improving undergraduate retention and graduation rates at umass boston
DESCRIPTION
Improving Undergraduate Retention and Graduation Rates at UMass Boston. Building a Culture and Systems that Support Student Success. Presentation to the F&A Advisory Committee April 27, 2011. Retention and Graduation Rates Committee. - PowerPoint PPT PresentationTRANSCRIPT

Improving Undergraduate Retention and Graduation Rates at UMass BostonBuilding a Culture and Systems that Support Student Success
Presentation to the F&A Advisory Committee
April 27, 2011

Retention and Graduation Rates Committee▸ Joan Becker, Vice Provost, Academic Support Services and Undergraduate Studies, chair
▸ Kathleen Teehan, Vice Chancellor for Enrollment Management, co-chair
▸ Andrew Grosovsky, Dean, College of Science and Mathematics, co-chair
▸ Donna Kuizenga, Dean CLA
▸ Janet DiPaolo, Coordinator, Library Instruction
▸ Cheryl Aaron, Assistant Director, Athletics
▸ Deborah Mahony, Clinical Associate Professor, Nursing
▸ Neal Bruss, Associate Professor, English; Chair, General Education Committee
▸ Maura Mast, Associate Prof., Math; Associate Vice Provost, VPASS/Undergraduate Studies
▸ Amy Mei, Undergraduate Program Coordinator, CM
▸ Kevin Murphy, Associate Director, OIRP
▸ Patrick Day, Vice Chancellor, Student Affairs
▸ Gail Stubbs, Director, University Advising Center
▸ Judy Keyes, Director of Financial Aid
▸ Liliana Mickle, Special Assistant for Retention, VPASS/Undergraduate Studies
▸ Sam Museus, Assistant Professor, College of Education and Human Development
▸ Alan Christian, Director, Environmental Science Program, EEOS
▸ Lorna Rivera, Associate Professor, Women’s Studies
▸ Lisa Buenaventura, Assistant Vice Chancellor, Co-Curricular Learning and Assessment, Student Affairs

Some Definitions
▸ Retention rates measure the percent of students in an entering cohort who complete the first year and return for a second.
▸ Persistence is the ongoing progression from semester to semester and year to year.
▸ Graduation rates are determined by the percent of students who complete a degree within a specified time period.
▸ Retention and graduation rates are publicly reported for first-time, full-time freshmen. Graduation rates are calculated based on students who graduate within six years from initial enrollment (150% of time).
▸ Retention and graduation rates for transfers are not publicly reported, but are important for UMass Boston as 60+% of our students are transfers.

Why Retention and Graduation Rates Matter▸ Retention rates are early indicators of student success and important
predictors of future graduation rates. Key measures of effectiveness and quality in higher education, graduation and retention rates are also increasingly part of accountability systems.
▸ High attrition is not cost-effective. Recruiting and orienting new students is costly.
▸ Graduation rates are now reported to students and their parents through the Federal financial aid process.
▸ UMass Boston’s low graduation rate was singled out to a national readership in last year’s New York Times article reviewing the William Bowen book, “Crossing the Finish Line: Completing College at America’s Public Universities.” UMass Boston was cited in a recent Chronicle of Higher Education article on the colleges with the lowest graduation rates.

Enrollment Trends
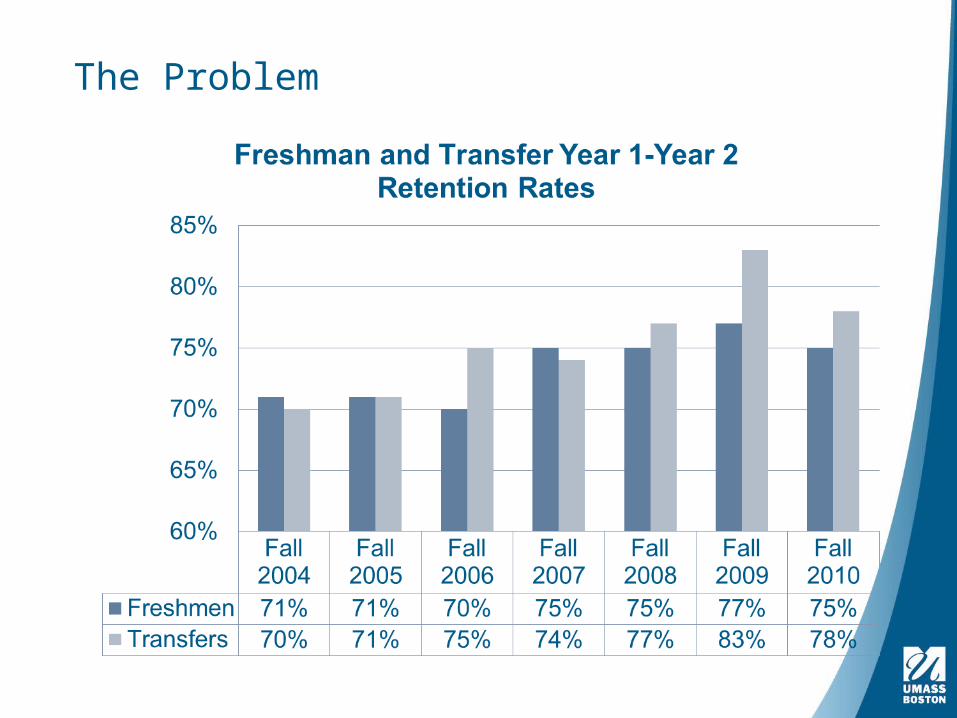
The Problem

The Problem

Sample Peer Comparisons
Institution Rate Institution Rate Institution Rate Institution RateTemple U 58.7% George Mason U 59.9% Temple U 64.8% Temple U 67.1%
George Mason U 56.1% Temple U 59.7% George Mason U 61.2% George Mason U 63.6%Rutgers, State U of NJ-
Newark 55.5%Rutgers, State U of NJ-
Newark 54.5%Rutgers, State U of NJ-
Newark 57.9%Rutgers, State U of NJ-
Newark 57.9%U of North Carolina-
Greensboro 52.0% U of Illinois-Chicago 50.0%U of North Carolina-
Greensboro 52.5% U of Illinois-Chicago 54.1%
U of Illinois-Chicago 50.6%U of North Carolina-
Greensboro 49.8% U of Nevada-Reno 48.4%U of North Carolina-
Greensboro 51.6%U of Nevada-Reno 48.4% Georgia State U 47.2% U of Illinois-Chicago 48.1% Georgia State U 49.7%
U of Missouri-Kansas City 46.2% U of Nevada-Reno 46.4% U of Louisville 45.7% U of Nevada-Reno 48.4%
Wright State U 43.5% U of Louisville 43.7% Georgia State U 44.0% U of Louisville 48.4%U of Missouri-Saint
Louis 42.4% Wright State U 43.4%U of Missouri-Saint
Louis 43.9%U of Missouri-Kansas
City 43.9%
U of Houston 42.3%U of Missouri-Saint
Louis 43.0%U of Missouri-Kansas
City 42.8% Wright State U 43.8%
Georgia State U 41.4%U of Missouri-Kansas
City 42.9% U of Houston 41.8% U of Colorado Denver 43.3%U of Louisville 40.7% U of Houston 42.8% Wright State U 41.6% U of Houston 40.8%
U of Nevada-Las Vegas 39.2%
U of Nevada-Las Vegas 40.6%
U of Nevada-Las Vegas 40.9%
U of Missouri-Saint Louis 40.3%
U of Colorado Denver 35.9% U of Colorado Denver 38.7% Alabama-Birmingham 39.8%U of Nevada-Las
Vegas 39.4%Alabama-Birmingham 35.8% Alabama-Birmingham 37.7% U of Memphis 39.1% Alabama-Birmingham 39.3%
UMass Boston 35.6% Portland State U 35.6% U of Colorado Denver 36.6% U of Memphis 38.6%U of Memphis 34.6% U of Memphis 34.7% UMass Boston 33.2% UMass Boston 38.6%
Portland State U 33.4% Cleveland State U 32.1% Portland State U 31.9%Indiana U-Purdue U-
Indianapolis 34.3%
Cleveland State U 30.6% UMass Boston 32.1%Indiana U-Purdue U-
Indianapolis 31.8% Portland State U 30.0%Indiana U-Purdue U-
Indianapolis 27.3%Indiana U-Purdue U-
Indianapolis 31.6% Cleveland State U 26.3% Cleveland State U 28.7%U of Arkansas-L.R 26.2% U of Arkansas-L.R 20.8% U of Arkansas-L.R 23.6% U of Arkansas-L.R 23.6%
Six-Year Graduation Rates UMass Boston and Selected Peers
Fall 2000 Fall 2001 Fall 2002 Fall 2003
Data Source: IPEDS

The Problem

Many Students Who Leave Transfer to Other Institutions
▸ First-Time Freshmen: Of the 987 first-time full or part-time freshmen who entered UMass Boston in fall 2009, 253 did not return to UMass Boston for fall 2010. ▸ 49% of those who did not return, enrolled elsewhere; 38% first
enrolled at a two-year school and 62% first enrolled at another four-year school, including 19% at another UMass campuses.
▸ Transfer Students: Of the 1,756 new transfer students formally matriculated at UMass Boston in fall 2009, 25 graduated before fall 2010 and 385 did not return in fall 2010. ▸ 35% of those who did not return, enrolled elsewhere; 38% first
enrolled at a two-year school and 62% first enrolled at another four-year school, including 13% at another UMass campuses.
Data source: National Student Clearinghouse; OIRP

Starting On Track Matters
▸ Students who continue into the second year on-track based on credit accumulation and grade point average are far more likely to graduate than students who do not.

Framework for On Track Indicators
Milestones On-Track Indicators Return for subsequent terms (retention) Complete needed remediation Begin college-level coursework in math
and English Earn one year of college-level credits Complete general education coursework Complete a community-college transfer
curriculum Transfer from community college to a
universityo after completing transfer curriculumo without completing transfer
curriculum Complete a certificate or degree
Remediation:Begin remedial coursework in first term, if neededGateway Courses:Complete college-level math and/or English in the first or second yearComplete a college-success course or other first-year experience programCredit Accumulation and Related Academic Behaviors:Complete high percentage of courses attempted (low rate of coursedropping and/or failure)Complete 20-30 credits in the first yearEarn summer creditsEnroll full timeEnroll continuously, without stop-outsRegister on time for coursesMaintain adequate grade-point average
Source: OFFENSTEIN, J. MOORE, C. AND SHULOCK, N. (2010)

Freshman Graduation Rates by On Track Status

Transfer Graduation Rates by Entry Level and On Track Status

Characteristics of Characteristics of High-Performing InstitutionsHigh-Performing Institutions
▸ Strong Networking ValuesStrong Networking Values
▸ A Commitment to Targeted SupportA Commitment to Targeted Support▸ Cultivate Early Connections▸ Maintain Continuous Connections▸ Foster Integrated Connections
▸ A Belief in Humanizing the Educational ExperienceA Belief in Humanizing the Educational Experience
▸ An Ethos of Institutional ResponsibilityAn Ethos of Institutional Responsibility

Both Academic and Social Both Academic and Social Connections MatterConnections Matter
▸ Integration into campus academic and social systems
▸ Quality and quantity of involvement
▸ Educationally purposeful engagement
▸ Connections to collective and individual cultural agents who value academic achievement and engage cultural backgrounds

Recommendations
▸ Start on Track, Stay on Track
▸ Early and Often: Connect, Engage, and Build Community

Recommendation 1: Build a culture and systems that enable students to start on track and stay on track.
▸ Develop and implement a system of on track indicators by college for freshmen and transfer students.
▸ Use technology to identify students who are off-track.
▸ Prioritize the class schedule. Ensure a sufficient number of sections of the courses students need to stay on-track are offered when they are needed.
▸ Significantly increase the capacity of departments to provide advising for declared majors. Hire professional advisors to augment faculty advising.

▸ Placement Testing. Develop a better placement testing system for all incoming students--earlier and more targeted, convenient, and available for students and more accurately places them into the appropriate coursework.
▸ Academic Support Services. Provide college-based and
centralized resources to provide academic support needed by students identified as not on track.
▸ Targeted Services for Off Track Students. Develop and
implement a course for re-admission, financial aid, and transfers in jeopardy.

Recommendation 2: Implement the UMass Boston Freshman Commitment aimed at increasing the success of students who enter as Freshmen.▸ Develop an intentional first year experience including
orientation and college-based learning communities.
▸ Identify and support teaching and learning that promotes the retention of freshmen
▸ Increase opportunities to extend learning and engagement (undergraduate research, study abroad, service learning, civic engagement, co- and extra-curricular activities)

Recommendation 3: Implement programs specifically tailored for Transfer Students to support their academic and social transition and success at the University.
▸Develop programming that connects transfer students to the university community
▸Develop programming aimed at increasing transfer student engagement and success (undergraduate research, study abroad, service learning, civic engagement, co- and extra-curricular activities)

Additional Recommendations
▸ Address informational and customer service issues.
▸ Increase need-based financial aid, on campus employment opportunities, and college-sensitive off-campus employment opportunities.
▸ Build residence halls
▸ Data analysis and evaluation.

Challenges
▸ Ensuring that all units and departments of the university understand the importance of and have the capacity to advance student success.
▸ Building a system of accountability—making sure that “we all have to own it” doesn’t translate into no one is accountable.
▸ The deficits, especially in terms of college-based success programs, major advising, and structures and programming that connect and engage students, are significant. These deficits are financial and cultural.
▸ Major investments are needed!