student retention in higher education: nursing … retention in higher education: examining the...
TRANSCRIPT
Student Retention in Higher Education:
Examining the Patterns of Selection, Preparation, Retention, and Graduation of
Nursing Students in the Undergraduate Pre-licensure Nursing Program
at Arizona State University
by
Cheryl Herrera
A Dissertation Presented in Partial Fulfillment of the Requirements for the Degree
Doctor of Philosophy
Approved March 2012 by the Graduate Supervisory Committee:
Arnold Danzig, Chair N Cayer
Victoria Grando
ARIZONA STATE UNIVERSITY
May 2012
i
ABSTRACT
This study is designed to understand the patterns of selection, preparation,
retention and graduation of undergraduate pre-licensure clinical nursing students
in the College of Nursing and Health Innovation at Arizona State University
enrolled in 2007 and 2008. The resulting patterns may guide policy decision
making regarding future cohorts in this program.
Several independent variables were examined including grades earned in
prerequisite courses; replacement course frequency; scores earned on the Nurse
Entrance Test (NET); the number of prerequisite courses taken at four-year
institutions; race/ethnicity; and gender. The dependent variable and definition of
success is completion of the Traditional Pre-licensure Clinical Nursing Program
in the prescribed four terms. Theories of retention and success in nursing
programs at colleges and universities guide the research.
Correlational analysis and multiple logistic regression revealed that
specific prerequisite courses—Human Nutrition, Clinical Healthcare Ethics, and
Human Pathophysiology—as well as race/ethnicity, and gender are predictive of
completing this program in the prescribed four terms.

ii
DEDICATION
This dissertation is dedicated to all those who supported my educational efforts
over the years including: my beautiful daughters Lauren and Christine; my
deceased mother Joni Schultz, my brother Kasey; my sister Lisa; my significant
other Chris Miller, and many friends including Jennifer Blair, Lori Reed, Mike
Chafin, Rosanna Johnson, Betty Dunaway, and the Herrera family.
iii
ACKNOWLEDGMENTS
Many professionals at Arizona State University supported my academic
endeavors including Bernadette Melnyk, Teri Pipe, Dave Hrabe, Brenda Morris,
Mary Killeen, Edward Greenberg, Joe Cayer, Arnold Danzig, Victoria Grando,
Anne Schneider, Ruth Jones, and Warren Miller. Many colleagues at Arizona
State University were also supportive of my academic efforts and I thank all of
these individuals.
iv
TABLE OF CONTENTS
Page
LIST OF TABLES ...................................................................................................... vi
LIST OF FIGURES ................................................................................................... vii
CHAPTER
1 INTRODUCTION ................................................................................................ 1
Background...................................................................................................... 1
Purpose of the Study ....................................................................................... 2
Statement of the Problem ................................................................................ 3
Definition of Terms ......................................................................................... 5
Abbreviations Used ....................................................................................... 23
Limitations ..................................................................................................... 24
Delimitations ................................................................................................. 24
Assumptions .................................................................................................. 25
Significance of the Study .............................................................................. 26
Summary and Research Questions ............................................................... 26
2 LITERATURE REVIEW ................................................................................... 29
The Importance of Higher Education in Democracies ................................. 29
Retention in Higher Education ..................................................................... 34
Early Literature on Student Departure from Higher Education ................... 36
Vincent Tinto’s Theoretical Model of Departure from Higher Education .. 38
v
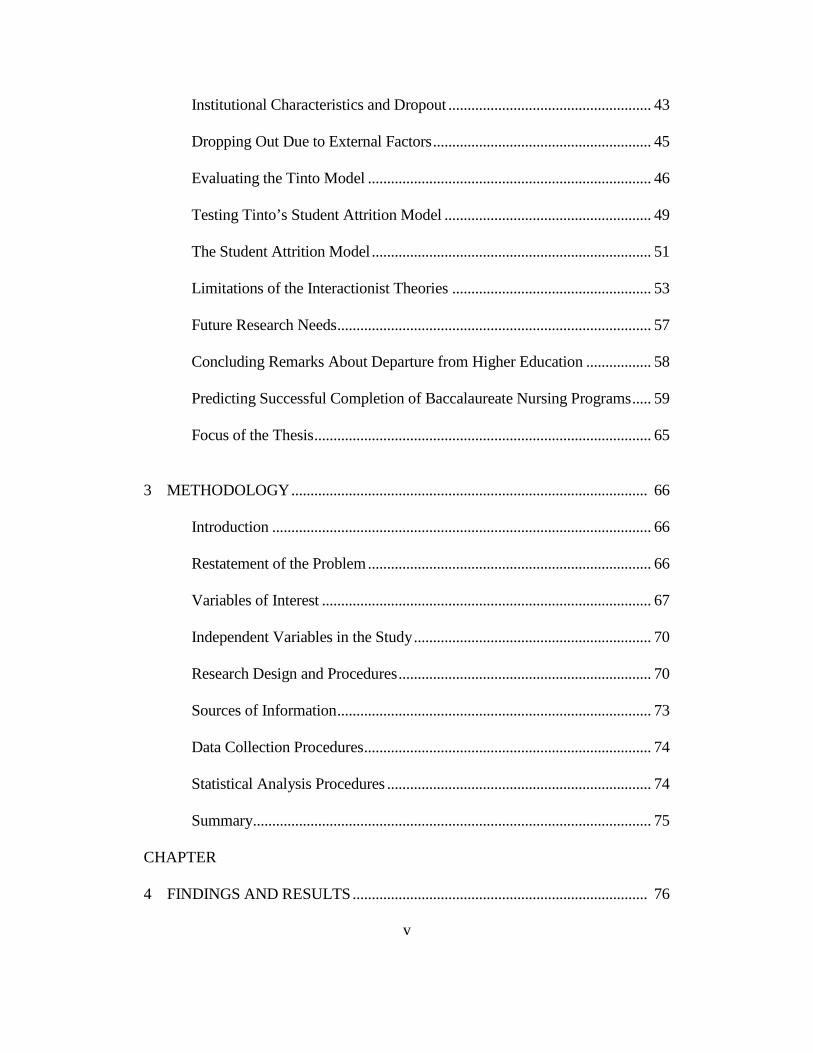
Institutional Characteristics and Dropout ..................................................... 43
Dropping Out Due to External Factors ......................................................... 45
Evaluating the Tinto Model .......................................................................... 46
Testing Tinto’s Student Attrition Model ...................................................... 49
The Student Attrition Model ......................................................................... 51
Limitations of the Interactionist Theories .................................................... 53
Future Research Needs .................................................................................. 57
Concluding Remarks About Departure from Higher Education ................. 58
Predicting Successful Completion of Baccalaureate Nursing Programs ..... 59
Focus of the Thesis ........................................................................................ 65
3 METHODOLOGY ............................................................................................. 66
Introduction ................................................................................................... 66
Restatement of the Problem .......................................................................... 66
Variables of Interest ...................................................................................... 67
Independent Variables in the Study .............................................................. 70
Research Design and Procedures .................................................................. 70
Sources of Information .................................................................................. 73
Data Collection Procedures ........................................................................... 74
Statistical Analysis Procedures ..................................................................... 74
Summary ........................................................................................................ 75
CHAPTER
4 FINDINGS AND RESULTS ............................................................................. 76

vi
Correlational Analysis ................................................................................... 76
Frequencies and Descriptive Statistics ......................................................... 79
Crosstabulations ............................................................................................ 89
Multiple Logistic Regression Analysis ......................................................... 95
Research Questions Tested ........................................................................... 97
Summary ...................................................................................................... 102
5 SUMMARY, CONCLUSIONS, RECOMMENDATIONS, AND
IMPLICATIONS........................................................................................ 106
Introduction ................................................................................................. 106
Summary of the Study ................................................................................. 107
Summary of the Findings and Conclusions ................................................ 107
Recommendations ....................................................................................... 114
Implications ................................................................................................. 119
Conclusion ................................................................................................... 121
REFERENCES ...................................................................................................... 123

vii
APPENDICES ....................................................................................................... 130
A CODEBOOK ............................................................................................. 130
B HUMAN RESEARCH CURRICULUM COMPLETION REPORT… .132
BIOGRAPHICAL SKETCH .................................................................................. 134
viii
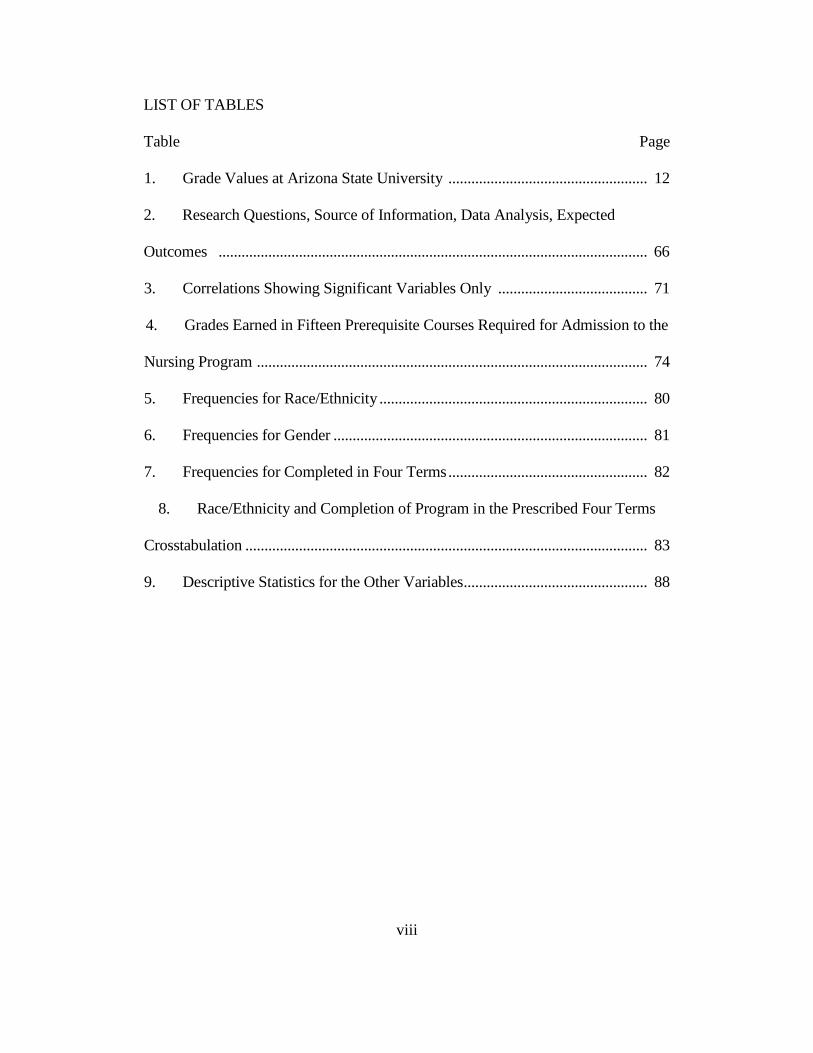
LIST OF TABLES
Table Page
1. Grade Values at Arizona State University .................................................... 12
2. Research Questions, Source of Information, Data Analysis, Expected
Outcomes ................................................................................................................ 66
3. Correlations Showing Significant Variables Only ....................................... 71
4. Grades Earned in Fifteen Prerequisite Courses Required for Admission to the
Nursing Program ...................................................................................................... 74
5. Frequencies for Race/Ethnicity ...................................................................... 80
6. Frequencies for Gender .................................................................................. 81
7. Frequencies for Completed in Four Terms .................................................... 82
8. Race/Ethnicity and Completion of Program in the Prescribed Four Terms
Crosstabulation ......................................................................................................... 83
9. Descriptive Statistics for the Other Variables ................................................ 88
ix
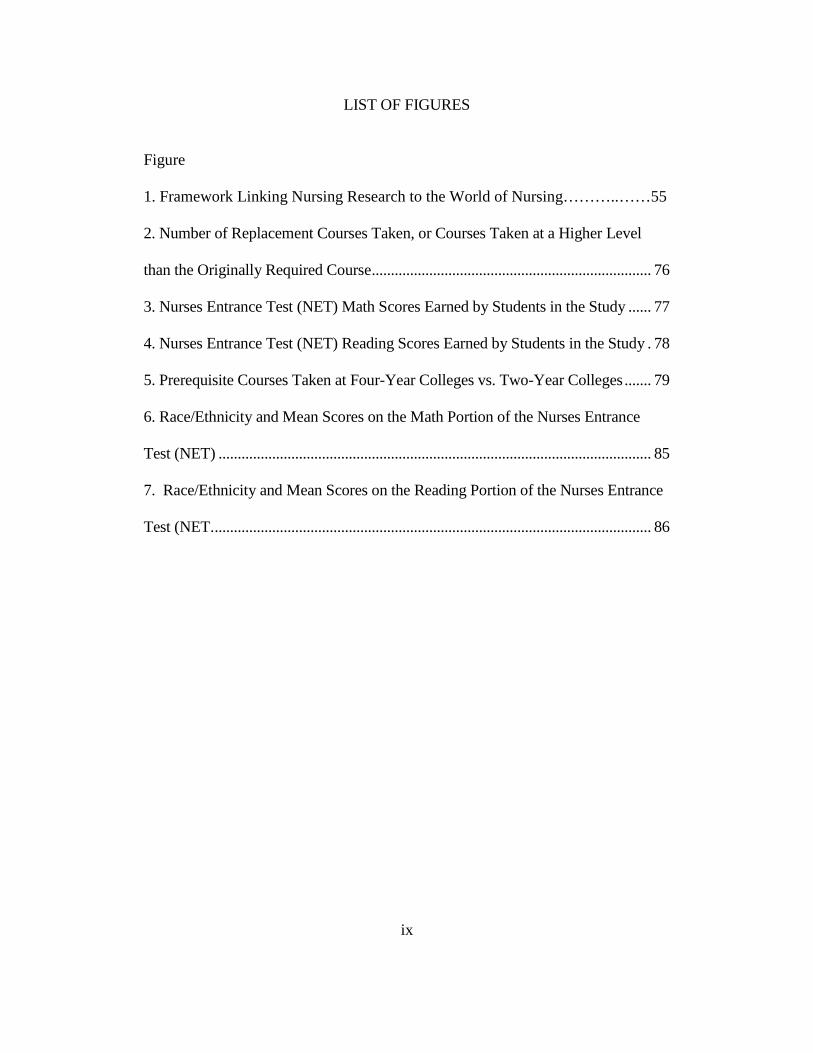
LIST OF FIGURES
Figure
1. Framework Linking Nursing Research to the World of Nursing………..……55
2. Number of Replacement Courses Taken, or Courses Taken at a Higher Level
than the Originally Required Course ......................................................................... 76
3. Nurses Entrance Test (NET) Math Scores Earned by Students in the Study ...... 77
4. Nurses Entrance Test (NET) Reading Scores Earned by Students in the Study . 78
5. Prerequisite Courses Taken at Four-Year Colleges vs. Two-Year Colleges ....... 79
6. Race/Ethnicity and Mean Scores on the Math Portion of the Nurses Entrance
Test (NET) ................................................................................................................. 85
7. Race/Ethnicity and Mean Scores on the Reading Portion of the Nurses Entrance
Test (NET. .................................................................................................................. 86
1
CHAPTER ONE
INTRODUCTION
Background
Higher education is important to democratic societies yet almost half of
those who start college do not complete a baccalaureate degree (Consortium for
Student Retention Data Exchange Retention Report, 2009). This startling attrition
rate is also true of students in Bachelor of Science in Nursing (BSN) programs
(American Association of Colleges of Nursing, 2011). Given the shortage of
nurses in the United States and the cost to educate nurses, this attrition rate is
especially concerning. The United States is projected to have a nursing shortage
which could intensify as the population ages, and the need for health care grows.
Nursing colleges and universities across the country are struggling to expand
enrollment levels to meet the rising demand for nursing care. The cost per
nursing student in baccalaureate programs compounds this problem because it is
higher than the cost for most other disciplines. This is due in large part to the
labor intensive, low faculty to student ratios required in nursing education of
approximately 1:10 (American Association of Colleges of Nursing, 2011).
Because of the need to graduate increasing numbers of baccalaureate
prepared nurses in cost-intensive programs, baccalaureate nursing programs must
be able to accurately and efficiently identify students most likely to succeed in
these programs, graduate with a BSN and pass the National Council Licensure
Examination-Registered Nurse (NCLEX-RN). Research indicates that there is a
2
need for a parsimonious explanation of BSN readiness and attrition to guide
policy makers in nursing programs in institutions of higher education to decrease
the attrition rate and boost the BSN graduation rate (Byrd, Garza, &
Nieswiadomy, 1999, p. 1).
Purpose of the Study
The purpose of this study is to answer some important questions about one
particular baccalaureate nursing program in the College of Nursing and Health
Innovation at Arizona State University the results of which could be generalizable
to other nursing programs. The important questions, then, are:
1. What is the pattern of success for nursing students in this program?
2. What factors best predict which students will be most likely to
complete the Bachelor of Science in Nursing, pass the NCLEX-RN,
and practice as a registered nurse?
Nursing programs across the country use a variety of factors to determine
which students will be the best prepared to pursue nursing studies, complete the
BSN, and pass the NCLEX-RN. Among these factors are scholastic aptitude
measures such as grade point average (GPA) and standardized aptitude tests.
Moderating effects also exist and are referred to as contextual environmental
factors or CEFs (Byrd, et al., 1999, p. 35). These include factors such as the
number of hours that nursing students work outside of their studies and the
number of students with English as a second language. Aptitude has also been
shown to be predictive of BSN student success and should be carefully examined
3
as a predictor of program completion (Byrd, et al., 199, p. 37). Entrance tests
such as the Nurses Entrance Test (NET) or the Test of Essential Academic Skills
(TEAS) usually measures aptitude.
Statement of the Problem
As the largest producer of baccalaureate prepared nurses in the state of
Arizona, the College of Nursing and Health Innovation at Arizona State
University (ASU) graduates approximately 300 BSNs each year through the pre-
licensure baccalaureate clinical nursing program and the RN to BSN completion
program (http://nursingandhealth.asu.edu/). Nationally, approximately 20% of
the students who begin nursing studies do not complete them. While this 20%
attrition rate is much better than the 50% national attrition rate for all majors, it
represents lost investment in those students who began a nursing program but did
not complete it. In addition, for the pre-licensure nursing program at Arizona
State University approximately 500 students meet the minimum eligibility criteria
for the 200 or so clinical spaces available each year (Herrera, 2012). Because of
the need for more nurses and due to budgetary concerns, it is critically important
to correctly identify the 200 students who will be granted space in the
undergraduate pre-licensure program that are most likely to complete the BSN
and pass the NCLEX-RN. The online RN to BSN program currently has
unlimited capacity so is not included in this study.
The College of Nursing and Health Innovation (CONHI) at Arizona State
University has used the grade point average (GPA) in prerequisite courses and an
4
aptitude test to determine which students will be given clinical space in the
undergraduate pre-licensure nursing program. These are quantitative factors and
the nursing faculty recognize that other more qualitative considerations might
provide additional, predictive information (Morris, 2012). Some qualitative
factors that were considered for inclusion in the decision making were essays
prepared by students to estimate their understanding of the nursing profession;
interviewing students; and resumes that would indicate health-related experiences.
Given the time intensive nature and related expenses of evaluating these other
factors, they have not been included in the placement decision making, to date.
Therefore, this research will focus on the quantitative factors used to determine
which students will be given the coveted clinical nursing spaces in the BSN.
This study is designed to understand the patterns of selection, preparation,
retention and graduation of undergraduate pre-licensure clinical nursing students
in the College of Nursing and Health Innovation at Arizona State University
enrolled in 2007 and 2008. These patterns include prerequisite course grades,
course location, course replacement, entrance test scores, demographics, and
outcomes and are identified and described. The intent is to understand the
contribution of course grades, select GPA, course replacement, NET scores,
race/ethnicity, and gender to successful completion of the program in the
prescribed four terms.
Arizona State University, a large, urban, public university includes the
College of Nursing and Health Innovation and the largest producer of
5
baccalaureate nurses in the state of Arizona. Current models of retention and
graduation in higher education will be described, research on success in nursing
programs examined, and relevant variables will be considered.
The independent variables examined include the grades earned in
prerequisite courses; replacement course frequency; scores earned on the Nurse
Entrance Test (NET); the number of prerequisite courses taken at four-year
colleges versus two-year colleges; race/ethnicity; and gender. The dependent
variable is dichotomous and is: completion of the upper division nursing
curriculum in the prescribed four terms, thus earning the BSN, or interruption in
progress toward the BSN such as failing a nursing course or discontinuation of the
degree program.
Definition of Terms
Retention: There is currently one standard national retention definition
established by the federal government that must be reported by all colleges on an
annual basis. That definition is: Program retention tracks the full-time student in
a degree program over time (in six years for four-year colleges and in three years
for two-year colleges) to determine whether the student has completed the
program (Consortium for Student Retention Data Exchange, 2009). This
definition of retention does not include students who start as part-time students
then move to full-time attendance or those who are attending college part-time
which in many cases is over 50% of some college populations, especially at
community colleges nor students taking distance education courses.
6
Course Retention: The number of students enrolled in each credit course
after the course census date and the number of students who successfully
complete the course with a grade of A, B, C, D or fail at the end of the term.
Student Retention: Students without a two-term consecutive absence are
considered retained. For students with two or more terms of absence, the college
may determine whether they have achieved their academic and/or personal goals.
Attrition: Reduction in the college student population as a result of
transferring or dropping out.
Diploma Nursing Programs: A Diploma in Nursing or Nursing Diploma
is an entry-level nursing credential. Diploma programs existed before colleges
and universities added nursing programs to their curricula. In the United States,
diploma programs are usually offered by hospital-based programs. These
programs include classroom and clinical experiences. The number of diploma
programs in the United States is declining (American Association of Colleges of
Nursing, 2011). Associate degree programs in nursing: The associate degree in
nursing is offered by two-year colleges known as Community Colleges.
Sometimes this degree is referred to as an Associate Degree in Nursing or ADN.
These programs usually require that students take prerequisite courses and then a
nursing curriculum including clinical experiences. This is currently the most
common nursing degree granted in the United States (American Association of
Colleges of Nursing, 2011).
7
Bachelor of Science in Nursing (BSN): The BSN is a four-year degree
that also prepares students for graduate level study in nursing. Most programs
require prerequisite courses in the first two years and then upper level nursing and
clinical courses for two years. The BSN is considered the professional degree and
is preferred by hospitals.
RN to BSN Programs: These programs are for students who have earned
an Associate of Applied Science degree (AAS) or ADN in nursing from a
community college or a Nursing Diploma from a diploma program and then
pursue the BSN. Upon completion of the BSN, students are prepared for graduate
study. RN to BSN programs build on the knowledge and skills the student
learned in the associate degree or diploma program.
Pre-Licensure Nursing Programs: Pre-licensure nursing programs (or
“Generic Nursing Programs”) refer to the nursing programs at the baccalaureate
level for students who do not have a nursing diploma or associate degree in
nursing who wish to complete a four-year BSN.
Nursing Aptitude: Nursing aptitude is the complexity of knowledge
needed by nursing students and is differentiated from scholastic aptitude.
Scholastic aptitude can be defined as scores earned on standardized tests such as
the ACT or SAT or the GPA earned in high school or college. Nursing aptitude is
more specific knowledge than scholastic aptitude and can be operationalized as
college-level competencies in English, math, science, and reading comprehension.
8
NCLEX-RN: The National Nurse Licensure Exam for Registered Nurses
may be taken after completing a nursing diploma, associate degree in nursing or a
bachelor’s degree in nursing. It allows those who pass it to practice as a
registered nurse.
Registered Nurse (RN): A person who has earned a diploma, associate’s
degree, or bachelor’s degree in nursing and successfully passed the NCLEX-RN
is a registered nurse. RNs can work in a variety of settings including hospitals,
schoools, long term care facilities, and doctor’s offices as well as many other
locations.
Evidence-based Practice (EBP): EBP refers to the integration of research
evidence with clinical expertise and patient needs and values. “In nursing, the
research evidence must focus on the description, explanation, prediction, and
control of phenomena important to practice” (Burns and Grove, 2009, p. 11).
Governing and Policy Making Bodies
Arizona Board of Regents (ABOR): The Arizona Board of Regents is the
governing board for Arizona’s public universities: Arizona State University,
Northern Arizona University, and the University of Arizona. The Board provides
policy guidance in such areas as: academic and student affairs; financial and
human resource programs; student tuition, fees, and financial aid programs;
university capital development plans; strategic plans; legal affairs; and public and
constituent outreach (http://www.azregents.edu/). The Board consists of twelve
members, eleven voting and one non-voting. This includes the Governor and
9
Superintendent of Public Instruction as ex-officio members, each serving while
they hold office, and two Student Regents.
Arizona State University Academic Assembly: The Academic Assembly
consists of all tenured and tenure-eligible faculty, academic professionals, and
full-time contract faculty (i.e. lecturers and senior lecturers, instructors, clinical
faculty, research faculty, and professors of practice).
University Senate: The University Senate is the representative body of the
Arizona State University Academic Assembly and is empowered by the Arizona
State University Constitution to act for the Academic Assembly in matters
relating to: academic affairs, personnel policies, faculty-student policies, finances
and University services and facilities. The policies considered by this body
include most of the academic operations of the university such as course title and
number standards, course prerequisites, course loads allowed for students,
registration periods, final exam schedules, and so on
(https://provost.asu.edu/committees/univ_senate).
College and University Standards Committees: When students wish to ask
for an exception to one of the major, college, or university policies, they may
submit standards committee petitions with the requests. Decisions are made by the
standards committees from each of the colleges. Requests for exceptions to
university policies that are denied are automatically reviewed by the university
standards committee. The Vice Provost for Academic Affairs oversees the
university standards committee. It has been noted at Arizona State University that
10
there are inconsistencies in how standards committees handle certain requests.
For example, some colleges routinely approve of students taking courses for a
third time in which they have received "D"s or "E"s. Other colleges routinely
deny these requests. Arizona State University strives for consistency/congruency
of standards committee petitions across colleges.
Academic Policies: Academic policies will be defined as those policies
made by the Arizona State Board of Regents (ABOR), the Arizona State
University Faculty Senate, and through university administrative mandates.
ABOR policies cover such areas as minimum requirements for admission to the
state universities, courses allowed to transfer from other higher education
institutions, and degree conferral.
11
Faculty Policy Actions: Arizona State University Faculty Senate policy
actions include such things as pedagogy, grading practices, standards for
academic progression, accessibility to students, and overall expectations of
student performance. Administrative mandates usually refer to mandates made
by the University President or the Provost and Senior Vice President.
Aspirational Peers: Aspirational peers are those institutions identified by
the College of Nursing and Health Innovation as universities that are similar or
more highly ranked than it. They include Indiana University, University of
California at Los Angeles, University of Iowa, University of Michigan, University
of North Carolina at Chapel Hill, University of Pittsburgh, University of Texas at
Austin, University of Texas at Houston, and University of Virginia (Morris,
2012).
Student Support Services: Student support services include non-academic
services such as admissions, financial aid, residence life, American Indian Student
Support Services, bookstores, Arizona State University family resources, the
Council of Religious Advisors (Student Religious Organizations), commuter
services, disability services, graduate student resources, the Intergroup Relations
Center, international student services, the Multicultural Student Services Office,
and veteran benefits and certification (https://students.asu.edu/supportservices).
Grade Related Terms
12
Grading Options: Ordinarily a grade of "A+," "A," "A-," "B+," " B," "B-,"
"C+," "C," "D," or "E," (E is a failing grade), is given upon completion of a
course, unless another grading option such as "audit" or "pass/fail" is indicated at
the time of registration. Although the plus/minus scale includes a grade of A+
with a value of 4.33, the cumulative GPA is capped at 4.00. Grading options
cannot be changed after the close of the drop/add period. The instructor of a
course has full discretion in selecting which grades to use and report from the
available grading options. An undergraduate course taken at Arizona State
University may be repeated for credit if the grade or mark of "D", "E", "W," or
"X" is received. To be eligible for the deletion of "D" or "E" grades from
calculations of the GPA, the course must be repeated at Arizona State University
(https://students.asu.edu/grades). Independent Learning courses may not be used
to repeat "D" or "E," or failing, grades. Students who have graduated are not
eligible to delete the grade for a course taken before the award of the Arizona
State University bachelor's degree. Undergraduate courses in which grades of
"D" or "E" are received may be repeated only once. Generally, students may not
repeat an undergraduate course for credit when a grade of "C" or higher is earned.
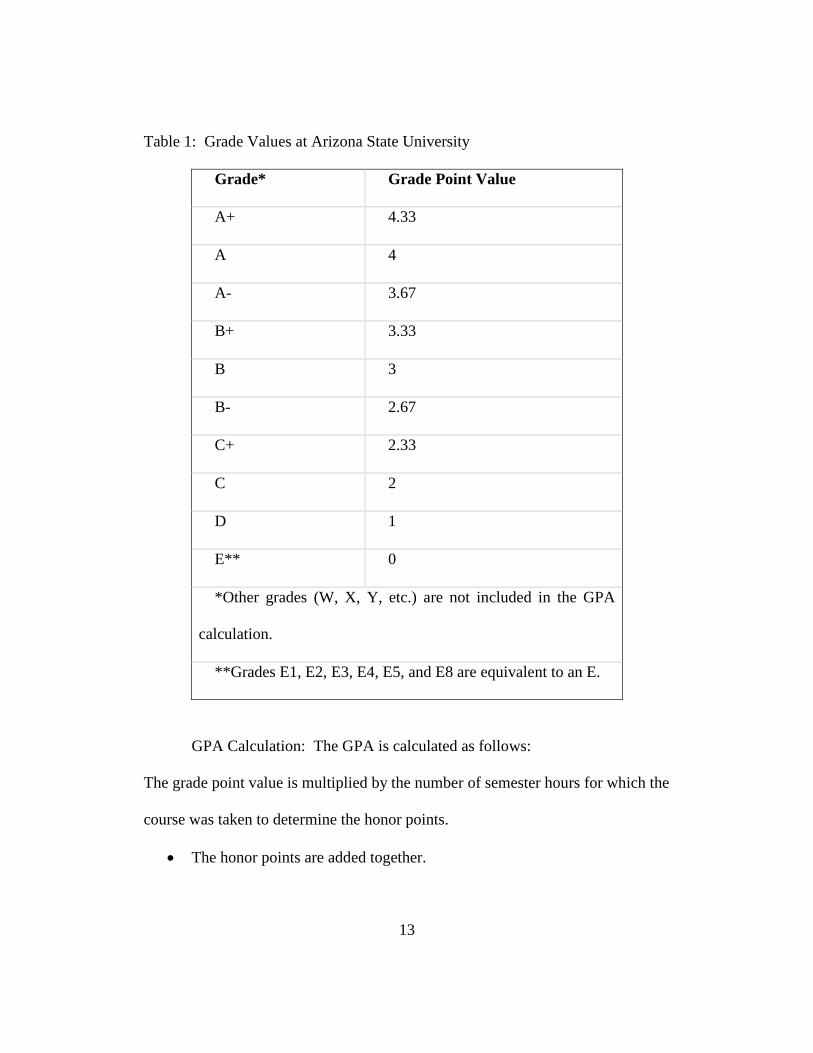
The following grades and their values are used in computing the semester
and cumulative Arizona State University GPA:
13
Table 1: Grade Values at Arizona State University
Grade* Grade Point Value
A+ 4.33
A 4
A- 3.67
B+ 3.33
B 3
B- 2.67
C+ 2.33
C 2
D 1
E** 0
*Other grades (W, X, Y, etc.) are not included in the GPA
calculation.
**Grades E1, E2, E3, E4, E5, and E8 are equivalent to an E.
GPA Calculation: The GPA is calculated as follows:
The grade point value is multiplied by the number of semester hours for which the
course was taken to determine the honor points.
• The honor points are added together.
14
• The semester hours are added together for courses that received one of the
above grades to determine net hours.
• The honor points are divided by the net hours to calculate the GPA.
• Honor Points ÷ Net Hours = GPA
• GPAs are rounded to the nearest 100th of a decimal point.
• Semester GPA is based on semester net hours. Cumulative GPA is based
on total net hours.
• Although the plus/minus scale includes a grade of A+ with a value of 4.33,
the cumulative GPA is capped at 4.00.
Attendance: Some instructors/faculty require that students attend class and
call roll to keep track of attendance and some count attendance as a portion of the
course grade.
Probation and Disqualification: Students must maintain a minimum GPA in
order to be considered in "good standing." The university standard is that
freshmen maintain a 1.60 GPA or above; sophomores maintain a 1.75 GPA or
above; and that juniors and seniors maintain a 2.0 GPA or above. Freshmen are
considered those students with fewer than 25 hours. Sophomores are those
students with 25 to 55 hours. Juniors are those students with 56 to 86 hours.
Seniors are those students with 87 hours or more. Students who do not maintain
the minimum GPA, are placed on academic probation. If their academic
achievement does not improve in the next academic semester, they will be
disqualified and will not be allowed to register at the university. Some colleges
15
have higher GPA standards such as 2.00 or 2.50 for all students in order to be
considered in good standing.
Grade Point Average Requirements for Professional Programs: Some of the
professional colleges at Arizona State University including the W.P. Carey School
of Business, the Herberger Institute for Design and the Arts, the Ira A. Fulton
Schools of Engineering, Nursing and Health Innovation, and Public Programs
require that students achieve a 2.50 to 3.50 GPA or higher and complete certain
courses before they will be allowed to take the upper division courses in their
major. Some even require that students apply for professional status.
Other Terms:
Academic Student Services: Academic student services include academic
advising, adult learner resources, computing services, libraries, and student
success tutoring.
Mandatory Academic Advising: Arizona State University requires that
certain students be advised before they are allowed to register. Different colleges
have different requirements but virtually all new students and students on
academic probation must be advised before registering. Some students find this
reassuring since they know that they are progressing in their course of study.
Other students find this burdensome and would rather make their own course
choices and proceed through a course of study independently.
General Studies Course Requirements: Arizona State University requires
that all students, regardless of major or college, take a set of general studies
16
courses. These include courses in composition; science with laboratory; social
and behavioral sciences; humanities/fine arts/design; mathematics; computers or
statistics; global awareness; cultural diversity in the United States; and historical
awareness.
Class Size: At Arizona State University, some courses are very small—as
small as eight students—while others are extremely large—as large as 500 or
more students.
Prerequisites: These are courses that must be taken and passed before
proceeding to another course. For example, ENG 101 English Composition I is a
prerequisite to ENG 102 English Composition II.
Nursing Prerequisites: There are 17 prerequisite courses for the BSN:
BIO 201 Anatomy and Physiology I, BIO 202 Anatomy and Physiology II, CHM
101 Introduction to Chemistry, CDE 232 Human Development, ENG 101 First
Year Composition I, ENG 102 First Year Composition II, HCR 210 Health Care
Ethics, HCR 220 Introduction to Nursing and Healthcare Systems, HCR 230
Culture and Health, HCR 240 Human Pathophysiology, MAT 142 College
Mathematics, MIC 205 and 206 Microbiology with laboratory, NTR 241 Human
Nutrition, Statistics, Humanities/Fine Arts, PGS 101 Introduction to Psychology,
and an elective.
Prerequisite GPA: The prerequisite GPA for the BSN is the grade point
average for the seventeen nursing prerequisites courses and must be at least a
3.25.
17
Traditional Pre-licensure Clinical Nursing Program (TPCNP): This is a
four year curriculum that includes prerequisite courses taken in approximately
four semesters and an upper division nursing curriculum consisting of in-class
didactic experiences, laboratory, and clinical experiences. Students who
successfully complete these requirements earn the Bachelor of Science in Nursing
(BSN) and are eligible to take the NCLEX-RN.
Course Levels: Lower division courses are those numbered in the 100 and
200 levels and are usually at a more introductory level and broader in scope.
Upper division courses are numbered at the 300 and 400 level and are usually
more difficult and more in-depth. Courses numbered as 500, 600 and 700 level
are graduate level courses.
Grade Replacement: Students are allowed to repeat most courses in which
they receive a grade of "D" or "E" (E means failing). New grades may either
replace the original grade or be averaged.
Course Prefixes: The course prefix refers to the three-letter abbreviation
used to list courses. For example, the prefix MAT is used to designate
mathematics courses.
Course Descriptions: The language used to describe the courses offered at
Arizona State University. The relevant course descriptions for this study are:
BIO 201 Anatomy and Physiology I. Studies the structure and function of
the human body. Topics include cells, tissues, integumentary system, skeletal
system, muscular system, and nervous system.
18
BIO 202 Anatomy and Physiology II. Studies the structure and function
of the human body. Topics include cardiovascular, respiratory,
lymphatic/immune, endocrine, renal, digestive, and reproductive systems.
CHM 101 Introduction to Chemistry. Elements of general chemistry.
Adapted to the needs of students in nursing and kinesiology and those preparing
for general chemistry.
CDE 232 Human Development. Lifespan development from conception
through adulthood, with emphasis on family influences. Recognition of
individuality within the universal pattern of development.
ENG 101 First Year Composition I. Discovers, organizes, and develops
ideas in relation to the writer's purpose, subject, and audience. Emphasizes modes
of written discourse and effective use of rhetorical principles.
ENG 102 First Year Composition II. Critical reading and writing;
emphasizes strategies of academic discourse. Research paper required.

19
Alternatives to ENG 101 and 102 are ENG 105 or ENG 107 and 108:
ENG 105 Advanced First Year Composition. Concentrated composition
course for students with superior writing skills; intensive reading; research papers;
logical and rhetorical effectiveness.
ENG 107 English for Foreign Students. For students from non-English-
speaking countries who have studied English in their native countries, but who
require practice in the idioms of English. Intensive reading, writing, and
discussion.
ENG 108 English for Foreign Students. For foreign students; critical
reading and writing; strategies of academic discourse. Research paper required.
HCR 210 Health Care Ethics. Healthcare ethics emphasizing analysis and
ethical decision making at clinical and health policy levels for healthcare
professionals.
HCR 220 Introduction to Nursing and Healthcare Systems. Introduces the
social, political, and economic contexts in which the nursing profession and
healthcare systems in the United States evolved.
HCR 230 Culture and Health. Cultures of diverse groups and
health/illness. Cross-cultural communication, awareness of own cultural
influences, indigenous and alternative healing practices.
HCR 240 Human Pathophysiology. Chemical, biologic, biochemical, and
psychological processes used in study of structural and functional alterations in
health with selected therapeutics.
20
MAT 142 College Mathematics. Applies basic college-level mathematics
to real-life problems. Appropriate for students whose major does not require
college algebra or pre-calculus.
MIC 205 and 206 Microbiology with laboratory. Introductory
microbiology, emphasizing basic principles of microorganisms (bacteria,
protozoa, algae, fungi, and viruses) and the role they play in health, ecology, and
applied fields. Principles and lab techniques used in identifying and handling
microorganisms.
NTR 241 Human Nutrition. Principles of human nutrition. Emphasizes
nutrient metabolism and the relationships between diet and disease.
PGS 101 Introduction to Psychology. Major areas of theory and research
in psychology. Requires participation in department-sponsored research or an
educationally equivalent alternative activity.
Humanities, Fine Arts, and Design (HU) and Social and Behavioral
Sciences (SB): The study of the humanities and the disciplines of art and design
deepen awareness of the complexities of the human condition and its diverse
histories and cultures. Courses in the humanities are devoted to the productions
of human thought and imagination, particularly in philosophical, historical,
religious, and artistic traditions. Courses with an emphasis in fine arts and design
are devoted to the study of aesthetic experiences and the processes of artistic
creation. They may also feature a design emphasis in which material culture is
studied as a product of human thought and imagination. The social and
21
behavioral sciences provide scientific methods of inquiry and empirical
knowledge about human behavior, within society and individually. The forms of
study may be cultural, economic, geographic, historical, linguistic, political,
psychological or social. The courses in this area address the challenge of
understanding the diverse natures of individuals and cultural groups who live
together in a world of diminishing economic, linguistic, military, political and
social distance.
Elective: Any course offered for college credit that students may choose
that is not intended to meet a particular requirement. Electives are courses that
are not defined as courses required for a major or minor.
Prerequisite GPA: The prerequisite GPA is the GPA calculated for the 17
required prerequisite courses for the pre-licensure nursing program.
Select GPA: The select GPA is the GPA calculated for 13 of the 17
prerequisite courses for the pre-licensure nursing program and includes both
composition courses and three of the four science courses with laboratory.
Replacement Courses: Students who earn grades of “B” or “C” in the
prerequisite courses may opt to take a different course at a higher level to attempt
to earn a higher grade of “B” or “A” to improve their prerequisite and select GPA.
For example, a student who earns a “C” in ENG 101 may opt to take ENG 217
and earn an “A” so that the “A” will be calculated in the prerequisite and select
GPA rather than the “C” earned in ENG 101.
Two-year and Four-year Institutions: These refer to colleges and
22
universities and the kinds of degrees offered. Most two-year institutions do not
offer bachelor’s degrees but offer associate’s degrees. Four-year institutions may
offer baccalaureate and graduate degrees.
Upper Division Nursing Curriculum: The pre-licensure BSN at Arizona
State University requires 17 prerequisite courses and four terms of upper division
nursing coursework. The nursing curriculum is referred to as the “upper division
nursing” because all courses in that four term curriculum are numbered in the 300
and 400 range.
Nursing Entrance Test (NET): The NET is a computer based test
consisting of six parts: math skills, reading comprehension, test taking skills,
stress level, social interaction, and learning style. All six parts must be completed
in order to receive scores and be considered for admission to the pre-licensure
nursing program. However, only the math and reading scores are used to
calculate application eligibility. A reading score of 50% or higher and a math
score of 50% or higher must be achieved for admission for most schools. The
College of Nursing and Healthcare Innovation requires a 65% or higher on the
math section and a 60% or higher on the reading section.
Test of Essential Academic Skills (TEAS): The TEAS is a multiple-
choice assessment of basic academic knowledge in reading, mathematics,
science and English and language usage. The objectives assessed on the
TEAS exam are those which nurse educators deemed most appropriate and
relevant to measure entry level skills and abilities of nursing program
23
applicants. Composite scores, as well as several sub-scores, are computed in
each of the four content areas to assess specific content comprehension. All
students considered in this study were required to take the NET. The TEAS
was adopted in 2010 to replace the NET.
Student Data Management System (SDMS): This is a database
maintained in the College of Nursing and Health Innovation with information
about students who have been advised about nursing programs as Arizona
State University. The database has fields for the prerequisite courses taken,
the NET or TEAS scores earned, whether and when students were advanced
to the clinical or upper division portion of the degree program and
demographic date such as race/ethnicity, and gender.
My Reports: My Reports is Arizona State University's implementation of
Hyperion BI+. Arizona State University Data Warehouse users can use My
Reports to run queries against the data warehouse. Personnel and researchers use
this program to gather data relevant to their interests.
Abbreviations Used
ABOR: Arizona State Board of Regents
ASU: Arizona State University
CONHI: College of Nursing and Health Innovation
GPA: Grade Point Average
NET: Nursing Entrance Test
SDMS: Student Data Management System
24
TEAS: Test of Essential Academic Skills
TPCNP: Traditional Pre-licensure Clinical Nursing Program
Limitations
This is a descriptive study that helps explain how the nursing program at
Arizona State University operates and to explain the performance of the student
participants. The most obvious limitation of this study is the sole use of
quantitative data rather than multimethods. This is mostly a correlational study
that helps to describe and predict success in the program. Therefore, there are
many other factors that contribute to the operation of the Arizona State University
nursing program and its participants than those variables included in this study.
However, with the data examined here a better understanding of the patterns of
selection, preparation, retention and graduation can be achieved.
25
Delimitations
A delimitation of this study is the use of data from only one university.
Arizona State University is an urban institution located in the downtown Phoenix
center, which is a dynamic environment. There is a significant Hispanic
population and a concentration of American Indian students. Arizona State
University is more like its aspirational peers, but less like smaller, private, and
non-research schools. Therefore, the results will be less generalizable to the
latter.
Assumptions The methods used to analyze the data in this research include frequency
distributions, correlational analysis, cross tabulation and multiple logistic
regression analysis. The assumptions of logistic regression analysis are described
below.
When the dependent variable is dichotomous, as it is in this research, a
regression analysis technique needs to be identified that takes into account the
probability of being in one of the outcomes as opposed to the other. Having a
restricted range can make it difficult to model such a variable. Logistic regression
allows researchers to predict such a discrete outcome whether the other variables
are continuous, discrete, or a mix of the two. Logistic regression is often used in
the health sciences where the outcome is measured as either presence of absence
of disease. In addition, logistic regression makes no assumptions about the
distributions of the predictor variables. The variables do not have to be normally
26
distributed, linearly related, or of equal variance within each group (Tabachnick
and Fidell, 1996, pp. 575-577).
The linear regression equation is the (natural log of the) probability
of being in one group divided by the probability of being in the
other group. The procedure for estimating coefficients is
maximum likelihood, and the goal is to find the best linear
combination of predictors to maximize the likelihood of obtaining
the observed outcome frequencies…The researcher uses goodness
of fit tests to choose the model that does the best job of prediction
with the fewest predictors (Tabachnick and Fidell, 1996, pp.575-
576).
This method is particularly well suited to this study since the dependent
variable is dichotomous where students have either completed the nursing
program in the prescribed four terms or they have not. In addition, the
independent variables may not be normally distributed but do not need to be for
this method.
Significance of the Study
Public administrators, including college and university administrators,
need research to identify policies at their institutions that affect student degree
completion. These policies can be amended, as needed, to maintain academic
integrity while increasing the number of students that persist and graduate.
Specific populations of students may be identified and policies developed to assist
27
them in completing the degree.
Summary and Research Questions
Research indicates that there is a need for a parsimonious explanation of
BSN readiness and attrition to guide policy makers in nursing programs in
institutions of higher education to decrease the attrition rate and boost the BSN
graduation rate.
The research questions asked in this study are:
1. What is the pattern of success for students in the upper division nursing
program at Arizona State University in 2007-08?
2. What academic variables are associated with upper division nursing program
success?
2.1. Are the grades earned in each of the prerequisite courses associated with
success in the upper division nursing program?
2.2. Is the Select GPA associated with success in the upper division nursing
program?
2.3. Is the number of replacement courses taken associated with success in the
upper division nursing program?
2.4. Are the math and reading scores and composite score from the NET
associated with success in the upper division nursing program?
2.5. Is the number of prerequisite courses taken at four-year institutions
associated with success in the upper division nursing program?
28
3. Are selected demographic factors associated with success in the upper
division nursing program?
3.1. Is race/ethnicity associated with success in the upper division nursing
program?
3.2. Is gender associated with success in the upper division nursing program?
Chapter Two examines the literature that provides the theoretical
underpinning for the research.
29
CHAPTER TWO
LITERATURE REVIEW
The Importance of Higher Education in Democracies
Higher education is important to democratic societies yet almost half of
those who start college do not complete a baccalaureate degree (Consortium for
Student Retention Data Exchange, 2009). According to a 2006 study,
Only about 42% of students now graduate within four years even
at the best public institutions, and the commonly reported six-year
rate at the best publics reaches only 71%. The average four-year
graduation rate including all public institutions is 20%, while the
six-year rate is 45% (Capaldi, Lombardi, & Yellen, 2006, p. 44).
The roots of democratic commitment to education are made explicit in
John Dewey's Democracy and Education: An Introduction to the Philosophy of
Education (1916). Dewey explains that education is important in a democracy
because we live in societies that must interact with those different from ourselves.
The devotion of democracy to education is a familiar fact. The superficial
explanation is that a government resting upon popular suffrage cannot be
successful unless those who elect and those who obey their governors are
educated. Since a democratic society repudiates the principle of external
authority, it must find a substitute in voluntary disposition and interest;
these can be created only by education. (Dewey, 1916, p. 101)
Dewey states that democracy is more than a form of government calling it,
30
"a mode of associated living, of conjoint communicated experience" (Dewey,
1916, p. 101). Individuals have to consider their own actions and the actions of
others in many different situations since the barriers of class, race, and national
territory are broken down in democratic societies. Since democratic societies do
not stratify their citizens into social classes, these societies must ensure that all of
their citizens have easy access to education. In Dewey's words, "A society which
is mobile, which is full of channels for the distribution of a change occurring
anywhere, must see to it that their members are educated to personal initiative and
adaptability" (Dewey, 1916, p. 102)."
What is the value of higher education in a democratic society? Is it
important that citizens continue educational achievement after completing high
school? Is there a threat to democratic systems if students enter higher education
but do not persist to the completion of a college degree?
A partial answer to those questions is that higher education yields benefits
to individuals and to society at large. Arthur M. Cohen lists several of these
benefits in his book The Shaping of American Higher Education: Emergence and
Growth of the Contemporary System (1998). Regarding higher education:
• It helps individuals move between social classes. Education or the
level of schooling attained is a major determinant of a person's
social-class placement.
• It yields better products and intellectual capital through research.
• It enhances community welfare. College graduates are less likely
31
to engage in health-damaging, activities, more likely to support
cultural events, and be active in civic affairs…It develops the
economy. A region's industry relates not only to its trained
workforce but also to the multiplier effect of businesses and entire
industries started by university staff in collaboration with
entrepreneurs.
• It enhances personal income. The more schooling people receive,
the more money they make, and the less likely they are to be
unemployed or the recipients of social welfare.
• It develops literacy. The community colleges and comprehensive
institutions especially have been engaged in direct language
training for immigrants and in enhancing the basic skills of
students who completed high school without mastering these
abilities.
• It is an economic engine, employing over two million people and
spending $190 billion per year…It develops human capital,
increasing the skills, energy, abilities, and tendencies in the
population that lead to greater productivity and less deviant
behavior.
• It enhances personal development. Young people are assisted
toward maturity. They broaden their outlook; they learn to delay
gratification and to appreciate differences among individuals.
32
They gain access to a society that welcomes them as worthy
citizens. (Cohen, 1998, pp. 456-57).
So, higher education “...serves many functions, provides something for anyone
seeking it, and is a national asset of incomparable value." (Cohen, 1998, pp. 457).
Dennis Hoffman, an economics professor at Arizona State University,
illustrates many of these societal benefits. Universities provide numerous benefits
to the community in which they are located (Hoffman: 2008a). These benefits
include individual financial benefits, social financial benefits, and societal
benefits.
The individual financial benefits indicate that those with a bachelor’s
degree earn an average of $17,000 per year higher than those with only a high
school diploma. If students graduate at age 22 and work until they are 65, they
will earn, on average, about $750,000 over their lifetime (Hoffman, 2008a, p. 1).
Hoffman states that the social financial benefits of higher education
“spillover” to all workers in the area. For example, an increase of 1% in the
proportion of college-educated workers in an area has been estimated to raise
wages by 1.9% among those with less than a high school diploma, 1.6% among
high school graduates, 1.2% among those with some college, and 0.4% among
university graduates (Hoffman, 2008b, p. 1).
Finally, society benefits from a better educated populace. Regions with
high proportions of college graduates have lower crime rates, greater and more
33
informed civic participation, and improved performance across other
socioeconomic measures (Hoffman, 2008, p. 1).
The benefits of a college degree also point to the importance of retaining
college students until they have completed a bachelor’s degree. Similarly,
limiting the drop out, or attrition, rate is important.
Retention in Higher Education
In the winter of 1975, the Review of Educational Research published an
article by Vincent Tinto titled "Dropout from Higher Education: A Theoretical
Synthesis of Recent Research.” This article set the stage for research on retention
that followed. In subsequent publications, Tinto (1986, 1993) listed structural
properties of organizations that might affect college student departure decisions
including: bureaucratic structure, institutional size, faculty-student ratios, and
institutional resources and goals.
J. M. Braxton included other organizational characteristics such as
admissions selectivity and control (Braxton, 2000, p. 260). Organizational
behavior that might affect social integration includes: presidential and
administrative styles (Berger and Braxton, 1998); organizational functions; effects
of organizational models on various student outcomes (Berger, 2000);
organizational attributes such as institutional communication, fairness in the
administration of rules and policies, and participation of students in decision
making (Braxton and Brier, 1989; Berger and Braxton, 1998).
A drive to establish outcomes indicators that would inform state legislators
34
and boards of regents of the efficiency and efficacy of institutions of higher
education became important to states, colleges, and universities in the 1990s. The
impetus was to retain students until they completed a college degree. Most states
developed statewide indicators to examine degrees awarded and the cost of
instruction. Statewide indicators included:
• Instructional inputs: test scores of entering freshmen; number and
performance of remedial students
• Instructional processes: time to degree; class size; faculty workload
• Instructional outcomes: graduation rates; student performance on
licensure examinations
• Efficiency: student-faculty ratios; program costs
• Condition: research activity; proportion of accredited programs;
campus facilities
• Access: enrollment, persistence, and graduation rates subdivided
by students' ethnicity
• Articulation: student transfer rates
• Relation to state: employment rates and salaries for graduates
(Cohen, 1998, p. 455).
Some universities experienced external pressures to increase graduation
rates (Moseley, 1995). State legislatures and/or boards of regents were expecting
universities to account for their graduation rates if they are deemed to be too low.
Universities were also compared to their peer institutions. If their graduation
35
rates were lower than their peer institution graduation rates, they were expected to
improve. Universities were also pressured to decrease the time that it took
students to graduate. University officials are also concerned about students
completing their degrees for another reason—they have invested resources in the
students and want to see a return for their investment.
How many, or what percentage, of students who enter college should we
expect to complete a degree? We know that not all students who enter college
will complete a four-year degree and that there are some good reasons why
students leave college, including: medical conditions (including childbirth);
moving for work; and, financial circumstances that require that the student work
more hours. In addition, a populist argument is that universities should be
accessible. Universities should try to raise the expectations of students to
encourage them to strive to excel and to consider loftier goals than they had
before. It is not unreasonable to take the view that it should be the goal of the
institution to encourage all entering students to aspire to the completion of a four-
year degree. If students do not enter with this goal, the institution should foster
this goal in the students.
Early Literature on Student Departure from Higher Education
The earliest literature on student departure from higher education is found
in the early 1900s. Johnson (1926) conducted research in 1917 in an attempt to
predict the success of students in college at the time that they entered based on
several factors including: "...high school scholarship, psychological tests, the
36
proportion of advanced studies elected in the high school and the first three
themes written in freshman English." (p. 82). Johnson found that using this
combination of variables resulted in a more reliable prediction of success in
college than the use of any one of these.
While much research on retention and graduation was conducted and
published after Johnson’s piece, a 1962 piece by Summerskill took the most
comprehensive view up to that point in time. Summerskill (1962) reviewed over
180 research studies dating back to the 1910s. He set out to answer the question
of why approximately half the students who begin studies in American colleges
and universities leave before completing an undergraduate degree and only about
40% graduate in four years. Another 20% graduate at some college, someday
(Summerskill, 1962, p. 631). He came to the conclusion that, "The extensive
literature addressing this question yields neither adequate nor conclusive
answers." (Summerskill, 1962, p. 627)
Summerskill identified several factors that are associated with dropping
out of college. These included: biological and social factors: age at matriculation,
gender; socio-economic factors; and, hometown location and size. The second set
of factors included academic factors: secondary school preparation; scholastic
aptitude; and, academic performance at college. He also suggested two
motivational factors: lack of motivation; and, change and conflict in motivation.
Finally, other factors were suggested including adjustment; illness and injury;
and, finances. It is to these factors that he devotes most of his attention.
37
Summerskill also cautioned that institutional characteristics and values are
important. He wrote,
... it is inadequate to ask whether a student has sufficient and appropriate
motivation for college. The more meaningful question is: does the student
have sufficient and appropriate motivation for a specified college with
specified characteristics and objectives. (Summerskill, 1962, p. 640).
He suggested that we distinguish between a student's motivation to attend
college and that student's motivation to graduate from that college. Some students
never intend to graduate when they begin college studies. In addition, students'
interests, needs, and goals will change during their college years. Students may
enter college with one set of goals or motivations and they may change over time.
38
Vincent Tinto’s Theoretical Model of Departure from Higher Education
The publication of “Dropout from Higher Education: A Theoretical
Synthesis of Recent Research” by Vincent Tinto in 1975 set the stage for research
on retention that followed. Tinto pointed out that previous literature failed to
explain dropout from higher education adequately because of two shortcomings:
(1) inadequate attention given to questions of definition and, (2) the lack of
development of theoretical models that sought to explain, not simply to describe,
the processes that bring individuals to leave institutions of higher education. (p.
89).
Tinto (1975) claimed that the dropout process had been inadequately
conceptualized and that not enough longitudinal models had been produced. He
showed that most previous studies were descriptive and were limited to how
individual or institutional characteristics related to dropping out. A theoretical
longitudinal model could link individual and institutional characteristics to the
process of dropping out from college (p. 90).
So, Tinto (1975) created a theoretical model that explained the interaction
between individual students and the college attended. He said that these
interactions resulted in some students dropping out. He also distinguished
between processes that result in different kinds of drop out behavior and referred
to his model as "institutionally-oriented" (p. 90).
Tinto continued to research the issue of college student departure and
studied economic, organizational, psychological, and sociological theoretical
39
perspectives (Tinto, 1986, 1993). According to another researcher, J. M. Braxton,
Tinto’s original interactionist theory “enjoys near paradigmatic stature” (2000).
As of 2000 more than 170 dissertations and 400 citations pertinent to his theory
are cited (Braxton, 2000).
Tinto's 1975 model includes condition variables on precollege entry.
These are: family background, individual attributes, and pre-college schooling.
Each of these influences each of the others and also affects the individual's goals
and commitment to the college attended. These, in turn, will affect how well the
students do in their college courses—grade performance—and how they develop
intellectually. They will also affect the interactions the student has with peers and
faculty. The grade performance and intellectual development variables are called
the academic system. The peer and faculty interactions are called the social
system. The academic and social systems interact with each other, as well.
The academic system helps to shape how well the student is integrated
academically at the college. The social system helps shape how well the student
is socially integrated into the college. Academic and social integration and the
original goal commitment and institutional commitment all shape the student's
subsequent goal and institutional commitments. These, in turn, affect whether the
student drops out of or persists in the college.
Academic Integration. Tinto (1975) stated that academic integration could
be measured in terms of grade performance and intellectual development (p. 104).
Grade performance refers to meeting certain standards of the academic system
40
and proved to be the single most important factor in predicting persistence in
college in a number of studies that Tinto reviewed.
Tinto (1975) defined intellectual development as, "... the student's
identification with the norms of the academic system" and as "...an integral part of
the person's personality development and as a reflection of his intellectual
integration into the academic system of the college..." (pp. 104-105). He also
found that intellectual development is related to persistence in college (pp. 104-
105). Some researchers found that students who persisted were, “...more likely to
value their college education as a process of gaining knowledge and of
appreciating ideas than as a process of vocational development...” (p. 105).
Tinto (1975) cites Summerskill regarding intellectual development.
Summerskill argued that what was important was the degree of congruency with
the intellectual development of the individual and the prevailing intellectual
climate of the institution (p. 106). Some students would withdraw if they felt that
the fit between themselves and the institution was not a good one.
Social Integration is another important factor. Tinto (1975) stated that,
“...social integration, like academic integration, involves notions of both levels of
integration and of degrees of congruency between the individual and his social
environment.” (p. 107). Most social integration will occur through peer group
associations, extracurricular activities, and in interactions with faculty and other
personnel at the college. If students have positive social interactions, they will
41
include them in their evaluation of the costs and benefits of college attendance
and their commitment to the institution.
Tinto (1975) reminded us that it is the student's perception of social
integration that is important. Those who drop out perceive themselves as having
less social interaction than do college persisters (p. 107). So, social integration
could be summarized as the student perceiving congruency with some part of the
social system of the college. If there is not social integration, there is more likely
to be voluntary withdrawal. Social integration can also be excessive, and, as
such, would detract from time spent on academics. This, in turn, could lead to
academic dismissal.
Academic and social system influences could also coalesce. If students
made friends with other students who had a strong academic orientation, then the
social and academic orientations could be reinforced. Many of the studies
reviewed by Tinto (1975) indicated that students who participated in
extracurricular activities had less of a strain between the demands of the social
and academic systems. In fact, those more involved in extracurricular activities
were more likely to persist.
A number of the studies reviewed found that social interaction with the
college's faculty was related to persistence in college (Tinto, 1975, p. 109). The
researchers suggested that this was due to an increase in social integration and
institutional commitment as well-as the student's academic integration (Tinto,
1975, p. 109). Tinto (1975) cited research that indicated that interacting with
42
faculty from the student's major was more important than with faculty from other
disciplines since the major faculty would have interests similar to the student. In
addition, the major faculty could have an impact on the student's future career.
Tinto (1975) concluded his discussion of social integration and
institutional commitment by indicating that academic integration most directly
affects goal commitment. Social integration most directly affects institutional
commitment. Colleges have both social and academic systems but they are really
institutions of academic achievement. Rewards to students are given for
academic excellence, not social attainment (pp. 110-111).
Institutional Characteristics and Dropout
Characteristics of the institution were also shown to relate to the
differential rates of dropout from college. Such institutional characteristics
included the colleges’ resources, facilities, structural arrangements, and
composition of its members (Tinto, 1975, p. 111). These characteristics could
lead to the development of academic and social climates at colleges.
Tinto (1975) pointed out that there had not been as much research on
institutional characteristics and dropout as there had been on individual
characteristics. However, he offered general statements about some of these
characteristics and their effect on persistence,
Public institutions of higher education tended to have higher dropout rates
than private institutions given the greater selectivity of private colleges.
43
Two-year colleges had higher dropout rates than did four-year colleges.
(Tinto, 1975, pp. 111-112).
The quality of the college was also related to dropout rates. Higher quality
colleges had higher persistence rates. Colleges with a greater percentage of
faculty with doctorates and/or institutions with higher income per student also had
higher persistence rates. Tinto (1975) referred to the "social status" effect of
educational institutions that says that, “... the higher the average social status
composition of the institution, the higher will be the perceived value of that
education by the individuals within that institution.” (p. 114). Therefore, rates of
dropout would be lower at colleges of higher quality. Tinto stated,
…Since quality of institution (and type of institution, e.g., two-year, four-
year, university, graduate) is presumably related to the degree to which
academic achievement is valued in the collegiate environment, one would
expect academic integration to be increasingly more important for
persistence, relative to social integration, the higher the quality of the
institution. (Tinto, 1975, p. 115).
Tinto (1975) concluded by saying that when studying drop out behavior, it
is important to distinguish between the different types of drop out behavior:
voluntary withdrawal and dismissal for academic reasons. This is especially
important because there are individual and institutional characteristics that affect
the students' ability to integrate themselves into the academic and social systems
of the colleges that they attend. Voluntary withdrawal is not associated with
44
grade performance. Academic dismissal is related to grade performance.
Voluntary withdrawal is more closely associated with a lack of congruence
between the student and the intellectual climate of the institution and the social
system composed of the students' peers (Tinto, 1975, p. 117).
Students also use cost benefit analysis in their decisions regarding
persisting or dropping out. Once students have completed one or more years of
college, they have more vested in the college degree and the nearer they are to
completion, the less likely they are to drop out. Therefore, goal and institutional
commitment are expected to increase as a function of nearness to the completion
of the degree. Those students who are academically dismissed tend to have both
lower aptitude and lower levels of intellectual development and to be of a lower
social status (Tinto, 1975, p. 118). Tinto concluded, based on this information,
that,
…given sufficient social interaction, programs designed to influence the
academic performance of persons from lower social status backgrounds
(backgrounds frequently of inferior schooling prior to college) seem to be
aimed in the proper direction to enhance their persistence in college.
Whether this applies equally well to the various racial minorities that are
disproportionately represented in the lower social status categories of
college students remains, however, to be determined. (Tinto, 1975, pp.
118-119)
Dropping Out Due to External Factors
45
Tinto (1975), of course, recognizes that students drop out of college for
reasons external to the college. One of the external factors that he considered was
the state of the job market. Tinto utilized cost-benefit analysis to explore this
factor. According to this theory, individuals will decide whether or not to
participate in an activity based on the perceived costs and benefits of that activity
relative to alternative activities. Cost-benefit analysis can help to explain a
student's decision to drop out of college. Students who believe that they will
receive greater benefits from spending their time and energy elsewhere will be
more likely to drop out of college.
Evaluating the Tinto Model
Tinto's review is a thorough review of all previous literature on the topic
of departure from higher education. It was also the first research to develop a
theory of dropping out that was explanatory, not merely descriptive. He made it
clear that researchers had to be precise in their definitions of terms like "drop out"
and that research needed to be longitudinal in order to really understand the
individual and institutional characteristics related to dropping out.
The “institutionally-oriented” theoretical model that Tinto developed
allows researchers to better understand the social process of dropping out of
institutions of higher education. By viewing colleges as academic and social
systems, it followed that students may drop out because they did not share the
same values or social structures as the college. If students do not feel integrated
46
into the social and/or academic systems in the college, they would be more likely
to drop out.
Tinto's model is inclusive. He includes family background, individual
characteristics of students, and pre-college schooling experiences in the model as
variables in their own right as well as variables that could affect the student's goal
commitment and institutional commitment. These goals, in turn, will affect how
students will perform in terms of grades, how they will develop intellectually,
how they will interact with their peers and with faculty. These experiences will
determine how integrated students will be academically and socially. All of this
will serve to strengthen or weaken students' commitments to their goals and to the
institution. Finally, students will decide to persist with their education or to drop
out.
Tinto's explanation of the model was detailed and intuitive. He provided a
very tangible explanation of social integration that included peer group
associations, extracurricular activities, and interactions with faculty and other
personnel at the college. He also reminded us that students’ perceptions of their
social integration were important.
His explanation of academic integration was less satisfying. He defined
grade performance as "meeting certain standards of the academic system." This
may refer to the threshold that colleges have for defining "good academic
standing" for their students. At many colleges this is defined as maintaining a
grade point average of 2.0 or above. Students who fall below this threshold can
47
face certain penalties such as "academic probation" and/or "dismissal or
disqualification" from the institution.
Intellectual development was defined as "the student's identification with
the norms of the academic system" (Tinto, 1975, p. 104). He found that those
that persisted in their college education were "more likely to value their college
education as a process of gaining knowledge and of appreciating ideas than as a
process of vocational development" (Tinto, 1975, p. 105). While understanding
grade performance is somewhat straightforward, understanding intellectual
development and how to assess it is less so.
The definitions of social integration are easier to understand and measure
than are those offered under academic integration. It is easier to understand and
determine how to measure "peer interactions" and "interactions with faculty" than
it is to pinpoint what are "the student's identification with the norms of the
academic system." Perhaps one way to understand this would be to ask the
students directly whether they were expecting to gain vocational skills or to
develop intellectually in the college and whether they believe that they had
achieved one of these.
Tinto's discussion of institutional characteristics was new. He included
such variables as resources, facilities, structural arrangements, and composition of
its members. He stated that all of these lead to a "social climate" at the institution.
I might rephrase this as "organizational culture.”
48
Organizational culture is defined as a system of learned, shared values,
beliefs, and norms that are used to understand the elements in the
environment and serve as a guide for all kinds of behavior. It is developed
by the organization not imposed on it. (Harris and DeSimone, 1994).
Another definition of organizational culture is
...the pattern of basic assumptions that a given group has invented,
discovered, or developed in learning to cope with its problems of external
adaptation and internal integration, that has worked well enough to be
considered valid and, therefore, to be taught to new members as the
correct way to perceive, think, and feel in relation to those problems"
(Schein, 1984, p. 14).
Leaders may, then, foster this culture by communicating it to members of
the organization and rewarding those that successfully demonstrate the desired
behavior.
Testing Tinto's Student Integration Model
Since 1975, there have been volumes of research testing Tinto's
theory/model and other models have been proposed. Tinto himself reexamined
his theory and also reviewed research conducted by others after 1975. Mallette
and Cabrera concluded that many post-1975 studies that tested Tinto's student
integration model found that precollege ability and background factors exerted no
significant direct effects on retention and found that background characteristics
influence, at most, initial institutional commitments and, to some extent, academic
49
and social integration (Mallette and Cabrera, 1991, p. 181). Other researchers
found that precollege ability and background factors did predict withdrawal
behavior (Anderson, 1981; Getzlaf, Gordon, Kearney, and Blackwell, 1984;
Pascarella and Terenzini, 1980; Terenzini, Lorang, and Pascarella, 1981).
Mallette and Cabrera (1991) also found that other researchers reported
contradictory results. Specifically, researchers differed in their conclusions about
what role variables in the model play in academic integration, social integration,
final goal commitment, and final institutional commitment.
Mallette and Cabrera (1991) reviewed other research that looked at
distinguishing between different types of withdrawal behavior. Some voluntary
drop outs could actually be considered transfers since they left their original
college to attend another college. They found that academic performance helped
to discriminate between persisters and drop outs, but failed to do so with transfers
and persisters.
Mallette and Cabrera (1991) also argued that colleges/universities that
sponsor programs that focus on academic ability, interactions with faculty,
institutional commitment, and student finances are likely to reduce the propensity
to drop out. Colleges that sponsor programs that emphasize institutional and goal
commitments are likely to reduce the propensity of students to transfer to other
colleges/universities (p. 191).
Other researchers found that institutional commitment did not affect
persistence (Munro, 1981); that final goal commitment and persistence were not

50
connected for females (Pascarella and Terenzini, 1983); that neither final goal
commitment nor final institutional commitment affected persistence, that neither
of these commitments was affected by academic integration or social integration,
and that the effect of social integration on persistence was negative (Pascarella,
Duby, and Iverson, 1983); and that neither academic integration nor social
integration had a significant effect on retention among Chicano students attending
three community colleges in southwest Texas (Nora, 1987).
51
The Student Attrition Model
Research by Bean (1980), Metzner and Bean (1987), and Bean and Vesper
(1990) proposed an alternative to Tinto's Student Integration Model. Their work
built upon process models of organizational turnover (March and Simon, 1958),
and models of attitude-behavior interactions (Bentler and Speckart, 1979; and
Bentler, 1981) and is called the Student Attrition Model. Bean, as quoted by
Cabrera, et al. (1992), argued that, "... student attrition is analogous to turnover in
work organizations" and they stressed "...the importance of behavioral intentions
(to stay or leave) as predictors of persistence behavior" (Cabrera, et al., 1992, p.
145). Bean's model also included factors external to the college that could play a
major role in affecting student attitudes and decisions such as student perceptions
of institutional quality, institutional fit, and opportunity to transfer.
In evaluating the Student Attrition Model, Mallette and Cabrera (1991)
state that adding these constructs to the student integration model might help us to
understand transfer decisions (p. 191). In addition, if the college studied the
institutions where their students were most likely to transfer, it helped them to
identify their competition and to assess the extent to which their academic
programs meet the needs of their students (p. 191).
According to Cabrera, et al. (1992), research shows that there is support
for the propositions that organizational, personal, and environmental variables
shape the attitudes of students, and student's intents to persist (p. 144). Research
done by Bean and Vesper (1990) found that factors other than those related to
52
intelligence play a major role in students' decisions to persist or drop out of
college. They also found that family approval had both a direct and indirect effect
on persistence.
Cabrera, et al. (1992) argued that a major gap in Tinto's Student
Integration Model and theory was the role of external factors in shaping student
perceptions, commitments, and preferences. Some of the external factors
affecting persisting behavior that they considered included parental
encouragement, support from friends, finances, and perceptions about opportunity
to transfer to other institutions. They state that the role that factors external to the
institution play on the college persistence process is by far more complex and
comprehensive than the one portrayed by Tinto's Student Integration Model (p.
159). They also state that their results support Bean's assertion that the influence
of environmental, organizational, and personal variables on persistence is more
likely to be indirect, mediated through behavioral intentions to stay or remain at
the institution.
Limitations of the Interactionist Theories
The Tinto (1975) and Bean (1980) models are considered interactional
models. Ruddock, et al. (1999) conducted research to determine if there were
variables in addition to those reported in the literature that would help predict
whether students would persist and point out the limitations of interactionist
theories of student departure developed by such researchers as Tinto and Bean:
external forces such as working off campus, the effects of commuting, and
53
volunteer participation in community events had not been considered (p. 2). In
addition, little attention had been paid to internal organizational policies and
procedures of the colleges and universities in the research. Citing Tinto (1986,
1987) and Hossler (1991), Ruddock et al. (1999) indicate that there was a call for,
...a more comprehensive theory of student departure, one that includes a
more detailed definition of "dropping out," accounts for the rich variety of
ways students are involved and interactive with the formal and informal
aspects of the institution, incorporates the time-specific nature of the
departure process, includes the relative impact of institutional policy and
procedures, as well as some measure of the quality and intensity of student
effort in the academic experience. (Ruddock, 1999, p. 2)
Using University of Texas at Austin for their study, the researchers
controlled for variables that had been reported in the literature as influencing
retention. These included high school rank, SAT total score, major,
race/ethnicity, gender, on-campus versus off-campus housing, and whether or not
the student attended orientation. They also looked at background factors, issues
concerning academic and career aspirations, institutional factors, faculty attitudes,
student support services, finances, persistence, diversity, personal factors, and
involvement along with the academic status of the student that was obtained from
student records (p. 20). Seven other factors were considered including:
• Why the student decided to attend the University of Texas at Austin
• Where they lived during their first year
54
• Whether they were employed during their first year
• How many hours per week they worked
• How many hours per week they studied outside of class
• How many times they skipped class because it did not seem worth going
(in the last semester)
• And, an estimation of the number of times since coming to the University
of Texas at Austin that they met with a faculty member outside of the
classroom (pp. 6-7).
They found that these variables did not predict which students would stay
and which would leave. Those students that persisted did not look different than
those students that dropped out.
The most striking finding was that the Leavers did much worse
academically than the Stayers. Given that academic preparation was
controlled for, Leavers experienced greater academic difficulty than could
have been predicted ahead of time. (Ruddock, et al., 1999, p. 15)
Adding ethnicity to the study did not add to their ability to predict retention.
They also offered the following academic findings:
• A larger percentage of students who left had grade point averages below
2.00 than did students who stayed.
• There was a high rate of enrollment in retention activities by both Stayers
and Leavers.
55
• Stayers generally did better in gatekeeper courses, whether they were
enrolled in sections with supplemental instruction or not.
• When the group of Leavers was divided into three subgroups based on
academic standing at the time they left, generally, Stayers and Leavers in
Good Academic Standing gave similar responses, while Leavers on
Academic Probation and Leavers Dismissed for Academic Reasons gave
similar responses.
Regarding the nonacademic findings, Ruddock et al. (1999) state that,
"Leavers reported greater difficulty adjusting to the university and were more
likely to cite health and personal issues as reasons why they left the university" (p.
17). In addition, self-reported interactions with faculty and staff, finances, and
goals did not differ significantly between the groups of Stayers and Leavers.
They also found very little support for the interactional models of student
departure.
Ruddock et al. (1999) stated that approximately half of the students who
left the university were having academic difficulty but they were unable to
determine if that was due to poor adjustment to the university, personal problems,
or "less than optimum learning conditions" (p. 18). They recommended that the
university:
• Identify, as early as possible, those students who are having academic
difficulty
56
• Provide training for faculty, TAs, AIs, academic advisors, resident hall
advisors, pledge trainers, etc., to spot and intervene on behalf of these
students… Maintain present retention programs.
• Provide programs for those students identified early in their first semester who
appear to be having academic difficulty.
• Review current academic policies to determine possible effects on freshman
retention.
• Study the faculty in terms of attitudes and culture towards grading, philosophy
on gatekeeper courses, etc.
• Study how faculty attitudes toward student success influence who does or
does not succeed (p. 19).
Ruddock et al. (1999) recommended that researchers look at academic
policies of the institution, retention program activities and services, and the
faculty's role in retention and student persistence, (pp. 20-21).
Future Research Needs
The models developed to understand student retention in college include
many variables that may in fact have an effect on whether students stay in college
until they complete a degree. However, many of these variables cannot be
influenced by college officials and must be taken as given. These include the
background characteristics of students, environmental variables, student
commitment to the college that they choose to attend, and, to some extent, how
well students do once they have completed studies at that college. What

57
researchers need to do now is find those other factors that influence the student
decision to stay or leave over which they might have some control.
Concluding Remarks about Departure from Higher Education
It is in the best interest of our country for students to attend higher
education and to complete their college degree once they have entered. Yet,
approximately half of the students that enter college will not complete their
degrees. Student departure from higher education has been the subject of much
research. The first theoretical model to describe leaving behavior was prepared
by Tinto who produced an interactional, institutional model to explain why
students leave college. His main premise was that students may or may not
become academically and socially integrated into college. The level of
integration will affect their commitment to their goal of college completion and to
their commitment to the college that they chose to attend.
The Tinto model has been modified many times and many other aspects of
the student departure puzzle have been examined. We now know much more
about why students leave college than we did before. Many of the reasons that
students leave are beyond the control of others, including officials at colleges and
universities that would like for their matriculated students to persist and graduate.
It should now be the focus of researchers to find those variables that we do have
some control over so we can attempt to attract, keep, and graduate students. Some
of the variables that should be considered are the academic policies, faculty
actions, and student services on college campuses.
58
Predicting Successful Completion of Baccalaureate Nursing Programs
While many nurses believe that nursing research should focus on
acquiring knowledge related to clinical practice, others feel that nursing research
should be broader than that and also include research on nursing education,
nursing administration, and nurses’ characteristics, and roles. Taking this broader
perspective can result in research being conducted that can directly or indirectly
influence the practice of nursing. Burns and Grove (2009, p. 3) developed a
framework to depict the connections between research and the elements of
nursing.
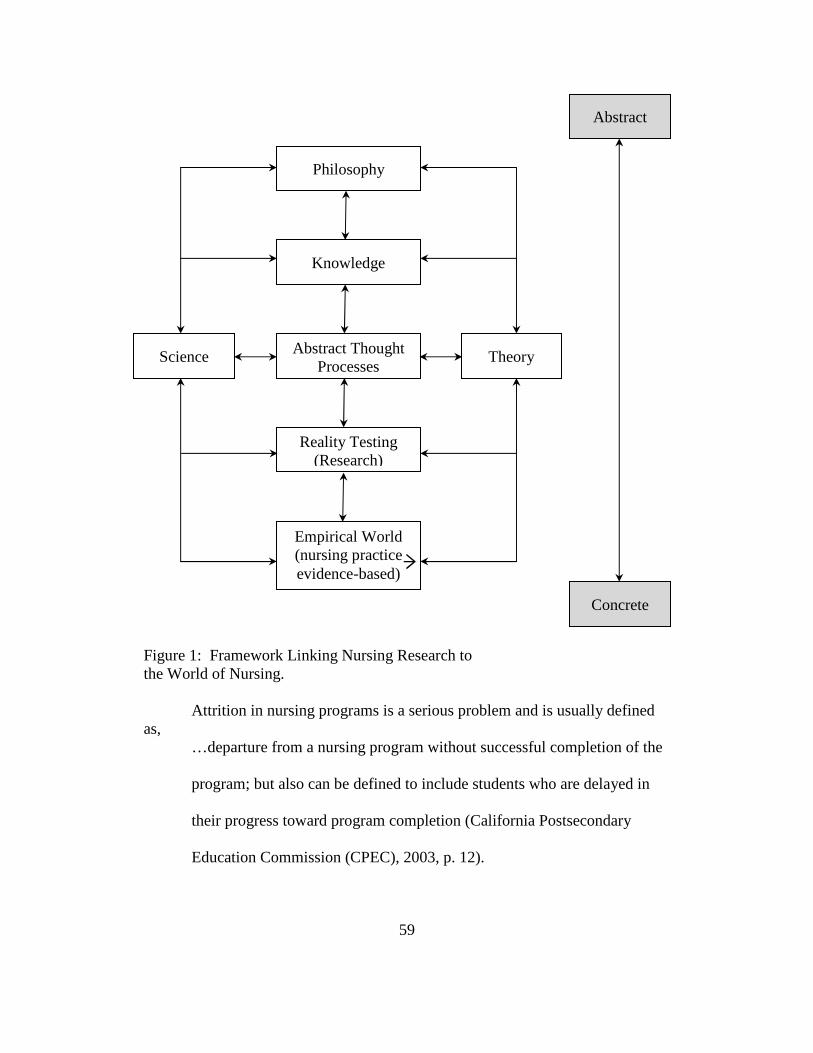
59
Figure 1: Framework Linking Nursing Research to the World of Nursing.
Attrition in nursing programs is a serious problem and is usually defined as,
…departure from a nursing program without successful completion of the
program; but also can be defined to include students who are delayed in
their progress toward program completion (California Postsecondary
Education Commission (CPEC), 2003, p. 12).
Theory
Knowledge
Abstract Thought Processes
Reality Testing (Research)
Empirical World (nursing practice evidence-based)
Philosophy
Science
Abstract
Concrete
60
Much of the research on attrition in nursing programs concludes that for
students to be successful in a baccalaureate nursing program colleges must admit
academically strong candidates. Students that are not prepared for the rigor of
baccalaureate nursing programs will suffer financial and emotional difficulties if
they are admitted to a nursing program and then fail.
While the National League for Nursing Accrediting Commission suggests
that 80% is an acceptable retention rate for nursing programs, graduation rates for
these programs are less than 50% nationwide (Brown and Marshall, 2008). Many
researchers attribute high rates of attrition from nursing programs to the caliber of
the students admitted to these programs citing that those students that left were
not academically prepared for the nursing major. (Brown and Marshall, 2008;
CPEC, 2003; Newton & Moore, 2008; Newton et al., 2007; Symes et al., 2005).
Those nursing programs with more stringent admission policies may have a lower
attrition rate since they are choosing more academically prepared students.
(DiBartolo and Seldomridge, 2005; Newton et al., 2007).
Because there are limited clinical training spaces in health agencies,
limited nursing faculty, and limited financial resources, and because there is a
looming nursing shortage, it is essential to identify the best possible students for
nursing education. In addition, Byrd, (1999) et al., point out that there is an,
“…increased emphasis on outcome criteria in nursing education (which) gives
added importance to determining predictors of success in baccalaureate nursing
61
programs.” (Byrd, et al., 1999, p. 1). The outcome criteria include passage of the
NCLEX-RN and safe practice as a registered nurse.
Early research on retention and attrition of nursing students found that the
most frequently studied variables were IQ tests, aptitude tests and rank in high
school (Plapp, Psathas, & Caputo, 1965, p. 566). Students with higher numbers
were more likely to be successful in nursing programs.
More recent research on nursing school attrition looks at several variables.
The variables most commonly used fall into the categories of nursing aptitude
measured by grades in particular pre-nursing courses, standardized tests, and
whether pre-nursing courses were taken at two- or four-year colleges.
Other factors considered in the literature are rolling admission policies
(Newton et al., 2007), allegiance to the institution attended and integration into
the social and intellectual life of the university. The latter is reminiscent of
Tinto’s theory of academic and social integration.
Much of the research points to the importance of course grades in pre-
nursing courses. Newton & Moore (2009) found that pre-nursing grades of less
than 2.5 are associated with having a weak scholastic aptitude (Newton & Moore,
2009). “Nursing aptitude” refers to grades earned in specific pre-nursing courses,
Aptitude is the complexity of knowledge needed by today’s nursing
students and cannot be determined by GPA alone. Aptitude must be
broken down into nursing and scholastic aptitude. Nursing aptitude is
more specific knowledge than scholastic aptitude and can be
62
operationalized as college-level competencies in English, math, science,
and reading comprehension (Newton, Smith and Moore, 2007).
The literature indicates that BSN students who are admitted with strong
scholastic and nursing aptitudes are less likely than students admitted with weak
aptitudes to have progression/retention issues (Brown and Marshall, 2008;
Newton et al.; 2007; Symes, Tart and Trafis, 2005). Specific courses cited as
being the most predictive of success include science courses (Potolsky, Cohen, &
Saylor (2003) and human pathophysiology (Uyehara, et al., 2007). The higher the
grade, the higher the probability of program success. (35).
Standardized nursing aptitude tests are widely suggested for use with other
admission data (Crow, et al., 2004; Newton, Smith Moore, et al., 2007). Tests
such as pre-college scores on the SAT or ACT, or nursing aptitude tests such as
the Nurse Entrance Test (NET) or the Test of Essential Academic Skills (TEAS)
were expected to be important predictors of success in nursing programs. A study
by Newton, Smith, Moore, et al. (2007) reported that the TEAS was able to
predict first semester nursing program success and that the TEAS was a more
reliable predictor of first semester success than was pre-nursing GPA.
Wolkowitz, and Kelley (2010) found when studying TEAS as a predictor
that the science section of the TEAS is,
…both a statistically significant predictor and the strongest of the four
content areas in the prediction of early nursing program success (of
science, mathematics, reading, and English content areas) (498). The
63
strongest predictor in overall and unique variance explained is the science
subtest of the TEAS followed by reading, written/verbal, and mathematics,
respectively.
Nationwide, many BSN programs use commercially available
standardized nursing aptitude tests along with scholastic aptitude to select
candidates for admission to the nursing major (Assessment Technologies Institute
(ATI), 2007; Newton et al., 2006; Newton, et al., 2007). However, little empirical
data exist that describes whether long-term retention in a BSN program and
readiness for the NCLEX-RN can be predicted using student aptitude data
(Newton, and Moore, 2009).
Transferring to a four-year institution from a two-year institution, like a
community college, can be a risk factor for attrition (Newton, et al., 2006).
Townsend (1995) reasons that this is due to the differences between four year
institutions and that, “...the milieu of community colleges tends to be student
centered and designed to raise self-esteem” (Townsend, 1995). In addition,
Newton suggests that BSN students who initiate their post-secondary educations
at community colleges are potentially at higher risk for attrition than students who
initiate their post-secondary educations at a four-year college or university (2005).
In Newton and Moore’s words (2009),
Thus, it behooves nurse educators to ….focus their attentions on the core
predictor variables that are known and that continue to be predictive of
BSN student attrition and NCLEX-RN readiness, namely, aptitude.
64
Tentative theory developed from the findings of this and other studies in
the literature (e.g., Crow, Handley, Morrison, and Mitchell, 2004; Newton
et al., 2007; Newton, et al., 2006; DiBartole and Seldomridge, 2005)
should be used to develop an explanatory model of the phenomena for use
by BSN programs, nationwide, to curtail BSN student attrition and
promote NCLEX-RN success.
Focus of this Thesis
It is to nursing aptitude variables that this study will now focus. We will
examine variables found in Tinto’s model under Academic Systems: academic
performance, or grades. From the Ruddock, et al., 1999 model the study
addresses some of the variables needing further examination: faculty definitions
of academic competence, academic policies on grade replacement, and retention
policies regarding gateway courses.
65
CHAPTER THREE
METHODOLOGY
Introduction
This study is designed to understand the patterns of selection, preparation,
retention and graduation of undergraduate pre-licensure clinical nursing students
in the College of Nursing and Health Innovation at Arizona State University
enrolled in 2007 and 2008. These patterns include prerequisite course grades,
course location, course replacement, entrance test scores, demographics, and
outcomes and are identified and described.
Restatement of the Problem
The questions asked in this study are: What are the patterns of selection,
preparation, retention and graduation in the undergraduate pre-licensure clinical
nursing program?
Is graduation in the prescribed four terms related to:
• grades earned in individual prerequisite courses?
• the composite GPA of those courses?
• entrance test scores?
• the number of replacement courses taken?
• the number of prerequisite courses taken at four-year colleges?
• race/ethnicity?
• gender?
The predictor variables for this study are grades earned in prerequisite
66
courses, the Select GPA which is a composite of the prerequisite courses, the
Nurses Entrance Test (NET) subject test scores in reading and math and the
composite score, the Select GPA, the number of replacement courses taken, the
number of prerequisite courses taken at four-year institutions, race/ethnicity, and
gender. The dependent variable is defined as the completion of the prescribed
four-term Traditional Pre-licensure Clinical Nursing Program (TPCNP) without
course failure or interruption in progression. It is a dichotomous variable with
values of either yes or no.
Variables of Interest
The faculty of the College of Nursing and Health Innovation at Arizona
State University identified 17 prerequisite courses that are required for the
Traditional Pre-licensure Clinical Nursing Program (TPCNP). They are
considered gateway courses to the upper division nursing coursework. Thirteen
of the 17 are averaged into a Select GPA, which includes three of four required
science with laboratory courses and two semesters of English composition. Eight
courses are then chosen by the students. The 17 prerequisite courses are: 1)
Anatomy and Physiology I, 2) Anatomy and Physiology II, 3) Introduction to
Chemistry, 4) Human Development, 5) First Year Composition I, 6) First Year
Composition II, 7) Clinical Health Care Ethics, 8) Introduction to Nursing and
Healthcare Systems, 9) Culture and Health, 10) Human Pathophysiology,11)
College Mathematics, 12) Microbiology with laboratory, 13) Human Nutrition,
14) Statistics, 15) Humanities/Fine Arts/Design, 16) Psychology, and an 17)
67
elective.
For students to be considered for the TCPNP they must earn a grade of
“C” (2.00) or higher in each of these courses. The combined grade point average
(GPA) for all 17 courses must be at least a 3.25, and the Select GPA (13 of 17
courses) must be at least a 3.25 for students to be considered for the TPCNP. The
range for both the prerequisite and select GPA is 3.25 to 4.00.
The faculty have identified fifteen of the seventeen courses that they
believe are the most predictive of success in the TPCNP. Humanities/Fine
Arts/Design and the elective are excluded in the prediction. The researcher will
determine the correlations among courses and Select GPA and success in the
program.
If students earn grades of “C” or “B” in prerequisite courses they may be
allowed to take replacement courses. Replacement courses are identified by the
faculty as courses at a level higher than the original prerequisite. So, for example,
if a student earns a “C” in First Year Composition 1, the faculty could allow the
student to take a higher level composition course, say, ENG 216 Persuasive
Writing on Public Issues, and use the grade earned in that course in the
computation of the Select GPA rather than the original “C” grade earned in First
Year Composition 1. Some students opt to take replacement courses to maximize
the Prerequisite and Select GPAs. The possible range of courses is from 0 to 15,
but in reality is three or less. The nursing faculty believe that students who take
replacement courses are less likely to be successful than those who earn high
68
grades initially in the prerequisite courses (Morris, 2012). This hunch will be
examined.
Prerequisite Course Location. The next variable considered will be the
number of prerequisites courses (of the 15 identified as best predictors) taken at
four-year colleges. The nursing faculty and this author believe that students who
have taken all or most of their courses at four-year colleges will be more
successful than those students who took all or most of them at two-year colleges
(Morris, 2012; Herrera, 2012).
The Nurses Entrance Test. The faculty of the College of Nursing and
Health Innovation at Arizona State University also require that students earn at
least minimum scores on an entrance test. Until 2010, the Nurses Entrance Test
(NET) was the prescribed entrance test. The NET is a computer based test
consisting of six parts: math skills, reading comprehension, test taking skills,
stress level, social interaction, and learning style. Students must have completed
all six parts in order to receive scores and be considered for admission. However,
only the math and reading scores are used to calculate application eligibility.
Math skills problems consist of whole numbers, decimals, fractions, percentages,
number system conversions, and algebra equations (60 problems in 60 minutes).
Reading comprehension involves reading selections and answering questions (33
questions in 30 minutes)
(http://www.testprepreview.com/net_test_breakdown.htm). A reading score of
60% or higher and a math score of 65% or higher is required for TPCNP
69
consideration so the range of the reading portion of the NET is .60 to 1 and the
range of the math portion of the NET is from .65 to 1.00.
Demographic Factors. Race/ethnicity and gender are nominal variables
identified in the following way: Asian, Black, Hispanic, Native American, or
White. Gender is identified as male or female.
Independent Variables in the Study
Grades in Prerequisite Courses. Grades earned in 15 prerequisite courses
listed earlier and Select GPA (SELECT), Replacement courses (REPL), Number
of Prerequisites at 4 Year School (PRQ4YR), Nurses Entrance Test Math
(NETMATH), Nurses Entrance Test Reading (NETREAD), Nurses Entrance Test
Composite (NET), Race/Ethnicity (RACE), and Gender (GEND) are used as
independent variables.
Research Design and Procedures
The frequencies for each variable will be displayed and the descriptive
statistics for all variables will be calculated showing the mean, and standard
deviation. Correlational analysis will be conducted and statistics reported.
Crosstabulations will be run on race/ethnicity and NET scores as well as for
gender and Completion of the Program in Four Terms. Multiple logistic
regression analysis will then be employed to determine the patterns of
participation and graduation of students.
Summary Table. Table 1 depicts the research questions asked in Chapter One,
the corresponding source of information, data analysis procedures, and the

70
expected outcomes.
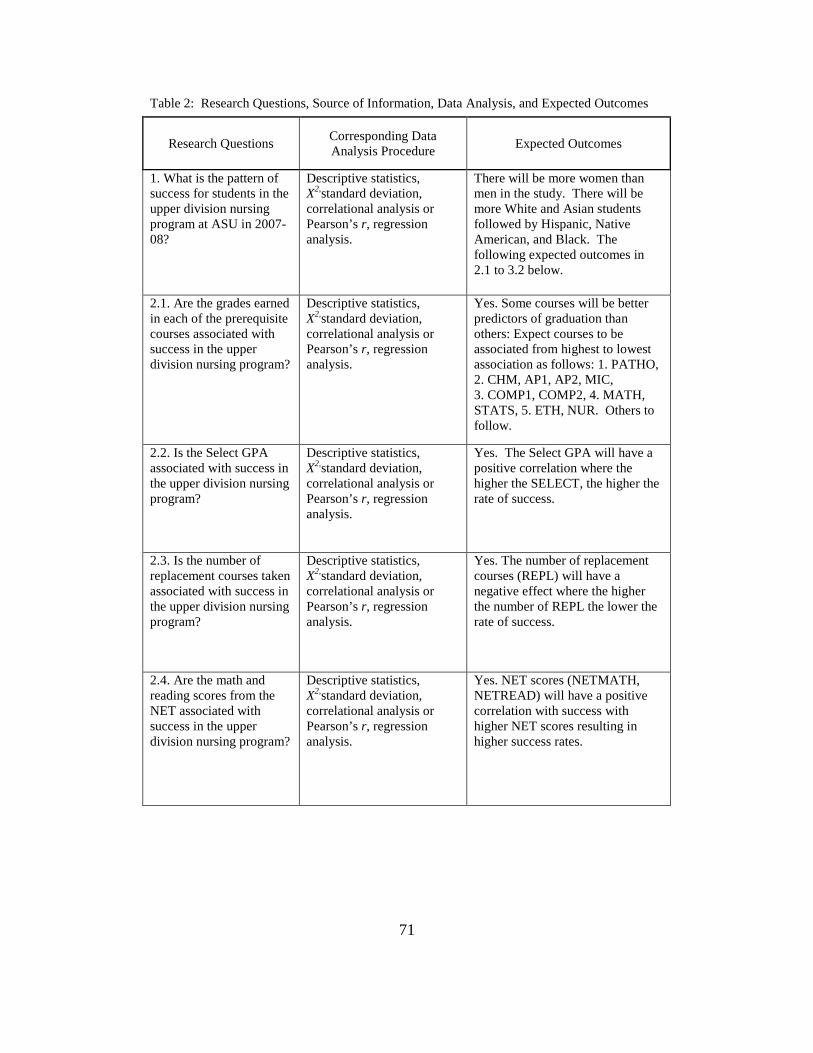
71
Table 2: Research Questions, Source of Information, Data Analysis, and Expected Outcomes
Research Questions Corresponding Data Analysis Procedure
Expected Outcomes
1. What is the pattern of success for students in the upper division nursing program at ASU in 2007-08?
Descriptive statistics, X2,standard deviation, correlational analysis or Pearson’s r, regression analysis.
There will be more women than men in the study. There will be more White and Asian students followed by Hispanic, Native American, and Black. The following expected outcomes in 2.1 to 3.2 below.
2.1. Are the grades earned in each of the prerequisite courses associated with success in the upper division nursing program?
Descriptive statistics, X2,standard deviation, correlational analysis or Pearson’s r, regression analysis.
Yes. Some courses will be better predictors of graduation than others: Expect courses to be associated from highest to lowest association as follows: 1. PATHO, 2. CHM, AP1, AP2, MIC, 3. COMP1, COMP2, 4. MATH, STATS, 5. ETH, NUR. Others to follow.
2.2. Is the Select GPA associated with success in the upper division nursing program?
Descriptive statistics, X2,standard deviation, correlational analysis or Pearson’s r, regression analysis.
Yes. The Select GPA will have a positive correlation where the higher the SELECT, the higher the rate of success.
2.3. Is the number of replacement courses taken associated with success in the upper division nursing program?
Descriptive statistics, X2,standard deviation, correlational analysis or Pearson’s r, regression analysis.
Yes. The number of replacement courses (REPL) will have a negative effect where the higher the number of REPL the lower the rate of success.
2.4. Are the math and reading scores from the NET associated with success in the upper division nursing program?
Descriptive statistics, X2,standard deviation, correlational analysis or Pearson’s r, regression analysis.
Yes. NET scores (NETMATH, NETREAD) will have a positive correlation with success with higher NET scores resulting in higher success rates.
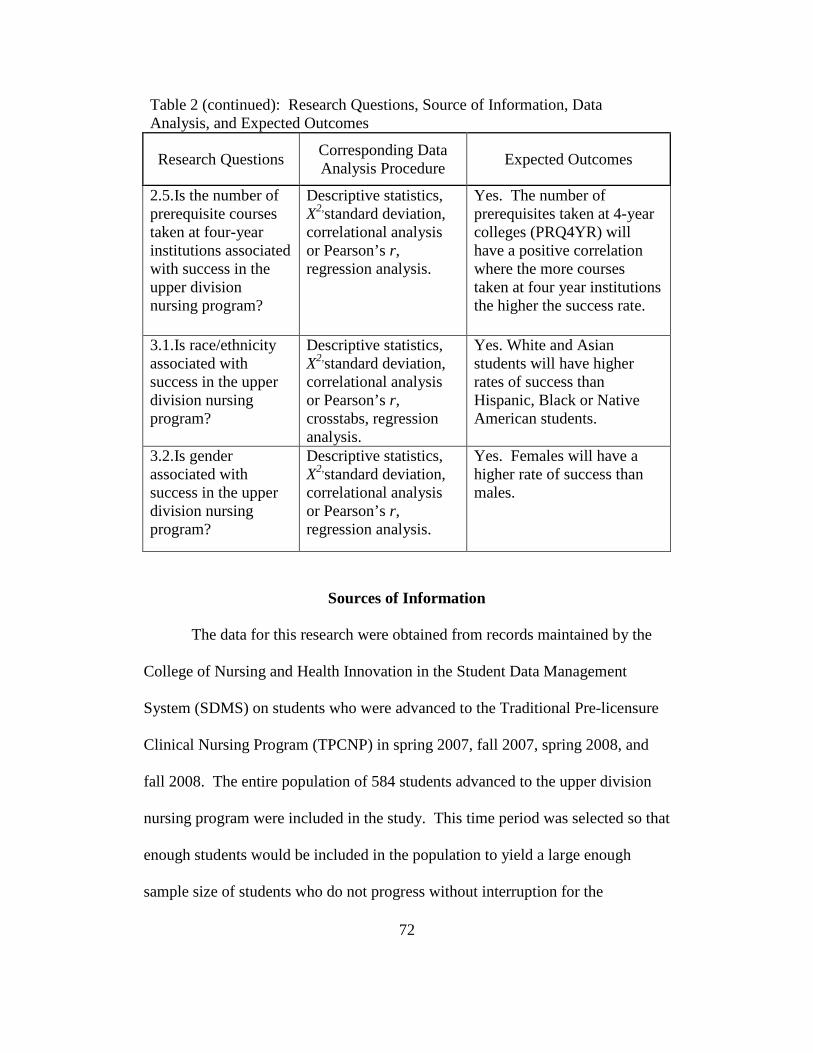
72
Table 2 (continued): Research Questions, Source of Information, Data Analysis, and Expected Outcomes
Research Questions Corresponding Data Analysis Procedure
Expected Outcomes
2.5.Is the number of prerequisite courses taken at four-year institutions associated with success in the upper division nursing program?
Descriptive statistics, X2,standard deviation, correlational analysis or Pearson’s r, regression analysis.
Yes. The number of prerequisites taken at 4-year colleges (PRQ4YR) will have a positive correlation where the more courses taken at four year institutions the higher the success rate.
3.1.Is race/ethnicity associated with success in the upper division nursing program?
Descriptive statistics, X2,standard deviation, correlational analysis or Pearson’s r, crosstabs, regression analysis.
Yes. White and Asian students will have higher rates of success than Hispanic, Black or Native American students.
3.2.Is gender associated with success in the upper division nursing program?
Descriptive statistics, X2,standard deviation, correlational analysis or Pearson’s r, regression analysis.
Yes. Females will have a higher rate of success than males.
Sources of Information
The data for this research were obtained from records maintained by the
College of Nursing and Health Innovation in the Student Data Management
System (SDMS) on students who were advanced to the Traditional Pre-licensure
Clinical Nursing Program (TPCNP) in spring 2007, fall 2007, spring 2008, and
fall 2008. The entire population of 584 students advanced to the upper division
nursing program were included in the study. This time period was selected so that
enough students would be included in the population to yield a large enough
sample size of students who do not progress without interruption for the
73
prescribed four terms to meet confidence levels and significance criteria of
multiple logistic regression analysis. This time period was also chosen because
all students admitted/advanced during this period would have taken the NET.
Data Collection Procedures
Student data from the SDMS regarding course grades; Select GPA; NET
Reading, Math and Composite scores; race/ethnicity; and gender were saved into
spreadsheets. A manual count of the number of replacement courses was
conducted and added to the spreadsheets.
Additional information cited in this study is based on an interview with a
senior program administrator conducted in January 2012. The interview helped
the researcher to understand information about college standards and faculty
views of the undergraduate pre-licensure clinical nursing program.
Other information about the nursing program was available based on the
knowledge of the author in her role as Director of Undergraduate Student
Academic Services for the College of Nursing and Health Innovation.
Statistical Analysis Procedures
The identifying information from the spreadsheets was removed to protect
the identity of the students. The data were then loaded into IBM SPSS so that
frequencies, descriptive statistics, and regression analysis could be conducted.
Frequencies were run for each variable and the mean and standard deviation
calculated. Crosstabulations were prepared for the race/ethnicity variable with
completion of the program and with NET scores. Multinominal logistic
74
regression analysis was run for all independent variables on the dependent
variable.
Summary
This research was undertaken to understand the patterns of selection,
preparation, retention and graduation in the undergraduate pre-licensure clinical
nursing program at Arizona State University using data obtained on students
enrolled in this program in 2007-08. This is an ex post facto study of the entire
population of students enrolled in this program in 2007-08 who, thus, had four
terms or more to complete the four term program. The variables examined
included grades earned in 15 prerequisite courses; the composite Select GPA; the
entrance test, or NET, scores; the number of replacement courses taken; the
number of prerequisite courses taken at four-year institutions; the race/ethnicity of
the students; and, the gender of the students.
75
CHAPTER FOUR
FINDINGS AND RESULTS
Analyses
Correlational Analysis
The first step taken in analyzing the data collected for this research was to
run correlational analysis. Correlation is a measure of linear dependency between
two variables. The Pearson product-moment correlation coefficient, typically
denoted by r and called Pearson’s r, is widely used in the sciences as a measure of
the strength of linear dependence. Pearson’s r has a value between +1 and -1 and
a value of +1 means that the variables are perfectly correlated. A value of -1
means that the variables are perfectly, inversely correlated. In the social sciences,
Pearson’s r coefficients of .7 to .9 may be considered to be high correlations and
values of 0.4 to .6 are considered to be moderate correlation values (Steel &
Torrie, 1960, p. 187). Pearson’s r coefficients of 0.4 to 1.0 were examined in this
study and represent moderate to high levels of correlation.
Resulting correlations, or Pearson’s r, are considered "statistically
significant" if the correlation is unlikely to have occurred by chance. Tests of
statistical significance refer to the likelihood that the variables are significantly
related. Or, that a null hypothesis that two variables are not correlated can be
rejected with a certain level of confidence. The lower the level of significance the
higher the confidence that the null hypothesis can be rejected. Popular levels of
significance are 10% (0.1), 5% (0.05), 1% (0.01), 0.5% (0.005), and 0.1% (0.001)
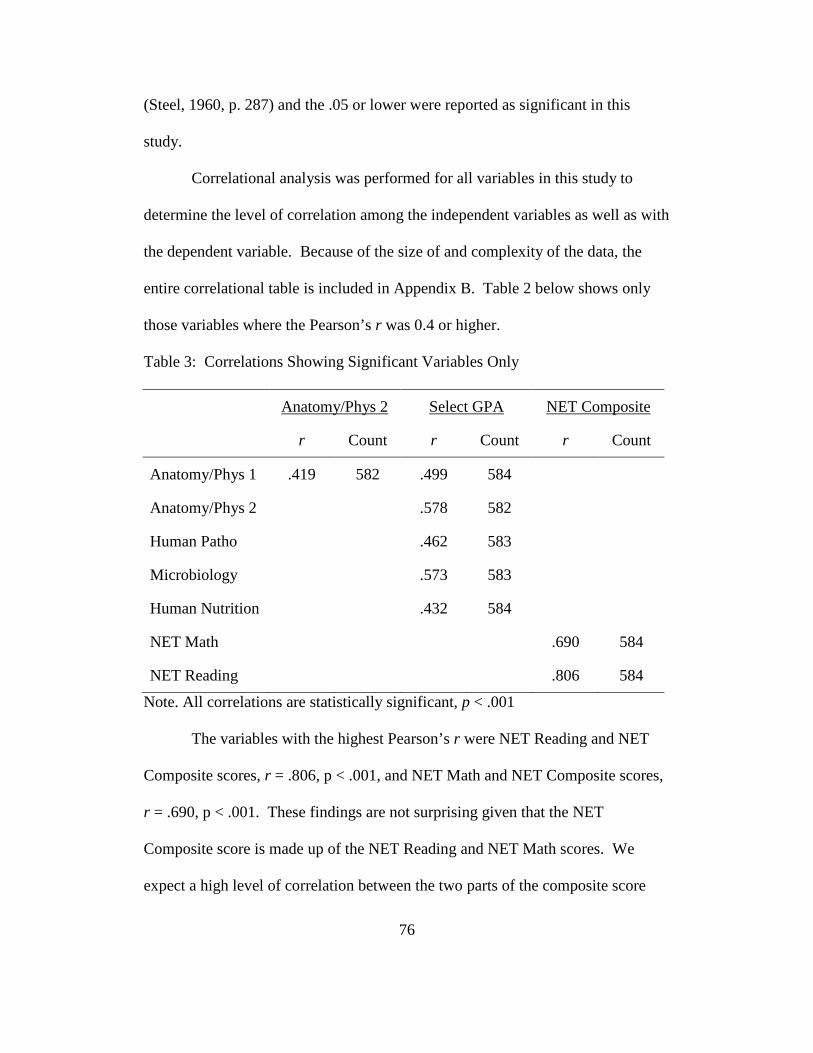
76
(Steel, 1960, p. 287) and the .05 or lower were reported as significant in this
study.
Correlational analysis was performed for all variables in this study to
determine the level of correlation among the independent variables as well as with
the dependent variable. Because of the size of and complexity of the data, the
entire correlational table is included in Appendix B. Table 2 below shows only
those variables where the Pearson’s r was 0.4 or higher.
Table 3: Correlations Showing Significant Variables Only
Anatomy/Phys 2 Select GPA NET Composite
r Count r Count r Count
Anatomy/Phys 1 .419 582 .499 584
Anatomy/Phys 2
.578 582
Human Patho
.462 583
Microbiology
.573 583
Human Nutrition
.432 584
NET Math
.690 584
NET Reading
.806 584
Note. All correlations are statistically significant, p < .001
The variables with the highest Pearson’s r were NET Reading and NET
Composite scores, r = .806, p < .001, and NET Math and NET Composite scores,
r = .690, p < .001. These findings are not surprising given that the NET
Composite score is made up of the NET Reading and NET Math scores. We
expect a high level of correlation between the two parts of the composite score
77
and the composite score itself. The Pearson’s r coefficients indicate that either
the NET Reading and NET Math should be used in the regression analysis, or the
NET Composite score, but not both. Therefore, the NET composite will not be
used in further analysis.
Because the Select GPA is comprised of Composition 1, Composition 2,
and three lab science courses from Anatomy and Physiology 1 and 2, Chemistry,
and Microbiology, we expect a high correlation between these variables and the
Select GPA. In fact there were no moderate to high correlations between the
Composition courses and the Select GPA nor Chemistry and the Select GPA. The
data indicate, though, that Anatomy and Physiology 1, Anatomy and Physiology 2
and Microbiology were moderately correlated with select GPA as follows:
Anatomy and Physiology 2, r = .594 at p < .001, Microbiology with a Pearson’s r
= .584, p < .001, and Anatomy and Physiology 1 with a Pearson’s r = .510, <
.001. This indicates that the grades earned in these three courses are correlated
with the Select GPA. Again, this finding is not surprising given that three lab
science courses must be included in the Select GPA. Because some of the course
grades are moderately correlated with the Select GPA, either the individual course
grades should be used in regression analysis or only the Select GPA but not both.
Therefore, the Select GPA will not be used in subsequent analysis. All other
variables had Pearson’s r correlation coefficients of less than 0.4 and were,
therefore, not highly correlated. Some correlations were statistically significant
and others were not.
78
Multicolinearity can pose a problem in regression analysis so the absence
of this finding does not detract from the research. This analysis indicates that
there is a high level of correlation among a few of the variables and so two
variables were eliminated, Select GPA and NET Composite Score. Low
multicolinearity allows for predictive testing such as logistic regression analysis
which will be described later in this chapter.
Frequencies and Descriptive Statistics
The next step in analyzing the data was to run frequencies and descriptive
statistics for each variable. The results are found in the tables and figures below.
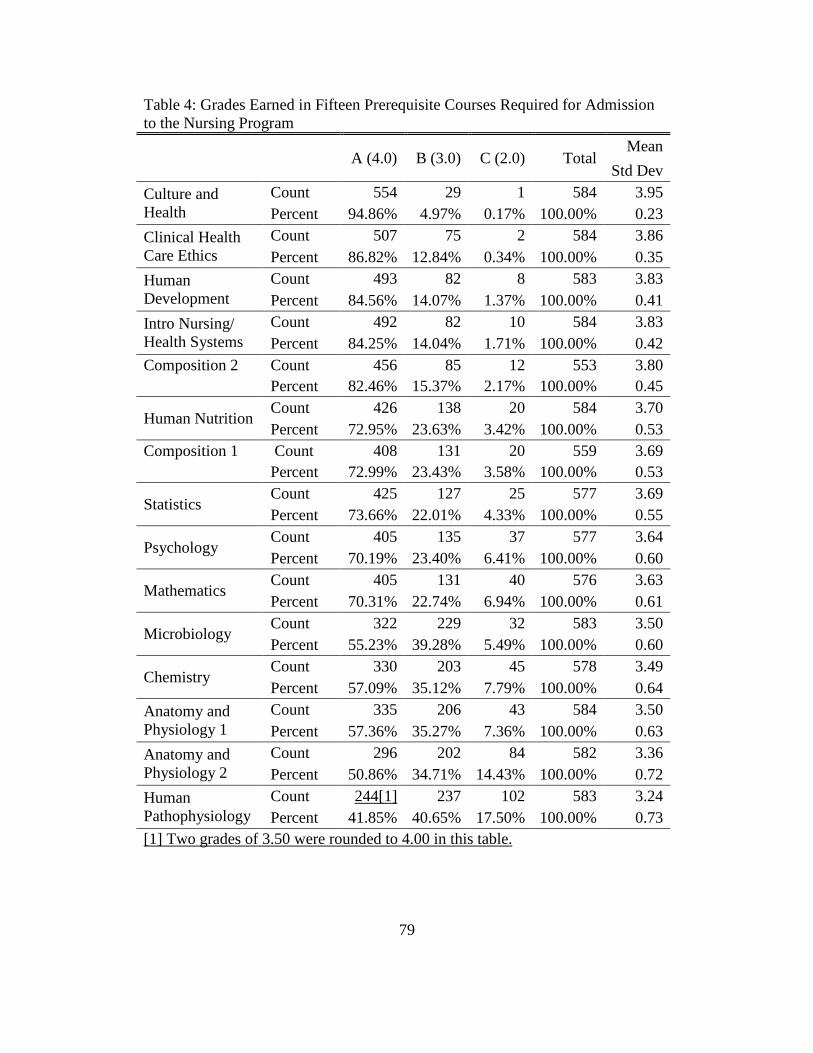
79
Table 4: Grades Earned in Fifteen Prerequisite Courses Required for Admission to the Nursing Program
A (4.0) B (3.0) C (2.0) Total Mean
Std Dev
Culture and Health
Count 554 29 1 584 3.95 Percent 94.86% 4.97% 0.17% 100.00% 0.23
Clinical Health Care Ethics
Count 507 75 2 584 3.86 Percent 86.82% 12.84% 0.34% 100.00% 0.35
Human Development
Count 493 82 8 583 3.83 Percent 84.56% 14.07% 1.37% 100.00% 0.41
Intro Nursing/ Health Systems
Count 492 82 10 584 3.83 Percent 84.25% 14.04% 1.71% 100.00% 0.42
Composition 2 Count 456 85 12 553 3.80 Percent 82.46% 15.37% 2.17% 100.00% 0.45
Human Nutrition Count 426 138 20 584 3.70 Percent 72.95% 23.63% 3.42% 100.00% 0.53
Composition 1 Count 408 131 20 559 3.69 Percent 72.99% 23.43% 3.58% 100.00% 0.53
Statistics Count 425 127 25 577 3.69 Percent 73.66% 22.01% 4.33% 100.00% 0.55
Psychology Count 405 135 37 577 3.64 Percent 70.19% 23.40% 6.41% 100.00% 0.60
Mathematics Count 405 131 40 576 3.63 Percent 70.31% 22.74% 6.94% 100.00% 0.61
Microbiology Count 322 229 32 583 3.50 Percent 55.23% 39.28% 5.49% 100.00% 0.60
Chemistry Count 330 203 45 578 3.49 Percent 57.09% 35.12% 7.79% 100.00% 0.64
Anatomy and Physiology 1
Count 335 206 43 584 3.50 Percent 57.36% 35.27% 7.36% 100.00% 0.63
Anatomy and Physiology 2
Count 296 202 84 582 3.36 Percent 50.86% 34.71% 14.43% 100.00% 0.72
Human Pathophysiology
Count 244[1] 237 102 583 3.24 Percent 41.85% 40.65% 17.50% 100.00% 0.73
[1] Two grades of 3.50 were rounded to 4.00 in this table.
80
The frequencies for the other variables in the study—Select GPA, Number
of Replacement Courses Taken, NET Math scores, NET Reading scores, NET
Composite scores, Number of Courses Taken at Four-Year Colleges,
Race/Ethnicity, and Gender—are depicted in the tables and figures below.
Descriptive Statistics. Number of Replacement Courses Taken. Figure 2
below shows that the vast majority of students, more than 400 of 584, did not take
any replacement course. About 100 students took one replacement course.
Fewer than 50 took two replacement courses and very few took three replacement
courses.
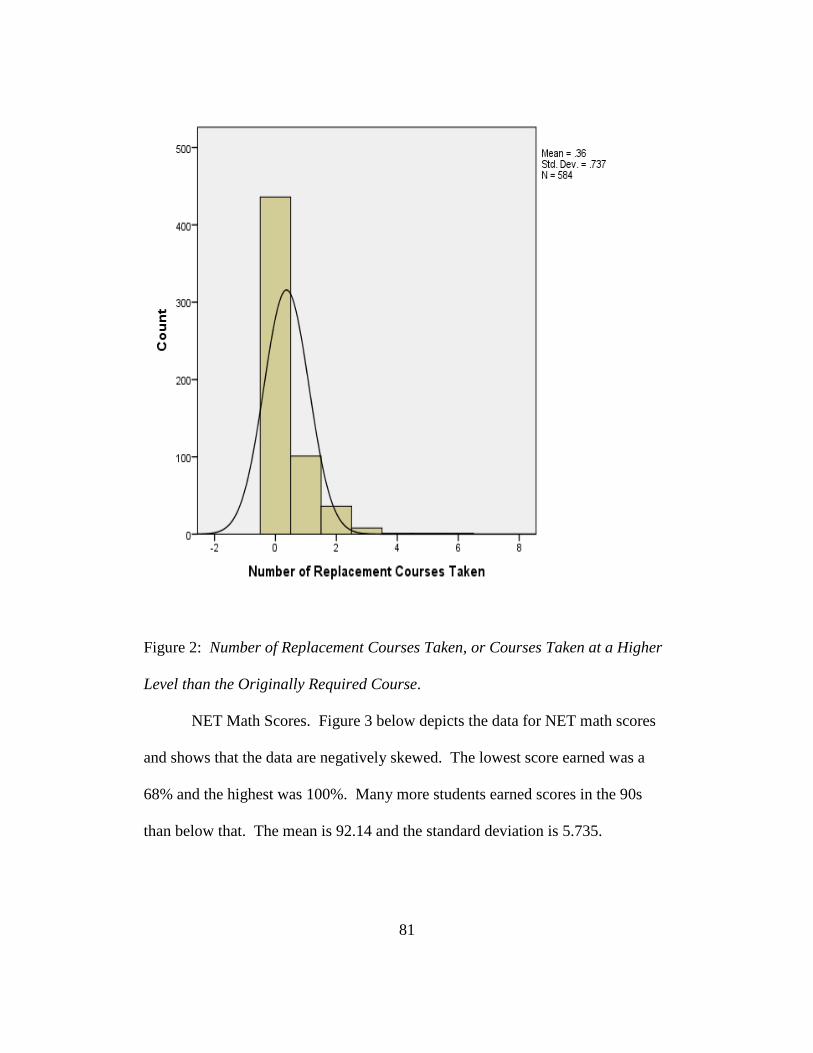
81
Figure 2: Number of Replacement Courses Taken, or Courses Taken at a Higher
Level than the Originally Required Course.
NET Math Scores. Figure 3 below depicts the data for NET math scores
and shows that the data are negatively skewed. The lowest score earned was a
68% and the highest was 100%. Many more students earned scores in the 90s
than below that. The mean is 92.14 and the standard deviation is 5.735.
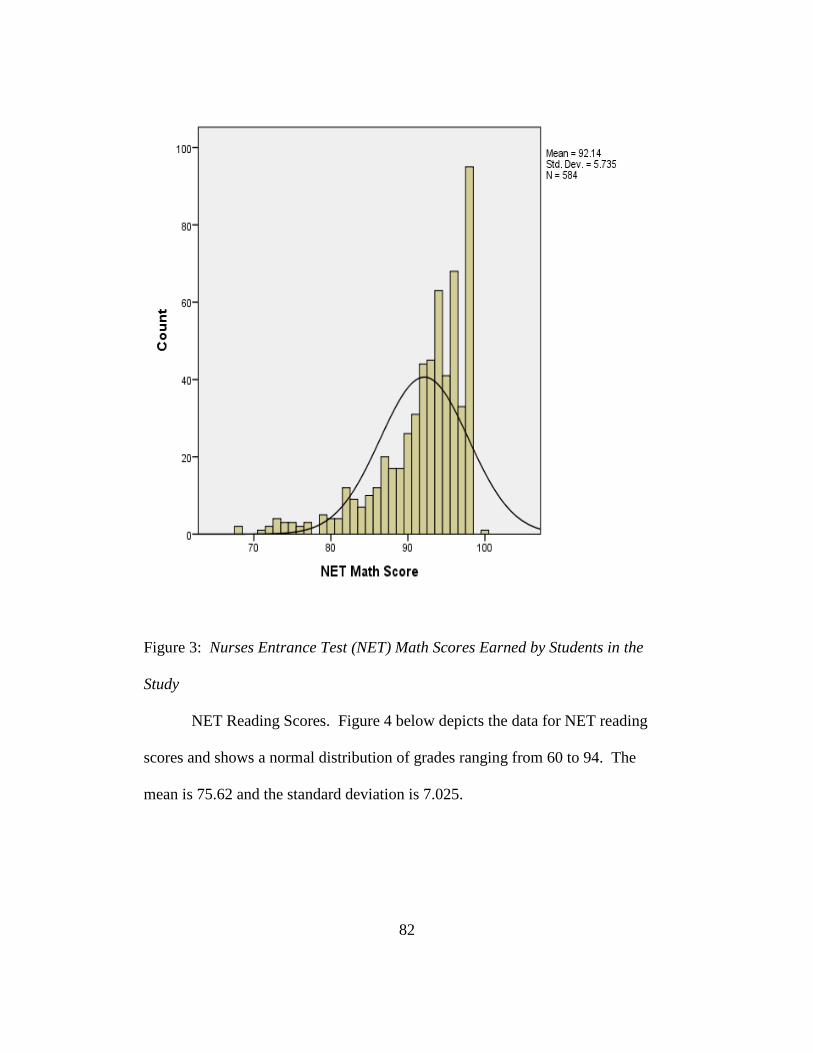
82
Figure 3: Nurses Entrance Test (NET) Math Scores Earned by Students in the
Study
NET Reading Scores. Figure 4 below depicts the data for NET reading
scores and shows a normal distribution of grades ranging from 60 to 94. The
mean is 75.62 and the standard deviation is 7.025.
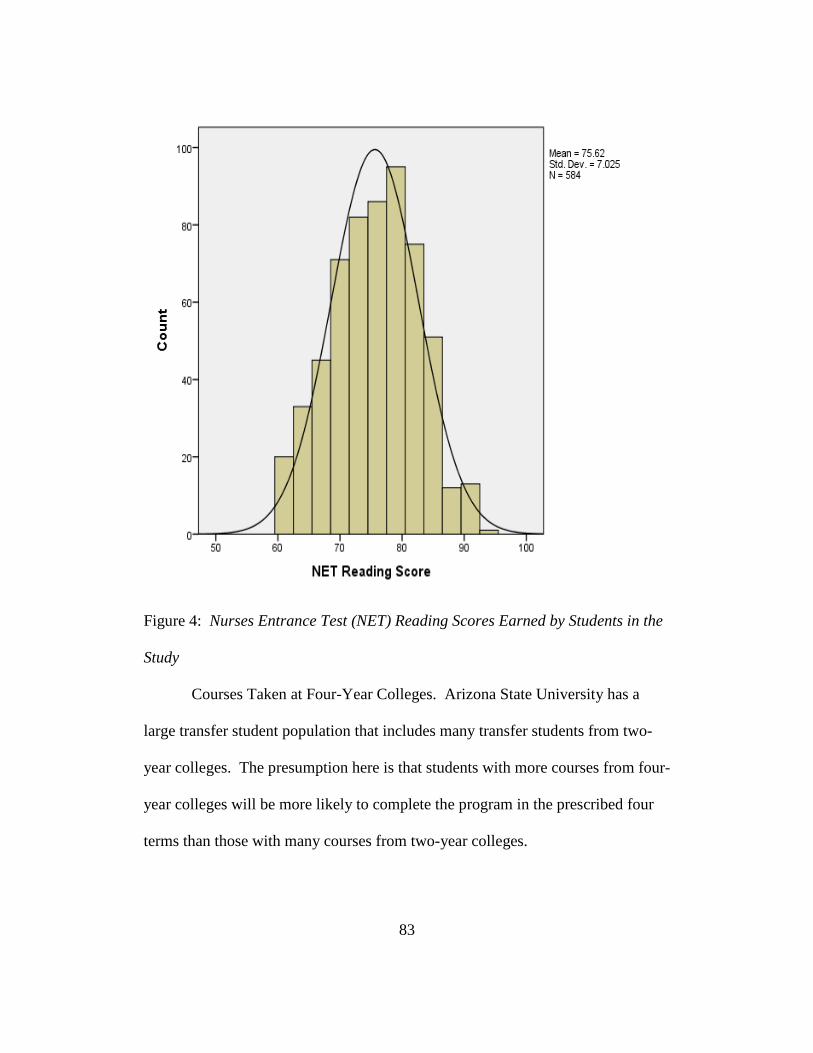
83
Figure 4: Nurses Entrance Test (NET) Reading Scores Earned by Students in the
Study
Courses Taken at Four-Year Colleges. Arizona State University has a
large transfer student population that includes many transfer students from two-
year colleges. The presumption here is that students with more courses from four-
year colleges will be more likely to complete the program in the prescribed four
terms than those with many courses from two-year colleges.
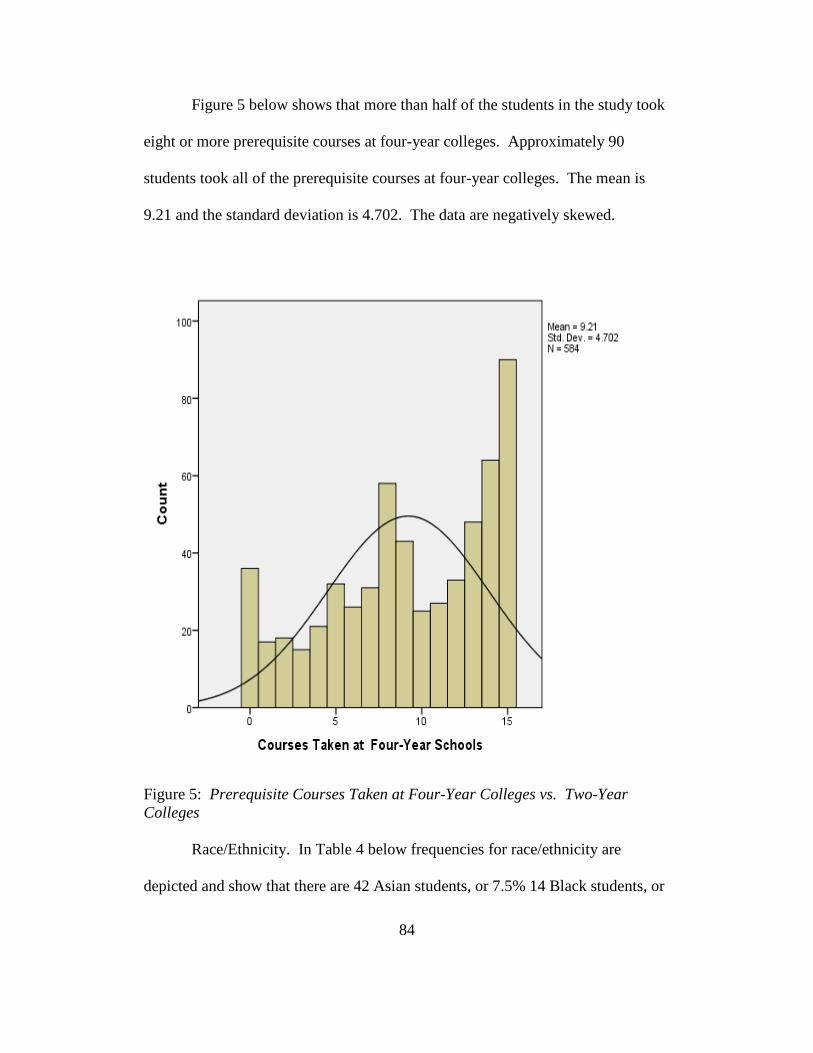
84
Figure 5 below shows that more than half of the students in the study took
eight or more prerequisite courses at four-year colleges. Approximately 90
students took all of the prerequisite courses at four-year colleges. The mean is
9.21 and the standard deviation is 4.702. The data are negatively skewed.
Figure 5: Prerequisite Courses Taken at Four-Year Colleges vs. Two-Year Colleges Race/Ethnicity. In Table 4 below frequencies for race/ethnicity are
depicted and show that there are 42 Asian students, or 7.5% 14 Black students, or

85
2.5%; 61 Hispanic students, or 10.9%; 10 Native American students, or 1.8%;
and, 432 White students, or 77.3%. This means that there are 22.7% non-White
students in the study.
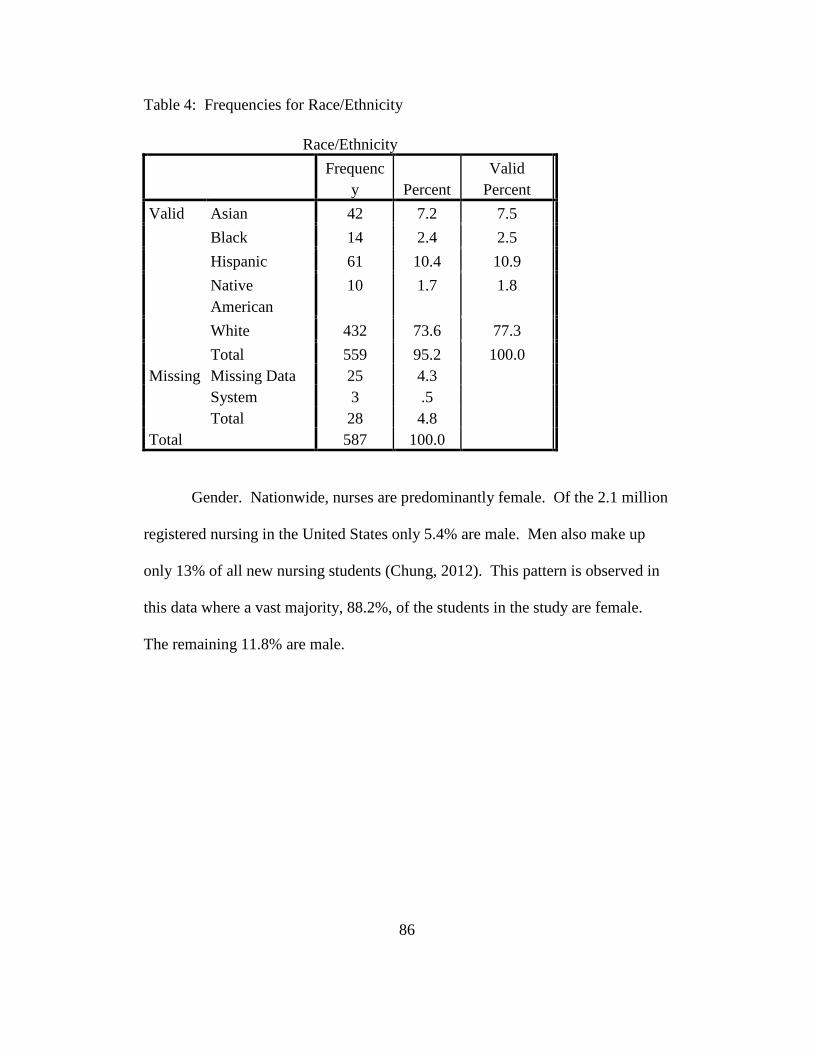
86
Table 4: Frequencies for Race/Ethnicity
Race/Ethnicity
Frequenc
y Percent Valid
Percent
Valid Asian 42 7.2 7.5
Black 14 2.4 2.5
Hispanic 61 10.4 10.9
Native American
10 1.7 1.8
White 432 73.6 77.3
Total 559 95.2 100.0
Missing Missing Data 25 4.3
System 3 .5
Total 28 4.8
Total 587 100.0
Gender. Nationwide, nurses are predominantly female. Of the 2.1 million
registered nursing in the United States only 5.4% are male. Men also make up
only 13% of all new nursing students (Chung, 2012). This pattern is observed in
this data where a vast majority, 88.2%, of the students in the study are female.
The remaining 11.8% are male.
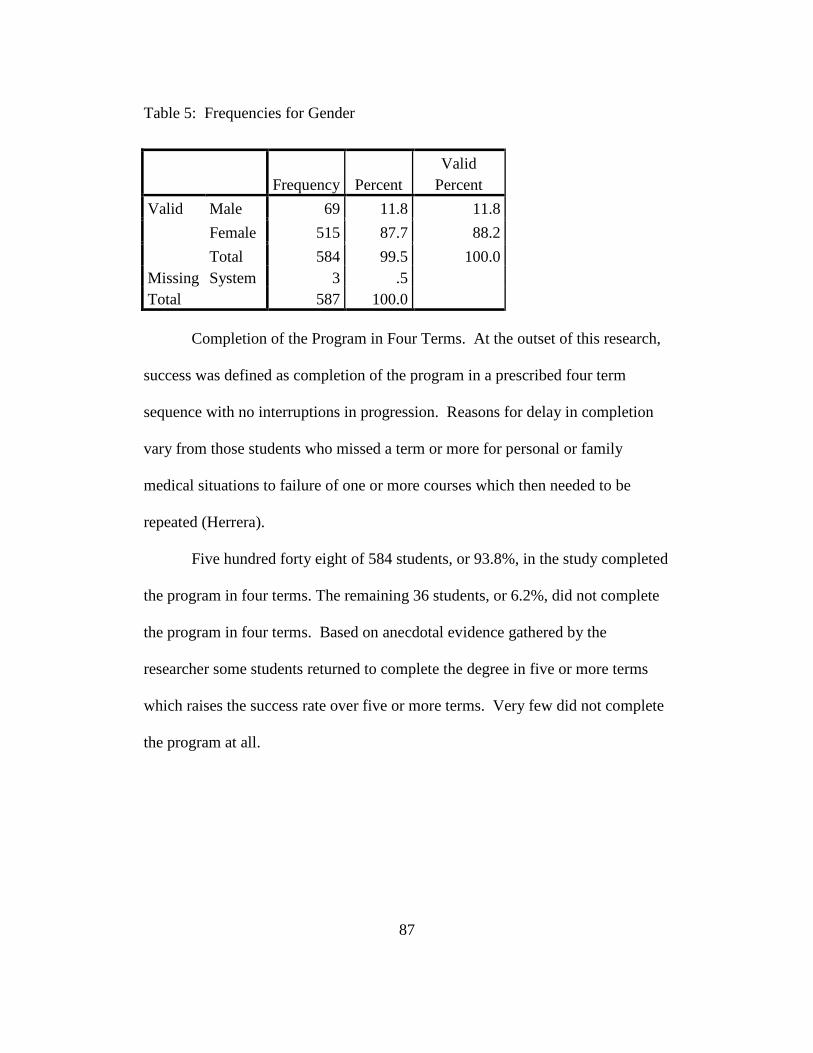
87
Table 5: Frequencies for Gender
Frequency Percent
Valid Percent
Valid Male 69 11.8 11.8
Female 515 87.7 88.2
Total 584 99.5 100.0 Missing System 3 .5
Total 587 100.0
Completion of the Program in Four Terms. At the outset of this research,
success was defined as completion of the program in a prescribed four term
sequence with no interruptions in progression. Reasons for delay in completion
vary from those students who missed a term or more for personal or family
medical situations to failure of one or more courses which then needed to be
repeated (Herrera).
Five hundred forty eight of 584 students, or 93.8%, in the study completed
the program in four terms. The remaining 36 students, or 6.2%, did not complete
the program in four terms. Based on anecdotal evidence gathered by the
researcher some students returned to complete the degree in five or more terms
which raises the success rate over five or more terms. Very few did not complete
the program at all.
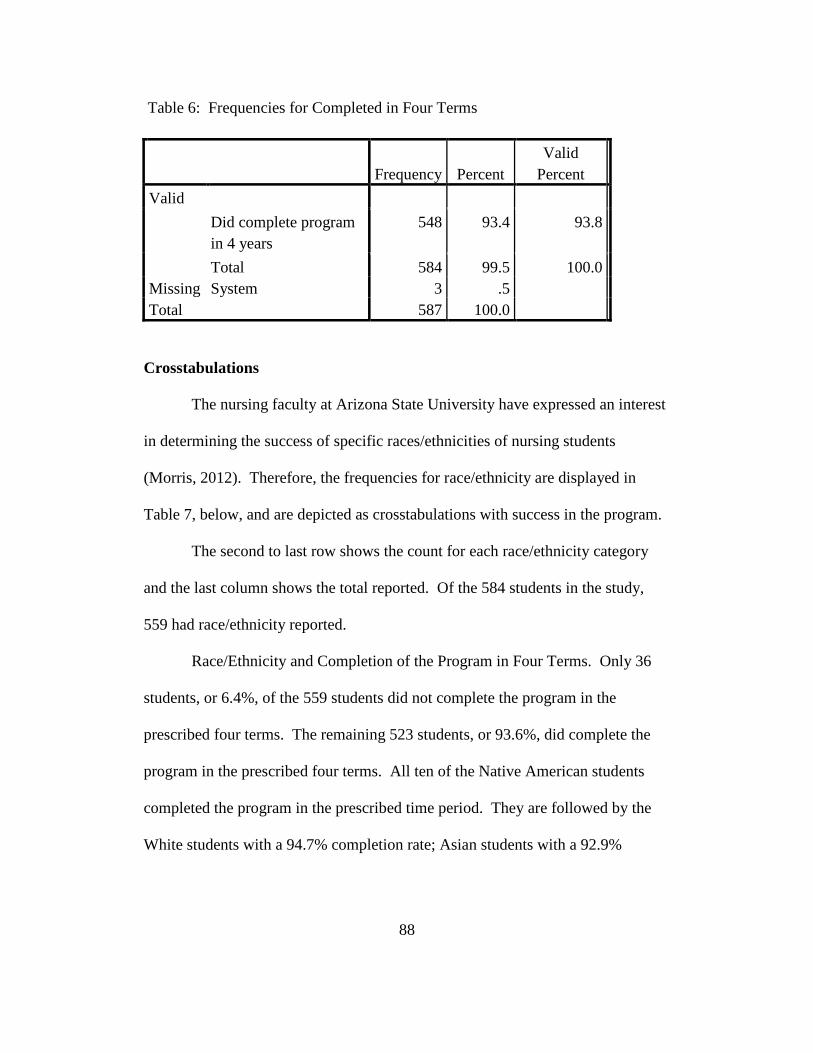
88
Table 6: Frequencies for Completed in Four Terms
Frequency Percent
Valid Percent
Valid
Did complete program in 4 years
548 93.4 93.8
Total 584 99.5 100.0
Missing System 3 .5
Total 587 100.0
Crosstabulations
The nursing faculty at Arizona State University have expressed an interest
in determining the success of specific races/ethnicities of nursing students
(Morris, 2012). Therefore, the frequencies for race/ethnicity are displayed in
Table 7, below, and are depicted as crosstabulations with success in the program.
The second to last row shows the count for each race/ethnicity category
and the last column shows the total reported. Of the 584 students in the study,
559 had race/ethnicity reported.
Race/Ethnicity and Completion of the Program in Four Terms. Only 36
students, or 6.4%, of the 559 students did not complete the program in the
prescribed four terms. The remaining 523 students, or 93.6%, did complete the
program in the prescribed four terms. All ten of the Native American students
completed the program in the prescribed time period. They are followed by the
White students with a 94.7% completion rate; Asian students with a 92.9%
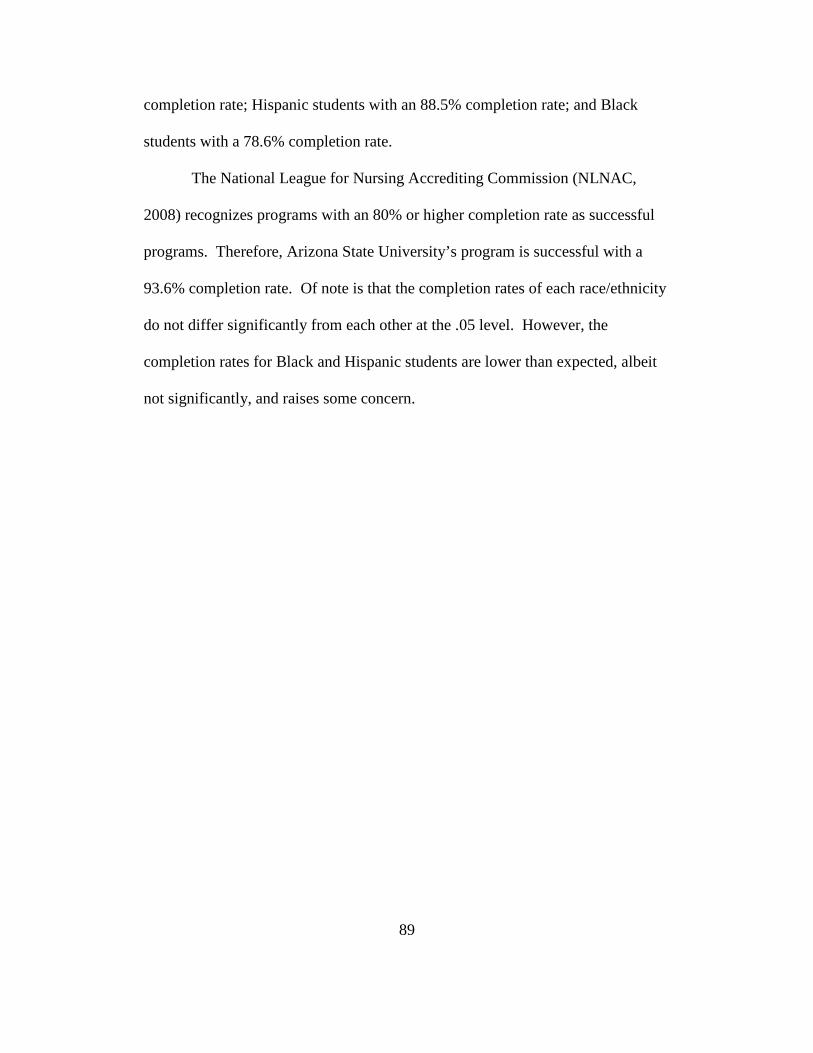
89
completion rate; Hispanic students with an 88.5% completion rate; and Black
students with a 78.6% completion rate.
The National League for Nursing Accrediting Commission (NLNAC,
2008) recognizes programs with an 80% or higher completion rate as successful
programs. Therefore, Arizona State University’s program is successful with a
93.6% completion rate. Of note is that the completion rates of each race/ethnicity
do not differ significantly from each other at the .05 level. However, the
completion rates for Black and Hispanic students are lower than expected, albeit
not significantly, and raises some concern.
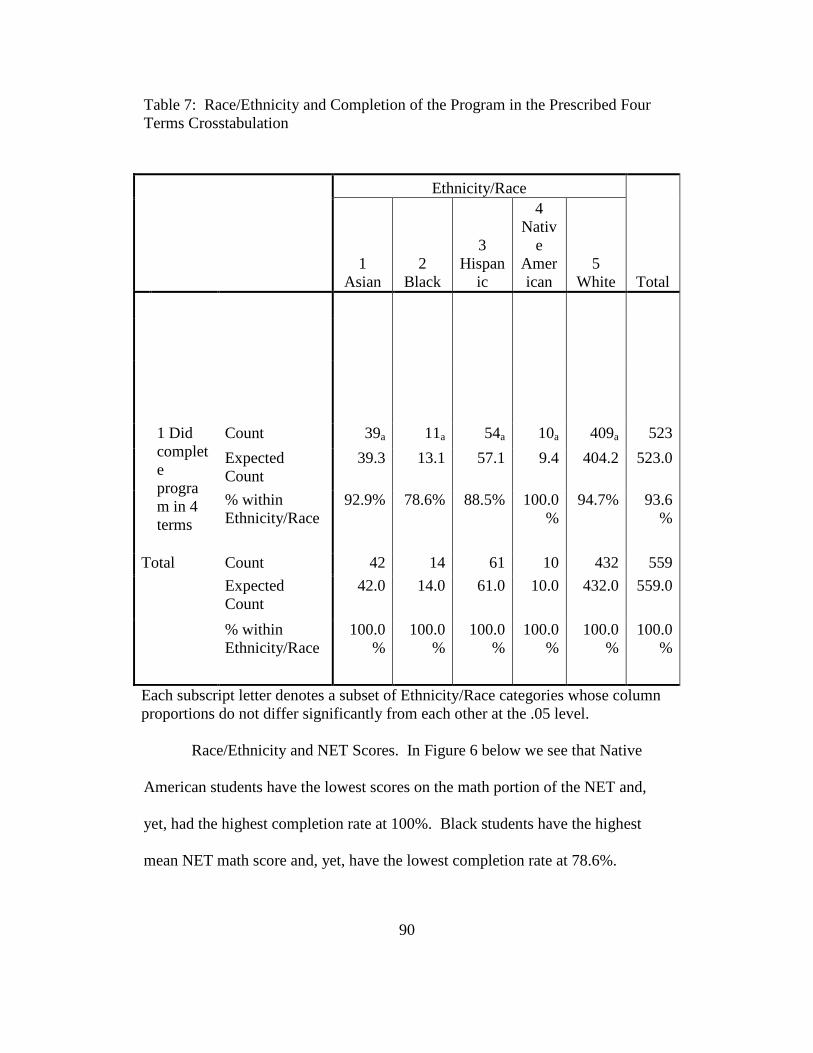
90
Table 7: Race/Ethnicity and Completion of the Program in the Prescribed Four Terms Crosstabulation
Race/Ethnicity and NET Scores. In Figure 6 below we see that Native
American students have the lowest scores on the math portion of the NET and,
yet, had the highest completion rate at 100%. Black students have the highest
mean NET math score and, yet, have the lowest completion rate at 78.6%.
Ethnicity/Race
Total 1
Asian 2
Black
3 Hispan
ic
4 Nativ
e American
5 White
1 Did complete program in 4 terms
Count 39a 11a 54a 10a 409a 523
Expected Count
39.3 13.1 57.1 9.4 404.2 523.0
% within Ethnicity/Race
92.9% 78.6% 88.5% 100.0%
94.7% 93.6%
Total Count 42 14 61 10 432 559
Expected Count
42.0 14.0 61.0 10.0 432.0 559.0
% within Ethnicity/Race
100.0%
100.0%
100.0%
100.0%
100.0%
100.0%
Each subscript letter denotes a subset of Ethnicity/Race categories whose column proportions do not differ significantly from each other at the .05 level.
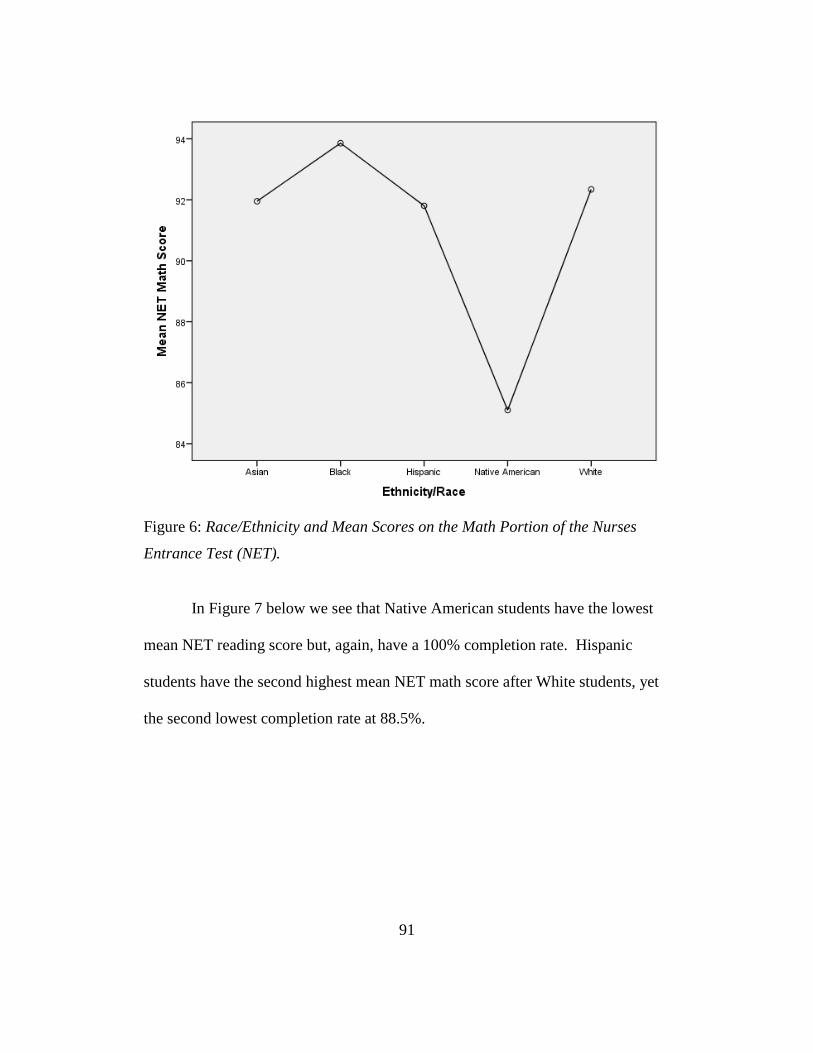
91
Figure 6: Race/Ethnicity and Mean Scores on the Math Portion of the Nurses
Entrance Test (NET).
In Figure 7 below we see that Native American students have the lowest
mean NET reading score but, again, have a 100% completion rate. Hispanic
students have the second highest mean NET math score after White students, yet
the second lowest completion rate at 88.5%.
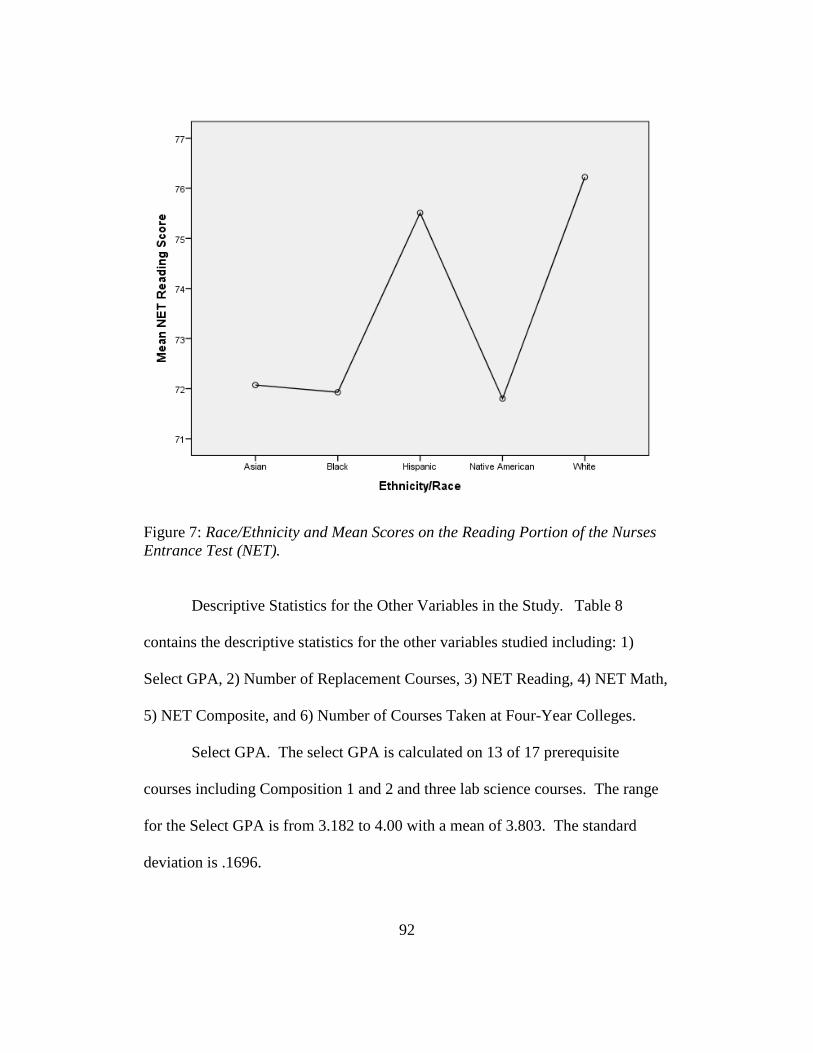
92
Figure 7: Race/Ethnicity and Mean Scores on the Reading Portion of the Nurses Entrance Test (NET).
Descriptive Statistics for the Other Variables in the Study. Table 8
contains the descriptive statistics for the other variables studied including: 1)
Select GPA, 2) Number of Replacement Courses, 3) NET Reading, 4) NET Math,
5) NET Composite, and 6) Number of Courses Taken at Four-Year Colleges.
Select GPA. The select GPA is calculated on 13 of 17 prerequisite
courses including Composition 1 and 2 and three lab science courses. The range
for the Select GPA is from 3.182 to 4.00 with a mean of 3.803. The standard
deviation is .1696.
93
Number of Replacement Courses. The variable Number of Replacement
Courses has a range of 0 to 6 with a mean of .36 and a standard deviation of .737.
This indicates that most students did not take replacement courses or, if they did
take them, they usually took only one replacement course. Of the 584 students in
the study 439 took no (0) replacement courses, 98 took one replacement course,
38 took two replacement courses, and eight took three replacement courses.
NET Reading. The variable NET Reading has a minimum value of 60 and
a maximum value of 98. The mean is 75.62 and the standard deviation is 7.025.
NET Math. The variable NET Math has a minimum value of 68 and a
maximum value of 100. The mean is 92.14 and the standard deviation is 5.735.
Number of Courses Taken at Four-Year Colleges. The variable Number
of Courses Taken at Four-Year Schools indicates how many of the 15 courses in
this study were taken at four-year colleges as opposed to two-year colleges. The
range is 0 to 15 with a mean of 9.21 and a standard deviation of 4.702. This
means that 57.7% of all courses taken were taken at four-year schools rather than
at two-year schools and 95% of students took between four and ten courses at
four-year schools.
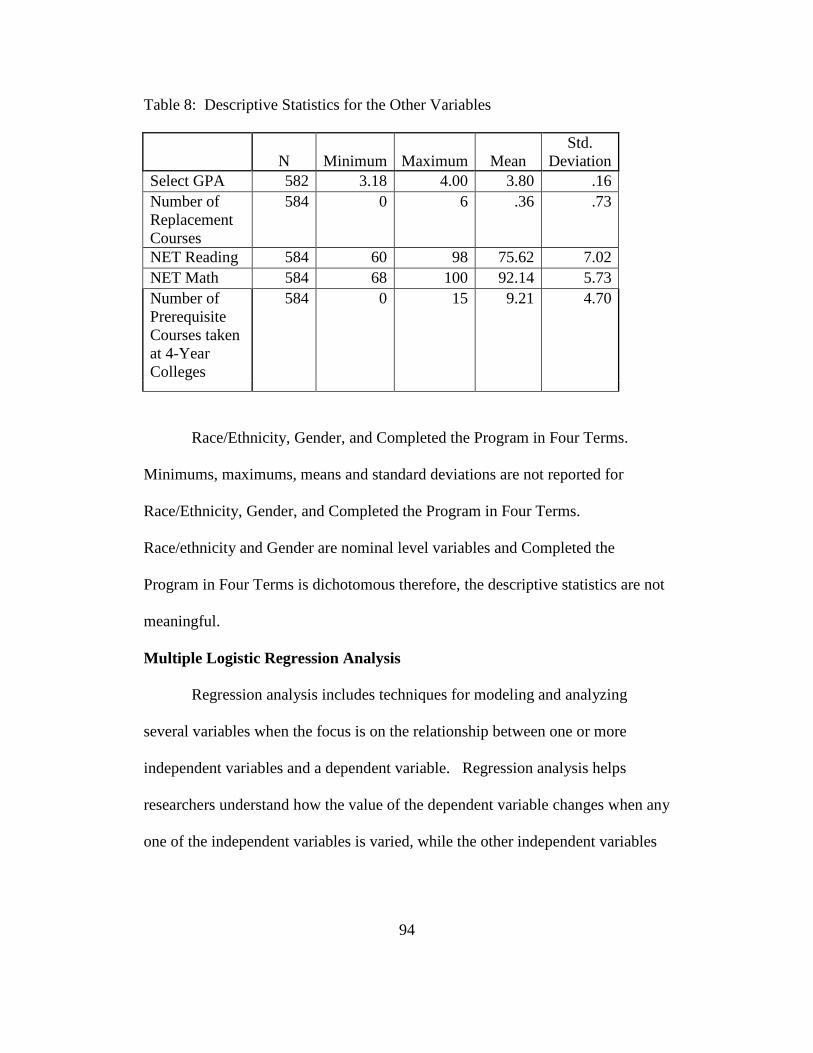
94
Table 8: Descriptive Statistics for the Other Variables
N Minimum Maximum Mean Std.
Deviation Select GPA 582 3.18 4.00 3.80 .16 Number of Replacement Courses
584 0 6 .36 .73
NET Reading 584 60 98 75.62 7.02 NET Math 584 68 100 92.14 5.73 Number of Prerequisite Courses taken at 4-Year Colleges
584 0 15 9.21 4.70
Race/Ethnicity, Gender, and Completed the Program in Four Terms.
Minimums, maximums, means and standard deviations are not reported for
Race/Ethnicity, Gender, and Completed the Program in Four Terms.
Race/ethnicity and Gender are nominal level variables and Completed the
Program in Four Terms is dichotomous therefore, the descriptive statistics are not
meaningful.
Multiple Logistic Regression Analysis
Regression analysis includes techniques for modeling and analyzing
several variables when the focus is on the relationship between one or more
independent variables and a dependent variable. Regression analysis helps
researchers understand how the value of the dependent variable changes when any
one of the independent variables is varied, while the other independent variables
95
are held fixed. The estimation target is a function of the independent variables
called the regression function and is referred to as R2 (Steel, 1960, p. 287).
The coefficient of determination R2 is used in the context of statistical
models whose main purpose is the prediction of future outcomes on the basis of
other related information. It is the proportion of variability in a data set that is
accounted for by the statistical model (Steel, 1960, p. 187). It provides a measure
of how well future outcomes are likely to be predicted by the model.
In linear regression, R2 is the square of the sample correlation coefficient
between the outcomes and their predicted values, or in the case of simple linear
regression, between the outcomes and the values of the single regressor being
used for prediction. In such cases, the coefficient of determination, R2, ranges
from 0 to 1. R2 is a statistic that will give some information about the “goodness
of fit” of a model. In regression, the R2 coefficient of determination is a statistical
measure of how well the regression line approximates the real data points. An R2
of 1.0 indicates that the regression line perfectly fits the data.
Chi-squared coefficients are also reported with regression analysis. A chi-
squared test, also referred to as X2, is any statistical hypothesis test in which the
sampling distribution of the test statistic is a chi-squared distribution when the
null hypothesis is true, or any in which this is asymptotically true, meaning that
the sampling distribution (if the null hypothesis is true) can be made to
approximate a X2distribution as closely as desired by making the sample size large
enough (Greenwood & Nikulin, 1996).
96
Because regression analysis allows researchers to test specific hypotheses
about the relationship between independent variables and a dependent variable,
the list of research questions is used here in place of hypotheses and appears
below.
Research Questions Tested
1. The grades earned in fifteen prerequisite courses will have a
significant positive predictive effect on completion of the program in
four terms. The higher the grade earned, the more likely the student
will complete the program in the prescribed four terms.
2. The number of replacement courses taken will have a significant
negative predictive effect on completion of the program in four terms.
The more replacement courses taken the less likely the student will be
to complete the program in the prescribed four terms.
3. The number of courses taken at four-year institutions, rather than at
two-year institutions, will have a significant positive predictive effect
on completion of the program in four terms. The more courses taken
at four-year colleges the more likely the student will be to complete
the program in the prescribed four terms.
4. NET scores will have a significant positive predictive effect on
completion of the program in four terms. The higher the NET scores
the more likely the student will complete the program in the prescribed
four terms.
97
5. The race/ethnicity of students will have a significant predictive effect
on completion of the program in four terms. White and Asian students
will complete the program in four terms at a higher rate than Blacks,
Hispanics, and Native Americans.
6. Gender is associated with completion of the program in four terms.
Female students will complete the program in four terms at a higher
rate than male students. This prediction is based on a belief that the
smaller critical mass of male students will detract from successfully
completing the program in the prescribed four terms.
In Table 9 below the results of the multiple logistic regression analysis
are displayed.
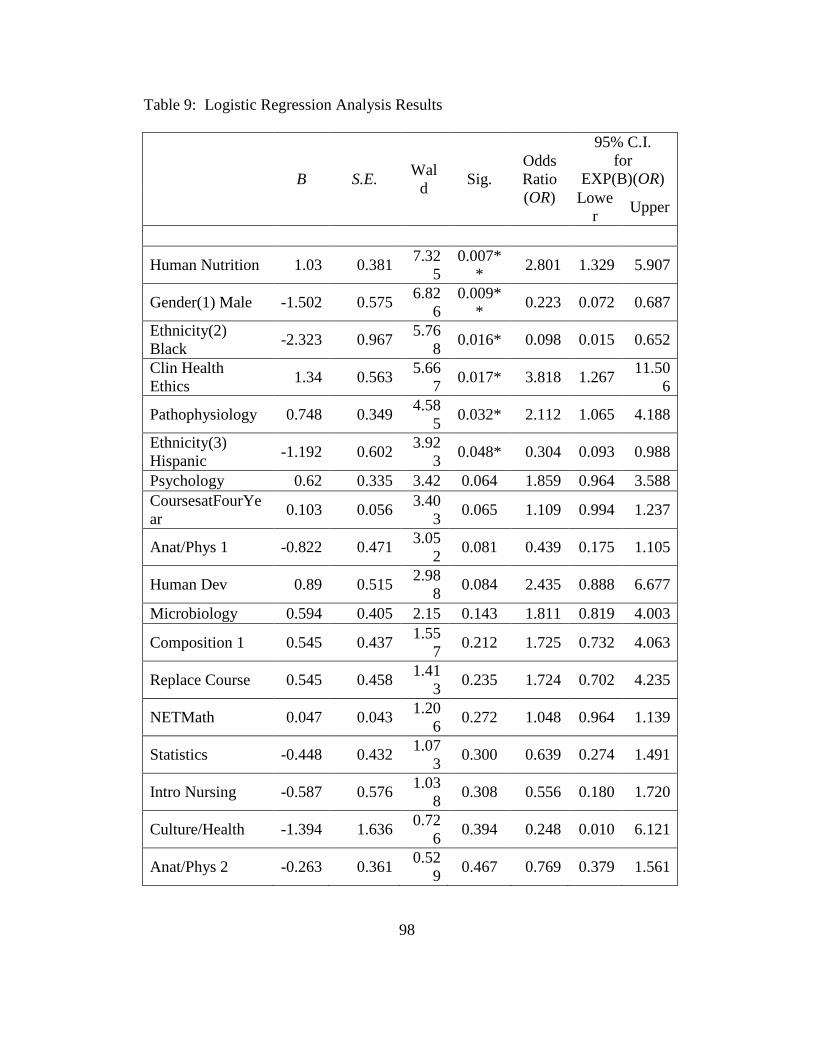
98
Table 9: Logistic Regression Analysis Results
B S.E. Wal
d Sig.
Odds Ratio (OR)
95% C.I. for
EXP(B)(OR) Lowe
r Upper
Human Nutrition 1.03 0.381 7.32
5 0.007*
* 2.801 1.329 5.907
Gender(1) Male -1.502 0.575 6.82
6 0.009*
* 0.223 0.072 0.687
Ethnicity(2) Black
-2.323 0.967 5.76
8 0.016* 0.098 0.015 0.652
Clin Health Ethics
1.34 0.563 5.66
7 0.017* 3.818 1.267
11.506
Pathophysiology 0.748 0.349 4.58
5 0.032* 2.112 1.065 4.188
Ethnicity(3) Hispanic
-1.192 0.602 3.92
3 0.048* 0.304 0.093 0.988
Psychology 0.62 0.335 3.42 0.064 1.859 0.964 3.588 CoursesatFourYear
0.103 0.056 3.40
3 0.065 1.109 0.994 1.237
Anat/Phys 1 -0.822 0.471 3.05
2 0.081 0.439 0.175 1.105
Human Dev 0.89 0.515 2.98
8 0.084 2.435 0.888 6.677
Microbiology 0.594 0.405 2.15 0.143 1.811 0.819 4.003
Composition 1 0.545 0.437 1.55
7 0.212 1.725 0.732 4.063
Replace Course 0.545 0.458 1.41
3 0.235 1.724 0.702 4.235
NETMath 0.047 0.043 1.20
6 0.272 1.048 0.964 1.139
Statistics -0.448 0.432 1.07
3 0.300 0.639 0.274 1.491
Intro Nursing -0.587 0.576 1.03
8 0.308 0.556 0.180 1.720
Culture/Health -1.394 1.636 0.72
6 0.394 0.248 0.010 6.121
Anat/Phys 2 -0.263 0.361 0.52
9 0.467 0.769 0.379 1.561
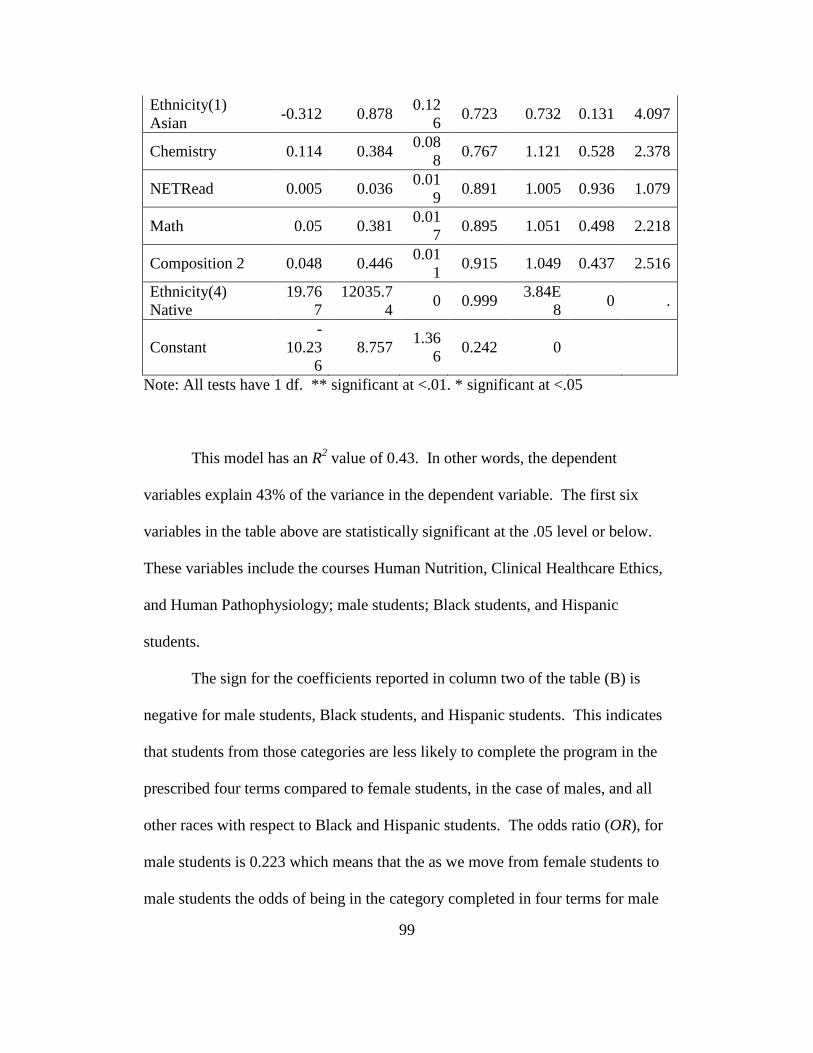
99
Ethnicity(1) Asian
-0.312 0.878 0.12
6 0.723 0.732 0.131 4.097
Chemistry 0.114 0.384 0.08
8 0.767 1.121 0.528 2.378
NETRead 0.005 0.036 0.01
9 0.891 1.005 0.936 1.079
Math 0.05 0.381 0.01
7 0.895 1.051 0.498 2.218
Composition 2 0.048 0.446 0.01
1 0.915 1.049 0.437 2.516
Ethnicity(4) Native
19.767
12035.74
0 0.999 3.84E
8 0 .
Constant -
10.236
8.757 1.36
6 0.242 0
Note: All tests have 1 df. ** significant at <.01. * significant at <.05
This model has an R2 value of 0.43. In other words, the dependent
variables explain 43% of the variance in the dependent variable. The first six
variables in the table above are statistically significant at the .05 level or below.
These variables include the courses Human Nutrition, Clinical Healthcare Ethics,
and Human Pathophysiology; male students; Black students, and Hispanic
students.
The sign for the coefficients reported in column two of the table (B) is
negative for male students, Black students, and Hispanic students. This indicates
that students from those categories are less likely to complete the program in the
prescribed four terms compared to female students, in the case of males, and all
other races with respect to Black and Hispanic students. The odds ratio (OR), for
male students is 0.223 which means that the as we move from female students to
male students the odds of being in the category completed in four terms for male
100
students is reduced by a rate of 0.223. In other words, males students are .223
times less likely to complete the program in four terms.
The odds ratio for Black students is 0.098. This means that if we compare
Black students to all other races of students, Black students are 0.098 times less
likely to complete the program in four terms.
The odds ratio for Hispanic students is 0.304. This means that if we
compare Hispanic students to all other races of students, Hispanic students are
0.304 times less likely to complete the program in four terms.
For Human Nutrition, Clinical Healthcare Ethics, and Human
Pathophysiology the B values in column two are positive. This indicates that as
the grades earned in the courses moves up one level, from a “C “to a “B” or a “B”
to an “A”, that the likelihood of being in the category completed in four terms
increases. The odds ratio for Human Nutrition is 2.801. So, as the student grades
moves up one level, the students are 2.801 times more likely to complete the
program in four terms.
The odds ratio for Clinical Healthcare Ethics is 3.818. That means that as
the student grades move up one level they are 3.818 times more likely to complete
the program in four terms.
The odds ratio for Human Pathophysiology is 2.112. That means that as
the student grades move up one level they are 2.112 times more likely to complete
the program in four terms.
101
The other variables in the logistic regression analysis were not statistically
significant at the .05 level or below
Male, Black and Hispanic students are less likely to complete the program
in four terms than their counterparts. The higher the grades earned in Human
Nutrition, Clinical Healthcare Ethics, and Human Pathophysiology the higher the
rate of completion of the program in four terms.
Summary
Correlational analysis exhibited moderate to high correlations among the
NET Reading and NET Math Scores and the NET Composite Score. Therefore,
the NET Composite Score was eliminated from further analysis.
Some of the courses in the study taken separately and the Select GPA, a
composite of 17 prerequisite courses also exhibited moderate to high correlations.
Those courses were Anatomy and Physiology 1 and 2, and Microbiology.
Therefore, the Select GPA was eliminated from further analysis.
Because the Traditional Pre-licensure Clinical Nursing Program (TPCNP)
had many more applicants than spaces available, usually about 300 applicants for
80 to 100 spaces in 2007-08, the students that are advanced to the clinical
coursework have superior grades and entrance test scores (Morris, 2012; Herrera,
2012). The following frequencies and descriptive statistics demonstrate the
academic excellence of these students.
Courses. Frequencies and descriptive statistics computed for each of the
courses in the study showed that for all courses except Human Pathophysiology
102
more than half of the students received grades of “A” so they showed negative
skewness. The range of percent of “A” grades earned ranged from 50.86% for
Anatomy and Physiology 2 to 94.86% for Culture and Health. The percent of “A”
grades earned in Human Pathophysiology was 41.85%. The mean grades earned
in the 15 courses ranged from 3.95 for Culture and Health to 3.24 for Human
Pathophysiology.
Multiple logistic regression analysis showed that the only courses that
were statistically significantly related to the dependent variable, Completion of
the Program in Four Terms, were 1) Human Nutrition, 2) Clinical Health Care
Ethics, and 3)Human Pathophysiology. For each of these courses, the higher the
grade earned, the more likely the student would complete the program in four
terms.
Very few students took replacement courses. Four hundred of 584
students took no replacement courses. Another 100 students took only one
replacement course. This variable was positively skewed. The Replacement
Course variable was not significant in the regression analysis. Therefore, the
number of replacement courses taken did not affect the likelihood of completing
the program in four terms.
The NET Math scores ranged from 68 to 100 with a mean of 92.14 and a
standard deviation of 5.735. The NET Reading Scores ranged from 60 to 94, had
a mean of 75.62 and a standard deviation of 7.025.
103
Of the 584 students in the study 90 took all of the prerequisite courses at
four-year colleges. Fewer than forty students took all of their courses at two-year
institutions. More than half of the students took half of the prerequisites at four-
year colleges. The regression results showed that the number of replacement
courses taken at four-year colleges was not predictive of completion of the
program in four terms.
Race/ethnicity. The frequencies for race/ethnicity revealed that there were
77.3% White students and 23.7% non-White students broken down as 7.5% Asian
students, 2.5% Black students, 10.9% Hispanic students, and 1.8% Native
American students. Native American students had the lowest scores on the NET
Math and Reading yet the highest completion rate at 100%.
Gender. Most of the students in the study were female, 88.2% with 11.8%
male. Table 9 showed that female students completed the program at higher rates
the male students. This finding was statistically significant.
Completion of the Program in Four Terms. Only 36 students, or 6.2% did
not complete the program in four terms. The success rate was 93.8%. Success
rates varied by race/ethnicity, however. Native American students had a 100%
completion rate; White students had a 94.7% completion rate; Asian students had
a 92.9% completion rate; Hispanic students had an 88.5% completion rate; and
Black students had a 78.6% completion rate. The regression analysis showed that
race/ethnicity was a predictive variable where Hispanic and Black students
completed the program at lower rates. This was statistically significant.
104
Overall, the analyses show that the TPCNP at Arizona State University is
a successful program with a 93.8% completion rate. This exceeds the goal stated
by the National League for Nursing Accrediting Commission (NLNAC, 2008) of
an 80% completion rate. However, the analysis shows that the student’s race
plays a role in the likelihood of completing the program and that issue should be
addressed and will be discussed further in Chapter Five.
The analyses also show that three courses are best predictors of successful
completion of the program. This will also be discussed further in Chapter Five.
105
CHAPTER FIVE
SUMMARY, CONCLUSIONS, RECOMMENDATIONS, AND
IMPLICATIONS
Introduction
The United States is projected to have a nursing shortage which could
intensify as the population ages and the need for health care grows. Nursing
colleges and universities across the country are struggling to expand enrollment
levels to meet the rising demand for nursing care.
Because of the need to graduate increasing numbers of baccalaureate
prepared nurses in cost-intensive programs, baccalaureate nursing programs must
be able to accurately and efficiently identify students most likely to succeed in
these programs, graduate with a BSN and pass the National Council Licensure
Examination-Registered Nurse (NCLEX-RN).
Research indicates that there is a need for a parsimonious explanation of
BSN readiness and attrition to guide policy makers in nursing programs in
institutions of higher education to decrease the attrition rate and boost the BSN
graduation rate (Byrd, et al., 1999, p. 33). Thus, the important questions asked in
this research are: what is the pattern of selection, preparation, retention, and
graduation of nursing students in the College of Nursing and Health Innovation at
Arizona State University? What factors help to predict which students will be
most likely to complete the BSN in preparation for the NCLEX-RN and
106
subsequent practice as a Registered Nurse? What policy changes could be made
to assist those students who complete the program at lower rates?
Summary of the Study
This study examined the quantitative factors used to evaluate students
meeting eligibility requirements for placement in the pre-licensure clinical
nursing program in the College of Nursing and Health Innovation at Arizona State
University. Specifically, several independent variables were examined including:
grades earned in prerequisite courses; replacement course frequency and grades;
scores earned on the Nurse Entrance Test (NET); the number of prerequisite
courses, of the fifteen studied, taken at four-year institutions; race/ethnicity; and,
gender. The dependent variable is a dichotomous variable and is: completion of
the Traditional Pre-licensure Clinical Nursing Program in four terms with no
interruption in progression toward the BSN, such as failing a nursing course or
discontinuation of the degree program.
Because this research employed data from one large public university, the
results should be generalizable to other large public universities but perhaps not to
smaller private institutions.
Summary of the Findings and Conclusions
Almost 94% of the 584 students in the study completed the program in the
prescribed four terms. According to this metric, the Arizona State University
nursing program succeeds beyond the National League for Nursing Accrediting
Commission (NLNAC, 2008) expectation of an 80% completion rate. This result
107
also supports Tinto’s (1986, 2003) explanation of academic integration into the
institution and commitment to academic goals discussed in Chapter Two. By the
time the students are accepted into this program through a highly competitive
process, they have committed to studying nursing and are only four terms away
from earning the bachelor’s degree.
However, not all variables included in this research were predictive of
success in the program. This research allows readers to see which of the factors
better predict success than others and to contemplate policy changes, if needed.
In addition, the research disclosed uneven completion rates for some categories of
race/ethnicity and gender within the small subset of students that did not complete
the nursing program in four terms.
A summary of the results of the frequencies and descriptive statistics,
correlational analysis, and multiple logistic regression analysis will be discussed
in the context of the research questions tested.
Research Questions. We now return to the research questions tested in
this research.
1. The grades earned in fifteen prerequisite courses will have a
significant positive predictive effect on completion of the program
in four terms. The higher the grade earned, the more likely the
student will complete the program in the prescribed four terms.
108
This research question was only partially upheld. Only three of the fifteen
prerequisite courses predicted the successful completion of the program: 1)
Human Nutrition, 2) Clinical Healthcare Ethics, and 3) Human Pathophysiology.
Three of the four courses that had the highest mean GPA are courses that
are taught by the College of Nursing and Health Innovation: 1) Culture and
Health, 2) Clinical Healthcare Ethics, and 3) Introduction to Nursing and
Healthcare Systems. In each of these courses, over 90% of students earned grades
of A. Of these, only Clinical Healthcare Ethics was statistically significantly
related to completing the program in four terms. There are multiple
interpretations of what this means that are beyond the scope of this study.
One possible explanation for why only Clinical Healthcare Ethics was
statistically significantly related to outcome but the other pre-nursing courses with
high mean GPAs were not is that the content in Culture and Health and
Introduction to Nursing and Healthcare Systems is less closely tied to the
academic requirements of the upper division nursing curriculum than Clinical
Healthcare Ethics. Clinical Healthcare Ethics has a humanities focus and covers
the Nurses Code of Ethics including such topics as respect for human dignity, the
nurses’ relationship to patients, privacy, confidentiality, moral self-respect and
responsibility for the healthcare environment (nursingworld.org). Culture and
Health has a broader social and behavioral science orientation and focus on
intercultural communication and healthcare. Introduction to Nursing and
Healthcare Systems is an introductory level course which covers the social,
109
political and economic context in which the nursing profession and healthcare
systems evolved. The curriculum in Clinical Healthcare Ethics, including the
Nurses Code of Ethics, is integrated into the clinical nursing courses and students
are graded in those courses, in part, based on their understanding of that code and
use in the clinical setting.
Human Pathophysiology had the lowest mean GPA, is a rigorous course,
and was also statistically significantly related to completion of the program in
four terms. It is the study of the human body in disease. Since that is the primary
focus of most of the upper division nursing curriculum it is not surprising that it is
also more closely related to success in the program.
Finding the limited number of course grades that are correlated with
completion of the program supports some of the research cited in Chapter Two
However, the broad spectrum of courses included in the study, including
composition, math, statistics, science courses and others, was not supported.
Potolsky, et.al., (2003) found that science course grades were predictive of
success in nursing programs and this study did not support that finding. Uyehara,
et al. (2007) found grades in Human Pathophysiology to be predictive of success
and that finding was supported by this research.
2. The number of replacement courses taken will have a significant
negative predictive effect on completion of the program in four
terms. The more replacement courses taken the less likely the
110
student will be to complete the program in the prescribed four
terms.
This research question was not upheld. Replacement course frequency
had no statistically significant effect on completion of the program. This may be
due to the fact that students were able to take a course at a higher level than the
original prerequisite course and, therefore, were able to gain additional mastery in
that discipline. It may also be that the content of the course taken most closely to
the time of beginning the upper division nursing coursework had a more
immediate effect on success in the program. So, for instance, a student may have
earned a “C” in Introduction to Psychology as a freshman but then earned an “A”
in Social Psychology as a sophomore. The sophomore student may be more
mature and more integrated into the college experience, and may have drawn on
the basic knowledge learned in the introductory course to achieve a higher
mastery of basic psychology needed to succeed in the upper division nursing
courses. Most students did not take replacement courses and, the few who did,
took only one, two or three replacement courses.
3. The number of courses taken at four-year institutions, rather than
at two-year institutions, will have a significant positive predictive
effect on completion of the program in four terms. The more
courses taken at four-year colleges the more likely the student will
be to complete the program in the prescribed four terms.
111
This research question was not upheld. Whether the prerequisite courses
were taken at two-year or four-year colleges had no statistically significant effect
on completion of the program. This finding contradicts the findings of Newton
(2008) regarding the lower success rates for transfer students from two- to four-
year colleges. However, in the current study, most of the students (more than
half) took more than half of the prerequisite courses at four-year colleges.
4. NET scores will have a significant positive predictive effect on
completion of the program in four terms. The higher the NET
scores the more likely the student will complete the program in the
prescribed four terms.
This research question was not upheld. The NET math and reading scores
did not have a statistically significant effect on completion of the program.
Interestingly, American Indian students had the lowest scores on the sections of
this exam yet completed the program at the highest rate.
5. The race/ethnicity of students will have a significant predictive
effect on completion of the program in four terms. White and
Asian students will complete the program in four terms at a higher
rate than Blacks, Hispanics, and Native Americans.
This research question was partially upheld. Although the numbers are
small, Black and Hispanic students completed the program at statistically
significantly lower rates than the other categories of students. However, the
Native American students had the highest completion rate at 100%.
112
The College of Nursing and Health Innovation at Arizona State University
has a special program for Native American students called American Indian
Students United for Nursing (ASUN). The purpose of ASUN is to increase the
number of American Indians/Alaskan Natives studying nursing at Arizona State
University and the number of nurses providing care to American Indians/Alaskan
Natives. ASUN is not a separate nursing program but rather provides scholarship
support to American Indian/Alaskan Native students studying nursing at Arizona
State University (http://nursingandhealth.asu.edu/asun/). This program provides
tutoring, computer laboratories, reading rooms, and mentorship to Native
American students. This nurturing program appears to have a positive effect on
the ability of Native American students to complete the program. If the goal is to
raise completion rates for Black and Hispanic students, similar programs to
nurture those students are likely to have positive outcomes.
6. Gender will have a significant association with completion of the
program in four terms. Female students will complete the program
in four terms at a higher rate than male students. This prediction
is based on a belief that the smaller critical mass of male students
will detract from successfully completing the program in the
prescribed four terms.
This research question was upheld. Male students completed the program
at statistically significantly lower rates that female students. It is not clear why
that is the case since only quantitative data were used in the study and no
113
interviews were conducted with individual students. A possible reason for this
outcome is that men only represent about 10% of the student population in this
program. There is not a critical mass of male students nor are there support
programs for them.
Recommendations
This research sheds light on the questions of patterns of selection,
preparation, retention and graduation in the undergraduate pre-licensure clinical
nursing program at Arizona State University. Since the National League for
Nursing Accrediting Commission has suggested that an 80% completion rate in
nursing programs is acceptable, we can conclude that this nursing program is
successful because there was a 93.7% completion rate for the four student cohorts
in 2007 and 2008.
In Chapter Two, the literature suggested that there were many factors that
affect students over which college personnel have no control. One of those
factors was the academic preparation that students have up to the point of
attending college. Other factors are student commitment to a particular college
and personal time constraints. A recommendation is to focus on those factors
over which policy makers at colleges have some control to attempt to affect
outcomes. So, this research may allow for policy makers, such as the nursing
faculty, to ask whether the selection process and support programs as they exist
are aligned with the expected outcomes. Faculty, and administrative personnel,
could use this research to make adjustments to the selection process and support
114
groups to improve the success rate for selected student populations, such as Black,
Hispanic and male students. Some recommendations regarding these kinds of
factors follow.
Recommendation One. Since this research established that Human
Nutrition, Clinical Healthcare Ethics, and Pathophysiology are related to
successful completion of the program in the prescribed four terms, the faculty
may want to consider including those courses in the Select GPA. This would
require careful scheduling of the prerequisite courses by students with the advice
of their academic advisors so that they would be completed at the time of
selection consideration.
Conversely, the faculty could consider excluding some of the courses from
the Select GPA. Perhaps the Select GPA could be made up of Human Nutrition,
Clinical Healthcare Ethics, Human Pathophysiology and five courses from the
remaining prerequisites. Since some research did find that composition and
science courses were predictive of success, students could choose from the
following to make up the Select GPA: Composition 1 and 2, Anatomy and
Physiology 1 and 2, Chemistry, and Microbiology. Nursing faculty may also
want to consider having the pre-nursing courses Culture and Health and
Introduction to Nursing and Healthcare Systems on this list. None of the research
indicated predictive effects for psychology, human development or elective
courses so while they could remain as prerequisites, they may be excluded from
the Select GPA.
115
Recommendation two. In 2007 and 2008, there were six points possible in
the ranking of students in the selection process. The Select GPA (made up of 13
of the 17 prerequisite courses) was assigned four of the six points possible. Two
of the six points were possible assigned to the NET scores (one point for reading
and one for math). In 2011 the relative weight of the Select GPA and the TEAS
was adjusted. The points used for ranking changed from six to two with one point
for the Select GPA and one point for the TEAS. Given the disparate success rates
on standardized tests for some minority groups this may need to be examined
more closely to determine if there is a detrimental effect for these groups of
students of having equal weight for the standardized test and the Select GPA.
Recommendation three. Additional research should be done to determine
if the TEAS is predictive of successful completion of the program in the
prescribed four terms. There was not a statistically significant relationship
between NET scores and successful completion of the program in the prescribed
four terms. Further research could determine if there is such a relationship
between the TEAS and completion of the program. If there is not, then the
standardized test may need to be reconsidered.
Newton, et.al. (2006) found that the TEAS was a good predictor of
success in the first semester nursing curriculum. All of the students used in this
research took the NET as required for consideration for the program. In 2010 the
TEAS replaced the NET as the required entrance exam for students since the NET
116
was discontinued. This research could be duplicated for more recent cohorts of
students to determine if the TEAS is a good predictor of success in the program.
Recommendation four. The American Indian Students United for Nursing
(ASUN) is credited with the 100% completion rate of Native American students.
Should the faculty wish to increase the completion rates of Black, Hispanic and
male students, they may wish to consider supports groups for those groups as
well.
Recommendation five: The 100% completion rate by Native American
students should be marketed. This is a remarkable achievement that should
reflect on this grant-funded program.
Recommendation six. This research did not look at NCLEX-RN passage
rates. While the Arizona State University program celebrates rates of between
80% and 95% for first time takers of the NCLEX-RN, a follow up study could
help determine which factors predict success on that licensure exam since passage
of that exam ultimately determines practice as a Registered Nurse. Further
research on NCLEX-RN passage rates is recommended.
Recommendation seven. Almost 94% of the 584 students in the study
completed the program in the prescribed four terms. That means that only 36
students did not complete the program in that time frame. Further examination
revealed that all but two students completed the program in six terms. That
represents a 99.6% completion rate in that longer time period. It is not known
why those two students did not complete the program at all.
117
Anecdotal information indicates that some students are delayed due to
personal medical situations or ill family members for which they must care.
These students then “step out” for a semester or more and then petition to return
to progression. Other students who are “out of sequence” have failed to complete
an upper division nursing course with a grade of “C” or higher. Those students
must then petition the college standards committee for permission to repeat that
course. If successful the second time, they petition to return to progression in the
next term. Two course failures results in disqualification from the program but
students may also petition for return to reinstatement and return to progression.
Students who are out of progression due to medical or compassionate
withdrawals are given priority in the return to progression decision making.
Further research on students who take five or more terms to complete the
program would reveal the reasons why it takes some students longer than the four
prescribed terms to complete the program and assist the nursing faculty in
decision making about the number of course failures and repeats allowed.
Recommendation eight. There is a limited number of spaces available in
the pre-licensure clinical nursing program at Arizona State University. The Select
GPA, made up of 13 of 17 prerequisite courses, and the entrance test are used to
determine the students who will be given those coveted spaces. No qualitative
factors are considered. While the selection process yields student cohorts that
complete the program at rates beyond expectations, it may be that the students
that are not given spaces would be just as successful in completing the program as
118
those that are selected. Arizona State University administrators, nursing faculty,
and prospective students have all recommended that additional factors be used in
the decision making process. This researcher concurs. If resources allow, student
interviews with nursing faculty should be added to the selection process.
Implications
The entire population of students enrolled in the program was employed,
so there is no risk of sampling error.
There may be some misperceptions on the part of faculty, community
members, or those outside of the college regarding expected completion rates of
different races/ethnicities, expecting Hispanic, Native American or Black students
to succeed at lower rates, this research shows that that is in fact a misperception
regarding Native American students. The completion rates of Native American
students could be more clearly communicated. Marketing the success of Native
American students is recommended.
This research also supports the selection process currently in place. If the
metric for defining success is an 80% or higher completion of the program in four
terms, then the selection process is successful since almost 94% of the students
did complete the program in that time frame. Anecdotal information indicates
that the success rate is higher if we consider five or six terms to complete the
program. Therefore, if the selection process is questioned by policy makers
within the university, college, community, students, or parents, this research
supports the selection process in place for the years 2007 and 2008.
119
Further research is recommended in the following areas: 1) research to
determine if the TEAS is predictive of success in the program since the NET was
not predictive; 2) research to determine if the relative weights of the Select GPA
and the TEAS scores affects the selection of students to participate in the program
and if those weights negatively affect certain categories of race/ethnicity; 3)
continuous tracking of American Indian students to determine if the ASUN
program continues to contribute to their success in the program; 4) research to
determine which of these, or other, factors contribute to passage of the NCLEX-
RN; 5) research to determine why some students take longer than the prescribed
four terms to complete the program; and, 6) research that includes qualitative
factors such as student commitment outside of their education.
This research contributes to the literature on BSN readiness and attrition in
the following ways. Tinto’s 1975 near-paradigmatic theory of departure from
higher education and further research in 1986 and 2003 regarding academic
integration into the institution is supported by the findings that the students who
are committed to the institution and the academic major are more likely to persist
than those that are not. The nursing students in this study completed the program
in prescribed four terms at a rate of 93.7%.
This research is at odds with research conducted by Potolsky (2003) who
found that science course grades were predictive of success in nursing programs
but supportive of the research conducted by Ulehana (2007) who found that
grades in Human Pathophysiology are predictive of success in nursing programs.
120
The finding that there is a lower success rate for students who transfer
from two- to four-year colleges by Newton (2008) was not supported by this
research.
Conclusion
This research has provided some insight into the patterns of selection,
preparation, retention and graduation for students in the Traditional Pre-licensure
Clinical Nursing Program in the College of Nursing and Health Innovation at
Arizona State University. Quantitative data analyses revealed that specific
prerequisite courses, certain categories of race/ethnicity, and gender are predictive
of completing this program in the prescribed four terms. Recommendations were
made for further research and for policy considerations to further improve this
program.
121
REFERENCES
American Association of Colleges of Nursing (2011). Fact sheet: Nursing Shortage. Retrieved from http://www.aacn.nche.ecu/media/ factsheets/nursingshortage.htm.
Anderson, K. L. (1981). Post-high school experiences and college attrition.
Sociology of Education 54, 1-15. Assessment Technologies Institute (ATI), 2007.
https://www.atitesting.com/Home.aspx. Barr, J. M. B. (n.d.). Interdisciplinary research: Predicting academic success in
the nursing program. Retrieved from http://www.drury.edu/ess/irconf/JBarr.html.
Bean, J. P. (1980). Dropouts and turnover: The synthesis and test of a causal
model of student attrition. Research in Higher Education, 12, 155-187. Bean, J. P. (1982). Student attrition, intentions, and confidence: Interaction effects
in a path model. Research in Higher Education, 17, 291-319. Bean, J. P. (1985). Interaction effects based on class level in an exploratory model
of college student dropout syndrome. American Educational Research Journal, 22, 35-64.
Bean, J. P. & Vesper, N. (1990). Quantitative approaches to grounding theory in
data: Using Lisrel to develop a local model and theory of student attrition. Paper presented at the annual meeting of the American Educational Research Association. Boston
Bentler, P. M., & Speckart, G. (1979). Models of attitude-behavior relations.
Educational Research Journal, 22, 35-64. Bentler, P. M. (1981). Attitudes "cause" behaviors: A structural equation analysis.
Journal of Personality and Social Psychology, 49, 226-38. Berger, J. B. (2000). Organizational behavior at colleges and student outcomes: A
new perspective on college impact. Review of Higher Education, 23, 177-198.
Berger, J. B., & Braxton, J. M. (1998). Revising Tinto's interactionalist theory of
student departure through theory elaboration: Examining the role of
122
organizational attributes in the persistence process. Research in Higher Education, 39, 103-119.
Braxton, J. M., (Ed.). (2000). Reworking the student departure puzzle. Nashville:
Vanderbilt University Press. Brown, J., Marshall, B. (2008). A historically Black university’s baccalaureate
enrollment and success tactics for registered nurses. Journal of Professional Nursing, pp. 21-29.
Byrd, G., Garza, C., & Nieswiadomy, R. (1999). Predictors of successful
completion of a baccalaureate nursing program. Nurse Educator, 24(6), 33-37.
Burns, N., & Grove, S. (2009). The practice of nursing research. St. Louis, MO:
Saunders Elsevier. Cabrera, A. F., Castaneda, M. B., Nora, A., & Ana Hengstier, D. (1992). The
convergence between two theories of college persistence. Journal of Higher Education, 63(2), 143-164.
Cabrera, A. F., Stampen, J. 0., & Hansen, W. L., (1990). Exploring the effects of
ability-to-pay on persistence in college. Review of Higher Education 13, 303-336.
California Postsecondary Education Commission, (2003).
http://www.cpec.ca.gov/completereports/2003reports/03-09.pdf Capaldi, E. D., Lombardi, J. V., & Yellen, V. (2006). Improving graduation rates:
A simple method that works. Change: The magazine of higher learning, 38 (4), pp. 44-50.
Chung, V., (2012). Men in Nursing. http://www.minoritynurse.com/ men-
nursing/men-nursing Cohen, A. M. (1998). The shaping of American higher education: Emergence and
growth of the contemporary system. San Francisco: Jossey-Bass. Consortium for Student Retention Data Exchange (CSRDE) Retention Report
(2009). The retention and graduation rates of entering baccalaureate degree-seeking freshman cohorts from fall 2000 through fall 2007 in 424 colleges and universities. Center for Institutional Data Exchange and Analysis (C-IDEA). The University of Oklahoma.
123
Crow, C., Handley, M., Morrison, R. & Shelton, M. (2004). Requirements and interventions used by BSN programs to promote and predict NCLEX-RN success: A national study. Journal of Professional Nursing, pp. 174-186.
Dewey, J. (1916). Democracy in education: An introduction to the philosophy of
education. New York: The MacMillan Company.
DiBartolo, M., & Seldomridge, L. (2005). A review of intervention studies to promote NCLEX-RN success of baccalaureate students. Nurse Educator, 166-171.
Getzlaf, S. B., Gordon, M. S., Kearney, K. A., & Aria Blackwell, J. J. (1984). Two types of voluntary undergraduate attrition: Application of Tinto's model. Research in Higher Education 20, 257-267.
Greenwood, P.E., & Nikulin, M.S. (1996). A guide to chi-squared testing. New
York: Wiley. Herrera, Cheryl (2012). Director Undergraduate Student Academic Services,
College of Nursing and Health Innovation. Hoffman, D. (2008a). Quantitative examples of the financial and economic
benefits of higher education. Productivity and prosperity project. Office of the university economist. Retrieved from http://www.wpcarey.asu.edu/seid.
Hoffman, D. (2008b). The societal benefits of higher education. Productivity and
prosperity project. Office of the university economist. Retrieved from http://www.wpcarey.asu.edu/seid.
Hossler, D. (1991). Evaluating recruitment and retention programs. New
directions for institutional research evaluating recruiting and retention programs, 18(2), 95-99.
Johnson, J.B. (1926). Predicting success in college at time of entrance. School and
Society, 23, 82-88. Mallette, B.I., & Cabrera, A. F. (1991). Determinants of withdrawal behavior: An
exploratory study. Research in Higher Education, 32, 179-194. March, J. C., & Simon, H. (1958). Organizations. New York: Wiley.
124
Metzner, B. S., & Bean, J. P. (1987). The estimation of a conceptual model of nontraditional undergraduate student attrition. Research in Higher Education 27, 15-38.
Morris, B. (2012). Senior Director Baccalaureate Program, College of Nursing
and Health Innovation, Arizona State University. Interview on January 15, 2012.
Moseley, J. (1995). Managing and leading the university of the 21st century:
megatrends and strategies: A report from the NASULGC Council on Academic Affairs. 1995. Retrieved from http://www.uoregon.edu/~acadaff/facultystaff/2.html.
Munro, B. (1981). Dropouts from higher education: Path analysis of a national
sample. American Educational Research Journal, 18(2), 133-141. National League for Nursing Accrediting Commission (NLNAC).
http://www.nlnac.org/manuals/SC2008_BACCALAUREATE.htm. Newton, S. E., & Moore, G. (2009). Use of aptitude to understand bachelor of
science in nursing student attrition and readiness for the National Council Licensure Examination-Registered Nurse. Journal of Professional Nursing, 25(5), 273-278.
Newton, S. E., Smith, L. H., & Moore, G. (2007). Baccalaureate nursing program
admission policies: Promoting success or facilitating failure? Journal of Nursing Education, 46, 439-444.
Newton, S. E., Smith, L. H., Moore, G., & Magnan, M. (2006). Predicting early
academic achievement in a baccalaureate nursing program. Journal of professional nursing, 23(3), 144-149.
Nora, A. (1987). Determinants of retention among Chicano students: A structural
model. Research in Higher Education, 26, 31-59. Nora, A., Attinasi, L. C., & Matonak, A. (1990). Testing qualitative indicators of
precollege factors in Tinto's attrition mode1: A community college student population. Review of higher education, 13, 337-356.
Pascarella, E. T. (ed.) (1982), Studying student attrition. New directions for
institutional research, 36, 17-33. San Francisco: Jossey-Bass Inc.
125
Pascarella, E. T., Duby, P., & Iverson, B. (1983). A test and a reconceptualization of a theoretical model of college withdrawal in a commuter institution setting. Sociology of education 56, 88-100.
Pascarella, E. T., & Terenzini, P. T. (1983). Predicting voluntary freshman year
persistence/withdrawal behavior in a residential university: A path analytic validation of Tinto's model. Journal of educational psychology ,75(2), 215-226.
Paulson, S. E., & Marchant, G. J. (2009). Background variables, levels or
aggregation, and standardized test scores. Education Policy Analysis Achrives, 17, 22-32.
Plapp, J. M., Psathas, G., & Caputo, D. V. (1965). Intellective predictors of
success in nursing school. Sage Publications. doi: 10.1177/001316446502500228.
Potolsky, A., Cohen, J., & Saylor, C. (2003). Academic performance of nursing
students: Do prerequisite grades and tutoring make a difference? Nursing Education Perspectives, 246-250.
Ruddock, M. S., Hanson G., & Moss, M. K. (1999). New directions in student
retention research: Looking beyond interactional theories of student departure. Paper presented at the 39th Annual Forum of the Association for Institutional Research; Seattle, Washington; May 30-June 2.
Sanford, N. (ed.), The American college: A psychological and social
interpretation of higher learning. Sayles, S., Shelton, D., & Powell, H. (2003). Predictors of success in nursing
education. The ABNF Journal. Retrieved from http://www.michigancenterfornursing.org/mimages/Employeffects.pdf.
Schein, E. (1984). Coming to a New Awareness of Organizational Culture.
Leadership and Organizational Studies. Steel, R. G. D. & Torrie, J. H. (1960). Principles and procedures of statistics,
New York: McGraw-Hill. Summerskil, J., (1962). Dropouts from college. In N. Sanford (Ed.), The
American college: A psychological and social interpretation of higher learning. New York: Wiley.
126
Supovitz, J., & Brennan, R. (1997). Mirror, mirror on the wall, which is the fairest test of all? An examination of the equitability of portfolio assessment relative to standardized tests. Harvard Educational Review, 67.
Symes, L., Tart, K., & Travis, L. (2005). An evaluation of the nursing success
program: Reading comprehension, graduation rates, and diversity. Nurse Educator, 217-220.
Tabachnick, B., & Fidell, L. (1996). Using Multivariate Statistics. New York:
Harper Collins. Terenzini, P., Lorang, W., & Pascarella, E. (1981). Predicting Freshman
Persistence and Voluntary Dropout Decisions: A Replication. Research in Higher Education, 109-127.
Tinto, V. (1975). Dropout from higher education: A theoretical synthesis of recent
research. Review of Educational Research, 45, 89-125. Tinto, V. (1982). Limits of theory and practice in student attrition. Journal of
Higher Education, 53, 687-700. Tinto, V. (1986). Theories of student departure revisited. Higher education:
handbook of theory and research, II. New York: Agathon Press. Tinto, V. (1987). Leaving college: rethinking the causes and cures of student
attrition. Chicago: University of Chicago Press. Tinto, V. (1993). Leaving college: Rethinking the causes and cures of student
attrition, 2d ed. Chicago: University of Chicago Press. Townsend, B. (1995). Community college transfer students: A case study of
survival. The Review of Higher Education, 175-193. Uyehara, J., Magnussen, L., Itano, J., & Zhang, S. (2007). Facilitating program
and NCLEX-RN success in a generic BSN program. Nursing Forum, 42 31-38.
Wolkowitz, A. A., & Kelley, J. A. (2010). Academic predictors of success in a
nursing program. Journal of Nursing Education, 49, 498-503. Yin, R. (2009). Case Study Research: Design and Methods, 4th ed. Sage
Publications, Inc.

127
APPENDIX A
CODEBOOK
128
AP1 = BIO 201 Anatomy & Physiology 1
AP2 = BIO 202 Anatomy & Physiology 2
CHM = CHM 101 Introduction to Chemistry
HDEV = CDE 232 Human Development
COMP1 = ENG 101 English Composition 1
COMP2 = ENG 102 English Composition 2
ETH = HCR 210 Health Care Ethics
NUR = HCR 220 Introduction to Nursing and Healthcare Systems
CUL = HCR 230 Culture and Health
PATHO = HCR 240 Human Pathophysiology
MATH = Any mathematics course
MIC = MIC 205/206 Microbiology
NTR = NTR 241 Human Nutrition
PSY = PGS 101 Introduction to Psychology
STATS = Any statistics class
For the above courses: 4 = A; 3 = B; 2 = C
Pre-ReqGPA = The GPA earned for 15 prerequisite courses. Values range from
3.25 to 4.00.
SelectGPA = The GPA for three science courses, two composition courses and
eight other prerequisite courses. Values range from 3.25 to 4.00.

129
REPL = Courses taken to replace a required prerequisite course in which a grade
of “B” or “C” was earned. Value indicates the number of replacement courses the
student took.
PRQ4YR = Of the 15prerequisite courses , the number taken at a 4-year
institution.
NET Math = The score earned on the math portion of the Nurses Entrance Test
which ranges from 65 to 100.
NET Read = The score earned on the reading portion of the Nurses Entrance Test
which ranges from 60 to 100.
Ethnicity = Asian = 1; Black = 2; Hispanic = 3; Native American = 4; White = 5;
Unknown = 99
Gender = Male = 1; Female = 2.
# Terms = The number of terms that the student took to complete the upper
division nursing Curriculum. The curriculum is designed for four terms. Those
who took longer did not earn a “C” or greater in a NUR course and, therefore, had
to repeat it. Thus, the number of terms taken is greater than four for those
students.

130
APPENDIX B
HUMAN RESEARCH CURRICULUM COMPLETION REPORT
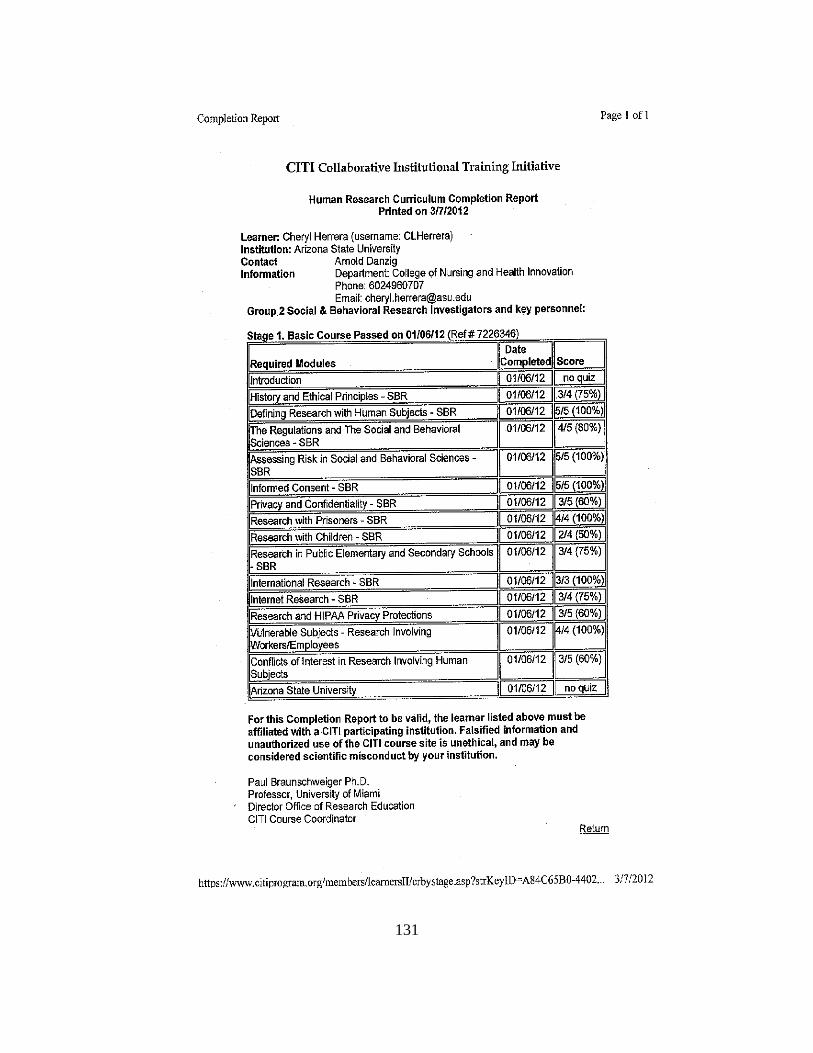
131
132
BIOGRAPHICAL SKETCH Cheryl Herrera was born Cheryl Lyn Doss on March 27, 1960 in La Mesa, California. She attended elementary and secondary schools in Southern California then received her bachelor’s and master’s degrees at California State University, Stanislaus. She achieved ABD status at the University of California, Santa Barbara in Political Science in 1989. She has worked at Arizona State University in Tempe and downtown Phoenix since 1989, mostly as Director of Student Services. She began her doctoral studies in Public Administration in 1998. Cheryl has two daughters—one in law school at the University of California, Davis and the other about to begin her college career. She enjoys spending time with her family and friends and the beauty of Arizona.