impurity profiling, separation of impurities, …...impurity peak at 158 c . the lcms studies were...
TRANSCRIPT

Eurasian Journal of Analytical Chemistry ISSN: 1306-3057 OPEN ACCESS 2019 14 (2): 175-187
Received: 19 March 2019 ▪ Revised: 21 April 2019 ▪ Accepted: 28 April 2019
Abstract: Sulfametapyrazine is an opportunistic candidate for Impurity profiling. The
development of method and validation in presence of related substances by RP-UFLC and
separation of identified impurities by preparative HPLC in Sulfametapyrazine (SMP) is a
challenging candidate. The identification, separation and quantification was performed
using RP-UFLC, LCMS and 2DNMR spectroscopy. A new RP-UFLC and LCMS method was
developed for identification of impurity in SMP, using mobile phase composed of
ammonium formate buffer pH 4.0 (B) and acetonitrile (A) (40:60 v/v), with 1.0 ml/min
flow rate, Phenomenex Hyperclone BDS C18 employed as column. The eluent was
examined using PDA detector at 254 nm. The impurity and SMP was efficiently separated
with the retention time of 3.04 and 4.12 min respectively. The DSC analysis showed the
actual melting point of SMP between 174- 177 °C, SMP peak was seen at 175 °C and the
impurity peak at 158 °C. The LCMS studies were carried out by using ESI through positive
ion mode. The m+1 prominent peak appeared for SMP and impurity at 281 g/mol and 449
g/mol. The detected impurity was separated by using preparative HPLC. The impurity
structure was characterised by HNMR, 13CNMR, COSY, HSQC and Mass spectroscopy. The
method was validated following guidelines.
Keywords: Sulfametapyrazine (SMP), Low Pressure Gradient Mode, UFLC, Impurity
Profiling, Electro Spray Ionisation (ESI).
INTRODUCTION Sulfametapyrazine (sulfalene), 4-amino-N-(3-methoxypyrazine-2-yl) benzenesulfonamide is an
example for long acting sulfonamide and used as antiinfective agent. SMP finds importance in management of lower respiratory tract infection, urinary tract infection and also in malaria. It competitively inhibits the bacterial enzyme dihydropteroate synthetase. The SMP is widely recommended drug in Europe, African countries, Thailand and is available in several commercial tablet dosage forms [5].
O2S
NH
N
N
H2N
H3CO
Jayadev Krishnan, Department of Pharmaceutical Chemistry, JSS College of Pharmacy, JSS Academy of Higher Education & Research (Deemed to be University), Mysuru.
Anand Kumar Tengli*, Department of Pharmaceutical Chemistry, JSS College of Pharmacy, JSS Academy of Higher Education & Research (Deemed to be University), Mysuru. E-mail: [email protected], [email protected]
Shivakumar Gudlawar, Buhoot, Research Lab, Dubai. Ramesha, Research and Development Department, RL Fine Chemicals Private Limited, Yelahanka, Bengaluru. Shankara, Department of Analysis, Vijnana Bhavan, Mysore University, Manasagangothri, Mysore.
Impurity Profiling, Separation of Impurities, Characterisation by LCMS and 2DNMR
Spectroscopy and Ultrafast Liquid Chromatography Method Development
Jayadev Krishnan, Anand Kumar Tengli*, Shivakumar Gudlawar, Ramesha, Shankara

176 Jayadev Krishnan et.al
Pharmaceutical dosage forms comprise of active pharmaceutical ingredients (APIs) and excipients. APIs used for formulations do comprise some impurities, as these impurities may affects the overall product quality. Therefore, it’s utmost challenging and important to perform impurity profiling in API. Impurity profiling encompasses identification, structural characterization and quantification of impurities in API’s and in drug products. Impurity profiling describes the account or description of maximum possible types of identified or unidentified impurities or both present in any APIs. These impurities may be either API related impurities, process related impurities or stability related impurities. API related impurities are even the stereoisomers, crystallization, and functional group of APIs. Process related impurities include chemicals, reagents, catalysts, residual solvents, synthetic intermediate products, by product, degradation products, method condition, related substances, and impurities related to formulation. Stability related impurities may be due to degradation or transformation of APIs, mutual interactions among APIs, excipients present in drug product. Presence of these impurities do impact the bioavailability, safety and efficacy of APIs. Regulatory authorities such as ICH, USFDA are highly stringent and specify limits for various impurities that may be possible present in APIs. Alternative markers and develop analytical technique towards isolation and characterization of the said impurities are adopted in the profiling process. The said process are important towards establishing biological safety and efficacy. In the recent trends impurity profiling emerges out as a mandatory requirement for a new drug application. The present investigation describes probable sources of impurities, need for impurity profiling and detailed techniques of characterization and quantitation of impurities. Thus, this review is an attempt to understand concept of impurity profiling and its various aspects.
Identification of impurities was done by Chromatographic and Spectroscopic techniques, either alone or in combination with other techniques8. General procedure for impurity profiling, Validation is performed in accordance with ICH Harmonised Tripartite Guideline9,10, explained advances in impurity profiling & Europian Pharmacopoeia11.
A few analytical methods were found to be developed and validated by using reverse phase-high performance liquid chromatography (RP-HPLC) for Sulfametapyrazine (SMP) in API, tablet formulation and in combined tablet dosage form.
The method has been developed for SMP in (API) in presence of related substances. In view, no method of impurity profiling (presence of related substances) on SMP in API and in pharmaceutical dosage form has been reported and hence it is necessary to carry out suitable method development and validation of SMP in API in presence of related substances and separation, quantification and characterization of impurities.
EXPERIMENTAL Chemicals and reagents
Sulfametapyrazine an Active pharmaceutical ingredient (API) was obtained from R L Fine Chemicals Bengaluru, Karnataka, India. LC grade acetonitrile and analytical grade orthophosphoric acid, ammonium acetate, ammonium formate, formic acid were obtained from Merck (India) ltd. Mumbai, and water used was Milli pore water.
Instrumentation
UFLC experiments were performed on SHIMADZU Ultra Fast - LC 20AD Chromatography system assembled with binary pump, auto sampler and photo diode array (PDA) detector. The output signals were examined and processed using LC Solutions software. The chromatographic separation was achieved by using Phenomenex C18 (250 X 4.6 mm, 5 μ) column with the composition of ammonium formate buffer at pH 4.0 adjusted using orthophosphoric acid (B) and acetonitrile (A) in the ratio of 40:60 (v/v) mobile phase. The flow rate was 1.0 ml/min with ambient temperature (250C) and the injection volume was 2 µl.
LC-MS
The separation and determination of mass of sulfametapyrazine and impurity were carried out by using Liquid Chromatography Mass spectroscopy/ Mass spectroscopy Shimadzu-8030, coupled with ESI.
Preparative HPLC
The impurity from sulfametapyrazine was resolved by Water’s preparative High Performance Liquid Chromatography, using Sunfire C18 (250X20 mm, 10 μm) column with mobile phase composed of ammonium formate buffer at pH 4.0 and acetonitrile in the ratio of 40:60 (v/v).

177 Eurasian Journal of Analytical Chemistry
Differential Scanning Colorimeter
Melting point of API was determined using Differential Scanning Colorimeter DSC- 60, Shimadzu Japan.
Rotary Evaporator
The evaporation of solvent after separation of impurity from sulfametapyrazine was achieved using rotary evaporator, Heidolph 2000-NS, Germany.
Nuclear Magnetic Resonance Spectroscopy The structure of the impurity was found out using Agilent 400 MHz, and the software used was VNMRJ
3.2.
Preparation of Buffer Solution Solutions for UFLC
The mobile phase composed of buffer (B):Acetonitrile (A) in the ratio of 40:60 (v/v). The buffer (B) solution of ammonium formate in 1000 ml of Millipore water was prepared by weighing accurately 6.03 g and the pH 4.0 was adjusted using orthophosphoric acid.
Preparative HPLC Mobile phase of 5mm of Ammonium formate was prepared by weighing 315.3 g into 1000 ml
volumetric flask, 250-300 ml of Millipore water was added to dissolve and the volume was made upto the mark with Millipore water and pH 4.0 adjusted with orthphosphoric acid. The mobile phase composed of buffer (B) and Acetonitrile (A) in the ratio 40:60
Preparation of Stock Solutions for UFLC
Stock solution of Sulfametapyrazine (API) 1000 μg/ml was prepared by weighing exactly 100 mg into a 100ml volumetric flask and few ml of ACN was added, sonicated to dissolve. The volume was made upto 100 ml using ACN.
Preparation of Stock Solutions for Preparative HPLC
Precise concentration of 20 mg/ml was prepared by accurately weighing 2g of SMP into a clean 100 ml graduated flask. Few ml of ACN was added to dissolve and the volume was made up to 100 ml using ACN.
Preparation of Impurity Stock Solution
Separate stock solution of separated impurity from API by preparative HPLC was prepared by weighing separately 1mg into 10ml standard graduated flask. Few ml of ACN was added and sonicated for 5 min to dissolve. Then the volume was made upto the mark with ACN and filtered through 0.22μ membrane filter. The resulting solution contains 0.1 mg/ml (100 μg/ml). From the stock solution, different concentrations were made in the range of 2-12 µg/ml.
Preparation of Calibration Curve
Standard solution of Sulfametapyrazine for calibration was prepared by pipetting out 10 ml into a graduated flask from 1000 µg/ml of stock solution, from this different concentration range of 2-10 µg/ml respectively was prepared. Each concentration was injected in triplicate and chromatographed under the chromatographic conditions. Linear correlations were found between peak-area ratio plotted against the corresponding concentration.
Separation of Impurities by Preparative HPLC Method
Impurity present in the sulfametapyrazine was separated by using column Sunfire C18 (250 x 20 mm, 10 μm), mobile phase composed of ammonium acetate buffer (pH 4.0) and acetonitrile in the ratio of 40:60 (v/v) with injection volume 1500 μl, flow rate 12.0 ml/min and the run time was 20 min. The eluent was monitored at 254 nm with column temperature at 25 ºC.
RESULTS AND DISCUSSION Impurity profiling, method development and validation by UFLC method in the presence of impurity
(related substance) in API is important and very challenging. Preliminary runs were performed with the objective of selecting optimum chromatographic conditions. The separation of the drug and impurity was tried using different columns like C8, Cyano and amino columns. The main difficulties faced during these investigations were lack of separation between sulfametapyrazine and impurity, peak tailing, drifting etc.
178 Jayadev Krishnan et.al
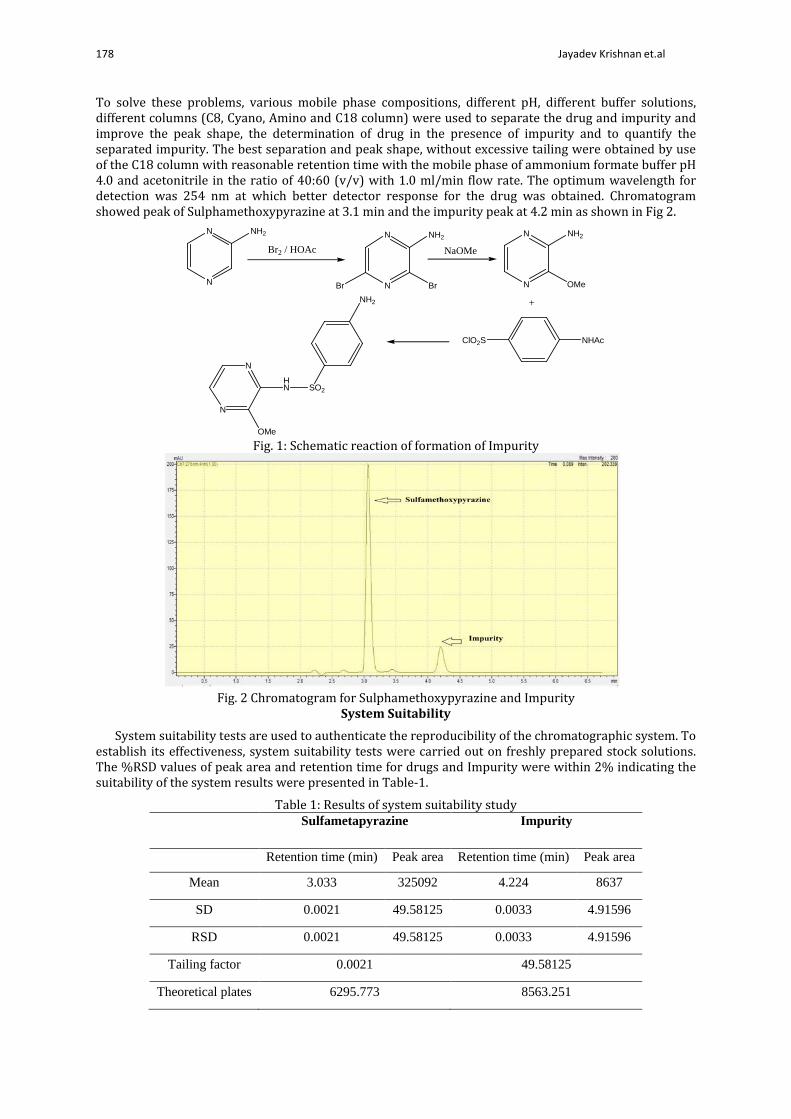
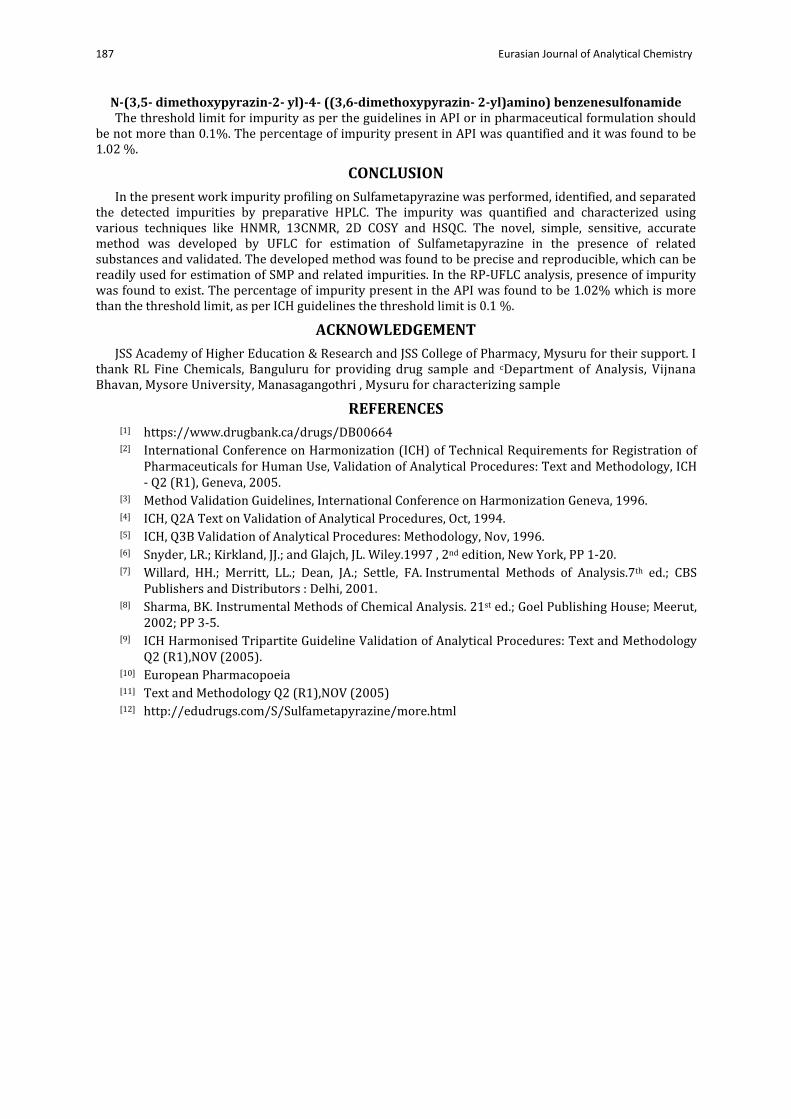
To solve these problems, various mobile phase compositions, different pH, different buffer solutions, different columns (C8, Cyano, Amino and C18 column) were used to separate the drug and impurity and improve the peak shape, the determination of drug in the presence of impurity and to quantify the separated impurity. The best separation and peak shape, without excessive tailing were obtained by use of the C18 column with reasonable retention time with the mobile phase of ammonium formate buffer pH 4.0 and acetonitrile in the ratio of 40:60 (v/v) with 1.0 ml/min flow rate. The optimum wavelength for detection was 254 nm at which better detector response for the drug was obtained. Chromatogram showed peak of Sulphamethoxypyrazine at 3.1 min and the impurity peak at 4.2 min as shown in Fig 2.
N
N NH2
Br2 / HOAc
N
N NH2
Br Br
NaOMe
N
N NH2
OMe
+
ClO2S NHAc
NH2
SO2HN
N
N
OMe Fig. 1: Schematic reaction of formation of Impurity
Fig. 2 Chromatogram for Sulphamethoxypyrazine and Impurity
System Suitability System suitability tests are used to authenticate the reproducibility of the chromatographic system. To
establish its effectiveness, system suitability tests were carried out on freshly prepared stock solutions. The %RSD values of peak area and retention time for drugs and Impurity were within 2% indicating the suitability of the system results were presented in Table-1.
Table 1: Results of system suitability study Sulfametapyrazine Impurity
Retention time (min) Peak area Retention time (min) Peak area
Mean 3.033 325092 4.224 8637
SD 0.0021 49.58125 0.0033 4.91596
RSD 0.0021 49.58125 0.0033 4.91596
Tailing factor 0.0021 49.58125
Theoretical plates 6295.773 8563.251

179 Eurasian Journal of Analytical Chemistry
Linearity
The linearity for sulfametapyrazine was checked in the concentration range of 2-10 μg/ml. The concentration ranges were found to be linear when a graph was plotted with peak area against concentration represented in Fig 3. The acceptance criterion for linear range is that the regression co-efficient value should not be less than 0.9991 with regression equation Y = 32805x + 4734.5 where x is independent variable ie concentration and y dependent variable ie. area. The results of regression parameters are presented in Table 2.
Fig. 3 Linearity graph of sulfamethoxypyrazine
Table 2: Results for Linearity Level Concentration in PPM Area of Sulfametapyrazine 1 0 0
2 2 63927
3 4 149687
4 6 204602
5 8 269262
6 10 325092 Regression equation Y = 32805x + 4734.5 Correlation coefficient (R2) 0.9957
Precision
System Precision
The system precision is to ensure that the analytical system is working properly towards the selected method. It is done by injecting the six samples and checking the reproducibility in retention time and the area of the samples. The results of system precision are given in the table 3 and 4.
Table 3: Results for Interday System precision studies Injection No. Peak area
Concentration 6µg/ml 1 201411 2 199837 3 202456 4 198898 5 198978 6 201356 Average 200489.3333 Standard Deviation 1336.061833 % RSD 0.666400457
Table 4: Results for Intraday System precision studies Injection. No. Peak area
Concentration 6µg/ml 1 204612 2 206785 3 199943 4 206885 5 201765 6 199874 Average 203310.6667 Standard Deviation 2946.219649 % RSD 1.449122025

180 Jayadev Krishnan et.al
The method was found to be precise with % RSD of sulfametapyrazine was 0.664 for inter-day and 1.449 for intra-day. The values were found to be within the acceptable limits.
Method Precision
The intraday and inter-day method precision were performed on sulfametapyrazine and the results were tabulated as given in the below table 5. The %RSD of sulfametapyrazine for inter-day and intra-day precisions were found to be within the acceptable limits.
Table 5: Intraday and Interday Method Precision S.No Amount of drug
taken (µg/ml) Intraday Interday
Peak area
Mean peak area
SD % RSD
Peak area
Mean peak area
SD % RSD
1 2 62456 63643.5 728.605 1.1448 63847 63864.3 806.889 1.2634
2 64256 64452
3 63232 64565
4 64125 64585
5 63236 62336
6 64556 63401
1 6 201563 198777.5 2279.073 1.1465 201125 201767.8 2524.084 1.2509
2 201123 202015
3 198563 198943
4 198898 206885
5 194653 201765
6 197865 199874
1 10 325421 320497.3 4208.316 1.3130 323668 324366.3 3417.874 1.0537
2 315465 326545
3 322312 324989
4 315565 330125
5 318656 319986
6 325565 320885
Limit of Detection & Limit of Quantitation
Limit of detection is the lowest amount of analyte in a sample that can be detected, but not necessarily quantitated, under the stated experimental conditions. Limit of Quantitation is the lowest amount of analyte in a sample that can be quantitated with acceptable accuracy and precision, under the stated experimental conditions. Calculated slope, intercept and correlation coefficient and the residual standard deviation from the linearity curve. From the intercept, slope and residual standard deviation, calculated the Limit of Detection and Quantitation. The results of LOD and LOQ are given in table 6.
Table 6: LOD and LOQ results Drug LOD (µg/mL) LOQ (µg/mL)
Sulfametapyrazine 0.4702 1.4249 Robustness
The robustness of an analytical procedure is a measure of its capacity to remain unaffected by small, but deliberate variations in method parameters and provides an indication of its reliability during normal usage.
Separation of impurity by preparative HPLC and characterization by LC-MS/MS and NMR
Preparative HPLC
The API was subjected to preparative HPLC under optimized conditions and the impurity was separated and collected for quantification. The mobile phase used was 5mm Ammonium Formate buffer (A) in Acetonitrile (B). The separation was done in gradient mode and the time and percentage of ammonium formate (A) buffer pH 4.0 and acetonitrile (B) is depicted in table 8. As seen from the chromatogram, the API was eluted at 8.31 min and impurity at 8.96 min.

181 Eurasian Journal of Analytical Chemistry
Table 7: Results for Robustness for Sulfametapyrazine Condition Tailing %RSD Theoretical plates %RSD Optimized method 1.302 - 6295 - Mobile phase composition (60:40) 65 : 35 1.34 1.432 6123 1.385
55:45 1.29 0.469 6189 0.842 pH 4.0 Decreased
(-0.1 unit) 1.33 1.06 6384 0.701
Increased (+0.1 unit) 1.335 1.25 6325 0.621 Flow rate 1.0 ml/min
Decreased (-0.1 mL/min)
1.279 0.891 6208 0.69
Increased (+0.1mL/min) 1.286 0.618 6166 1.03 Increased (+0.1 mL/min) Decreased (1nm) 1.326 0.684 6451 1.22
Increased (1nm) 1.295 0.365 6395 0.788 Table 8: Gradient Elution by Preparative HPLC
Quantification of Impurity
Impurity present in the sulfametapyrazine were quantified by using a calibration plot of the separated impurity. The different concentration of the separated impurity were injected to obtain a calibration plot. By using the calibration plot the percentage of impurity present in the sulfametapyrazine was quantified by extrapolating it on the linearity graph. The different concentration of the impurity and peak area is depicted in table 09. The purity of the impurity peak is shown by fig 05 and fig 06 respectively. The concentration of impurity present in the API was calculated by using equation: y = mx + c.
Fig. 4: Preparative HPLC Chromatogram of Sulfametapyrazine
Fig. 5: Chromatogram of Pure Impurity

182 Jayadev Krishnan et.al
Fig. 6: Peak purity Chromatogram of Pure Impurity
Table 9: Calibration concentration of Impurity
The linear equation of pure impurity is y = 20715x + 6560.5, upon substitution of y as 8637, the value
of x was found to be 0.1002 µg.
SUMMARY In the selected chromatographic conditions the drug and its related substances were having a good
resolution. The related substances were separated in the selected chromatographic conditions, to confirm the
presence of related substances in the SMP and there is no degradation of drug at the particular pH, column varied spectral analysis was performed.
UV spectra of SMP with related substances, DSC, LC-MS in both the case is confirmed that the drug is not degraded at that particular pH and the additional peak in the UFLC indicated the presence of impurity.
The RT of the drug peak and impurity-A were 3.02 min and 4.12 min respectively. Differential Scanning Colorimeter (DSC) clearly got two melting point peaks at 175 °C for sulfametapyrazine and the other at 158 °C for impurity peak. Later the impurities were separated by preparative HPLC and the separated impurities were characterized by LC-MS, NMR.
1H- 1H correlation cross peaks were noticed between aromatic protons on C19, C17 and C16, C20 in 2D COSY spectrum.
The 1H- 13C connectivity was established by 2D HSQC experiment. All the 1H-13C correlation information were confirmed by Fig. 14 and Table 10. The proposed structure and IUPAC name of the impurity was found to be (C18H20N6O6S):
Level Concentration in PPM Area of Pure Impurity 1 0 0 2 2 55296 3 4 90856 4 6 130952 5 8 171358 6 10 212356 Regression Equation Y = 20715x + 6560.5 Correlation Coefficient (R2) 0.9966 Slope 20715 Intercept 6560.5

183 Eurasian Journal of Analytical Chemistry
Fig. 7: Differential Scanning Colorimeter peak of sulfametapyrazine and impurity
Fig. 8: Calibration curve of pure Impurity
100 150 200 250 300 350 400 450 m/z0.0
1.0
2.0
3.0
4.0
5.0
6.0
Inten. (x1,000,000)
449.20
487.20342.30288.40 356.30279.25 316.40
Fig. 9: LC-MS data for impurity

184 Jayadev Krishnan et.al
Fig. 10: 1HNMR of impurity
Fig. 11: 13C of Impurity

185 Eurasian Journal of Analytical Chemistry
Fig. 12: COSY of impurity
Fig. 13: HSQC of impurity

186 Jayadev Krishnan et.al
Table 10: 1HNMR & 13CNMR interpretation
Structure
N4
3
2
N1 6
5
16 17
18
1920
15
NH11
S12
O13
O14
O9
10
O7
8N23
2227
N26
25
24
NH21
O28
29
O30
31
1HN
MR 8.17(C3,S), 3.98(C8,S), 3.92(C10,S), 7.42-7.79 (C19,C17,d), 8.03-8.05 (C20, C16,d), 8.11(C25,S),
3.87(C29,S), 3.79(C31,S) 7.42 (NH,S)
13CNMR
53.54-60.4 (C28,C30,C7,C9), 118 (C17, C19), 129 (C20, C16) 150.9 (C3, C25), 144 (C18), 160.8 (C6), 160.2 (C15), 149 (C5), 131 (C2), 152 (C24), 126 (C27)
Table 11: Summary report of UFLC method validation of SMP and related substances Validation Parameter Acceptance Criteria Result (SMP) System Suitability
Tailing factor It should be NMT 2.0 % 1.315 Impurity
1.217 Theoritical plates It should be NLT 2000 4478.495 8563.21
Linearity The Correlation coefficient not intended to be NLT 0.95 0.997 0.993
LOD - 0.37 µg/ml LOQ
Should not be more than 50% of the working concentration 1.26 µg/ml
System Precision Intraday
The %RSD should be NMT 2.0 for peaks obtained from the 6 replicate injections
1.2164
System Precision Interday
The %RSD should be NMT 2.0 for peaks obtained from the 6 replicate injections
1.00093
Method Precision Intraday
The %RSD should be NMT 2.0 for peaks obtained from the 6 replicate injections
1.201746
Method Precision Interday
The %RSD should be NMT 2.0 for peaks obtained from the 6 replicate injections
1.18432
Robustness
All the parameters for suitability should pass for all the conditions.
For the developed method, for all the conditions and all the parameters passed the system suitability
LC-MS Mass of Drug – 280.1 g/mol Mass of Impurity – 448 g/mol
H- NMR The H-NMR was done and the number of protons present in the impurity was found to be 20
C-NMR The C-13 NMR was done and the number of carbons in the impurity was found to be 18
N23
22
27
N26
2524
NH21
O28 29
O30
31
N4
32
N1
6
516
17
18
19
20
15
NH11
S12
O13
O14
O910
O7
8
187 Eurasian Journal of Analytical Chemistry
N-(3,5- dimethoxypyrazin-2- yl)-4- ((3,6-dimethoxypyrazin- 2-yl)amino) benzenesulfonamide The threshold limit for impurity as per the guidelines in API or in pharmaceutical formulation should
be not more than 0.1%. The percentage of impurity present in API was quantified and it was found to be 1.02 %.
CONCLUSION In the present work impurity profiling on Sulfametapyrazine was performed, identified, and separated
the detected impurities by preparative HPLC. The impurity was quantified and characterized using various techniques like HNMR, 13CNMR, 2D COSY and HSQC. The novel, simple, sensitive, accurate method was developed by UFLC for estimation of Sulfametapyrazine in the presence of related substances and validated. The developed method was found to be precise and reproducible, which can be readily used for estimation of SMP and related impurities. In the RP-UFLC analysis, presence of impurity was found to exist. The percentage of impurity present in the API was found to be 1.02% which is more than the threshold limit, as per ICH guidelines the threshold limit is 0.1 %.
ACKNOWLEDGEMENT JSS Academy of Higher Education & Research and JSS College of Pharmacy, Mysuru for their support. I
thank RL Fine Chemicals, Banguluru for providing drug sample and cDepartment of Analysis, Vijnana Bhavan, Mysore University, Manasagangothri , Mysuru for characterizing sample
REFERENCES [1] https://www.drugbank.ca/drugs/DB00664 [2] International Conference on Harmonization (ICH) of Technical Requirements for Registration of
Pharmaceuticals for Human Use, Validation of Analytical Procedures: Text and Methodology, ICH - Q2 (R1), Geneva, 2005.
[3] Method Validation Guidelines, International Conference on Harmonization Geneva, 1996. [4] ICH, Q2A Text on Validation of Analytical Procedures, Oct, 1994. [5] ICH, Q3B Validation of Analytical Procedures: Methodology, Nov, 1996. [6] Snyder, LR.; Kirkland, JJ.; and Glajch, JL. Wiley.1997 , 2nd edition, New York, PP 1-20. [7] Willard, HH.; Merritt, LL.; Dean, JA.; Settle, FA. Instrumental Methods of Analysis.7th ed.; CBS
Publishers and Distributors : Delhi, 2001. [8] Sharma, BK. Instrumental Methods of Chemical Analysis. 21st ed.; Goel Publishing House; Meerut,
2002; PP 3-5. [9] ICH Harmonised Tripartite Guideline Validation of Analytical Procedures: Text and Methodology
Q2 (R1),NOV (2005). [10] European Pharmacopoeia [11] Text and Methodology Q2 (R1),NOV (2005) [12] http://edudrugs.com/S/Sulfametapyrazine/more.html