in new hampshire - employment & training · pdf filestem in new hampshire: a labor...
TRANSCRIPT

STEM in New Hampshire:
A Labor Demand-Supply Analysis
State of New HampshireMargaret Wood Hassan, Governor
New Hampshire Employment SecurityGeorge N. Copadis, Commissioner
Economic and Labor Market Informati on BureauBruce R. DeMay, Director
April 2013
SCIENCE TECHNOLOGY ENGINEERING MATHEMATICS

Economic and Labor Market Informati on Bureau, New Hampshire Employment Security
STEM in New Hampshire: A Labor Demand-Supply Analysis
AcknowledgmentsThe following New Hampshire Employment Security staff members were instrumental in producing this publication:
Economic and Labor Market Information BureauKatrina Evans, Assistant DirectorAnnette Nielsen, EconomistAnita Josten, Research AnalystElisabeth Richardson, Informational/Web Site Representative
For further information about this analysis contact:
Annette Nielsen (603) [email protected]
Anita Josten(603) [email protected]
Katrina Evans(603) [email protected]
Economic and Labor Market Information BureauNew Hampshire Employment Security32 South Main StreetConcord, New Hampshire 03301(603) [email protected]/elmi
This workforce product was funded by a grant awarded by the U.S. Department of Labor’s Employment and Training Administration. The product was created by the grantee and does not necessarily reflect the official position of the U.S. Department of Labor. The Department of Labor makes no guarantees, warranties, or assurances of any kind, express or implied, with respect to such information, including any information on linked sites and including, but not limited to, accuracy of the information or its completeness, timeliness, usefulness, adequacy, continued availability, or ownership. This product is copyrighted by the institution that created it. Internal use by an organization and/or personal use by an individual for non-commercial purposes is permissible. All other uses require the prior authorization of the copyright owner.
STEM in New Hampshire: A Labor Demand-Supply Analysis
Economic and Labor Market Informati on Bureau, New Hampshire Employment Security i
Table of ContentsExecuti ve Summary . . . . . . . . . . . . . . . . . . . . . . . . . . . . . . . . . . . . . . ii
Introducti on . . . . . . . . . . . . . . . . . . . . . . . . . . . . . . . . . . . . . . . . . . 1
Defi ning STEM Occupati ons . . . . . . . . . . . . . . . . . . . . . . . . . . . . . . . . . . 2
Demand for Workers in STEM Occupati ons . . . . . . . . . . . . . . . . . . . . . . . . . 5
Skills and Knowledge Assessment . . . . . . . . . . . . . . . . . . . . . . . . . . 10
Occupati onal Licensing – Another Sign of Specializati on. . . . . . . . . . . . . . 15
The Pipeline of New STEM Workers: Educati onal Completers . . . . . . . . . . . . . . 16
Labor Market Supply for STEM Occupati ons . . . . . . . . . . . . . . . . . . . . 18
Experienced Supply: Unemployment Rates by STEM Occupati onal Groups . . . 25
Translati ng Occupati onal Demand into Industry Demand: a STEM Job Multi plier . . . 26
Real-World STEM: Wages, Locati on Quoti ents, and Online Job Posti ngs . . . . . . . . 31
Conclusion. . . . . . . . . . . . . . . . . . . . . . . . . . . . . . . . . . . . . . . . . . . 37
Appendices
Appendix A: Occupati ons by STEM Group (BLS Defi niti on) . . . . . . . . . . . . 40
Appendix B: Demand Data Table . . . . . . . . . . . . . . . . . . . . . . . . . . . 45
Appendix C: Supply-Demand Comparison. . . . . . . . . . . . . . . . . . . . . . 52
Appendix D: REMI Methodology . . . . . . . . . . . . . . . . . . . . . . . . . . . 57

ii Economic and Labor Market Informati on Bureau, New Hampshire Employment Security
STEM in New Hampshire: A Labor Demand-Supply Analysis
Executi ve SummaryThere has been a renewed emphasis on the need for both education and jobs in Science, Technology, Engineering and Mathematics (STEM) among political stakeholders, educators, and employers. With the variety of stakeholders involved with this one topic, this analysis is an attempt to bridge the differences between the business demand for qualified workers in STEM occupations and educational institutions providing programs in STEM subjects.
To analyze supply and demand, STEM occupations were grouped into three clusters based on the Bureau of Labor Statistics definition of STEM occupations: Life/Physical Science, Engineering, Architecture,
Math, and Information Technology cluster
Social Science cluster
Health cluster
The Health cluster, which is excluded from some definitions of STEM, was included here because analysis shows that workers in health care are required to have many of the same skills and knowledge areas as workers in other STEM occupations, as well as needing advanced educational preparation and occupational licensure to practice.
Demand for STEM WorkersIn New Hampshire, occupations identified as STEM are projected to have a stronger demand than the average for all occupations between 2010 and 2020, according to the latest occupational employment projections. STEM occupations are expected to grow by
17.3 percent, compared to 10.4 percent for the state as a whole.
STEM occupations are expected to account for 3,180 of the 22,759 projected annual job openings in New Hampshire, or about 14 percent. Life/Physical Science, Engineering,
Architecture, Math, and Information
Technology occupations are projected to have 1,507 annual job openings.
Social Science occupations are projected to have 71 annual job openings.
Health occupations are projected to have 1,602 annual job openings.
Among the workers’ occupations, four out of five are in occupations with “very favorable” employment opportunities expected, compared to two out of five among all occupations.
Of the estimated annual job openings for STEM occupations, more than half are Research, Development, Design, or Practitioner occupations, and just over a quarter are Technologist and Technician occupations.
About 27 percent of projected STEM job openings are in occupations requiring an Associate’s degree, about 42 percent are in occupations requiring a Bachelor’s degree, and about 16 percent are in occupations requiring an advanced degree (beyond a baccalaureate).
Among the STEM occupations, approximately 35 percent must be licensed, certified, or registered in New Hampshire, compared to 20 percent of all occupations.
Supply of STEM WorkersIn 2011, about 4,600 New Hampshire students were awarded degrees in educational programs corresponding to entry-level qualifications for STEM occupations. Of those: 2,150 completers were awarded a degree in
an instructional program that corresponded to entry-level employment requirements for Life/Physical Science, Engineering, Architecture, Math, and Information Technology occupations;
530 completers were awarded a degree in an instructional program that corresponded to entry-level employment requirements for Social Science occupations; and
1,920 completers were awarded a degree in an instructional program that corresponded

STEM in New Hampshire: A Labor Demand-Supply Analysis
Economic and Labor Market Informati on Bureau, New Hampshire Employment Security iii
to entry-level employment requirements for Health occupations.
To estimate the pipeline of workers into the labor market, postsecondary educational program completers at New Hampshire colleges and universities were used as a proxy for labor market entrants. Program completers were matched to occupations based on academic major, using a crosswalk that identifies the specific educational program(s) that prepare students to become employed in an occupation. In addition, for a completer to be considered available as labor supply, the award level needed to correspond to or be higher than the entry-level educational qualification for each occupation, as defined by the Bureau of Labor Statistics.
Not all of the STEM occupations in New Hampshire had corresponding program completers with the degree needed for entry-level employment. In some cases, the program was offered, but at lower educational level than the entry-level requirement. In other cases, a program meeting the requirement was offered, but there were no New Hampshire completers in 2011.
Also contributing to meeting the demand for workers in STEM occupations are those already in the labor force. The supply of experienced STEM workers was examined using the unemployment rates of workers in four occupational groups: Computer and mathematical science occupations, Architecture and engineering occupations, Life, physical, and social service occupations, and Healthcare practitioner and technical occupations. New Hampshire’s average annual unemployment rate in 2012 among these occupations was 2.7 percent, well below the statewide average rate of 5.6 percent for all occupations.
Translati ng Occupati onal Demand into Industry DemandThe final step in the analysis of supply and demand was to determine the economic impact of STEM workers on the New Hampshire economy. First, industry staffing patterns were used to identify the industries most likely to employ workers in STEM occupations. Annual openings for STEM occupations were distributed across employing industries. 39.8 percent of STEM annual openings were in
the Health care and social assistance sector 17.3 percent of STEM annual openings were in
the Professional and business services sector 9.5 percent of STEM annual openings were in
the Manufacturing sector.
Then, the REMI econometric model was used to develop a counterfactual simulation to estimate the multiplier effect of not filling a STEM job opening on the economy. In this counterfactual scenario, annual average job openings for STEM occupational employment by industry were removed from the REMI model baseline. For each STEM job opening not filled, the impact on New Hampshire’s economy averaged 1.77 jobs (including the STEM job opening) over the ten-year period. *
ConclusionIn New Hampshire, workers in STEM occupations: are more likely to have higher levels of
education, have the skills and knowledge most in demand,
and are expected to have very favorable
employment opportunities between 2010 and 2020.
* This multiplier is a conservative estimate. The multiplier effect is likely higher as the model’s baseline employment was reduced by industry, and not occupation. The majority of STEM occupations are paid wages higher than the average, whereas the REMI policy employment variable is based on average pay in each industry.

iv Economic and Labor Market Informati on Bureau, New Hampshire Employment Security
STEM in New Hampshire: A Labor Demand-Supply Analysis
The supply of labor, measured by postsecondary educational program completers from New Hampshire educational institutions, was also positive. Supply exceeded demand in each of the three STEM clusters — Life/Physical Science, Architecture, Engineering, Math and IT occupations; Social Science occupations, and Health occupations. This was not the case for the individual occupations, where some had an over-supply of entrants and others had no supply.
However, these program completers are not all expected to seek employment here in New Hampshire. In addition, there is a lack of population growth among the state’s primary and secondary school-age students, impacting the future supply pipeline into the labor force.
New Hampshire faces a potential labor shortage in the future, and STEM occupations are no exception. This problem cannot be addressed from just one perspective. The business community must ensure that the education community understands expectations for worker skills and abilities, and be willing to hire graduates with little or no experience. The education community must understand the skills and abilities expected by business, and be prepared to adjust curricula to meet those expectations, as well as provide students opportunities to gain work experience. Both sides of the labor equation — demand and supply — will have to work together to achieve success.

STEM in New Hampshire: A Labor Demand-Supply Analysis
Economic and Labor Market Informati on Bureau, New Hampshire Employment Security 1
As far back as the first Congressional address given by President George Washington,1 emphasis has been placed on an American population highly educated in math and science because it was considered the path to new innovations and prosperity. Americans invented products such as the typewriter, the revolver, the telegraph, vulcanized rubber, and the telephone. In the first half of the 20th century, demands of two world wars brought forth the continued need for excellence in math and science disciplines.2 As the United States entered the race to space with the Soviet Union in the late 1950s, astronauts became American heroes, and the National Defense Education Act appropriated funding to improve science, mathematics, and foreign language instruction in elementary and secondary schools.3
New Hampshire has been the home of many inventors, including Samuel Morey (internal combustion engine), Sylvester Marsh (cog rail mechanism), David Goodell (apple-parer), Benjamin Palmer (artificial leg), Neil Tillotson (latex balloon), and Dean Kamen (ambulatory infusion pump, portable dialysis machine, the Segway, and more).4 Earl Silas Tupper (Tupperware) was born in New Hampshire.5
As technology has advanced more quickly, so has the expansion and evolution within science and mathematics education disciplines. The emphasis on science and mathematics education has evolved, merging with theory, practical application, and instructional methodology. Today, there is a renewed emphasis on the need
1. U.S. President George Washington, First Annual Message to Congress on the State of the Union, January 8, 1790. The American Presidency Project. <www.presidency.ucsb.edu/ws/index.php?pid=29431>.
2. Roosevelt, F.D. (1945) Science The Endless Frontier A Report to the President. Vannevar Bush, Director of the Office of Scientific Research and Development, July 1945. United States Government Printing Office, Washington: 1945. <www.nsf.gov/od/lpa/nsf50/vbush1945.htm>.
3. US Department of Education. The Federal Role in Education. <www2.ed.gov/about/overview/fed/role.html>.4. Karlon, Marty, “Invented Here.” NHMagazine.com. January 1, 2011. <www.nhmagazine.com/people/903944-113/invented-
here.html>.5. PBS. “American Experience.” <www.pbs.org/wgbh/americanexperience/features/biography/tupperware-tupper/>.
Introducti onfor people educated in the fields of Science, Technology, Engineering, and Mathematics, known as STEM. Workers with advanced skills and knowledge in STEM fields are vital to keeping America’s workforce competitive.
This study is an assessment of the current status of STEM in New Hampshire from a labor force perspective, comparing the supply of and demand for workers with STEM knowledge and abilities. First, STEM occupations are defined. Then, demand for workers in STEM occupations for New Hampshire is estimated, using projections of occupational employment for 2010 to 2020. These data are measured against a proxy of worker supply, a measurement of students at New Hampshire institutions completing postsecondary education programs that prepare them for employment in STEM occupations. Finally, these data will be used to estimate the contribution of STEM workers to the New Hampshire economy.
The goal of this assessment is to provide a point-in-time picture of the supply and demand for STEM workers in New Hampshire — to determine if supply exceeds demand, or if there is more demand than supply. This study is not intended as a critique of the education community, nor of business practices. It is, however, hoped that by identifying labor supply and demand, educational institutions and employers will develop a common understanding and be encouraged to work together to fill labor force gaps, making New Hampshire more competitive in a global economy.

2 Economic and Labor Market Informati on Bureau, New Hampshire Employment Security
STEM in New Hampshire: A Labor Demand-Supply Analysis
STEM has re-emerged as a prominent issue among the political stakeholders, educators, and employers. Yet those discussing, promoting, or analyzing the demand for and supply of workers in STEM are not always using the same definitions. Some STEM definitions are quite broad, while others are very specific. STEM has been used in reference to secondary students’ level of science, technological, and math expertise (or lack thereof) prior to entering postsecondary institutions. It has also been used to refer to the number of postsecondary graduates with degrees in science, technology, engineering, or math. At other times, STEM refers to the apparent insufficient number of workers with necessary experience in engineering to meet employer needs.
To analyze supply and demand, a labor market definition of STEM is most appropriate. The STEM definition published by the Bureau of Labor Statistics was selected,6 as this definition provides a broad range of occupations covering a measurable portion of the New Hampshire economy, and is based on standard occupational coding methodology. The 2012 STEM definition was developed upon request from the Office of Management and Budget to the Standard Occupational Classification Policy Committee (SOCPC). A STEM workgroup was established, representing members from federal agencies related to workforce and economic development as well as national stakeholders such as the National Center for Education Statistics, the National Science Foundation, and the National Center for Science and Engineering Statistics.7
The STEM workgroup developed a framework to identify STEM occupations using two major STEM domains, or areas of expertise, with each domain including two sub-domains. Then, five types of
6. US Bureau of Labor Statistics, Standard Occupational Classification Crosswalks. <www.bls.gov/soc/#crosswalks>.7. SOC Policy Committee, Options for Defining STEM (Science, Technology, Engineering, and Mathematics) occupations under
the 2010 Standard Occupational Classification (SOC) system, Attachment A. <www.bls.gov/soc/Attachment_A_STEM.pdf>.
Defi ning STEM Occupati ons
Data Sources and Classifi cati on Systems To evaluate an esti mate of demand for and supply of workers in STEM occupati ons, data were drawn from three sources, each of which uses a diff erent taxonomy. Demand data are from projecti ons of occupati onal demand for New Hampshire, 2010 – 2020. Projecti ons of industry and occupati onal employment are developed biennially by New Hampshire Employment Security’s Economic and Labor Market Informati on Bureau. Supply data are based on postsecondary educati onal program completers for 2011 at New Hampshire colleges and universiti es. These data are reported to and compiled by the Integrated Postsecondary Educati onal Data System (IPEDS), Nati onal Center for Educati on Stati sti cs, US Department of Educati on. Finally, economic impact is assessed by industry using the North American Industry Classifi cati on System (NAICS).
The fi rst hurdle for such an analysis is that labor demand — occupati onal data — is classifi ed using the 2010 Standard Occupati onal Classifi cati on (SOC), while new labor supply — educati onal program completers — is classifi ed using the 2010 Classifi cati on of Instructi onal Programs (CIP). To determine if the supply of new labor (educati onal completers) is adequate for worker demand (projected job openings), the CIP-SOC crosswalk was used.a
continued on page 3
a. The CIP-SOC crosswalk used was jointly developed by the Bureau of Labor Stati sti cs and the Nati onal Center for Educati on Stati sti cs. For more informati on, visit the NCES website: nces.ed.gov/ipeds/cipcode/resources.aspx?y=55.

STEM in New Hampshire: A Labor Demand-Supply Analysis
Economic and Labor Market Informati on Bureau, New Hampshire Employment Security 3
occupations were identified, based on educational attainment and method of work.8
The framework used the same guidelines as those for structuring the Standard Occupational Classification (SOC) System. Most significantly, STEM occupations were selected based on SOC Classification Principle 2, which states, “Occupations are classified based on the work performed and, in some cases on the skills, education, and/or training needed to perform the work at a competent level.” 9
The STEM domains and sub-domains in this classification are:
Science, Engineering, Mathematics, and Information Technology Domain1. Life and Physical Science, Engineering,
Mathematics, and Information TechnologyOccupations
2. Social Science Occupations
Science- and Engineering-Related Domain3. Architecture Occupations4. Health Occupations
In addition to being divided by domain, STEM occupations were further classified by type of occupation:
A. Research, Development, Design, or Practitioner Occupations
B. Technologist and Technician OccupationsC. Postsecondary Teaching OccupationsD. Managerial OccupationsE. Sales Occupations
The STEM workgroup identified 184 SOC occupations as STEM, and identified a domain, sub-domain, and type for each occupation.10 There were three detailed SOC occupations that fit equally well in multiple sub-domain and occupational type groups: Architectural and engineering managers, Architectural and civil drafters, and Life, physical, and social science technicians, all other. The framework assigned
conti nued from page 2
According to the Guidelines for Using the CIP-SOC Crosswalk:
A CIP-SOC relationship must indicate
a ‘direct’ relationship, that is, programs
in the CIP category are preparation …
for entry into and performance in jobs in
the SOC category. The programs satisfy
requirements for entry and/or prepare
individuals to meet licensure or certification
requirements to work in the occupation.
It is possible that there may be no
direct correspondence between a CIP Code
and a SOC code. This may occur because
the occupation does not require any
postsecondary education, because the CIP
program is not career related, or because
an insufficient number of institutions offer
the program, to justify having a CIP Code.
Relationships between CIP and
SOC may be one-to-one, one-to-many,
many-to-one, or many-to-many. Since
SOC codes tend to be more specific than
CIP codes, it is likely that one CIP code
will map to multiple SOC codes. This is
in part because the CIP codes describe
instructional programs that will often
provide training that can be applied to
multiple occupations.b
Thus, the measure of labor supply is based on a count of students completi ng postsecondary educati on who majored in an instructi onal program that has prepared the student to enter an occupati on identi fi ed as STEM in the defi niti on selected for this analysis. For example, a student att aining a degree in Physical therapy is most likely
conti nued on page 4
b. National Center for Education Statistics, CIP User Site. <nces.ed.gov/ipeds/cipcode/resources.aspx?y=55>.
8. Ibid.9. US Bureau of Labor Statistics, 2010 SOC User Guide. <www.bls.gov/soc/soc_2010_user_guide.pdf>.10. For a complete list of the STEM occupations as identified by the STEM workgroup, see Appendix A.

4 Economic and Labor Market Informati on Bureau, New Hampshire Employment Security
STEM in New Hampshire: A Labor Demand-Supply Analysis
“part” of the employment in these occupations into multiple groups.
New Hampshire demand data were available for 130 STEM occupations, which were organized into the following three groups: Life/Physical Science, Architecture,
Engineering, Mathematics, and Information Technology Occupations
Social Science Occupations
Health Occupations
Because the Architecture sub-domain includes just five occupations, it was combined with Life/Physical Science, Engineering, Mathematics, and Information Technology occupations. There were several reasons for making this combination. First, two of the five Architecture occupations (Architectural and engineering managers, and Architectural and civil drafters) are included in part with Life/Physical Science, Engineering, Mathematics, and Information Technology occupations. Second, three of the five Architecture occupations are classified in the Architecture and Engineering occupations SOC job family (17-0000), a major occupational group having similar educational requirements, and dominated by engineering occupations. Finally, due to the fact that the majority of STEM occupations have a relatively low employment level in New Hampshire, combining STEM occupations into fewer groups provides a larger employment base for analysis, and helps avoid potential data confidentiality issues.
In many STEM definitions, Health occupations are excluded, however, Health occupations are included in this analysis for two reasons. First, workers in Healthcare Practitioner and Technical occupations (SOC job family 29-000) are required to have an educational background in sciences, technology, engineering, and mathematics similar to that of many engineers or life and physical scientists. Second, health care represents a significant portion of employment in New Hampshire — in 2011, the Health care and social assistance industry sector was the second-largest private employment sector in
the state, after Retail trade. The majority of this analysis examines the three occupational groups separately, to inform both those who consider Healthcare a part of STEM, and those who do not.
conti nued from page 3
to be employed as a Physical therapist (a one-to-one relati onship). On the other hand, a student att aining a degree in Biology may fi nd employment as a Biological scienti st, a Secondary school teacher, or a Natural sciences manager (a one-to-many relati onship).
The next hurdle in this analysis was that STEM employment by occupati on had to be translated into industry data to assess the economic impact of STEM workers. Industry data are classifi ed in a third taxonomy, the North American Industrial Classifi cati on System, or NAICS. The connecti on between occupati on and industry is determined by occupati onal staffi ng patt erns.
The Occupati onal Employment Stati sti cs (OES) Program, conducted in New Hampshire under cooperati ve agreement with the US Bureau of Labor Stati sti cs, collects informati on from New Hampshire employers, who have been identi fi ed by industry, on the occupati ons of workers employed there. These data are compiled to create an occupati onal staffi ng patt ern for all non-farm industries, measuring the share of each industry’s total employment held by each occupati on. These data can then be inverted to show the industries in which workers engaged in each occupati on are usually employed. These inverse staffi ng patt erns may indicate numerous industries employing workers in an occupati on, or a small number of industries employing workers in another occupati on. For example, Accountants and auditors are employed by businesses in nearly 70 diff erent industries, while Audiologists are employed by businesses in just two industries.

STEM in New Hampshire: A Labor Demand-Supply Analysis
Economic and Labor Market Informati on Bureau, New Hampshire Employment Security 5
To determine the level of demand, long-term projections of New Hampshire employment by occupation for 2010 to 2020 were used.11 Among all occupations in New Hampshire in 2010, there were about 662,150 workers. This number is expected to grow to 730,700 by 2020, a ten-year growth rate of 10.4 percent, and an increase of 68,500 workers. On average, 22,760 workers will be needed to fill available job openings annually. New job growth will create an estimated annual 7,100 openings, while the need to replace workers who leave jobs, either to retire or for other reasons, will create an estimated 15,650 job openings annually.
Among the defined STEM occupations, there were about 84,800 workers in 2010, and that number is expected to increase to 99,500 by 2020. This is a ten-year growth rate of a little over 17 percent, an increase of 14,660 workers. An average of 3,180 workers will be needed annually to fill available job openings. Of those, about 1,500 will be new job openings and 1,700 will be replacement job openings. 12
11. Occupational projections data include the self-employed.12. A detailed listing of projected demand for workers in individual STEM occupations is available in Appendix B.13. Total annual openings are an estimated number of new workers needed annually for each occupation. The total estimate is
the sum of openings due to new job growth and openings due to replacement needs. A replacement is a job opening created by a worker who permanently leaves an occupation because of retirement, death, or exiting the workforce. This estimate does not include turnover, or workers moving from one job to another within the same occupation. Annual openings are also not the same as job postings, which are advertisements for jobs.
New Hampshire Long-term Occupati onal Projecti ons, 2010 to 2020
Occupati onal categories 2010 Base2020
ProjectedTotal
Change Percent
Average Annual Openings
Growth Replacements Total
Life/Physical Sciences, Architecture, Engineering, Math, and IT occupati ons 43,037 49,396 6,359 14.8% 636 871 1,507
Social Science Occupati ons 1,895 2,139 244 12.9% 23 48 71
Health Occupati ons 39,901 47,962 8,061 20.2% 804 798 1,602
STEM Occupati ons, Total 84,833 99,497 14,664 17.3% 1,463 1,717 3,180
Total, All Occupati ons 662,146 730,710 68,564 10.4% 7,109 15,650 22,759
In this assessment, total projected annual job openings are used to estimate labor demand for STEM workers. Among the three defined STEM occupational clusters, Health occupations are expected to have 1,600 job openings annually. Life/Physical Sciences, Architecture, Engineering, Math, and IT occupations are expected to have almost the same number, with 1,500 job openings, while Social Science occupations are expected to have fewer than 100 job openings annually. Life/Physical Sciences, Architecture, Engineering, Math, and IT occupations are expected to have more openings from replacements (870) than from growth (640), while Health occupations are expected to have about an equal number of openings from replacements and growth (800).
To gain a perspective of how the demand for workers in STEM occupations compares to other parts of the labor market, projections data for STEM occupations and all occupations were compiled. The comparisons were based on projected employment opportunity (occupational descriptors); projected annual job openings by job family; and projected annual job openings for STEM by entry-level educational requirement. 13
Demand for Workers in STEM Occupati ons

6 Economic and Labor Market Informati on Bureau, New Hampshire Employment Security
STEM in New Hampshire: A Labor Demand-Supply Analysis
Projected Employment Opportunity for STEM Occupati ons As part of the projections process, occupations are assigned a measure of employment opportunity known as “occupational descriptors,” based on the projected growth rate and the average number of annual openings. Five ranges of projected growth are combined with five ranges of annual openings into four categories of favorability for employment opportunity. These categories are Very favorable, Favorable, Less favorable, and Not favorable. 14
Occupations with Very favorable job opportunities are expected to have higher than the average growth rate for all occupations and more job openings than the average for all occupations
Employment opportuniti es for STEM occupati ons are expected to be more favorable than opportuniti es for all occupati ons.
79.9%
38.7%
15.6%
50.7% 9.1%
3.4%
1.1%
1.6%
Share of STEM2010 Employment
Share of Total2010 Employment
Very Favorable Favorable Less Favorable Not Favorable
14. Additional information about the Occupational Descriptors can be found in New Hampshire Employment Projections by Industry and Occupation, Base Year 2010 to Projected Year 2020, <www.nhes.nh.gov/elmi/products/documents/projections.pdf>, page 8.
from 2010 to 2020. Among the 130 STEM occupations in New Hampshire, four out of five workers were in occupations with a Very favorable outlook. Among all occupations, only two out of five workers were in occupations with a Very favorable outlook. All of the three STEM clusters are expected to grow at a faster rate than the growth rate for Very favorable occupations (11.1 percent). But there are some specific STEM occupations within each cluster that have low levels of employment. As a result, these individual occupations will not produce many job openings despite a high rate of growth, and so are not considered Very favorable occupations.
STEM in New Hampshire: A Labor Demand-Supply Analysis
Economic and Labor Market Informati on Bureau, New Hampshire Employment Security 7
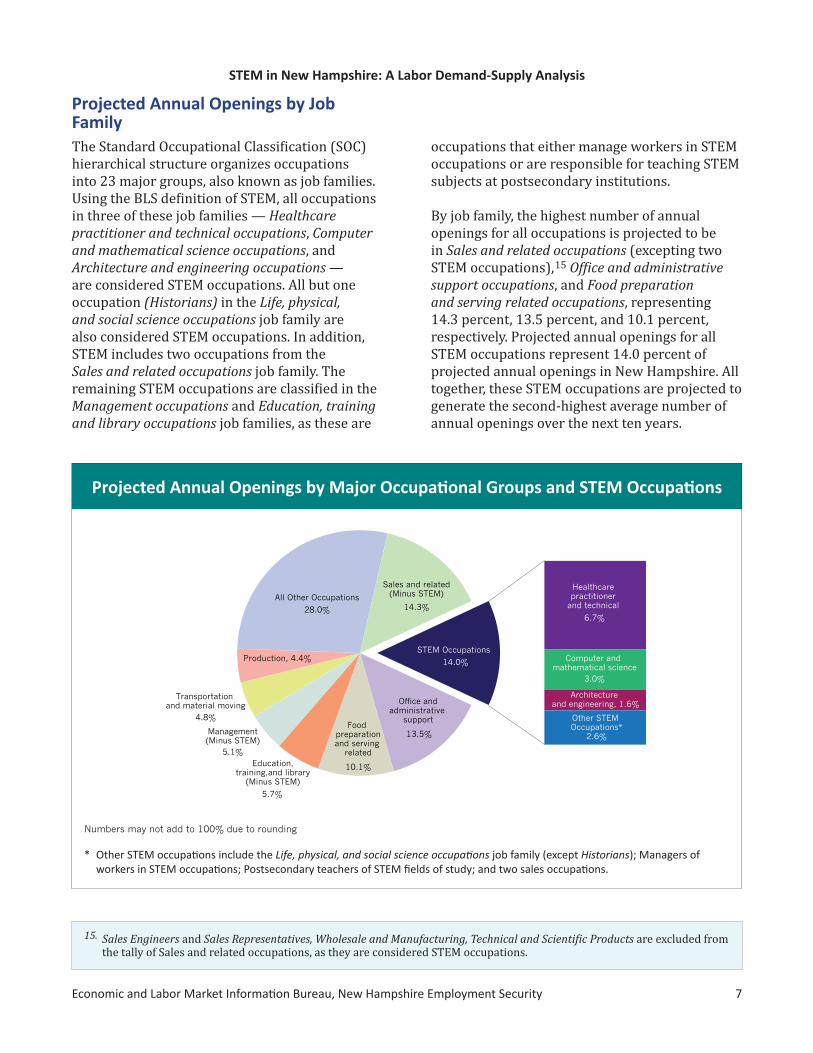
Projected Annual Openings by Job FamilyThe Standard Occupational Classification (SOC) hierarchical structure organizes occupations into 23 major groups, also known as job families. Using the BLS definition of STEM, all occupations in three of these job families — Healthcare practitioner and technical occupations, Computer and mathematical science occupations, and Architecture and engineering occupations — are considered STEM occupations. All but one occupation (Historians) in the Life, physical, and social science occupations job family are also considered STEM occupations. In addition, STEM includes two occupations from the Sales and related occupations job family. The remaining STEM occupations are classified in the Management occupations and Education, training and library occupations job families, as these are
15. Sales Engineers and Sales Representatives, Wholesale and Manufacturing, Technical and Scientific Products are excluded from the tally of Sales and related occupations, as they are considered STEM occupations.
Projected Annual Openings by Major Occupati onal Groups and STEM Occupati ons
Education,training,and library
(Minus STEM)
5.7%
Management(Minus STEM)
5.1%
Transportation and material moving
4.8%
Production, 4.4%STEM Occupations
14.0%
Other STEM Occupations*
2.6%
Architecture and engineering, 1.6%
Computer and mathematical science
3.0%
Healthcare practitioner
and technical
6.7%
All Other Occupations
28.0%
Sales and related(Minus STEM)
14.3%
Office andadministrative
support
13.5%Food
preparationand serving
related
10.1%
occupations that either manage workers in STEM occupations or are responsible for teaching STEM subjects at postsecondary institutions.
By job family, the highest number of annual openings for all occupations is projected to be in Sales and related occupations (excepting two STEM occupations), 15 Office and administrative support occupations, and Food preparation and serving related occupations, representing 14.3 percent, 13.5 percent, and 10.1 percent, respectively. Projected annual openings for all STEM occupations represent 14.0 percent of projected annual openings in New Hampshire. All together, these STEM occupations are projected to generate the second-highest average number of annual openings over the next ten years.
Numbers may not add to 100% due to rounding
* Other STEM occupati ons include the Life, physical, and social science occupati ons job family (except Historians); Managers of workers in STEM occupati ons; Postsecondary teachers of STEM fi elds of study; and two sales occupati ons.

8 Economic and Labor Market Informati on Bureau, New Hampshire Employment Security
STEM in New Hampshire: A Labor Demand-Supply Analysis
Projected Annual Openings by Occupati on Type
59.9% 27.5% 5.3% 5.3%
2.0%
STE
M O
pen
ings
by
Typ
e of
Wor
k per
form
ed
A. Research, Development, Design, or Practitioner Occupations
B. Technologist and Technician Occupations
C. Postsecondary Teaching Occupations
D. Managerial Occupations
E. Sales Occupations
By type of work performed, the majority of STEM occupations are Research, Development, Design, or Practitioner occupations, accounting for more than half of projected STEM openings. Just over a quarter of annual job openings for STEM
occupations are in Technologist and Technician occupations. STEM occupations in Sales, Managerial, and Postsecondary Teaching all have significantly smaller shares of total projected STEM job openings.
STEM in New Hampshire: A Labor Demand-Supply Analysis
Economic and Labor Market Informati on Bureau, New Hampshire Employment Security 9
STEM Openings (Demand) by Entry-Level Educati onal Requirement
Master's degree
3.8%
Doctoral orprofessional degree
Bachelor'sdegree
41.9%
Associate'sdegree
27.4%
High school diplomaor equivalent
Postsecondary non-degree award
3.7%
Some college, no degree
8.2%
12.8%
2.2%
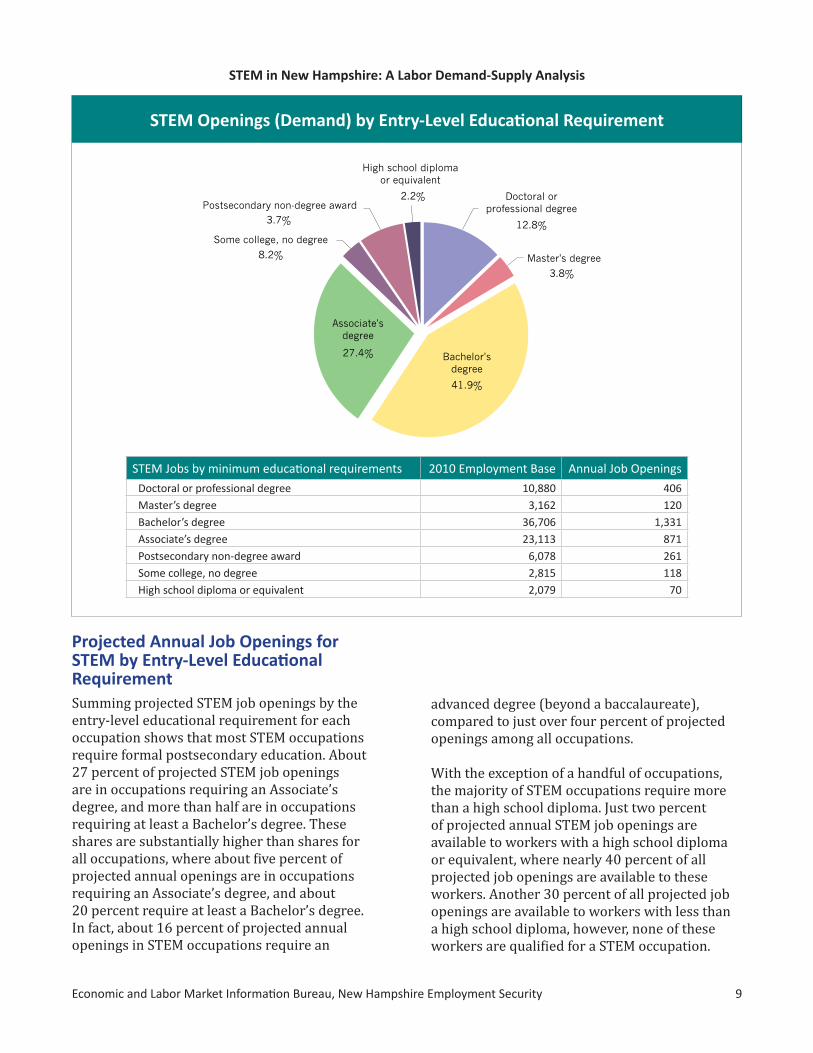
Projected Annual Job Openings for STEM by Entry-Level Educati onal RequirementSumming projected STEM job openings by the entry-level educational requirement for each occupation shows that most STEM occupations require formal postsecondary education. About 27 percent of projected STEM job openings are in occupations requiring an Associate’s degree, and more than half are in occupations requiring at least a Bachelor’s degree. These shares are substantially higher than shares for all occupations, where about five percent of projected annual openings are in occupations requiring an Associate’s degree, and about 20 percent require at least a Bachelor’s degree. In fact, about 16 percent of projected annual openings in STEM occupations require an
advanced degree (beyond a baccalaureate), compared to just over four percent of projected openings among all occupations.
With the exception of a handful of occupations, the majority of STEM occupations require more than a high school diploma. Just two percent of projected annual STEM job openings are available to workers with a high school diploma or equivalent, where nearly 40 percent of all projected job openings are available to these workers. Another 30 percent of all projected job openings are available to workers with less than a high school diploma, however, none of these workers are qualified for a STEM occupation.
STEM Jobs by minimum educati onal requirements 2010 Employment Base Annual Job Openings
Doctoral or professional degree 10,880 406Master’s degree 3,162 120Bachelor’s degree 36,706 1,331Associate’s degree 23,113 871Postsecondary non-degree award 6,078 261Some college, no degree 2,815 118High school diploma or equivalent 2,079 70

10 Economic and Labor Market Informati on Bureau, New Hampshire Employment Security
STEM in New Hampshire: A Labor Demand-Supply Analysis
Skills and Knowledge Assessment Employment projections provide a picture of the required education and employment opportunities for workers in 2020. But what are some common worker traits among the STEM occupations that will be higher in demand than others? To help assess the knowledge and skills in demand for STEM occupations, the Skills-Based Projections16 system was used. The application uses state occupational employment projections in combination with occupational knowledge,
16. The Skills-Based Projections (SBP) software utilizes state occupational projections and O*Net as the two primary input data sources. O*Net is used in the generation of a broad array of career information products. It provides more than one hundred measures of knowledge, skills and work activities (collectively referred to as KSW) specific to 726 SOC-based occupations. Simply, the SBP software uses the SOC-based occupation to attach state employment projections to KSW’s in the O*Net database. For each specific knowledge, skill and work activity, the SBP creates a set of links to all occupations for which it is required. The SBP then estimates base and projected skill demand by summing the employment levels for the linked occupations.
The current version of the Skills-Based Projections (SBP) software used an earlier version of the O*Net database (see technical note <dev.projectionscentral.com/sbproj/downloads/SBP_2_ReleaseNotes.pdf >), resulting in approximately 14.5 percent of the occupational employment not being imported, and therefore not part of the analysis. The majority of the occupations not imported are residual, or All Other, occupations, representing a collection of related, yet distinct occupations, for which O*Net cannot produce worker requirements.
skills, and work activities from O*Net to assess future demand for specific skills and knowledge.
O*Net, the Occupational Information Network, is a compilation of the characteristics of occupations, the mix of knowledge, skills, and abilities required for each, and the variety of activities and tasks performed by workers in each occupation. The O*Net Content Model defines worker requirements as “developed or acquired attributes of an individual that may be related
All Occupati ons - 2010-2020 NH OutlookSkills Gap Index*
Skill Index Defi niti on Reading Comprehension 100.0 Understanding writt en sentences and paragraphs in work related documents.
Acti ve Listening 97.1 Giving full att enti on to what other people are saying, taking ti me to understand the points being made, asking questi ons as appropriate, and not interrupti ng at inappropriate ti mes.
Criti cal Thinking 94.3 Using logic and reasoning to identi fy the strengths and weaknesses of alternati ve soluti ons, conclusions or approaches to problems.
Speaking 91.4 Talking to others to convey informati on eff ecti vely.
Acti ve Learning 88.6 Understanding the implicati ons of new informati on for both current and future problem-solving and decision-making.
Coordinati on 85.7 Adjusti ng acti ons in relati on to others' acti ons
Instructi ng 82.9 Teaching others how to do something.
Monitoring 80.0 Monitoring or assessing performance of yourself, other individuals, or organizati ons to make improvements or take correcti ve acti on.
Writi ng 77.1 Communicati ng eff ecti vely in writi ng as appropriate for the needs of the audience.
Time Management 74.3 Managing one's own ti me and the ti me of others.
* As the Skills Gap Index is standardized from 1 to 100, these numeric indicators merely represent a ranking according to overall importance, so these numbers are excluded from the STEM comparison tables.

STEM in New Hampshire: A Labor Demand-Supply Analysis
Economic and Labor Market Informati on Bureau, New Hampshire Employment Security 11
17. The O*Net® Content Model. O*Net Resource Center. <www.onetcenter.org/content.html>.18. Skills Gap Index: For each job requirement, a standardized measure of the difference (gap) between the current supply
and projected demand, calculated in four steps:1. Skill Weight: The proportion of the total current labor force meeting specific job requirement criteria. It is calculated as the job requirement base-year employment divided by total base-year employment.2. Skill Weight Percent Change: Employment change across the projection horizon, weighted by the percentage of total base-year employment. ((Projected Employment - Base Employment)/Base Employment) * Skill Weight 3. Skill Weight Rank: A rank score, of Skill Weight Percent Change, within a job requirement set.4. Skills Gap Index: The Skill Weight Rank is standardized from 1 to 100.
to work performance such as work-related knowledge and skill. Knowledge represents the acquisition of facts and principles about a domain of information. Experience lays the foundation for establishing procedures to work with given knowledge. These procedures are more commonly known as skills.” Thus, workers must have knowledge about the work undertaken, then must apply skills to conduct that work. In the O*Net Content Model, skills are defined as “work-related attributes acquired and/or developed through education and experience,” while knowledge is defined as “acquisition of facts and principles about a domain of information.”17
The Skills Gap Index measures the relative change in demand for an O*Net skill or knowledge. Higher index scores mean a larger change (or gap) between current (2010) employment levels and future (2020) demand for workers with the skill or knowledge, relative to other skills or knowledge. 18 The closer a skill or knowledge is ranked to 100, the more demand there will be for workers with that skill or knowledge. The Skills Gap Index in the Skills-Based Projections suite can be used to measure skills, knowledge areas, or specific work activities.

12 Economic and Labor Market Informati on Bureau, New Hampshire Employment Security
STEM in New Hampshire: A Labor Demand-Supply Analysis
Skills in Demand The Skills Gap Index represents a relative ranking of the difference between the number of workers currently in occupations that require a skill and the future demand for workers with that skill. Skills with the highest ranking will be more in demand in the future. Among all occupations, skills ranking the highest — those with the highest expected future demand — are basic skills and cross-functional skills. In the O*Net content model, basic skills are defined as “capacities that facilitate learning or the more rapid acquisition of knowledge,” and cross-functional skills are defined as “capacities that facilitate performance of activities that occur across jobs.”
Repeating the exercise for the three clusters of STEM occupations, the top ten skills in each
cluster were similar to those of all occupations. Two of the three clusters ranked the same four basic skills the highest: Reading comprehension, Active learning, Active listening, and Critical thinking. The skills in demand for the Social Science occupations cluster were quite different, with Writing, Time management, Speaking, and Social perceptiveness ranking highest in demand. The top ten skills in demand for each of the STEM clusters that did not rank in the top ten for all occupations were Complex problem identification, Social perceptiveness, Persuasion, Learning strategies, and Judgment and decision making. 19 Four of these five skills — excepting Learning strategies, which is a basic skill — are considered cross-functional skills.
19. O*Net defines these skills as followsComplex problem identification: Developed capacities used to solve novel, ill-defined problems in complex, real-world settingsSocial Perceptiveness: Being aware of others’ reactions and understanding why they react as they doLearning Strategies: Selecting and using training/instructional methods and procedures appropriate for the situation when learning or teaching new thingsPersuasion: Persuading others to change their minds or behaviorJudgment and Decision Making: Considering the relative costs and benefits of potential actions to choose the most appropriate one.
Ranking of Skills in Demand by STEM Occupati onal Clusters
Life/Physical Science, Architecture, Engineering, Math and IT Social Science Health
Reading Comprehension Writi ng Reading Comprehension
Acti ve Learning Time Management Acti ve Learning
Acti ve Listening Speaking Acti ve Listening
Criti cal Thinking Social Percepti veness Criti cal Thinking
Coordinati on Reading Comprehension Instructi ng
Complex Problem Identi fi cati on Persuasion Speaking
Writi ng Monitoring Writi ng
Instructi ng Judgment and Decision Making Learning Strategies
Speaking Criti cal Thinking Social Percepti veness
Time Management Coordinati on Coordinati on
Based on the 2010-2020 New Hampshire occupati onal employment projecti ons

STEM in New Hampshire: A Labor Demand-Supply Analysis
Economic and Labor Market Informati on Bureau, New Hampshire Employment Security 13
All Occupati ons - 2010-2020 NH OutlookKnowledge Gap Index*
Knowledge Index Defi niti on
Customer and Personal Service
100.0 Principles and processes for providing customer and personal services. This includes customer needs assessment, meeti ng quality standards for services, and evaluati on of customer sati sfacti on.
English Language 97.0 The structure and content of the English language including the meaning and spelling of words, rules of compositi on, and grammar.
Psychology 93.9 Human behavior and performance; individual diff erences in ability, personality, and interests; learning and moti vati on; psychological research methods; and the assessment and treatment of behavioral and aff ecti ve disorders.
Educati on and Training
90.9 Principles and methods for curriculum and training design, teaching and instructi on for individuals and groups, and the measurement of training eff ects.
Mathemati cs 87.9 Arithmeti c, algebra, geometry, calculus, stati sti cs, and their applicati ons.
Clerical 84.8 Administrati ve and clerical procedures and systems such as word processing, managing fi les and records, stenography and transcripti on, designing forms, and other offi ce procedures and terminology.
Administrati on and Management
81.8 Business and management principles involved in strategic planning, resource allocati on, human resources modeling, leadership technique, producti on methods, and coordinati on of people and resources.
Sales and Marketi ng 78.8 Principles and methods for showing, promoti ng, and selling products or services. This includes marketi ng strategy and tacti cs, product demonstrati on, sales techniques, and sales control systems.
Computers and Electronics
75.8 Circuit boards, processors, chips, electronic equipment, and computer hardware and soft ware, including applicati ons and programming.
Medicine and Denti stry
72.7 The informati on and techniques needed to diagnose and treat human injuries, diseases, and deformiti es. This includes symptoms, treatment alternati ves, drug properti es and interacti ons, and preventi ve health-care measures.
* As the Knowledge Gap Index is standardized from 1 to 100, these numeric indicators merely represent a ranking according to overall importance, so these numbers are excluded from the STEM comparison tables.
Most Common Knowledge Areas in DemandJust as the Skills Gap Index represents a relative ranking of the difference between the number of workers currently in occupations that require a skill and the future demand for workers with that skill, the Knowledge Gap Index represents a relative ranking for knowledge areas. Among all occupations, the work-related knowledge areas ranking highest in demand were Customer and personal service, English language, and Psychology, indicating that more workers will need knowledge in these areas in the future than those competent in the knowledge area now.
When ranking knowledge gaps for each of the three STEM clusters, four knowledge areas are listed among the top ten highest ranking knowledge areas for all three clusters, and for all occupations as well. These knowledge areas are English language, Customer and personal service, Mathematics, and Education and training. This indicates that there will be more need for workers with knowledge in these subjects in the future than there are at present.
14 Economic and Labor Market Informati on Bureau, New Hampshire Employment Security
STEM in New Hampshire: A Labor Demand-Supply Analysis
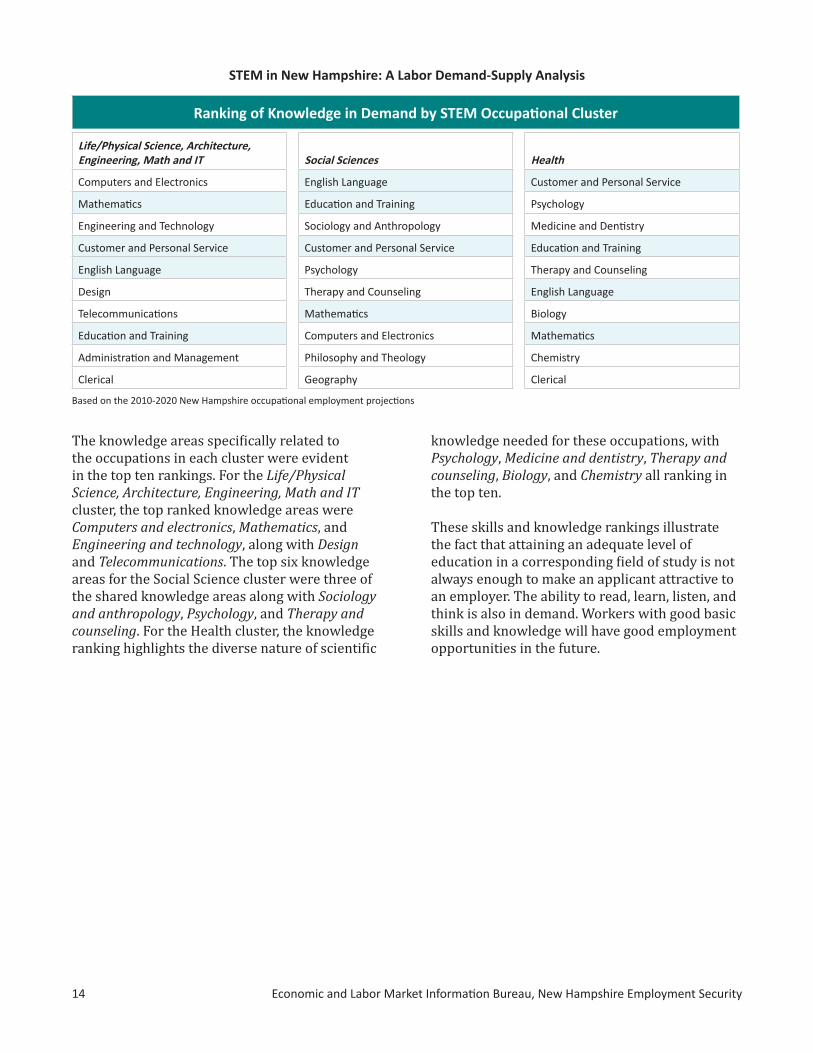
Ranking of Knowledge in Demand by STEM Occupati onal Cluster
Life/Physical Science, Architecture, Engineering, Math and IT Social Sciences Health
Computers and Electronics English Language Customer and Personal Service
Mathemati cs Educati on and Training Psychology
Engineering and Technology Sociology and Anthropology Medicine and Denti stry
Customer and Personal Service Customer and Personal Service Educati on and Training
English Language Psychology Therapy and Counseling
Design Therapy and Counseling English Language
Telecommunicati ons Mathemati cs Biology
Educati on and Training Computers and Electronics Mathemati cs
Administrati on and Management Philosophy and Theology Chemistry
Clerical Geography Clerical
The knowledge areas specifically related to the occupations in each cluster were evident in the top ten rankings. For the Life/Physical Science, Architecture, Engineering, Math and IT cluster, the top ranked knowledge areas were Computers and electronics, Mathematics, and Engineering and technology, along with Design and Telecommunications. The top six knowledge areas for the Social Science cluster were three of the shared knowledge areas along with Sociology and anthropology, Psychology, and Therapy and counseling. For the Health cluster, the knowledge ranking highlights the diverse nature of scientific
knowledge needed for these occupations, with Psychology, Medicine and dentistry, Therapy and counseling, Biology, and Chemistry all ranking in the top ten.
These skills and knowledge rankings illustrate the fact that attaining an adequate level of education in a corresponding field of study is not always enough to make an applicant attractive to an employer. The ability to read, learn, listen, and think is also in demand. Workers with good basic skills and knowledge will have good employment opportunities in the future.
Based on the 2010-2020 New Hampshire occupati onal employment projecti ons

STEM in New Hampshire: A Labor Demand-Supply Analysis
Economic and Labor Market Informati on Bureau, New Hampshire Employment Security 15
Occupati onal Licensing – Another Sign of Specializati onThe State of New Hampshire regulates nearly 150 specific occupational activities by requiring licensure, certification, or registration with a state board or agency. Statutory regulation ranges from simply submitting an application form to extensive educational preparation, passing an examination, obtaining years of experience, and regular completion of continuing education.
About 35 percent of STEM occupations must be licensed, certified, or registered in New Hampshire, compared to about 20 percent of all occupations. Among the STEM occupations requiring licensure in New Hampshire, about half are health-related occupations.
Requirement of an occupational license highlights the difficulty in transferring skills among STEM occupations. These occupations usually require completion of an occupation-specific educational program and passing an examination requiring specific occupational knowledge. For example, a Forest and conservation technician cannot easily qualify as a licensed Respiratory care practitioner, despite the fact that both are classified as Technologists and technicians and both require an
Associate’s degree for entry-level employment. As the educational level required for an occupation rises, the required field of study becomes more specialized, and the ability to transfer skills from one occupation to another becomes increasingly difficult.
Not only is transferring skills more complicated, licensure requirements may also limit where the licensee is able to practice. Occupational licensure is established on a state-by-state basis. For a license issued in one state to be considered valid in another state, reciprocity or endorsement must be allowed. While the State of New Hampshire has reciprocity agreements with other states for some occupations, this is not the case for all occupations. For example, Professional engineers who are licensed in another state, and whose qualifications are equal to or higher than those required by New Hampshire statute and administrative rule, may be licensed in this state upon application and payment of a fee. But for Speech-language pathologists, a license obtained in another state does not qualify the applicant for licensure in this state, as reciprocity is not accepted.

16 Economic and Labor Market Informati on Bureau, New Hampshire Employment Security
STEM in New Hampshire: A Labor Demand-Supply Analysis
Occupational projections provide a basis for evaluating the labor market demand for workers over time. The next step in this labor supply-demand analysis is to determine if there will be qualified workers to fill the projected demand for these jobs.
A majority of STEM occupations require postsecondary education in a particular field of study, or college major. The counts of students completing postsecondary education programs
The Pipeline of New STEM Workers: Educati onal Completers
related to STEM occupations provide a measure of new labor supply. The most comprehensive source for the new labor supply pipeline is completer data reported by postsecondary education institutions and compiled by the National Center for Education Statistics as part of the Integrated Postsecondary Education Data System, or IPEDS. (See the section on Data Sources and Classification Systems on page 2 for further explanation of data classification and crosswalks.)
Sample of SOC - CIP crosswalk matching processStandard Occupati onal Classifi cati on (SOC)
Clas
sifi c
ati o
n of
Inst
ructi
ona
l Pro
gram
s (C
IP)
Occupati onal Title
Computer & Informati on
Systems Managers
Computer & Informati on
Research Scienti sts
Computer Systems Analysts
Architects, except
Landscape & Naval
Architecture Teachers,
PostsecondaryDatabase
AdministratorsRegistered
Nurses
Entry-Level Degree Bachelor’s Doctoral or professional
Bachelor’s Bachelor’s Doctoral or professional
Bachelor’s Associate’s
Program, Degree Conferred & Total Completers
Architecture
Bachelor’s degree 25 25 0
Computer and Informati on Sciences, General
Associate’s degree 10 0 0 0 0
Bachelor’s degree 31 10 0 10 11
Master’s degree 27 9 0 9 9
Doctorate 1 0 1 0 0
Informati on Technology
Bachelor’s degree 8 4 0 4
Registered Nursing / Registered Nurse
Associate’s degree 472 472
Bachelor’s degree 176 176
Master’s degree 88 88
Nursing Science
Bachelor’s degree 94 94
Master’s degree 9 9
Nursing Practi ce
Bachelor’s degree 14 14
Examples represent numbers of completers by degree conferred for select educati onal programs (left column). Shaded blocks indicate educati onal programs corresponding to a STEM occupati on (top row). Numbers in the shaded blocks represent a count of educati onal program completers matching or exceeding the educati on level required to qualify for entry-level employment in the occupati on. If the educati onal program corresponded to multi ple occupati ons, program completers were distributed proporti onately among corresponding occupati ons.

STEM in New Hampshire: A Labor Demand-Supply Analysis
Economic and Labor Market Informati on Bureau, New Hampshire Employment Security 17
As a proxy for labor supply, counts of students completing an educational program at a New Hampshire postsecondary educational institution in 2011 were used to establish a point-in-time estimate of labor available to fill STEM occupations. There are no data available on the exact numbers of students entering the labor force, the state in which they obtained employment, the occupation in which they became employed, or indeed if the student entered the labor force at all. The following assumptions were made for this analysis:
1. Students awarded degrees from New Hampshire postsecondary institutions in 2011 would enter the labor force, as opposed to continuing their education to earn a higher degree, entering the military, or choosing an entirely different line of work.
2. It was assumed that the number of students awarded degrees in New Hampshire in specific educational programs would enter the labor force in New Hampshire.
3. Only primary majors of dual-major graduates were considered, to avoid double-counting a single graduate.
4. Some educational programs (CIP) for which there were completers in New Hampshire qualified the student for multiple occupations (SOC). Completer data for these programs were proportionately distributed across all relevant occupations, regardless of demand for that occupation.
5. For completers to be considered qualified for employment in an occupation, the degree awarded must be equal to or higher than the entry-level educational requirement of the occupation, as defined by the Bureau of Labor Statistics. 20
20. Bureau of Labor Statistics, “Paving the occupational path: A new system for assigning education and training,” Occupational Outlook Quarterly, Fall 2011, <www.bls.gov/opub/ooq/2011/fall/art02.pdf>.
The final step of ensuring that completers met the basic level of education to become employed was important to gain a more real-world picture of labor supply. In many cases, a degree program may have had completers at a New Hampshire educational institution, however, those awards were less than the entry level educational requirement of the STEM occupation, so completers were not counted. For example, though there were students in New Hampshire who earned a baccalaureate in Astronomy, this award level is insufficient for employment as a professional Astronomer, which has an entry-level qualification of a doctorate in Astronomy. Thus, even though some students were awarded a degree in a STEM-related program, those awarded a degree insufficient for employment were not considered labor supply for the STEM occupation.

18 Economic and Labor Market Informati on Bureau, New Hampshire Employment Security
STEM in New Hampshire: A Labor Demand-Supply Analysis
STEM Program Completers(award level corresponding to entry-level occupational requirements)
All Completers(all programs, both primary and secondary majors)
20,146
STEM Program Completers(all award levels)
Males55.2%
Females44.8%
Life/Physical Science, Architecture, Engineering, Math,
and IT Occupations2,154
Social Science Occupations534
Males89 (9.8%)
Females819 (90.2%)
RNs & LPNs*904 (47.0% of All
Health Occupation Completers)
Health Occupations*1,926
Males61.1%
Females38.9%
Males18.6% (329)
Females81.4% (1,442)
* Gender data not available for 155 completers
In 2011, there were 20,146 completers from all educational programs at postsecondary institutions in New Hampshire. 21
19,482 were awarded a primary degree (excludes the second major of dual-major students)
7,023 were awarded a primary degree in an educational program leading to a STEM occupation
4,614 of these completers were awarded a degree in an instructional program that corresponded to the educational requirements for entry-level employment in a STEM occupation
21. Integrated Postsecondary Education Data System (IPEDS) serves as data collection for the National Center for Education Statistics (NCES). These data represent only completers by state from institutions that report to NCES. Completers from the Manchester, New Hampshire campus of the Massachusetts College of Pharmacy and Health Sciences, reported as Massachusetts completers, were added to the New Hampshire IPEDS totals.
Labor Market Supply for STEM Occupati ons
Of the completers with awards corresponding to entry-level employment: 2,154 completers were awarded a degree in
an instructional program that corresponded to entry-level employment requirements for Life/Physical Science, Engineering, Architecture, Math, and IT occupations.
534 completers were awarded a degree in an instructional program that corresponded to entry-level employment requirements for Social Science occupations.
1,926 completers were awarded a degree in an instructional program that corresponded to entry-level employment requirements for Health occupations.

STEM in New Hampshire: A Labor Demand-Supply Analysis
Economic and Labor Market Informati on Bureau, New Hampshire Employment Security 19
Demographics of New Hampshire’s New Labor Supply PipelineOf the 4,614 New Hampshire students awarded degrees in educational programs corresponding to entry-level qualifications for STEM occupations, 43.5 percent were male and 56.5 percent were female. This, however, differs by STEM occupational cluster.
Among those awarded degrees in educational programs corresponding to Social Science occupations, the share of males was 55.2 percent, and the share of females, 44.8 percent.
Students awarded degrees in programs corresponding to Life/Physical Science, Engineering, Architecture, Math, and IT occupations were 61.1 percent male and 38.9 percent female. This cluster represents one common definition of STEM occupations.
Among those awarded degrees in educational programs corresponding to Health occupations, the ratio of males to females was different from the other STEM clusters. In this cluster, 81.5 percent of completers were female and 18.5 percent were male. Those awarded degrees corresponding to Registered nurse (RN) and
Gender of Completers by STEM Occupati onal Clusters
1,317
295 329
868
239
1,442
0
500
1,000
1,500
2,000
2,500
Life/Physical Science,Engineering, Architecture,
Math and IT
Social Science Health*
Source: IPEDS *Gender data not available for 155 completers
Females
Males
Licensed practical nurse (LPN) were even more concentrated, 90.2 percent of completers in these programs were female. Even when excluding completers of Registered nurse and Licensed practical nurse related programs, the remaining graduates from educational programs corresponding to Health occupations were 72.2 percent female and 27.8 percent male.
Analysis shows that workers in healthcare require many of the same skills and knowledge areas as other STEM clusters, as well as requiring advanced educational preparation and occupational licensure to practice.
Strengths in New Hampshire’s Supply PipelineAmong those completing educational programs corresponding to STEM occupations, some strengths were evident. In the three occupational clusters, just a few occupations accounted for almost half of the completers in each cluster.
Among the 2,154 completers awarded a degree in programs corresponding to entry-level

20 Economic and Labor Market Informati on Bureau, New Hampshire Employment Security
STEM in New Hampshire: A Labor Demand-Supply Analysis
Dominant Occupati ons with Qualifi ed New Hampshire Completers
Remaining Occupations, 242
Remaining Occupations
808
Remaining Occupations
1,002Economists, 171
Survey Researchers, 121
Licensed Practical andLicensed Vocational Nurses, 106
Medical and Health Services Managers, 214
Registered Nurses
798
Engineers, All Other, 126
Environmental Scientists and Specialists, Including Health, 156
Life Scientists, All Other, 190
Architectural and Engineering Managers, 267
Natural Sciences Managers
413
Social Science HealthLife/Physical Science, Engineering, Architecture, Math and IT
employment qualifications in Life/Physical Science, Engineering, Architecture, Math, and IT occupations, 53.4 percent of graduates were qualified to enter five occupations:
Natural science managers; Architectural and engineering managers; Life scientists, all other Environmental scientists and specialists,
including health; and Engineers, all other.
More than 1,150 completers met entry-level educational requirements for these five occupations. However, based on the completer distribution process, the managers and all others occupation categories held a many-to-one relationship with more completers than other occupations. The all other categories include miscellaneous specialties that are not included elsewhere in the occupational specific Standard Occupational Classification (SOC) taxonomy.
In the Social Science occupations cluster, there were fewer completers that met the degree
and program requirement for entry-level employment, a total of 534 completers. Almost 300 of those met the educational and degree requirements of two occupations: Economists and Survey researchers.
Among those completing educational programs that corresponded to Health occupations, 1,926 completers met the entry-level educational requirements. Almost half, 904 completers, were qualified for employment as a Registered nurse or Licensed practical nurse.
New Hampshire’s Supply Pipeline – the Immeasurable One of the difficulties of analyzing worker supply and demand is that data must be classified in order to conduct a numerical analysis. Educational program offerings, however, are not always easily compartmentalized. Many colleges and universities offer educational programs that fit neatly into a Classification of Instructional Programs (CIP) code, then offer a concentration or specialty area of study within that program,

STEM in New Hampshire: A Labor Demand-Supply Analysis
Economic and Labor Market Informati on Bureau, New Hampshire Employment Security 21
that does not fit neatly into a code. In addition, when program completers are reported, only the total number of completers by degree for a CIP code are tallied, not a count of those completing each concentration. Yet some of these concentrations correspond to an occupation, while the overarching CIP program does not. Thus, it is not possible to include all completers in the supply estimate.
For example, there are no institutions in New Hampshire offering an exclusive program for land surveying, but an Associate’s degree in Civil Engineering Technology includes adequate coursework to qualify the graduate for licensure as a Surveyor (though an applicant must complete six years of combined education and experience as well).
This was also the case for many occupations in the Health occupation cluster. For example, specialties of physicians and surgeons were related to specific medical residency programs, however, completer data were not available.
In other cases, qualification for employment requires an internship or certification, neither of which are reported in educational institution statistics. Completers from non-degree granting postsecondary institutions, usually earning a
certificate of completion, are not reported to the National Center for Education Statistics. Without a complete count, it is not possible to estimate a labor market supply for these occupations. There are a number of medical technician occupations that fall into this category.
Finally, residual occupations — those classified as all other — are a miscellaneous collection of workers that do not fit readily into an existing SOC classification, or there are not enough workers in a specific line of work to add a new SOC code to the taxonomy. Because of the miscellaneous nature of these occupations, frequently it is not possible to assign a related program of education that will prepare a student for the occupation. Related miscellaneous educational programs are, on occasion, crosswalked to an all other occupation.
Weaknesses in New Hampshire’s Supply PipelineOn the surface, the total number of completers from New Hampshire educational institutions in STEM disciplines appears to be adequate to supply the demand for workers in STEM occupations. Closer inspection, however, highlights some of the difficulties New Hampshire may face in meeting the labor demand for STEM occupations.
* Postsecondary Teaching requires both a doctorate in the subject matt er and experience. There are no specifi c educati onal preparati on programs with a conferred degree in postsecondary teaching. Many professionals with a doctorate also teach at the postsecondary level, thus it is not possible to count these professionals separately.
STEM Occupati ons with No Completi ons in Corresponding Educati onal Programs Reported at New Hampshire Educati onal Insti tuti ons
Social Science Occupati onsSOC Occupati onal Title Off ered in NH, no completer data available19-3051 Urban and Regional Planners Baccalaureate off ered. Entry-level educati on is a Master’s.19-3091 Anthropologists and Archeologists Baccalaureate off ered. Entry-level educati on is a Master’s.
25-1061 Anthropology and Archeology Teachers, Postsecondary*
Entry-level educati on of a Doctorate plus experience
25-1062 Area, Ethic, and Cultural Studies Teachers, Postsecondary*
Entry-level educati on of a Doctorate plus experience
25-1064 Geography Teachers, Postsecondary* Entry-level educati on of a Doctorate plus experience25-1065 Politi cal Science Teachers, Postsecondary* Entry-level educati on of a Doctorate plus experience25-1066 Psychology Teachers, Postsecondary* Entry-level educati on of a Doctorate plus experience
25-1069 Social Sciences Teachers, Postsecondary, All Other*
Entry-level educati on of a Doctorate plus experience

22 Economic and Labor Market Informati on Bureau, New Hampshire Employment Security
STEM in New Hampshire: A Labor Demand-Supply Analysis
Life/Physical Science, Engineering, Architecture, Math, and IT Occupati onsSOC Occupati onal Title Off ered in NH, no completer data available
15-1151 Computer User Support SpecialistsEntry-level educati on of a non-degree certi fi cate - completers not reported
15-2091 Mathemati cal TechniciansApplied Math Opti on, Master’s in Mathemati cs - completers not reported
17-1021 Cartographers and Photogrammetrists Certi fi cate off ered in NH. Entry-level educati on is a Baccalaureate.
17-1022 SurveyorsAssociate’s off ered in NH. Entry-level educati on is a Baccalaureate. NH License requires six years’ experience, no degree
19-1022 Microbiologists Off ered at NH insti tuti on(s), no completers reported 19-2011 Astronomers Baccalaureate off ered. Entry-level educati on is a Doctorate.19-4021 Biological Technicians Associate’s off ered in NH. Entry-level educati on is a Baccalaureate.25-1031 Architecture Teachers, Postsecondary* Entry-level educati on of a Doctorate plus experience
25-1041 Agricultural Sciences Teachers, Postsecondary* Entry-level educati on of a Doctorate plus experience
25-1043Forestry and Conservati on Science Teachers, Postsecondary*
Entry-level educati on of a Doctorate plus experience
25-1051Atmospheric, Earth, Marine, and Space Sciences Teachers, Postsecondary*
Entry-level educati on of a Doctorate plus experience
SOC Occupati onal Title Related programs not off ered in NH, nearest program off ering in:
15-2031 Operati ons Research Analysts Massachusett s17-1012 Landscape Architects Massachusett s / Connecti cut / Rhode Island17-2021 Agricultural Engineers New York17-2112 Industrial Engineers Massachusett s / Connecti cut / Rhode Island / Vermont17-2121 Marine Engineers and Naval Architects Maine / Massachusett s / Connecti cut17-2131 Materials Engineers Maine / Massachusett s / Connecti cut
17-2151Mining and Geological Engineers, Including Mine Safety
None in New England
17-2161 Nuclear Engineers Massachusett s17-2171 Petroleum Engineers None in New England
17-3021Aerospace Engineering and Operati ons Technicians
Connecti cut
17-3024 Electro-Mechanical Technicians Maine / Rhode Island / Massachusett s / Vermont
17-3025 Environmental Engineering Technicians Massachusett s / Connecti cut19-1012 Food Scienti sts and Technologists Maine / Massachusett s / New York19-1041 Epidemiologists Massachusett s / Rhode Island19-2099 Physical Scienti sts, All Other Related programs off ered - no completers in 201119-4011 Agricultural and Food Science Technicians None in New England19-4031 Chemical Technicians Connecti cut / Rhode Island19-4041 Geological and Petroleum Technicians None in New England19-4051 Nuclear Technicians Connecti cut
19-4091Environmental Science and Protecti on Technicians, Inc. Health
Massachusett s
19-4092 Forensic Science Technicians Massachusett s / Connecti cut
19-4099Life, Physical, and Social Science Technicians, All Other
Massachusett s
* Postsecondary Teaching requires both a doctorate in the subject matt er and experience. There are no specifi c educati onal preparati on programs with a conferred degree in postsecondary teaching. Many professionals with a doctorate also teach at the postsecondary level, thus it is not possible to count these professionals separately.

STEM in New Hampshire: A Labor Demand-Supply Analysis
Economic and Labor Market Informati on Bureau, New Hampshire Employment Security 23
There was a difference of 2,400 completers between the total completers from all STEM programs and completers meeting the specific educational program and award levels that corresponded to requirements for entry-level employment for STEM occupations. Among those that did not meet the requirements, some completers did not have a high enough award level to meet the minimum requirement for entry-level employment in the occupation. That is not to say the completers would not qualify for some other employment in STEM or other fields, just that there was not a direct correspondence between the completer’s award and the recommended level of education for the occupation.
In some cases, a program with a qualifying award was offered at a New Hampshire educational institution, but there were no completers reported for 2011. The lack of completers may be due to a program being too new for any student to have completed, or simply that no students were interested in the major.
In other cases, the specific educational program(s) corresponding to a STEM occupation was simply not offered at New Hampshire institutions. For some occupations, this is due to a regional lack of need. For example, New England does not have much demand for Petroleum engineers, and likewise, there are no educational programs in petroleum engineering
Health Occupati onsSOC Occupati onal Title Off ered in NH, no completer data available25-1071 Health Specialti es Teachers, Postsecondary* Entry-level educati on of a Doctorate plus experience
29-1061 Anesthesiologists Related educati on is a medical residency - completers not reported
29-1063 Internists, General Related educati on is a medical residency - completers not reported
29-1064 Obstetricians and Gynecologists Related educati on is a medical residency - completers not reported
29-1065 Pediatricians, General Related educati on is a medical residency - completers not reported
29-1066 Psychiatrists Related educati on is a medical residency - completers not reported
29-1067 Surgeons Related educati on is a medical residency - completers not reported
29-1125 Recreati onal Therapists Off ered at NH insti tuti on(s), no completers reported
29-1151 Nurse Anestheti sts Additi onal credenti al earned aft er Nursing baccalaureate
29-1161 Nurse Midwives Additi onal credenti al earned aft er Nursing baccalaureate
29-1171 Nurse Practi ti oners Additi onal credenti al earned aft er Nursing baccalaureate
29-2032 Diagnosti c Medical Sonographers Certi fi cate off ered in NH. Entry-level educati on is an Associate’s.
29-2033 Nuclear Medicine Technologists Non-mandatory professional associati on certi fi cati on
29-2035 Magneti c Resonance Imaging Technologists Manufacturer-specifi c training, off ered online
29-2041 Emergency Medical Technicians and ParamedicsEntry-level educati on of a non-degree certi fi cate - completers not reported
29-2052 Pharmacy Technicians Non-mandatory professional associati on certi fi cati on
29-2053 Psychiatric Technicians Non-mandatory professional associati on certi fi cati on
29-2057 Ophthalmic Medical Technicians Non-mandatory professional associati on certi fi cati on
29-2081 Opti cians, Dispensing No postsecondary educati on required
29-2092 Hearing Aid Specialists NH License requires non-specifi c Associate’s degree plus apprenti ceship
* Postsecondary Teaching requires both a doctorate in the subject matt er and experience. There are no specifi c educati onal preparati on programs with a conferred degree in postsecondary teaching. Many professionals with a doctorate also teach at the postsecondary level, thus it is not possible to count these professionals separately.

24 Economic and Labor Market Informati on Bureau, New Hampshire Employment Security
STEM in New Hampshire: A Labor Demand-Supply Analysis
SOC Occupati onal Title Related programs not off ered in NH, nearest program off ering in:
29-1011 Chiropractors Connecti cut / New York
29-1021 Denti sts, General Massachusett s / New York
29-1022 Oral and Maxillofacial Surgeons Massachusett s / New York
29-1023 Orthodonti sts Massachusett s / New York
29-1024 Prosthodonti sts Massachusett s / New York
29-1029 Denti sts, All Other Specialists Massachusett s / Connecti cut / New York
29-1041 Optometrists Massachusett s / New York
29-1081 Podiatrists New York / New Jersey
29-1131 Veterinarians Massachusett s / New York
29-1181 Audiologists Massachusett s / Rhode Island
29-1199Health Diagnosing and Treati ng Practi ti oners, All Other
Maine / Vermont / Connecti cut / New York
29-2031 Cardiovascular Technologists and Technicians New York / New Jersey
29-2091 Orthoti cs and Prostheti sts Connecti cut
29-2099 Health Technologists and Technicians, All Other Massachusett s / Connecti cut / Rhode Island / New York
29-9012 Occupati onal Health and Safety Technicians Maine / Massachusett s / Connecti cut / Rhode Island
29-9092 Geneti c Counselors Massachusett s
29-9099Healthcare Practi ti oners and Technical Workers, All Other
Massachusett s / New York
offered anywhere in the New England region. Conversely, for many occupations with a lower level of demand, there is a regional supply pipeline that feeds the entire region, but is not centered in New Hampshire. 22 In 2011, there were 239 degree-granting institutions in the six New England states; 29 of those were in New Hampshire. In addition, there were 302 degree-granting institutions in New York state. 23 For several occupations, the proximity of the New England states reduces the need for duplication of each program in each state.
Particularly for occupations in Life/Physical Science, Engineering, Architecture, Math, and IT, a corresponding educational program not available at a New Hampshire institution was available at an institution elsewhere in New England.
The tables illustrate occupations in each of the STEM clusters for which there are no corresponding educational programs offered in New Hampshire. Also listed are some of the educational opportunities in the Northeast region.
22. The New England Board of Higher Education is a nonprofit interstate agency whose mission is to promote greater educational opportunities and services for the residents of New England. NEBHE was established by the New England Higher Education Compact, a 1955 agreement among the states of Connecticut, Maine, Massachusetts, New Hampshire, Rhode Island and Vermont. One of its programs is the New England Regional Student Program (RSP), known as the Tuition Break, which allows New England residents to enroll at out-of-state New England public colleges and universities at a discounted rate. The RSP Tuition Break is available when a student enrolls in an approved major that is not offered by public colleges and universities in their home state. Many of the degree programs available to New Hampshire residents are STEM-related. For complete information about NEBHE check their web site at <www.nebhe.org>. For information about programs available to New Hampshire residents, go to <www.nebhe.org/wp-content/uploads/2013-14-TuitionBreak_for_NewHampshire_Residents.pdf>.
23. National Center for Education Statistics. Digest of Education Statistics, Degree-granting institutions and branches, by control and level of institution and state or jurisdiction: 2010-11. <nces.ed.gov/programs/digest/d11/tables/dt11_280.asp>.
* Postsecondary Teaching requires both a doctorate in the subject matt er and experience. There are no specifi c educati onal preparati on programs with a conferred degree in postsecondary teaching. Many professionals with a doctorate also teach at the postsecondary level, thus it is not possible to count these professionals separately.

STEM in New Hampshire: A Labor Demand-Supply Analysis
Economic and Labor Market Informati on Bureau, New Hampshire Employment Security 25
The demand analysis for STEM occupations showed that over the 2010 to 2020 period, the number of workers is expected to increase by 17.3 percent, with 3,200 workers needed annually. Of those 3,200 workers, over half — about 1,700 workers — will be needed to replace workers who leave jobs due to retirement, job change, or other reason, while about 1,450 openings will be due to new job growth. 24
While new graduates will fill many of these jobs, some will be filled by people currently in the labor force. What does the current employment picture looks like for STEM workers, and how many are looking for work?
There is an association between an advanced education and low unemployment. The 2012 annual average unemployment rate in New Hampshire for those with less than a high school education was 10.5 percent, and for those with a high school diploma, it improved to 8.1 percent. People who completed some college had an unemployment rate of 6.2 percent, while those completing an Associate’s degree program
24. New job growth and replacements openings are estimates of the number of new workers needed annually, and not the same as job postings, which are advertisements for jobs.
25. U.S. Census Bureau, unpublished Current Population Survey data.26. U.S. Department of Labor, Bureau of Labor Statistics Table 7. Employment status of the civilian noninstitutional population
25 years and over by educational attainment, sex, race, and Hispanic or Latino ethnicity. <www.bls.gov/cps/tables.htm#annual>.
experienced an even lower unemployment rate of 3.5 percent. The lowest unemployment rate, 3.4 percent, was among those with a Bachelor’s degree or higher. 25
There are four occupational groups, or job families, which account for a majority of STEM jobs: Computer and mathematical science occupations (15-0000); Architecture and engineering occupations (17-0000); Life, physical, and social science occupations (19-0000); and Healthcare practitioner and technical occupations (29-0000). Workers in these four job families represented 13.7 percent of New Hampshire’s labor force in 2012.26
For people in STEM occupations, the majority of whom have some postsecondary education, the unemployment rate in 2012 was quite low. New Hampshire’s average annual unemployment rate in 2012 among these four job families was 2.7 percent, well below the statewide average rate for all occupations of 5.6 percent. For those in Healthcare practitioner and technical occupations, the unemployment rate was just 1.4 percent.
Experienced Worker Supply: Unemployment Rates by Occupati onal Group
Annual Average 2012 Labor Force Employed UnemployedUnemployment
Rate
New Hampshire Total 738,696 697,186 41,510 5.6%
15-0000 Computer and mathemati cal science occupati ons 29,941 28,795 1,146 3.8%
17-0000 Architecture and engineering occupati ons 19,491 18,752 739 3.8%
19-0000 Life, physical, and social service occupati ons 6,295 6,088 207 3.3%
29-0000 Healthcare practi ti oner and technical occupati ons 45,478 44,819 659 1.4%
STEM Occupati onal Average 101,205 98,454 2,751 2.7%

26 Economic and Labor Market Informati on Bureau, New Hampshire Employment Security
STEM in New Hampshire: A Labor Demand-Supply Analysis
This analysis has discussed both the demand for and the supply of labor in STEM occupations. But what is the greater impact of the estimated supply not meeting the estimated demand? To understand the economic impact of not meeting the demand for STEM workers, a multiplier factor was calculated. The STEM job multiplier measures the economic impact, in terms of jobs, that the inability to fill a single STEM job opening would have on New Hampshire’s economy. To assess the impact of STEM workers on the New Hampshire economy, the Economic and Labor Market Information Bureau’s New Hampshire statewide, 70 industry sector, REMI Policy Insight+® econometric model 27 was used.
The employment variable in REMI is based on industry data and not occupational data. The first task was to use inverse staffing patterns 28 to convert annual job openings for STEM occupations, which uses the Standard Occupational Classification (SOC) taxonomy, into a measure of industry employment, which uses the North American Industrial Classification System (NAICS). 29
27. Product of Regional Economic Models, Inc. of Amherst, MA.28. See Data Sources and Classification Systems on page 2 for more information.29. The employment share for the 2020 projected year was used. 30. Self-employment accounted for more than 30 percent of the employment base for each of these STEM occupations.31. Employment data in the REMI model is based on the Bureau of Economic Analysis (BEA) employment estimates. Total
employment in BEA terminology includes Wage and Salary employment, farm and proprietary employment.
Translati ng Occupati onal Demand into Industry Demand: a STEM Job Multi plier
Using inverse staffing patterns for each STEM occupation, the share of employment was distributed across NAICS industries and self-employment. The final matrix consisted of 138 STEM occupations with employment shared out among 90 different NAICS sectors and self-employment. These industry shares were then multiplied by the number of annual openings for each of the STEM occupations, and a total of employment for each industry was aggregated across all STEM occupations. Out of the total estimated annual STEM openings (3,180), the share of self-employed was 123 job openings. Examples of STEM occupations with large shares of self-employment are chiropractors, dentists, and different specialties of psychologists and therapists. 30
After the annual job openings data for STEM occupations were converted to industry employment, data were combined into the 70 industry sectors in the REMI model. The 123 self-employment job openings were shared among all industries, as the industry employment data in the REMI model already includes data on self-employment. 31
continued on page 29

STEM in New Hampshire: A Labor Demand-Supply Analysis
Economic and Labor Market Informati on Bureau, New Hampshire Employment Security 27
STEM Demand by Industry – in what industries are STEM workers employed?Aft er translati ng and aggregati ng annual job openings for STEM occupati ons into annual demand by industry, Health care and social assistance had the largest share of STEM employment, followed by Professional and business services and Manufacturing. Health care and social assistance accounts for 39.8 percent of annual STEM job openings, Professional and business services, 17.3 percent of annual STEM job openings, and Manufacturing, 9.5 percent of annual STEM job openings.
Within the Professional and Business Services sector, two industry groups accounted for the majority of annual STEM job openings — Computer systems design and related services (NAICS 5415) and Architectural, engineering, and related services (NAICS 5413).
The Wholesale trade industry sector accounted for close to half of annual STEM job openings in Trade, transportati on and uti liti es. A large porti on of these job openings are in one occupati on — Sales representati ves, wholesale and manufacturing, technical and scienti fi c products. This occupati on is one of the two sales-related STEM occupati ons.
The Informati on industry sector accounted for just 3.1 percent of total annual STEM job openings, despite the name’s connecti on to informati on technology. The Financial acti viti es industry sector holds a larger share of annual STEM job openings, 5.5 percent. In New Hampshire, there are more Soft ware developers employed in the Finance and insurance sector than in the Informati on sector.
Educational Services
6.5%
Financial Activities 5.5%
Trade, Transportation
and Utilities8.6%
Government 5.1%
Self-Employed Workers
3.9%
Information 3.1% Other
0.8%
Manufacturing9.5%
Professional and Business
Services17.3%
Health Care and Social Assistance
39.8%
STEM Openings Distributed by Selected Supersectors including Self-employed

28 Economic and Labor Market Informati on Bureau, New Hampshire Employment Security
STEM in New Hampshire: A Labor Demand-Supply Analysis
Whereas most of the STEM job openings in the Health cluster are in Health care and social assistance, STEM job openings in Life/Physical Science, Architecture, Engineering, Math and IT cluster are spread across many sectors, with the largest share of employment in Professional and business services and Manufacturing. Close to half of STEM job openings in the Social science cluster are in Educati onal services.
Manufacturing
Professional and Business Services
Health Care and Social Assistance
Educational Services
Professional and Business Services 455 5 90
Manufacturing 297 0 5
Trade, Transportation and Utilities 173 0 100
Financial Activities 171 0 4
Educational Services 123 31 52
Information 99 0 0
Government 77 12 74
Health Care and Social Assistance 48 9 1,210
Other 19 1 5
Self-Employed Workers 48 13 62
Life/Physical Science, Architecture,Engineering, Math and IT Social Sciences Health
STEM Annual Job Openings Distributed by Industry

STEM in New Hampshire: A Labor Demand-Supply Analysis
Economic and Labor Market Informati on Bureau, New Hampshire Employment Security 29
STEM Multi plier – Results of the Counterfactual Simulati on In a counterfactual simulation, the theoretical impact of a specific event or change is estimated by removing factors such as employment or production output from the economy and comparing the results to an original baseline. Here, the REMI model was used to establish a counterfactual baseline value for not meeting the demand for workers in STEM occupations. In this counterfactual scenario, annual average job openings for STEM occupational employment, which was estimated and re-summed by industry based on the inverse staffing patterns, were removed from the REMI model baseline employment by industry 32 over a ten-year period.
Based on the 2010-2020 occupational projections, annual demand for STEM occupations was 3,180 annual job openings. Over ten years, the cumulative effect of not meeting the entire annual demand for STEM occupations would be 31,805 job openings.
Not meeting the demand for STEM occupations (counterfactual) in the first year of the REMI simulation resulted in a total loss of 5,671 jobs. Indirect and induced jobs accounted for 2,491 of the jobs lost in the first year of the simulation.
In ten years’ time, continually not meeting any of the STEM demand (counterfactual) would have an aggregate impact on the New Hampshire economy of 54,628 jobs lost. Of that, the number of indirect and induced jobs lost amounted to 22,823.
Because the input to the model in the tenth year is tenfold the impact in the first year of
32. In REMI, there are two options on how to make a change to the employment variable. The choices are to either model the employment change as Firm Behavior or as Industry Behavior. Firm Behavior allows displacement due to competition in the local and nearby markets and the national market.Industry Behavior does not account for any crowding out effects. It does not compete with other producers within the region and within the nation. In this counterfactual scenario the employment was removed using the Industry Behavior policy variable.
33. The secondary job losses in local and state government would best be interpreted as employment below the baseline level that would not be required in order to provide demand for shared government services. Shared services include education, public safety, water and sewage treatment, road construction and maintenance, and other services not needed (or that could not be afforded) due to a decline in the level of business activities in New Hampshire.
the simulation, the total result in terms of jobs diminishes over time. The reason for this dilution in impact is that the REMI model is a dynamic equilibrium model that, over time, will substitute labor and technology interchangeably in order to return to the forecasted baseline employment.
Not meeting the demand for STEM workers would cause a reduction in Gross Domestic Product (GDP) for New Hampshire of $403 million (in fixed 2005 dollars) in the first year, accumulating to $4.6 billion by the tenth year in comparison to the baseline projection.
GDP per capita would be negatively affected by $261 (in fixed 2005 dollars) in the first year of the counterfactual simulation, rising to $1,715 (in fixed 2005 dollars) by the tenth year of the counterfactual simulation.
Real disposable per capita personal income would be reduced in the first year by $122 (in fixed 2005 dollars), and would be further reduced by $486 (in fixed 2005 dollars) by the tenth year of the counterfactual simulation.
In terms of job losses due to the impact of the indirect and induced effects of not meeting the demand for STEM workers, State and local government, Retail trade and Construction would be impacted the most. In any impact study, these are commonly the sectors affected by the indirect and induced ripples from losing jobs or output in the economy. Job losses are linked to less economic activity in terms of capital investment, consumer spending and state and local government services. 33 The impact on consumer spending from not meeting the demand for STEM

30 Economic and Labor Market Informati on Bureau, New Hampshire Employment Security
STEM in New Hampshire: A Labor Demand-Supply Analysis
34. This multiplier is a conservative estimate. The multiplier effect is likely higher as the model’s baseline employment was reduced by industry, and not occupation. The majority of STEM occupations are paid wages higher than the average, whereas the REMI policy employment variable is based on average pay in each industry.
35. Modeled using the Industry Behavior policy variable (see footnote 6).36. Ibid.
Industries ranked by the number of secondary jobs impacted by the loss of STEM jobs in the fi rst year of the counterfactual simulati on
Reducti on in STEM Jobs
Secondary Job Loss
Total Jobs Impact
Health Care and Social Assistance 1,317 245 1,562Professional, Scienti fi c, and Technical Services 470 125 595State and Local 133 455 588Retail Trade 142 355 497Manufacturing 313 46 359Constructi on 8 337 345Administrati ve and Waste Management Services 76 244 320Wholesale Trade 127 115 242Educati onal Services 214 15 229Finance and Insurance 180 28 208Accommodati on and Food Services 0 165 165Other Services, except Public Administrati on 14 144 158Real Estate and Rental and Leasing 3 125 128Informati on 102 15 117Arts, Entertainment, and Recreati on 1 57 58Federal Civilian 37 0 37Management of Companies and Enterprises 28 5 33Uti liti es 12 6 18Transportati on and Warehousing 3 8 11
workers is most predominant in the Retail trade and Accommodation and food services industries. More than 350 retail trade jobs depend on generating a sufficient number of workers in STEM occupations. Despite the fact that no STEM occupations are in the Accommodation and food services industry, 165 secondary jobs are dependent upon the ability to fill STEM job openings in New Hampshire.
This scenario was run as a counterfactual simulation over a ten-year period to estimate the multiplier effect of not filling a STEM job opening would have on the economy. So what is the estimated impact of not meeting the demand for STEM workers?
For each STEM job opening not filled, the impact on the economy averages 1.77 jobs (including the STEM job opening itself) over the ten-year period.34
A job multiplier of more than one would indicate that some of the existing jobs in the local economy will be positively affected and will expand as the new job enters the local economy. For example, when modeling a job in Retail trade for statewide New Hampshire in a non-competitive situation, this job would generate a multiplier of 1.64 35 over a ten-year period. A job in Accommodation and food services, in a non-competitive situation, would generate 1.2 jobs. 36 However, in most situations, demand for both Retail trade and Accommodation and food services employment and output are responsive to the local presence of similar establishments and will, therefore, be competing for consumers and labor.
While this counterfactual scenario is just theoretical, the results do show that continuing to meet the demand for STEM workers will produce a measurable impact on the economy.

STEM in New Hampshire: A Labor Demand-Supply Analysis
Economic and Labor Market Informati on Bureau, New Hampshire Employment Security 31
Real-World STEMWage Comparisons for STEM Occupati onsAs demonstrated by the multiplier analysis, a single STEM job is likely to have a measurable impact on the New Hampshire economy. One factor of that economic impact is the rate of pay for STEM occupations. To examine the differences in wages for STEM occupations in New Hampshire and across the region, Occupational Employment Statistics (OES) survey data were used. 37
Data from the May 2011 OES Survey show that nearly nine out of ten STEM occupations had higher average annual salaries in New Hampshire than the average for all occupations. Among occupations with employment of at least 50 in
New Hampshire, the top-paying occupations were Surgeons, Obstetricians and Gynecologists, and Dentists, General. Eleven of the 20 STEM occupations with the highest annual salaries were in the Healthcare practitioners and technical occupations job family. All but one of these eleven top-paying healthcare occupations require a minimum education of a doctorate or professional degree, and licensure by the State of New Hampshire.
Comparing the mean hourly wage for all occupations in STEM occupational groups for each state and the nation shows wages in New Hampshire fall about in the middle
$250,320$242,360
$237,430$227,560
$197,400$196,150
$166,880$156,770
$127,830$126,730$125,740
$119,630$118,660
$116,210$114,800$114,010
$110,740$107,110
$101,370$99,150
SurgeonsObstetricians and Gynecologists
Dentists, GeneralPhysicians and Surgeons, All Other
Internists, GeneralFamily and General Practitioners
PsychiatristsPediatricians, General
Architectural and Engineering ManagersComputer and Information Systems Managers
OptometristsEconomics Teachers, Postsecondary
PharmacistsComputer and Information Research Scientists
Biological Science Teachers, PostsecondaryNatural Sciences Managers
Engineering Teachers, PostsecondarySoftware Developers, Systems Software
Sales EngineersPhysician Assistants
Top paying STEM occupati ons in New Hampshire based on May 2011 OES survey (only occupati ons with an esti mated employment of more than 50 were included)
37. The Occupational Employment Statistics (OES) program is based on a semiannual survey of employers conducted by state employment security agencies in all 50 states. The New Hampshire survey was conducted by New Hampshire Employment Security’s Economic and Labor Market Information Bureau (ELMIB), in cooperation with the U.S. Bureau of Labor Statistics. The survey collects data on occupational employment and wage rates of workers in all nonfarm industries. The survey does not include the self-employed, owners and partners in unincorporated firms, household workers, or unpaid family workers.

32 Economic and Labor Market Informati on Bureau, New Hampshire Employment Security
STEM in New Hampshire: A Labor Demand-Supply Analysis
between the highest and lowest rates of pay. New Hampshire has a slightly higher than national average wage for Computer and mathematical occupations and Healthcare practitioners and technical occupations. Mean
hourly wage in New Hampshire for Architecture and engineering occupations and Life, physical and social science occupations is slightly lower than the national average.
$43.97 $44.44
$40.44$42.96
$28.42
$23.39
$27.85$26.46
Computer andMathematical
Architecture andEngineering
Life, Physical, andSocial Science
HealthcarePractitioners and
Technical
Highest Paid New Hampshire Lowest Paid National Average
STEM Occupati ons Wage Range Hourly rate
Mean Hourly Wages for STEM Occupati onal Groups NH ME VT MA US
All Occupati ons $21.74 $19.32 $20.71 $26.32 $21.74
15-0000 Computer and Mathemati cal Occupati ons $38.22 $30.64 $31.91 $42.93 $37.85
17-0000 Architecture and Engineering Occupati ons $34.57 $32.14 $33.67 $39.45 $37.08
19-0000 Life, Physical, and Social Science Occupati ons $29.93 $27.73 $30.52 $35.69 $32.44
29-0000 Healthcare Practi ti oners and Technical Occupati ons $35.95 $35.58 $35.91 $39.55 $34.97

STEM in New Hampshire: A Labor Demand-Supply Analysis
Economic and Labor Market Informati on Bureau, New Hampshire Employment Security 33
Locati on Quoti entDoes New Hampshire have more workers in STEM occupations than the national average or neighboring states? To answer this question, a location quotient (LQ) can be used. A location quotient compares the concentration of occupational employment in an area to the national average for that occupation. A location quotient greater than one means the area has a higher share of employment in the occupation. A location quotient of less than one means employment in the occupation for the area is lower than the national average for the occupation.
New Hampshire's strengths among STEM occupations are in the Computer and mathematical and Architecture and engineering job families. The LQ in New Hampshire for the
Life, physical and social science job family is lower than one and the lowest in the region, indicating a smaller concentration of employment for these occupations in the state.
When comparing all states nationally, the location quotients for each state are furthest apart for employment in Life, physical and social sciences occupations. The high and low location quotients for Health practitioner and technical occupations are much closer together. Wider differences in the relative concentration of occupational employment among states indicate that employment in these occupations is likely concentrated in fewer states, while a larger share have low levels of employment. On the other hand, narrower differences in location quotients among states reflect employment levels that are more equal between states.
Locati on Quoti ent by STEM Occupati onal Group NH ME VT MA
15-0000 Computer and Mathemati cal Occupati ons 1.10 0.56 0.89 1.55
17-0000 Architecture and Engineering Occupati ons 1.12 0.84 0.98 1.23
19-0000 Life, Physical, and Social Science Occupati ons 0.74 0.91 1.29 1.78
29-0000 Healthcare Practi ti oners and Technical Occupati ons 1.02 1.17 1.06 1.23
2.01
1.68
2.43
1.25
0.31
0.53 0.580.70
0.00
0.50
1.00
1.50
2.00
2.50
Computer andMathematical
Architecture andEngineering
Life, Physical, andSocial Science
Healthcare Practitionersand Technical
Highest State LQ
Lowest State LQ
New Hampshire LQ
Comparison of All State Locati on Quoti ents by STEM Job Families

34 Economic and Labor Market Informati on Bureau, New Hampshire Employment Security
STEM in New Hampshire: A Labor Demand-Supply Analysis
Workers providing services where a physical presence with clients is needed, such as healthcare, usually must perform work where clients live. Employment for these workers is likely to be more wide-spread and less concentrated by state.
However, location quotients are affected not only by population, but also by technological advances. Workers providing services that can be provided remotely, such as software development, have no need for a physical presence in every community. Work can be performed in central locations, with clients spread across the nation. This could lead to differences in concentration of occupations and location quotients. Also, some occupations are linked to industries that benefit from economies of agglomeration, resulting in industry (and occupational) clustering.
Among STEM occupations in New Hampshire, Sales representatives, wholesale and manufacturing, technical and scientific products have the strongest concentration of employment with a location quotient of 2.18. The other sales-related STEM occupation, Sales engineers, also has a high concentration of employment in New Hampshire. The state has a high concentration (relative to the nation) of Software developers, applications; Software developers, systems software; Computer and information systems managers; and Electrical engineers as well.
Locati on Quoti ent for select STEM Occupati ons NH ME VT MA
41-4011 Sales Representati ves, Wholesale and Manufacturing, Technical and Scienti fi c Products 2.18 0.40 0.64 1.63
41-9031 Sales Engineers 1.57 0.76 0.67 1.89
15-1132 Soft ware Developers, Applicati ons 1.79 0.55 0.71 1.88
15-1133 Soft ware Developers, Systems Soft ware 1.08 0.22 0.77 2.87
11-3021 Computer and Informati on Systems Managers 1.71 0.66 0.78 1.95
17-2071 Electrical Engineers 1.55 0.50 1.09 1.95
STEM in New Hampshire: A Labor Demand-Supply Analysis
Economic and Labor Market Informati on Bureau, New Hampshire Employment Security 35
Online Job Posti ngs: Experienced Worker DemandTo provide a real-world example of STEM demand, a sampling of actual on-line job postings identified as jobs available in New Hampshire were extracted from the Northeast Consortium’s real-time demand web portal. 38 In the last quarter of 2011, 39 STEM occupations were strongly represented in on-line job postings. Four of the ten occupations with the most jobs posted on-line were STEM occupations:
Registered nurses;
Mechanical engineers;
Computer software engineers, applications; and
Computer programmers.
The share of job postings for each occupation with a specific skill or knowledge listed in the posting text was calculated. Based on the skills requested in the posting text for the above four STEM occupations, the top ten most-requested skills or knowledge areas were identified, as was the share of job postings for each occupation listing specific years of experience. The comparison of the four STEM occupations with the largest volume of on-line postings in the last quarter of 2011 revealed several similarities.
In postings for the four STEM occupations, communication skills was one of the ten most-often listed skills or knowledge area. In postings for three of the four STEM occupations, writing skills was in the top ten, and in postings for two of the four STEM occupations, customer service was one of the ten most-often listed skill or knowledge areas. Two of these skills — communication skills and writing — also ranked in the top ten skills in demand for each STEM cluster; customer service ranked in the top five knowledge areas in demand for each STEM cluster (see the section on Skills and Knowledge Assessment on page 10).
The years of experience requested by employers in a job posting is another factor in the ability of labor supply to meet labor demand. Among the four STEM occupations with the highest number of on-line job postings, well over half of the postings specified years of experience. The two computer-related occupations had the highest share of postings requesting experience, with 40 percent of postings for Computer software engineers, applications asking for five or more years of experience, and 36 percent of postings for Computer programmers asking for five or more years of experience. Registered nurses had the largest share of on-line job postings asking
38. In 2009, the US Department of Labor’s Employment and Training Administration issued a grant for State Labor Market Information Improvement. New Hampshire’s Economic and Labor Market Information Bureau, in conjunction with seven other northeast states and consultants from the Center on Education and the Workforce at Georgetown University, Burning Glass Technologies, and Direct Employers Association, formed the Northeast Consortium to examine the potential for identifying green jobs in demand through skills listed in on-line job posting data. Research was funded by a grant from the US Department of Labor using American Recovery and Reinvestment Act funds. <public.greencareercentral.org>.
39. The Northeast Consortium analyzed the content of on-line job postings by occupation between 2009 and 2011. The latest quarter with real-time data available was fourth quarter 2011.

36 Economic and Labor Market Informati on Bureau, New Hampshire Employment Security
STEM in New Hampshire: A Labor Demand-Supply Analysis
for one to four years of experience, while postings for Mechanical engineers were about evenly split between those asking for one to four years’ experience, those asking for five or more years of experience, and those not specifying experience.
Even using this limited sample of on-line job postings, it is clear that there is active demand for workers in STEM occupations in the New Hampshire labor market. The occupational skills and knowledge assessment is supported by the skills or knowledge requested in on-line job
postings. The data also highlights an additional factor of labor demand — experience. The new supply of labor for many STEM occupations may be adequate, however, many new labor market entrants are lacking the years of experience requested by employers. This factor can impact the connection between supply and demand. Those in the supply pipeline have difficulty in getting hired due to insufficient experience. At the same time, those on the demand side find that there is not enough supply with adequate experience to meet their needs.
23.5%
26.6%
28.5%
44.6%
36.0%
40.0%
29.6%
12.9%
39.3%
33.1%
31.3%
42.3%
0% 10% 20% 30% 40% 50% 60% 70% 80% 90% 100%
Computer Programmers
Computer SoftwareEngineer, Applications
Mechanical Engineer
Registered Nurse
Share of 2011 Q4 Job Postings
1-4 Years 5+ Years Unspecified
Experience Requirements

STEM in New Hampshire: A Labor Demand-Supply Analysis
Economic and Labor Market Informati on Bureau, New Hampshire Employment Security 37
ConclusionThe age-old puzzle, “Which came first – the chicken or the egg?” can be applied to concepts of STEM labor supply and demand. Is demand driven by an abundant supply of workers with the educational qualification for STEM occupations, or are individuals pursuing STEM careers because the demand for STEM occupations is growing?
The analysis showed a strong demand for STEM workers in New Hampshire. Workers in STEM occupations are: more likely to have higher levels of education, have the skills and knowledge most in demand,
and are expected to have very favorable
employment opportunities between 2010 and 2020.
Estimated openings for STEM occupations are 3,180 positions annually from 2010 to 2020. The counterfactual simulation estimated that every STEM job opening left unfilled has an economic impact of 1.77 jobs. These exercises illustrate the demand for and value of workers in STEM occupations for New Hampshire.
The supply of labor, measured by postsecondary educational program completers, for STEM occupations in New Hampshire was also positive. In 2011, there were approximately 4,600 postsecondary program completers qualified to enter employment in a STEM occupation, slightly above total average annual job openings for STEM occupations. Supply exceeded demand in each of the three STEM clusters, Life/Physical Science, Architecture, Engineering, Math and IT occupations; Social Science occupations, and Health occupations.
Yet these completers did not equal the annual demand for each individual STEM occupation, indicating a potential over-supply in some occupations and a potential shortage in others. In addition, estimates of labor supply were made with the assumption that all completers from New Hampshire postsecondary institutions would be entering the New Hampshire workforce, which is not the case. This amplifies potential labor shortages for many occupations. Among current STEM workers, the experienced labor supply, the unemployment rate in 2012 was about 2.7 percent, well below the statewide average of 5.6 percent. This hints at the potential for labor shortages in STEM occupations as well.
New Hampshire’s workforce is considered well-educated, providing the state an advantage in economic development. According to the 2007-2011 American Community Survey, 41.5 percent of New Hampshire’s male population, age 25 years and older, had an Associate’s degree or higher, compared to 35.5 percent nationally. Among New Hampshire’s female population, age 25 years and older, 43.7 percent had an Associate’s degree or higher, compared to 36.1 percent for the nation. 40 However, workers with postsecondary degrees are not enough to maintain the state’s advantage in a global economy.
How can New Hampshire prepare to meet the future demand for STEM workers? In order to produce a continuous supply of talent for individual STEM occupations, attention must be turned to developing and maintaining an interest in science, mathematics, engineering and technology among primary and secondary school students.
40. 2007-2011 American Community Survey, Table B15002: Sex By Educational Attainment for the Population 25 Years and Over. Universe: Population 25 years and over. <factfinder2.census.gov/faces/nav/jsf/pages/searchresults.xhtml?refresh=t>.

38 Economic and Labor Market Informati on Bureau, New Hampshire Employment Security
STEM in New Hampshire: A Labor Demand-Supply Analysis
Standardized test scores 41 for the 2012-2013 school year in New Hampshire for children in grades 4 and 8 were relatively strong in mathematics, with 77 percent scoring “proficient” or “proficient with distinction” in grade 4, and 68 percent in grade 8. Yet by grade 11, when students have the option to select class topics, test scores of “proficient” or “proficient with distinction” fell to 37 percent, and the percent scoring “substantially below proficient” was more than double the share for grade 8.
Compounding the problem of a future labor supply in New Hampshire is a sheer lack of population among primary and secondary school-age students. The National Center for Education Statistics estimates the number of public high school graduates through the 2021-2022 school year, based on current population age and demographics. According to projections, the number of public high school graduates in New Hampshire is expected to decline from 14,830 (actual count) for the 2009-2010 school year, to 12,640 by the 2021-2022 school year. Nationally, the number of public high school graduates is expected to stabilize and slowly increase. 42
MATH NECAP Scores NH Grade2012-2013 School Year 4 8 11Profi cient with Disti ncti on 30 21 2
Profi cient 47 47 35
Parti ally Profi cient 15 17 26
Substanti ally Below Profi cient 8 15 36
41. A standardized test, the New England Common Assessment Program (NECAP) is administered annually to multiple grades and includes mathematics and science as specific test topics.
42. National Center for Education Statistics. Institute of Education Sciences. Projections of Education Statistics to 2021. U.S. Department of Education. <nces.ed.gov/pubsearch/pubsinfo.asp?pubid=2013008>.
10,000
11,000
12,000
13,000
14,000
15,000
16,000
17,000
18,000
19,000
20,000
2003–0
4
2004–0
5
2005–0
6
2006–0
7
2007–0
8
20
08
–09
20
09
–10
20
10
–11
20
11
–12
20
12
–13
20
13
–14
20
14
–15
20
15
–16
20
16
–17
20
17
–18
20
18
–19
20
19
–20
20
20
–21
20
21
–22
school year
New
Ham
psh
ire
hig
h s
chool gra
duat
es
2,500,000
2,600,000
2,700,000
2,800,000
2,900,000
3,000,000
3,100,000
3,200,000
3,300,000
3,400,000
3,500,000
Source: Projections of Education Statistics to 2021, National Center for Education Statistics, Institute of Education Sciences, U.S. Department of Education
Unit
ed S
tate
s hig
h s
chool gra
duat
es
Projected numbers
New Hampshire
United States
Actual and Projected Numbers for Public High School Graduates

STEM in New Hampshire: A Labor Demand-Supply Analysis
Economic and Labor Market Informati on Bureau, New Hampshire Employment Security 39
This STEM labor supply and demand analysis has shown that for New Hampshire to remain a player in the global economy, increasing the number of graduates in STEM programs will not be enough. Students will need to not only meet entry-level educational requirements for STEM occupations in demand, but also look for ways to gain work experience prior to entering the labor force. Actual on-line job postings reinforce the real-time demand for workers in STEM occupations with the right skills and experience. Labor force entrants must learn all expectations of job performance — not just the theoretical and technical knowledge aspects of an occupation, but also the skills of reading, active listening, critical thinking, active learning, and complex problem solving.
New Hampshire faces a potential labor shortage in the future, and STEM occupations are no exception. This problem cannot be addressed from just one perspective. The business community must ensure that the education community understands expectations for worker skills and abilities, and be willing to hire graduates with little or no experience. The education community must understand the skills and abilities expected by business, and be prepared to adjust curricula to meet those expectations, as well as provide students opportunities to gain work experience. Both sides of the labor equation — demand and supply — will have to work together to achieve success.

40 Economic and Labor Market Informati on Bureau, New Hampshire Employment Security
STEM in New Hampshire: A Labor Demand-Supply Analysis
Appendix A: Occupati ons by STEM Group (BLS Defi niti ons)
Sub-domain and Type of Occupati on
2010 SOC code 2010 SOC ti tle
1.D 11-3021 Computer and Informati on Systems Managers
1.D and 3.D 11-9041 Architectural and Engineering Managers
1.D 11-9121 Natural Sciences Managers
1.A 15-1111 Computer and Informati on Research Scienti sts
1.A 15-1121 Computer Systems Analysts
1.A 15-1122 Informati on Security Analysts
1.B 15-1131 Computer Programmers
1.A 15-1132 Soft ware Developers, Applicati ons
1.A 15-1133 Soft ware Developers, Systems Soft ware
1.A 15-1134 Web Developers
1.A 15-1141 Database Administrators
1.A 15-1142 Network and Computer Systems Administrators
1.A 15-1143 Computer Network Architects
1.B 15-1151 Computer User Support Specialists
1.B 15-1152 Computer Network Support Specialists
1.A 15-1199 Computer Occupati ons, All Other
1.A 15-2011 Actuaries
1.A 15-2021 Mathemati cians
1.A 15-2031 Operati ons Research Analysts
1.A 15-2041 Stati sti cians
1.B 15-2091 Mathemati cal Technicians
1.A 15-2099 Mathemati cal Science Occupati ons, All Other
3.A 17-1011 Architects, Except Landscape and Naval
3.A 17-1012 Landscape Architects
1.B 17-1021 Cartographers and Photogrammetrists
1.B 17-1022 Surveyors
1.A 17-2011 Aerospace Engineers
1.A 17-2021 Agricultural Engineers
1.A 17-2031 Biomedical Engineers
1.A 17-2041 Chemical Engineers
1.A 17-2051 Civil Engineers
1.A 17-2061 Computer Hardware Engineers
1.A 17-2071 Electrical Engineers
Sub-domain
1 Life and Physical Science, Engineering, Math, and IT Occupati ons
2 Social Science Occupati ons
3 Architecture Occupati ons
4 Health Occupati ons
Split across 2 sub-domains
Types of occupati ons
A Research, Development, Design, or Practi ti oner Occupati ons
B Technologist and Technician Occupati ons
C Postsecondary Teaching Occupati ons
D Managerial Occupati ons
E Sales Occupati ons
Key

STEM in New Hampshire: A Labor Demand-Supply Analysis
Economic and Labor Market Informati on Bureau, New Hampshire Employment Security 41
Appendix A: Occupati ons by STEM Group (BLS Defi niti ons) conti nued
1.A 17-2072 Electronics Engineers, Except Computer
1.A 17-2081 Environmental Engineers
1.A 17-2111 Health and Safety Engineers, Except Mining Safety Engineers and Inspectors
1.A 17-2112 Industrial Engineers
1.A 17-2121 Marine Engineers and Naval Architects
1.A 17-2131 Materials Engineers
1.A 17-2141 Mechanical Engineers
1.A 17-2151 Mining and Geological Engineers, Including Mining Safety Engineers
1.A 17-2161 Nuclear Engineers
1.A 17-2171 Petroleum Engineers
1.A 17-2199 Engineers, All Other
1.B and 3.B 17-3011 Architectural and Civil Draft ers
1.B 17-3012 Electrical and Electronics Draft ers
1.B 17-3013 Mechanical Draft ers
1.B 17-3019 Draft ers, All Other
1.B 17-3021 Aerospace Engineering and Operati ons Technicians
1.B 17-3022 Civil Engineering Technicians
1.B 17-3023 Electrical and Electronics Engineering Technicians
1.B 17-3024 Electro-Mechanical Technicians
1.B 17-3025 Environmental Engineering Technicians
1.B 17-3026 Industrial Engineering Technicians
1.B 17-3027 Mechanical Engineering Technicians
1.B 17-3029 Engineering Technicians, Except Draft ers, All Other
1.B 17-3031 Surveying and Mapping Technicians
1.A 19-1011 Animal Scienti sts
1.A 19-1012 Food Scienti sts and Technologists
1.A 19-1013 Soil and Plant Scienti sts
1.A 19-1021 Biochemists and Biophysicists
1.A 19-1022 Microbiologists
1.A 19-1023 Zoologists and Wildlife Biologists
1.A 19-1029 Biological Scienti sts, All Other
1.A 19-1031 Conservati on Scienti sts
1.A 19-1032 Foresters
1.A 19-1041 Epidemiologists
1.A 19-1042 Medical Scienti sts, Except Epidemiologists
1.A 19-1099 Life Scienti sts, All Other
1.A 19-2011 Astronomers
1.A 19-2012 Physicists
1.A 19-2021 Atmospheric and Space Scienti sts
1.A 19-2031 Chemists
1.A 19-2032 Materials Scienti sts
1.A 19-2041 Environmental Scienti sts and Specialists, Including Health
1.A 19-2042 Geoscienti sts, Except Hydrologists and Geographers
1.A 19-2043 Hydrologists
1.A 19-2099 Physical Scienti sts, All Other
Sub-domain and Type of Occupati on
2010 SOC code 2010 SOC ti tle

42 Economic and Labor Market Informati on Bureau, New Hampshire Employment Security
STEM in New Hampshire: A Labor Demand-Supply Analysis
1.B 19-4011 Agricultural and Food Science Technicians1.B 19-4021 Biological Technicians1.B 19-4031 Chemical Technicians1.B 19-4041 Geological and Petroleum Technicians1.B 19-4051 Nuclear Technicians1.B 19-4091 Environmental Science and Protecti on Technicians, Including Health1.B 19-4092 Forensic Science Technicians1.B 19-4093 Forest and Conservati on Technicians
1.B and 2.B 19-4099 Life, Physical, and Social Science Technicians, All Other1.C 25-1021 Computer Science Teachers, Postsecondary1.C 25-1022 Mathemati cal Science Teachers, Postsecondary3.C 25-1031 Architecture Teachers, Postsecondary1.C 25-1032 Engineering Teachers, Postsecondary1.C 25-1041 Agricultural Sciences Teachers, Postsecondary1.C 25-1042 Biological Science Teachers, Postsecondary1.C 25-1043 Forestry and Conservati on Science Teachers, Postsecondary1.C 25-1051 Atmospheric, Earth, Marine, and Space Sciences Teachers, Postsecondary1.C 25-1052 Chemistry Teachers, Postsecondary1.C 25-1053 Environmental Science Teachers, Postsecondary1.C 25-1054 Physics Teachers, Postsecondary1.E 41-4011 Sales Representati ves, Wholesale and Manufacturing, Technical and Scienti fi c Products1.E 41-9031 Sales Engineers
Sub-domain and Type of Occupati on
2010 SOC code 2010 SOC ti tle
Sub-domain and Type of Occupati on
2010 SOC code 2010 SOC ti tle
2.A 19-3011 Economists2.A 19-3022 Survey Researchers2.A 19-3031 Clinical, Counseling, and School Psychologists2.A 19-3032 Industrial-Organizati onal Psychologists2.A 19-3039 Psychologists, All Other2.A 19-3041 Sociologists2.A 19-3051 Urban and Regional Planners2.A 19-3091 Anthropologists and Archeologists2.A 19-3092 Geographers2.A 19-3094 Politi cal Scienti sts2.A 19-3099 Social Scienti sts and Related Workers, All Other2.B 19-4061 Social Science Research Assistants2.C 25-1061 Anthropology and Archeology Teachers, Postsecondary2.C 25-1062 Area, Ethnic, and Cultural Studies Teachers, Postsecondary2.C 25-1063 Economics Teachers, Postsecondary2.C 25-1064 Geography Teachers, Postsecondary2.C 25-1065 Politi cal Science Teachers, Postsecondary2.C 25-1066 Psychology Teachers, Postsecondary2.C 25-1067 Sociology Teachers, Postsecondary2.C 25-1069 Social Sciences Teachers, Postsecondary, All Other
Appendix A: Occupati ons by STEM Group (BLS Defi niti ons) conti nued

STEM in New Hampshire: A Labor Demand-Supply Analysis
Economic and Labor Market Informati on Bureau, New Hampshire Employment Security 43
Sub-domain and Type of Occupati on
2010 SOC code 2010 SOC ti tle
4.D 11-9111 Medical and Health Services Managers
4.C 25-1071 Health Specialti es Teachers, Postsecondary
4.C 25-1072 Nursing Instructors and Teachers, Postsecondary
4.A 29-1011 Chiropractors
4.A 29-1021 Denti sts, General
4.A 29-1022 Oral and Maxillofacial Surgeons
4.A 29-1023 Orthodonti sts
4.A 29-1024 Prosthodonti sts
4.A 29-1029 Denti sts, All Other Specialists
4.A 29-1031 Dieti ti ans and Nutriti onists
4.A 29-1041 Optometrists
4.A 29-1051 Pharmacists
4.A 29-1061 Anesthesiologists
4.A 29-1062 Family and General Practi ti oners
4.A 29-1063 Internists, General
4.A 29-1064 Obstetricians and Gynecologists
4.A 29-1065 Pediatricians, General
4.A 29-1066 Psychiatrists
4.A 29-1067 Surgeons
4.A 29-1069 Physicians and Surgeons, All Other
4.A 29-1071 Physician Assistants
4.A 29-1081 Podiatrists
4.A 29-1122 Occupati onal Therapists
4.A 29-1123 Physical Therapists
4.A 29-1124 Radiati on Therapists
4.A 29-1125 Recreati onal Therapists
4.A 29-1126 Respiratory Therapists
4.A 29-1127 Speech-Language Pathologists
4.A 29-1128 Exercise Physiologists
4.A 29-1129 Therapists, All Other
4.A 29-1131 Veterinarians
4.A 29-1141 Registered Nurses
4.A 29-1151 Nurse Anestheti sts
Appendix A: Occupati ons by STEM Group (BLS Defi niti ons) conti nued
Sub-domain
1 Life and Physical Science, Engineering, Math, and IT Occupati ons
2 Social Science Occupati ons
3 Architecture Occupati ons
4 Health Occupati ons
Split across 2 sub-domains
Types of occupati ons
A Research, Development, Design, or Practi ti oner Occupati ons
B Technologist and Technician Occupati ons
C Postsecondary Teaching Occupati ons
D Managerial Occupati ons
E Sales Occupati ons
Key

44 Economic and Labor Market Informati on Bureau, New Hampshire Employment Security
STEM in New Hampshire: A Labor Demand-Supply Analysis
Sub-domain and Type of Occupati on
2010 SOC code 2010 SOC ti tle
4.A 29-1161 Nurse Midwives
4.A 29-1171 Nurse Practi ti oners
4.A 29-1181 Audiologists
4.A 29-1199 Health Diagnosing and Treati ng Practi ti oners, All Other
4.B 29-2011 Medical and Clinical Laboratory Technologists
4.B 29-2012 Medical and Clinical Laboratory Technicians
4.B 29-2021 Dental Hygienists
4.B 29-2031 Cardiovascular Technologists and Technicians
4.B 29-2032 Diagnosti c Medical Sonographers
4.B 29-2033 Nuclear Medicine Technologists
4.B 29-2034 Radiologic Technologists
4.B 29-2035 Magneti c Resonance Imaging Technologists
4.B 29-2041 Emergency Medical Technicians and Paramedics
4.B 29-2051 Dieteti c Technicians
4.B 29-2052 Pharmacy Technicians
4.B 29-2053 Psychiatric Technicians
4.B 29-2054 Respiratory Therapy Technicians
4.B 29-2055 Surgical Technologists
4.B 29-2056 Veterinary Technologists and Technicians
4.B 29-2057 Ophthalmic Medical Technicians
4.B 29-2061 Licensed Practi cal and Licensed Vocati onal Nurses
4.B 29-2071 Medical Records and Health Informati on Technicians
4.B 29-2081 Opti cians, Dispensing
4.B 29-2091 Orthoti sts and Prostheti sts
4.B 29-2092 Hearing Aid Specialists
4.B 29-2099 Health Technologists and Technicians, All Other
4.B 29-9011 Occupati onal Health and Safety Specialists
4.B 29-9012 Occupati onal Health and Safety Technicians
4.B 29-9091 Athleti c Trainers
4.B 29-9092 Geneti c Counselors
4.B 29-9099 Healthcare Practi ti oners and Technical Workers, All Other
Appendix A: Occupati ons by STEM Group (BLS Defi niti ons) conti nued
Sub-domain
1 Life and Physical Science, Engineering, Math, and IT Occupati ons
2 Social Science Occupati ons
3 Architecture Occupati ons
4 Health Occupati ons
Split across 2 sub-domains
Types of occupati ons
A Research, Development, Design, or Practi ti oner Occupati ons
B Technologist and Technician Occupati ons
C Postsecondary Teaching Occupati ons
D Managerial Occupati ons
E Sales Occupati ons
Key

STEM in New Hampshire: A Labor Demand-Supply Analysis
Economic and Labor Market Informati on Bureau, New Hampshire Employment Security 45
New Hampshire Long-term Occupati onal Projecti ons, 2010 to 2020
SOC Code Occupati on Title
2010Base
2020Projected
Total Job
OpeningsEducati on Value
NH License
Work/ Experience Value
Job Training Value Descriptor
11-3021 Computer and Informati on Systems Managers 2,423 2,864 81 Bachelor’s
degreeMore than 5 years None Very
Favorable
11-9041 Engineering Managers 1,042 1,076 24 Bachelor’s degree
More than 5 years None Favorable
11-9121 Natural Sciences Managers 99 110 7 Bachelor’s degree
More than 5 years None Favorable
15-1111 Computer and Informati on Research Scienti sts 67 82 3
Doctoral or professional degree
None None Favorable
15-1121 Computer Systems Analysts 2,920 3,414 105 Bachelor’s degree None None Very
Favorable
15-1131 Computer Programmers 1,404 1,588 52 Bachelor’s degree None None Very
Favorable
15-1132 Soft ware Developers, Applicati ons 4,761 5,990 173 Bachelor’s degree None None Very
Favorable
15-1133 Soft ware Developers, Systems Soft ware 2,248 2,736 72 Bachelor’s
degree None None Very Favorable
15-1141 Database Administrators 499 631 21 Bachelor’s degree 1 to 5 years None Very
Favorable
15-1142 Network and Computer Systems Architects and Administrators 1,610 2,000 66 Bachelor’s
degree None None Very Favorable
15-1150 Computer Support Specialists 2,815 3,250 118 Some college, no degree None Moderate-
term OJTVery Favorable
15-1179Informati on Security Analysts, Web Developers, and Computer Network Architects
956 1,089 28 Bachelor’s degree 1 to 5 years None Very
Favorable
15-1199 Computer Occupati ons, All Other 1,026 1,197 36 Bachelor’s degree None None Very
Favorable
15-2011 Actuaries 68 80 5 Bachelor’s degree None Long-term
OJTVery Favorable
15-2021 Mathemati cians n n n Master’s degree None None Not
Favorable
15-2031 Operati ons Research Analysts 143 156 6 Bachelor’s degree None None Favorable
15-2041 Stati sti cians 85 93 6 Master’s degree None None Favorable
15-2099 Mathemati cal Science Occupati ons, All Other n n n Bachelor’s
degree None None Favorable
Appendix B: STEM Demand Data Table

46 Economic and Labor Market Informati on Bureau, New Hampshire Employment Security
STEM in New Hampshire: A Labor Demand-Supply Analysis
New Hampshire Long-term Occupati onal Projecti ons, 2010 to 2020
SOC Code Occupati on Title
2010Base
2020Projected
Total Job
OpeningsEducati on Value
NH License
Work/ Experience Value
Job Training Value Descriptor
17-1011 Architects, Except Landscape and Naval 255 313 11 Bachelor’s
degree Yes None Internship/residency
Very Favorable
17-1012 Landscape Architects 128 140 4 Bachelor’s degree Yes None Internship/
residencyLess Favorable
17-1021 Cartographers and Photogrammetrists 82 99 4 Bachelor’s degree None None Favorable
17-1022 Surveyors 269 342 13 Bachelor’s degree Yes None None Very
Favorable
17-2011 Aerospace Engineers n n n Bachelor’s degree None None Less
Favorable
17-2021 Agricultural Engineers n n n Bachelor’s degree None None Not
Favorable
17-2031 Biomedical Engineers 48 76 4 Bachelor’s degree Yes None None Favorable
17-2041 Chemical Engineers 70 79 3 Bachelor’s degree Yes None None Favorable
17-2051 Civil Engineers 930 1,096 36 Bachelor’s degree Yes None None Very
Favorable
17-2061 Computer Hardware Engineers 181 197 6 Bachelor’s degree Yes None None Favorable
17-2071 Electrical Engineers 1,197 1,216 31 Bachelor’s degree Yes None None Favorable
17-2072 Electronics Engineers, Except Computer 539 565 15 Bachelor’s
degree Yes None None Favorable
17-2081 Environmental Engineers 272 344 13 Bachelor’s degree Yes None None Very
Favorable
17-2111Health and Safety Engineers, Except Mining Safety Engineers and Inspectors
46 50 1 Bachelor’s degree Yes None None Less
Favorable
17-2112 Industrial Engineers 1,101 1,164 31 Bachelor’s degree Yes None None Favorable
17-2131 Materials Engineers 64 70 2 Bachelor’s degree Yes None None Less
Favorable
17-2141 Mechanical Engineers 1,492 1,563 55 Bachelor’s degree Yes None None Favorable
17-2151 Mining and Geological Engineers, Including Mining Safety Engineers n n n Bachelor’s
degree None None Not Favorable
17-2161 Nuclear Engineers n n n Bachelor’s degree None None Not
Favorable
17-2199 Engineers, All Other 1,599 1,743 50 Bachelor’s degree None None Favorable
17-3011 Architectural and Civil Draft ers 354 368 8 Associate’s degree None None Less
Favorable
17-3012 Electrical and Electronics Draft ers 168 172 3 Associate’s degree None None Not
Favorable
17-3013 Mechanical Draft ers 178 189 5 Associate’s degree None None Less
Favorable
Appendix B: STEM Demand Data Table conti nued

STEM in New Hampshire: A Labor Demand-Supply Analysis
Economic and Labor Market Informati on Bureau, New Hampshire Employment Security 47
New Hampshire Long-term Occupati onal Projecti ons, 2010 to 2020
SOC Code Occupati on Title2010Base
2020Projected
Total Job
OpeningsEducati on Value
NH License
Work/ Experience Value
Job Training Value Descriptor
17-3019 Draft ers, All Other 371 356 7 Associate’s degree None None Less
Favorable
17-3021 Aerospace Engineering and Operati ons Technicians n n n Associate’s
degree None None Not Favorable
17-3022 Civil Engineering Technicians 142 169 6 Associate’s degree None None Very
Favorable
17-3023 Electrical and Electronic Engineering Technicians 953 966 19 Associate’s
degree None None Favorable
17-3024 Electro-Mechanical Technicians 34 36 1 Associate’s degree None None Not
Favorable
17-3025 Environmental Engineering Technicians n n n Associate’s
degree None None Favorable
17-3026 Industrial Engineering Technicians 305 308 7 Associate’s degree None None Less
Favorable
17-3027 Mechanical Engineering Technicians 392 400 8 Associate’s degree None None Less
Favorable
17-3029 Engineering Technicians, Except Draft ers, All Other 667 675 13 Associate’s
degree None None Favorable
17-3031 Surveying and Mapping Technicians 209 239 7High school diploma or equivalent
None Moderate-term OJT Favorable
19-1011 Animal Scienti sts n n nDoctoral or professional degree
None None Not Favorable
19-1012 Food Scienti sts and Technologists 30 33 1 Bachelor’s degree None None Less
Favorable
19-1013 Soil and Plant Scienti sts 16 16 1 Bachelor’s degree Yes None None Not
Favorable
19-1021 Biochemists and Biophysicists n n nDoctoral or professional degree
None None Favorable
19-1022 Microbiologists 27 29 1 Bachelor’s degree None None Less
Favorable
19-1023 Zoologists and Wildlife Biologists 85 90 3 Bachelor’s degree None None Not
Favorable
19-1029 Biological Scienti sts, All Other 91 96 2Doctoral or professional degree
None None Not Favorable
19-1031 Conservati on Scienti sts 59 65 1 Bachelor’s degree Yes None None Less
Favorable
19-1032 Foresters 47 49 1 Bachelor’s degree Yes None None Not
Favorable
19-1041 Epidemiologists n n n Master’s degree None None Less
Favorable
19-1042 Medical Scienti sts, Except Epidemiologists 358 479 14
Doctoral or professional degree
None None Very Favorable
19-1099 Life Scienti sts, All Other 68 77 1 Bachelor’s degree None None Favorable
19-2011 Astronomers n n nDoctoral or professional degree
None None Less Favorable
Appendix B: STEM Demand Data Table conti nued

48 Economic and Labor Market Informati on Bureau, New Hampshire Employment Security
STEM in New Hampshire: A Labor Demand-Supply Analysis
New Hampshire Long-term Occupati onal Projecti ons, 2010 to 2020
SOC Code Occupati on Title2010Base
2020Projected
Total Job
OpeningsEducati on Value
NH License
Work/ Experience Value
Job Training Value Descriptor
19-2012 Physicists 55 55 2Doctoral or professional degree
None None Not Favorable
19-2021 Atmospheric and Space Scienti sts 50 56 1 Bachelor’s degree None None Favorable
19-2031 Chemists 140 153 6 Bachelor’s degree None None Favorable
19-2032 Materials Scienti sts 37 41 1 Bachelor’s degree None None Less
Favorable
19-2041 Environmental Scienti sts and Specialists, Including Health 408 481 19 Bachelor’s
degree Yes None None Very Favorable
19-2042 Geoscienti sts, Except Hydrologists and Geographers 82 103 4 Bachelor’s
degree Yes None None Favorable
19-2043 Hydrologists 64 73 3 Master’s degree None None Favorable
19-2099 Physical Scienti sts, All Other 205 223 9 Bachelor’s degree None None Favorable
19-4011 Agricultural and Food Science Technicians n n n Associate’s
degree None None Less Favorable
19-4021 Biological Technicians 200 233 10 Bachelor’s degree None None Favorable
19-4031 Chemical Technicians 110 122 3 Associate’s degree None Moderate-
term OJTLess Favorable
19-4041 Geological and Petroleum Technicians 15 17 0 Associate’s degree None Moderate-
term OJTLess Favorable
19-4051 Nuclear Technicians n n n Associate’s degree None Moderate-
term OJTLess Favorable
19-4091 Environmental Science and Protecti on Technicians, Including Health 163 196 10 Associate’s
degree Yes None Moderate-term OJT
Very Favorable
19-4092 Forensic Science Technicians 44 50 3 Bachelor’s degree None Moderate-
term OJT Favorable
19-4093 Forest and Conservati on Technicians 85 85 4 Associate’s degree None None Not
Favorable
19-4099 Life, Physical, and Social Science Technicians, All Other 456 510 25 Associate’s
degree None Moderate-term OJT
Very Favorable
41-4011Sales Representati ves, Wholesale and Manufacturing, Technical and Scienti fi c Products
3,882 4,480 151 Bachelor’s degree None Moderate-
term OJTVery Favorable
41-9031 Sales Engineers 423 477 19 Bachelor’s degree None Moderate-
term OJTVery Favorable
19-3011 Economists 16 16 0 Bachelor’s degree None None Not
Favorable
Appendix B: STEM Demand Data Table conti nued

STEM in New Hampshire: A Labor Demand-Supply Analysis
Economic and Labor Market Informati on Bureau, New Hampshire Employment Security 49
New Hampshire Long-term Occupati onal Projecti ons, 2010 to 2020
SOC Code Occupati on Title2010Base
2020Projected
Total Job
OpeningsEducati on Value
NH License
Work/ Experience Value
Job Training Value Descriptor
19-3022 Survey Researchers 111 115 3 Bachelor’s degree None None Not
Favorable
19-3031 Clinical, Counseling, and School Psychologists 692 794 32
Doctoral or professional degree
Yes None Internship/residency
Very Favorable
19-3039 Psychologists, All Other 47 55 3 Master’s degree None Internship/
residency Favorable
19-3051 Urban and Regional Planners 275 300 9 Master’s degree None None Favorable
19-3091 Anthropologists and Archeologists 10 14 0 Master’s degree None None Less
Favorable
19-3099 Social Scienti sts and Related Workers, All Other 115 124 6 Bachelor’s
degree None None Favorable
19-4061 Social Science Research Assistants 27 32 2 Associate’s degree None None Favorable
25-1000 Postsecondary STEM Teachers1 2,080 2,356 57Doctoral or professional degree
None None Very Favorable
11-9111 Medical and Health Services Managers 1,301 1,547 57 Bachelor’s
degree Yes None None Very Favorable
25-1072 Nursing Instructors and Teachers, Postsecondary 224 254 7 Master’s
degree Yes None None Favorable
29-1011 Chiropractors 207 251 8Doctoral or professional degree
Yes None None Very Favorable
29-1020 Denti sts2 527 597 22Doctoral or professional degree
Yes None Internship/residency
Very Favorable
29-1031 Dieti ti ans and Nutriti onists 311 357 16 Bachelor’s degree Yes None Internship/
residencyVery Favorable
29-1041 Optometrists 142 180 9Doctoral or professional degree
Yes None None Very Favorable
29-1051 Pharmacists 1,885 2,136 73Doctoral or professional degree
Yes None None Very Favorable
29-1060 Physicians and Surgeons2 2,885 3,436 111Doctoral or professional degree
Yes None Internship/residency
Very Favorable
29-1071 Physician Assistants 459 573 20 Master’s degree Yes None None Very
Favorable
29-1081 Podiatrists 43 50 2Doctoral or professional degree
Yes None Internship/residency Favorable
29-1111 Registered Nurses3 13,961 17,055 562 Associate’s degree Yes None None Very
Favorable
29-1122 Occupati onal Therapists 866 1,042 34 Master’s degree Yes None None Very
Favorable
1. Data for Postsecondary Teachers requiring a Doctorate or Professional degree have been combined to this summary level. 2. Data for Denti sts, all specializati ons and Physicians and Surgeons, all specializati ons have been combined to summary levels.3. Data for Registered Nurses includes other nursing specialti es: Nurse Anestheti sts, Nurse Midwives, and Nurse Practi ti oners
Appendix B: STEM Demand Data Table conti nued
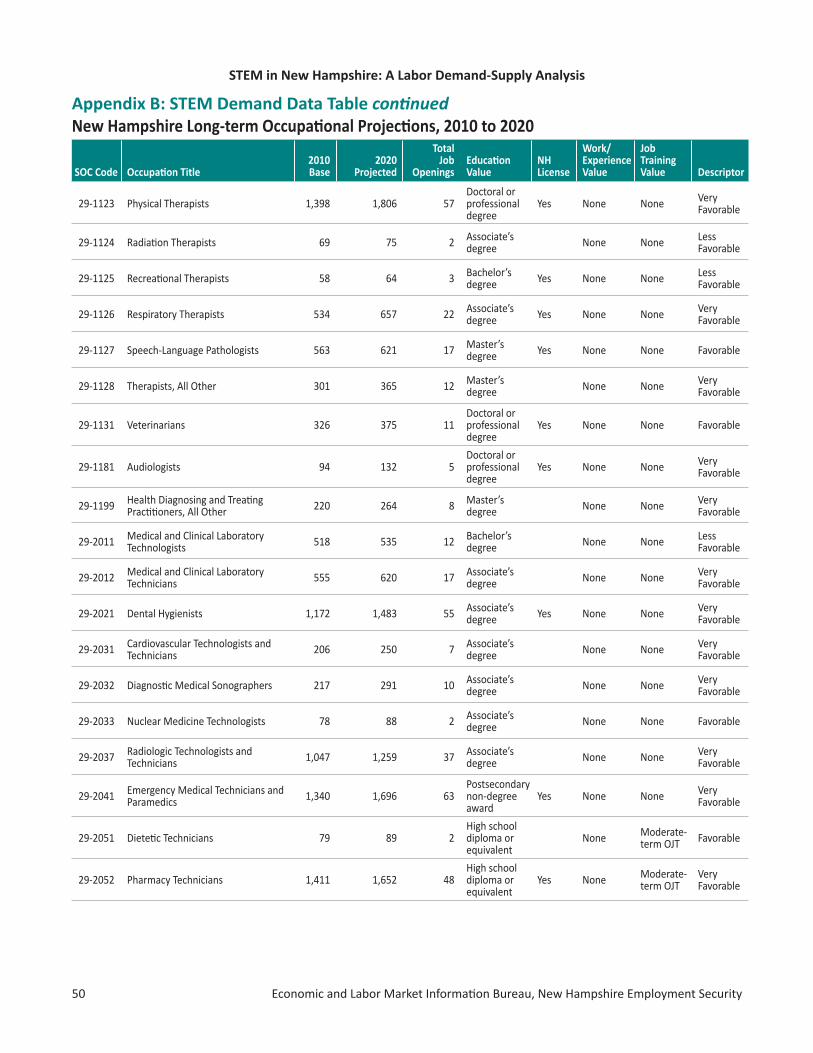
50 Economic and Labor Market Informati on Bureau, New Hampshire Employment Security
STEM in New Hampshire: A Labor Demand-Supply Analysis
New Hampshire Long-term Occupati onal Projecti ons, 2010 to 2020
SOC Code Occupati on Title2010Base
2020Projected
Total Job
OpeningsEducati on Value
NH License
Work/ Experience Value
Job Training Value Descriptor
29-1123 Physical Therapists 1,398 1,806 57Doctoral or professional degree
Yes None None Very Favorable
29-1124 Radiati on Therapists 69 75 2 Associate’s degree None None Less
Favorable
29-1125 Recreati onal Therapists 58 64 3 Bachelor’s degree Yes None None Less
Favorable
29-1126 Respiratory Therapists 534 657 22 Associate’s degree Yes None None Very
Favorable
29-1127 Speech-Language Pathologists 563 621 17 Master’s degree Yes None None Favorable
29-1128 Therapists, All Other 301 365 12 Master’s degree None None Very
Favorable
29-1131 Veterinarians 326 375 11Doctoral or professional degree
Yes None None Favorable
29-1181 Audiologists 94 132 5Doctoral or professional degree
Yes None None Very Favorable
29-1199 Health Diagnosing and Treati ng Practi ti oners, All Other 220 264 8 Master’s
degree None None Very Favorable
29-2011 Medical and Clinical Laboratory Technologists 518 535 12 Bachelor’s
degree None None Less Favorable
29-2012 Medical and Clinical Laboratory Technicians 555 620 17 Associate’s
degree None None Very Favorable
29-2021 Dental Hygienists 1,172 1,483 55 Associate’s degree Yes None None Very
Favorable
29-2031 Cardiovascular Technologists and Technicians 206 250 7 Associate’s
degree None None Very Favorable
29-2032 Diagnosti c Medical Sonographers 217 291 10 Associate’s degree None None Very
Favorable
29-2033 Nuclear Medicine Technologists 78 88 2 Associate’s degree None None Favorable
29-2037 Radiologic Technologists and Technicians 1,047 1,259 37 Associate’s
degree None None Very Favorable
29-2041 Emergency Medical Technicians and Paramedics 1,340 1,696 63
Postsecondary non-degree award
Yes None None Very Favorable
29-2051 Dieteti c Technicians 79 89 2High school diploma or equivalent
None Moderate-term OJT Favorable
29-2052 Pharmacy Technicians 1,411 1,652 48High school diploma or equivalent
Yes None Moderate-term OJT
Very Favorable
Appendix B: STEM Demand Data Table conti nued

STEM in New Hampshire: A Labor Demand-Supply Analysis
Economic and Labor Market Informati on Bureau, New Hampshire Employment Security 51
New Hampshire Long-term Occupati onal Projecti ons, 2010 to 2020
SOC Code Occupati on Title2010Base
2020Projected
Total Job
OpeningsEducati on Value
NH License
Work/ Experience Value
Job Training Value Descriptor
29-2053 Psychiatric Technicians n n nPostsecondary non-degree award
None Short-term OJT Favorable
29-2054 Respiratory Therapy Technicians 38 39 1 Associate’s degree None Moderate-
term OJTNot Favorable
29-2055 Surgical Technologists 307 341 8Postsecondary non-degree award
None None Favorable
29-2056 Veterinary Technologists and Technicians 654 828 28 Associate’s
degree None None Very Favorable
29-2061 Licensed Practi cal and Licensed Vocati onal Nurses 2,663 3,187 123
Postsecondary non-degree award
Yes None None Very Favorable
29-2071 Medical Records and Health Informati on Technicians 1,080 1,260 40
Postsecondary non-degree award
None None Very Favorable
29-2081 Opti cians, Dispensing 345 393 12High school diploma or equivalent
Yes None Long-term OJT Favorable
29-2091 Orthoti sts and Prostheti sts 33 34 1 Master’s degree None None Not
Favorable
29-2799 Health Technologists and Technicians, All Other 635 756 25
Postsecondary non-degree award
None Short-term OJT
Very Favorable
29-9011 Occupati onal Health and Safety Specialists 207 224 9 Bachelor’s
degree Yes None Moderate-term OJT Favorable
29-9012 Occupati onal Health and Safety Technicians n n n
High school diploma or equivalent
None Moderate-term oOJT
Less Favorable
29-9091 Athleti c Trainers 106 133 6 Bachelor’s degree Yes None None Very
Favorable
29-9799Healthcare Practi ti oners and Technical Workers, All Other, including geneti c counselors
549 644 29 Bachelor’s degree None None Very
Favorable
Appendix B: STEM Demand Data Table conti nued

52 Economic and Labor Market Informati on Bureau, New Hampshire Employment Security
STEM in New Hampshire: A Labor Demand-Supply Analysis
Appendix C: Supply-Demand ComparisonStandard
Occupati onal Classifi cati on
(SOC) Occupati onal Title
NEW Supply/ 2011 NH
Completers Match
2010 - 2020 Projecti ons
Demand/Annual Openings
Diff erence:NEW Supply less Annual
Demand
11-3021 Computer and Informati on Systems Managers 32 81 (49)
11-9041 Engineering Managers 247 24 223
11-9111 Medical and Health Services Managers 214 57 157
11-9121 Natural Sciences Managers 295 7 288
15-1111 Computer and Informati on Research Scienti sts 5 3 2
15-1121 Computer Systems Analysts 23 105 (82)
15-1179 Informati on Security Analysts, Web Developers, and Computer Network Architects 53 28 25
15-1150 Computer Support Specialists 26 118 NA
15-1131 Computer Programmers 11 52 (41)
15-1132 Soft ware Developers, Applicati ons 20 173 (153)
15-1133 Soft ware Developers, Systems Soft ware 19 72 (53)
15-1141 Database Administrators 21 21 0
15-1142 Network and computer systems architects and administrators 20 66 (46)
15-1799 Computer Occupati ons, All Other 33 36 (3)
15-2011 Actuaries 2 5 (3)
15-2021 Mathemati cians 7 NP NA
15-2031 Operati ons Research Analysts 0 6 (6)
15-2041 Stati sti cians 7 6 1
15-2091 Mathemati cal Technicians NA no NH data
15-2099 Mathemati cal Science Occupati ons, All Other 52 1 51
17-1011 Architects, Except Landscape and Naval 25 11 14
17-1012 Landscape Architects 0 4 (4)
17-1021 Cartographers and Photogrammetrists 0 4 (4)
17-1022 Surveyors 0 13 (13)
17-2011 Aerospace Engineers 46 NP NA
17-2021 Agricultural Engineers NA NP
17-2031 Biomedical Engineers 2 4 (2)
17-2041 Chemical Engineers 17 3 14
17-2051 Civil Engineers 49 36 13
17-2061 Computer Hardware Engineers 5 6 (1)
17-2071 Electrical Engineers 12 31 (19)
17-2072 Electronics Engineers, Except Computer 12 15 (3)
17-2081 Environmental Engineers 6 13 (7)

STEM in New Hampshire: A Labor Demand-Supply Analysis
Economic and Labor Market Informati on Bureau, New Hampshire Employment Security 53
Appendix C: Supply-Demand Comparison conti nued
Standard Occupati onal Classifi cati on
(SOC) Occupati onal Title
NEW Supply/ 2011 NH
Completers Match
2010 - 2020 Projecti ons
Demand/Annual Openings
Diff erence:NEW Supply less Annual
Demand
17-2111 Health and Safety Engineers, Except Mining Safety Engineers and Inspectors 7 1 6
17-2112 Industrial Engineers 0 31 (31)
17-2121 Marine Engineers and Naval Architects 0 no NH data NA
17-2131 Materials Engineers 0 2 (2)
17-2141 Mechanical Engineers 34 55 (21)
17-2151 Mining and Geological Engineers, Including Mining Safety Engineers 0 NP NA
17-2161 Nuclear Engineers 0 NP NA
17-2171 Petroleum Engineers 0 0
17-2199 Engineers, All Other 127 50 77
17-3011 Architectural and Civil Draft ers 2 8 (6)
17-3012 Electrical and Electronics Draft ers 2 3 (1)
17-3013 Mechanical Draft ers 2 5 (3)
17-3019 Draft ers, All Other 2 7 (5)
17-3021 Aerospace Engineering and Operati ons Technicians 0 NP NA
17-3022 Civil Engineering Technicians 19 6 13
17-3023 Electrical and Electronic Engineering Technicians 29 19 10
17-3024 Electro-Mechanical Technicians 0 1 (1)
17-3025 Environmental Engineering Technicians 0 NP NA
17-3026 Industrial Engineering Technicians 8 7 1
17-3027 Mechanical Engineering Technicians 32 8 24
17-3029 Engineering Technicians, Except Draft ers, All Other 24 13 11
17-3031 Surveying and Mapping Technicians NA 7
19-1011 Animal Scienti sts 1 0 1
19-1012 Food Scienti sts and Technologists NA 1
19-1013 Soil and Plant Scienti sts 7 1 6
19-1021 Biochemists and Biophysicists 3 NP NA
19-1022 Microbiologists 0 1 (1)
19-1023 Zoologists and Wildlife Biologists 27 3 24
19-1029 Biological Scienti sts, All Other 7 2 5
19-1031 Conservati on Scienti sts 8 1 7
19-1032 Foresters 11 1 10
19-1041 Epidemiologists 0 NP NA
19-1042 Medical Scienti sts, Except Epidemiologists 6 14 (8)
19-1099 Life Scienti sts, All Other 58 1 57
19-2011 Astronomers 0 NP NA
19-2012 Physicists 7 2 5
19-2021 Atmospheric and Space Scienti sts 11 1 10
19-2031 Chemists 29 6 23

54 Economic and Labor Market Informati on Bureau, New Hampshire Employment Security
STEM in New Hampshire: A Labor Demand-Supply Analysis
Standard Occupati onal Classifi cati on
(SOC) Occupati onal Title
NEW Supply/ 2011 NH
Completers Match
2010 - 2020 Projecti ons
Demand/Annual Openings
Diff erence:NEW Supply less Annual
Demand
19-2032 Materials Scienti sts 1 1 0
19-2041 Environmental Scienti sts and Specialists, Including Health 164 19 145
19-2042 Geoscienti sts, Except Hydrologists and Geographers 14 4 10
19-2043 Hydrologists 5 3 2
19-2099 Physical Scienti sts, All Other NA 9
19-3011 Economists 169 0 169
19-3022 Survey Researchers 123 3 120
19-3031 Clinical, Counseling, and School Psychologists 33 32 1
19-3032 Industrial-Organizati onal Psychologists 22 no NH data NA
19-3039 Psychologists, All Other NA 3
19-3041 Sociologists 13 9 4
19-3051 Urban and Regional Planners 0 0 0
19-3091 Anthropologists and Archeologists 0 no NH data NA
19-3092 Geographers 51 no NH data NA
19-3094 Politi cal Scienti sts 46 6 40
19-3099 Social Scienti sts and Related Workers, All Other 38 NP NA
19-4011 Agricultural and Food Science Technicians 0 10 (10)
19-4021 Biological Technicians NA 3
19-4031 Chemical Technicians 0 0 0
19-4041 Geological and Petroleum Technicians 0 NP NA
19-4051 Nuclear Technicians 0 2 (2)
19-4061 Social Science Research Assistants 44 10 34
19-4091 Environmental Science and Protecti on Technicians, Including Health NA 3
19-4092 Forensic Science Technicians 0 4 (4)
19-4093 Forest and Conservati on Technicians 15 25 (10)
19-4099 Life, Physical, and Social Science Technicians, All Other NA 4
25-1000 Postsecondary Teachers1 0 53 (6)
25-1071 Health Specialti es Teachers, Postsecondary 50 7 43
25-1072 Nursing Instructors and Teachers, Postsecondary 50 8 42
29-1011 Chiropractors 0
29-1020 Denti sts2 0 22 (22)
29-1031 Dieti ti ans and Nutriti onists 17 16 1
Appendix C: Supply-Demand Comparison conti nued

STEM in New Hampshire: A Labor Demand-Supply Analysis
Economic and Labor Market Informati on Bureau, New Hampshire Employment Security 55
Standard Occupati onal Classifi cati on
(SOC) Occupati onal Title
NEW Supply/ 2011 NH
Completers Match
2010 - 2020 Projecti ons
Demand/Annual Openings
Diff erence:NEW Supply less Annual
Demand
29-1041 Optometrists 0 9 (9)
29-1051 Pharmacists 51 73 (22)
29-1060 Physicians and Surgeons2 68 111 NA
29-1071 Physician Assistants 53 20 33
29-1081 Podiatrists 0 2 (2)
29-1111 Registered Nurses3 796 562 234
29-1122 Occupati onal Therapists 62 34 28
29-1123 Physical Therapists 41 57 (16)
29-1124 Radiati on Therapists 1 2 (1)
29-1125 Recreati onal Therapists 0 3 (3)
29-1126 Respiratory Therapists 5 22 (17)
29-1127 Speech-Language Pathologists 25 17 8
29-1128 Exercise Physiologists 9 9
29-1129 Therapists, All Other 9 12 6
29-1131 Veterinarians 0 0
29-1181 Audiologists 0 5 (5)
29-1199 Health Diagnosing and Treati ng Practi ti oners, All Other NA 8
29-2011 Medical and Clinical Laboratory Technologists 25 12 13
29-2012 Medical and Clinical Laboratory Technicians 9 17 (8)
29-2021 Dental Hygienists 28 55 (27)
29-2031 Cardiovascular Technologists and Technicians 0 7 (7)
29-2032 Diagnosti c Medical Sonographers 0 10 (10)
29-2033 Nuclear Medicine Technologists NA 2
29-2034 Radiologic Technologists and Technicians 4 4
29-2035 Magneti c Resonance Imaging - Radiologic Technologists and Technicians NA 37
29-2041 Emergency Medical Technicians and Paramedics NA 63
29-2051 Dieteti c Technicians 16 2 14
29-2052 Pharmacy Technicians NA 48
29-2053 Psychiatric Technicians NA NP
29-2054 Respiratory Therapy Technicians 6 1 5
29-2055 Surgical Technologists 10 8 2
29-2056 Veterinary Technologists and Technicians 32 28 4
29-2057 Opthalmic Medical Technicians NA
29-2061 Licensed Practi cal and Licensed Vocati onal Nurses 106 123 (17)
29-2071 Medical Records and Health Informati on Technicians 77 40 37
Appendix C: Supply-Demand Comparison conti nued

56 Economic and Labor Market Informati on Bureau, New Hampshire Employment Security
STEM in New Hampshire: A Labor Demand-Supply Analysis
Standard Occupati onal Classifi cati on
(SOC) Occupati onal Title
NEW Supply/ 2011 NH
Completers Match
2010 - 2020 Projecti ons
Demand/Annual Openings
Diff erence:NEW Supply less Annual
Demand
29-2081 Opti cians, Dispensing NA 12
29-2091 Orthoti sts and Prostheti sts 0 1 (1)
29-2092 Hearing Aid Specialists NA
29-2099 Health Technologists and Technicians, All Other NA 25
29-9011 Occupati onal Health and Safety Specialists 87 9 78
29-9012 Occupati onal Health and Safety Technicians 0 NP NA
29-9091 Athleti c Trainers 16 6 10
29-9092 Geneti c Counselors 0 0
29-9099 Healthcare Practi ti oners and Technical Workers, All Other NA 29
41-4011 Sales Representati ves, Wholesale and Manufacturing, Technical and Scienti fi c Products NA 151
41-9031 Sales Engineers NA 19
NOTE: Completers for NEW Supply were distributed proporti onately to qualifying occupati ons
1. Occupati ons combined due to SOC code changes made in 2010
15-1150 - Computer Support Specialists includes Computer User Support Specialists and Computer Network Support Specialists
2. Data for Postsecondary Teachers requiring a Doctorate or Professional degree have been combined to this summary level.
3. Data for Denti sts, all specializati ons and Physicians and Surgeons, all specializati ons have been combined to summary levels.
4. Data for Registered Nurses includes other nursing specialti es: Nurse Anestheti sts, Nurse Midwives, and Nurse Practi ti oners
NP - Employment data does not meet disclosure standards
NA - Data not available
Appendix C: Supply-Demand Comparison conti nued

STEM in New Hampshire: A Labor Demand-Supply Analysis
Economic and Labor Market Informati on Bureau, New Hampshire Employment Security 57
Appendix D: REMI Methodology
The explanation below is the economic theory and empirical data behind the REMI model.
The REMI ModelREMI Policy Insight® is a structural model, meaning that it clearly includes cause-and-effect relationships. The model is based on two key underlying assumptions from mainstream economic theory: households maximize utility and producers maximize profits. Since these assumptions make sense to most people, lay people as well as trained economists can understand the model. The tool is often used by economic developers and planners to gage the potential impact on a regional economy of proposed projects such as transportation infrastructure, office and retail development, relocation or expansion of businesses, etc.
In the model, businesses produce goods and services to sell locally to other firms, investors, governments, and individuals, and to sell as exports to purchasers outside the region. The output is produced using labor, capital, fuel, and intermediate inputs. The demand, per unit of output, for labor, capital, and fuel depends on their relative costs, since an increase in the price of any one of these inputs leads to substitution away from that input to other inputs. The supply of labor in the model depends on the number of
people in the population and the proportion of those people who participate in the labor force. Economic migration affects the population size. People will move into an area if the real after-tax wage rates or the likelihood of being employed increases in a region.
Supply and demand for labor determine the wage rates in the model. These wage rates, along with other prices and productivity, determine the cost of doing business for each industry in the model. An increase in the cost of doing business causes either an increase in prices or a cut in profits, depending on the market for the product. In either case, an increase in costs would decrease the share of the local and U.S. market supplied by local firms. This market share, combined with the demand described above, determines the amount of local output. Many other feedbacks are incorporated in the model. For example, changes in wages and employment impact income and consumption, while economic expansion changes investment, and population growth impacts government spending.
The effects of a change scenario to the model are determined by comparing the baseline REMI forecast with an alternative forecast that incorporates the assumptions for the change scenario.

58 Economic and Labor Market Informati on Bureau, New Hampshire Employment Security
STEM in New Hampshire: A Labor Demand-Supply Analysis