in quest of new fingerprints of exposure to vocs from...
TRANSCRIPT

In Quest of New Fingerprints
of Exposure to VOCs from
Consumer Products
Dr Juana Maria Delgado-Saborit
Division of Environmental Health and Risk Management
University of Birmingham, UK
CEFIC-LRI 2010 Innovative Science Award

1. INTRODUCTION
2. HYPOTHESIS AND OBJECTIVES
3. METHODOLOGY
4. PROGRESS UPDATE
5. FUTURE STEPS
6. RESEARCH TEAM
INDEX

INTRODUCTION

1. INTRODUCTION
Are VOC concentrations indoors
relevant to human exposure?

1. INTRODUCTION
CONTRIBUTION OF INDOOR AIR TO PERSONAL EXPOSURES (PE)
TIME SPENT IN MICROENVIRONMENTS
Indoors 80–93%
In Transit –vehicles 1–7%
Outdoors 2–7%
(Harrison et al. 2009, Brunekreef et al. 2005)
MICROENVIRONMENT
CONTRIBUTION TO PE
Indoors 68% - 77%
In Transit 30% - 6%
Outdoors 2% - 3% (Bruinen de Bruin et al. 2008, Harrison et al. 2009)
CAR
FRIENDS' HOUSE
HOME
PUB
RESTAURANT
STREET
OFFICE
OTHERS
INDOOR SOURCE OF VOCs
Consumer Products
1. INTRODUCTION
Can we trace exposures to VOCs
in the human body?

1. INTRODUCTION
PATHWAY OF VOCs IN THE BODY
RESPIRATORY SYSTEM
Inhalation
CIRCULATORY SYSTEM
Distribution
DIGESTIVE SYSTEM – LIVER
Metabolism
RENAL SYSTEM
Excretion
IN
OUT
• Personal
Exposures
• Lung Doses
• Biomarkers of
Exposure
• Biomarkers of
Effect
TRACERS ?
– Searching for the tracers

1. INTRODUCTION
PERSONAL EXPOSURES VS LUNG DOSE
PERSONAL EXPOSURES
Measured at the breathing area
2 – 5 µg/m3 in Europe
LUNG DOSE
Mass of pollutant inhaled in the lungs
100 (70 – 500) µg/day in Europe
Depends on:
• Concentration in the breathing area (PE)
• Duration of exposure
• Minute ventilation
• Age
• Gender
• Fitness
• Level of exertion
• Presence of disease
1. INTRODUCTION
(Nerbert et al 2002; ATSDR 2007)
Biomarkers of
Exposure
?
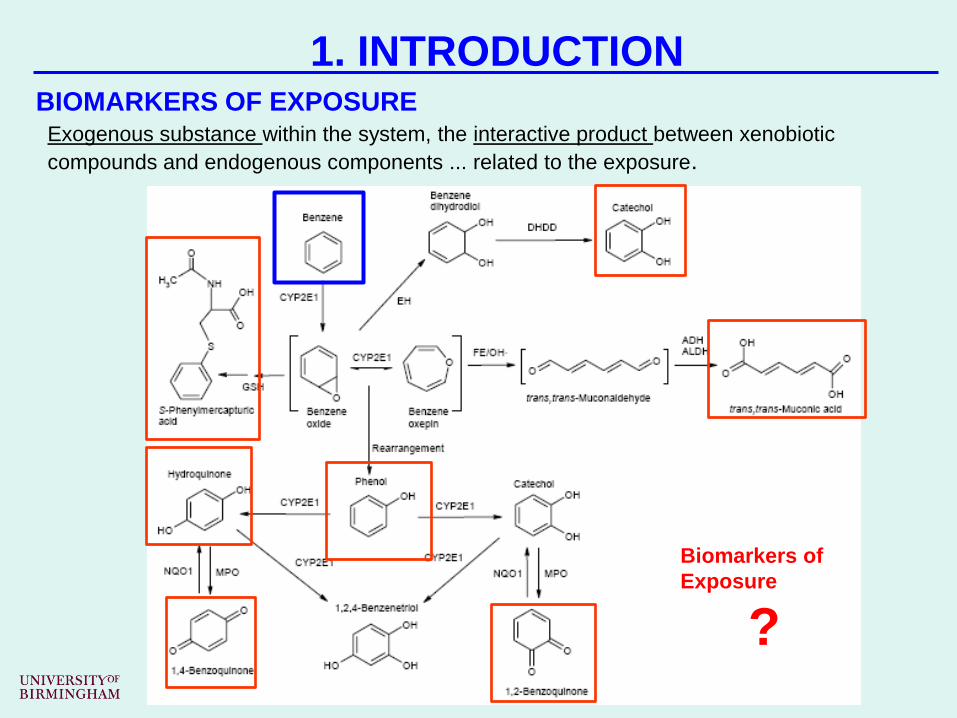
BIOMARKERS OF EXPOSURE Exogenous substance within the system, the interactive product between xenobiotic
compounds and endogenous components ... related to the exposure.

1. INTRODUCTION
BIOMARKERS OF EXPOSURE
(Rappaport et al. 2010. Chem-Biolog Interact: 189)
(Harrison et al. 2009. HEI)
(Farmer et al. 2005. Chem-Biolog Interact : 97)
HIGH EXPOSURES
LOW EXPOSURES

1. INTRODUCTION
BIOMARKERS OF EXPOSURE
(Nerbert et al 2002; ATSDR 2007)
Biomarkers of
Exposure at low
concentrations
?

www.genome.jp/kegg/pathway/map/map01100.html Image may be subject to copyright.
1. INTRODUCTION
BIOMARKERS OF EFFECT
• Recognise changes in pattern of endogenous metabolites (natural
occurring substances) after xenobiotic exposure
• Connects molecular events to those at the macro level
Xenobiotic (e.g. pollutants) metabolism
might affect other metabolic processes...
... Metabolomics might help identify new
biomarkers...
METABOLOMICS
Indicator of an endogenous component of the
biological system, a measure of the functional
capacity of the system, or an altered state of
the system that is recognized as impairment or
disease.
1. INTRODUCTION
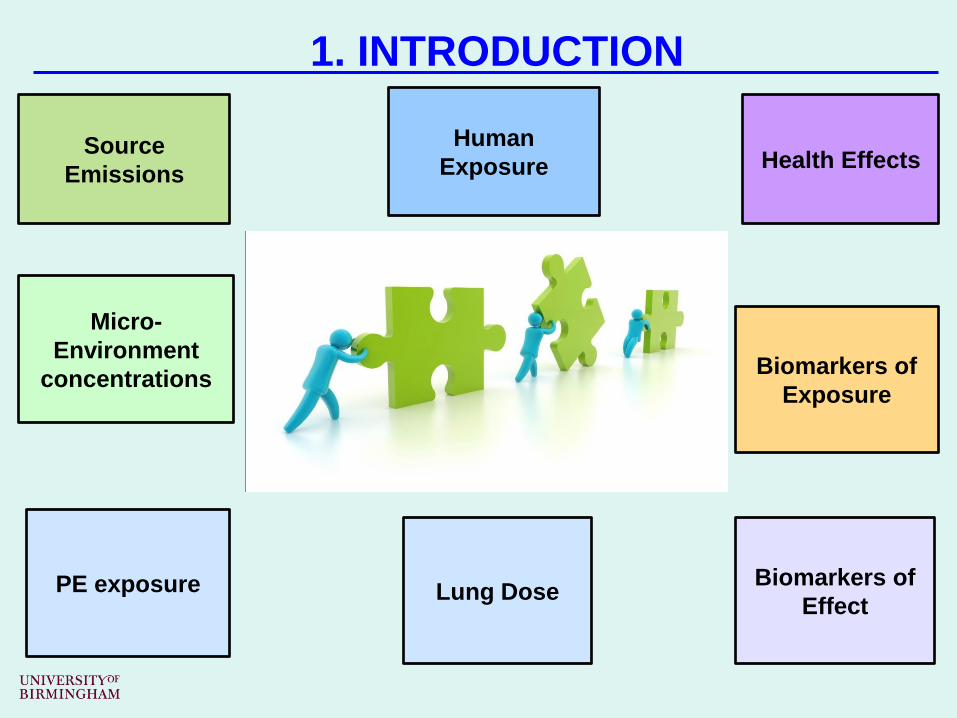
Source
Emissions
Micro-
Environment
concentrations
PE exposure Lung Dose
Biomarkers of
Exposure
Biomarkers of
Effect
Human
Exposure Health Effects

MARKERS
Source Emissions
Transport & Transformation
Human
Exposure
Bio-
availability
METABOLISM
Accumulation
Transformation
Elimination
Early
Expression
of Disease
Altered
Function
Clinical
Disease
1. INTRODUCTION
EXPOSURE-EFFECTS CONTINUUM
Micro-
Environment
concentrations
VOC indoors
PE
exposure
VOC PE
Lung
Dose
VOC
inhaled
Biomarkers of
Exposure
U-BZ
1,4-BQ
EXOGENOUS
Biomarkers of
Effect
Metabolic
Profiles
ENDOGENOUS

HYPOTHESIS AND
OBJECTIVES

Source Emissions
Transport & Transformation
Human
Exposure
Bio-
availability
METABOLISM
Accumulation
Transformation
Elimination
Early
Expression
of Disease
Altered
Function
Clinical
Disease
2. HYPOTHESIS AND OBJECTIVES
HYPOTHESIS: EXPOSURE-EFFECTS CONTINUUM
The general population is exposed to different VOC emitted from
consumer products and building materials.
Doses of inhaled VOCs are metabolised producing biomarkers of
exposure (exogenous) and effect (endogenous), that can be
detected from urine samples

2. HYPOTHESIS AND OBJECTIVES
Characterise VOC concentrations in indoor microenvironments
relevant to personal exposures (home and workplace)
OBJECTIVES
Characterise personal exposures to a common range of chemicals
used in consumer products and building materials
Model inhalation doses and personal exposures using
microenvironment concentrations and subject information
Characterise biomarkers of exposure to low-level VOC
concentrations
Discover biomarkers of effect using metabolomics
MARKERS
Micro-
Environment
concentrations
VOC indoors
PE
exposure
VOC PE
Lung
Dose
VOC
inhaled
Biomarkers of
Exposure
U-BZ
1,4-BQ
EXOGENOUS
Biomarkers of
Effect
Metabolic
Profiles
ENDOGENOUS

METHODOLOGY

WP2:
MicroEnvironment
Sampling
WP 5: Urine
Sampling
WP3: PE & ME
VOC analysis
PE
concentration
3. METHODOLOGY
WP1:Subject
Recruitment
WP 2: Personal
Exposure Sampling
WP2: PE & ME data
collection
WP5:Metabol-
omic analysis
WP5:Quinone
urine analysis
WP5: VOC
urine analysis
ME
concentration
WP 4:
Lung
Dose
Biomarker of
Exposure
Biomarker of
Effect
WP 7: Data
Analysis
QA/QC
WP 8:
Dissemination

PROGRESS UPDATE

WP2:
MicroEnvironment
Sampling
WP 5:Urine
Sampling
WP3: PE & ME
VOC analysis
PE
concentration
WP1:Subject
Recruitment
WP 2: Personal
Exposure Sampling
WP2: PE & ME data
collection
WP5:Metabol-
omic analysis
WP5:Quinone
urine analysis
WP5: VOC
urine analysis
ME
concentration
WP 4:
Lung
Dose
Biomarker of
Exposure
Biomarker of
Effect
WP 7: Data
Analysis
QA/QC
WP 8:
Dissemination
4. PROGRESS UPDATE

SUBJECT RECRUITMENT
GROUP 1 (N=15)
Occupationally
Exposed
GROUP 2 (N=15)
Medium – VOC
exposed
GROUP 3 (N=15)
Control
• Workers from steel foundries, oil storage
depots, petrol station attendants,
motor mechanics, bus drivers.
• “Birmingham is the city of all trades”
• Subjects living / working in new or
redecorated / refurbished buildings.
• New Hospital, Muirhead tower
• No occupationally exposed subjects, nor
living/working in new or redecorated buildings.
• Big database of subjects from previous studies
4. PROGRESS UPDATE

• 24- hour personal sample
• Samples collected
•VOC in sorbent tubes
• PM2.5 in Teflon filters
•PAH, quinones
• BC real time - microAethalometer
• Urine collected the day after
SAMPLING EQUIPMENT
• Group 1 & 3. Sampled once
• Group 2. Sampled twice:
•1st : when building new/redecorated
• 2nd : One year later
SAMPLING STRATEGY • Concurrent Measurement
• PERSONAL EXPOSURE
• HOME
• WORK
• URINE COLLECTION
4. PROGRESS UPDATE

4. PROGRESS UPDATE RECRUITMENT AND SAMPLING
GROUP 1 (N=15)
Occupationally
Exposed
GROUP 2 (N=15)
Medium – VOC
exposed
GROUP 3 (N=15)
Control
0
10
20
30
40
50
60
70
80
90
100
G1 Occupational Exposed
G2 New Buildings G3 Control Group
Perc
en
tag
e o
f Targ
et
(%)
Recruited Sampled

RECRUITMENT AND SAMPLING GROUP 1 (N=15)
Occupationally
Exposed Recruitment Steps
• PETROCHEMICAL INDUSTRY
• Discussions with a UK petrochemical company
• Failed
• Next step – Contact UK Petroleum Industry
Association (UKPIA)
• OTHER INDUSTRIES
• Arizona State University – UoB pilot campaign
• Test Suitability of Gardeners, Mechanics &
Decorators/Painters
4. PROGRESS UPDATE

• Goal:
– To test various occupational
exposures
• Equipment:
– Hybrid Device – ASU design
– Shoulder bag
• Procedure:
– Device is given to user to
sample their occupational
exposure for approximately 15
minutes
– Device is taken back by the
researchers and set down for
approximately 45 minutes as
the device runs
The device was fixed in a
bag so the user could
easily carry the device as
they worked.
Inlet
RECRUITMENT AND SAMPLING
Arizona State University / UoB pilot campaign – Occupational Testing
4. PROGRESS UPDATE

• Three different occupational exposures were considered:
– Gardening
– Garage/mechanics
– Painting
RECRUITMENT AND SAMPLING
Arizona State University / UoB pilot campaign – Occupational Testing
4. PROGRESS UPDATE

RECRUITMENT AND SAMPLING
Arizona State University / UoB pilot campaign – Occupational Testing
0
20
40
60
80
100
120
140
160
180
200
Be
nze
ne
Co
nc
en
tra
tio
ns
(p
pb
) 4. PROGRESS UPDATE
G1 Target - Mechanics and Gardeners
Capleton and Levy (2005) Chem-Biolog Interactions 153-54: 43-53

WP2:
MicroEnvironment
Sampling
WP 5: Urine
Sampling
WP3: PE & ME
VOC analysis
PE
concentration
WP1:Subject
Recruitment
WP 2: Personal
Exposure Sampling
WP2: PE & ME data
collection
WP5:Metabol-
omic analysis
WP5:Quinone
urine analysis
WP5: VOC
urine analysis
ME
concentration
WP 4:
Lung
Dose
Biomarker of
Exposure
Biomarker of
Effect
WP 7: Data
Analysis
QA/QC
WP 8:
Dissemination
4. PROGRESS UPDATE

QUINONE URINE ANALYSIS
Expected Range of Concentrations
4. PROGRESS UPDATE
• Non Exposed 0.15 – 4.3 µg/mL (HQ)
• Exposed 0.26 – 47 µg/mL (HQ) Kim et al (2006) Carcinogenesis 27 (4): 772-781
Standard preparation
• BQ & BQ-d4 in ethanol
• 5 calibration standards ranging 0.1 – 200 µg/mL (BQ) & 200 µg/mL (BQ-d4)
• Matrix – artificial urine (Putnal (1971) NASA report)
Proposed methods
• Reversed-phase Solid Phase Extraction
• Liquid – Liquid Extraction

QUINONE URINE ANALYSIS
Reversed Solid Phase Extraction
4. PROGRESS UPDATE
Column selected C-18 Paci et al (2007) Biomarkers 14 (7): 502-512
SPE extraction Test 1
• Condition the column with acidified methanol (1% acetic)
• Rinse the column with acidified water (1% acetic)
• Load the column with the sample
• Rinse with acidified water
• Elute with methanol
No results – possible explanations:
• The phenol from the artificial urine is an interfering peak with the BQs
• The phenol interacts with the column, displacing the less hydrophobic
compounds (e.g. BQ)
• The ethanol in which the standards are dissolved affects the BQ – HQ
equilibrium

QUINONE URINE ANALYSIS
BQ – HQ equilibrium in different solvents
4. PROGRESS UPDATE
0%
10%
20%
30%
40%
50%
60%
70%
80%
90%
100%
Pentane DCM Ethanol Nonane Ethyl Acetate
BQ – HQ equilibrium Percentage of response
% of HQ % of BQ
-
20,000,000
40,000,000
60,000,000
80,000,000
100,000,000
120,000,000
140,000,000
160,000,000
Pentane DCM Ethanol Nonane Ethyl Acetate
BQ – HQ equilibrium Response
HQ Response/Weight BQ Response/Weight

QUINONE URINE ANALYSIS
Solid Phase Extraction
4. PROGRESS UPDATE
SPE extraction Test 2
• Standards are prepared with BQ or HQ in water and spiked in artificial urine
• Condition the column with ethyl acetate (pure, not acidified)
• Rinse the column with acidified water (0.1% HCl)
• Load the column with the sample (with or without acidification)
• Rinse with acidified water (0.1% HCl)
• Elute with ethyl acetate
0
2,000
4,000
6,000
8,000
p-benzoquinone Hydroquinone
Resp
on
se
SPE Artificial Urine
BQ Standard HQ Standard
0
5,000
10,000
15,000
20,000
25,000
p-benzoquinone Hydroquinone
Resp
on
se
SPE Acidified Artificial Urine
BQ Standard HQ Standard

QUINONE URINE ANALYSIS
Liquid- Liquid Extraction
4. PROGRESS UPDATE
Standards are prepared with BQ or HQ in water and spiked in artificial urine
Extraction of free metabolites
• Add ethyl acetate
• Shake 5 min
• Recover the ethyl acetate
• Dry with Na2SO4
0
1,000,000
2,000,000
3,000,000
p-benzoquinone Hydroquinone
Resp
on
se
L-L Artificial Urine
BQ Standard HQ Standard
0
400,000
800,000
1,200,000
1,600,000
p-benzoquinone Hydroquinone
Resp
on
se
L-L Acidified Artificial Urine
BQ Standard HQ Standard

QUINONE URINE ANALYSIS
Extractions from Real Urine
4. PROGRESS UPDATE
0
8,000
16,000
p-benzoquinone Hydroquinone
Re
sp
on
se
L-L Real Urine
0
2,500
5,000
p-benzoquinone Hydroquinone
Res
po
nse
L-L Acidified Real Urine
0
1,000
2,000
p-benzoquinone Hydroquinone
Res
po
ns
e
SPE Real Urine
0
400
800
p-benzoquinone Hydroquinone
Res
po
nse
SPE Acidified Real Urine

FUTURE STEPS
5. FUTURE STEPS SAMPLING
GROUP 1 (JAN-APR ’12)
• RECRUITMENT
• Contact UKPIA
• Contact Grounds Maintenance Service at UoB (target gardeners)
• Contact local Car Garages (target mechanics)
• SAMPLING
• Sampling scheduled for February – April ‘12
GROUP 2 / 3 (ongoing)
• RECRUITMENT
• Include new channels to advertise the recruitment (local newspaper)
• SAMPLING
• Continue sampling of Group 2 (new volunteers) and 3
• Repeat sampling of Group 2 (former volunteers) – August’12- onwards
ANALYSIS - ENVIRONMENTAL SAMPLES • Environmental Samples Analysis : May – Jun’12 & Feb-Mar’13
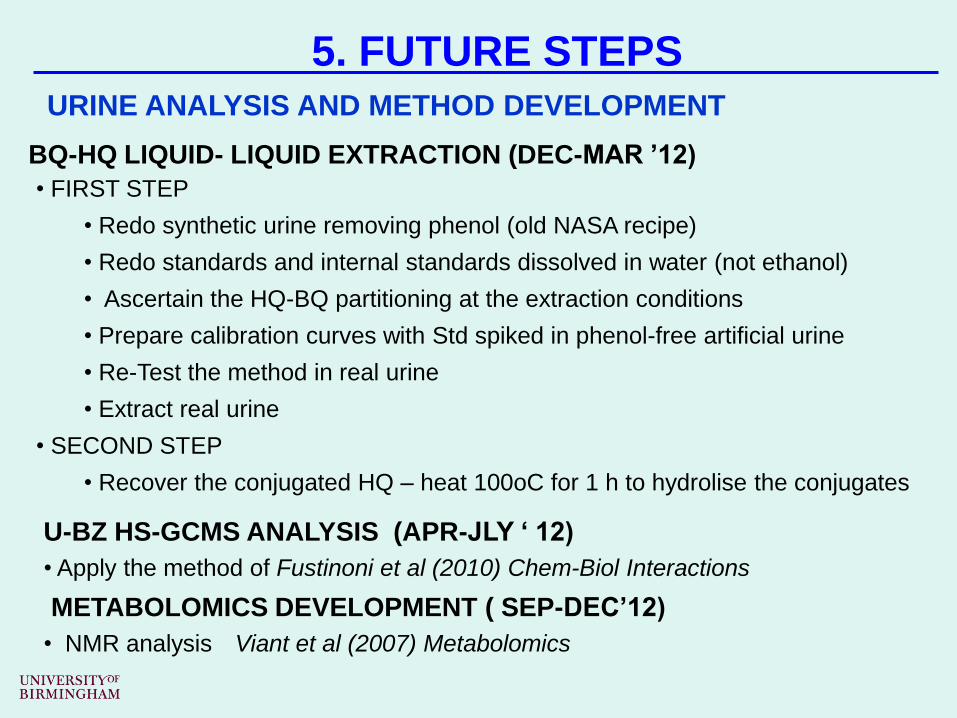
BQ-HQ LIQUID- LIQUID EXTRACTION (DEC-MAR ’12)
• FIRST STEP
• Redo synthetic urine removing phenol (old NASA recipe)
• Redo standards and internal standards dissolved in water (not ethanol)
• Ascertain the HQ-BQ partitioning at the extraction conditions
• Prepare calibration curves with Std spiked in phenol-free artificial urine
• Re-Test the method in real urine
• Extract real urine
• SECOND STEP
• Recover the conjugated HQ – heat 100oC for 1 h to hydrolise the conjugates
5. FUTURE STEPS URINE ANALYSIS AND METHOD DEVELOPMENT
U-BZ HS-GCMS ANALYSIS (APR-JLY ‘ 12)
• Apply the method of Fustinoni et al (2010) Chem-Biol Interactions
METABOLOMICS DEVELOPMENT ( SEP-DEC’12)
• NMR analysis Viant et al (2007) Metabolomics

RESEARCH TEAM
RESEARCH TEAM
Dr. Peyton Jacob III (UCSF)
Researcher specialist in
urinary biomarker analysis
Prof Roy Harrison (UoB)
Head of Division Env Health & Risk Manag.
UK NERC Env. Poll & Human Health Theme Leader
Dr. Mark Viant (UoB)
Director of UK NERC Biomolecular
Analysis Facilities Metabolomics
ADVISORY BOARD
Dr. Juana Mari Delgado-Saborit
Research Fellow
Research Coordinator
Mr. Massimiliano Mascelloni
PhD student – 2010 LRI Award funded
Urine Analysis and Method Development
Mrs. Barbara Macias Hernandez
PhD student – Mexican Government funded
Sampling and Environmental Analysis

Thanks for your attention
Thanks to CEFIC for the 2010 LRI Innovative
Science Award http://www.gees.bham.ac.uk/research/projects/airtoxics/index.shtml