in the deschutes river basin, oregon - u.s. fish and wildlife service
TRANSCRIPT
Page1�
Population structure and genetic characteristics of summer
steelhead (Oncorhynchus mykiss) in the Deschutes River Basin, Oregon
United States Fish & Wildlife Service Abernathy Fish Technology Center Report
Final Report
January 2011
Prepared by
Denise K. Hawkins1, Kevin S. Williamson1, Andrew P. Matala1,
David Hand2, Doug Olson2, and Howard Schaller2
1U.S. Fish & Wildlife Service, Abernathy Fish Technology Center, Conservation Genetics Program, 1440 Abernathy Creek Road, Longview, WA 98632, TEL: 360-425-6072, FAX: 360-636-1855, ([email protected])
2U.S. Fish & Wildlife Service, Columbia River Fisheries Program Office, 1211 SE Cardinal Ct., Suite 100, Vancouver, WA 98683, TEL: 360-604-2500, FAX: 360-604-2505, ([email protected]), ([email protected]), ([email protected])

Page2�
Abstract
The Deschutes River Basin represents a region of substantial diversity among
anadromous and resident forms of Oncorhynchus mykiss. However, the current distribution and
genetic origins of populations throughout the Deschutes River Basin have not been clearly
delineated. Using a suite of 17 microsatellite markers, we evaluated genetic structure among
Deschutes River Basin populations of steelhead. To provide a broader perspective of diversity
and to help assess the Interior Columbia River Technical Recovery Team (ICR-TRT) population
delineations, we also compared the steelhead collections to collections of redband trout from the
upper basin and the Oak Springs Hatchery rainbow trout stock that was planted in the Deschutes
River Basin. Whychus Creek redband trout appeared to be more genetically similar to O. mykiss
in the lower mainstem of the Deschutes River than to other collections included in this report,
which is inconsistent with the previous population delineation that includes Whychus Creek with
Deschutes-Westside populations. Below the Pelton-Round Butte Dam complex mainstem
collections were statistically different from tributary collections; however, there were no
statistically significant differences between Deschutes-Westside and Deschutes-Eastside
populations below the Pelton-Round Butte Dam complex. These data suggest that the previous
delineation of populations into Deschutes-Westside and Deschutes-Eastside by the ICR-TRT
does not reflect observed genetic relationships.

Page3�
Introduction
Summer steelhead trout (anadromous form of Oncorhynchus mykiss) in the Deschutes
River Basin are part of the Mid-Columbia Steelhead Evolutionarily Significant Unit (ESU) that
has been listed as threatened by NOAA-Fisheries since 1999 (NMFS, NOAA 1999 and 2006).
In order to evaluate recovery needs and implement a recovery plan for steelhead in the Deschutes
River, the Interior Columbia River Technical Recovery Team (ICR-TRT 2003) attempted to
characterize population structure and identify discrete populations throughout the basin. The
Deschutes River Basin represents a region of substantial biological diversity among O. mykiss
(Kostow 1995), likely indicative of multiple colonization events (Currens et al. 1990) and the
influence of geologic and hydrologic barriers (Currens et al. 1990; Zimmerman and Ratliff 2003;
Stuart et al. 2007). The current distribution and genetic origin of populations throughout the
Deschutes River Basin have not been clearly delineated.
With a limited amount of genetic information available, the recovery team relied on life-
history information and differences in topographic and habitat conditions to describe
anadromous O. mykiss (steelhead) populations. Two potentially independent (distinct)
populations were identified: 1) Deschutes River eastside tributaries (Deschutes-Eastside),
encompassing all of the eastside tributaries below the Pelton-Round Butte Dam complex
including the mainstem from its mouth to the confluence of Trout Creek, and 2) Deschutes River
westside tributaries (Deschutes-Westside), encompassing all of the westside tributaries below
Pelton-Round Butte Dam complex including the mainstem above the confluence of Trout Creek
(Figure 1). The recovery team also identified that the areas above Pelton-Round Butte Dam
complex likely supported one or more populations historically. The team updated the population
delineations in 2005, and clarified that areas likely used historically by anadromous O. mykiss
would be included in two of the existing population delineations (NMFS, NOAA 2006).
Therefore, the Deschutes-Westside population now includes Whychus Creek and any historically
used portions of the Metolius River. The recovery team noted that the lack of comprehensive
genetic information limited their ability to infer the relationship among presumed populations,
particularly between mainstem and tributary spawners. This lack of information was also
recognized as a constraint on fishery managers and on the planning process for reintroductions in
the upper sub-basin (Northwest Power and Conservation Council 2004, Deschutes sub-basin

Page4�
plan). An analysis of genetic diversity will aid managers and recovery planners by improving
understanding of factors influencing the pattern and level of population structure of Deschutes
River Basin summer steelhead.
Another concern for fishery managers is the impact of within-basin and out-of-basin stray
hatchery steelhead on the wild steelhead populations in the lower Deschutes River. Round Butte
Hatchery (RBH) originally collected brood stock from unmarked adult steelhead in the
Deschutes River and released juvenile hatchery steelhead below Pelton Dam. On average,
47.1% of returning Round Butte Hatchery (RBH) marked steelhead passing Sherars Falls are not
captured but remain in the Basin (ODFW 2004). In addition, out-of-basin hatchery strays have
accounted for an average of over 60% of the steelhead migrating past Sherars Falls since 1995
(Hand and Olson 2004). The fate of these fish has implications for management, particularly in
regard to their presence and reproductive success relative to that of native steelhead on spawning
grounds. Genetic analysis may provide evidence of measurable introgression between out-of-
basin stray hatchery steelhead and populations of native steelhead in the Deschutes River or its
tributaries below the Pelton-Round Butte Dam complex. Although a paucity of information
currently exists on the influence of out-of-basin stray hatchery steelhead on local native
steelhead populations, Chilcote (2003) used data from the Deschutes River steelhead population
as part of an analysis of mixed spawning populations of wild and hatchery steelhead and
estimated a reduced level of productivity in populations that had higher proportions of hatchery
fish on the spawning grounds. Genetic baseline data for both the hatchery and wild populations
in the Deschutes River are necessary prior to an evaluation of the influence of stray hatchery fish
on the genetic diversity of the wild steelhead populations.
The Warm Springs River system is considered a valuable spawning area for native
Deschutes River summer steelhead below the Pelton-Round Butte Dam complex. Only
unmarked summer steelhead are provided access to spawning grounds above the barrier at the
Warm Springs National Fish Hatchery (WSNFH). Stray wild fish have no identifying marks, are
indistinguishable from Warm Springs River native steelhead, and comprise an unknown
proportion of the total return. Although the number of stray wild steelhead in the Deschutes
River is unknown, marked hatchery stray steelhead comprised an average of 51% of total returns
to the Warm Springs River between 1980 and 2003 (Hand and Olson 2004). Most of the
hatchery strays that could be identified in the Warm Springs River came from the Snake River

Page5�
Basin. There is also a potential for unmarked, hatchery-origin steelhead to stray into the Warm
Springs River. In 2003, approximately two million juvenile hatchery steelhead were released in
the Columbia River Basin without adipose fin clips. Hence, it is possible that returning
unmarked adult hatchery steelhead that stray to the Warm Springs River may be mistaken for
native Warm Springs River steelhead and inadvertently provided access to spawning grounds
above WSNFH. Genetically characterizing wild fish returning to the Warm Springs River
provides a genetic profile of Warm Springs River native summer steelhead and a benchmark to
assist in identifying out-of-basin wild or unmarked hatchery origin fish entering the system.
Future assessment of strays in the Deschutes basin will be carried out using the 13 microsatellite
loci that make up the SPAN baseline (a collection of genotypic data contributed by a consortium
of multiple state and federal agencies and Tribes; Stephenson et al. 2009).
Representatives of state, federal, and tribal agencies met in The Dalles, Oregon
(December 2004) to develop a preliminary study plan addressing the Interior Columbia River
Technical Recovery Team (ICR-TRT (2003) conclusion that insufficient information was
available to describe the genetic relationships among steelhead in the mainstem Deschutes River,
and east and west side tributaries of the Deschutes River below the Pelton-Round Butte Dam
complex. The representatives agreed that the study objectives would be: 1) develop an
understanding of the population structure and genetic variability among steelhead occupying
tributaries and the mainstem Deschutes River downstream of the Pelton-Round Butte Dam
complex with a three year genetic sampling protocol, 2) evaluate the effect of out-of-basin strays
on the Deschutes River Basin populations (by determining rate of straying and reproductive
contribution of strays), and 3) evaluate relationships among resident redband trout and
anadromous steelhead in the Deschutes River using genetic characteristics and other life history
characteristics.
This report represents the completion of Objective 1 – examination of the spatial and
temporal aspects of Deschutes River O. mykiss population structure below the Pelton-Round
Butte Dam complex. We also evaluate the ICR-TRT population groups (Deschutes-
Eastside/Deschutes-Westside), and two other population groupings (Mainstem/Tributary, and
Upper mainstem Deschutes/Lower mainstem Deschutes) through a genetic characterization of
O. mykiss from five tributaries and two mainstem locations downstream of the Pelton-Round
Butte Dam complex.

Page6�
Methods
The Columbia River Fisheries Program Office (CRFPO) was responsible for coordinating
field collections, and sampling protocols were collaboratively developed. Target locations for
tributary collections are identified in this report by region: westside, eastside, and Deschutes
River mainstem (Figure 1). The Oregon Department of Fish and Wildlife (ODFW) led efforts to
collect biological information and genetic samples from three eastside tributaries (Buck Hollow,
Bakeoven, and Trout creeks) and the mainstem Deschutes River, while the Confederated Tribes
of the Warm Springs Reservation of Oregon (CTWSRO) collected samples from two westside
tributaries (Warm Springs River and Shitike Creek; Figure 1). Juvenile steelhead were also
collected from the mainstem Deschutes River above the confluence of Trout Creek (upper
mainstem) and from the mainstem Deschutes River between Sherars Falls and the confluence of
Trout Creek (lower mainstem). Sampling was focused on steelhead juveniles to eliminate the
chance of inadvertently collecting either out-of-basin, unmarked stray hatchery, or stray natural
origin adults. A target sample size of 50 juvenile steelhead was set for each population sampled
from 2005 to 2007. Some areas within the basin are difficult to sample and typically support
fewer fish with an anticipated lower yield from sampling. A standard sample size of 50
individuals improves the likelihood of uniform sampling among sites, while meeting cost
considerations associated with sample collection and processing. No more than 10 individuals
were collected from each 100 meters of stream surveyed to avoid non-random sampling (i.e.,
sampling of family groups). For each population, field biologists identified sample sites for
collection of progeny of anadromous steelhead. Sites and samples were identified based on a
combination of factors including: 1) known steelhead spawning areas, 2) stream flow (time of
year), 3) size and physical appearance of juveniles, and 4) stream access. Scales were collected
and fork lengths and geo-reference information were recorded (when possible) for each sample.
Juvenile samples were classified as a) anadromous steelhead (STH) if field crews were
reasonably confident of anadromous parentage, b) resident (Omy) if field crews were reasonably
confident of resident parentage, or c) unknown (Unk) if the parentage was indeterminate. In
nearly all cases, the number of samples collected from each location was close to or exceeded the
target of 50. In the three cases where the target was not met, temporal collections were

Page7�
combined (Table 1). Samples of adult natural origin (NOR) and hatchery origin (HOR)
steelhead were also collected from the Warm Springs River. A detailed description of sample
collection for each population is given in Appendix 1.
In 2006, fin clip samples were collected from redband trout within the upper Deschutes
River sub-basin above the Pelton-Round Butte Dam complex and from Oak Springs Hatchery
rainbow trout (n=56; Stock #53; Maupin, Oregon) (Table 1). These collections were obtained,
genotyped, and analyzed as part of a separate study to evaluate genetic structure and similarities
among Oak Springs Hatchery and Crane Prairie Reservoir stocks and their relationships to
redband trout populations in the upper Deschutes River Basin tributaries (Matala et al. 2009).
These collections were included in the analyses of Deschutes River native steelhead below the
Pelton-Round Butte Dam complex so that a broader picture of genetic diversity could be
presented. By including the Whychus Creek and other redband trout collections in the
population structure analysis, the National Marine Fisheries Service (2006) update to the
independent population group Deschutes-Westside tributaries (containing Whychus Creek) could
be evaluated.
Microsatellite Amplification
DNA was extracted from all samples in a Chelex 100 (Sigma Chemical Co.) resin
solution as described by Miller and Kapuscinski (1996). In total, 22 nuclear loci were amplified
by polymerase chain reaction (PCR) assays. Seventeen microsatellite loci were used to analyze
genetic diversity. Included among the 17 microsatellite loci used in this study are 13 loci that
have been evaluated in the Steven Phelps Allele Nomenclature (SPAN) standardization effort for
steelhead trout (Appendix 2). The data are standardized among laboratories and available for
sharing among collaborative parties for the benefit of steelhead trout management, conservation,
and research. Four additional loci were added to the 13 SPAN loci to provide increased
resolution in the population structure analyses. PCRs were carried out in 10 μl volumes
containing 2-20 ng of genomic DNA, 1.5-2.0 mM MgCl2, 0.2 mM of each deoxynucleotide
triphosphate, 0.2 μM of each primer, and 1X QIAGEN PCR Master Mix containing DNA
polymerase (Appendix 2). PTC100 thermal cyclers (MJ Research, San Francisco, California)
were programmed with the following conditions to amplify all microsatellite loci examined: one
denaturation cycle at 95oC for 15 minutes; 29 amplification cycles of 95oC for 30 seconds,

Page8�
primer specific annealing temperatures for 90 sec. (Appendix 2), and 72oC for 60 sec.; and a
final extension cycle of 60oC for 20 min. Five diagnostic nuclear markers, OCC35, OCC36,
OCC37, OCC42, and OM55 (Ostberg and Rodriguez 2002, 2004), were amplified by PCR to
detect cutthroat trout (O. clarki clarki) and O. clarki x O. mykiss hybrids in samples of natural
origin fish. PCRs were carried out in 10 μl volumes containing 2-20 ng of genomic DNA, 3.0
mM MgCl2, 0.2 mM of each deoxynucleotide triphosphate, 0.2 μM of each primer, and 1X
QIAgen PCR Master Mix containing DNA. PTC100 thermal cyclers were programmed with the
following conditions to amplify these five microsatellite loci: one denaturation cycle at 95oC for
15 min.; 20 amplification cycles of 94oC for 30 sec., 58 to 48oC (subtracting 0.5oC /cycle) for 90
sec.; 18 amplification cycles of 94oC for 30 sec., 48oC for 90 sec., and a final extension cycle of
72oC for 10 min. An ABI-3130xl automated DNA Genetic Analyzer and GeneMapper v4.0
software (Applied Biosystems Inc., Foster City, California) were used to resolve and evaluate the
size of PCR amplified alleles. Individuals identified as either cutthroat trout or cutthroat x
rainbow hybrids were removed from the dataset prior to analyses.
QA/QC: error rate analysis
Laboratory error rate was determined through a quality-assessment/quality-control
(QA/QC) procedure involving random re-sampling and duplicate genotypic analyses. Original
data and replicate data were collected by different laboratory personnel, and data concordance
was determined by the lead researcher. DNA from every 10th sample from the complete data set
was re-extracted from tissue, re-amplified at 17 loci using PCR, and re-genotyped. The original
sample scores were then aligned with the scores generated from the duplicate analysis and an
error rate over all loci was calculated as the proportion of mismatches (i.e., differing allelic
scores).
Descriptive Statistics – all 21 collections
Allele frequencies for each locus were determined with CONVERT v1.3.1 (Glaubitz
2004) and shown in Appendix 3. GENEPOP v4.0.1 (Raymond and Rousset 1995) was used to
test for departures from Hardy-Weinberg Equilibrium (HWE) for each locus and collection, and
to test for evidence of linkage disequilibrium (LD) between all pairs of loci. FIS (a measure of
departure from random mating) was calculated using FSTAT v2.9.3 (Goudet 2001). Significant
deviations from HWE expectations, extreme values of FIS, and high levels of LD can all indicate

Page9�
non-random mating or non-random sampling within a population. Allelic richness and
heterozygosity were calculated as measures of genetic diversity within populations. The average
number of alleles per locus and allelic richness (the number of alleles per locus corrected for
unequal sample sizes among collections) were determined with FSTAT v2.9.3 (Goudet 2001).
Observed and expected heterozygosity (Ho and He) were calculated using GDA v1.1 (Lewis and
Zaykin 2001).
Tests of population groups –13 juvenile Deschutes collections only Deschutes River NOR steelhead collected from below the Pelton-Round Butte Dam
complex were combined into three sets of groups for comparison of summary statistics: 1)
Deschutes-Eastside (Bakeoven, Buck Hollow, and Trout creeks, and the lower mainstem
Deschutes River) and Deschutes-Westside (Warm Springs River, Shitike Creek, and upper
mainstem Deschutes River; NMFS, NOAA 2006), 2) Mainstem (upper and lower mainstem
Deschutes) and Tributary (Bakeoven, Buck Hollow, and Trout creeks, Warm Springs River, and
Shitike Creek), and 3) Upper and Lower Deschutes. Allelic richness (AR), observed
heterozygosity (Ho), gene diversity (Hs; Eq. 8.31 Nei 1987), index of inbreeding (FIS), and FST
were compared between population groups using the program FSTAT with 1000 permutations.
The proportion of variance among collections within population groups was compared to
that between population groups using an analysis of molecular variance (AMOVA) as
implemented in ARLEQUIN version 3.1 (Excoffier et al. 2005). Three AMOVAs were
performed on the three population groups below the Pelton-Round Butte Dam complex described
above.
Population differentiation – all 21 collections and 13 juvenile Deschutes collections Estimates of pairwise FST and exact tests of genotypic differentiation were carried out to
assess genetic relationships. Divergence among all pairs of collections was estimated as FST (θ;
Weir and Cockerham 1984) using GENETIX v4.05.2 (Belkhir et al. 2004). Statistical
significance of FST values was evaluated by comparison to a null distribution based on 1000
replicate datasets in which individuals were permuted among the pairs of collections (α = 0.05).
Exact tests of genotypic differentiation (differences in allele frequencies) were carried out using
GENEPOP v4.0.1 (Raymond and Rousset 1995). Bonferroni corrections (Rice 1989) for
multiple tests were applied to P-values when assessing statistical significance of test results. We

Page10�
generated a consensus neighbor-joining tree using the program PHYLIP v3.6 (Felsenstein 2005)
as a graphical representation of the genetic relationships for all 21 collections and for the subset
of 13 juvenile Deschutes collections. The SEQBOOT sub-routine of PHYLIP was used to
generate 1000 randomized replicates (boot-strap resampling) of the allele frequency dataset. For
each of the 1000 replicates a pairwise genetic distance matrix of Cavalli-Sforza and Edwards
(1967) chord distance measures (DCE) was generated, and an unrooted neighbor-joining tree of
genetic distance was calculated from each matrix using the sub-routines GENDIST and
NEIGHBOR. The sub-routine CONSENSE was used to calculate the consensus tree.
Confidence in the nodes of the consensus tree was based on the percentage of replicate trees that
displayed the same topology. The program MEGA4 (Tamura et al. 2007) was used to
graphically display the trees.
Test of population assignment – all 21 collections
Population assignment testing was used to further investigate genetic distinction among
collections of NOR Deschutes River steelhead, as well as between stray (out-of-basin) hatchery
steelhead and native Deschutes River populations. To determine how well individual fish could
be assigned to their population of origin a jackknife, or leave one out, test was carried out using
ONCOR (Kalinowski, downloaded 2010). The jackknife method is carried out by removing
individuals one at a time, recalculating the baseline allele frequencies, estimating the probability
that the individual came from each baseline collection, and assigning that individual to the
population to which it has the highest probability of belonging. Assignment success was
evaluated for only those individuals with complete genotypic information at 17 loci, but all
individuals were included in the estimation of baseline population allele frequencies.
Results
Genotyping
The 17 microsatellites examined here exhibited 319 alleles, with individual loci
exhibiting between eight and twenty-eight alleles (Appendix 2). We conducted a QA/QC test
during each collection year. The total number of samples evaluated was 126, and the number of
allelic comparisons made across 17 loci was 3,912 (comparisons with a missing score were
excluded). We observed a total of 12 scoring discrepancies, usually associated with weakly

Page11�
amplified samples, for a total error rate of 0.31%. Error rates <1% are typically considered
acceptable for population structure analyses (Bonin et al. 2004).
Descriptive Statistics
There were 9 statistically significant departures from expected genotypic proportions
among all 21 collections and 357 total tests of Hardy-Weinberg Equilibrium (HWE). Departures
from HWE occurred at Ots1 (n=3), Omy77 (n=2), Omy7iNRA (n=2), Omy1011 (n=1), and
Oneμ14 (n=1) (data not shown). All 21 collections had few (0-5 out of 136) statistically
significant pairwise linkage disequilibrium (LD) tests. Mean allelic richness (AR) ranged from
5.75 in the Oak Springs collection to 10.09 in the Warm Springs NOR juveniles (Table 2).
Tests of population groups
Summary genetic statistics were compared between population groups (Table 3).
Comparison of Deschutes River mainstem and tributary population groups indicated that the
tributary population group had significantly higher allelic richness, observed heterozygosity, and
gene diversity. No significant differences in FIS, or overall FST were detected between mainstem
and tributary population groups. Comparison of Deschutes River upper and lower mainstem
population groups indicated that the upper mainstem group had significantly higher observed
heterozygosity and gene diversity, with no differences detected in the remaining statistics. No
statistically significant differences in summary genetic statistics were detected when
comparisons were made between eastside and westside Deschutes River tributaries.
Analysis of molecular variance provided a second assessment of the Deschutes River
steelhead population groups (Table 4). Significant variance was detected between groups of
Deschutes River mainstem and tributary (2.09%; P<0.00001), but not between eastside and
westside tributary groups (P=0.557), or between lower and upper mainstem (P=0.331)
population groups.
Population differentiation
Nearly all tests of population differentiation were highly significant. Only two tests of
genotypic differentiation based on allele frequency differences between pairs of collections were
not statistically significant: the two collections from Trout Creek and the two collections of stray

Page12�
adults from the Warm Springs River (data not shown). Similarly, all but five pairwise FST
estimates indicated significant differences between population pairs (Appendix 5). The non-
significant estimates of FST were temporal samples from Trout Creek, lower Mainstem, and stray
adults from Warm Springs River. The collection of Warm Springs NOR adults from 2007 was
also not statistically different from either of the two stray adult collections from the Warm
Springs River. Pairwise FST estimates ranged from 0.001 (Warm Springs River adult strays
collected in 2005 and 2006) to 0.249 (Oak Springs Hatchery and Whychus Creek). Among the
juvenile collections including Round Butte Hatchery, pairwise FST estimates ranged from 0.005
(temporal collections from Bakeoven Creek) to 0.062 (lower mainstem Deschutes 05 and
Bakeoven 05).
In the neighbor-joining tree with juvenile and Round Butte Hatchery collections (Figure
2), there was strong bootstrap support for the separation of mainstem and tributary collections
and also between upper and lower mainstem collections. Additionally, there was strong support
for the separation of the two Westside Deschutes tributaries (Shitike and Warm Springs) from
the Eastside Deschutes tributaries (Bakeoven, Buck Hollow, Trout creeks). All of the tributary
collections were separated from each other with moderate to high levels of bootstrap support and
moderate support for the clustering of the temporal collections, with the exception of Trout
Creek (temporal collection bootstrap 74%). The collection from Round Butte Hatchery was
most similar to the two Trout Creek collections but with only 40% bootstrap support.
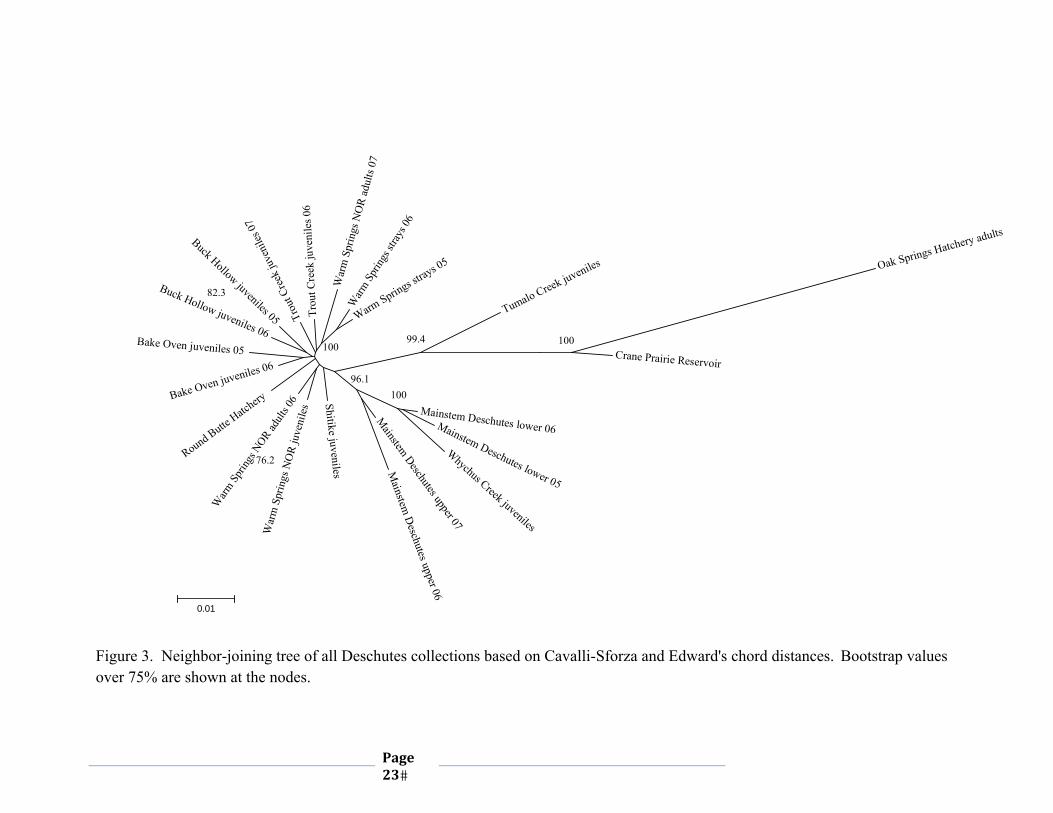
In the neighbor-joining tree including all 21 collections (Figure 3), the strong support for
the separation of the mainstem Deschutes collections from the tributary collections was still
present. However, the Whychus collection clustered with the lower Deschutes mainstem
collections with 100% bootstrap support. The other collections above Pelton-Round Butte Dam
(Tumalo and Crane Prairie) and the collection from Oak Springs Hatchery were distinctly
separated from the below Pelton-Round Butte Dam collections with long branch lengths and
high bootstrap support. The clustering of temporal collections from Buck Hollow still had
moderate bootstrap support. The 2006 collection of NOR adults from the Warm Springs River
clustered with the Warm Springs NOR juveniles with moderate bootstrap support, while the
2007 collection of NOR adults from the Warm Springs River clustered with the Warm Springs
River adult strays, separate from the other tributary collections with 100% support.

Page13�
Population assignment tests
Correct assignment of individuals back to collection of origin was generally low for all
collections below Pelton-Round Butte Dam (juvenile collections range: 23% - 67%; adult
collections range: 17% - 37%; Table 5). However in general, the largest percentage of
misassignments for each collection was to a temporal replicate collection or to a geographically
nearby tributary. The Round Butte Hatchery collection had 56% correct assignment with the
largest percentage of misassignments going to the Trout Creek 07 collection. The Warm Springs
NOR juveniles had 38% correct assignment with the majority of misassignments going to the
2006 Warm Springs River adults. The 2006 Warm Springs River NOR adults had 29% correct
assignment with the majority of misassignments going to Trout Creek 07. The 2007 Warm
Springs River NOR adults had 17% correct assignment; while the majority of misassignments
were to the 2006 Warm Springs River NOR adult collection, a nearly equal number of fish were
misassigned to both the Shitike and Warm Springs stray 06 collections (Appendix 4).
Collections from above Pelton-Round Butte Dam had very high correct assignment rates
with the exception of Whychus Creek. Whychus Creek had 64% correct assignment with the
majority of misassignments going to the lower mainstem Deschutes 06 collection.
Discussion
The two main objectives of this project were to 1) develop an understanding of the
population structure and genetic variability among steelhead occupying tributaries and the
mainstem Deschutes River downstream of the Pelton-Round Butte Dam complex and 2) to
provide a genetic evaluation of the population groups. The results of this project address the
current genetic information gap for Deschutes Basin summer steelhead.
Tests of population groups
Differences were detected between the mainstem and tributary groups of collections for
both the summary statistics and with the analysis of molecular variation. The increased variation
found within the tributary group is consistent with the greater geographic separation of these
collections. The neighbor-joining tree mirrored this difference between mainstem and tributary
groups. We also detected differences in summary statistics between the upper and lower

Page14�
Deschutes mainstem groups, but not with the analysis of molecular variation. The neighbor-
joining tree supported the detected differences.
The primary ICR-TRT defined management groups are the Eastside and Westside
Deschutes groups. These two groups each contain a mix of tributary and mainstem collections,
and the Whychus Creek population above Pelton-Round Butte Dam collection has been included
in the Westside Deschutes group. We detected no differences between these two groups with
either the comparison of summary statistics or with the analysis of molecular variation, and
collections within each group were found to be genetically distinct. In the neighbor-joining tree,
the Westside Deschutes tributaries are separated from the Eastside Deschutes tributaries, but the
cohesiveness of the groups is disrupted by the difference of the mainstem collections from the
tributaries. The inclusion of Whychus Creek with the Westside Deschutes group is not
supported by our analyses. In the neighbor-joining tree, Whychus Creek clusters with the lower
Deschutes mainstem collections which are part of the Eastside Deschutes group. In the jackknife
analysis, the majority of misassignments from Whychus Creek go to the lower Deschutes
mainstem collection, in agreement with the clustering of these collections on the tree. These
combined results do not support the Eastside – Westside Deschutes population groups as
currently defined.
Population structure and genetic variability
All 21 collections included in this report were found to be genetically distinct with very
few non-significant tests of genetic difference. The greatest differences were found between the
above and below Pelton-Round Butte Dam collections as would be expected since the above
Pelton-Round Butte Dam collections represent resident redband trout. Although there were
differences in temporal replicate collections, these differences were relatively small compared to
differences between collection locations. In the case of Buck Hollow collections, the 2005
collection was of unknown origin and may have contained resident rainbow trout; additionally,
the collection location for the 2005 samples was separated by 12 river kilometers from the 2006
collection. Very few tests of HWE and LD were statistically significant, and all collections had
similarly high levels of genetic diversity.
Population structure among Deschutes Basin steelhead based on the juvenile collections
is driven primarily by differences between mainstem and tributary populations. Within the

Page15�
tributary populations, Shitike Creek and Warm Springs River (Westside tributaries) are more
similar to each other than to the Eastside tributary collections. Similarly, the Eastside tributary
collections are more similar to each other than to the Westside tributary collections. Round
Butte Hatchery was most similar to Trout Creek, and specifically to the 2007 collection from
Trout Creek. This 2007 Trout Creek collection appears to be genetically similar to many of the
other collections, including the Warm Springs strays, and in the jackknife analysis there were
many individuals that assigned to various other collections. It is possible that this collection is a
mixture of individuals from many populations, although the collection did not show typical signs
of this such as elevated levels of LD and departures from HWE.
The inclusion of the adult Warm Springs collections provided an initial assessment of
Warm Springs NORs and strays. The two collections of strays were most similar to each other.
The 2006 collection of adult NOR steelhead from Warm Springs was most similar to the juvenile
Warm Springs NOR steelhead. However, the 2007 collection of Warm Springs NOR adults was
most similar to the strays. The detailed jackknife results given in Appendix 4 suggest that this
collection is likely composed of individuals of both native Warm Springs origin and stray origin.
Further analysis of collections of adults and juveniles will be required to obtain a more thorough
understanding of the effects of unmarked stray hatchery and natural origin fish in the Warm
Springs River, including the assessment of potential introgression between hatchery strays and
NORs.
Acknowledgements We extend our appreciation and gratitude to the inter-agency field crew and personnel for
their efforts in collecting genetic tissue samples used in these analyses (Oregon Department of
Fish and Wildlife, Confederated Tribes of the Warm Springs Reservation of Oregon, NOAA
Fisheries-Northwest Fisheries Science Center, and the Columbia River Inter-Tribal Fish
Commission). Amanda Matala, Lindsay Godfrey, and Emily Williams of the Abernathy Fish
Technology Center provided laboratory processing and microsatellite genotyping. Molly
McGlauflin, Christian Smith, Patty Crandell, and Jeff Olsen provided comments on this report.
The findings and conclusions in this report are those of the authors and do not necessarily
represent the views of the United States Fish and Wildlife Service.

Page16�
References
Banks, M. A., M. S. Blouin, B. A. Baldwin, V. K. Rashbrook, H. A. Fitzgerald, S. M. Blankenship and D. Hedgecock. 1999. Isolation and inheritance of novel microsatellites in Chinook salmon (Oncorhynchus tshawytscha). Journal of Heredity 90: 281-288.
Belkhir, K., P. Borsa, L. Chikhi, N. Raufaste, and F. Bonhomme. 2003. GENETIX: program for Windows for the genetic analysis of populations. Laboratoire Ge´nome, Populations, Interactions CNRS UMR 5000, University of Montpellier II, Montpellier, France. Available at: www. University-montp2.fr/;genetix/genetix.htm. Accessed 11 November, 2009.
Bonin A., E. Bellemain, P. Bronken Eidesen, F. Pompanon, C. Brochmann, and P. Taberlet.
2004. How to track and assess genotyping errors in population genetic studies. Molecular Ecology 13: 3261– 3273.
Buchholz, W. G., S. J. Miller, and W. J. Spearman. 2001. Isolation and characterization
of chum salmon microsatellite loci and use across species. Animal Genetics 32 (3): 162– 165.
Cairney, M., J. B. Taggart and B. Høyheim. 2000. Characterization of microsatellite and
minisatellite loci in Atlantic salmon (Salmo salar L.) and cross-species amplification in other salmonids. Molecular Ecology 9: 2175–2178.
Cavalli-Sforza, L.L., and A. W. F. Edwards. 1967. Phylogenetic analysis: models and
estimation procedures. Evolution 32: 550-570. Chilcote, M. W. 2003. Relationship between natural productivity and the frequency of wild
fish in mixed spawning populations of wild and hatchery steelhead (Oncorhynchus mykiss). Canadian Journal of Fisheries and Aquatic Sciences 60: 1057-1067.
Chittenden, M.E. Jr. 2002. Given a significance test, how large a sample size is large enough? Fisheries 27 (8): 25-29.
Condrey, M. J. and P. Bentzen. 1998. Characterization of coastal cutthroat trout
(Oncorhynchus clarki clarki) microsatellites and their conservation in other salmonids. Molecular Ecology 7: 787-789.
Currens, K. P., C. B. Schreck and H. W. Li. 1990. Allozyme and morphological divergence of rainbow trout (Oncorhynchus mykiss) above and below waterfalls in the Deschutes River, Oregon. Copeia 1990 (3): 730-746.
Excoffier, L. G. Laval, and S. Schneider. 2005. Arlequin ver. 3.0: An integrated software package for population genetics data analysis. Evolutionary Bioinformatics Online 1: 47- 50.

Page17�
Felsenstein, J. 2002. PHYLIP (Phylogeny Inference Package) Version 3.6α. Department of Genome Sciences. University of Washington, Seattle, Available at: www.evolution.s.washington.edu/phylip/faq.html. Accessed 11 November, 2009.
Goudet, J. 1995. FSTAT (v1.2): a computer program to calculate F-statistics. Journal of Heredity 86: 485-486.
Glaubitz, J. C. 2004. CONVERT: A user-friendly program to reformat diploid genotypic
data for commonly used population genetic software packages. Molecular Ecology Notes 4 (2): 309–310.
Hand, D.M. and D.E. Olson. 2004. Creating a sanctuary for wild steelhead trout through hatchery operations. Proceedings of the Wild Trout VIII Symposium. Yellowstone National Park. Accessed on 2 February, 2010. Available at: http://www.fws.gov/columbiariver/publications/sanctuary.pdf.
Interior Columbia Basin Technical Recovery Team (ICR-TRT). 2003. Independent populations
of Chinook steelhead and sockeye for listed evolutionary significant units within the interior Columbia River basin. in. Viability of ESUs containing multiple types of populations. ISAB 2005-2, Independent Science Advisory Board, Northwest Power and Conservation Council, Portland, OR. Accessed on 8 March, 2010. Available at: http://www.nwfsc.noaa.gov/trt/trt_columbia.htm.
Kalinowski, S. 2008. ONCOR: Software for genetic stock identification. Accessed 10 June,
2009. Available at: http://www.montana.edu/kalinowski/Software/ONCOR.htm Kostow, K. (Editor) 1995. Biennial report on the status of wild fish in Oregon. Oregon
Department of Fish and Wildlife, Portland, OR. 247 pp. Available from Oregon Department of Fish and Wildlife, P.O. Box 59, Portland, OR 97207.
Leider, S.A., P.L. Hulett, J.J. Loch, and M.W. Chilcote. 1990. Electrophoretic comparison of the
reproductive success of naturally spawning transplanted and wild steelhead trout through the returning adult stage. Aquaculture 88: 239-252.
Lewis, P. O., and Zaykin, D. 2001. Genetic Data Analysis: Computer program for
the analysis of allelic data. Version 1.0 (d16c). Free program distributed by the authors over the internet from http://lewis.eeb.uconn.edu/lewishome/software.html. Accessed 11 November, 2009.
Matala, A. P., S. Marx and T.G. Wise. 2009. A genetically distinct wild redband trout
(Oncorhynchus mykiss gairdneri) population in Crane Prairie Reservoir, Oregon, persists despite extensive stocking of hatchery rainbow trout (O. m. irideus). Conservation Genetics 9: 1643-1652.
Page18�
McConnell, S. K., P. O’Reilly, L. Hamilton, J. M. Wright, and P. Bentzen. 1995. Polymorphic micro-satellite loci from Atlantic salmon (Salmo salar): genetic differentiation of North American and European populations. Canadian Journal of Fisheries and Aquatic Sciences 52: 1863–1872.
Miller, L.M., and A.R. Kapuscinski. 1996. Microsatellite DNA markers reveal new levels of
variation in northern pike. Transactions of the American Fisheries Society 125: 971-997. Morris, D. B., K. Richard and J. Wright. 1996. Microsatellites from rainbow trout
(Oncorhynchus mykiss) and their use for genetic study of salmonids. Canadian Journal of Fisheries and Aquatic Sciences 53: 120-126.
Nei, M. 1978. Estimation of average heterozygosity and genetic distance from a small number of individuals. Genetics 89:583–590.
Nei, M. 1987. Molecular Evolutionary Genetics. Columbia University Press, New York. NMFS, NOAA (National Marine Fisheries Service, National Oceanic and Atmospheric
Administration). 1999. Endangered and Threatened Species: Threatened Status for Two ESUs of Steelhead in Washington and Oregon. Federal Register [Docket No. 980225046–9070–03, March 25, 1999] Vol. 64, No.57. pp. 14517-14528.
NMFS, NOAA. 2006. Endangered and Threatened Species: Final Listing Determinations for 10
Distinct Population Segments of West Coast Steelhead; Final Rule. Federal Register [Docket No. 051216341–5341–01, Jan. 5, 2006] Vol. 71, No.3. pp. 834-862.
Northwest Power and Conservation Council, 2004. Deschutes sub-basin plan. Portland,
Oregon. 668p. Available at http://www.nwcouncil.org/fw/subbasinplanning/deschutes/default.asp
Olsen, J. B., P. Bentzen and J. E. Seeb. 1998. Characterization of seven microsatellite loci
derived from pink salmon. Molecular Ecology 7: 1087-1089. Oregon Department of Fish and Wildlife. 2004. Round Butte Hatchery, Hatchery and
Genetic Management Plan (HGMP), Salem, OR. Accessed 11 November, 2009. Available at: http://www.dfw.state.or.us/HGMP/docs/2006/06-round-butte-summer-steelhead.pdf
Ostberg, C. O., and R. J. Rodriguez. 2002. Novel microsatellite markers differentiate
Oncorhynchus mykiss (rainbow trout and steelhead) and the O. clarki (cutthroat trout) subspecies. Molecular Ecology Notes 2: 197–202.
Ostberg, C. O., and R. J. Rodriguez. 2004. Bi-parentally inherited species-specific markers
identify hybridization between rainbow trout and cutthroat trout subspecies. Molecular Ecology Notes 4: 26–29.

Page19�
Raymond, M. and F. Rousset. 1995. Genepop: population genetics software for exact tests and Ecumenicism. Journal of Heredity 83: 248-249.
Rice, W. R. 1989. Analyzing tables of statistical tests. Evolution 43: 223-225. Scribner, K. T., J. R. Gust and R. L. Fields. 1996. Isolation and characterization of
novel salmon microsatellite loci: Cross-species amplification and population genetic applications. Canadian Journal of Fisheries and Aquatic Sciences 53: 833-841.
Smith, C. T., B. F. Koop. and R. J. Nelson. 1998. Isolation and characterization of coho
salmon (Oncorhynchus kisutch) microsatellites and their use in other salmonids. Molecular Ecology 7: 1614-1616.
Spies, I.B., D.J. Brasier, P.T.L. O’Reilly, T.R. Seamons, and P. Bentzen. 2005. Development
and characterization of novel tetra-, tri, and dinucleotide microsatellite markers in rainbow trout (Oncorhynchus mykiss). Molecular Ecology Notes 5: 278-281.
Stephenson, J.J., M.R. Campbell, J.E. Hess, C. Kozfkay, A.P. Matala, M.V. McPhee, P. Moran, S.R. Narum, M.M. Paquin, O. Schlei, M.P. Small, D.M. Van Doornik, and John K. Wenburg. 2009. A centralized model for creating shared, standardized, microsatellite data that simplifies inter-laboratory collaboration. Conservation Genetics 10: 1145-1149.
Stuart, A. M., D. Grover, T. K. Nelson and S. L. Thiesfeld. 2007. Redband trout
investigations in the Crooked River Basin. Pages 76-91 in R. K. Schroeder and J. D. Hall, editors. Redband trout: resilience and challenge in a changing landscape. Oregon Chapter, American Fisheries Society, Corvallis.
Tamura K, J. Dudley, M. Nei, and S. Kumar. 2007. MEGA4: Molecular Evolutionary Genetics Analysis (MEGA) software version 4.0. Molecular Biology and Evolution 24: 1596-1599.
Weir, B.S., and C.C. Cockerham. 1984. Estimating F-statistics for the analysis of
population structure. Evolution 38: 1358-1370.
Zimmerman, C. E. and D. E. Ratliff. 2003. Controls on the distribution and life history of fish populations in the Deschutes River: geology, hydrology, and dams. Pages 51-70 in Jim E. O'Connor and Gordon E. Grant, editors. A Peculiar River: Geology, Geomorphology, and Hydrology of the Deschutes River, Oregon, American Geophysical Union, Washington DC.

Page20�

Page21�
Figure 1. Deschutes River Basin, Oregon.

Page22�
Figure 2. Neighbor-joining tree of juvenile Deschutes collections based on Cavalli-Sforza and Edward's chord distances. Bootstrap values over 75% are shown at the nodes.
Trout Cree
k juveniles 06
Trou
t Cre
ek ju
veni
les 0
7
Roun
d Bu
tte H
atch
ery
Bake O
ven j
uven
iles 0
5
Bake Oven juveniles 06
Buck Hollow juveniles 05
Buck Hollow juveniles 06
Warm
Springs NO
R juveniles
Shiti
ke ju
veni
les
Main
stem D
eschu
tes lo
wer 05
Mainstem Deschutes lower 06
Mainstem Deschutes upper 06Mainstem Deschutes upper 07
0.005
78.9 92.5
97.7
85
100
100
Page23�
Figure 3. Neighbor-joining tree of all Deschutes collections based on Cavalli-Sforza and Edward's chord distances. Bootstrap values over 75% are shown at the nodes.
Mainstem Deschutes lower 06Mainstem Deschutes lower 05
Whychus Creek juveniles
Mainstem Deschutes upper 07
Mainstem
Deschutes upper 06
Shitike juveniles
War
m S
prin
gs N
OR
juve
nile
s
Warm
Sprin
gs N
OR adult
s 06
Round Butte Hatc
heryBake Oven juveniles 06
Bake Oven juveniles 05
Buck Hollow juveniles 06
Buck Hollow juveniles 05 Trou
t Cre
ek ju
veni
les 0
7
Trou
t Cre
ek ju
veni
les 0
6
War
m S
prin
gs N
OR
adul
ts 07
Warm
Spr
ings
stray
s 06
Warm Springs strays 05
Tumalo Creek juveniles Oak Springs Hatchery adults
Crane Prairie Reservoir
0.01
96.1
100
100
99.4
76.2
82.3
100

Page24�
Table 1. All population collections included in report.
2005 2006 2007 2005 2006 2007 2005 2006 2007
Bakeoven Creek 50,STH 50,STH -- -- -- -- -- -- --Buck Hollow Creek 45,Unk 42,STH -- -- -- -- -- -- --Deschutes River: -- -- -- -- -- -- -- -- -- Mainstem-Upper -- 38,STH 54,STH -- -- -- -- -- -- Mainstem-Lower 50,Unk 96,Unk -- -- -- -- -- -- --Round Butte Hatchery -- -- -- 50,STH -- -- -- -- --Shitike Creek 30,STHa,b -- -- 39,STHb -- -- -- -- --Trout Creek -- -- -- -- 56,STH 50,STH -- -- --Warm Springs River 9,STHc -- -- -- 58,STHc -- -- 61,STH 25,STHWarm Springs R. (strays) -- -- -- -- -- -- 57,STH 60,STH
--Crane Prairie Reservior -- -- -- -- 17, RedBd,e -- -- 34, RedBd,e --Oak Springs Hatchery -- -- -- -- -- -- -- 56, Omyd --Tumalo Creek -- -- -- -- 53, RedBd -- -- -- --Whychus Creek -- -- -- -- 47, RedBd -- -- -- --
a These juveniles are presumed to be steelhead; b These two collections were combined for analysis; c These two collections werecombined for analysis; d Genetic data was collected on these fish as part of a separate, complementary sub-project; e These two collections were combined for analysis.
Above Pelton-Round Butte Dam
AdultsLocation (collection)
Juvenile Smolts
Below Pelton-Round Butte Dam

Page25�
Table 2. Population descriptive statistics for all 21 collections.
Population HWE LD A AR Ho He FIS
Warm Springs strays 05 0 0 11.0 9.18 0.82 0.81 -0.01Round Butte Hatchery 0 0 9.9 8.89 0.76 0.78 0.03Shitike juveniles 1 1 12.1 9.59 0.75 0.79 0.04Buck Hollow juveniles 05 0 2 11.6 10.07 0.80 0.79 -0.01Mainstem Deschutes lower 05 0 0 10.2 8.43 0.69 0.71 0.03Bakeoven juveniles 05 1 5 10.6 9.23 0.77 0.79 0.03Warm Springs NOR adults 06 0 0 12.1 9.81 0.77 0.79 0.02Warm Springs strays 06 1 0 10.8 9.29 0.77 0.80 0.04Buck Hollow juveniles 06 1 0 11.3 9.77 0.78 0.80 0.02Bakeoven juveniles 06 0 1 10.5 9.14 0.76 0.78 0.02Mainstem Deschutes lower 06 0 0 10.9 8.11 0.70 0.70 0.01Warm Springs NOR juveniles 1 0 12.4 10.09 0.79 0.79 0.00Mainstem Deschutes upper 06 1 1 10.1 9.35 0.75 0.78 0.04Trout Creek juveniles 06 1 0 11.8 9.71 0.77 0.80 0.03Trout Creek juveniles 07 0 0 11.7 9.84 0.78 0.79 0.02Warm Springs NOR adults 07 0 0 9.9 9.84 0.79 0.82 0.03Mainstem Deschutes upper 07 0 5 10.8 9.25 0.77 0.79 0.02Whychus Creek juveniles 0 1 9.2 7.85 0.70 0.69 -0.01Crane Prairie Reservoir 0 0 11.1 9.52 0.78 0.81 0.03Tumalo Creek juveniles 1 0 11.1 9.43 0.75 0.80 0.07Oak Springs Hatchery adults 1 0 6.4 5.75 0.67 0.69 0.03
HWE: Number of loci statistically out of Hardy-Weinburg Equilibrium expectations after Bonferroni correction.LD: Number of pairs of loci out of 136 tests per population with significant linkage disequilibrium after Bonferroni correction.A: Average number of alleles for the 17 loci observed in this study.AR: Allelic richness based on a minimum sample size of 24 individuals. Ho: Observed heterozygosity.He: Expected heterozygosity.FIS: index of inbreeding (Weir and Cockerham 1984)

Page26�
Table 3. Comparison of descriptive statistics between populations groups - juvenile collections only.
AR 9.7 < 10.7 (0.012*) 10.5 10.5 (0.973) 9.3 10.1 (0.255)Ho 0.719 < 0.774 (0.004*) 0.762 0.767 (0.885) 0.693 < 0.762 (0.039*)Hs 0.736 < 0.790 (0.005*) 0.780 0.787 (0.794) 0.706 < 0.784 (0.025*)FIS 0.022 0.020 (0.844) 0.024 0.025 (0.864) 0.018 0.028 (0.534)FST 0.020 0.010 (0.544) 0.018 0.013 (0.808) 0.002 0.008 (0.765)a Lower and upper mainstem of Deschutes River; b Bakeoven, Buck Hollow, Shitike, and Trout Creeks, and Warm Springs River; c All eastside tributaries below Pelton-Round Butte Dam complex including the mainstem from its mouth to the confluence of Trout Creek; d All westside tributaries below Pelton Dam including the mainstem above the confluence of Trout Creek;e From mouth of mainstem Deschutes River to below confluence of Trout Creek; f Mainstem Deschutes River above confluence of Trout Creek to below Pelton-Round Butte Dam.
Deschutes R.Mainstema vs. Tributariesb Eastsidec vs. Westsided
Deschutes R. tributaries Mainstem Deschutes R. Lowere vs. Upperf

Page27�
Table 4. Analysis of molecular variation (AMOVA) results by population groupings – juvenile collections only.
Among Among WithinPopulation Groups Groups Populations Groups Populations Populations
2 12 2.09** 1.26** 96.65**
2 12 -0.13 2.40** 97.73**
2 4 2.28 0.46** 97.26**a Lower and upper mainstem of Deschutes River; b Bakeoven, Buck Hollow, Shitike, and Trout Creeks, and Warm Springs River; c All eastside tributaries below Pelton-Round Butte Dam complex including the mainstem from its mouth to the confluence of Trout Creek; d All westside tributaries below Pelton Dam including the mainstem above the confluence of Trout Creek;e From mouth of mainstem Deschutes River to below confluence of Trout Creek; f Mainstem Deschutes River above confluence of Trout Creek to below Pelton-Round Butte Dam.
Lowere vs. upperf mainstem Deschutes River
Percentage of VariationWithin Groups
Number of
Mainstema vs. tributaryb populations
Eastsidec vs. westsided Deschutes River populations

Page28�
Table 5. Population jackknife summary – all 21 collections.
Population N assigned Percent correct Largest Misassignment Percent assigned Warm Springs strays 05 49 34.70% Warm Springs strays 06 32.70%Round Butte Hatchery 41 56.10% Trout Creek juveniles 07 12.20%Shitike juveniles 67 41.80% Mainstem Deschutes lower 06 10.40%Buck Hollow juveniles 05 44 27.30% Buck Hollow juveniles 06 13.60%Mainstem Deschutes lower 05 50 28.00% Mainstem Deschutes lower 06 48.00%Bakeoven juveniles 05 50 58.00% Trout Creek juveniles 06 10.00%Warm Springs NOR adults 06 58 29.30% Trout Creek juveniles 07 12.10%Warm Springs strays 06 57 36.80% Warm Springs strays 05 19.30%Buck Hollow juveniles 06 39 23.10% Buck Hollow juveniles 05 15.40%Bakeoven juveniles 06 48 39.60% Bakeoven juveniles 05 10.40%Mainstem Deschutes lower 06 93 66.70% Mainstem Deschutes lower 05 8.60%Warm Springs NOR juveniles 65 38.50% Warm Springs NOR adults 06 12.30%Mainstem Deschutes upper 06 36 52.80% Mainstem Deschutes upper 07 16.70%Trout Creek juveniles 06 53 26.40% Trout Creek juveniles 07 18.90%Trout Creek juveniles 07 49 24.50% Buck Hollow juveniles 05 14.30%Warm Springs NOR adults 07 24 16.70% Warm Springs NOR adults 06 16.70%Mainstem Deschutes upper 07 51 37.30% Mainstem Deschutes upper 06 19.60%Whychus Creek juveniles 42 64.30% Mainstem Deschutes lower 06 16.70%Crane Prairie Reservoir 40 100.00%Tumalo Creek juveniles 52 98.10% Warm Springs NOR adults 06 1.90%Oak Springs Hatchery adults 54 100.00%

Page29�
Appendix 1. Description of field sampling efforts for collections of resident rainbow trout and steelhead in the Deschutes River basin below the Pelton-Round Butte Dam complex.
Eastside tributary sampling
In Bakeoven and Buck Hollow Creeks, electrofishing was used to collect samples in the fall of both 2005 and 2006. The Bakeoven Creek samples in 2005 (n=50, STH) and 2006 (n=50, STH) were collected from sample sites approximately 12 river kilometers (rkm) upstream from the confluence of the Deschutes River in a stretch of stream that ODFW biologists considered to be predominately inhabited by anadromous steelhead. In 2005, sample sites in Buck Hollow Creek were limited to the lower 200 meters of the creek due to landowner access issues. The 2005 samples (n=50, UNK) were of unknown origin and could potentially contain a mix of resident and anadromous samples. In 2006, samples (n=50, STH) were collected from sites approximately 19 rkm upstream from the confluence of the Deschutes River in a known steelhead spawning area. In 2006 and 2007, samples were collected in Trout Creek at a rotary screw trap, operated by ODFW, located near the mouth of the creek. Scale and fin tissue samples have been collected at the trap for several years as part of a long-term monitoring and evaluation program.
Westside tributary sampling
Due to concerns from NOAA-Fisheries and the CTWSRO, in-stream sample collection from Shitike Creek and the Warm Springs River was attempted using a combination of seining and dip-netting. In 2005, samples (n=30, presumed STH) were collected at rkm 7 of Shitike Creek in an area with both anadromous and resident forms. Samples (n=40, STH) were also collected at rkm 14 in a predominately anadromous spawning area. These 40 samples are classified as smolts in Table 1, but may be either smolts or pre-smolt steelhead. In the Warm Springs River, samples were collected from rkm 10 of Mill Creek (n=4, STH), a tributary to the Warm Springs River, and from the mainstem Warm Springs River at rkm 43 (n=5, STH) for a total of 9 STH samples in 2005. The low sample size was due to the lack of available juveniles in locations where only anadromous steelhead were located.
In the Warm Springs River, steelhead smolt samples (n=58, STH) were collected in 2006 from a trap located near the mouth of the river. Smolts were identified based on out-migration timing, appearance (smolt characteristics), and size. In addition, a collection (n=9, STH) of 2005 juvenile and a collection (n=19, STH) of 2006 adult Warm Springs River were evaluated. For comparison our analyses included samples of adult stray hatchery-origin steelhead sampled at Warm Springs National Fish Hatchery from 2005 and 2006 (n=57 and 102, respectively), and adult natural-origin steelhead (n=25) sampled in the Warm Springs River in 2007.

Page30�
Mainstem and Round Butte Hatchery sampling
In 2005, electrofishing was used to collect samples (n=50, Unk) from the lower mainstem Deschutes River to just below the confluence with Trout Creek. Both the lower and upper collections occurred during the fall and may have contained resident, anadromous, or a mix of both life history forms. Electrofishing was used again in the fall of 2006 to collect samples (n=100, Unk) from the mainstem Deschutes River below Trout Creek, between rkm 98 and rkm139. These samples likewise contained resident, anadromous, or a mix of life history forms. The Round Butte Hatchery collection contains samples (n=50, STH) from brood year 2005 steelhead collected from raceways.
In the mainstem Deschutes River (above Trout Creek) 2006 sampling effort, locations were targeted in which predominately anadromous forms were present. A drift boat was used to observe active spawning by adult anadromous steelhead during the springtime and GPS locations were recorded for steelhead redd locations. In early June, field crews returned to the steelhead redd locations and used dip-netting techniques to capture newly emergent fry. Based on the location, timing, and size of the fish collected, field crews were reasonably confident that these samples (n=38, STH) were made up of primarily anadromous origin juveniles. Similar sampling (n=54, STH) was carried out in 2007.

Page31�
Appendix 2. Microsatellite loci used in this study. Bold loci are part of the SPAN suite of loci.
Annealing [MgCl2] NumberLocus Reference Temp. (oC) (mM) of Alleles
Ssa407 Cairney et al. 2000 60 2.0 23Omy1001UW Spies et al. 2005 50 1.5 28Oke4 Buchholz et al. 2001 54 2.0 24Ots3 Banks et al. 1999 48 2.0 11Ogo4 Olsen et al. 1998 59 1.5 14Omy1011UW Spies et al. 2005 59 2.0 23Omy7iNRA K. Gharbi, and R. Guyomard, INRAa, France 59 2.0 17Ssa289 McConnell et al.1995 50 2.0 11Oneμ14 Scribner et al. 1996 60 2.0 14Ots100 Banks et al. 1999 57 2.0 24Ots4 Banks et al. 1999 53 2.0 8Ocl1 Condrey & Bentzen 1998 59 1.5 19Oki23 Smith et al. 1998 59 2.0 23Omy77 Morris et al. 1996 59 2.0 21Ssa408 Cairney et al. 2000 59 2.0 26Ogo3 Olsen et al. 1998 59 2.0 10Ots1 Banks et al. 1999 59 2.0 23a French Institute for Agricultural Research (INRA)

Page32�
Appendix 3. Population allele frequencies – all 21 collections.
Locu
s
Alle
le#
Size
War
m S
prin
gs st
rays
05
Rou
nd B
utte
Hat
cher
ySh
itike
juve
nile
sB
uck
Hol
low
juve
nile
s 05
Mai
nste
m D
esch
utes
low
er 0
5B
akeo
ven
juve
nile
s 05
War
m S
prin
gs N
OR
adu
lts 0
6W
arm
Spr
ings
stra
ys 0
6B
uck
Hol
low
juve
nile
s 06
Bak
eove
n ju
veni
les 0
6M
ains
tem
Des
chut
es lo
wer
06
War
m S
prin
gs N
OR
juve
nile
sM
ains
tem
Des
chut
es u
pper
06
Trou
t Cre
ek ju
veni
les
06Tr
out C
reek
juve
nile
s 07
War
m S
prin
gs N
OR
adu
lts 0
7M
ains
tem
Des
chut
es u
pper
07
Why
chus
Cre
ek ju
veni
les
Cra
ne P
rairi
e R
eser
voir
Tum
alo
Cree
k ju
veni
les
Oak
Spr
ings
Hat
cher
y ad
ults
Ocl1 1 150 0.0000 0.0000 0.0000 0.0000 0.0000 0.0000 0.0000 0.0000 0.0000 0.0000 0.0000 0.0000 0.0000 0.0000 0.0000 0.0000 0.0000 0.0000 0.0000 0.0283 0.00002 154 0.0000 0.0000 0.0072 0.0000 0.0000 0.0000 0.0000 0.0000 0.0000 0.0000 0.0000 0.0149 0.0000 0.0000 0.0000 0.0000 0.0000 0.0000 0.0000 0.0000 0.00003 176 0.0000 0.0100 0.0072 0.0000 0.0000 0.0000 0.0000 0.0083 0.0000 0.0000 0.0053 0.0075 0.0132 0.0091 0.0100 0.0200 0.0093 0.0000 0.0000 0.0094 0.00004 184 0.0000 0.0000 0.0000 0.0000 0.0000 0.0000 0.0246 0.0000 0.0000 0.0000 0.0000 0.0075 0.0000 0.0000 0.0000 0.0000 0.0000 0.0000 0.0000 0.0000 0.00005 188 0.0089 0.0000 0.0000 0.0111 0.0000 0.0000 0.0082 0.0333 0.0119 0.0000 0.0000 0.0000 0.0000 0.0091 0.0100 0.0000 0.0000 0.0000 0.0000 0.0943 0.00006 192 0.0268 0.0200 0.0145 0.0111 0.0000 0.0400 0.0246 0.0083 0.0119 0.0102 0.0474 0.0522 0.0395 0.0273 0.0500 0.0400 0.0648 0.0000 0.2059 0.0377 0.56257 194 0.0000 0.0000 0.0000 0.0000 0.0000 0.0000 0.0000 0.0000 0.0000 0.0000 0.0000 0.0000 0.0000 0.0091 0.0000 0.0000 0.0000 0.0000 0.0000 0.0000 0.00008 196 0.1250 0.0200 0.0652 0.1333 0.0300 0.0400 0.1148 0.0583 0.1071 0.0510 0.0263 0.0299 0.2105 0.1455 0.0600 0.1000 0.1296 0.0319 0.0686 0.1038 0.01799 198 0.0000 0.0000 0.0000 0.0000 0.0000 0.0000 0.0000 0.0000 0.0000 0.0000 0.0000 0.0000 0.0000 0.0000 0.0000 0.0200 0.0000 0.0000 0.0000 0.0000 0.0000
10 200 0.1786 0.1800 0.2971 0.2556 0.4200 0.1600 0.1066 0.1583 0.1310 0.2755 0.3526 0.2239 0.2895 0.1455 0.1500 0.1400 0.3426 0.3404 0.0784 0.1132 0.000011 202 0.0000 0.0000 0.0000 0.0000 0.0000 0.0000 0.0000 0.0000 0.0000 0.0000 0.0000 0.0000 0.0000 0.0000 0.0000 0.0000 0.0000 0.0000 0.0098 0.0000 0.142912 204 0.3750 0.3800 0.2754 0.3222 0.2600 0.3300 0.4508 0.3917 0.4762 0.3878 0.2474 0.3731 0.2500 0.3364 0.3800 0.3400 0.2778 0.1596 0.5196 0.3585 0.133913 208 0.0446 0.1600 0.0725 0.0222 0.1900 0.0500 0.0574 0.0417 0.0238 0.0408 0.2000 0.0896 0.1184 0.1364 0.1000 0.1200 0.1111 0.3617 0.0098 0.0566 0.142914 212 0.0804 0.0600 0.0797 0.0444 0.0500 0.0600 0.0738 0.1000 0.0238 0.0612 0.0474 0.0746 0.0395 0.0727 0.1100 0.1000 0.0370 0.0745 0.0490 0.1132 0.000015 216 0.0000 0.0500 0.0072 0.0000 0.0000 0.0700 0.0082 0.0083 0.0595 0.0102 0.0053 0.0075 0.0132 0.0091 0.0100 0.0400 0.0185 0.0000 0.0294 0.0660 0.000016 220 0.0268 0.0300 0.0217 0.0222 0.0300 0.0600 0.0246 0.0167 0.0238 0.0408 0.0158 0.0373 0.0263 0.0364 0.0300 0.0000 0.0000 0.0319 0.0000 0.0094 0.000017 224 0.0625 0.0700 0.0942 0.1444 0.0100 0.1700 0.0820 0.1083 0.0952 0.1122 0.0316 0.0373 0.0000 0.0455 0.0700 0.0800 0.0000 0.0000 0.0000 0.0094 0.000018 228 0.0446 0.0200 0.0290 0.0222 0.0100 0.0200 0.0246 0.0250 0.0357 0.0102 0.0211 0.0448 0.0000 0.0182 0.0100 0.0000 0.0093 0.0000 0.0294 0.0000 0.000019 230 0.0268 0.0000 0.0290 0.0111 0.0000 0.0000 0.0000 0.0417 0.0000 0.0000 0.0000 0.0000 0.0000 0.0000 0.0100 0.0000 0.0000 0.0000 0.0000 0.0000 0.0000
# samples: 56 50 69 45 50 50 61 60 42 49 95 67 38 55 50 25 54 47 51 53 56

Page33�
Appendix 3 (cont.). Population allele frequencies – all 21 collections.
Locu
s
Alle
le#
Size
War
m S
prin
gs st
rays
05
Rou
nd B
utte
Hat
cher
ySh
itike
juve
nile
sB
uck
Hol
low
juve
niles
05
Mai
nste
m D
esch
utes
low
er 0
5B
akeo
ven
juve
nile
s 05
War
m S
prin
gs N
OR
adul
ts 0
6W
arm
Spr
ings
stra
ys 0
6B
uck
Hol
low
juve
niles
06
Bak
eove
n ju
veni
les 0
6M
ains
tem
Des
chut
es lo
wer
06
War
m S
prin
gs N
OR
juve
nile
sM
ains
tem
Des
chut
es u
pper
06
Trou
t Cre
ek ju
veni
les 0
6Tr
out C
reek
juve
niles
07
War
m S
prin
gs N
OR
adul
ts 0
7M
ains
tem
Des
chut
es u
pper
07
Why
chus
Cre
ek ju
veni
les
Cra
ne P
rairi
e Re
serv
oir
Tum
alo
Cree
k ju
veni
les
Oak
Spr
ings
Hat
cher
y ad
ults
Ogo4 1 115 0.0877 0.2041 0.2609 0.2889 0.3400 0.1400 0.2750 0.0750 0.1429 0.2200 0.3474 0.2761 0.3026 0.2636 0.1300 0.1600 0.3426 0.4681 0.2059 0.3774 0.24112 117 0.0263 0.0816 0.0145 0.0444 0.0000 0.0400 0.0250 0.0083 0.0238 0.0200 0.0421 0.0597 0.0395 0.0182 0.0400 0.0000 0.0093 0.0000 0.0588 0.1132 0.04463 119 0.0439 0.0204 0.0580 0.1000 0.0200 0.0400 0.0000 0.0417 0.0238 0.0000 0.0053 0.0075 0.0000 0.0182 0.0200 0.0600 0.0093 0.0106 0.0000 0.0283 0.00004 121 0.0088 0.0000 0.0000 0.0000 0.0000 0.0000 0.0000 0.0000 0.0000 0.0000 0.0000 0.0075 0.0000 0.0000 0.0000 0.0000 0.0000 0.0000 0.0000 0.0000 0.00005 123 0.0000 0.0000 0.0072 0.0333 0.0000 0.0000 0.0000 0.0000 0.0000 0.0000 0.0000 0.0000 0.0000 0.0000 0.0000 0.0000 0.0000 0.0000 0.0000 0.0566 0.00006 125 0.0175 0.0000 0.0145 0.0111 0.0100 0.0000 0.0083 0.0000 0.0238 0.0000 0.0000 0.0149 0.0000 0.0000 0.0000 0.0000 0.0000 0.0000 0.0000 0.0000 0.00007 127 0.0614 0.1122 0.0072 0.1000 0.0000 0.0300 0.0750 0.1417 0.1310 0.0200 0.0000 0.0597 0.0395 0.0273 0.0800 0.0600 0.0278 0.0106 0.0588 0.0094 0.04468 129 0.2895 0.2755 0.3261 0.2222 0.4200 0.3200 0.2333 0.2750 0.2738 0.3400 0.4684 0.2836 0.3158 0.3000 0.4200 0.2800 0.3241 0.3404 0.3725 0.2264 0.14299 131 0.2018 0.1020 0.0652 0.0667 0.1300 0.2000 0.1500 0.1500 0.1548 0.0900 0.0842 0.1194 0.2368 0.1545 0.0900 0.2000 0.1296 0.0638 0.1863 0.0189 0.4554
10 133 0.0965 0.0918 0.1087 0.0111 0.0100 0.0100 0.0750 0.1083 0.0833 0.1300 0.0053 0.0373 0.0132 0.0909 0.0800 0.0800 0.0185 0.0106 0.1176 0.1698 0.071411 135 0.1404 0.1122 0.1159 0.1111 0.0700 0.1700 0.1167 0.1750 0.1429 0.1800 0.0316 0.1045 0.0395 0.1182 0.1300 0.1400 0.1111 0.0638 0.0000 0.0000 0.000012 137 0.0263 0.0000 0.0145 0.0111 0.0000 0.0000 0.0000 0.0250 0.0000 0.0000 0.0158 0.0149 0.0132 0.0091 0.0100 0.0200 0.0278 0.0319 0.0000 0.0000 0.000013 139 0.0000 0.0000 0.0000 0.0000 0.0000 0.0000 0.0417 0.0000 0.0000 0.0000 0.0000 0.0149 0.0000 0.0000 0.0000 0.0000 0.0000 0.0000 0.0000 0.0000 0.000014 145 0.0000 0.0000 0.0072 0.0000 0.0000 0.0500 0.0000 0.0000 0.0000 0.0000 0.0000 0.0000 0.0000 0.0000 0.0000 0.0000 0.0000 0.0000 0.0000 0.0000 0.0000
# samples: 57 49 69 45 50 50 60 60 42 50 95 67 38 55 50 25 54 47 51 53 56

Page34�
Appendix 3 (cont.). Population allele frequencies – all 21 collections.
Locu
s
Alle
le#
Size
War
m S
prin
gs st
rays
05
Rou
nd B
utte
Hat
cher
ySh
itike
juve
nil e
sB
uck
Hol
low
juve
niles
05
Mai
nste
m D
esch
utes
low
er 0
5B
akeo
ven
juve
nile
s 05
War
m S
prin
gs N
OR
adul
ts 0
6W
arm
Spr
ings
stra
ys 0
6B
uck
Hol
low
juve
niles
06
Bak
eove
n ju
veni
les 0
6M
ains
tem
Des
chut
es lo
wer
06
War
m S
prin
gs N
OR
juve
niles
Mai
nste
m D
esch
utes
upp
er 0
6Tr
out C
reek
juve
nile
s 06
Trou
t Cre
ek ju
veni
les 0
7W
arm
Spr
ings
NO
R ad
ults
07
Mai
nste
m D
esch
utes
upp
er 0
7W
hych
us C
reek
juve
nile
sC
rane
Pra
irie
R ese
rvoi
r T u
mal
o Cr
eek
juve
nile
sO
ak S
prin
gs H
atch
ery
adul
ts
Omy7i 1 234 0.0702 0.0000 0.0507 0.0444 0.0200 0.0500 0.0667 0.0417 0.0119 0.0500 0.0052 0.0746 0.0000 0.0370 0.0100 0.0600 0.0000 0.0000 0.0392 0.0755 0.18752 238 0.0000 0.0400 0.0000 0.0000 0.0000 0.0000 0.0250 0.0000 0.0000 0.0000 0.0000 0.0149 0.0000 0.0000 0.0000 0.0000 0.0000 0.0000 0.0196 0.0283 0.00003 242 0.0175 0.0200 0.0000 0.0222 0.0000 0.0100 0.0167 0.0333 0.0000 0.0000 0.0000 0.0075 0.0000 0.0093 0.0000 0.0000 0.0000 0.0000 0.0098 0.0000 0.00004 244 0.0000 0.0200 0.0725 0.0444 0.2200 0.0400 0.0917 0.0000 0.0476 0.0300 0.1354 0.0522 0.0658 0.0185 0.0300 0.0600 0.1204 0.2222 0.0000 0.0000 0.00005 246 0.0789 0.0300 0.1014 0.0667 0.0000 0.0400 0.0833 0.0417 0.0119 0.0800 0.0208 0.0299 0.1053 0.0278 0.0400 0.0400 0.0556 0.0222 0.0196 0.0849 0.10716 248 0.1491 0.1000 0.0725 0.1111 0.0400 0.1400 0.1417 0.1333 0.0476 0.0500 0.0312 0.0672 0.1579 0.1667 0.1100 0.2000 0.1574 0.0444 0.3627 0.1415 0.09827 250 0.1228 0.2600 0.1377 0.2333 0.1200 0.1900 0.1500 0.1167 0.1548 0.2200 0.1042 0.0970 0.1974 0.1759 0.2100 0.1000 0.1667 0.0333 0.1667 0.1415 0.45548 252 0.1228 0.1700 0.0507 0.1000 0.1000 0.1800 0.0250 0.1583 0.3214 0.2000 0.0990 0.0970 0.1184 0.1667 0.1200 0.0800 0.0833 0.1778 0.0196 0.0660 0.00009 254 0.2368 0.1800 0.2899 0.2111 0.0600 0.1800 0.2167 0.2917 0.2024 0.2200 0.1250 0.2687 0.1842 0.2500 0.2600 0.2800 0.1944 0.1556 0.0000 0.1509 0.0000
10 256 0.0789 0.1200 0.0580 0.0444 0.1500 0.0400 0.0917 0.0250 0.0238 0.0300 0.1927 0.1194 0.0526 0.0278 0.0900 0.0400 0.0833 0.0556 0.3333 0.2264 0.000011 258 0.0702 0.0100 0.1014 0.0222 0.0000 0.0300 0.0083 0.0667 0.0119 0.0300 0.0260 0.0075 0.0132 0.0463 0.0700 0.0800 0.0370 0.0444 0.0000 0.0000 0.000012 260 0.0000 0.0000 0.0072 0.0000 0.0000 0.0000 0.0000 0.0000 0.0000 0.0000 0.0000 0.0149 0.0000 0.0000 0.0000 0.0000 0.0000 0.0000 0.0000 0.0000 0.000013 262 0.0263 0.0500 0.0507 0.1000 0.2700 0.0800 0.0500 0.0917 0.1667 0.0900 0.2292 0.1269 0.1053 0.0648 0.0300 0.0600 0.1019 0.2444 0.0098 0.0566 0.017914 264 0.0000 0.0000 0.0000 0.0000 0.0000 0.0000 0.0000 0.0000 0.0000 0.0000 0.0000 0.0000 0.0000 0.0000 0.0000 0.0000 0.0000 0.0000 0.0000 0.0189 0.000015 266 0.0000 0.0000 0.0000 0.0000 0.0000 0.0200 0.0000 0.0000 0.0000 0.0000 0.0000 0.0000 0.0000 0.0000 0.0000 0.0000 0.0000 0.0000 0.0000 0.0094 0.000016 268 0.0263 0.0000 0.0072 0.0000 0.0200 0.0000 0.0250 0.0000 0.0000 0.0000 0.0312 0.0075 0.0000 0.0093 0.0300 0.0000 0.0000 0.0000 0.0196 0.0000 0.133917 272 0.0000 0.0000 0.0000 0.0000 0.0000 0.0000 0.0083 0.0000 0.0000 0.0000 0.0000 0.0149 0.0000 0.0000 0.0000 0.0000 0.0000 0.0000 0.0000 0.0000 0.0000
# samples: 57 50 69 45 50 50 60 60 42 50 96 67 38 54 50 25 54 45 51 53 56

Page35�
Appendix 3 (cont.). Population allele frequencies – all 21 collections.
Locu
s
Alle
le#
Size
War
m S
prin
gs st
rays
05
Rou
nd B
utte
Hat
cher
ySh
itike
juve
nile
sB
uck
Hol
low
juve
nile
s 05
Mai
nste
m D
esch
utes
low
er 0
5B
akeo
ven
juve
nile
s 05
War
m S
prin
gs N
OR
adu
lts 0
6W
arm
Spr
ings
stra
ys 0
6B
uck
Hol
low
juve
nile
s 06
Bak
eove
n ju
veni
les 0
6M
ains
tem
Des
chut
es lo
wer
06
War
m S
prin
gs N
OR
juve
nile
sM
ains
tem
Des
chut
es u
pper
06
Trou
t Cre
ek ju
veni
les
06Tr
out C
reek
juve
nile
s 07
War
m S
prin
gs N
OR
adu
lts 0
7M
ains
tem
Des
chut
es u
pper
07
Why
chus
Cre
ek ju
veni
les
Cra
ne P
rairi
e R
eser
voir
Tum
alo
Cree
k ju
veni
les
Oak
Spr
ings
Hat
cher
y ad
ults
Ots1 1 156 0.0000 0.0000 0.0000 0.0000 0.0000 0.0000 0.0000 0.0083 0.0122 0.0000 0.0000 0.0075 0.0000 0.0000 0.0000 0.0000 0.0000 0.0000 0.0294 0.1321 0.00002 160 0.0000 0.0000 0.0000 0.0000 0.0100 0.0000 0.0000 0.0000 0.0000 0.0000 0.0053 0.0000 0.0921 0.0000 0.0000 0.0000 0.0377 0.0000 0.0000 0.0000 0.00003 162 0.0526 0.1224 0.0870 0.0341 0.0600 0.0700 0.0246 0.0417 0.0366 0.0521 0.0579 0.0000 0.2237 0.0182 0.0400 0.0208 0.1226 0.0532 0.1373 0.1509 0.06254 164 0.1842 0.2347 0.1812 0.1250 0.2200 0.2200 0.2869 0.1250 0.1463 0.1562 0.2737 0.3209 0.1842 0.1636 0.2100 0.1667 0.1604 0.1489 0.1471 0.3019 0.11615 166 0.2368 0.1939 0.1304 0.2159 0.1800 0.1900 0.1393 0.1250 0.1829 0.1667 0.2105 0.2164 0.0132 0.2273 0.2600 0.0417 0.1509 0.3191 0.0882 0.0283 0.29466 168 0.0263 0.0102 0.0145 0.0682 0.0500 0.0000 0.0246 0.0667 0.0000 0.0104 0.0053 0.0075 0.0263 0.0273 0.0300 0.0417 0.0000 0.0000 0.2157 0.0283 0.37507 169 0.1491 0.0714 0.1232 0.1250 0.0400 0.0800 0.0984 0.1333 0.1341 0.1250 0.0105 0.0746 0.0658 0.1727 0.1000 0.2292 0.0660 0.0213 0.0588 0.0943 0.00008 170 0.0088 0.0102 0.0000 0.0000 0.0000 0.0000 0.0164 0.0083 0.0000 0.0000 0.0000 0.0000 0.0000 0.0000 0.0000 0.0000 0.0000 0.0106 0.0784 0.0000 0.00009 172 0.0000 0.0306 0.0000 0.0114 0.0000 0.0000 0.0082 0.0083 0.0244 0.0000 0.0000 0.0000 0.0263 0.0091 0.0200 0.0000 0.0000 0.0000 0.0000 0.0000 0.0000
10 174 0.0351 0.0816 0.1304 0.0455 0.2000 0.0400 0.0984 0.0333 0.0976 0.1146 0.2526 0.1269 0.1184 0.0545 0.0400 0.1042 0.0660 0.2128 0.0000 0.0000 0.000011 176 0.0000 0.0102 0.0072 0.0000 0.0000 0.0000 0.0082 0.0000 0.0000 0.0000 0.0000 0.0000 0.0000 0.0000 0.0000 0.0000 0.0000 0.0000 0.0490 0.0000 0.133912 180 0.0000 0.0306 0.0507 0.0341 0.0600 0.0000 0.0082 0.0000 0.0122 0.0000 0.0474 0.0149 0.0000 0.0000 0.0100 0.0000 0.0660 0.0638 0.0000 0.0000 0.000013 182 0.0000 0.0000 0.0000 0.0000 0.0000 0.0000 0.0082 0.0000 0.0000 0.0000 0.0000 0.0000 0.0000 0.0000 0.0000 0.0000 0.0000 0.0000 0.0000 0.0000 0.000014 188 0.0000 0.0000 0.0000 0.0114 0.0100 0.0000 0.0246 0.0000 0.0244 0.0000 0.0000 0.0000 0.0000 0.0091 0.0200 0.0000 0.0094 0.0000 0.0000 0.0000 0.000015 190 0.0000 0.0000 0.0000 0.0114 0.0000 0.0000 0.0000 0.0000 0.0000 0.0000 0.0000 0.0000 0.0000 0.0000 0.0000 0.0000 0.0000 0.0000 0.0000 0.0000 0.000016 230 0.0000 0.0000 0.0000 0.0000 0.0000 0.0000 0.0000 0.0000 0.0000 0.0000 0.0000 0.0000 0.0000 0.0000 0.0000 0.0000 0.0000 0.0000 0.0000 0.0377 0.000017 234 0.0175 0.0000 0.0362 0.0341 0.0000 0.0300 0.0082 0.0083 0.0000 0.0208 0.0053 0.0000 0.0000 0.0273 0.0100 0.0417 0.0094 0.0000 0.0000 0.0000 0.008918 236 0.0088 0.0000 0.0000 0.0000 0.0000 0.0000 0.0000 0.0417 0.0000 0.0000 0.0000 0.0000 0.0000 0.0000 0.0000 0.0000 0.0000 0.0000 0.0098 0.0000 0.000019 238 0.0526 0.0000 0.0072 0.0227 0.0000 0.0000 0.0082 0.0417 0.0244 0.0000 0.0053 0.0149 0.0789 0.0182 0.0300 0.0000 0.0094 0.0426 0.0000 0.0000 0.000020 242 0.2281 0.2041 0.2246 0.2500 0.1400 0.3700 0.2377 0.3583 0.3049 0.3125 0.1211 0.2015 0.0526 0.2636 0.2300 0.3542 0.2830 0.1277 0.0294 0.1981 0.000021 244 0.0000 0.0000 0.0072 0.0114 0.0300 0.0000 0.0000 0.0000 0.0000 0.0312 0.0053 0.0075 0.1184 0.0000 0.0000 0.0000 0.0094 0.0000 0.1569 0.0283 0.000022 246 0.0000 0.0000 0.0000 0.0000 0.0000 0.0000 0.0000 0.0000 0.0000 0.0000 0.0000 0.0075 0.0000 0.0091 0.0000 0.0000 0.0094 0.0000 0.0000 0.0000 0.000023 248 0.0000 0.0000 0.0000 0.0000 0.0000 0.0000 0.0000 0.0000 0.0000 0.0104 0.0000 0.0000 0.0000 0.0000 0.0000 0.0000 0.0000 0.0000 0.0000 0.0000 0.0089
# samples: 57 49 69 44 50 50 61 60 41 48 95 67 38 55 50 24 53 47 51 53 56

Page36�
Appendix 3 (cont.). Population allele frequencies – all 21 collections.
Locu
s
Alle
le#
Size
War
m S
prin
gs st
rays
05
Rou
nd B
utte
Hat
cher
ySh
itike
juve
nile
sB
uck
Hol
low
juve
nile
s 05
Mai
nste
m D
esch
utes
low
er 0
5B
akeo
ven
juve
nile
s 05
War
m S
prin
gs N
OR
adu
lts 0
6W
arm
Spr
ings
stra
ys 0
6B
uck
Hol
low
juve
nile
s 06
Bak
eove
n ju
veni
les 0
6M
ains
tem
Des
chut
es lo
wer
06
War
m S
prin
gs N
OR
juve
nile
sM
ains
tem
Des
chut
es u
pper
06
Trou
t Cre
ek ju
veni
les
06Tr
out C
reek
juve
nile
s 07
War
m S
prin
gs N
OR
adu
lts 0
7M
ains
tem
Des
chut
es u
pper
07
Why
chus
Cre
ek ju
veni
les
Cra
ne P
rairi
e R
eser
voir
Tum
alo
Cree
k ju
veni
les
Oak
Spr
ings
Hat
cher
y ad
ults
Ots100 1 166 0.1273 0.1100 0.0809 0.1444 0.1600 0.1700 0.1083 0.1083 0.1429 0.0500 0.2396 0.1194 0.0946 0.1204 0.0800 0.0400 0.1204 0.4444 0.0588 0.0755 0.00002 170 0.2091 0.2000 0.1544 0.1444 0.1100 0.0800 0.1750 0.1583 0.1667 0.1300 0.1302 0.0821 0.0541 0.1019 0.1100 0.2200 0.1389 0.0889 0.2843 0.1887 0.00003 172 0.0000 0.0000 0.0000 0.0000 0.0000 0.0000 0.0000 0.0000 0.0000 0.0000 0.0000 0.0149 0.0000 0.0093 0.0000 0.0000 0.0000 0.0000 0.0000 0.0094 0.00004 174 0.0545 0.0300 0.1176 0.0444 0.0600 0.0700 0.0917 0.0417 0.0476 0.0400 0.0208 0.0597 0.0135 0.0093 0.0200 0.1000 0.0926 0.0333 0.0588 0.1132 0.00005 178 0.3545 0.2300 0.1618 0.2222 0.0500 0.2100 0.1583 0.3500 0.2024 0.1400 0.0885 0.2015 0.0405 0.3148 0.3000 0.2600 0.0463 0.0889 0.1569 0.0000 0.09826 180 0.0000 0.0000 0.0000 0.0000 0.0000 0.0000 0.0167 0.0000 0.0000 0.0000 0.0000 0.0000 0.0000 0.0093 0.0000 0.0000 0.0000 0.0000 0.0000 0.0000 0.00007 182 0.1273 0.0700 0.0882 0.0778 0.0800 0.1200 0.1250 0.2083 0.0952 0.1700 0.0885 0.1119 0.1757 0.0926 0.1300 0.1400 0.0833 0.0222 0.0098 0.0377 0.00008 184 0.0091 0.0300 0.0368 0.0333 0.0300 0.0300 0.0833 0.0500 0.0119 0.0500 0.0625 0.0522 0.0811 0.0741 0.0700 0.0400 0.0833 0.0333 0.0490 0.0377 0.15189 186 0.0091 0.0600 0.0147 0.0556 0.0100 0.0100 0.0583 0.0167 0.0357 0.0800 0.0000 0.0299 0.0000 0.0556 0.0100 0.0200 0.0000 0.0000 0.0000 0.1415 0.0000
10 188 0.0000 0.0000 0.0000 0.0000 0.0000 0.0200 0.0000 0.0000 0.0000 0.0000 0.0000 0.0224 0.0000 0.0000 0.0000 0.0000 0.0093 0.0000 0.0000 0.0000 0.000011 190 0.0091 0.0900 0.0000 0.0444 0.0100 0.0400 0.0083 0.0333 0.0476 0.0800 0.0104 0.0299 0.0135 0.0278 0.0200 0.0200 0.0093 0.0000 0.0490 0.0472 0.000012 192 0.0000 0.0000 0.0000 0.0111 0.0100 0.0100 0.0083 0.0000 0.0119 0.0200 0.0000 0.0075 0.0405 0.0000 0.0000 0.0000 0.0093 0.0000 0.0098 0.0000 0.000013 194 0.0273 0.1500 0.2574 0.1556 0.3900 0.1400 0.0750 0.0000 0.1548 0.1200 0.3177 0.1493 0.2432 0.0833 0.1600 0.1400 0.2593 0.2333 0.0294 0.1132 0.000014 196 0.0000 0.0000 0.0074 0.0000 0.0200 0.0200 0.0000 0.0000 0.0000 0.0000 0.0000 0.0000 0.0270 0.0000 0.0000 0.0000 0.0370 0.0111 0.0196 0.0189 0.071415 198 0.0364 0.0000 0.0441 0.0333 0.0100 0.0400 0.0083 0.0250 0.0119 0.0800 0.0208 0.0522 0.0405 0.0463 0.0600 0.0000 0.0370 0.0333 0.0000 0.0566 0.000016 200 0.0091 0.0300 0.0074 0.0000 0.0000 0.0000 0.0000 0.0000 0.0000 0.0200 0.0104 0.0000 0.0270 0.0000 0.0200 0.0000 0.0000 0.0000 0.0980 0.0849 0.419617 202 0.0000 0.0000 0.0000 0.0000 0.0100 0.0000 0.0583 0.0083 0.0000 0.0000 0.0000 0.0597 0.0000 0.0185 0.0000 0.0200 0.0000 0.0111 0.0098 0.0000 0.053618 204 0.0000 0.0000 0.0074 0.0000 0.0000 0.0000 0.0000 0.0000 0.0000 0.0000 0.0000 0.0000 0.0000 0.0000 0.0100 0.0000 0.0000 0.0000 0.0196 0.0000 0.000019 206 0.0000 0.0000 0.0221 0.0222 0.0100 0.0400 0.0167 0.0000 0.0119 0.0000 0.0000 0.0000 0.0000 0.0278 0.0100 0.0000 0.0185 0.0000 0.0000 0.0660 0.000020 209 0.0000 0.0000 0.0000 0.0000 0.0000 0.0000 0.0000 0.0000 0.0000 0.0000 0.0000 0.0000 0.0000 0.0093 0.0000 0.0000 0.0000 0.0000 0.0000 0.0000 0.000021 210 0.0273 0.0000 0.0000 0.0000 0.0000 0.0000 0.0083 0.0000 0.0238 0.0000 0.0000 0.0075 0.0000 0.0000 0.0000 0.0000 0.0000 0.0000 0.0000 0.0000 0.000022 212 0.0000 0.0000 0.0000 0.0000 0.0000 0.0000 0.0000 0.0000 0.0238 0.0200 0.0000 0.0000 0.0541 0.0000 0.0000 0.0000 0.0000 0.0000 0.1078 0.0000 0.187523 216 0.0000 0.0000 0.0000 0.0000 0.0400 0.0000 0.0000 0.0000 0.0000 0.0000 0.0104 0.0000 0.0946 0.0000 0.0000 0.0000 0.0556 0.0000 0.0392 0.0094 0.017924 220 0.0000 0.0000 0.0000 0.0111 0.0000 0.0000 0.0000 0.0000 0.0119 0.0000 0.0000 0.0000 0.0000 0.0000 0.0000 0.0000 0.0000 0.0000 0.0000 0.0000 0.0000
# samples: 55 50 68 45 50 50 60 60 42 50 96 67 37 54 50 25 54 45 51 53 56

Page37�
Appendix 3 (cont.). Population allele frequencies – all 21 collections.
Locu
s
Alle
le#
Size
War
m S
prin
gs st
rays
05
Rou
nd B
utte
Hat
cher
ySh
itike
juve
nile
sB
uck
Hol
low
juve
nile
s 05
Mai
nste
m D
esch
utes
low
er 0
5B
akeo
ven
juve
nile
s 05
War
m S
prin
gs N
OR
adul
ts 0
6W
arm
Spr
ings
stra
ys 0
6B
uck
Hol
low
juve
nile
s 06
Bak
eove
n ju
veni
les 0
6M
ains
tem
Des
chut
es lo
wer
06
War
m S
prin
gs N
OR
juve
nile
sM
ains
tem
Des
chut
es u
pper
06
Trou
t Cre
ek ju
veni
les
06Tr
out C
reek
juve
nile
s 07
War
m S
prin
gs N
OR
adul
ts 0
7M
ains
tem
Des
chut
es u
pper
07
Why
chus
Cre
ek ju
veni
les
Cra
ne P
rairi
e R
eser
voir
Tum
alo
Cree
k ju
veni
les
Oak
Spr
ings
Hat
cher
y ad
ults
Ots3 1 67 0.0000 0.0000 0.0000 0.0000 0.0000 0.0000 0.0000 0.0000 0.0000 0.0000 0.0000 0.0000 0.0000 0.0089 0.0000 0.0000 0.0000 0.0000 0.0000 0.0000 0.00002 69 0.0000 0.0000 0.0000 0.0000 0.0000 0.0000 0.0000 0.0000 0.0000 0.0000 0.0000 0.0000 0.0000 0.0000 0.0000 0.0200 0.0000 0.0000 0.1275 0.0000 0.00003 71 0.0000 0.0000 0.0000 0.0000 0.0000 0.0000 0.0000 0.0000 0.0000 0.0000 0.0000 0.0000 0.0000 0.0000 0.0000 0.0000 0.0000 0.0000 0.0588 0.0000 0.00004 73 0.0000 0.0000 0.0217 0.0000 0.0000 0.0000 0.0000 0.0000 0.0000 0.0000 0.0000 0.0000 0.0000 0.0000 0.0000 0.0000 0.0000 0.0000 0.0098 0.0000 0.00005 75 0.0702 0.0400 0.0217 0.0444 0.0000 0.0500 0.0164 0.0917 0.0238 0.0300 0.0158 0.0152 0.0526 0.0714 0.0200 0.0200 0.0185 0.0106 0.2451 0.1792 0.22326 77 0.3772 0.3800 0.4638 0.5333 0.7100 0.4000 0.5164 0.2750 0.3929 0.4900 0.5684 0.4697 0.3684 0.4554 0.4200 0.3200 0.4167 0.5532 0.3333 0.5377 0.25897 79 0.3509 0.4200 0.4275 0.2556 0.2800 0.3300 0.3361 0.3500 0.3214 0.3700 0.3526 0.3409 0.5132 0.2500 0.3800 0.4400 0.5000 0.3085 0.1471 0.0943 0.51798 81 0.1228 0.0500 0.0580 0.0000 0.0000 0.0200 0.0738 0.1500 0.0714 0.0100 0.0368 0.0909 0.0000 0.0536 0.0600 0.1200 0.0000 0.1064 0.0196 0.0566 0.00009 83 0.0614 0.1100 0.0072 0.1556 0.0100 0.1900 0.0492 0.1250 0.1786 0.1000 0.0263 0.0606 0.0658 0.1607 0.1000 0.0800 0.0648 0.0213 0.0588 0.1321 0.0000
10 85 0.0000 0.0000 0.0000 0.0111 0.0000 0.0100 0.0082 0.0083 0.0119 0.0000 0.0000 0.0076 0.0000 0.0000 0.0100 0.0000 0.0000 0.0000 0.0000 0.0000 0.000011 87 0.0175 0.0000 0.0000 0.0000 0.0000 0.0000 0.0000 0.0000 0.0000 0.0000 0.0000 0.0152 0.0000 0.0000 0.0100 0.0000 0.0000 0.0000 0.0000 0.0000 0.0000
# samples: 57 50 69 45 50 50 61 60 42 50 95 66 38 56 50 25 54 47 51 53 56

Page38�
Appendix 3 (cont.). Population allele frequencies – all 21 collections.
Locu
s
Alle
le#
Size
War
m S
prin
gs st
rays
05
Rou
nd B
utte
Hat
cher
ySh
itike
juve
nile
sB
uck
Hol
low
juve
nile
s 05
Mai
nste
m D
esch
utes
low
er 0
5B
akeo
ven
juve
nile
s 05
War
m S
prin
gs N
OR
adu
lts 0
6W
arm
Spr
ings
stra
ys 0
6B
uck
Hol
low
juve
nile
s 06
Bak
eove
n ju
veni
les 0
6M
ains
tem
Des
chut
es lo
wer
06
War
m S
prin
gs N
OR
juve
nile
sM
ains
tem
Des
chut
es u
pper
06
Trou
t Cre
ek ju
veni
les
06Tr
out C
reek
juve
nile
s 07
War
m S
prin
gs N
OR
adu
lts 0
7M
ains
tem
Des
chut
es u
pper
07
Why
chus
Cre
ek ju
veni
les
Cra
ne P
rairi
e R
eser
voir
Tum
alo
Cree
k ju
veni
les
Oak
Spr
ings
Hat
cher
y ad
ults
Ots4 1 105 0.1579 0.1327 0.1765 0.0778 0.0800 0.0500 0.1066 0.1186 0.1429 0.1000 0.0789 0.1343 0.2237 0.1727 0.1000 0.1000 0.1296 0.1702 0.5000 0.3302 0.28572 113 0.0000 0.0000 0.0000 0.0000 0.0000 0.0000 0.0000 0.0000 0.0000 0.0000 0.0000 0.0000 0.0000 0.0000 0.0100 0.0000 0.0000 0.0000 0.0000 0.0000 0.00003 117 0.1754 0.1224 0.0662 0.1889 0.0700 0.1500 0.1721 0.1356 0.2024 0.1800 0.0211 0.1194 0.1579 0.1364 0.1400 0.2000 0.1574 0.0106 0.1569 0.0189 0.56254 119 0.0789 0.1837 0.0882 0.0667 0.0500 0.1600 0.0246 0.0847 0.0357 0.1400 0.0789 0.0746 0.0789 0.0636 0.0700 0.0800 0.1204 0.0319 0.0196 0.1321 0.05365 121 0.0088 0.0306 0.0147 0.0111 0.0200 0.0500 0.0246 0.0508 0.0119 0.0500 0.0158 0.0224 0.0789 0.0182 0.0100 0.0400 0.0463 0.0532 0.0588 0.0377 0.00006 123 0.3421 0.3980 0.5294 0.5444 0.7200 0.2400 0.4836 0.4068 0.4167 0.3000 0.7263 0.4627 0.4342 0.4273 0.5100 0.2200 0.5000 0.6064 0.0490 0.2547 0.09827 125 0.2281 0.1224 0.1176 0.1111 0.0600 0.3400 0.1803 0.1864 0.1905 0.2200 0.0737 0.1716 0.0132 0.1727 0.1500 0.3400 0.0463 0.1277 0.2059 0.2170 0.00008 127 0.0088 0.0102 0.0074 0.0000 0.0000 0.0100 0.0082 0.0169 0.0000 0.0100 0.0053 0.0149 0.0132 0.0091 0.0100 0.0200 0.0000 0.0000 0.0098 0.0094 0.0000
# samples: 57 49 68 45 50 50 61 59 42 50 95 67 38 55 50 25 54 47 51 53 56
Locu
s
Alle
le#
Size
War
m S
prin
gs st
rays
05
Rou
nd B
utte
Hat
cher
ySh
itike
juve
nile
sB
uck
Hol
low
juve
nile
s 05
Mai
nste
m D
esch
utes
low
er 0
5B
akeo
ven
juve
nile
s 05
War
m S
prin
gs N
OR
adu
lts 0
6W
arm
Spr
ings
stra
ys 0
6B
uck
Hol
low
juve
nile
s 06
Bak
eove
n ju
veni
les 0
6M
ains
tem
Des
chut
es lo
wer
06
War
m S
prin
gs N
OR
juve
nile
sM
ains
tem
Des
chut
es u
pper
06
Trou
t Cre
ek ju
veni
les
06Tr
out C
reek
juve
nile
s 07
War
m S
prin
gs N
OR
adu
lts 0
7M
ains
tem
Des
chut
es u
pper
07
Why
chus
Cre
ek ju
veni
les
Cra
ne P
rairi
e R
eser
voir
Tum
alo
Cree
k ju
veni
les
Oak
Spr
ings
Hat
cher
y ad
ults
Ogo3 1 77 0.0000 0.0000 0.0000 0.0000 0.0000 0.0000 0.0000 0.0000 0.0000 0.0000 0.0000 0.0000 0.0132 0.0000 0.0000 0.0000 0.0000 0.0000 0.0000 0.0000 0.00002 79 0.0000 0.0000 0.0000 0.0000 0.0000 0.0000 0.0000 0.0167 0.0000 0.0000 0.0000 0.0000 0.0000 0.0000 0.0100 0.0000 0.0000 0.0000 0.0000 0.0000 0.00003 81 0.0000 0.0300 0.0290 0.0111 0.0100 0.0200 0.0082 0.0083 0.0119 0.0100 0.0052 0.0299 0.0132 0.0000 0.0000 0.0600 0.0000 0.1196 0.3039 0.2547 0.00004 83 0.2456 0.3100 0.1884 0.3000 0.1300 0.2000 0.2131 0.1750 0.2143 0.2600 0.1458 0.2463 0.1316 0.2321 0.3000 0.2600 0.1481 0.1522 0.0686 0.3396 0.12505 85 0.0000 0.0100 0.0217 0.0000 0.0100 0.0000 0.0082 0.0000 0.0238 0.0000 0.0104 0.0149 0.0658 0.0000 0.0100 0.0000 0.0000 0.0326 0.0000 0.0000 0.00896 87 0.3158 0.2400 0.3406 0.4444 0.1500 0.3100 0.2377 0.3167 0.2381 0.2500 0.1146 0.2388 0.1842 0.3661 0.2800 0.2400 0.1852 0.0326 0.3039 0.2264 0.21437 89 0.0088 0.0300 0.0507 0.0333 0.2500 0.0600 0.0410 0.0417 0.0595 0.0600 0.1562 0.0299 0.1053 0.0536 0.0200 0.0600 0.2407 0.1739 0.1765 0.0849 0.35718 91 0.4035 0.3800 0.3406 0.2111 0.3500 0.3500 0.3770 0.4167 0.4167 0.3800 0.4688 0.4030 0.4474 0.3393 0.3800 0.3600 0.3981 0.4457 0.0588 0.0566 0.28579 93 0.0175 0.0000 0.0290 0.0000 0.0900 0.0500 0.0902 0.0250 0.0357 0.0300 0.0990 0.0373 0.0395 0.0000 0.0000 0.0200 0.0278 0.0435 0.0000 0.0000 0.0000
10 95 0.0088 0.0000 0.0000 0.0000 0.0100 0.0100 0.0246 0.0000 0.0000 0.0100 0.0000 0.0000 0.0000 0.0089 0.0000 0.0000 0.0000 0.0000 0.0882 0.0377 0.0089# samples: 57 50 69 45 50 50 61 60 42 50 96 67 38 56 50 25 54 46 51 53 56

Page39�
Appendix 3 (cont.). Population allele frequencies – all 21 collections.
Locu
s
Alle
le#
Size
War
m S
prin
gs st
rays
05
Rou
nd B
utte
Hat
cher
ySh
itike
juve
nile
sB
uck
Hol
low
juve
nile
s 05
Mai
nste
m D
esch
utes
low
er 0
5B
akeo
ven
juve
nile
s 05
War
m S
prin
gs N
OR
adul
ts 0
6W
arm
Spr
ings
stra
ys 0
6B
uck
Hol
low
juve
nile
s 06
Bak
eove
n ju
veni
les 0
6M
ains
tem
Des
chut
es lo
wer
06
War
m S
prin
gs N
OR
juve
nile
sM
ains
tem
Des
chut
es u
pper
06
Trou
t Cre
ek ju
veni
les
06Tr
out C
reek
juve
nile
s 07
War
m S
prin
gs N
OR
adul
ts 0
7M
ains
tem
Des
chut
es u
pper
07
Why
chus
Cre
ek ju
veni
les
Cra
ne P
rairi
e R
eser
voir
Tum
alo
Cree
k ju
veni
les
Oak
Spr
ings
Hat
cher
y ad
ults
Oki23 1 112 0.0000 0.0000 0.0000 0.0000 0.0000 0.0000 0.0000 0.0000 0.0000 0.0000 0.0000 0.0000 0.0000 0.0000 0.0000 0.0000 0.0000 0.0000 0.0882 0.0000 0.00002 116 0.0263 0.0306 0.0145 0.0778 0.0000 0.0000 0.0246 0.0417 0.0238 0.0200 0.0000 0.0373 0.0405 0.0179 0.0900 0.0200 0.0648 0.0426 0.2059 0.0943 0.42863 120 0.0439 0.0408 0.0145 0.0111 0.0500 0.0200 0.0246 0.0500 0.0119 0.0300 0.0469 0.0000 0.0270 0.0714 0.0600 0.0200 0.0556 0.0638 0.0000 0.0189 0.00004 122 0.0088 0.0000 0.0000 0.0000 0.0000 0.0000 0.0000 0.0000 0.0000 0.0000 0.0000 0.0000 0.0000 0.0000 0.0000 0.0000 0.0000 0.0000 0.0000 0.0000 0.00005 124 0.4035 0.5000 0.3406 0.2444 0.2600 0.5000 0.3033 0.3417 0.4524 0.4400 0.3281 0.2761 0.3649 0.3125 0.3400 0.3800 0.2407 0.4894 0.0000 0.0566 0.00006 128 0.2018 0.1633 0.2391 0.2444 0.2000 0.1600 0.1967 0.1583 0.1548 0.2400 0.1771 0.1418 0.1216 0.1875 0.1300 0.1400 0.2037 0.1170 0.3922 0.3113 0.05367 132 0.0614 0.0408 0.0290 0.0778 0.0000 0.0300 0.0410 0.0500 0.0595 0.0400 0.0052 0.0224 0.0541 0.0089 0.0400 0.0200 0.0278 0.0106 0.0196 0.0849 0.00008 136 0.0526 0.0204 0.0507 0.0444 0.0000 0.0500 0.0246 0.0667 0.0238 0.0100 0.0104 0.0448 0.0000 0.0625 0.0400 0.0600 0.0741 0.0213 0.0000 0.0849 0.00009 140 0.0526 0.0102 0.0217 0.0778 0.0000 0.0400 0.0410 0.0833 0.0357 0.0100 0.0156 0.0448 0.1216 0.0625 0.0700 0.0400 0.0185 0.0213 0.0588 0.0377 0.0000
10 144 0.0702 0.0612 0.0652 0.0333 0.0300 0.0600 0.0902 0.0833 0.0833 0.0700 0.0260 0.1343 0.0135 0.0714 0.0700 0.1600 0.1111 0.0638 0.0000 0.0189 0.000011 148 0.0526 0.0306 0.0145 0.0444 0.0200 0.0100 0.0164 0.0583 0.0000 0.0500 0.0104 0.0448 0.0000 0.0179 0.0100 0.0200 0.0093 0.0000 0.0098 0.0566 0.000012 152 0.0175 0.0306 0.1377 0.0444 0.2000 0.0000 0.0984 0.0000 0.0357 0.0400 0.1771 0.0896 0.0541 0.0446 0.0400 0.0200 0.0833 0.0851 0.0196 0.0472 0.000013 156 0.0000 0.0714 0.0290 0.0444 0.0900 0.0000 0.0328 0.0000 0.0952 0.0300 0.1042 0.0075 0.0270 0.0268 0.0300 0.0000 0.0093 0.0638 0.0000 0.0094 0.000014 160 0.0000 0.0000 0.0290 0.0111 0.0900 0.0300 0.0246 0.0000 0.0000 0.0200 0.0677 0.0373 0.0135 0.0536 0.0300 0.0000 0.0370 0.0106 0.0000 0.0283 0.000015 164 0.0000 0.0000 0.0000 0.0000 0.0100 0.0300 0.0328 0.0167 0.0000 0.0000 0.0052 0.0746 0.0000 0.0089 0.0100 0.0400 0.0093 0.0106 0.0098 0.0094 0.000016 168 0.0000 0.0000 0.0000 0.0111 0.0200 0.0100 0.0246 0.0000 0.0000 0.0000 0.0104 0.0075 0.0270 0.0089 0.0000 0.0200 0.0278 0.0000 0.0000 0.0094 0.000017 172 0.0088 0.0000 0.0072 0.0000 0.0100 0.0200 0.0082 0.0083 0.0119 0.0000 0.0156 0.0224 0.0541 0.0179 0.0000 0.0200 0.0000 0.0000 0.0294 0.0283 0.000018 176 0.0000 0.0000 0.0000 0.0000 0.0000 0.0000 0.0000 0.0000 0.0000 0.0000 0.0000 0.0000 0.0000 0.0000 0.0000 0.0000 0.0000 0.0000 0.0098 0.0472 0.017919 180 0.0000 0.0000 0.0000 0.0000 0.0000 0.0000 0.0000 0.0000 0.0000 0.0000 0.0000 0.0000 0.0000 0.0089 0.0100 0.0000 0.0000 0.0000 0.0294 0.0000 0.071420 184 0.0000 0.0000 0.0000 0.0111 0.0000 0.0200 0.0000 0.0000 0.0000 0.0000 0.0000 0.0000 0.0811 0.0089 0.0100 0.0000 0.0093 0.0000 0.0686 0.0000 0.294621 188 0.0000 0.0000 0.0072 0.0000 0.0200 0.0000 0.0082 0.0000 0.0000 0.0000 0.0000 0.0000 0.0000 0.0000 0.0000 0.0000 0.0185 0.0000 0.0098 0.0472 0.000022 192 0.0000 0.0000 0.0000 0.0000 0.0000 0.0000 0.0000 0.0083 0.0000 0.0000 0.0000 0.0000 0.0000 0.0000 0.0100 0.0000 0.0000 0.0000 0.0000 0.0000 0.017923 196 0.0000 0.0000 0.0000 0.0222 0.0000 0.0200 0.0082 0.0333 0.0119 0.0000 0.0000 0.0149 0.0000 0.0089 0.0100 0.0400 0.0000 0.0000 0.0490 0.0094 0.1161
# samples: 57 49 69 45 50 50 61 60 42 50 96 67 37 56 50 25 54 47 51 53 56

Page40�
Appendix 3 (cont.). Population allele frequencies – all 21 collections.
Locu
s
Alle
le#
Size
War
m S
prin
gs st
rays
05
Rou
nd B
utte
Hat
cher
ySh
itike
juve
nile
sB
uck
Hol
low
juve
nile
s 05
Mai
nste
m D
esch
utes
low
er 0
5B
akeo
ven
juve
nile
s 05
War
m S
prin
gs N
OR
adu
lts 0
6W
arm
Spr
ings
stra
ys 0
6B
uck
Hol
low
juve
nile
s 06
Bak
eove
n ju
veni
les 0
6M
ains
tem
Des
chut
es lo
wer
06
War
m S
prin
gs N
OR
juve
nile
sM
ains
tem
Des
chut
es u
pper
06
Trou
t Cre
ek ju
veni
les
06Tr
out C
reek
juve
nile
s 07
War
m S
prin
gs N
OR
adu
lts 0
7M
ains
tem
Des
chut
es u
pper
07
Why
chus
Cre
ek ju
veni
les
Cra
ne P
rairi
e R
eser
voir
Tum
alo
Cree
k ju
veni
les
Oak
Spr
ings
Hat
cher
y ad
ults
Omy10 1 134 0.0000 0.0000 0.0000 0.0000 0.0200 0.0000 0.0000 0.0000 0.0000 0.0000 0.0053 0.0075 0.1316 0.0000 0.0000 0.0000 0.0648 0.0000 0.0196 0.0000 0.17862 138 0.0089 0.0000 0.0000 0.0111 0.0000 0.0000 0.0082 0.0083 0.0000 0.0000 0.0000 0.0299 0.0000 0.0089 0.0000 0.0200 0.0000 0.0000 0.0000 0.0000 0.00003 146 0.0268 0.0600 0.0072 0.0000 0.0100 0.0100 0.0000 0.0000 0.0000 0.0000 0.0000 0.0075 0.0000 0.0268 0.0100 0.0000 0.0093 0.0000 0.0000 0.0094 0.00004 150 0.0089 0.0300 0.0362 0.0000 0.0000 0.0300 0.0410 0.0167 0.0000 0.0100 0.0053 0.0149 0.0132 0.0089 0.0200 0.0400 0.0648 0.0000 0.0098 0.1132 0.00005 154 0.0625 0.0300 0.0145 0.1222 0.0100 0.0900 0.0738 0.0583 0.0119 0.0900 0.0000 0.0970 0.0000 0.0536 0.0800 0.1200 0.0278 0.0000 0.0000 0.0566 0.00006 158 0.1250 0.0900 0.0507 0.0333 0.0200 0.0900 0.0820 0.0750 0.0595 0.0800 0.0316 0.1119 0.0526 0.0268 0.0800 0.1800 0.0833 0.0109 0.1275 0.0472 0.39297 162 0.0089 0.0500 0.0290 0.0667 0.0200 0.0300 0.0574 0.0417 0.0714 0.0300 0.0263 0.0075 0.0789 0.0268 0.0500 0.0000 0.0370 0.1196 0.0588 0.0660 0.07148 166 0.0804 0.1200 0.1449 0.1333 0.1600 0.0800 0.1148 0.0750 0.0476 0.0800 0.1632 0.0746 0.0789 0.1071 0.0500 0.1600 0.0741 0.1957 0.0784 0.2264 0.00009 170 0.2411 0.1400 0.1739 0.1556 0.1700 0.2500 0.2049 0.2417 0.2500 0.2400 0.1421 0.2239 0.1316 0.1607 0.1500 0.1200 0.1389 0.2391 0.0784 0.1887 0.0000
10 174 0.0982 0.2200 0.1159 0.0889 0.0300 0.1500 0.1393 0.1083 0.1071 0.1400 0.0526 0.1418 0.0658 0.1607 0.2400 0.1000 0.1296 0.0000 0.1176 0.1887 0.000011 178 0.1339 0.0900 0.0362 0.0111 0.0500 0.0300 0.0656 0.1750 0.0595 0.0200 0.0526 0.0224 0.0132 0.1607 0.0900 0.0400 0.0556 0.0543 0.1275 0.0660 0.214312 182 0.0000 0.0100 0.0507 0.0667 0.1200 0.0100 0.0492 0.0083 0.0238 0.0400 0.1053 0.0448 0.0263 0.0179 0.0100 0.0600 0.0370 0.1304 0.0490 0.0000 0.125013 186 0.0536 0.0700 0.1304 0.1333 0.2600 0.0800 0.0492 0.0417 0.2500 0.0900 0.2316 0.0448 0.1842 0.0446 0.0700 0.0400 0.1574 0.1304 0.0686 0.0000 0.017914 190 0.0536 0.0400 0.0435 0.0556 0.0500 0.0500 0.0492 0.0500 0.0357 0.0800 0.0474 0.0746 0.1184 0.0893 0.0200 0.0600 0.0463 0.0761 0.0784 0.0283 0.000015 194 0.0357 0.0200 0.0652 0.0222 0.0500 0.0200 0.0246 0.0167 0.0238 0.0400 0.0684 0.0448 0.0526 0.0179 0.0800 0.0200 0.0556 0.0217 0.0882 0.0000 0.000016 198 0.0000 0.0300 0.0217 0.0444 0.0100 0.0300 0.0328 0.0250 0.0476 0.0500 0.0105 0.0224 0.0395 0.0357 0.0300 0.0200 0.0000 0.0109 0.0392 0.0094 0.000017 202 0.0625 0.0000 0.0507 0.0444 0.0200 0.0100 0.0000 0.0583 0.0119 0.0100 0.0526 0.0299 0.0132 0.0536 0.0100 0.0200 0.0185 0.0109 0.0000 0.0000 0.000018 206 0.0000 0.0000 0.0000 0.0000 0.0000 0.0300 0.0082 0.0000 0.0000 0.0000 0.0000 0.0000 0.0000 0.0000 0.0100 0.0000 0.0000 0.0000 0.0000 0.0000 0.000019 210 0.0000 0.0000 0.0290 0.0000 0.0000 0.0100 0.0000 0.0000 0.0000 0.0000 0.0000 0.0000 0.0000 0.0000 0.0000 0.0000 0.0000 0.0000 0.0000 0.0000 0.000020 218 0.0000 0.0000 0.0000 0.0000 0.0000 0.0000 0.0000 0.0000 0.0000 0.0000 0.0000 0.0000 0.0000 0.0000 0.0000 0.0000 0.0000 0.0000 0.0196 0.0000 0.000021 230 0.0000 0.0000 0.0000 0.0111 0.0000 0.0000 0.0000 0.0000 0.0000 0.0000 0.0053 0.0000 0.0000 0.0000 0.0000 0.0000 0.0000 0.0000 0.0000 0.0000 0.000022 258 0.0000 0.0000 0.0000 0.0000 0.0000 0.0000 0.0000 0.0000 0.0000 0.0000 0.0000 0.0000 0.0000 0.0000 0.0000 0.0000 0.0000 0.0000 0.0098 0.0000 0.000023 274 0.0000 0.0000 0.0000 0.0000 0.0000 0.0000 0.0000 0.0000 0.0000 0.0000 0.0000 0.0000 0.0000 0.0000 0.0000 0.0000 0.0000 0.0000 0.0294 0.0000 0.0000
# samples: 56 50 69 45 50 50 61 60 42 50 95 67 38 56 50 25 54 46 51 53 56

Page41�
Appendix 3 (cont.). Population allele frequencies – all 21 collections.
Locu
s
Alle
le#
Size
War
m S
prin
gs st
rays
05
Rou
nd B
utte
Hat
cher
ySh
itike
juve
nile
sB
uck
Hollo
w ju
veni
les 0
5M
ains
tem
Des
chut
es lo
wer
05
Bak
eove
n ju
veni
les 0
5W
arm
Spr
ings
NO
R ad
ults
06
War
m S
prin
gs st
rays
06
Buc
k Ho
llow
juve
nile
s 06
Bak
eove
n ju
veni
les 0
6M
ains
tem
Des
chut
es lo
wer
06
War
m S
prin
gs N
OR
juve
nile
sM
ains
tem
Des
chut
es u
pper
06
Trou
t Cre
ek ju
veni
les 0
6Tr
out C
reek
juve
nile
s 07
War
m S
prin
gs N
OR
adul
ts 0
7M
ains
tem
Des
chut
es u
pper
07
Why
chus
Cre
ek ju
veni
lesC
rane
Pra
irie
Rese
rvoi
r Tu
mal
o Cr
eek
juve
nile
sO
ak S
prin
gs H
atch
ery
adul
ts
Omy77 1 84 0.0000 0.0000 0.0000 0.0000 0.0000 0.0000 0.0000 0.0000 0.0000 0.0000 0.0000 0.0000 0.0000 0.0000 0.0000 0.0000 0.0000 0.0000 0.0196 0.0000 0.00002 96 0.0000 0.0000 0.0000 0.0000 0.0000 0.0100 0.0000 0.0000 0.0000 0.0000 0.0000 0.0000 0.0000 0.0000 0.0000 0.0000 0.0000 0.0000 0.0980 0.0000 0.00003 98 0.0091 0.0000 0.0000 0.0000 0.0800 0.0000 0.0000 0.0000 0.0000 0.0000 0.0158 0.0000 0.2237 0.0000 0.0000 0.0000 0.1574 0.0000 0.2647 0.0472 0.68754 102 0.0273 0.0000 0.0290 0.0556 0.0100 0.0000 0.0082 0.0417 0.0250 0.0000 0.0000 0.0076 0.0000 0.0273 0.0204 0.0400 0.0185 0.0222 0.0294 0.1132 0.00005 110 0.0000 0.0521 0.0652 0.0000 0.0100 0.0000 0.0246 0.0083 0.0125 0.0000 0.0000 0.0076 0.0000 0.0091 0.0000 0.0000 0.0278 0.0000 0.0490 0.1132 0.08046 112 0.0091 0.0104 0.0000 0.0222 0.0100 0.0000 0.0082 0.0083 0.0125 0.0700 0.0000 0.0227 0.0000 0.0091 0.0204 0.0200 0.0093 0.0667 0.0000 0.0566 0.00897 114 0.0364 0.0000 0.0000 0.0222 0.0200 0.0400 0.0000 0.0333 0.0125 0.0000 0.0368 0.0152 0.0132 0.0182 0.0204 0.0200 0.0093 0.0111 0.0686 0.0000 0.10718 116 0.1091 0.1354 0.1159 0.0667 0.1300 0.0600 0.1393 0.2000 0.0500 0.0900 0.1368 0.0758 0.0526 0.0909 0.0918 0.0800 0.0833 0.1444 0.3137 0.0566 0.00009 118 0.0273 0.1771 0.0797 0.0667 0.1500 0.1300 0.0820 0.0333 0.0125 0.0900 0.1316 0.1212 0.1184 0.0545 0.0612 0.0800 0.1204 0.1222 0.0196 0.0472 0.0000
10 120 0.0455 0.0312 0.0145 0.0333 0.0200 0.0500 0.0656 0.0500 0.0375 0.0300 0.0211 0.0379 0.0000 0.0273 0.0816 0.0400 0.0000 0.0111 0.0000 0.0377 0.000011 122 0.2182 0.0208 0.0435 0.0667 0.0000 0.1000 0.0328 0.1583 0.1250 0.1100 0.0000 0.0909 0.0132 0.0636 0.1327 0.1800 0.0093 0.0000 0.0000 0.0849 0.000012 124 0.0818 0.1458 0.1087 0.1778 0.0200 0.1000 0.0902 0.0750 0.1625 0.1500 0.0368 0.1364 0.0526 0.2364 0.1429 0.0600 0.1019 0.0667 0.0098 0.0755 0.000013 126 0.1364 0.0833 0.1884 0.1333 0.1100 0.1300 0.0902 0.1167 0.0625 0.1300 0.0684 0.1136 0.1053 0.1182 0.0816 0.2000 0.0278 0.0111 0.0294 0.2642 0.000014 128 0.0273 0.1667 0.0435 0.0556 0.0600 0.0600 0.0984 0.0500 0.0875 0.0800 0.0737 0.0909 0.0789 0.1000 0.1939 0.0200 0.1389 0.0444 0.0000 0.0943 0.008915 130 0.0364 0.0521 0.0797 0.0667 0.1200 0.0100 0.0902 0.0333 0.1375 0.0600 0.1789 0.1212 0.0395 0.0636 0.0000 0.1200 0.1296 0.2444 0.0196 0.0000 0.000016 132 0.1909 0.0938 0.1884 0.1333 0.2300 0.2100 0.1721 0.1833 0.1375 0.1200 0.2211 0.1212 0.1974 0.1545 0.0816 0.1000 0.1481 0.1889 0.0098 0.0000 0.000017 134 0.0182 0.0104 0.0362 0.0778 0.0300 0.0400 0.0902 0.0083 0.0125 0.0000 0.0737 0.0303 0.0658 0.0000 0.0612 0.0200 0.0185 0.0111 0.0000 0.0000 0.000018 136 0.0000 0.0104 0.0000 0.0222 0.0000 0.0500 0.0000 0.0000 0.0875 0.0500 0.0000 0.0076 0.0395 0.0000 0.0102 0.0000 0.0000 0.0556 0.0000 0.0000 0.000019 138 0.0091 0.0104 0.0072 0.0000 0.0000 0.0100 0.0082 0.0000 0.0250 0.0200 0.0000 0.0000 0.0000 0.0273 0.0000 0.0000 0.0000 0.0000 0.0098 0.0000 0.000020 140 0.0182 0.0000 0.0000 0.0000 0.0000 0.0000 0.0000 0.0000 0.0000 0.0000 0.0053 0.0000 0.0000 0.0000 0.0000 0.0000 0.0000 0.0000 0.0588 0.0094 0.107121 146 0.0000 0.0000 0.0000 0.0000 0.0000 0.0000 0.0000 0.0000 0.0000 0.0000 0.0000 0.0000 0.0000 0.0000 0.0000 0.0200 0.0000 0.0000 0.0000 0.0000 0.0000
# samples: 55 48 69 45 50 50 61 60 40 50 95 66 38 55 49 25 54 45 51 53 56

Page42�
Appendix 3 (cont.). Population allele frequencies – all 21 collections.
Locu
s
Alle
le#
Size
War
m S
prin
gs st
rays
05
R oun
d Bu
tte H
atch
ery
Shit i
ke ju
veni
les
B uck
Hol
low
juve
niles
05
Mai
nste
m D
esch
utes
low
er 0
5B a
keov
en ju
veni
les 0
5W
arm
Spr
ings
NO
R ad
ults
06W
arm
Spr
ings
stra
ys 0
6Bu
ck H
ollo
w ju
veni
les 0
6B a
keov
en ju
veni
les 0
6M
ains
tem
Des
chut
es lo
wer
06
War
m S
prin
gs N
OR
juve
niles
Mai
nste
m D
esch
utes
upp
er 0
6T r
out C
reek
juve
niles
06
T rou
t Cre
ek ju
veni
les 0
7W
arm
Spr
ings
NO
R ad
ults
07M
ains
tem
Des
chut
es u
pper
07
Why
chus
Cre
ek ju
veni
les
C ran
e Pra
irie R
eser
voi r
T um
alo
Cree
k ju
veni
les
Oak
Spr
ings
Hat
cher
y ad
ults
Ssa289 1 99 0.0000 0.0000 0.0000 0.0000 0.0000 0.0000 0.0000 0.0000 0.0000 0.0000 0.0000 0.0000 0.0000 0.0000 0.0000 0.0000 0.0093 0.0000 0.0000 0.0000 0.00002 103 0.0000 0.0000 0.0072 0.0000 0.0000 0.0000 0.0000 0.0000 0.0000 0.0000 0.0000 0.0000 0.0000 0.0000 0.0000 0.0000 0.0000 0.0000 0.0000 0.0000 0.00003 105 0.0000 0.0000 0.0000 0.0222 0.0400 0.0000 0.0000 0.0333 0.0119 0.0200 0.0104 0.0149 0.0921 0.0000 0.0000 0.0000 0.0926 0.0000 0.0700 0.0566 0.28574 107 0.5625 0.7500 0.7464 0.7444 0.8600 0.8000 0.7705 0.6500 0.6667 0.8600 0.9115 0.8209 0.6974 0.7455 0.7400 0.6600 0.7130 0.9043 0.4300 0.6509 0.03575 109 0.2857 0.1000 0.1014 0.1556 0.0400 0.1600 0.1967 0.1667 0.2262 0.0800 0.0156 0.0597 0.0395 0.1727 0.1300 0.1200 0.0926 0.0213 0.1800 0.0943 0.54466 111 0.0000 0.0400 0.0217 0.0111 0.0200 0.0000 0.0000 0.0000 0.0119 0.0100 0.0312 0.0075 0.0263 0.0273 0.0200 0.0000 0.0093 0.0000 0.0200 0.0094 0.00897 113 0.0357 0.0000 0.0217 0.0556 0.0000 0.0300 0.0164 0.0750 0.0357 0.0100 0.0000 0.0299 0.0000 0.0364 0.0600 0.0800 0.0093 0.0000 0.0000 0.0000 0.00008 115 0.1071 0.0500 0.0290 0.0111 0.0200 0.0100 0.0164 0.0667 0.0357 0.0200 0.0208 0.0597 0.1316 0.0182 0.0400 0.1400 0.0556 0.0745 0.1400 0.1132 0.12509 117 0.0000 0.0500 0.0507 0.0000 0.0200 0.0000 0.0000 0.0000 0.0000 0.0000 0.0052 0.0000 0.0132 0.0000 0.0100 0.0000 0.0185 0.0000 0.0800 0.0283 0.0000
10 119 0.0089 0.0100 0.0217 0.0000 0.0000 0.0000 0.0000 0.0083 0.0119 0.0000 0.0052 0.0075 0.0000 0.0000 0.0000 0.0000 0.0000 0.0000 0.0500 0.0472 0.000011 121 0.0000 0.0000 0.0000 0.0000 0.0000 0.0000 0.0000 0.0000 0.0000 0.0000 0.0000 0.0000 0.0000 0.0000 0.0000 0.0000 0.0000 0.0000 0.0300 0.0000 0.0000
# samples: 56 50 69 45 50 50 61 60 42 50 96 67 38 55 50 25 54 47 50 53 56

Page43�
Appendix 3 (cont.). Population allele frequencies – all 21 collections.
Locu
s
Alle
le#
Size
War
m S
prin
gs st
rays
05
Rou
nd B
utte
Hat
cher
ySh
itike
juve
nile
sB
uck
Hol
low
juve
nile
s 05
Mai
nste
m D
esch
utes
low
er 0
5B
akeo
ven
juve
nile
s 05
War
m S
prin
gs N
OR
adu
lts 0
6W
arm
Spr
ings
stra
ys 0
6B
uck
Hol
low
juve
nile
s 06
Bak
eove
n ju
veni
les 0
6M
ains
tem
Des
chut
es lo
wer
06
War
m S
prin
gs N
OR
juve
nile
sM
ains
tem
Des
chut
es u
pper
06
Trou
t Cre
ek ju
veni
les 0
6Tr
out C
reek
juve
nile
s 07
War
m S
prin
gs N
OR
adu
lts 0
7M
ains
tem
Des
chut
es u
pper
07
Why
chus
Cre
ek ju
veni
les
Cra
ne P
rairi
e R
eser
voir
Tum
alo
Cree
k ju
veni
les
Oak
Spr
ings
Hat
cher
y ad
ults
Ssa407 1 159 0.0000 0.0300 0.0000 0.0000 0.0000 0.0000 0.0082 0.0000 0.0119 0.0000 0.0052 0.0000 0.0000 0.0273 0.0200 0.0200 0.0000 0.0000 0.0000 0.0000 0.00002 163 0.0179 0.0000 0.0074 0.0000 0.0300 0.0000 0.0000 0.0083 0.0000 0.0200 0.0000 0.0149 0.0000 0.0000 0.0000 0.0000 0.0000 0.0000 0.0200 0.0094 0.00003 167 0.0714 0.0600 0.0368 0.0556 0.0400 0.0600 0.0328 0.0833 0.1310 0.0900 0.0521 0.0448 0.0263 0.0455 0.0400 0.0600 0.0556 0.0000 0.0000 0.0094 0.00004 171 0.1071 0.1700 0.1544 0.1889 0.2400 0.1600 0.1475 0.1833 0.1786 0.1700 0.2969 0.1269 0.1447 0.1273 0.1900 0.1000 0.1019 0.3617 0.0000 0.0094 0.00005 175 0.1518 0.0600 0.1176 0.0778 0.0600 0.1500 0.0492 0.1833 0.0714 0.1100 0.0365 0.0821 0.0395 0.1545 0.1500 0.1200 0.0926 0.0106 0.1600 0.1038 0.20546 179 0.1875 0.1300 0.1029 0.1778 0.1100 0.1200 0.2131 0.1750 0.1905 0.1600 0.0573 0.0896 0.1316 0.0818 0.1800 0.2000 0.1204 0.0745 0.0600 0.0472 0.02687 183 0.1786 0.2200 0.2059 0.1667 0.2400 0.0900 0.2131 0.1333 0.1310 0.1700 0.1615 0.1343 0.2763 0.2000 0.1300 0.1200 0.2870 0.2128 0.2700 0.3585 0.23218 187 0.1339 0.0800 0.1691 0.1111 0.1300 0.1400 0.1557 0.0833 0.1071 0.1000 0.1615 0.2910 0.1316 0.0909 0.0600 0.2400 0.1019 0.0638 0.1200 0.1698 0.00009 191 0.0268 0.0400 0.0147 0.0333 0.0100 0.0300 0.0328 0.0250 0.0238 0.0300 0.0260 0.0299 0.0395 0.0364 0.0500 0.0000 0.0000 0.0106 0.0200 0.1132 0.0000
10 195 0.0446 0.0300 0.0147 0.0556 0.0100 0.0900 0.0164 0.0167 0.0357 0.0500 0.0104 0.0149 0.0395 0.0182 0.0200 0.0200 0.0648 0.0957 0.1700 0.0283 0.000011 199 0.0179 0.0300 0.0441 0.0222 0.0300 0.0300 0.0082 0.0500 0.0119 0.0100 0.0156 0.0522 0.0395 0.0455 0.0100 0.0000 0.0093 0.0106 0.0400 0.0000 0.000012 201 0.0000 0.0000 0.0000 0.0000 0.0000 0.0000 0.0000 0.0000 0.0000 0.0000 0.0000 0.0000 0.0000 0.0000 0.0100 0.0200 0.0093 0.0000 0.0000 0.0000 0.000013 203 0.0089 0.0000 0.0000 0.0111 0.0100 0.0100 0.0164 0.0000 0.0238 0.0200 0.0000 0.0224 0.0132 0.0000 0.0100 0.0000 0.0093 0.0000 0.0100 0.0283 0.062514 207 0.0089 0.0100 0.0147 0.0333 0.0100 0.0100 0.0000 0.0000 0.0000 0.0000 0.0000 0.0000 0.0000 0.0273 0.0000 0.0000 0.0278 0.0000 0.0600 0.0755 0.205415 209 0.0000 0.0000 0.0000 0.0000 0.0000 0.0000 0.0000 0.0000 0.0000 0.0000 0.0000 0.0000 0.0000 0.0000 0.0100 0.0000 0.0000 0.0000 0.0000 0.0000 0.000016 211 0.0179 0.0200 0.0147 0.0111 0.0200 0.0500 0.0328 0.0333 0.0357 0.0000 0.0417 0.0149 0.0395 0.0000 0.0300 0.0200 0.0000 0.0106 0.0100 0.0094 0.089317 215 0.0089 0.0900 0.0662 0.0111 0.0500 0.0000 0.0246 0.0000 0.0119 0.0200 0.1042 0.0448 0.0526 0.0455 0.0600 0.0200 0.1204 0.0638 0.0500 0.0094 0.000018 219 0.0000 0.0000 0.0221 0.0000 0.0100 0.0600 0.0328 0.0083 0.0238 0.0200 0.0052 0.0299 0.0000 0.0273 0.0000 0.0200 0.0000 0.0319 0.0100 0.0000 0.178619 223 0.0089 0.0300 0.0074 0.0111 0.0000 0.0000 0.0082 0.0000 0.0000 0.0100 0.0156 0.0075 0.0263 0.0727 0.0300 0.0200 0.0000 0.0213 0.0000 0.0094 0.000020 227 0.0000 0.0000 0.0000 0.0000 0.0000 0.0000 0.0000 0.0000 0.0000 0.0200 0.0104 0.0000 0.0000 0.0000 0.0000 0.0000 0.0000 0.0319 0.0000 0.0000 0.000021 231 0.0089 0.0000 0.0000 0.0000 0.0000 0.0000 0.0082 0.0167 0.0000 0.0000 0.0000 0.0000 0.0000 0.0000 0.0000 0.0000 0.0000 0.0000 0.0000 0.0094 0.000022 235 0.0000 0.0000 0.0000 0.0333 0.0000 0.0000 0.0000 0.0000 0.0119 0.0000 0.0000 0.0000 0.0000 0.0000 0.0000 0.0200 0.0000 0.0000 0.0000 0.0094 0.000023 247 0.0000 0.0000 0.0074 0.0000 0.0000 0.0000 0.0000 0.0000 0.0000 0.0000 0.0000 0.0000 0.0000 0.0000 0.0000 0.0000 0.0000 0.0000 0.0000 0.0000 0.0000
# samples: 56 50 68 45 50 50 61 60 42 50 96 67 38 55 50 25 54 47 50 53 56

Page44�
Appendix 3 (cont.). Population allele frequencies – all 21 collections.
Locu
s
Alle
le#
Size
War
m S
prin
gs st
rays
05
Rou
nd B
utte
Hat
cher
ySh
itike
juve
nile
sB
uck
Hol
low
juve
nile
s 05
Mai
nste
m D
esch
utes
low
er 0
5B
akeo
ven
juve
nile
s 05
War
m S
prin
gs N
OR
adu
lts 0
6W
arm
Spr
ings
stra
ys 0
6B
uck
Hol
low
juve
nile
s 06
Bak
eove
n ju
veni
les 0
6M
ains
tem
Des
chut
es lo
wer
06
War
m S
prin
gs N
OR
juve
nile
sM
ains
tem
Des
chut
es u
pper
06
Trou
t Cre
ek ju
veni
les
06Tr
out C
reek
juve
nile
s 07
War
m S
prin
gs N
OR
adu
lts 0
7M
ains
tem
Des
chut
es u
pper
07
Why
chus
Cre
ek ju
veni
les
Cra
ne P
rairi
e R
eser
voir
Tum
alo
Cree
k ju
veni
les
Oak
Spr
ings
Hat
cher
y ad
ults
Ssa408 1 169 0.0000 0.0000 0.0000 0.0556 0.0000 0.0000 0.0000 0.0167 0.0119 0.0100 0.0000 0.0000 0.0395 0.0000 0.0200 0.0000 0.0000 0.0000 0.0000 0.0000 0.00002 173 0.0526 0.2021 0.1159 0.0333 0.0100 0.0700 0.0656 0.1167 0.0714 0.1400 0.0260 0.0896 0.0395 0.0727 0.1100 0.0400 0.0278 0.0106 0.0100 0.0000 0.00003 177 0.1316 0.0957 0.0725 0.1444 0.0200 0.0600 0.0328 0.1500 0.0476 0.1200 0.0521 0.0970 0.1316 0.1091 0.0800 0.1000 0.0556 0.0213 0.0000 0.0094 0.00004 181 0.0351 0.0213 0.0217 0.0111 0.0200 0.0200 0.0492 0.0833 0.0238 0.0200 0.0156 0.0448 0.0658 0.0091 0.0200 0.0600 0.0370 0.0319 0.0100 0.0189 0.03575 185 0.1228 0.0851 0.0217 0.1333 0.0900 0.1600 0.0656 0.0833 0.1786 0.0900 0.0833 0.0746 0.0263 0.1182 0.1000 0.1600 0.0648 0.0532 0.1200 0.0000 0.19646 189 0.0351 0.0426 0.1232 0.0667 0.0600 0.1100 0.0410 0.0500 0.0714 0.0800 0.0521 0.1045 0.1316 0.0364 0.0500 0.0800 0.1574 0.1383 0.1500 0.1604 0.07147 193 0.0965 0.1383 0.1449 0.1000 0.1200 0.0100 0.1639 0.1083 0.0476 0.0600 0.1667 0.0672 0.1184 0.0364 0.0800 0.1200 0.1111 0.0532 0.1500 0.1604 0.13398 197 0.1053 0.0532 0.1014 0.1222 0.2400 0.0900 0.0656 0.0500 0.1429 0.0900 0.1823 0.1343 0.1184 0.1091 0.0900 0.0800 0.0463 0.1596 0.1800 0.2075 0.00009 201 0.0789 0.0319 0.0362 0.0444 0.0000 0.0100 0.0410 0.0250 0.0595 0.0300 0.0104 0.0597 0.0132 0.0727 0.0800 0.0000 0.0463 0.0106 0.0000 0.0472 0.0000
10 203 0.0000 0.0000 0.0000 0.0000 0.0000 0.0000 0.0000 0.0000 0.0000 0.0000 0.0000 0.0000 0.0000 0.0000 0.0000 0.0200 0.0000 0.0000 0.0000 0.0000 0.000011 205 0.2105 0.1489 0.1087 0.0778 0.0100 0.2500 0.0902 0.2083 0.0833 0.1100 0.0104 0.0597 0.0000 0.1727 0.0900 0.0800 0.0556 0.0000 0.0100 0.0094 0.000012 207 0.0000 0.0000 0.0000 0.0000 0.0000 0.0000 0.0000 0.0000 0.0000 0.0000 0.0000 0.0000 0.0000 0.0000 0.0000 0.0200 0.0000 0.0000 0.0000 0.0000 0.000013 209 0.0614 0.0000 0.0217 0.0111 0.0300 0.0000 0.0492 0.0250 0.0476 0.0000 0.0156 0.0224 0.0132 0.0636 0.0200 0.0200 0.0741 0.0745 0.0700 0.1038 0.116114 213 0.0000 0.0319 0.0217 0.0111 0.0100 0.0000 0.0492 0.0167 0.0476 0.0300 0.0052 0.0448 0.0000 0.0273 0.0800 0.0400 0.0000 0.1064 0.0300 0.0377 0.008915 217 0.0088 0.0106 0.0145 0.0111 0.0000 0.0000 0.0164 0.0333 0.0238 0.0300 0.0000 0.0224 0.0000 0.0000 0.0700 0.0000 0.0370 0.0426 0.0500 0.0377 0.258916 219 0.0000 0.0000 0.0000 0.0000 0.0000 0.0000 0.0000 0.0000 0.0000 0.0000 0.0000 0.0000 0.0000 0.0000 0.0100 0.0000 0.0000 0.0000 0.0000 0.0000 0.000017 221 0.0088 0.0638 0.0507 0.0111 0.1100 0.1100 0.0574 0.0167 0.0119 0.0700 0.1302 0.0299 0.0526 0.0182 0.0400 0.1000 0.1204 0.1383 0.0100 0.0472 0.000018 225 0.0439 0.0106 0.0507 0.0556 0.0700 0.0000 0.0410 0.0167 0.0238 0.0400 0.0573 0.0000 0.0263 0.0273 0.0500 0.0000 0.0093 0.0532 0.0300 0.0472 0.026819 227 0.0000 0.0000 0.0000 0.0000 0.0000 0.0200 0.0000 0.0000 0.0119 0.0100 0.0000 0.0000 0.0000 0.0455 0.0000 0.0000 0.0000 0.0106 0.0000 0.0000 0.000020 229 0.0088 0.0638 0.0797 0.0667 0.1900 0.0900 0.1148 0.0000 0.0833 0.0600 0.1719 0.0522 0.1447 0.0364 0.0000 0.0800 0.1389 0.0851 0.0000 0.0000 0.000021 233 0.0000 0.0000 0.0072 0.0333 0.0100 0.0000 0.0492 0.0000 0.0119 0.0000 0.0208 0.0597 0.0395 0.0273 0.0000 0.0000 0.0185 0.0106 0.1500 0.0755 0.098222 237 0.0000 0.0000 0.0000 0.0111 0.0100 0.0000 0.0000 0.0000 0.0000 0.0100 0.0000 0.0075 0.0000 0.0000 0.0000 0.0000 0.0000 0.0000 0.0000 0.0283 0.000023 241 0.0000 0.0000 0.0072 0.0000 0.0000 0.0000 0.0082 0.0000 0.0000 0.0000 0.0000 0.0000 0.0000 0.0000 0.0000 0.0000 0.0000 0.0000 0.0000 0.0094 0.000024 245 0.0000 0.0000 0.0000 0.0000 0.0000 0.0000 0.0000 0.0000 0.0000 0.0000 0.0000 0.0299 0.0395 0.0091 0.0000 0.0000 0.0000 0.0000 0.0300 0.0000 0.017925 249 0.0000 0.0000 0.0000 0.0000 0.0000 0.0000 0.0000 0.0000 0.0000 0.0000 0.0000 0.0000 0.0000 0.0000 0.0000 0.0000 0.0000 0.0000 0.0000 0.0000 0.035726 253 0.0000 0.0000 0.0000 0.0000 0.0000 0.0000 0.0000 0.0000 0.0000 0.0000 0.0000 0.0000 0.0000 0.0091 0.0100 0.0000 0.0000 0.0000 0.0000 0.0000 0.0000
# samples: 57 47 69 45 50 50 61 60 42 50 96 67 38 55 50 25 54 47 50 53 56

Page45�
Appendix 3 (cont.). Population allele frequencies – all 21 collections.
Locu
s
Alle
le#
Size
War
m S
prin
gs st
rays
05
Rou
nd B
utte
Hat
cher
ySh
itike
juve
nile
sB
uck
Hol
low
juve
nile
s 05
Mai
nste
m D
esch
utes
low
er 0
5B
akeo
ven
juve
nile
s 05
War
m S
prin
gs N
OR
adu
lts 0
6W
arm
Spr
ings
stra
ys 0
6B
uck
Hol
low
juve
nile
s 06
Bak
eove
n ju
veni
les 0
6M
ains
tem
Des
chut
es lo
wer
06
War
m S
prin
gs N
OR
juve
nile
sM
ains
tem
Des
chut
es u
pper
06
Trou
t Cre
ek ju
veni
les
06Tr
out C
reek
juve
nile
s 07
War
m S
prin
gs N
OR
adu
lts 0
7M
ains
tem
Des
chut
es u
pper
07
Why
chus
Cre
ek ju
veni
les
Cra
ne P
rairi
e R
eser
voir
Tum
alo
Cree
k ju
veni
les
Oak
Spr
ings
Hat
cher
y ad
ults
Oke4 1 234 0.0088 0.0000 0.0362 0.0222 0.0100 0.0000 0.0167 0.0086 0.0000 0.0000 0.0052 0.0075 0.0000 0.0185 0.0200 0.0400 0.0000 0.0111 0.0521 0.0943 0.00002 236 0.0526 0.1735 0.0362 0.0444 0.0000 0.0900 0.0333 0.0172 0.0357 0.0900 0.0000 0.0299 0.0270 0.0370 0.0500 0.0000 0.0556 0.0111 0.0000 0.0000 0.00003 240 0.0000 0.0000 0.0072 0.0000 0.0000 0.0000 0.0000 0.0000 0.0000 0.0000 0.0573 0.0000 0.0000 0.0000 0.0000 0.0000 0.0000 0.0111 0.0104 0.0000 0.00894 242 0.1053 0.2551 0.2029 0.2444 0.3100 0.2100 0.3167 0.1552 0.2143 0.1600 0.3542 0.3284 0.2703 0.1667 0.1600 0.1200 0.2963 0.3667 0.1250 0.2642 0.00005 244 0.1842 0.1429 0.1739 0.1111 0.1600 0.3400 0.1750 0.2931 0.1190 0.2300 0.0833 0.1119 0.1081 0.2593 0.2400 0.2200 0.1296 0.0556 0.0521 0.1509 0.00006 245 0.0000 0.0000 0.0000 0.0000 0.0000 0.0000 0.0000 0.0000 0.0119 0.0000 0.0000 0.0000 0.0000 0.0000 0.0000 0.0000 0.0000 0.0000 0.0104 0.0189 0.00007 246 0.0702 0.1531 0.0942 0.0889 0.0900 0.0900 0.1083 0.0603 0.1071 0.1000 0.0625 0.1119 0.0270 0.1852 0.0800 0.1400 0.0648 0.0111 0.0000 0.0000 0.00008 248 0.1404 0.0918 0.1812 0.1444 0.3600 0.0300 0.1083 0.0603 0.1905 0.1900 0.3333 0.1642 0.2973 0.1019 0.0900 0.1400 0.1204 0.4667 0.0625 0.2453 0.00009 250 0.1316 0.0510 0.0580 0.0556 0.0100 0.0500 0.0250 0.1379 0.0833 0.0300 0.0052 0.0224 0.0135 0.0370 0.0900 0.0600 0.0463 0.0000 0.1354 0.0094 0.6607
10 252 0.0000 0.0000 0.0145 0.0000 0.0000 0.0000 0.0000 0.0000 0.0000 0.0000 0.0000 0.0000 0.0000 0.0000 0.0000 0.0000 0.0000 0.0000 0.0104 0.0000 0.000011 254 0.2456 0.1224 0.1739 0.2222 0.0000 0.1500 0.1917 0.1983 0.2262 0.1400 0.0677 0.1194 0.0270 0.1481 0.1800 0.1800 0.1111 0.0444 0.0208 0.1038 0.000012 255 0.0000 0.0000 0.0000 0.0000 0.0000 0.0000 0.0000 0.0000 0.0000 0.0000 0.0000 0.0000 0.0000 0.0000 0.0000 0.0000 0.0000 0.0000 0.0208 0.0000 0.000013 256 0.0000 0.0000 0.0072 0.0111 0.0000 0.0100 0.0167 0.0000 0.0000 0.0300 0.0000 0.0597 0.0000 0.0093 0.0300 0.0200 0.0278 0.0000 0.0312 0.0377 0.044614 257 0.0000 0.0000 0.0000 0.0000 0.0000 0.0000 0.0000 0.0000 0.0000 0.0000 0.0104 0.0373 0.0000 0.0000 0.0000 0.0200 0.0000 0.0111 0.0000 0.0189 0.000015 258 0.0439 0.0000 0.0145 0.0000 0.0000 0.0300 0.0083 0.0517 0.0000 0.0100 0.0000 0.0000 0.0000 0.0185 0.0500 0.0400 0.0093 0.0000 0.0312 0.0000 0.044616 262 0.0000 0.0000 0.0000 0.0111 0.0000 0.0000 0.0000 0.0000 0.0119 0.0000 0.0000 0.0000 0.0000 0.0000 0.0000 0.0000 0.0000 0.0000 0.1875 0.0000 0.008917 264 0.0175 0.0102 0.0000 0.0333 0.0000 0.0000 0.0000 0.0172 0.0000 0.0100 0.0052 0.0075 0.0541 0.0093 0.0000 0.0000 0.0278 0.0000 0.0625 0.0094 0.089318 266 0.0000 0.0000 0.0000 0.0000 0.0000 0.0000 0.0000 0.0000 0.0000 0.0000 0.0000 0.0000 0.0000 0.0000 0.0100 0.0000 0.0000 0.0000 0.0521 0.0000 0.035719 267 0.0000 0.0000 0.0000 0.0000 0.0000 0.0000 0.0000 0.0000 0.0000 0.0000 0.0000 0.0000 0.0000 0.0000 0.0000 0.0000 0.0000 0.0000 0.0833 0.0094 0.000020 268 0.0000 0.0000 0.0000 0.0000 0.0000 0.0000 0.0000 0.0000 0.0000 0.0000 0.0000 0.0000 0.0000 0.0000 0.0000 0.0000 0.0000 0.0000 0.0208 0.0000 0.000021 270 0.0000 0.0000 0.0000 0.0000 0.0000 0.0000 0.0000 0.0000 0.0000 0.0000 0.0000 0.0000 0.0000 0.0093 0.0000 0.0000 0.0000 0.0000 0.0000 0.0377 0.017922 272 0.0000 0.0000 0.0000 0.0111 0.0400 0.0000 0.0000 0.0000 0.0000 0.0100 0.0052 0.0000 0.0676 0.0000 0.0000 0.0000 0.0556 0.0000 0.0312 0.0000 0.089323 274 0.0000 0.0000 0.0000 0.0000 0.0200 0.0000 0.0000 0.0000 0.0000 0.0000 0.0104 0.0000 0.1081 0.0000 0.0000 0.0000 0.0556 0.0000 0.0000 0.0000 0.000024 276 0.0000 0.0000 0.0000 0.0000 0.0000 0.0000 0.0000 0.0000 0.0000 0.0000 0.0000 0.0000 0.0000 0.0000 0.0000 0.0200 0.0000 0.0111 0.0000 0.0000 0.0000
# samples: 57 49 69 45 50 50 60 58 42 50 96 67 37 54 50 25 54 45 48 53 56

Page46�
Appendix 3 (cont.). Population allele frequencies – all 21 collections.
Locu
s
Alle
le#
Size
War
m S
prin
gs st
rays
05
Rou
nd B
utte
Hat
cher
ySh
itike
juve
nile
s
Buc
k Ho
llow
juve
nile
s 05
Mai
nste
m D
esch
utes
low
er 0
5B
akeo
ven
juve
nile
s 05
War
m S
prin
gs N
OR
adu
lts 0
6W
arm
Spr
ings
stra
ys 0
6B
uck
Hollo
w ju
veni
les
06B
akeo
ven
juve
nile
s 06
Mai
nste
m D
esch
utes
low
er 0
6W
arm
Spr
ings
NO
R ju
veni
les
Mai
nste
m D
esch
utes
upp
er 0
6Tr
out C
reek
juve
nile
s 06
Trou
t Cre
ek ju
veni
les
07W
arm
Spr
ings
NO
R a
dults
07
Mai
nste
m D
esch
utes
upp
er 0
7W
hych
us C
reek
juve
nile
sC
rane
Pra
irie
Res
ervo
ir Tu
mal
o Cr
eek
juve
nile
sO
ak S
prin
gs H
atch
ery
adul
ts
Omy10 1 166 0.0000 0.0000 0.0000 0.0000 0.0000 0.0000 0.0000 0.0000 0.0000 0.0000 0.0000 0.0000 0.0000 0.0000 0.0000 0.0000 0.0000 0.0000 0.0000 0.0377 0.00002 168 0.0263 0.0204 0.0074 0.0222 0.0000 0.0000 0.0169 0.0431 0.0000 0.0000 0.0052 0.0075 0.0000 0.0089 0.0000 0.0000 0.0093 0.0000 0.0000 0.0000 0.00003 172 0.0000 0.0000 0.0000 0.0000 0.0000 0.0300 0.0000 0.0000 0.0000 0.0100 0.0000 0.0000 0.0000 0.0000 0.0000 0.0000 0.0000 0.0000 0.0000 0.0000 0.00004 174 0.0000 0.0000 0.0000 0.0000 0.0000 0.0100 0.0000 0.0000 0.0000 0.0000 0.0000 0.0000 0.0000 0.0000 0.0000 0.0000 0.0000 0.0000 0.0000 0.0000 0.03645 176 0.0439 0.0510 0.0147 0.0444 0.0000 0.1100 0.0000 0.0862 0.0119 0.0400 0.0052 0.0522 0.0658 0.0000 0.0400 0.0000 0.0463 0.0444 0.0111 0.0283 0.00006 178 0.0000 0.0000 0.0000 0.0000 0.0000 0.0000 0.0000 0.0000 0.0000 0.0000 0.0000 0.0000 0.0000 0.0000 0.0000 0.0000 0.0000 0.0000 0.0111 0.0000 0.00007 180 0.0351 0.0102 0.0074 0.0333 0.0400 0.0800 0.0000 0.0517 0.0357 0.0400 0.0052 0.0149 0.1447 0.0179 0.0100 0.0600 0.0370 0.0000 0.0444 0.0660 0.06368 182 0.0351 0.0612 0.0882 0.1000 0.1200 0.1600 0.0593 0.0517 0.0357 0.0800 0.2135 0.0448 0.0658 0.0893 0.0600 0.1200 0.0926 0.2222 0.0000 0.0094 0.00009 184 0.1140 0.0306 0.0809 0.0778 0.0400 0.0300 0.0508 0.0776 0.0476 0.0900 0.0312 0.1269 0.0658 0.0982 0.1100 0.0800 0.0926 0.0333 0.2222 0.1887 0.3182
10 186 0.0088 0.0612 0.0221 0.0333 0.0600 0.0000 0.0508 0.0086 0.0238 0.0300 0.0208 0.0299 0.0395 0.0089 0.0100 0.0400 0.0000 0.0333 0.0000 0.0472 0.000011 188 0.1404 0.0918 0.1103 0.1111 0.1300 0.0700 0.1441 0.1207 0.1905 0.1100 0.1302 0.1269 0.0921 0.2054 0.1300 0.1600 0.1574 0.1000 0.1000 0.0755 0.018212 190 0.1140 0.0612 0.1176 0.1444 0.0000 0.1800 0.1271 0.0948 0.1310 0.1300 0.0469 0.0746 0.1447 0.1161 0.1600 0.0800 0.1389 0.0111 0.0000 0.0000 0.000013 192 0.0965 0.0306 0.1103 0.0333 0.0500 0.0200 0.0339 0.0690 0.0357 0.0600 0.0312 0.0448 0.0263 0.1250 0.1400 0.0600 0.0926 0.0333 0.0000 0.0094 0.000014 194 0.0088 0.0204 0.0221 0.0111 0.0600 0.0200 0.0169 0.0259 0.0238 0.0500 0.0208 0.0075 0.0000 0.0268 0.0200 0.0000 0.0000 0.0222 0.1333 0.1604 0.000015 196 0.1316 0.1122 0.0882 0.0556 0.0500 0.0300 0.1695 0.0862 0.1071 0.1200 0.0104 0.0597 0.0526 0.0893 0.0800 0.1400 0.0370 0.0111 0.0778 0.0377 0.081816 198 0.0263 0.0408 0.0074 0.0778 0.0300 0.0100 0.0085 0.0345 0.0714 0.0100 0.0000 0.0299 0.0000 0.0357 0.0300 0.0400 0.0185 0.0000 0.0778 0.0094 0.127317 200 0.0351 0.1939 0.0147 0.0222 0.0100 0.0100 0.0339 0.0517 0.0357 0.0100 0.0312 0.0597 0.0526 0.0179 0.0200 0.1200 0.0278 0.0111 0.1333 0.0943 0.272718 202 0.0263 0.0000 0.1544 0.0444 0.2300 0.0300 0.1356 0.0345 0.0238 0.0700 0.3125 0.0597 0.1053 0.0179 0.0400 0.0000 0.1019 0.3667 0.0000 0.0000 0.000019 204 0.0877 0.1122 0.0441 0.0444 0.0400 0.0900 0.0508 0.0862 0.0833 0.0600 0.0312 0.1269 0.0789 0.0625 0.0600 0.0600 0.0093 0.0778 0.0778 0.1415 0.000020 206 0.0000 0.0000 0.0147 0.0000 0.0800 0.0100 0.0000 0.0000 0.0119 0.0000 0.0312 0.0224 0.0395 0.0089 0.0000 0.0000 0.0741 0.0000 0.0000 0.0000 0.000021 208 0.0088 0.0714 0.0662 0.0556 0.0100 0.0300 0.0508 0.0345 0.0476 0.0900 0.0104 0.0373 0.0263 0.0179 0.0500 0.0200 0.0370 0.0000 0.0222 0.0566 0.000022 210 0.0000 0.0306 0.0074 0.0556 0.0400 0.0000 0.0254 0.0000 0.0238 0.0000 0.0521 0.0373 0.0000 0.0000 0.0200 0.0000 0.0185 0.0333 0.0000 0.0000 0.000023 212 0.0088 0.0000 0.0000 0.0222 0.0000 0.0400 0.0169 0.0000 0.0119 0.0000 0.0000 0.0224 0.0000 0.0089 0.0200 0.0000 0.0000 0.0000 0.0000 0.0000 0.000024 214 0.0000 0.0000 0.0000 0.0000 0.0000 0.0000 0.0000 0.0000 0.0000 0.0000 0.0104 0.0000 0.0000 0.0000 0.0000 0.0000 0.0093 0.0000 0.0111 0.0000 0.036425 216 0.0000 0.0000 0.0074 0.0000 0.0000 0.0000 0.0000 0.0000 0.0119 0.0000 0.0000 0.0000 0.0000 0.0000 0.0000 0.0000 0.0000 0.0000 0.0111 0.0189 0.000026 220 0.0088 0.0000 0.0074 0.0000 0.0000 0.0400 0.0000 0.0000 0.0000 0.0000 0.0000 0.0000 0.0000 0.0000 0.0000 0.0000 0.0000 0.0000 0.0667 0.0000 0.036427 222 0.0000 0.0000 0.0000 0.0000 0.0000 0.0000 0.0000 0.0000 0.0000 0.0000 0.0000 0.0000 0.0000 0.0000 0.0000 0.0000 0.0000 0.0000 0.0000 0.0094 0.009128 224 0.0439 0.0000 0.0074 0.0111 0.0100 0.0000 0.0085 0.0431 0.0357 0.0000 0.0000 0.0149 0.0000 0.0446 0.0000 0.0200 0.0000 0.0000 0.0000 0.0094 0.0000
# samples: 57 49 68 45 50 50 59 58 42 50 96 67 38 56 50 25 54 45 45 53 55

Page47�
Appendix 3 (cont.). Population allele frequencies – all 21 collections.
Locu
s
Alle
le#
S ize
War
m S
prin
gs st
rays
05
Roun
d Bu
t te H
atch
ery
Shiti
ke ju
veni
l es
B uck
Hol
low
juve
nile
s 05
Mai
nste
m D
esch
utes
low
er 0
5B a
keov
en ju
veni
les 0
5W
arm
Spr
ings
NO
R ad
ults
06
War
m S
prin
gs st
rays
06
Buck
Hol
low
juve
nile
s 06
B ake
oven
juve
nile
s 06
Mai
nste
m D
esch
utes
low
er 0
6W
arm
Spr
ings
NO
R ju
veni
les
Mai
nste
m D
esch
utes
upp
er 0
6Tr
out C
reek
juve
nile
s 06
Trou
t Cre
ek ju
veni
les 0
7W
arm
Spr
ings
NO
R ad
ult s
07
Mai
nste
m D
esch
utes
upp
er 0
7W
hych
us C
reek
juve
nile
sC r
ane
Pra i
rie R
eser
voir
T um
alo
Cree
k ju
veni
les
Oak
Spr
ings
Hat
cher
y ad
ults
One14 1 146 0.1842 0.0000 0.1014 0.0778 0.0200 0.1000 0.0750 0.1121 0.0952 0.0500 0.0365 0.1045 0.0000 0.0727 0.1200 0.0600 0.0481 0.0745 0.0000 0.0288 0.00002 150 0.1053 0.0300 0.0580 0.0333 0.0200 0.1600 0.1083 0.0776 0.0476 0.1300 0.0104 0.0896 0.0658 0.0636 0.0500 0.1800 0.0577 0.0106 0.0116 0.0481 0.00003 152 0.0000 0.0000 0.0000 0.0000 0.0000 0.0000 0.0083 0.0000 0.0000 0.0000 0.0000 0.0000 0.0000 0.0000 0.0100 0.0000 0.0000 0.0000 0.0000 0.0000 0.00004 154 0.2281 0.4300 0.2246 0.2111 0.0700 0.1900 0.2000 0.2845 0.2262 0.1800 0.1094 0.2313 0.0526 0.3000 0.2900 0.3000 0.2019 0.0426 0.2791 0.2019 0.38185 156 0.0000 0.0000 0.0000 0.0000 0.0000 0.0000 0.0083 0.0000 0.0119 0.0000 0.0000 0.0000 0.0000 0.0000 0.0000 0.0000 0.0000 0.0000 0.0000 0.0096 0.00006 158 0.4649 0.5400 0.5870 0.6222 0.8700 0.5200 0.5750 0.5086 0.5119 0.6100 0.8073 0.5299 0.7763 0.5364 0.4900 0.4200 0.6635 0.8511 0.4535 0.4712 0.00007 160 0.0088 0.0000 0.0072 0.0111 0.0100 0.0200 0.0083 0.0086 0.0119 0.0000 0.0208 0.0149 0.0921 0.0091 0.0300 0.0000 0.0288 0.0106 0.1512 0.1731 0.21828 162 0.0088 0.0000 0.0217 0.0222 0.0100 0.0100 0.0083 0.0086 0.0952 0.0100 0.0156 0.0224 0.0132 0.0091 0.0100 0.0000 0.0000 0.0106 0.0000 0.0481 0.00009 164 0.0000 0.0000 0.0000 0.0000 0.0000 0.0000 0.0000 0.0000 0.0000 0.0200 0.0000 0.0075 0.0000 0.0000 0.0000 0.0000 0.0000 0.0000 0.0465 0.0000 0.390910 166 0.0000 0.0000 0.0000 0.0000 0.0000 0.0000 0.0000 0.0000 0.0000 0.0000 0.0000 0.0000 0.0000 0.0091 0.0000 0.0000 0.0000 0.0000 0.0000 0.0192 0.009111 168 0.0000 0.0000 0.0000 0.0111 0.0000 0.0000 0.0000 0.0000 0.0000 0.0000 0.0000 0.0000 0.0000 0.0000 0.0000 0.0000 0.0000 0.0000 0.0000 0.0000 0.000012 172 0.0000 0.0000 0.0000 0.0000 0.0000 0.0000 0.0000 0.0000 0.0000 0.0000 0.0000 0.0000 0.0000 0.0000 0.0000 0.0000 0.0000 0.0000 0.0581 0.0000 0.000013 180 0.0000 0.0000 0.0000 0.0111 0.0000 0.0000 0.0083 0.0000 0.0000 0.0000 0.0000 0.0000 0.0000 0.0000 0.0000 0.0200 0.0000 0.0000 0.0000 0.0000 0.000014 246 0.0000 0.0000 0.0000 0.0000 0.0000 0.0000 0.0000 0.0000 0.0000 0.0000 0.0000 0.0000 0.0000 0.0000 0.0000 0.0200 0.0000 0.0000 0.0000 0.0000 0.0000
# samples: 57 50 69 45 50 50 60 58 42 50 96 67 38 55 50 25 52 47 43 52 55
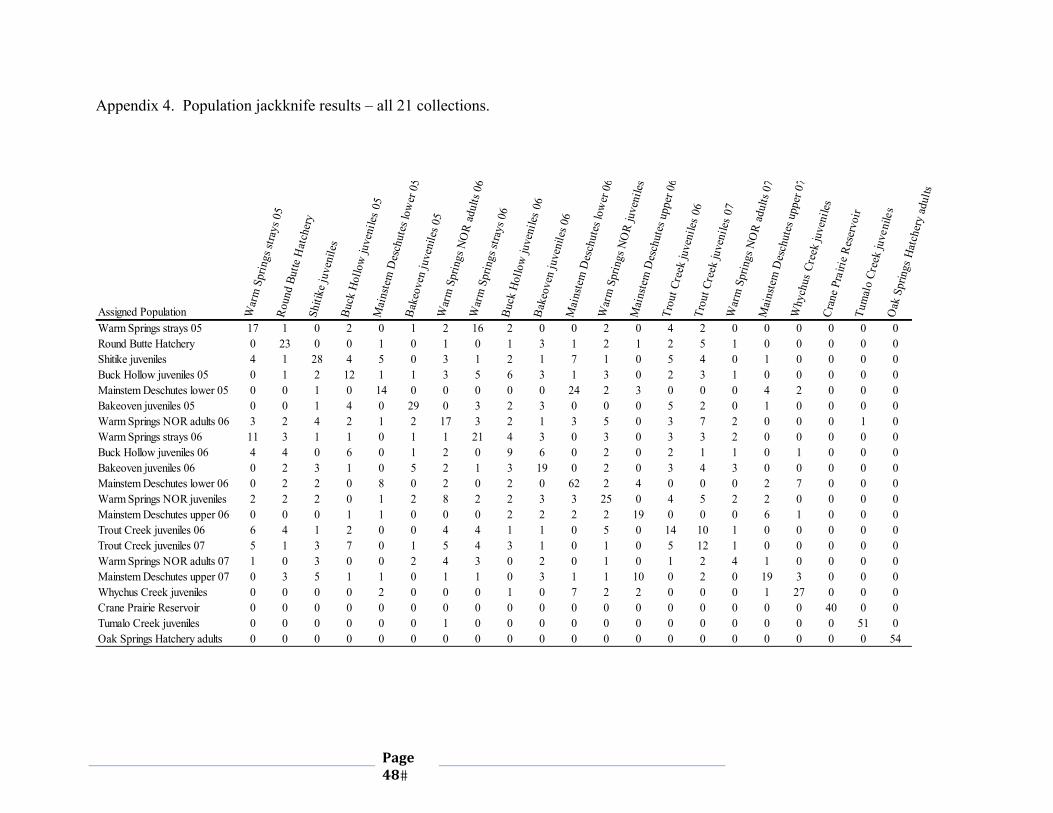
Page48�
Appendix 4. Population jackknife results – all 21 collections.
Assigned Population War
m S
prin
gs st
rays
05
Roun
d Bu
tte H
atch
ery
Shiti
ke ju
veni
les
Buck
Hol
low
juve
niles
05
Mai
nste
m D
esch
utes
low
er 0
5Ba
keov
en ju
veni
les 0
5W
arm
Spr
ings
NO
R ad
ults
06
War
m S
prin
gs st
rays
06
Buck
Hol
low
juve
niles
06
Bake
oven
juve
nile
s 06
Mai
nste
m D
esch
utes
low
er 0
6W
arm
Spr
ings
NO
R ju
veni
les
Mai
nste
m D
esch
utes
upp
er 0
6Tr
out C
reek
juve
niles
06
Trou
t Cre
ek ju
veni
les 0
7W
arm
Spr
ings
NO
R ad
ults
07
Mai
nste
m D
esch
utes
upp
er 0
7W
hych
us C
reek
juve
niles
Cran
e Pr
airie
Res
ervo
ir Tu
mal
o Cr
eek
juve
nile
sO
ak S
prin
gs H
atch
ery
adul
ts
Warm Springs strays 05 17 1 0 2 0 1 2 16 2 0 0 2 0 4 2 0 0 0 0 0 0Round Butte Hatchery 0 23 0 0 1 0 1 0 1 3 1 2 1 2 5 1 0 0 0 0 0Shitike juveniles 4 1 28 4 5 0 3 1 2 1 7 1 0 5 4 0 1 0 0 0 0Buck Hollow juveniles 05 0 1 2 12 1 1 3 5 6 3 1 3 0 2 3 1 0 0 0 0 0Mainstem Deschutes lower 05 0 0 1 0 14 0 0 0 0 0 24 2 3 0 0 0 4 2 0 0 0Bakeoven juveniles 05 0 0 1 4 0 29 0 3 2 3 0 0 0 5 2 0 1 0 0 0 0Warm Springs NOR adults 06 3 2 4 2 1 2 17 3 2 1 3 5 0 3 7 2 0 0 0 1 0Warm Springs strays 06 11 3 1 1 0 1 1 21 4 3 0 3 0 3 3 2 0 0 0 0 0Buck Hollow juveniles 06 4 4 0 6 0 1 2 0 9 6 0 2 0 2 1 1 0 1 0 0 0Bakeoven juveniles 06 0 2 3 1 0 5 2 1 3 19 0 2 0 3 4 3 0 0 0 0 0Mainstem Deschutes lower 06 0 2 2 0 8 0 2 0 2 0 62 2 4 0 0 0 2 7 0 0 0Warm Springs NOR juveniles 2 2 2 0 1 2 8 2 2 3 3 25 0 4 5 2 2 0 0 0 0Mainstem Deschutes upper 06 0 0 0 1 1 0 0 0 2 2 2 2 19 0 0 0 6 1 0 0 0Trout Creek juveniles 06 6 4 1 2 0 0 4 4 1 1 0 5 0 14 10 1 0 0 0 0 0Trout Creek juveniles 07 5 1 3 7 0 1 5 4 3 1 0 1 0 5 12 1 0 0 0 0 0Warm Springs NOR adults 07 1 0 3 0 0 2 4 3 0 2 0 1 0 1 2 4 1 0 0 0 0Mainstem Deschutes upper 07 0 3 5 1 1 0 1 1 0 3 1 1 10 0 2 0 19 3 0 0 0Whychus Creek juveniles 0 0 0 0 2 0 0 0 1 0 7 2 2 0 0 0 1 27 0 0 0Crane Prairie Reservoir 0 0 0 0 0 0 0 0 0 0 0 0 0 0 0 0 0 0 40 0 0Tumalo Creek juveniles 0 0 0 0 0 0 1 0 0 0 0 0 0 0 0 0 0 0 0 51 0Oak Springs Hatchery adults 0 0 0 0 0 0 0 0 0 0 0 0 0 0 0 0 0 0 0 0 54

Page49�
Appendix 5. Pairwise FST values – all 21 collections. Bold loci are not statistically significant.
War
m S
prin
gs st
rays
05
Rou
nd B
utte
Hat
cher
ySh
itike
juve
nile
s
Buc
k H
ollo
w ju
veni
les
05M
ains
tem
Des
chut
es lo
wer
05
Bak
eove
n ju
veni
les 0
5W
arm
Spr
ings
NO
R a
dults
06
War
m S
prin
gs st
rays
06
Buc
k H
ollo
w ju
veni
les
06B
akeo
ven
juve
nile
s 06
Mai
nste
m D
esch
utes
low
er 0
6W
arm
Spr
ings
NO
R ju
veni
les
Mai
nste
m D
esch
utes
upp
er 0
6Tr
out C
reek
juve
nile
s 06
Trou
t Cre
ek ju
veni
les
07W
arm
Spr
ings
NO
R a
dults
07
Mai
nste
m D
esch
utes
upp
er 0
7W
hych
us C
reek
juve
nile
sC
rane
Pra
irie
Res
ervo
ir Tu
mal
o Cr
eek
juve
nile
sO
ak S
prin
gs H
atch
ery
Warm Springs strays 05 0.0000Round Butte Hatchery 0.0182 0.0000Shitike juveniles 0.0164 0.0136 0.0000Buck Hollow juveniles 05 0.0160 0.0161 0.0072 0.0000Mainstem Deschutes lower 05 0.0705 0.0538 0.0277 0.0379 0.0000Bakeoven juveniles 05 0.0129 0.0162 0.0197 0.0176 0.0620 0.0000Warm Springs NOR adults 06 0.0133 0.0121 0.0067 0.0076 0.0373 0.0162 0.0000Warm Springs strays 06 0.0005 0.0165 0.0177 0.0172 0.0715 0.0111 0.0149 0.0000Buck Hollow juveniles 06 0.0081 0.0120 0.0154 0.0093 0.0495 0.0114 0.0097 0.0097 0.0000Bakeoven juveniles 06 0.0130 0.0083 0.0068 0.0085 0.0419 0.0047 0.0078 0.0121 0.0057 0.0000Mainstem Deschutes lower 06 0.0691 0.0484 0.0269 0.0410 0.0017 0.0604 0.0360 0.0689 0.0487 0.0427 0.0000Warm Springs NOR juveniles 0.0169 0.0122 0.0072 0.0103 0.0351 0.0167 0.0040 0.0183 0.0120 0.0077 0.0311 0.0000Mainstem Deschutes upper 06 0.0407 0.0313 0.0200 0.0288 0.0294 0.0391 0.0260 0.0419 0.0309 0.0250 0.0321 0.0254 0.0000Trout Creek juveniles 06 0.0066 0.0103 0.0100 0.0056 0.0512 0.0109 0.0084 0.0070 0.0080 0.0069 0.0517 0.0094 0.0344 0.0000Trout Creek juveniles 07 0.0068 0.0065 0.0091 0.0085 0.0530 0.0122 0.0083 0.0062 0.0078 0.0061 0.0487 0.0081 0.0338 0.0021 0.0000Warm Springs NOR adults 07 0.0030 0.0137 0.0129 0.0178 0.0667 0.0075 0.0096 0.0044 0.0093 0.0074 0.0656 0.0106 0.0348 0.0086 0.0096 0.0000Mainstem Deschutes upper 07 0.0311 0.0194 0.0082 0.0165 0.0233 0.0276 0.0136 0.0305 0.0214 0.0160 0.0260 0.0144 0.0080 0.0197 0.0187 0.0233 0.0000Whychus Creek juveniles 0.0784 0.0615 0.0428 0.0548 0.0188 0.0698 0.0509 0.0789 0.0571 0.0530 0.0126 0.0442 0.0435 0.0616 0.0645 0.0767 0.0399 0.0000Crane Prairie Reservoir 0.0654 0.0739 0.0764 0.0723 0.1129 0.0838 0.0703 0.0724 0.0765 0.0796 0.1223 0.0746 0.0754 0.0682 0.0740 0.0648 0.0720 0.1332 0.0000Tumalo Creek juveniles 0.0497 0.0460 0.0400 0.0379 0.0728 0.0557 0.0383 0.0554 0.0518 0.0436 0.0819 0.0374 0.0537 0.0405 0.0475 0.0422 0.0468 0.0890 0.0402 0.0000Oak Springs Hatchery 0.1586 0.1767 0.1851 0.1799 0.2314 0.1867 0.1781 0.1696 0.1769 0.1897 0.2365 0.1807 0.1724 0.1729 0.1704 0.1664 0.1655 0.2489 0.1201 0.1737 0.0000