in vitro gene regulatory networks predict in vivo function of liver
TRANSCRIPT

RESEARCH ARTICLE Open Access
In vitro gene regulatory networks predict in vivofunction of liverYouping Deng1*, David R Johnson2, Xin Guan3, Choo Y Ang3, Junmei Ai4, Edward J Perkins2
Abstract
Background: Evolution of toxicity testing is predicated upon using in vitro cell based systems to rapidly screenand predict how a chemical might cause toxicity to an organ in vivo. However, the degree to which we canextend in vitro results to in vivo activity and possible mechanisms of action remains to be fully addressed.
Results: Here we use the nitroaromatic 2,4,6-trinitrotoluene (TNT) as a model chemical to compare and determinehow we might extrapolate from in vitro data to in vivo effects. We found 341 transcripts differentially expressed incommon among in vitro and in vivo assays in response to TNT. The major functional term corresponding to thesetranscripts was cell cycle. Similarly modulated common pathways were identified between in vitro and in vivo.Furthermore, we uncovered the conserved common transcriptional gene regulatory networks between in vitro andin vivo cellular liver systems that responded to TNT exposure, which mainly contain 2 subnetwork modules: PTTG1and PIR centered networks. Interestingly, all 7 genes in the PTTG1 module were involved in cell cycle anddownregulated by TNT both in vitro and in vivo.
Conclusions: The results of our investigation of TNT effects on gene expression in liver suggest that generegulatory networks obtained from an in vitro system can predict in vivo function and mechanisms. InhibitingPTTG1 and its targeted cell cyle related genes could be key machanism for TNT induced liver toxicity.
BackgroundHigh-throughput toxicity testing is predicated uponusing in vitro cell based systems to rapidly screen andpredict how a chemical might cause toxicity to an organin vivo [1]. Recent microarray studies have shown thatthe in vitro gene expression profiles in liver slices trea-ted with various compounds could predict the toxicityand pathology observed in vivo [2]. However, the degreeto which in vitro results can be extended to in vivoactivity and possible mechanisms of action remains tobe fully addressed.Compared with animal models, primary cell cultures
have advantages for investigating mechanisms of chemi-cal toxicity. Primary cultured cells, such as hepatocytes,can offer a convenient system that is easily geneticallymanipulated and can be used to test various throughputscreens using different molecular and biochemical meth-ods. Use of primary cell cultures can also reduce cost
and mitigate animal welfare concerns inherent in in vivostudies [3]. In vitro systems have a long history of use inscreening new drugs for human diseases such as cancerand in studying cellular and molecular events of differ-ent molecules (e.g., pharmaceuticals and xenobiotics)[4,5].In this study, we used the nitroaromatic 2,4,6 -rinitro-
toluene (TNT) as a model chemical to compare anddetermine how we might extrapolate in vitro data to invivo systems. We compared the gene expression profilesof in vitro primary liver cells with the gene expressionprofiles of in vivo liver tissue of rats exposed to TNT.TNT is a munitions compound which is released to
the environment as a result of military training activitiesand manufacturing processes [6,7]. The major toxiceffects to rats in response to TNT exposure are methe-moglobinemia, anemia, hypercholesterolemia, and hepa-tomegaly, splenomegaly, and testicular atrophy withtheir accompanying histologic lesions [8]. Cytotoxic andgenotoxic effects are also caused by TNT [9-11]. Ourrecent toxicity studies in rats found that TNT decreased
* Correspondence: [email protected] University Cancer Center, Rush University Medical Center, Chicago, IL60612, USAFull list of author information is available at the end of the article
Deng et al. BMC Systems Biology 2010, 4:153http://www.biomedcentral.com/1752-0509/4/153
© 2010 Deng et al; licensee BioMed Central Ltd. This is an Open Access article distributed under the terms of the Creative CommonsAttribution License (http://creativecommons.org/licenses/by/2.0), which permits unrestricted use, distribution, and reproduction inany medium, provided the original work is properly cited.
body weight, increased liver weight, and inducederythrocytosis (Deng et al., unpublished data).Although a variety of studies have focused on toxicity
aspects of TNT, the underlying mechanisms of toxicityinduced by this compound are largely unknown. Severallaboratories have started to use microarray analysis tounderstand the molecular mechanisms of invertebrateecotoxicity. The exposure of the earthworm Eiseniafetida with TNT regulates the expression of genesinvolved in multiple biological processes including mus-cle contraction, neuronal signaling and growth, ubiquiti-nylation, fibrinolysis and coagulation, iron and calciumhomeostasis, oxygen transport, and immunity [12].Microarray analysis of TNT exposed Arabidopsis thali-ana (Arabidopsis) reveals the induced expression ofoxophytodienoate reductases (OPRs), the proteinresponsible for TNT detoxification in Arabidopsis. Thesame team also found that bifunctional O- and C-gluco-syltransferases is involved in combating TNT inducedtoxicity in Arabidopsis [2,13]. Eisentraeger et al. [14]investigated the mechanism of human liver cell lineHepG2 treated with TNT using the toxicology cDNAmicroarray. They found that the detoxification metabo-lism in the HepG2 cells by TNT induced genes encodedphase I and phase II enzymes.In the current study, we examined gene transcriptional
responses to short term (24 h and 48 h) TNT exposuresin rat in both in vitro hepatocytes and in vivo liver. Weobserved that a number of genes were commonly regu-lated by both in vitro and in vivo TNT treatments. More-over, we found commonly affected pathways in both invivo and in vitro systems exposed with TNT. Functionalanalysis indicates that both TNT treatments in vivo andin vitro impact genes involved in cell cycle, cell growthand cell death signaling, detoxification response, lipidmetabolism and immune response, which can reasonablyaccount for the physiological dysfunctions induced byTNT. In addition, we identified conserved gene networksinferred from in vivo and in vitro networks. Our resultssuggest that in vitro system can predict in vivo functionsand mechanisms based on gene expression profiles, andgene network is a valuable approach for predicting invivo function using in vitro data.
ResultsCommonly regulated genes by in vivo and in vitro TNTtreatmentsTo determine if in vitro TNT exposure could be used topredict in vivo TNT exposure, the first aim of thisexperiment was to determine if there were commongenes differentially regulated by both in vivo and invitro TNT treatments. For the in vivo experiment, ratswere gavaged with TNT at: 0 (control), 4.8, 48, 96 or192 mg/kg and sacrificed after 24 h or 48 h. RNA was
isolated for microarray hybridization. Agilent rat wholegenome array (Agilent Technologies Inc., Palo Alto, CA)was employed in the study. Four biological replicateswere used for each unique condition as described in theMaterial and Methods. For the in vitro experiments, pri-mary rat hepatocytes (Lonza, Walkersville, MD) werecultured and treated with TNT at 10 ppm or vehiclecontrol for 24 h, after which RNA was isolated formicroarray experiments. The in vivo and in vitro micor-array data have been deposited in the GEO databaseswith assigned numbers GSE19628 and GSE19662,respectively.To identify genes differentially expressed in vivo, a
one-way ANOVA was applied to identify differentiatedtranscripts across different doses of TNT treatments ateach of the 24 h or 48 h time points. A p value cut-offof 0.05 and a 1.5 fold gene transcript change by compar-ing at least one pair of conditions between differentdoses including control were used as filters to identifydifferentially expressed genes. A total of 4875 gene tran-scripts were significantly and differentially expressed(i.e., upregulated and downregulated) in in vivo TNTtreatment for all doses and time points.An un-paired t-test with a p value cut-off of 0.05 and
1.5 fold change filter was used to test for differentialexpression between controls and TNT treated hepato-cytes in the in vitro assay yielding 967 differentiallyexpressed transcripts. A Venn diagram shows that therewere 341 transcripts that were commonly regulated byboth in vivo and in vitro TNT treatments (Figure 1 &Additional file 1, Table S 1). The common differentiatedgenes between in vivo and in vitro exposures suggestthat a common mechanism exists between in vitro TNTand in vivo TNT treated liver systems.
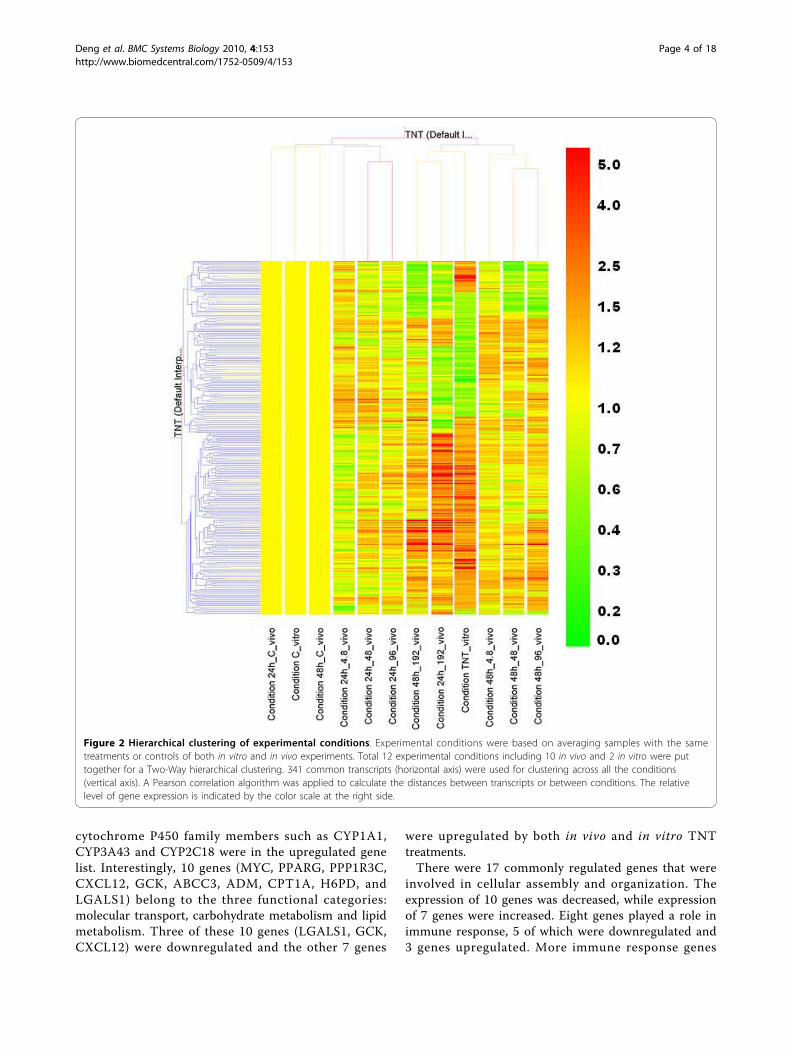
Similar gene expression pattern shared by commonlyregulated in vivo and in vitro genesWe examined the expression pattern of the 341 commontranscripts from in vivo and in vitro TNT exposures. Toreach the goal, each sample was normalized by the meanintensity of a gene of relative control samples, and thesamples under the same condition were averaged intoone condition. A two-way hierarchical clustering resultedin two cluster dendrograms of the 341 transcripts across10 in vivo conditions and 2 in vitro conditions (Figure 2).The controls and 3 lower in vivo dose conditions (4.8, 48,and 96 mg/kg) at 24 h were in a cluster, indicating thatthese doses at 24 h are closer to controls and have lessgenes affected than other conditions. The remaining invivo and in vitro TNT exposed hepatocytes and liversformed the second cluster.Overall, we found the conditons were more likely to
group together according to exposure duration thandose concentration, implying that the time effect is
Deng et al. BMC Systems Biology 2010, 4:153http://www.biomedcentral.com/1752-0509/4/153
Page 2 of 18

stronger than the dose effect. Interestingly, we foundthat 3 conditions (in vivo TNT treatment at 192 mg/kgfor 24 h, in vivo TNT treatment at 192 mg/kg for 48 h,and in vitro TNT treatment for 24 h) fell into one sub-group. Moreover, we noticed that the gene expressionpatterns for the 192 mg/kg, 24 h in vivo TNT treatmentand the 24 h in vitro TNT treatment were similar. Thegenes are upregulated (red pettern) by the in vitro treat-ment, and they were usually upregulated in vivo treat-ment. Most downregulated genes in in vitro were alsorepressed in vivo. Since these two conditions behavedclosely, we directly compared commonly upregulatedand downregulated genes based on these two conditions.Out of these 341 transcripts, 201 transcripts were upre-gulated by the in vivo TNT treatment, and 214 tran-scripts were upregulated by the in vitro TNT treatment.One hundred sixty-four transcripts (77% of the in vitrotranscripts) were commonly upregulated under bothconditions (Figure 3A). One hundred forty in vivo TNTtranscripts and 127 in vitro TNT transcripts were down-regulated. Furthermore, 90 transcripts (71% of the 127in vitro transcripts) were reduced by both conditions(Figure 3B). Another common phenomenon was thatboth TNT exposed liver systems had more upregulatedthan downregulated genes. Our results demonstrate thatTNT treatment in in vivo and in vitro liver systems
results in genes regulated in the same direction, provid-ing more evidence that in vitro hepatocytes act as a sui-table surrogate for in vivo liver exposures.
Functional analysis of commonly regulated genesTo understand the functions of the commonly regulatedgenes, we identified most significantly functional cate-gories using the Ingenuity function analysis tool (Inge-nuity Systems, Inc., Redwood City, CA). Thesefunctional groups mainly included cell cycle, carbohy-drate metabolism, molecular transport, cell growth andproliferation, cell death, DNA replication, recombinationand repair, lipid metabolism, cellular assembly and orga-nization, and immune response (Table 1). The most sig-nificant functional category regulated by TNT was cellcycle, which possessed 31 genes, of which, 18 geneswere commonly downregulated by in vivo and in vitroTNT exposures. The most heavily downregulated genesinvolved in cell cycle by both in vivo and in vitro TNTtreatments included LGALS1, CYP26B1, and PTTG1.Highly induced genes in this cell cycle category includedADM, DUSP13, and PPARG. More genes participatingin cell cycle were downregulated, indicating that TNTappears to interfere with cell cycle progress.Other commonly significantly affected functional
terms were cell growth and proliferation (40 genes), celldeath (19 genes), DNA replication (19 genes), andrecombination and repair (19 genes). Interestingly, therewere 10 genes that were repeatedly present in all fourfunctional terms: ADM, CCNB1, CCND2, CXCL12,LGALS, MYC, NRG1, NRG2, PPARG, and PTTG1. Inaddition, these genes were consistently regulated byboth in vivo TNT and in vitro TNT in the same direc-tions. The expression of CCNB1, CCND2, PTTG1,CXC12, and LGALS1 was decreased by TNT, and theexpression of ADM, MYC, NGR1, NGR2, and PPARGwas elevated by TNT.There were 23 commonly regulated genes that were
involved in molecular transport (Table 1). Nineteen ofthe 23 genes (83%) were upregulated, and only 4 ofthem were downregulated by both in vitro and in vivoTNT treatments. Some significant upregulated genesincluded NQO1, ADM, ABCC3 and ABCC4. Our resultssuggest that TNT can enhance molecular transport bothin vivo and in vitro liver systems.Twenty-three genes contributing to carbohydrate
metabolism were commonly regulated by both in vivoand in vitro TNT treatments. Among them, only 6genes were repressed and 17 genes were induced. Theexpression of 27 genes participating in lipid metabolismwas significantly changed in response to both in vivoand in vitro TNT exposures. Similar to carbohydratemetabolism, we saw more upregulated genes (21) thandownregulated genes (6) in this category. Several
Figure 1 Commonly significantly regulated transcripts by TNTin vitro and in vivo. For the in vivo experiment, rats were exposedto TNT at various doses: 0 (control), 4.8, 48, 96 or 192 mg/kg for 24h or 48 h. Subsequently rats were sacrificed and RNAs were isolatedfor microarray hybridization using a Rat Agilent whole genomearray. For in vitro experiments, primary cultured rat liver cells weretreated with TNT at 10 mg/l or vehicle control, and RNAs wereisolated for microarray experiments using the same type of Agilentarray as the in vivo experiment. Differentiated transcripts wereanalyzed as described in the Materials and Methods. The commonlyregulated transcripts are shown in the intersection part of the Venndiagram.
Deng et al. BMC Systems Biology 2010, 4:153http://www.biomedcentral.com/1752-0509/4/153
Page 3 of 18
cytochrome P450 family members such as CYP1A1,CYP3A43 and CYP2C18 were in the upregulated genelist. Interestingly, 10 genes (MYC, PPARG, PPP1R3C,CXCL12, GCK, ABCC3, ADM, CPT1A, H6PD, andLGALS1) belong to the three functional categories:molecular transport, carbohydrate metabolism and lipidmetabolism. Three of these 10 genes (LGALS1, GCK,CXCL12) were downregulated and the other 7 genes
were upregulated by both in vivo and in vitro TNTtreatments.There were 17 commonly regulated genes that were
involved in cellular assembly and organization. Theexpression of 10 genes was decreased, while expressionof 7 genes were increased. Eight genes played a role inimmune response, 5 of which were downregulated and3 genes upregulated. More immune response genes
Figure 2 Hierarchical clustering of experimental conditions. Experimental conditions were based on averaging samples with the sametreatments or controls of both in vitro and in vivo experiments. Total 12 experimental conditions including 10 in vivo and 2 in vitro were puttogether for a Two-Way hierarchical clustering. 341 common transcripts (horizontal axis) were used for clustering across all the conditions(vertical axis). A Pearson correlation algorithm was applied to calculate the distances between transcripts or between conditions. The relativelevel of gene expression is indicated by the color scale at the right side.
Deng et al. BMC Systems Biology 2010, 4:153http://www.biomedcentral.com/1752-0509/4/153
Page 4 of 18

Figure 3 Comparison of upregulated and downregulated transcripts between in vivo and in vitro TNT treatments. Among 341commonly regulated transcripts regulated by TNT in vitro and in vivo, commonly upregulated transcripts (A) and downregulated transcripts(B) ofthese 341 transcripts between in vivo TNT treatment at 199 mg/ml for 24 h and in vitro TNT treatment are shown by the Venn diagram.
Table 1 Significant functional categories based on genes commonly regulated by TNT in vivo and in vitro
Category P-value
Downregulated genes* Upregulated genes*
Cell Cycle 5.1E-07-1E-02
ANGPTL2, LGALS1, CYP26B1, COL1A1, CCND2, CKAP2,CDKN3, KIF20A, CXCL12, ECT2, CCNB1, RARB, PTTG1, LZTS1,TFDP2, BCL2A1, CDC2, INPP5D
MYC, CCNC, DNM1L, NRG2(includesEG:9542), MAPK1, NRG1,TFRC, PPARG, CREG1, RIOK3, NTRK1, DUSP13, ADM
CarbohydrateMetabolism
1.36E-06-1E-02
GCK, MMP2, INPP5 D, PTTG1, CXCL12, LGALS1 NQO1, ADM, PLA2G7, UGDH, GCLC, PPP1R3C, NTRK1,PPARG, JMJD7, PLA2G4B, ABCC3, UGT1A6, CPT1A, PARD3,NRG1, H6PD, SLC5A3, MYC
MolecularTransport
1.36E-06-1E-02
GCK, PTTG1, CXCL12, LGALS1 MYC, SLC5A3, ABCG5, EIF2S1, GMFB, H6PD, MAPK1, NRG1,PARD3, CPT1A, TFRC, ABCC3, PPARG, AQP8, ABCC4,PPP1R3C, GCLC, ADM, NQO1
Cellular Growthand Proliferation
1.25E-05-1E-02
LGALS1, COL1A1, CCND2, KIF20A, CXCL12, CCNB1, RARB,PTTG1, LZTS1, HSD11B2, DLC1, COL1A2, BCL2A1, CDC2,INPP5 D, MMP2
MYC, DNAJB6, NRG2 (includes EG:9542), CES2 (includesEG:8824), MAFF, CDH4 (includesEG:1002), UGT2B17, MAPK1,NRG1, TRIM35, TFRC, PPARG, CXCL2, ALDH1L1, CREG1,GSTP1, HMGCR, NTRK1, CDA, PHLDA1, PFN2, GRIN2C, ADM,CYP1A1
Cell Death 3.45E-05-1E-02
LGALS1, CYP26B1, CCND2, CKAP2, CXCL12, CCNB1, RARB,PTTG1, HSD11B2, DLC1, BCL2A1, CDC2, INPP5 D, MMP2
MYC, DNAJB6, EIF2S1, DNM1L, NRG2(includes EG:9542),GMFB, HTATIP2, MAPK1, NRG1, TRIM35, TFRC, EPHX1, PPARG,CXCL2, SQSTM1, CYP2F1, GSTP1, GSR, NTRK1, ABCC4,PHLDA1, GCLC, PLA2G7, TXNRD1, NR1I3, GRIN2C, ADM,NQO1, NCF2
DNA Replication,Recombination,and Repair
1.52E-04-1E-02
LGALS1, CCND2, CXCL12, ECT2, CCNB1, PTTG1, MMP2 MYC, NRG2 (includes EG:9542), PDE5A, NRG1, PPARG, RIOK3,GSTP1, GCLC, NR1I3, ADM, AMPD3, NQO1
Lipid Metabolism 2.6E-04-1E-02
GCK, INPP5 D, HSD11B2, CXCL12, PNPLA3, LGALS1 CYP1A1, ADM, PLA2G7, PPP1R3C, UGT2B7, NTRK1, ACOT4,GSTP1, AQP8, PPARG, JMJD7-PLA2G4B, ABCC3, RDH16,CPT1A, MAPK1, H6PD, UGT2B17, CYP3A43, CYP2C18, ABCG5,MYC
Cellular Assemblyand Organization
5.88E-04-1E-02
LGALS1, COL1A1, ECT2, CCNB1, PTTG1, COL1A2, CDC2,KRT20, INPP5D
MYC, DNAJB6, DNM1L, EPB41, NRG1, RIOK3, PFN2, ADM
Immune CellTrafficking
3.58E-03-1E-02
COL1A1, CYTIP, CXCL12 CXCL2
Humoral ImmuneResponse
5.57E-03-1E-02
CXCL12, BCL2A1, NPP5D MYC, NTRK1
* Full names of the genes are listed in Additional file 1, Table S 1.
Deng et al. BMC Systems Biology 2010, 4:153http://www.biomedcentral.com/1752-0509/4/153
Page 5 of 18

were downregulated, indicating that TNT may interferewith normal immune function to induce its toxicity.Overall, some commonly regulated genes were highly
represented. For instance, the gene MYC falls into all thefunctional categories listed in Table 2. CXCL12 belongsto all the functional groups except cellular assembly andorganization. ADM and LGALS1 genes PPARG wereabsent in only two functional categories, cellular assem-bly and organization, and immune response.
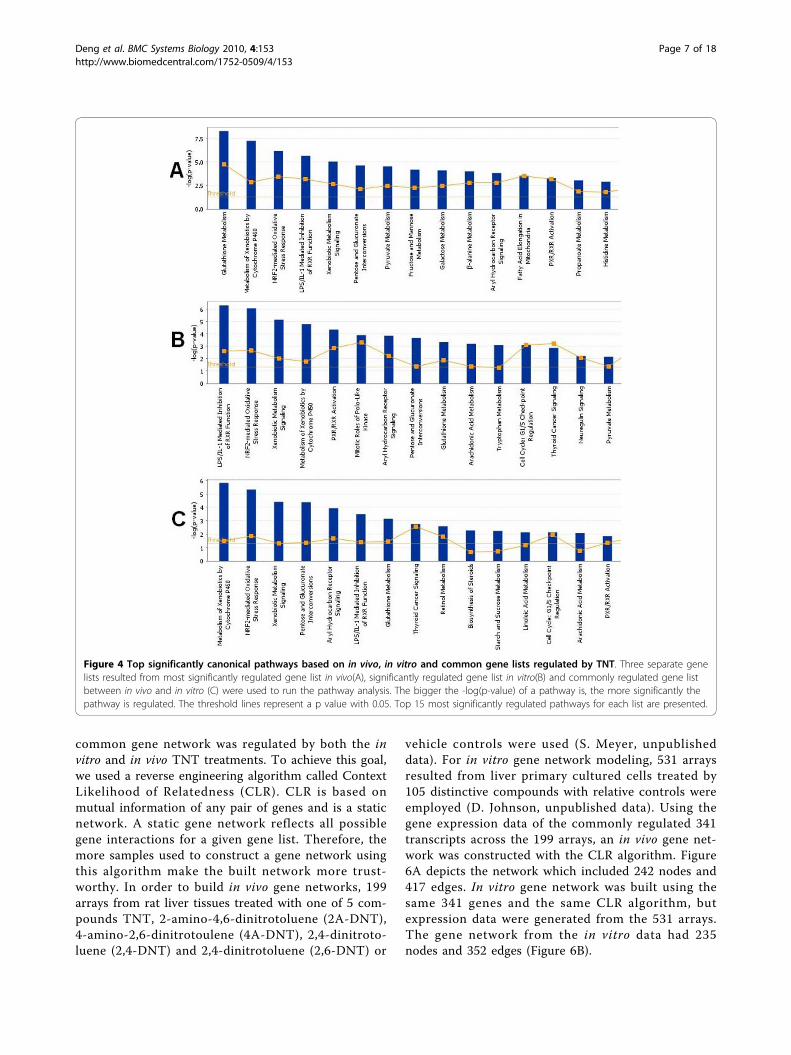
Pathway analysisTo further understand the gene function influenced byTNT exposure to in vivo and in vitro liver cells, we con-ducted a canonical pathway analysis using the Ingenuitypathway analysis tool. Three separate gene lists wereused to run the pathway analysis: the list of genes mostsignificantly regulated by in vivo TNT treatment, the listof genes most significantly regulated by in vitro TNTexposure, and the list of the 341 commonly regulatedgenes. In order to identify the most significantly influ-enced pathways in vivo, a more stringent p value (p <0.002) was applied, which resulted in 1106 significantlyregulated transcripts for the in vivo TNT experiment.The top significantly impacted pathways from each genelist are depicted in Figure 4. Using a threshold p valueof 0.05, a total of 47 pathways were regulated by in vivoTNT treatment, 40 pathways were evidently affected byin vitro TNT exposure, and 38 significantly pathwayswere obtained by analyzing the common 341 genesalone (Figure 5).Twenty commonly regulated pathways were shared by
the in vivo and in vitro pathway lists, which is 50% ofthe pathways impacted by in vitro TNT treatment(Figure 5). The percentage of overlapping pathways was
much higher than that of overlapping genes illustratedin Figure 1, indicating that the in vitro system perturbedby TNT could reflect more biological truth for anin vivo system from a mechanism related pathway view.Sixteen consensus pathways were shared by the threesignificant pathway lists (Figure 5 and Table 2). The topregulated pathways with relative genes are listed inTable 3. Several gene families that were highly repre-sented in these pathways are related to xenobiotic meta-bolism and transport. These families were cytochromeP450 (CYP), glutathione S-transferase (GST), UDP glu-curonosyltransferase (UGT), aldehyde dehydrogenase 1(ALDH1) and ATP-binding cassette (ABC) families. Theregulated genes in the CYP family included CYPA1,CYP2C18, CYP2F1, and CYP3A43. The genes listed inTable 3 belonging to GST family included GST1 andGSTA5. The UGT family included UGT1A6, UGT2B7,and UGT2B17. The regulated gene aldehyde dehydro-genase 1 family, member L1 (ALDH1L1) in the familyALDH1 was involved in many pathways listed inTable 3. The regulated genes in the ABC familyincluded ABCC3, ABCC4, and ABCG5.Interestingly, all the genes in Table 3, except for
CCND2 and retinoid acid receptor beta (RARB), werecommonly upregulated by both in vivo and in vitro TNTtreatments. MAPK1, a critical intracellular signaling pro-tein involved in multiple cellular functions (Table 1) wasalso presented in multiple pathways such as NRF-2mediated oxidative stress response, xenobiotic metabo-lism signaling, and aryl hydrocarbon signaling pathways.
Inferring in vitro and in vivo gene networksMotivated by commonly regulated genes, functionalterms and pathways, we then investigated whether a
Table 2 Commonly regulated canonical pathways based on in vivo, in vitro and common gene lists regulated by TNT
Pathway -Log(P-value) in vivo -Log(P-value) in vitro -Log(P-value) in vivo and in vitro
Metabolism of Xenobiotics by Cytochrome P450 7.26 4.77 5.82
NRF2-mediated Oxidative Stress Response 6.17 6.05 5.31
LPS/IL-1 Mediated Inhibition of RXR Function 5.66 6.29 3.48
Glutathione Metabolism 8.31 3.33 3.14
Xenobiotic Metabolism Signaling 5.05 5.14 4.4
Pentose and Glucuronate Interconversions 4.63 3.67 4.37
Aryl Hydrocarbon Receptor Signaling 3.82 3.84 3.93
PXR/RXR Activation 3.28 4.34 1.84
Pyruvate Metabolism 4.54 2.15 1.25
Galactose Metabolism 4.11 1.44 1.73
Fructose and Mannose Metabolism 4.19 1.33 1.65
Retinol Metabolism 1.98 1.97 2.59
Biosynthesis of Steroids 1.83 1.56 2.28
Fatty Acid Metabolism 2.3 1.87 1.48
Starch and Sucrose Metabolism 1.11 1.48 2.24
Androgen and Estrogen Metabolism 1.31 1.34 1.74
Deng et al. BMC Systems Biology 2010, 4:153http://www.biomedcentral.com/1752-0509/4/153
Page 6 of 18
common gene network was regulated by both the invitro and in vivo TNT treatments. To achieve this goal,we used a reverse engineering algorithm called ContextLikelihood of Relatedness (CLR). CLR is based onmutual information of any pair of genes and is a staticnetwork. A static gene network reflects all possiblegene interactions for a given gene list. Therefore, themore samples used to construct a gene network usingthis algorithm make the built network more trust-worthy. In order to build in vivo gene networks, 199arrays from rat liver tissues treated with one of 5 com-pounds TNT, 2-amino-4,6-dinitrotoluene (2A-DNT),4-amino-2,6-dinitrotoulene (4A-DNT), 2,4-dinitroto-luene (2,4-DNT) and 2,4-dinitrotoluene (2,6-DNT) or
vehicle controls were used (S. Meyer, unpublisheddata). For in vitro gene network modeling, 531 arraysresulted from liver primary cultured cells treated by105 distinctive compounds with relative controls wereemployed (D. Johnson, unpublished data). Using thegene expression data of the commonly regulated 341transcripts across the 199 arrays, an in vivo gene net-work was constructed with the CLR algorithm. Figure6A depicts the network which included 242 nodes and417 edges. In vitro gene network was built using thesame 341 genes and the same CLR algorithm, butexpression data were generated from the 531 arrays.The gene network from the in vitro data had 235nodes and 352 edges (Figure 6B).
Figure 4 Top significantly canonical pathways based on in vivo, in vitro and common gene lists regulated by TNT. Three separate genelists resulted from most significantly regulated gene list in vivo(A), significantly regulated gene list in vitro(B) and commonly regulated gene listbetween in vivo and in vitro (C) were used to run the pathway analysis. The bigger the -log(p-value) of a pathway is, the more significantly thepathway is regulated. The threshold lines represent a p value with 0.05. Top 15 most significantly regulated pathways for each list are presented.
Deng et al. BMC Systems Biology 2010, 4:153http://www.biomedcentral.com/1752-0509/4/153
Page 7 of 18

Since transcriptional regulated gene networks aretrigged by transcription factors, we then counted theconnections of the transcription factors (TFs) in the 341transcripts for the both in vivo and in vitro gene net-works. Top TFs with most connections in the in vitrogene network were cellular repressor of E1A-stimulatedgenes 1 (CREG1), pirin (iron-binding nuclear protein)(PIR), BTB (POZ) domain containing 11(BTBD11),SAM pointed domain containing ets transcription factor(SPDEF) and basic helix-loop-helix family, member e41(BHLHE41). TFs with most connections in the in vivogene network included HIV-1 Tat interactive protein 2,30kDa (HTATIP2), transcription factor Dp-2 (E2Fdimerization partner 2) (TFDP2), leucine zipper, puta-tive tumor suppressor 1 (LZTS1), zinc finger protein217 (ZNF217), PIR, and MYC. The transcription factorsthat had over 15 connections in the both gene networksincluded CREG1, PIR, BTBD11, LZTS1, ASB2, HES6,and SQSTM1(Figure 6C). Two TFs, SPDEF andBHLHE41, had at least twice more connections in the invitro gene network than that in the in vivo gene net-work. Seven TFs including HTATIP2, MYC, NEQ1,ZNF394, E2F3, DNAJB6 and TFDP2 possessed overtwice as many connections in the in vivo gene networkthan that in the in vitro gene network.
Conserved in vitro and in vivo gene networksBy comparing the in vivo and in vitro gene networks(Figure 6), we identified several conserved sub-networksthat were common in both gene networks (Figure 7).The TF PTTG1 centered sub-gene network consisted of7 genes (PTTG1, CCNB1, CDC2, CDKN3, CKAP2,ECT2, and KIF20A), all of which are involved in cellcycle processes. Moreover, all the genes in the cell cycle
Figure 5 Comparison of significantly canonical pathways basedon in vivo, in vitro and common gene lists regulated by TNT.Three separate gene lists resulted from most significantly regulatedgene list in vivo, significantly regulated gene list in vitro andcommonly regulated gene list between in vivo and in vitro wereused to run the Ingenuity pathway analysis tool. The overlappedsignificantly regulated pathways are presented in the Venn diagram.A pathway enrichment p value less than 0.05 was considered assignificant.
Table 3 Top common pathways regulated by TNT in vitro and in vivo
Canonical Pathways Common regulated genes*
Metabolism of Xenobiotics byCytochrome P450
CYP3A43, CYP2F1, GSTP1, CYP1A1, CYP2C18, UGT1A6, UGT2B7, GSTA5, ALDH1L1, UGT2B17, EPHX1
NRF2-mediated Oxidative StressResponse
GSR, AKR7A3, GSTP1, MAPK1, GSTA5, NQO1, GCLC, SQSTM1, DNAJB6, MAFF, TXNRD1, EPHX1
Xenobiotic Metabolism Signaling GSTP1, CYP1A1, UGT1A6, MAPK1, GSTA5, NQO1, ALDH1L1, GCLC, CES2 (includes EG:8824), UGT2B7, NR1I3,UGT2B17, ABCC3
Aryl Hydrocarbon Receptor Signaling MYC, GSTP1, CYP1A1, CCND2, MAPK1, GSTA5, NQO1, RARB, ALDH1L1
Pentose and GlucuronateInterconversions
TCAG7.1260, AKR7A3, UGDH, UGT1A6, UGT2B7, UGT2B17
LPS/IL-1 Mediated Inhibition of RXRFunction
GSTP1, ABCG5, CPT1A, GSTA5, NR1I3, ALDH1L1, CES2 (includes EG:8824), ABCC3, ABCC4
Glutathione Metabolism GSR, GSTP1, GSTA5, H6PD, GCLC
PXR/RXR Activation CPT1A, NR1I3, CES2 (includes EG:8824), ABCC3
* Full names of the genes are listed in Additional file 1, Table S 1.
Deng et al. BMC Systems Biology 2010, 4:153http://www.biomedcentral.com/1752-0509/4/153
Page 8 of 18

sub-network were consistently repressed by both in vivoand in vitro TNT treatments. The conserved sub-net-work provides further evidence that the cell cycle pro-cess may be impaired in both in vivo and in vitrosystems treated with TNT.The TFs PIR, BTBD11, HTATIP2, and CREG1 were
colocalized in the biggest conserved sub-network(herein called the PBHC network). Eight genes wereconnected with the TF PIR centered sub-gene networkmodule (Figure 7), and contained highly enriched genesassociated with oxidoreductase activity (ACOT4,AKR7A3, RDH16, TXNRD1, and UGDH). AKR7A3 andTXNRD1 also participate in NRF2-mediated oxidativestress pathway. All the genes in this network modulewere upregulated by both in vivo and in vitro TNTexposures. This result suggests that oxidative stress isactivated by TNT [15].The TF CREG1 centered sub-network module
included 5 genes (Figure 7), 3 of which were also cellcycle related genes (CREG1, NTRK1 and DUSP13). Incontrast to PTTG1 centered sub-network, all the genes
in the CREG sub-network module were upregulated byboth in vivo and in vitro TNT treatments. Glutathionereductase (GSR), a gene related to oxidoreductase activ-ity, and TXNRD1 provided the connections between theCREG1, HTATIP2, and PIR sub-networks (Figure 7),creating a larger 13 gene sub-network. In addition, GSRalso participated in the NRF2-mediated oxidative stresspathway. Indeed, we found that all the genes in the big-gest conserved sub-network formed by CREG1, HTA-TIP2, BTBD11, and PIR mediated modules wereconsistently upregulated by both in vivo and in vitroTNT additions.
Verification of microarray responses using real time QRT-PCRTo verify the credibility of microarray and gene networkmodeling results, we selected 13 genes to perform realtime quantitative PCR (QRT-PCR) both in vitro and invivo. The genes chosen consistently played key roles infunctional categories and pathways altered by TNTexposures in vivo and in vivo. As illustrated in Figure 8,
Figure 6 In vivo and in vitro transcriptional gene network views. Both gene networks were built using common genes regulated by TNT invivo and in vitro. The in vivo gene network (A) was constructed using 200 arrays from rat liver tissues treated with one of 5 compounds TNT,2,4-DNT, 2,6-DNT, 2A-DNT and 4A-DNT or vehicle controls. The in vitro gene network (B) was modeled using 531 arrays resulted from liverprimary cultured cells treated by one of 105 compounds with relative controls. The Context Likelihood of Relatedness (CLR) algorithm wasemployed to build both gene networks. Yellow highlighted genes are transcription factors. (C) Number of connections of transcription factors invivo and in vitro gene networks. The number of connections of transcription factors in vivo and in vitro gene networks exhibited in Fig. 6A, B wascounted.
Deng et al. BMC Systems Biology 2010, 4:153http://www.biomedcentral.com/1752-0509/4/153
Page 9 of 18

we observed good consistency between microarray andQRT-PCR results. Similar upregulation and downregula-tion trends were seen with both microarray data andQRT-PCR data for all 13 genes. The overall regressioncoefficient of the two methods across various conditionswas 0.875 (Figure 8C). Our results indicate the microar-ray data quality is good and our interpretation and ana-lysis should be convincing. Specific comparisonsbetween microarray and QRT-PCR are presented inAdditional file 2, Figures S 1A-1F.For instance, the gene ABCC3 was shown in microar-
ray (Additional file 2, Figure S 1A) to be upregulated atboth 24 h and 48 h with a clear dose response to in vivoTNT treatment, and was also induced by TNT in vitro,and the same pattern was exhibited by QRT-PCR (Addi-tional file 2, Supplementary Figure 1A). In both micro-array and QRT-PCR results, the gene AKR7A3 wasupregulated at both time points in vivo as well as upre-gulated in vitro. Interestingly, AKR7A3 was significantlyupregulated at the highest dose (192 mg/kg) in vivo at48 h but not at other lower doses, which was shownconsistently by both microarray and QRT-PCR (Addi-tional file 2: Figure S1 A). For the gene CYP1A1, wesaw it was upregulated more in response to in vitroTNT than in vivo TNT treatment, and was inducedmuch more at 24 h than 48 h in vivo, which was consis-tently revealed by both microarray and QRT-PCRresults (Additional file 2, Figure S 1C). Three genes
PTTG1 (Figure 8), CCNB1 and CCND2 that were inPTTG1 centered subnetwork were consistently shownto be downregulated by TNT in vivo and in vitro, withboth approaches (Additional file 2, Figures S 1B and F).The QRT-PCR results could exactly confirm our twoobservations obtained from the microarray data: thegenes up or downregulated in the same directions invitro and in vivo, and a clear dose response in vivo.
DiscussionIn this study, we compared gene expression profilesregulated by TNT exposure in vivo and in vitro fromshared gene lists, functional terms, common pathways,and conserved networks. Overall, good consistencyexisted between in vitro and in vivo exposures. TheVenn diagram (Figure 1) shows that a only small per-centage of the in vivo transcripts were also regulated inthe in vitro experiments. Because the regulated genenumber in vivo is the total number from all TNT treat-ments including multiple doses and two time points (24h and 48h), the gene number is much larger than thatof in vitro exposures. However, the in vitro gene numbercomes from only one dose. The reason we used onedose is that the in vitro experiment is a large one with atotal of over 105 chemicals and 531 arrays. But if wecompare the overlapped transcripts with the in vitrotranscripts (940), the number of overlapped transcriptsis not small, with over one third of the total in vitro
Figure 7 Conserved sub gene networks between in vitro and in vivo gene networks. By comparing in vivo and in vitro gene networks(shown in Fig. 6), conserved subnetworks that had the same connections in the both networks were achieved. Transcription factors arehighlighted as yellow.
Deng et al. BMC Systems Biology 2010, 4:153http://www.biomedcentral.com/1752-0509/4/153
Page 10 of 18

transcripts. This observation is found more than inoverlaps examined in other publications ([16]. Also wewould like to emphasize that the gene expression pat-terns for the 192 mg/kg, 24 h in vivo TNT treatmentand the 24 h in vitro TNT treatment are similar. If we
only count the regulated transcript number for192 mg/kg, 24 h in vivo TNT treatment (Figure 2), thenumber is comparable to that of the 24 h in vitro TNTtreatment. In addition, in vivo and in vitro are two dif-ferent systems, we cannot expect that they are exactlythe same. Our purpose is to identify common tran-scripts between these two systems, thereby to under-stand the in vivo function through the in vitro system.From the perspective of functional analysis, both TNTtreatments in vivo and in vitro influence genes involvedin cell cycle, cell growth and cell death signaling, detoxi-fication response, lipid metabolism and immunereponse, which can reasonably explain the physiologicaldysfunctions induced by TNT. We also found conservedsub-networks between inferred networks from in vivoand in vitro TNT regulated gene expression profiles.
Cell cycle, cell growth, and cell death signalingA large number of genes involved in cell cycle, cellgrowth and cell death were commonly regulated in bothin vitro and in vivo systems perturbed by TNT. Thehighly represented downregulated genes were CCNB1,CCND2, PTTG1, CXC12, and LGALS1, and the highlyrepresented upregulated genes were ADM, MYC, NRG1,NRG2, and PPARG. The cyclin B1 (CCNB1) geneproduct complexes with p34(cdc2) to form the matura-tion-promoting factor (MPF). CCNB1 is expressed pre-dominantly during G2/M phase because of its criticalrole in cell mitosis [17,18]. The protein encoded byCCND2 belongs to the highly conserved cyclin family,whose members are characterized by a dramatic periodi-city in protein abundance through the cell cycle. Cyclinsfunction as regulators of CDK kinases. Different cyclinsexhibit distinct expression and degradation patternswhich contribute to the temporal coordination of eachmitotic event. The CCND2-translated cyclin forms acomplex with and functions as a regulatory subunit ofCDK4 or CDK6, whose activity is essential for cell cycleG1/S transition. PTTG1 encoded protein is a homologof yeast securin proteins, which prevent separins frompromoting sister chromatid separation. The gene pro-duct contains 2 PXXP motifs, which are essential for itstransforming and tumorigenic activities, as well as forits stimulation of basic fibroblast growth factor expres-sion [19-21]. Besides the functions of cell cycle andgrowth, the major role of CXC12 is involved in immuneresponse. The protein encoded by LGALS1 is a memberof beta-galactoside-binding protein family implicated inmodulating cell-cell and cell-matrix interactions, whichmay act as an autocrine negative growth factor that reg-ulates cell proliferation [22].The protein product of the gene Adrenomedullin
(ADM) is a multifunctional peptide vasodilator that car-ries out its functions through calcitonin receptor-like
Figure 8 Quantitative real-time RT-PCR (QRT-PCR) verificationof microarray gene expression. Both QRT-PCR (A) and microarray(B) results of the gene PTTG1(G) were presented. The experimentaldesign was the same as the microarray experiment. The expressionvalue for a given gene was represented as a log2 ratio of ratio ofexposed versus respective control RNA. The correlation of total 13genes across different conditions (n = 156) between the microarrayand RT-PCR data was shown on Fig. 8C. Bars represent the standarderrors for the average log2 ratios of biological replicates.
Deng et al. BMC Systems Biology 2010, 4:153http://www.biomedcentral.com/1752-0509/4/153
Page 11 of 18

receptor/receptor activity modifying protein-2 and -3(CLR/RAMP2 and CLR/RAMP3). It can positivelyenhance cell proliferation [21]. MYC is a well knownmultifunctional, nuclear phosphoprotein that contributesto cell cycle progression, apoptosis and cellular transfor-mation [23]. It acts as a transcription factor that regu-lates transcription of specific target genes. It has beenimplicated as an oncogene to facilitate cell growth andsurvival. The protein encoded by NRG1 was initiallycharacterized as a 44-kD glycoprotein that interacts withthe NEU/ERBB2 receptor tyrosine kinase to increase itsphosphorylation on tyrosine residues. This protein is asignaling protein that regulates cell-cell interactions andis involved in the promotion of growth and developmentof multiple organ systems [24,25]. Neuregulin 2 (NRG2)is a new member of the neuregulin family of growthand differentiation factors. By interacting with the Erbbfamily of receptors, NRG2 induces the growth and dif-ferentiation of epithelial, neuronal, glial, and other celltypes [26]. The gene PPARG encodes a member of theperoxisome proliferator-activated receptor (PPAR) sub-family of nuclear receptors. PPARs form heterodimerswith retinoid X receptors (RXRs) and these heterodi-mers regulate transcription of various genes to executevarious functions including lipid metabolism and cellgrowth [27,28].The gene BCL2A1, encodes a member of the BCL-2
protein family, a well known protein family functioningas anti- and pro-apoptotic regulators[29]. The proteinencoded by this BCL2A1 is able to reduce the release ofpro-apoptotic cytochrome c from mitochondria andblock caspase activation, thereby enhance cell survival.The reduction of the expression of this gene could par-tially account for the cell damage induced by TNT.Interestingly, the downregulated genes involved in cell
growth and cell death also play a role in the cell cycleprocess. Therefore, the cell growth and other possiblecell death related phenotypes may occur primarilythrough interrupting cell cycle progression of cells.Recently we found that there was weight loss in ratstreated with TNT (data not shown). The possible reasonfor the body weight loss is that cell growth is reducedby TNT. TNT could inhibit the growth of V79 and TK6human lymphoblastic cells [30]. It could explain cyto-toxic effects caused by TNT [9-11].
Detoxification responseOur results revealed a couple of pathways that werecommonly regulated by both in vivo and in vitro TNTtreatments. From the pathways listed in Table 3, weidentified xenobiotic metabolism signaling as the key ofall the pathways because all the other pathways areinvolved in xenobiotic metabolism signaling. Certainly,several phase I and II metabolizing enzymes with their
family members that take part in multiple pathways playa pivotal role in the detoxification process. Theseenzymes mainly cover CYPs, GSTs, UGTs, AKR7A3,ALDHL1, NQO1, and EPHX1. As expected, all theseenzymes were consistently elevated by both in vitro andin vivo TNT treatments.CYP1A1 has been a hallmark for the treatments of
many toxins and carcinogens [31-34]. CYP1A1 wasstrongly induced in both in vivo and in vitro liver cellsby TNT. Due to its catalytic function, it could play dualroles in the cells in the presence of TNT. Its activationleads to the production of reactive oxygen species (ROS)[35] which induces oxidative stress, lipid peroxidation(LPO), protein modification and denaturation, and DNAdamage, and thus induces toxicity. Meanwhile, it mayalso directly metabolize TNT or its metabolites, result-ing in cell survival. Glutathione transferases (GSTs) cat-alyze the conjunction of reduced glutathione (GSH) toelectrophiles and oxidative stress products, thus facilitat-ing their removal [36].UGTs catalyze the generation of glucuronide conju-
gates of dihydrodiols to execute their detoxificationfunction [37]. AKR7A3 catalyzes aflatoxin B1 (AFB 1)and suppresses AFB1 dialdehyde metabolite to its corre-sponding mono and dialcohols. Hence, the activation ofAKR7A3 attenuates the toxicity of the AFB1-dialdehydethat reacts with proteins, and thus decreases AFB1-induced toxicity [38].ALDH1L1 is well recognized as protectors against
ROS caused oxidative damage. It metabolizes reactiveproducts of toxic LPO, which include 4-hydroxy-2-nonenal (4-HNE) and malondialdehyde (MDA) [39].This protective mechanism could explain how ALDHresponds to the cellular recovery to TNT exposure.As a cytosolic flavoenzyme, NQO1 catalyzes the two-
electron reduction of diversified substrates [40]. NQO1is characterized as a detoxification enzyme mainlybecause of its capability of degenerating quinone sub-strates to their less toxic hydroquinone metabolites,bypassing the redox-cycling semiquinone radical [41,42].NQO1 can also transform ubiquinone and vitamin Equinone to their antioxidant forms [42].EPHX1 is one member of epoxide hydrolases (EPHs)
that catalyze the hydrolysis of electrophiles such asepoxides to the less reactive vicinal diols, which canexplain the mechanism of epoxide hydrolases as classi-cal detoxifying enzymes. EPH is able to inactivatehighly diversified reactive epoxides with different struc-tures, and therefore plays a critical role in the enzy-matic defense against adverse effects of xenobioticcompounds [43].Many upregulated genes involved in xenobiotic meta-
bolism signaling also participate in cell cycle, cellgrowth, and cell death. Our results suggest that, upon
Deng et al. BMC Systems Biology 2010, 4:153http://www.biomedcentral.com/1752-0509/4/153
Page 12 of 18

exposure to TNT, cells arrest the cell cycle and increasedetoxification and oxidative stress enzymes to removethe xenobiotic and eliminate any cell damage caused bythe xenobiotic..
Lipid metabolismSeveral genes participating in lipid metabolism werecommonly regulated by both in vivo and in vitro TNTexposures. Most of these lipid metabolism genes showedelevated expression, while only a small number of geneswere repressed. The downregulated genes includedLGALS1, PNPLA3, CXCL12, HSD11B2 and INPP5 D.One well known gene, inositol polyphosphate-5-phos-phatase, 145kDa (INPP5 D, or SHIP-1), encodes a proteinthat is largely confined to hematopoietic cells. It is a wellcharacterized inhibitory molecule that is recruited byengagement of the inhibitory Fcg type IIB receptor in Bcells and mast cells or by engagement of Fcε type I or Fcgtype III, cytokine, and growth factor receptors in myeloidcells [44]. Once recruited to the plasma membrane bysignaling complexes, its enzymatic activity depletesPtdIns(3,4,5)P3 and prevents membrane localization ofsome PH domain-containing effectors, eventually leadingto impaired PI3K-dependent signaling events.The protein encoded by the gene PNPLA3 is a member
of the adiponutrin family complement the hormone sensi-tive lipase (HSL) as responsible for adipocyte triacylgly-cerol lipase activity. Mice lacking HSL reveal a leanphenotype and accumulate diglycerides suggesting thatHSL is the main enzyme for the second step of lipolysis[45]. LGALS1 has been shown to be involved in manyother functions in Table 1, also plays a role in lipidmetabolism, by increasing the induction of levels of phos-phatidylserine as well as the mobilization of phosphatidyl-serine [46]. Hydroxysteroid (11-beta) dehydrogenase 2(HSD11B2) has been reported to contribute to the meta-bolism of aldosterone, cortisone, glucorticoid and hydro-cortisone [47,48]. The downregulated genes involved inlipid metabolism may indicate that TNT may interruptlipid metabolism to some degree. The lipid metabolismwas also impaired in the liver of quail exposed to 2,6-DNT[49]. Meanwhile, we saw many other genes involved inlipid metabolism upregulated by TNT, many of whichoverlap with xenobiotic signaling genes (Table 3), suggest-ing that they also function for detoxification by trying torecover normal lipid metabolism.
Immune responseAs described earlier in the results, 5 of 8 genes asso-ciated with immune response were downregulated byTNT both in vivo and in vitro. These 5 genes areCXCL12, COL1A1, BCL2A1, INPP5 D, and CYTIP.Chemokine (C-X-C motif) ligand 12 (CXCL12 or
SDF-1) was strongly downregulated by TNT. It is a
ligand for the G-coupled receptor protein chemokine(C-X-C motif) receptor CXCR4. Activation of CXCR4by CXCL12 is involved in many biological functionssuch as cell migration, growth, and survival [50].Besides enhancing cell survival, BCL2A1 is a direct tran-
scription target of NF-�B in response to inflammatorymediators, and is upregulated by different extracellular sig-nals such as granulocyte-macrophage colony-stimulatingfactor (GM-CSF), CD40, phorbol ester and inflammatorycytokines TNF and IL-1, which suggests a cytoprotectivefunction that is essential for lymphocyte activation, andplays a role in immune response [51].COL1A1 encodes the pro-alpha 1 chains of type I col-
lagen whose triple helix is composed of two alpha 1chains and one alpha 2 chain. Type I collagen is a fibril-forming collagen found in most connective tissues andis abundant in bone, cornea, dermis and tendon. Thusthis gene is critical for cell aggregation, migration, pro-liferation, binding, adhesion and growth [52]. This genecarries out its immune response by primarily affectingtransmigration of T lymphocytes. As a gene primarilyfunctioning in lipid metabolism, INPP5 D participatingin immune response by mainly maintaining the quantityof B lymphocytes and participating in phospholipidmetabolism [53]. Cytohesin 1 interacting protein(CYTIP) encodes a protein containing 2 leucine zipperdomains and a putative C-terminal nuclear targeting sig-nal. Its major role is involved in the quantity mainte-nance, migration of leukocytes and lymphocytes [54].The decreased above gene expression could explain
the interference of normal immune response by TNTboth in vitro and in vivo, which could lead to inflamma-tion and other immune related toxicities caused byTNT.
Network as a valuable approach for predicting in vivofunction using in vitro dataFinally, not only could we find commonly regulatedgenes, functional terms, and pathways, but we were alsoable to identify conserved gene networks between invitro and in vivo liver systems perturbed by TNT. Therewere two big conserved sub-networks, the TF PTTG1centered gene network and the TFs PIR, BTBD11,HTATIP2 and CREG1-connected gene network (PBHCnetwork). Interestingly, all the genes in the PTTG1 sub-network were associated with cell cycle function. Forexample, CDC2 and cyclin B (CCNB1) form a complexwhich is responsible for the onset of metaphase [55].PTTG1, CDC2, and CCNB1 all participated in the mito-tic roles of Polo-Like kinase pathway [56,57]. Further-more, all the genes in the PTTG sub-network weredownregulated by TNT in vitro and in vivo. Since cellcycle is the most significant functional term affected byTNT both in vitro and in vivo (Table 1), this conserved
Deng et al. BMC Systems Biology 2010, 4:153http://www.biomedcentral.com/1752-0509/4/153
Page 13 of 18

cell cycle relating network could well explain the com-mon mechanism of TNT treated liver systems both invivo and in vitro, which is that cell cycle progression isinterfered by TNT, thereby leading to cell growth inhi-bition and cell death, ultimately cause toxicity [58-60].We did observe liver cell death in rats exposed to highdose TNT (Deng et al., unpublished data).In the PBHC sub-network, some genes such as
CREG1, NTRK1, DUSP13, GSR, and TXNRD1 play arole in cell cycle and/or cell death. Many genes possessoxidoreductase activity [61], and are involved in oxida-tive stress process and play a crucial role in metaboliz-ing toxic compounds and their metabolites. The TF PIRencodes a TF which is a member of the cupin superfam-ily. The encoded protein is a Fe(II)-containing nuclearprotein expressed in all tissues of the body and concen-trated within dot-like subnuclear structures [62]. Inter-actions with nuclear factor I/CCAAT box transcriptionfactor as well as B cell lymphoma 3-encoded oncopro-tein suggest the encoded protein may function as a tran-scriptional cofactor and be involved in the regulation ofDNA transcription and replication. Interestingly, the TFHTATIP2 also has oxidoreductase activity [63], andconnects two genes GSR and TXNRD1 that both pos-sess oxidoreductase activity as well as both take part inNRF2-mediated oxidative stress pathway. HTATIP wasreported to be regulated by NRF2, too [64].Overall, we can see that the genes in the PBHC sub-
network are involved in cell cycle growth, and/or oxi-doreductase activity. Surprisingly, 17 genes in the PBHCsub-network (Figure 7) were all consistently upregulatedby TNT both in vivo and in vitro. The induction ofthese gene expression lead to cell survival and removalof toxic products, therefore, this conserved sub-networkmay well explain the common detoxification mechanismboth in vivo and in vitro liver systems treated with TNT.We did not use only TNT-exposed samples but
included all samples in the pool to construct static genenetworks, which aim to uncover any gene interactions.In so doing, the more samples and conditions includedmake the network analyses more robust. For instance,Faith et al. (2007) used 445 arrays with over 180 variousconditions to build an E. Coli static gene network.Because the genes we used are TNT-regulated genes,the constructed gene networks are specifically TNT-regulated networks.We built separate gene networks using in vitro and in
vivo samples and found commonly conserved networks.These common networks are ideal because they validateboth in vivo and in vitro conditions.
ConclusionsOur results indicate that TNT perturbed similar generegulated networks when in vitro effects on hepatocyte
cells are compared with in vitro effects on liver. Thus,gene regulatory networks obtained from an in vitro sys-tem can be predictive of in vivo function in the liverwhen perturbed by a chemical stressor such as TNT.Furthermore, PTTG1 regulated cell cycle may be a keytargeted process indicator for TNT induced toxicity.This study is the first report to use an in vitro tran-
scriptional regulatory gene network to predict in vivotoxicity and mechanism induced by a chemical. Knowl-edge achieved from this innovative study can provide anefficient way to assess whether a soldier or civilian hasbeen exposed to TNT and to find possible ways to pre-vent, treat, and reduce TNT induced adverse effects.
MethodsMicroarray experimental designChanges in gene expression were tested using Agilentcommercial whole rat genome microarrays (4 X 44K).For in vivo experiment, one of five compounds (2,4-DNT, 2,6-DNT, TNT, 2-ADNT and 4-ADNT) wereused to treat rats. Female Sprague-Dawley rats (175-225grams) were from the in-house breeding colony (Collegeof Pharmacy, University of Louisiana at Monroe [ULM]and treated in accordance with the Guide for Use andCare of Animals [65]. Breeders were from Harlan-Spra-gue Dawley in Madison, WI. Housing consisted of a 12h light/dark cycle with ad libitum access to tap waterand rodent chow (Harlan/Teklad 7012, Madison, WI).Rats were housed individually in polycarbonate cages onhardwood bedding (Sani-chips, Harlan/Tekland, Madi-son, WI) one week prior to treatment. Food was with-drawn the night before treatments, which wereadministered by gavage between 8 and 10 AM. Studyprotocols were preapproved by the ULM Animal Careand Use Committee.Groups of rats were weighed and randomly assigned
to treatment. Treatments were vehicle (5% v/v DMSOin corn oil), 2,4-DNT (4.8, 48, 96, and 192 mg/kg), 2A-DNT (4.4, 44, 87 and 174 mg/kg) and 4A-DNT (4.7, 47,94 and 187 mg/kg), TNT (4.8, 48, 96 and 192 mg/kg),and 2,6-DNT (5.0, 25, 50 and 99 mg/kg). Rats wereobserved continuously for the first hour after dosing,hourly for 8 h and daily thereafter. Moribund rats wereeuthanized with CO2. Livers were excised and weighed.A portion of the liver was removed and placed in RNALater (Ambion) following manufacturer’s instructionand later used for genomic analyses. Remaining liverwas flash frozen in liquid N2 and stored at -70°C forfurther analyses.For in vitro experiment, primary cultured rat hepato-
cytes (Lonza, Walkersville, MD) were kept in an incu-bator at 37°C and 5% CO2. After seeding in flasks(3x10⁶ cells/flask), the cells were treated with 10 mg/lTNT and vehicle control (DMSO). Three experimental
Deng et al. BMC Systems Biology 2010, 4:153http://www.biomedcentral.com/1752-0509/4/153
Page 14 of 18

replicates were used. After 24 h, the cells were isolatedand lysed for RNA analysis. Cells were also treatedwith one of 106 compounds, including TNT (10 mg/l),and relative controls. At least three biological replicateswere used for each unique condition (Additional file 3,Table S 3).
Total RNA extractionTotal RNA was extracted from about 30 mg of liver tis-sue or cell pellet. Tissues or cells were homogenized inthe lysis buffer with FAST Prep-24 from MP at speed6.0/s twice, each last 30 s before using RNeasy kits (Qia-gen). Total RNA concentrations were measured usingNanoDrop® ND-1000 Spectrophotometer (NanoDroptechnologies, Wilmington, DE, USA). The integrity andquality of total RNA was checked on an Agilent 2100Bioanalyzer (Palo Alto, CA). The gel-like images gener-ated by the Bioanalyzer show that total RNAs have twobands, represent 18 S and 26 S RNA of mammalianRNA. Nuclease-free water (Ambion) was used to elutetotal RNA.
Microarray hybridizationRat whole genome oligo arrays in the format of 4X44Kwere purchased from Agilent. Sample cRNA synthesis,labeling, hybridization and microarray processing wereperformed according to manufacturer’s protocol “One-Color Microarray-Based Gene Expression Analysis”(version 1.0). The Agilent One-Color Spike-Mix (partnumber 5188-5282) was diluted 5000-fold and 5 μl ofthe diluted spike-in mix was added to 1000 ng of eachof the total RNA samples prior to labeling reactions.The labeling reactions were performed using the Agi-lent Low RNA Input Linear Amplification Kit in thepresence of cyanine 3-CTP. The labeled cRNA fromeach labeling reaction was hybridized to individualarrays at 65°C for 17 h using the Agilent Gene Expres-sion Hybridization Kit. After washing, the arrays werescanned at PMT levels 350 using GenePix 4200ALscanner (Molecular Device Inc.), the Feature extrac-tion software (V. 9.5.1) from Agilent was used to auto-matically find and place microarray grids, reject outlierpixels, accurately determine feature intensities andratios, flag outlier pixels, and calculate statisticalconfidences.
Microarray data analysisMicroarray data analyses were processed with Gene-Spring version 7.0 and 10.0. The sample quality controlwas based on the Pearson correlation of a sample withother samples in the whole experiment. If the averagePearson correlation with other samples was less than80%, the sample was excluded for further analysis. If thescanned intensity was less than 5.0 for a probe, it was
transformed to 5. A perchip (within) array normalizationwas performed using 50 percentile values of all theprobe values in the array. Per gene (between) array nor-malization was also applied using the median value of agene across all samples in the experiment. Probe fea-tures were first filtered using flags. A “present” or“absent” flag was defined using the Agilent FeatureExtraction 9.5.1 software. Only a probe that had presentflags in at least 50% samples of all the arrays was keptfor further analyses. Data were subsequently log (base 2)transformed for statistical analyses.To identify differentiated genes that responded to
TNT treatment with various doses in vivo, One-WayANOVA was performed across 5 doses at each timepoint (24 h or 48h). A cut off p value 0.05 was usedto find statistically changed genes, and a 1.5 foldchange showing at least one pair of doses at each timepoint was further applied to filter less significantlyregulated genes. To idenitfy differential genes afterTNT treatment in vitro, an un-paired t-test with cutoff p value 0.05 was applied to compare control sam-ples and TNT exposed samples. In additon, 1.5 foldchange was applied to identify more signifcantly regu-lated genes.
Gene functional analysis and pathway analysisSignificantly regulated probes were employed fortwo-way hierarchical clustering (clustering both genesand samples) using GeneSpring 7.0. A Pearson correla-tion with average linkage was applied for the clustering.Gene functional categories were classified according tothe Ingenuity knowledge base tool. A Gene functionalterm enrichment p value less than 0.05 was consideredsignificant. Pathway analysis was performed using theIngenuity canonical pathways analysis tool. Similar tofunctional term analysis, a pathway with an enrichmentp value less than 0.05 was considered to be a signifi-cantly regulated pathway.
Reverse-transcription quantitative PCR (QRT-PCR)Two-stage RT-QPCR were performed, 1000 ng of totalRNA were first reverse transcribed into cDNA in a20 μl reaction containing 250 ng random primers andSuperScript™ III reverse transcriptase (Invitrogen)following the manufacturer’s instruction. The synthe-sized cDNA was diluted to 10 ng/μl as cDNA template.QPCR was performed on ABI Sequence Detector 7900.Each 20-μl reaction was run in duplicate and contained6 μl (10ng/μl) of synthesized cDNA templates and 3 μlof nuclease-free water along with 1 μl of TaqMan genespecific assay and 10ul of 2× TaqMan universal PCRMaster Mix (ABI). Cycling parameters were 95°C for 15min to activate the DNA polymerase, then 40 cycles of95°C for 15 s and 60°C for 1 min.
Deng et al. BMC Systems Biology 2010, 4:153http://www.biomedcentral.com/1752-0509/4/153
Page 15 of 18
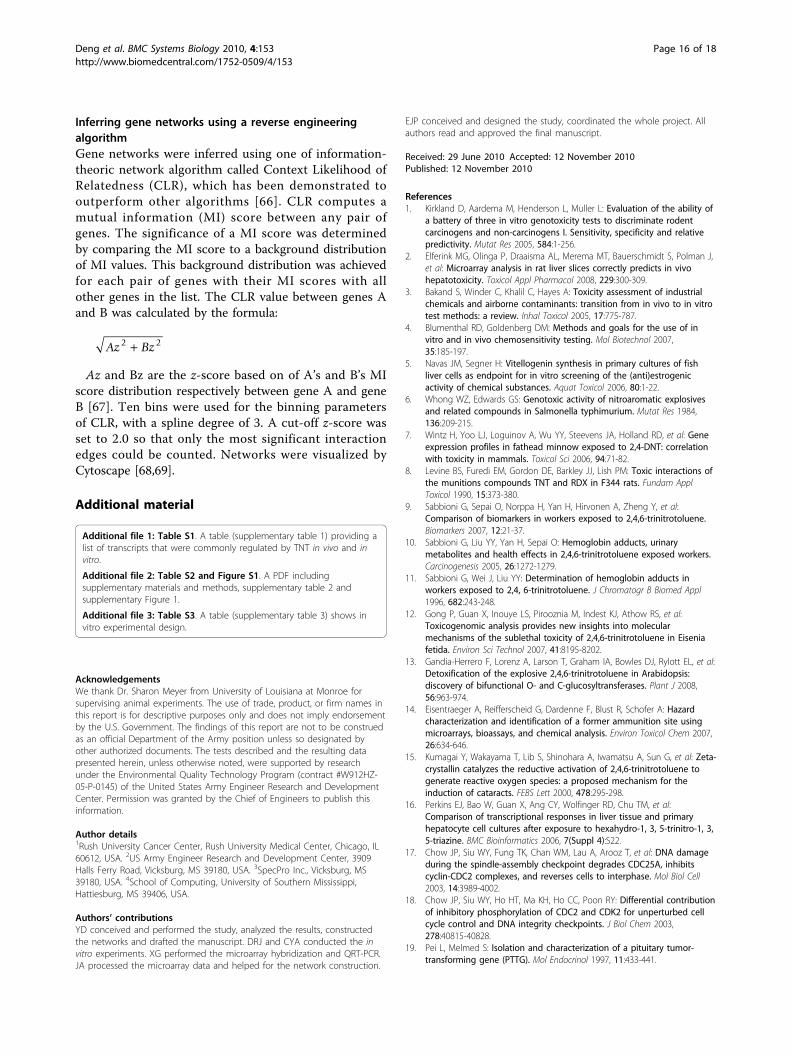
Inferring gene networks using a reverse engineeringalgorithmGene networks were inferred using one of information-theoric network algorithm called Context Likelihood ofRelatedness (CLR), which has been demonstrated tooutperform other algorithms [66]. CLR computes amutual information (MI) score between any pair ofgenes. The significance of a MI score was determinedby comparing the MI score to a background distributionof MI values. This background distribution was achievedfor each pair of genes with their MI scores with allother genes in the list. The CLR value between genes Aand B was calculated by the formula:
Az Bz2 2+
Az and Bz are the z-score based on of A’s and B’s MIscore distribution respectively between gene A and geneB [67]. Ten bins were used for the binning parametersof CLR, with a spline degree of 3. A cut-off z-score wasset to 2.0 so that only the most significant interactionedges could be counted. Networks were visualized byCytoscape [68,69].
Additional material
Additional file 1: Table S1. A table (supplementary table 1) providing alist of transcripts that were commonly regulated by TNT in vivo and invitro.
Additional file 2: Table S2 and Figure S1. A PDF includingsupplementary materials and methods, supplementary table 2 andsupplementary Figure 1.
Additional file 3: Table S3. A table (supplementary table 3) shows invitro experimental design.
AcknowledgementsWe thank Dr. Sharon Meyer from University of Louisiana at Monroe forsupervising animal experiments. The use of trade, product, or firm names inthis report is for descriptive purposes only and does not imply endorsementby the U.S. Government. The findings of this report are not to be construedas an official Department of the Army position unless so designated byother authorized documents. The tests described and the resulting datapresented herein, unless otherwise noted, were supported by researchunder the Environmental Quality Technology Program (contract #W912HZ-05-P-0145) of the United States Army Engineer Research and DevelopmentCenter. Permission was granted by the Chief of Engineers to publish thisinformation.
Author details1Rush University Cancer Center, Rush University Medical Center, Chicago, IL60612, USA. 2US Army Engineer Research and Development Center, 3909Halls Ferry Road, Vicksburg, MS 39180, USA. 3SpecPro Inc., Vicksburg, MS39180, USA. 4School of Computing, University of Southern Mississippi,Hattiesburg, MS 39406, USA.
Authors’ contributionsYD conceived and performed the study, analyzed the results, constructedthe networks and drafted the manuscript. DRJ and CYA conducted the invitro experiments. XG performed the microarray hybridization and QRT-PCR.JA processed the microarray data and helped for the network construction.
EJP conceived and designed the study, coordinated the whole project. Allauthors read and approved the final manuscript.
Received: 29 June 2010 Accepted: 12 November 2010Published: 12 November 2010
References1. Kirkland D, Aardema M, Henderson L, Muller L: Evaluation of the ability of
a battery of three in vitro genotoxicity tests to discriminate rodentcarcinogens and non-carcinogens I. Sensitivity, specificity and relativepredictivity. Mutat Res 2005, 584:1-256.
2. Elferink MG, Olinga P, Draaisma AL, Merema MT, Bauerschmidt S, Polman J,et al: Microarray analysis in rat liver slices correctly predicts in vivohepatotoxicity. Toxicol Appl Pharmacol 2008, 229:300-309.
3. Bakand S, Winder C, Khalil C, Hayes A: Toxicity assessment of industrialchemicals and airborne contaminants: transition from in vivo to in vitrotest methods: a review. Inhal Toxicol 2005, 17:775-787.
4. Blumenthal RD, Goldenberg DM: Methods and goals for the use of invitro and in vivo chemosensitivity testing. Mol Biotechnol 2007,35:185-197.
5. Navas JM, Segner H: Vitellogenin synthesis in primary cultures of fishliver cells as endpoint for in vitro screening of the (anti)estrogenicactivity of chemical substances. Aquat Toxicol 2006, 80:1-22.
6. Whong WZ, Edwards GS: Genotoxic activity of nitroaromatic explosivesand related compounds in Salmonella typhimurium. Mutat Res 1984,136:209-215.
7. Wintz H, Yoo LJ, Loguinov A, Wu YY, Steevens JA, Holland RD, et al: Geneexpression profiles in fathead minnow exposed to 2,4-DNT: correlationwith toxicity in mammals. Toxicol Sci 2006, 94:71-82.
8. Levine BS, Furedi EM, Gordon DE, Barkley JJ, Lish PM: Toxic interactions ofthe munitions compounds TNT and RDX in F344 rats. Fundam ApplToxicol 1990, 15:373-380.
9. Sabbioni G, Sepai O, Norppa H, Yan H, Hirvonen A, Zheng Y, et al:Comparison of biomarkers in workers exposed to 2,4,6-trinitrotoluene.Biomarkers 2007, 12:21-37.
10. Sabbioni G, Liu YY, Yan H, Sepai O: Hemoglobin adducts, urinarymetabolites and health effects in 2,4,6-trinitrotoluene exposed workers.Carcinogenesis 2005, 26:1272-1279.
11. Sabbioni G, Wei J, Liu YY: Determination of hemoglobin adducts inworkers exposed to 2,4, 6-trinitrotoluene. J Chromatogr B Biomed Appl1996, 682:243-248.
12. Gong P, Guan X, Inouye LS, Pirooznia M, Indest KJ, Athow RS, et al:Toxicogenomic analysis provides new insights into molecularmechanisms of the sublethal toxicity of 2,4,6-trinitrotoluene in Eiseniafetida. Environ Sci Technol 2007, 41:8195-8202.
13. Gandia-Herrero F, Lorenz A, Larson T, Graham IA, Bowles DJ, Rylott EL, et al:Detoxification of the explosive 2,4,6-trinitrotoluene in Arabidopsis:discovery of bifunctional O- and C-glucosyltransferases. Plant J 2008,56:963-974.
14. Eisentraeger A, Reifferscheid G, Dardenne F, Blust R, Schofer A: Hazardcharacterization and identification of a former ammunition site usingmicroarrays, bioassays, and chemical analysis. Environ Toxicol Chem 2007,26:634-646.
15. Kumagai Y, Wakayama T, Lib S, Shinohara A, Iwamatsu A, Sun G, et al: Zeta-crystallin catalyzes the reductive activation of 2,4,6-trinitrotoluene togenerate reactive oxygen species: a proposed mechanism for theinduction of cataracts. FEBS Lett 2000, 478:295-298.
16. Perkins EJ, Bao W, Guan X, Ang CY, Wolfinger RD, Chu TM, et al:Comparison of transcriptional responses in liver tissue and primaryhepatocyte cell cultures after exposure to hexahydro-1, 3, 5-trinitro-1, 3,5-triazine. BMC Bioinformatics 2006, 7(Suppl 4):S22.
17. Chow JP, Siu WY, Fung TK, Chan WM, Lau A, Arooz T, et al: DNA damageduring the spindle-assembly checkpoint degrades CDC25A, inhibitscyclin-CDC2 complexes, and reverses cells to interphase. Mol Biol Cell2003, 14:3989-4002.
18. Chow JP, Siu WY, Ho HT, Ma KH, Ho CC, Poon RY: Differential contributionof inhibitory phosphorylation of CDC2 and CDK2 for unperturbed cellcycle control and DNA integrity checkpoints. J Biol Chem 2003,278:40815-40828.
19. Pei L, Melmed S: Isolation and characterization of a pituitary tumor-transforming gene (PTTG). Mol Endocrinol 1997, 11:433-441.
Deng et al. BMC Systems Biology 2010, 4:153http://www.biomedcentral.com/1752-0509/4/153
Page 16 of 18

20. Zou H, McGarry TJ, Bernal T, Kirschner MW: Identification of a vertebratesister-chromatid separation inhibitor involved in transformation andtumorigenesis. Science 1999, 285:418-422.
21. Kaafarani I, Fernandez-Sauze S, Berenguer C, Chinot O, Delfino C,Dussert C, et al: Targeting adrenomedullin receptors with systemicdelivery of neutralizing antibodies inhibits tumor angiogenesis andsuppresses growth of human tumor xenografts in mice. FASEB J 2009,23:3424-3435.
22. Park JW, Voss PG, Grabski S, Wang JL, Patterson RJ: Association of galectin-1 and galectin-3 with Gemin4 in complexes containing the SMN protein.Nucleic Acids Res 2001, 29:3595-3602.
23. Danial NN, Korsmeyer SJ: Cell death: critical control points. Cell 2004,116:205-219.
24. Bersell K, Arab S, Haring B, Kuhn B: Neuregulin1/ErbB4 signaling inducescardiomyocyte proliferation and repair of heart injury. Cell 2009,138:257-270.
25. Britsch S: The neuregulin-I/ErbB signaling system in development anddisease. Adv Anat Embryol Cell Biol 2007, 190:1-65.
26. Chang H, Riese DJ, Gilbert W, Stern DF, McMahan UJ: Ligands for ErbB-family receptors encoded by a neuregulin-like gene. Nature 1997,387:509-512.
27. Kersten S, Desvergne B, Wahli W: Roles of PPARs in health and disease.Nature 2000, 405:421-424.
28. Auwerx J: PPARgamma, the ultimate thrifty gene. Diabetologia 1999,42:1033-1049.
29. Rasooly R, Schuster GU, Gregg JP, Xiao JH, Chandraratna RA,Stephensen CB: Retinoid × receptor agonists increase bcl2a1 expressionand decrease apoptosis of naive T lymphocytes. J Immunol 2005,175:7916-7929.
30. Lachance B, Robidoux PY, Hawari J, Ampleman G, Thiboutot S, Sunahara GI:Cytotoxic and genotoxic effects of energetic compounds on bacterialand mammalian cells in vitro. Mutat Res 1999, 444:25-39.
31. Padgham CR, Paine AJ: Altered expression of cytochrome P-450 mRNAs,and potentially of other transcripts encoding key hepatic functions, aretriggered during the isolation of rat hepatocytes. Biochem J 1993, 289(Pt3):621-624.
32. Hahn ME: Biomarkers and bioassays for detecting dioxin-like compoundsin the marine environment. Sci Total Environ 2002, 289:49-69.
33. Gonzalez FJ: Transgenic models in xenobiotic metabolism andtoxicology. Toxicology 2002, 181-182:237-239.
34. Hawkins SA, Billiard SM, Tabash SP, Brown RS, Hodson PV: Alteringcytochrome P4501A activity affects polycyclic aromatic hydrocarbonmetabolism and toxicity in rainbow trout (Oncorhynchus mykiss). EnvironToxicol Chem 2002, 21:1845-1853.
35. Morel Y, de W, Barouki R: A repressive cross-regulation between catalyticand promoter activities of the CYP1A1 and CYP2E1 genes: role of H(2)O(2). Mol Pharmacol 2000, 57:1158-1164.
36. Boverhof DR, Burgoon LD, Tashiro C, Chittim B, Harkema JR, Jump DB, et al:Temporal and dose-dependent hepatic gene expression patterns inmice provide new insights into TCDD-Mediated hepatotoxicity. ToxicolSci 2005, 85:1048-1063.
37. Naspinski C, Gu X, Zhou GD, Mertens-Talcott SU, Donnelly KC, Tian Y:Pregnane × receptor protects HepG2 cells from BaP-induced DNAdamage. Toxicol Sci 2008, 104:67-73.
38. Bodreddigari S, Jones LK, Egner PA, Groopman JD, Sutter CH, Roebuck BD,et al: Protection against aflatoxin B1-induced cytotoxicity by expressionof the cloned aflatoxin B1-aldehyde reductases rat AKR7A1 and humanAKR7A3. Chem Res Toxicol 2008, 21:1134-1142.
39. Lassen N, Bateman JB, Estey T, Kuszak JR, Nees DW, Piatigorsky J, et al:Multiple and additive functions of ALDH3A1 and ALDH1A1: cataractphenotype and ocular oxidative damage in Aldh3a1(-/-)/Aldh1a1(-/-)knock-out mice. J Biol Chem 2007, 282:25668-25676.
40. Lind C, Hochstein P, Ernster L: DT-diaphorase as a quinone reductase: acellular control device against semiquinone and superoxide radicalformation. Arch Biochem Biophys 1982, 216:178-185.
41. Thor H, Smith MT, Hartzell P, Bellomo G, Jewell SA, Orrenius S: Themetabolism of menadione (2-methyl-1,4-naphthoquinone) by isolatedhepatocytes. A study of the implications of oxidative stress in intactcells. J Biol Chem 1982, 257:12419-12425.
42. Anwar A, Dehn D, Siegel D, Kepa JK, Tang LJ, Pietenpol JA, et al:Interaction of human NAD(P)H:quinone oxidoreductase 1 (NQO1) with
the tumor suppressor protein p53 in cells and cell-free systems. J BiolChem 2003, 278:10368-10373.
43. Keating AF, Rajapaksa KS, Sipes IG, Hoyer PB: Effect of CYP2E1 genedeletion in mice on expression of microsomal epoxide hydrolase inresponse to VCD exposure. Toxicol Sci 2008, 105:351-359.
44. Harris SJ, Parry RV, Westwick J, Ward SG: Phosphoinositide lipidphosphatases: natural regulators of phosphoinositide 3-kinase signalingin T lymphocytes. J Biol Chem 2008, 283:2465-2469.
45. Johansson LE, Johansson LM, Danielsson P, Norgren S, Johansson S,Marcus C, et al: Genetic variance in the adiponutrin gene family andchildhood obesity. PLoS One 2009, 4:e5327.
46. Karmakar S, Cummings RD, McEver RP: Contributions of Ca2+ to galectin-1-induced exposure of phosphatidylserine on activated neutrophils. JBiol Chem 2005, 280:28623-28631.
47. Tagawa N, Yuda R, Kubota S, Wakabayashi M, Yamaguchi Y, Kiyonaga D,et al: 17Beta-estradiol inhibits 11beta-hydroxysteroid dehydrogenasetype 1 activity in rodent adipocytes. J Endocrinol 2009, 202:131-139.
48. Bujalska IJ, Gathercole LL, Tomlinson JW, Darimont C, Ermolieff J, Fanjul AN,et al: A novel selective 11beta-hydroxysteroid dehydrogenase type 1inhibitor prevents human adipogenesis. J Endocrinol 2008, 197:297-307.
49. Rawat A, Gust KA, Deng Y, Garcia-Reyero N, Quinn MJ, Johnson MS, et al:From raw materials to validated system: The construction of a genomiclibrary and microarray to interpret systemic perturbations in Northernbobwhite. Physiol Genomics 2010, 7;42(2):219-35.
50. Grundler R, Brault L, Gasser C, Bullock AN, Dechow T, Woetzel S, et al:Dissection of PIM serine/threonine kinases in FLT3-ITD-inducedleukemogenesis reveals PIM1 as regulator of CXCL12-CXCR4-mediatedhoming and migration. J Exp Med 2009, 206:1957-1970.
51. Mandal M, Borowski C, Palomero T, Ferrando AA, Oberdoerffer P, Meng F,et al: The BCL2A1 gene as a pre-T cell receptor-induced regulator ofthymocyte survival. J Exp Med 2005, 201:603-614.
52. Kitamoto S, Sukhova GK, Sun J, Yang M, Libby P, Love V, et al: Cathepsin Ldeficiency reduces diet-induced atherosclerosis in low-densitylipoprotein receptor-knockout mice. Circulation 2007, 115:2065-2075.
53. Kurosaki T: Genetic analysis of B cell antigen receptor signaling. Annu RevImmunol 1999, 17:555-592.
54. Coppola V, Barrick CA, Bobisse S, Rodriguez-Galan MC, Pivetta M,Reynolds D, et al: The scaffold protein Cybr is required for cytokine-modulated trafficking of leukocytes in vivo. Mol Cell Biol 2006,26:5249-5258.
55. Hoffmann I, Clarke PR, Marcote MJ, Karsenti E, Draetta G: Phosphorylationand activation of human cdc25-C by cdc2–cyclin B and its involvementin the self-amplification of MPF at mitosis. EMBO J 1993, 12:53-63.
56. Donaldson MM, Tavares AA, Hagan IM, Nigg EA, Glover DM: The mitoticroles of Polo-like kinase. J Cell Sci 2001, 114:2357-2358.
57. Donaldson MM, Tavares AA, Ohkura H, Deak P, Glover DM: Metaphasearrest with centromere separation in polo mutants of Drosophila. J CellBiol 2001, 153:663-676.
58. Robidoux PY, Svendsen C, Sarrazin M, Hawari J, Thiboutot S, Ampleman G,et al: Evaluation of tissue and cellular biomarkers to assess 2,4,6-trinitrotoluene (TNT) exposure in earthworms: effects-based assessmentin laboratory studies using Eisenia andrei. Biomarkers 2002, 7:306-321.
59. Robidoux PY, Svendsen C, Sarrazin M, Thiboutot S, Ampleman G, Hawari J,et al: Assessment of a 2,4,6-trinitrotoluene-contaminated site usingAporrectodea rosea and Eisenia andrei in mesocosms. Arch EnvironContam Toxicol 2005, 48:56-67.
60. Gong P, Guan X, Inouye LS, Deng Y, Pirooznia M, Perkins EJ: Transcriptomicanalysis of RDX and TNT interactive sublethal effects in the earthwormEisenia fetida. BMC Genomics 2008, 9(Suppl 1):S15.
61. Zhang Q, Pi J, Woods CG, Andersen ME: Phase I to II cross-induction ofxenobiotic metabolizing enzymes: a feedforward control mechanism forpotential hormetic responses. Toxicol Appl Pharmacol 2009, 237:345-356.
62. Adams M, Jia Z: Structural and biochemical analysis reveal pirins topossess quercetinase activity. J Biol Chem 2005, 280:28675-28682.
63. Persson B, Kallberg Y, Bray JE, Bruford E, Dellaporta SL, Favia AD, et al: TheSDR (short-chain dehydrogenase/reductase and related enzymes)nomenclature initiative. Chem Biol Interact 2009, 178:94-98.
64. Kwak MK, Wakabayashi N, Itoh K, Motohashi H, Yamamoto M, Kensler TW:Modulation of gene expression by cancer chemopreventivedithiolethiones through the Keap1-Nrf2 pathway. Identification of novelgene clusters for cell survival. J Biol Chem 2003, 278:8135-8145.
Deng et al. BMC Systems Biology 2010, 4:153http://www.biomedcentral.com/1752-0509/4/153
Page 17 of 18

65. National Research Council: Guide for the care and use of laboratory animalsNational Academy Press, Washington D.C; 1996.
66. Faith JJ, Hayete B, Thaden JT, Mogno I, Wierzbowski J, Cottarel G, et al:Large-scale mapping and validation of Escherichia coli transcriptionalregulation from a compendium of expression profiles. PLoS Biol 2007, 5:e8.
67. Taylor RC, cquaah-Mensah G, Singhal M, Malhotra D, Biswal S: Networkinference algorithms elucidate Nrf2 regulation of mouse lung oxidativestress. PLoS Comput Biol 2008, 4:e1000166.
68. Emig D, Cline MS, Lengauer T, Albrecht M: Integrating expression datawith domain interaction networks. Bioinformatics 2008, 24:2546-2548.
69. Cline MS, Smoot M, Cerami E, Kuchinsky A, Landys N, Workman C, et al:Integration of biological networks and gene expression data usingCytoscape. Nat Protoc 2007, 2:2366-2382.
doi:10.1186/1752-0509-4-153Cite this article as: Deng et al.: In vitro gene regulatory networkspredict in vivo function of liver. BMC Systems Biology 2010 4:153.
Submit your next manuscript to BioMed Centraland take full advantage of:
• Convenient online submission
• Thorough peer review
• No space constraints or color figure charges
• Immediate publication on acceptance
• Inclusion in PubMed, CAS, Scopus and Google Scholar
• Research which is freely available for redistribution
Submit your manuscript at www.biomedcentral.com/submit
Deng et al. BMC Systems Biology 2010, 4:153http://www.biomedcentral.com/1752-0509/4/153
Page 18 of 18