incentives policy evaluation
TRANSCRIPT

Final Report
Incentives Policy Evaluation

HR&A Advisors, Inc. Columbus Incentives Policy Evaluation | 1
Table of Contents
I. Introduction 2
II. Overview: Incentive Toolkit & Policy Goals 8
III. Residential Abatement Analysis & Recommendations 14
Effectiveness in Supporting Neighborhood Revitalization 16
The Role of Incentives in Driving Development Feasibility 35
Residential Incentives Recommendations 44
IV. Commercial Incentives & Recommendations 53
Commercial Incentive Overview 55
National Peers and Neighbors 69
Best Practices to Ensure Competitiveness 76
Appendix I. Neighborhood Decision Support Tool 88
Appendix II. Advisory Committee Acknowledgements 94
Appendix III. Study Timeline 96

HR&A Advisors, Inc. Columbus Incentives Policy Evaluation |2
I. Introduction

HR&A Advisors, Inc. Columbus Incentives Policy Evaluation |3
Columbus is in the midst of a sustained period of urban revitalization.
Columbus CommonsScioto MileShort North Revitalization
Columbus is in the midst of a sustained period of urban
revitalization, having seen significant growth in residents and
jobs over the past decade, supported by strong investment in
its downtown and core neighborhoods.
As both the capital of Ohio and the home of The Ohio State
University, Columbus has established itself as one of the
major Midwestern centers for young college graduates to
launch their careers. Its strong sectoral base in education,
professional services, and government makes it a natural
destination for college graduates.
Columbus is also attracting a host of new jobs to the city.
Between 2004 and 2014, total employment in Columbus
increased by 9%, or approximately 38,000 jobs. The fastest
growing sectors include corporate management, health care
and social assistance, educational services, transportation and
warehousing, and finance and insurance.
Columbus has also made a series of investments that have
capitalized and spurred this interest. For example, the
Columbus Commons, a 9-acre park in the heart of downtown,
is a popular open space that has drawn families into the
downtown core with its robust programming schedule.
Additionally, development of the Scioto Mile has facilitated
new investments along the Scioto River.
The renewed interest in urban living in Columbus has
translated into the revitalization of several of Columbus’s
core neighborhoods. Short North, which has received
significant investment, is a prime example of a core
neighborhood that has experienced a rebirth. With a bustling
arts district, Short North has become one of the most vibrant
neighborhoods in Columbus, including a sizable residential
population in addition to a multitude of options for shopping,
dining, and leisure.
Photo: Wikimedia Photo: Columbus Parks and RecreationPhoto: Wikimedia

HR&A Advisors, Inc. Columbus Incentives Policy Evaluation | 4
The city’s population growth is emblematic of its success among Midwestern cities.
9.4%
7.3%
6.0%
11.1%
5.1%4.3%
1.6%1.3% 1.2%
9.7%
4.8%4.2%
0.0%
2.0%
4.0%
6.0%
8.0%
10.0%
12.0%
2000-2010 2010-2016 2016-2021
Columbus Columbus MSA Ohio United States
Population Trends & Projections
With a population of 860,000 as of 2016, Columbus has added more than 140,000 residents since 2000, far
outpacing the population growth rate in the State of Ohio. Additionally, within the past six years, the City of Columbus
has seen faster growth than the overall Columbus MSA, indicating renewed demand for urban living.
Source: U.S. Census, ESRI
City of Columbus &
Columbus MSA

HR&A Advisors, Inc. Columbus Incentives Policy Evaluation |5
Though Columbus has seen strong job growth in the past
decade, adding approximately 38,000 jobs between
2004 and 2014, real household income growth has
lagged behind. Real household incomes fell on an inflation
adjusted basis during the great-recession and have yet to
recover to their 2008 levels. That said, there have been
noticeable gains in the past two years.
Moreover, though it has attracted some residential
investment, Columbus has failed to attract significant
downtown commercial investment relative to its
Midwestern peers. According to CRBE’s 2015 report
“Resurgence in Midwest Secondary Markets,” Columbus had
only $250 million worth of commercial real estate under
construction in its downtown, compared to more than
$1,250 million for Indianapolis, $1,100 million for
Cleveland, and $800 million for Cincinnati.
Additionally, though some neighborhoods have seen
significant recent revitalization, others still struggle with
realizing new investment. The Columbus MSA is ranked as
the 5th most segregated large metro area by income
according to the Martin Prosperity Institute. This indicates
that there is more that can be done to ensure that economic
prosperity in Columbus is shared by all.
Despite significant progress, there are still several areas where Columbus is
experiencing challenges that threaten its overall prosperity.
Source: U.S. Census, CRBE, Martin Prosperity Institute, ESRI

HR&A Advisors, Inc. Columbus Incentives Policy Evaluation | 6
This study assessed how Columbus can best utilize its incentive portfolio to
realize community and development objectives and to remain competitive.
How effective have incentives been in supporting neighborhood revitalization to date?
Residential
How competitive are Columbus’s commercial incentives in a regional and national context?
Commercial
How can Columbus support inclusive growth across neighborhoods, and what should the role of
incentives be in that process?
How can the portfolio best support achievement of the City’s economic objectives?
Columbus’s success raises important questions about both the role of the City’s incentive policies in continuing to support
investment and unlocking opportunities to deepen and broaden revitalization across the City. With that in mind, the City
developed a series of four key questions to be explored further for both its residential- and commercial-focused incentives.
Photo: Wikimedia Photo: WikimediaPhoto: VSI Photo: ODSA

HR&A Advisors, Inc. Columbus Incentives Policy Evaluation | 7
This study proceeded across a five-stage process to lead to affirmative
recommendations for the City.
Stage 1 Existing Data Review & Project Kickoff
The HR&A team reviewed existing policy documents and analyzed incentive data to assess the contours of the
City’s incentive deployment in recent years. We convened a meeting of the Advisory Committee, comprised of
local experts in the fields of real estate, community and economic development, to confirm study objectives
and align on City economic and community development goals.
Stage 2 Residential & Commercial Market Scan
The team led a market study to understand market conditions citywide and in four neighborhoods selected by
the City for more detailed analysis: Hilltop, Linden, the East Side, and Short North.
Stage 3 Neighborhood-Based Incentive Analysis
HR&A analyzed the use and impact of residential abatements in the four neighborhoods to date, and created
a series of pro formas to demonstrate the role of the incentives in driving the financial feasibility of
prototypical projects.
Stage 4 Benchmarking of Office & Industrial Incentives
HR&A reviewed the commercial office and industrial incentive portfolios of three neighboring municipalities
and three national peers, and interviewed leaders from these cities to understand their approach to incentive
deployment and derive best practices.
Stage 5 Incentive Policy Recommendations
HR&A synthesized the findings from the analysis to offer recommendations for re-positioning Columbus’s
incentive portfolio in order to better align its incentive offerings with community and development goals.

HR&A Advisors, Inc. Columbus Incentives Policy Evaluation |8
II. Overview: Incentive Toolkit
& Policy Goals

HR&A Advisors, Inc. Columbus Incentives Policy Evaluation | 9
The City has a toolkit of incentives that it deploys across
Columbus, utilizing three broad mechanisms:
• Property tax incentives: Incentives for real estate
investments that reduce the property taxes that owners
otherwise would owe on new investments;
• Performance-based incentives: Incentives for
businesses to relocate to or expand within Columbus,
typically structured as either cash payments or tax
credits; and
• Property tax redirection: Incentives for real estate
investments that redirect incremental property tax
revenues to fund private improvements with public
benefits.
The programs seek to achieve three core objectives, each
of which is color-coded with the incentive programs below:
• Support property value growth through capital
investments that produce high-quality residential,
commercial office, and industrial real estate;
• Create jobs by facilitating business attraction and
retention; and
• Enable inclusive economic growth and vibrant
neighborhoods across the City.
This study is focused on evaluating the City’s property tax abatements and
performance-based incentives.
TIF
Property Tax
Incentive
Performance-
Based
Incentives
Downtown Office
IncentiveJobs Growth Incentive
Residential CRA
Job Creation Tax Credit
Enterprise Zone Commercial CRA
Property Tax
Redirection

HR&A Advisors, Inc. Columbus Incentives Policy Evaluation | 10
Each program has a distinct structure reflecting its purpose.
Property Tax Incentives
• Enterprise Zone (EZ): Negotiated property tax abatement of up to 75% on incremental value of commercial and
industrial improvements for up to 10 years. For rates above 75% and terms above 10 years, School Board permission is
required.
• Commercial CRA (C-CRA): Negotiated property tax abatement of up to 100% on incremental value of commercial and
industrial improvements for up to 15 years. For rates above 50%, school Board permission is required.
• Residential CRA (R-CRA): As-of-right 100% property tax abatement on incremental value of residential improvements
for up to 15 yrs.
Performance-Based Incentives
• Downtown Office Incentive (DOI): Negotiated incentive that offers cash payment equal to 50% of local income tax
withholding for eligible new employees for up to 8 years. Reserved for firms Downtown.
• Jobs Growth Incentive (JGI): Negotiated incentive that offers cash payment equal to 25% of local income tax
withholding for eligible new employees, typically for 5 years. Reserved for firms outside Downtown.
• Job Creation Tax Credit (JCTC): Negotiated incentive that offers non-reimbursable credit against firms’ net profit tax
equivalent to a set percentage of local income tax withholding for eligible new employees.
Property Tax Redirection
• TIF: A 30-year project based tax increment financing mechanism.

HR&A Advisors, Inc. Columbus Incentives Policy Evaluation | 11
Columbus’s incentive portfolio can be evaluated in light of its broader
community and development goals and objectives.
Columbus’s key goals
Regional economic engine
Anchor of competitive region with diversified
economy.
Equitable access to opportunity
Inclusive economic growth built on quality jobs and
workforce development.
Revitalized neighborhoods
Vibrant mixed-income neighborhoods that include
a range of housing options and quality of life
amenities.
Strong employment hubs
Vibrant employment centers and industrial hubs
offering residents access to quality jobs.
Downtown powerhouse
Thriving 24-hour downtown that is a commercial,
residential, and cultural center.
Sustainable Growth
Urban development and density concentrated in
existing areas well-served by infrastructure.
Columbus has created a thoughtful framework for
regional and City economic development that aligns
with the region’s relative strengths and challenges.
To further understand the City’s goals, HR&A reviewed
three key documents and initiatives:
• Columbus 2020, an ongoing initiative launched in
2010 with the release of a Comprehensive
Economic Development Strategy to enhance the
Columbus region’s economic competitiveness;
• Columbus Downtown Plan, a strategic plan that
offers an overall vision and implementation
recommendations for Downtown Columbus,
leveraging previous planning efforts;
• The Fiscal Year 2017 Proposed City Budget.
Based on our review, HR&A synthesized a series of
economic development goals, which were then
reviewed and confirmed with the study’s Advisory
Committee and City staff.

HR&A Advisors, Inc. Columbus Incentives Policy Evaluation | 12
Development Goals Incentives Alignment/Opportunity
Regional economic
engine
DOI, JGI, JCTC,
C-CRA, EZ
Alignment
The City’s performance-based incentives (DOI, JGI, JCTC) help new or
expanding firms grow jobs in the region. C-CRA and EZ promote capital
investments in quality office and industrial space.
Revitalized
neighborhoods
R-CRA, C-CRA,
EZ
Opportunity to strengthen alignment
R-CRA supports the creation of new or upgraded housing in
neighborhoods. C-CRA and EZ help modernize office and industrial space
in distressed neighborhoods. Nonetheless, there remains additional
opportunity to utilize existing incentives programs to ensure a greater
distribution of revitalization across neighborhoods.
Equitable access to
opportunity
JCTC, JGI, EZ Opportunity to strengthen alignment
While JGI and JCTC have brought a range of jobs into Columbus,
complementing the high-wage jobs associated with DOI, the opportunity
exists to support higher wages and greater workforce development for
jobs incentivized under Columbus’s programs.
Columbus’s development goals should be used as a lens through which to
evaluate the success of its residential and commercial incentive policies (1/2).
To ensure the efficacy of Columbus’s incentives, it is important to understand how its existing offerings align with
stated economic development goals, as well as where there may be opportunities for enhancement. Below, we summarize
which incentive programs directly support economic and community development goals and identify where there are
opportunities to strengthen the alignment between the goals and the existing incentive portfolio.

HR&A Advisors, Inc. Columbus Incentives Policy Evaluation | 13
Development Goals Incentives Alignment/Opportunity
Strong employment
hubs
DOI, JGI, JCTC,
C-CRA, EZ
Alignment
The City’s performance-based incentives (DOI, JGI, JCTC) encourage firms
to locate such that they support strong jobs hubs. C-CRA and EZ promote
quality commercial office and industrial space in these locations.
Downtown
powerhouse
DOI, C-CRA Alignment
DOI helps lower costs for firms locating Downtown, while C-CRA helps
overcome higher development costs associated with the delivery of
Downtown commercial and residential product.
Sustainable
growth
N/A Opportunity to strengthen alignment
Today, no incentives are targeted towards creating sustainable growth,
with the exception of a new Property-Assessed Clean Energy (PACE)
program being piloted by the Port Authority.
Columbus’s development goals should be used as a lens through which to
evaluate the success of its residential and commercial incentive policies (2/2).

HR&A Advisors, Inc. Columbus Incentives Policy Evaluation |14
III. Residential Abatement
Analysis & Recommendations

HR&A Advisors, Inc. Columbus Incentives Policy Evaluation | 15
Using two guiding questions as a framework, we assessed how effective the
City’s residential incentives are at meeting community and development goals.
1.
Market Scan
2.
Impact Analysis
3.
Categorization & Pro Formas
4.
Recommendations
The team conducted a
high-level market scan
using public and
proprietary data for four
target neighborhoods
selected by the City, in
order to represent the
variation in market
conditions that exists across
Columbus. This analysis
considered demographic,
economic, and real estate
market data.
Utilizing data furnished by
the City and Franklin
County, HR&A analyzed:
1. The use of Residential
CRA in the four target
neighborhoods between
2011 and 2016; and
2. The impact of those
incentives on land value,
building value, and
development activity
throughout the
neighborhoods.
Based on the market scan
and impact analysis, HR&A
examined each of the four
neighborhoods and
developed a series of
residential development pro
formas to assess how the
incentives affect the
financial feasibility of
development projects
occurring within each
neighborhood typology.
Based on the findings from
the analysis and the City’s
development goals, HR&A
produced
recommendations to better
align the City’s incentive
portfolio with its broader
community and
development objectives.
How effective have incentives been in
supporting neighborhood revitalization
to date?
How can Columbus support inclusive
growth across neighborhoods, and what
is the role of incentives in that process?
HR&A Advisors, Inc. Columbus Incentives Policy Evaluation | 16
Effectiveness in Supporting Neighborhood Revitalization
Photo: Wikimedia
HR&A Advisors, Inc. Columbus Incentives Policy Evaluation | 17
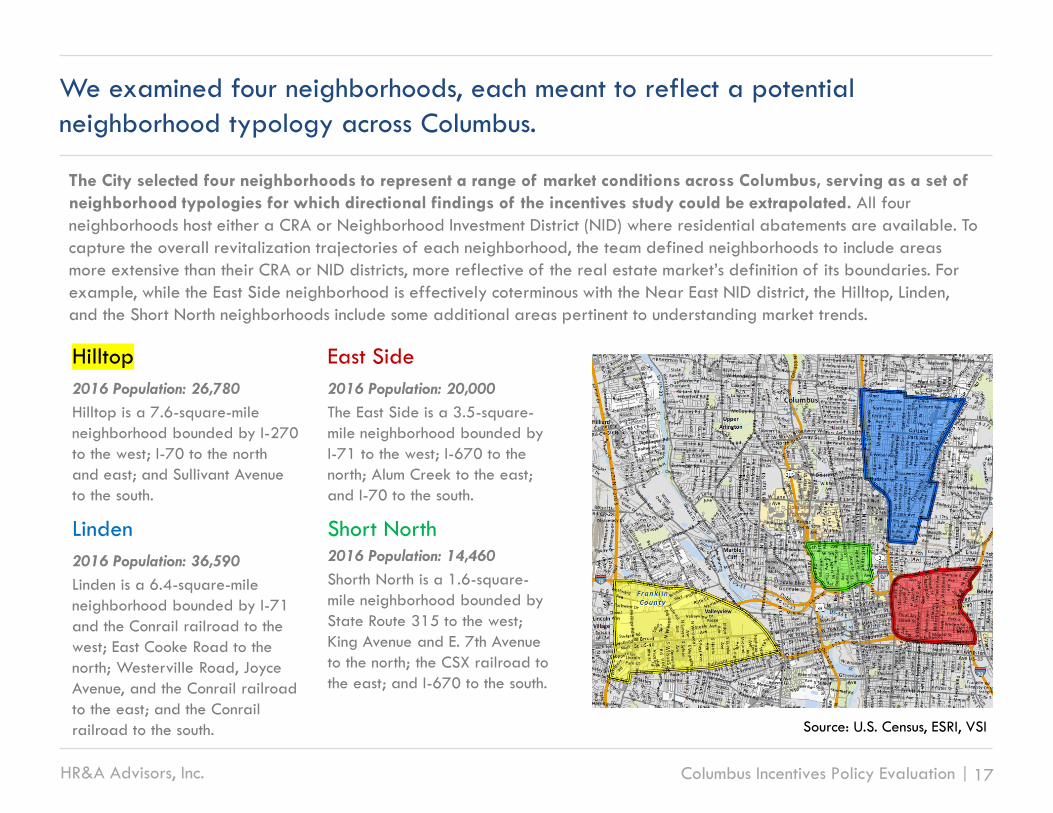
Hilltop
2016 Population: 26,780
Hilltop is a 7.6-square-mile
neighborhood bounded by I-270
to the west; I-70 to the north
and east; and Sullivant Avenue
to the south.
Linden
2016 Population: 36,590
Linden is a 6.4-square-mile
neighborhood bounded by I-71
and the Conrail railroad to the
west; East Cooke Road to the
north; Westerville Road, Joyce
Avenue, and the Conrail railroad
to the east; and the Conrail
railroad to the south.
East Side
2016 Population: 20,000
The East Side is a 3.5-square-
mile neighborhood bounded by
I-71 to the west; I-670 to the
north; Alum Creek to the east;
and I-70 to the south.
Short North2016 Population: 14,460
Shorth North is a 1.6-square-
mile neighborhood bounded by
State Route 315 to the west;
King Avenue and E. 7th Avenue
to the north; the CSX railroad to
the east; and I-670 to the south.
We examined four neighborhoods, each meant to reflect a potential
neighborhood typology across Columbus.
Source: U.S. Census, ESRI, VSI
The City selected four neighborhoods to represent a range of market conditions across Columbus, serving as a set of
neighborhood typologies for which directional findings of the incentives study could be extrapolated. All four
neighborhoods host either a CRA or Neighborhood Investment District (NID) where residential abatements are available. To
capture the overall revitalization trajectories of each neighborhood, the team defined neighborhoods to include areas
more extensive than their CRA or NID districts, more reflective of the real estate market’s definition of its boundaries. For
example, while the East Side neighborhood is effectively coterminous with the Near East NID district, the Hilltop, Linden,
and the Short North neighborhoods include some additional areas pertinent to understanding market trends.

HR&A Advisors, Inc. Columbus Incentives Policy Evaluation | 18
These neighborhoods reflect varying demographic and socioeconomic conditions.
Hilltop Linden East Side Short North Columbus
Change in population,
2000-2016(8.5%) (5.6%) (8.3%) +22.5% +18.7%
Population with
Bachelor’s degree &
above, 2016
13% 13% 25% 69% 35%
Poverty rate 36% 33% 42% 19% 21%
The Short North stands out from the other neighborhoods
and the City of Columbus as a whole due to its strong
population growth from 2000 to 2016, population with
higher levels of educational attainment, and lower poverty
rate. The Short North’s high population growth rate
demonstrates the neighborhood’s attractiveness to new
residents, particularly well-educated professionals.
In contrast, Hilltop, Linden, and the East Side all
experienced population decreases from 2000 to 2016,
with the steepest population decline in Hilltop. Both Hilltop
and Linden have populations with lower levels of
educational attainment and above-average poverty rates.
While the East Side has the highest poverty rate among the
four neighborhoods, likely due to the presence of several
large public housing complexes, the share of its population
with a bachelor’s degree and above is almost twice that of
Hilltop and Linden.
Source: U.S. Census, ESRI, VSI

HR&A Advisors, Inc. Columbus Incentives Policy Evaluation | 19
Short North’s income growth has far outpaced that of the City and the other
neighborhoods since 2000.
$0
$10,000
$20,000
$30,000
$40,000
$50,000
$60,000
Columbus Hilltop East Side Linden Short North
2000 (Census) 2010 (Census) 2016 (Estimated)
+17.3%
Median Household Income Growth, 2000-2016
+1.0%
+28.1%
(2.7%)
+65.1%
Source: U.S. Census, ESRI, VSI
Overall, Columbus has experienced moderate growth in
median household income since 2000, with the majority
of the gains coming between 2000 and 2010. While
Hilltop, Linden, and the Short North had roughly the same
median household income levels in 2000, the Short North
has experienced tremendous income growth since then,
while the median income in Hilltop and Linden has stayed
flat or fallen. The East Side, which started from the lowest
base in 2000, experienced significant gains between 2000
and 2010, but remains well below the City average.

HR&A Advisors, Inc. Columbus Incentives Policy Evaluation | 20
Housing characteristics across the four neighborhoods also differ, with the Near
East and Short North having more relatively new and multifamily product.
Hilltop Linden East Side Short North Columbus
Share of
housing built
2000 or later
2% 2% 5% 15% 14%
Share of
housing with 5
or more units,
2015
22% 7% 32% 42% 30%
Renter rate,
201658% 52% 74% 76% 54%
Source: U.S. Census, ESRI, VSI
Compared to the other neighborhoods, Short North has a
greater share of residential structures built since 2000,
indicating that it has been a center of development activity,
notwithstanding some historical preservation limitations on
structures that can be redeveloped.
In terms of structures developed since 2000, the East
Side also has experienced some development activity,
about a third as much as the Short North, but more than
twice as much as Hilltop and Linden. In addition, the Short
North and East Side both have greater-than-average
shares of multifamily product, defined as housing with 5 or
more units, as well as higher percentages of renters.

HR&A Advisors, Inc. Columbus Incentives Policy Evaluation | 21
Housing stock differs greatly, with Linden and Hilltop dominated by 1-3 family
housing, versus the increasing prevalence of mid-rise in Short North.
Hilltop Linden East Side Short North
Hilltop is characterized by 1-3
family homes and some low-
rise apartments. Single-family
homes represent about 70% of
the housing stock, and
multifamily product (buildings
with 5 or more units) about
22%.
In recent years, Hilltop has
attracted primarily affordable
rental and homeownership
development, including Low
Income Housing Tax Credit
projects. This development has
taken the form of infill single-
family homes, low-rise rehab,
and modest owner-occupied
rehab.
The East Side has a diverse
housing stock, with a mix of
1-3 family homes and some
low- and mid-rise apartments.
While single-family homes
account for about 50% of its
housing stock, multifamily
product comprises about 32%.
In recent years, the East Side
has attracted some larger
mixed-income projects (e.g.,
Poindexter Place).
Like Hilltop, Linden primarily
has 1-3 family homes and
some low-rise apartments. It
has the highest share of single-
family homes of the studied
neighborhoods, with this
typology accounting for almost
80% of its stock, as well as the
lowest share of multifamily
product (7%).
In recent years, like Hilltop,
Linden has attracted primarily
affordable rental and
homeownership development,
including Tax Credit projects.
Of the studied neighborhoods,
Short North has the greatest
share of multifamily product
(almost 42%), located in both
low- and mid-rise buildings,
with single-family homes
comprising only about 36% of
its stock.
In recent years, development
has been focused on mid-rise
product, especially along High
Street, including both concrete
podium/stick-built and
concrete/steel typologies.
Source: U.S. Census, ESRI, VSI

HR&A Advisors, Inc. Columbus Incentives Policy Evaluation | 22
Columbus has seen substantial increases in its housing prices, both on a rental
and sale price per square foot basis.
$0.73$0.59
$0.48
$0.68
$0.89$0.87
$0.67$0.61
$0.79
$1.41
Columbus Hilltop East Side Linden Short North
2010 2017
+13% +26%+15%
+58%Median Rent Per Square Foot
All Homes, 2010-2017
+19%
$73.45
$26.44 $22.26 $22.55
$149.21
$93.93
$43.16
$74.50
$45.19
$223.26
Columbus Hilltop East Side Linden Short North
2012 2017
+28%
+63%+235%
+100%
+50%Median Sales Price Per Square Foot
All Homes, 2012-2017
Since 2010, Columbus has experienced 19.3%
growth in median rents per square foot. Rent
growth in Hilltop and Linden has lagged behind the
citywide increase, while rents in the Short North have
grown almost three times as fast as in the City. It is
important to note that these rents are for all homes in
these neighborhoods, and thus lower than rents for
new product only, as they include older and
distressed assets (the same is true for sales price
data below).
Sales prices per square foot also have increased in
all neighborhoods. However, Hilltop, Linden, and the
East Side experienced comparatively high growth
rates starting from low bases. The fact that the East
Side has seen very high sales price growth, but only
modest rent increases, suggests that investment may
be driven in part by speculation.
Sales Volume by Neighborhood 2012 2016
Hilltop 617 849
East Side 518 712
Linden 1,163 1,595
Short North 418 590
Source: Zillow.com, Redfin.com VSI

HR&A Advisors, Inc. Columbus Incentives Policy Evaluation | 23
Columbus has two residential abatement programs, Community Revitalization
Areas and Neighborhood Investment Districts, which operate similarly.
Structure Property tax abatement on incremental
value of improvements undertaken in a
designated CRA or NID zone.
Minimum
Investment
$2,500 (1-2 units)
$5,000 (3 or more units)
For NIDS, owner-occupied rehab costs must
be at least 20% of existing structure
assessed value and rental rehab costs must
be at least 50%.
RateDefault 100%, unless reduced in
authorizing ordinance
Term Rehab
<2 units: Up to 10 years
3+ units: Up to 12 years
New construction
Up to 15 years
Under Ohio statute, the City can create CRA districts to
support residential and/or commercial investment in
areas where it is not occurring. The CRA program was
first established in Ohio in 1977, and significantly
amended in 1994. To establish a district, the City conducts
a housing survey of the potential area in order to
determine that it “is one in which housing facilities or
structures of historical significance are located and new
housing construction and repair of existing facilities or
structures are discouraged.” The City then passes an
ordinance authorizing the district, defining the property
types that can receive abatements within it, and setting
the abatement rates and terms per state limits.
The City established its NID program in the early 2000s
primarily to support housing creation. Columbus
launched its first NIDs (Linden, North of Broad, South Side,
Hilltop, and South of Main) in 2002 to provide
abatements for owner-occupied and rental rehabs and
owner-occupied new construction. In 2006, the City
established two additional NIDs, Weinland Park and
Franklinton. In 2011 and 2012, Columbus expanded
abatements in Weinland Park and Franklinton to rental
new construction. In 2015, the City made this change for
all NIDs and created a new NID, North Central.

HR&A Advisors, Inc. Columbus Incentives Policy Evaluation | 24
The City’s CRA districts are differentiated by several characteristics, described
below.
Property
type(s) eligible
for abatements
• The authorizing ordinance for each district identifies whether commercial office, industrial, and/or
residential structures are eligible for abatements there, as well as whether new construction,
rehabilitation, or both are eligible.
• If the ordinance does not specify, then both new construction and rehabilitation projects for all
property classes (commercial office, industrial, and residential) are eligible for abatements in the
district.
Status as pre-
1994 CRA
• CRAs created prior to July 1994 operate differently than those created after that date. In
general, pre-1994 CRAs set fewer limitations on abatements and grant higher rates as-of-right.
• For pre-1994 CRAs, both residential and commercial abatements are automatically granted at
100% for as-of-right terms.
• For post-1994 CRAs, both residential and commercial abatements can be granted at rates below
100%. For residential abatements, rates (up to 100%) and terms (up to 15 years) are set as-of-
right for specific project types within each district. For commercial abatements, rates (up to 100%)
and terms (up to 15 years) are individually negotiated, and rates greater than 50% require
School Board approval.
• Pre-1994 CRA authorizing legislation can only be amended twice after July 1994 and still
continue operation under pre-1994 laws.
Overlap with
other economic
development
tools
• CRAs can fall within both TIF districts and Community Authority zones.
• Properties that are subject to both CRA and TIF agreements have the property taxes on their CRA-
associated improvements exempted for the CRA abatement duration and pay the property taxes
on their TIF-associated improvements into the relevant TIF fund for the TIF duration.

HR&A Advisors, Inc. Columbus Incentives Policy Evaluation | 25
113
213
23
3 6 2
35
3
73
48
111
73
134
Of the 639 residential abatements awarded 2011-2015, most projects have
fallen within three districts: AC Humko, Short North, and Weinland Park.
Residential Abatements Awarded By Area, 2011-2015
Some CRA districts cover neighborhoods, while others
target specific challenged sites where CRA designation is
deemed necessary to catalyze revitalization. An example
of a project-based district, the AC Humko district was
created to enable the redevelopment of the eponymous
former margarine factory site into the Harrison West
development. In addition, some project-based districts
evolve into neighborhood-based districts over time, as a
project spurs revitalization and development becomes more
broadly viable, such as has occurred in Fifth by Northwest.
By their nature, the NIDs always cover neighborhoods,
although some have more expansive boundaries than
others. For example, the Near East NID covers the entirety
of the East Side, while the Linden NID is focused on South
Linden, the most challenged part of the neighborhood.
Tracking of abatements awarded is by parcel, so a project that encompasses multiple parcels can have multiple parcel-level abatements.
Source: City of Columbus.
Key:
Project-Based
Project-Based Transformed Into Neighborhood-Based
Neighborhood-Based

HR&A Advisors, Inc. Columbus Incentives Policy Evaluation | 26
0
20
40
60
80
100
120
140
160
New Construction Rehab
Across all abatements, the majority (70%) have involved new construction,
although there have been a modest number of rehabs.
New Construction vs. Rehab by Area, 2011-2015
The relative frequency of new construction versus rehab
depends on two factors: 1) the existing housing stock, and
especially the presence of properties that are attractive
candidates for rehab, potentially combined with historic
preservation requirements; and 2) the development
economics of ground-up new construction. The relatively
higher shares of new construction in the Short North and
Fifth by Northwest districts represent areas where higher
rents can likely be achieved, while those in AC Humko and
Petzinger Road reflect lack of existing stock for rehab. The
NIDs generally have experienced a mix of new construction
and rehab, likely due to the fact that until recently, non-
owner-occupied new construction was not eligible to receive
an abatement.
Source: City of Columbus

HR&A Advisors, Inc. Columbus Incentives Policy Evaluation | 27
While use of abatements differ greatly by neighborhood, overall 56% of
abatements supported market-rate, with the balance supporting affordable.
Breakdown of Market-Rate vs. Affordable Deals, 2011-2015
MR HO MR Rental Aff. HO Aff. Rental
Most districts tended to have a focus on either affordable
or market-rate abatements. For example, market-rate
abatements constituted the vast majority of deals in AC
Humko, Brewers’ District, Fifth by Northwest, and the Short
North. However, a small number of districts, concentrated
among the NIDs, included a mix of market-rate and
affordable abatements, as evidenced by Weinland Park,
Southside, and to a lesser extent, the Near East. As
development economics continue to improve in the Near
East, it is likely to see a growing share of market-rate
abatements. The majority of deals in Hilltop and Linden
were affordable abatements.
Source: City of Columbus

HR&A Advisors, Inc. Columbus Incentives Policy Evaluation | 28
Neighborhood Context Analysis | Methodology
To consider the impact that the availability of
abatements had on the market value of properties in
Columbus, HR&A conducted a neighborhood context
analysis.
• For the four neighborhoods under study (Hilltop, Linden,
Near East, and Short North), HR&A examined changes
in value for parcels with and without abatements in
place.
• For this analysis, HR&A relied on Franklin County
assessment data from January 2011 and 2016, cross-
checked against City data.
• HR&A defined the districts using the most recent parcel
list from the relevant authorizing CRA or NID ordinance.
In some cases, the district boundaries are different from
those used to define the neighborhoods for the
residential market scan, where the focus was on
evaluating broader neighborhood revitalization trends.
• HR&A selected 2011 as the start year for this analysis
for two reasons. First, it was the year of the first
citywide reappraisal following the Great Recession.
Second, because the minimum abatement term is 10
years and the oldest abatement districts under study
(the Hilltop, Linden, and Near East NIDs) were created
in 2002, it enabled identification of all parcels that
received abatements, as abatements granted in the
first year of the program would not start expiring until
2012. HR&A selected 2016 as the end year because it
was the most recent assessment data available at the
time.
• Parcels with abatements were defined to include any
parcels with land or building value in the exempt
category in 2011, 2016, or both years. Parcels include
those added since 2011 due to subdivision. For the
purpose of this analysis, parcels classified in the 600
range (600-699) under state land use codes were
considered not to have abatements, as these codes
indicate public or nonprofit assets that do not have to
pay property taxes because they are exempt by law.
• In addition to parcels with CRA abatements, the Short
North included a number of parcels subject to Tax
Increment Financing agreements. These TIF agreements
were regarded as separate from abatements, because
they require the owner to pay the same amount of
impacted property taxes, which are redirected for
specific public purposes. Abatements do not require the
owner to pay the impacted property taxes.

HR&A Advisors, Inc. Columbus Incentives Policy Evaluation | 29
Abatement levels | The Near East Side has the largest number of parcels with
abatements, and only 6% of parcels are abated in the Short North.
Hilltop Linden Near East Short North
Parcels with abatement 2% 1% 2% 6%
Total parcels in neighborhood 4,800* 8,421* 9,229* 1,836
Parcels with abatement 88 87 203 119
Parcels without abatement 4,712 8,334 9,026 1,706
*Parcel count excludes 5 parcels in Hilltop with missing data, 13 in Linden, and 4 in Near East.
Abatement LevelsBased on 2011 and 2016 Assessor’s data
The intensity of abatement use differs between the
neighborhoods. The Near East, which represents the largest
district in terms of total parcels included within its
boundaries and thus eligible for abatements, also contains
the largest number of parcels with abatements. In contrast,
the Short North is the smallest district in terms of total
parcels eligible for abatements. While it has the largest
share of parcels with abatements among the four
neighborhoods, parcels with abatements still account for
only 6% of total parcels.
Hilltop and Linden both have low absolute numbers and
shares of parcels with abatements. This is notwithstanding
the fact that these two NID districts have been in place
since 2002, compared to 2009 for the Short North CRA.
The differences in abatement use between the
neighborhoods reflect varying levels of market demand to
realize capital improvements.

HR&A Advisors, Inc. Columbus Incentives Policy Evaluation | 30
Total value | For all neighborhoods, parcels with abatements are more likely
to increase in total assessed value than parcels without.
Hilltop Linden Near East Short North
Parcels with abatement 2% 1% 2% 6%
Percentage of parcels with total value
increase, 2011-16 11% 10% 33% 86%
Parcels with abatement 23% 48% 53% 100%
Parcels without abatement 11% 10% 32% 86%
Total Value IncreaseBased on 2011 and 2016 Assessor’s data
Increases in total value from 2011 to 2016 for parcels with
abatements likely reflect both the capital improvements
facilitated by the abatement, which increased building
value, and land appreciation associated with the area
becoming more attractive through building and
infrastructure upgrades.
In the Short North, the very high percentage of parcels
experiencing total value increases, including both parcels
with abatements (100%) and parcels without abatements
(86%), indicates market strength in recent years, suggesting
that investors have become confident making capital
upgrades and land is appreciating. In contrast, the
proportion of parcels experiencing total value increases in
Hilltop and Linden are much lower, suggesting that there
have been limited capital investments in building upgrades
and low overall appreciation in these neighborhoods.

HR&A Advisors, Inc. Columbus Incentives Policy Evaluation | 31
Land value | In the Near East, parcels with abatements have experienced very
high land appreciation, while those in Hilltop and Linden have declined less.
Hilltop Linden Near East Short North
Parcels with abatement 2% 1% 2% 6%
Percent change in land value -18% -27% 13% 60%
Parcels with abatement -11% -11% 183% 186%
Parcels without abatement -18% -27% 9% 56%
In the Near East and Short North, where overall land is
appreciating, parcels with abatements help to support and
enhance land value increases. The capital improvements
being made on these parcels serve to upgrade the area
and make the underlying land more attractive, suggesting
that “a rising tide lifts all boats.”
In Hilltop and Linden, where land values are falling, parcels
with abatements serve to mitigate the decrease in valuing
being felt throughout the neighborhoods. The capital
improvements being made on these properties serve as a
backstop against more severe decline.
Change in Land ValueBased on 2011 and 2016 Assessor’s data

HR&A Advisors, Inc. Columbus Incentives Policy Evaluation | 32
Building value | Parcels with abatements have experienced high growth in
building values, reflecting their role in fostering rehab and new construction.
Hilltop Linden Near East Short North
Parcels with abatement 2% 1% 2% 6%
Percent change in building value -24% -21% 32% 18%
Parcels with abatement -16% 4% 238% 820%
Parcels without abatement -24% -22% 26% 3%
Change in Building ValueBased on 2011 and 2016 Assessor’s data
In the Near East and the Short North, parcels with
abatements have experienced a larger total building value
increase than parcels without, reflecting incentive-facilitated
capital improvements. In Linden, the same is true, although
the building value increase has been more modest. In
contrast, parcels with abatements in Hilltop have not
experienced a building value increase, but rather a lesser
building value decline, due to three factors:
• Demolitions, where an older building removed for
redevelopment has not yet been replaced;
• Conversions to affordable housing, where an older
market-rate building has been redeveloped as new or
rehabbed affordable housing, which is assessed by law
at a lower rate;
• Capital improvements insufficient to offset
depreciation, including parcels where capital
improvements made years earlier have been insufficient
to offset decreases associated with the building aging
and/or overall neighborhood declining. This outcome is
especially likely for owner-occupied and, to some
degree, rental properties that experienced very light
rehab.

HR&A Advisors, Inc. Columbus Incentives Policy Evaluation | 33
The neighborhood context analysis suggests that residential abatements play
different roles across various neighborhood types.
Persistently Disinvested Ready for Revitalization Market-Ready
Linden, Hilltop Near East Short North
• Continued population
decline and disinvestment.
• Rents and home values far
below cost to support
market-rate development.
• Attracting some
reinvestment and at a
potential “tipping point.”
• Rents and home values
below or approaching
market-rate threshold.
• Steadily attracting
reinvestment.
• Rents and home values
above cost needed to
support market-rate
development.Cha
ract
erist
ics
Typolo
gy
Role
of
Abate
ment
s
Act as a backstop against
further value declines by
supporting targeted capital
improvements.
Help secure an ongoing flow of
investment and “tip the
balance” in the neighborhood.
Promote continued investment in
the neighborhood.
The neighborhood context analysis supported the identification of three broad neighborhood typologies, summarized
below. These typologies reflect different demographic, residential market, and reinvestment conditions.

HR&A Advisors, Inc. Columbus Incentives Policy Evaluation | 34
There are a multitude of ways in which the growth of market-ready
neighborhoods may benefit the overall city.
A healthy supply of market-ready neighborhoods benefits
the overall City of Columbus in several ways, including:
• Citywide brand-building. The presence of distinctive,
compelling neighborhoods helps to enhance the City’s
overall brand. These neighborhoods help present
Columbus as an attractive, engaging place to live,
work, and visit.
• New retail and entertainment opportunities, serving
both residents and visitors. In market-ready
neighborhoods, the presence of higher-income residents
tends to attract new retail and entertainment offerings.
Since use of these facilities is not confined to the people
within them, Columbus as a whole benefits from these
investments. In addition, market-ready neighborhoods
offering a variety of retail and entertainment options
can bring tourists to the City, who in turn create new
economic activity.
• Attraction and retention of young professionals.
Young professionals are interested in the dynamic live-
work-play environments available in market-ready
neighborhoods, so a supply of these neighborhoods is
necessary to attract them. Young professionals support
the City’s economy through both their discretionary
spending and role in drawing companies seeking a
robust talent pipeline.
• Spread of revitalization to adjoining neighborhoods.
The revitalization of one neighborhood can spur that of
adjoining neighborhoods, helping to catalyze
investment, encourage economic activity, and improve
property values.
Source: Wikimedia

HR&A Advisors, Inc. Columbus Incentives Policy Evaluation | 35
The Role of Incentives in Driving
Development Feasibility
Photo: Wikimedia

HR&A Advisors, Inc. Columbus Incentives Policy Evaluation | 36
Development is feasible when costs, including an
appropriate developer return, are equal to the value that
can be realized from the project over time. A financial gap
occurs when development costs are greater than market
value, meaning that the project does not generate sufficient
revenue to justify undertaking it. Abatements can help close
this financial gap by decreasing the ongoing operating cost
of the project, which improves project cash flow.
Gap
MARKET
VALUE
Capitalized value of
cash flow after debt
service
DEVELOPMENT
COSTS
Financing
Hard costs
Soft costs
Land
Return
To better understand the role that residential abatements play, HR&A
examined development feasibility for rental product in the four neighborhoods.
For the purpose of this analysis, we assessed three
key questions:
1. Is there a financial gap, and if so how much?
2. How does the abatement compare relative
to the gap?
3. How much would the abatement need to
change to better fit the gap?
AbatementPotential role of
abatement as gap
filler

HR&A Advisors, Inc. Columbus Incentives Policy Evaluation | 37
We evaluated development feasibility in the neighborhoods using market-rate
rental product types.
• For each submarket, HR&A developed residential
market assumptions for modeling purposes, including
rents and exit cap rates. We also identified
development cost assumptions, including land price and
construction costs, through review of relevant
comparables and developer interviews.
• HR&A examined low-rise (4 stories and below) and
mid-rise (5 to 10 stories) rental housing typologies. To
provide a consistent basis for comparison across the
four neighborhoods, we tested market-rate rental
product, even though this product type currently is not
being developed in all neighborhoods. Findings should
not be read as to suggest that the City should
incentivize market-rate development in all submarkets,
as investment in affordable housing may be more
effective in some neighborhoods and provide a better
return on City investment.
• For each neighborhood, HR&A tested the ability of
development to produce a threshold developer return
under current market conditions, assumed to be an
internal rate of return of 15%. For markets where
market-rate development is not feasible today, the
analysis identified the financial gap that must be filled
to make development feasible.
• HR&A then evaluated the role of residential
abatements in filling that gap, assuming the maximum
possible term of 15 years under state statute, even for
rehab projects, where the term is currently 12 years.
• For neighborhoods where development is not feasible
even with a 15-year abatement, HR&A demonstrated
the rent increase that would be necessary on top of the
abatement to render market-rate development
feasible.
HR&A developed a series of sample projects for each neighborhood in order to quantify order-of-magnitude
differences in development feasibility between the four submarkets. As previously described, the submarkets studied
reflect the variations that exist in Columbus’s residential market conditions and affect development feasibility for particular
types of rental product. This exercise was intended to illustrate and quantify these differences at a high level and provide
directional guidance for incentive policy refinement; findings may not be consistent for every development at a project by
project level. The size of the financial gap faced by individual projects in the neighborhoods is likely to vary, depending on
factors that drive higher costs or increase the value that can be realized, each which may also vary from project to project.

HR&A Advisors, Inc. Columbus Incentives Policy Evaluation | 38
HR&A studied the feasibility of four conceptual market-rate product types
across the four neighborhoods.
Townhomes /
Low-Rise Apts.,
Wood Frame
Townhomes /
Low-Rise Apts.,
Wood Frame
Mid-Rise,
Wood Frame w/
Concrete Podium
Mid-Rise,
Concrete & Steel
New Construction Rehab New Construction New Construction
Surface Parking Surface Parking Surface Parking Structured Parking
Hilltop √ √
Linden √ √
East Side √ √ √
Short North √ √
The four conceptual product types were developed to be
representative of the general development types that are
likely in these neighborhoods in order to provide a high-
level assessment of development feasibility with and
without abatements in place. Both rehab and new
construction projects were tested. New mid-rise construction
is currently occurring only in the Short North and very
limited areas of the Near East. For the Short North, mid-rise
concrete and steel product with structured parking is
reflective of recent development along the High Street
corridor, while the mid-rise wood frame with concrete
podium and low-rise typologies are more typical of what is
being developed in the rest of the neighborhood.

HR&A Advisors, Inc. Columbus Incentives Policy Evaluation | 39
Development Costs
(Per NSF of Dev.)
Townhomes/Low-Rise Apts., Wood - New Construction $205
Townhomes/Low-Rise Apts., Wood - Rehab $164
Mid-Rise, Wood Frame w/ Podium - New Construction $233
Mid-Rise, Concrete & Steel - New Construction $296
Rents (Per NSF/Month) Cap Rates
Townhomes / Low-
Rise Apts., Wood
New Construction
Townhomes / Low-
Rise Apts., Wood
Rehab
Mid-Rise, Wood
Frame w/ Podium
New Construction
Mid-Rise, Concrete
& Steel
New Construction
Hilltop $0.80 $0.72 8.5%
Linden $0.75 $0.68 8.5%
East Side $1.10 $0.99 $1.15 7.5%
Short North $2.05 $2.35 5.5%
We developed residential market and cost assumptions through local
comparables and developer interviews.
Market
Assumptions
Cost Assumptions
Target Developer Leveraged Internal Rate of Return: 15%
Abatement Terms: 10, 12, and 15 years at 100%
Land Costs
(Per GSF of Dev.)
Hilltop $8
Linden $6
East Side $15
Short North (rest of nbhd.) $30
Short North (High Street) $38
HR&A estimated rents based on comparable projects to
represent what could be realized for market-rate
development in the neighborhoods. Land prices were
estimated based on recent transactions and likely density
of new development. Hard construction costs for rehab
were assumed to be a fraction of hard construction costs for
new development. HR&A conducted extensive developer
interviews to verify assumptions.
NSF = net square foot; GSF = gross square foot

HR&A Advisors, Inc. Columbus Incentives Policy Evaluation | 40
In Linden and Hilltop, the abatement cannot fill the gap on its own for market-
rate development, and rents would have to rise significantly to close it.
Townhome/
Low-Rise, Wood
New Construction
Townhome/
Low-Rise, Wood
Rehab
Financial gap (absent abatement), per GSF -$90 -$70
Capitalized value of 15-yr. abatement, per GSF +$20 +$15
Current incentive as a percentage of gap 25% 25%
Subsidy required to fill gap, per GSF +$70 +$55
Rent required to fill gap, per NSF $1.60 $1.30
Rent increase relative to current rent 100% 80%
Linden and Hilltop
For this analysis, Hilltop and Linden have been combined
because of similar development economics, with slightly
higher rents in Hilltop offset by higher land costs. For both,
there is a significant gap for market-rate low-rise new
construction and rehab. The gap is lower for rehab than
new construction because construction costs are lower, and it
is associated with only a modest decrement in rents.
The value of the 15-year abatement is not sufficient to
offset the development gap on its own. Translating the gap
and abatement into unit terms, assuming a 1,000 GSF unit
for the low-rise new construction product, the financing gap
is $90,000 and the abatement provides a benefit of
$20,000 per unit.
Even with the abatement in place, rents would have to rise
substantially to make the difference, by 100% for new
construction and 80% for rehab. For the sake of
comparison, overall rents in the Short North, one of the most
rapidly appreciating areas in the City, increased by 60%
from 2010 to 2017.
These findings are not unexpected, given that there is
minimal market-rate low-rise development occurring in
these neighborhoods, with affordable product accounting
for the vast majority of what is being delivered.
Nonetheless, findings provide a useful comparison to the
other neighborhoods under study.

HR&A Advisors, Inc. Columbus Incentives Policy Evaluation | 41
Townhome/
Low-Rise, Wood
New Construction
Townhome/
Low-Rise, Wood
Rehab
Midrise, Wood
Frame w/ Concrete
Podium
New Construction
Financial gap (absent abatement), per GSF -$75 -$55 -$90
Capitalized value of 15-yr. abatement, per GSF +$25 $20 +$25
Current incentive as a percentage of gap 35% 35% 30%
Subsidy required to fill gap, per GSF +$50 +$35 +$65
Rent required to fill gap, per NSF $1.55 $1.25 $1.70
Rent increase relative to current rent 40% 25% 50%
In Near East, the abatement also cannot fill the gap on its own for market-rate
development, but rents would have to rise to a lesser degree to close it.
In the Near East, a development feasibility gap exists for
market-rate low-rise and mid-rise new construction, as
well as low-rise rehab.
As in Hilltop and Linden, the value of the 15-year
abatement is not sufficient to offset the development gap in
the Near East. However, due to higher market values, the
value of the abatement is relatively greater in the Near
East. Higher rents also are better able to offset
development costs.
For these reasons, with the 15-year abatement in place,
rents have to rise by a lower percentage to make
development feasible in the Near East than in Hilltop and
Linden. Given that the Near East is favorably situated for
further development, it may be possible for the market to
contribute to a closing of the development gap over time.
To give an indication of the rent increases possible in
market-ready neighborhoods, the Short North experienced
a 58% increase in overall rent from 2010 to 2017.
Near East

HR&A Advisors, Inc. Columbus Incentives Policy Evaluation | 42
In Short North, the abatement is not required to make some market-rate
products feasible, and has the capacity to be reduced for others.
Midrise, Wood Frame
w/ Concrete Podium
New Construction
Mid-Rise, Concrete &
Steel
New Construction‘
Financial gap (absent abatement), per GSF No gap -$27
Capitalized value of 15-yr. abatement, per GSF +$27 +$34
Current incentive as a percentage of gap NA 127%
Abatement decrease to right-size incentive, per GSF -$27 -$7
Abatement decrease relative to current incentive -100% -21%
For the Short North, the mid-rise concrete and steel
typology with structured parking is reflective of recent
product being developed along the High Street corridor.
This typology involves higher construction costs than the mid-
rise wood-frame and concrete podium typology with
surface parking, the latter of which is more typical of
development in the rest of the neighborhood.
Based on the financial analysis, there is no financial gap
for the mid-rise wood-frame and concrete podium with
surface parking product. This suggests an opportunity to
significantly reduce abatements without hindering
development feasibility for this product type. For concrete
and steel mid-rise product with structured parking, a
financial gap exists due to higher construction costs that
may not be fully offset by higher rents. This suggests an
opportunity to right-size the abatement through a more
modest reduction.
Decreases in abatement levels may impact projects in two
ways: reducing developer returns and/or reducing land
values, with the latter being a likely outcome in the long
term. In the near term, changes to incentives may slow the
pace of development given the “stickiness” of land prices,
wherein landowners may be reluctant to adjust prices. Any
adjustments to abatements therefore should be both
carefully considered and clearly communicated to all
parties in advance of changes taking effect.
Short North

HR&A Advisors, Inc. Columbus Incentives Policy Evaluation | 43
The feasibility analysis suggest that abatements have varying impacts on
development feasibility across neighborhoods.
• Gap exists for low-rise and
mid-rise new construction.
• Versus Hilltop & Linden,
incentive performs better in
covering gap, so less additional
subsidy is needed to make
market rate development
feasible.
• Gap does not exist for mid-
rise wood frame with concrete
podium and surface parking
new construction.
• Gap does exist for mid-rise
concrete and steel with
structured parking, and is
filled by abatement.
Abate
ment
Impact
s
Polic
y
Implic
ations Continue abatement use and
explore use of additional subsidy
to catalyze development,
especially transformative larger-
scale projects.
Right-size incentive and/or
reposition them to support high
quality product that delivers
public benefits.
In Hilltop and Linden, even with abatements in place, significant barriers remain to market-rate development. In the Near
East, providing additional subsidy could catalyze market-rate development. In the Short North, subsidy could be reduced.
Persistently Disinvested Ready for Revitalization Market-Ready
Linden, Hilltop Near East Short North
Typolo
gy
• Large gap exists for low-rise
new construction and rehab,
even with maximum
abatement.
• Abatement on its own is not
sufficient to catalyze market
rate development.
Using abatement to support
quality affordable and mixed-
income product is most
appropriate in the near term.

HR&A Advisors, Inc. Columbus Incentives Policy Evaluation |44
Residential Incentives
Recommendations
Photo: Pixabay

HR&A Advisors, Inc. Columbus Incentives Policy Evaluation | 45
HR&A recommends alterations to the existing incentive structure to drive gains in
efficiency, support citywide investment, and promote inclusive growth.
1. Establish simple neighborhood typologies across
Columbus to guide the use of incentives. The three
neighborhood typologies identified through this
analysis (Persistently Disinvested, Ready for
Revitalization, and Market-Ready) reflect varying
market and demographic conditions, and can serve as
a useful guide for how the City thinks about the role of
its incentives in spurring investment and growth.
2. Consider changes to incentive structure and
deployment by neighborhood typology. Given
differing market conditions by typology, incentives can
be more effectively targeted to spur desired outcomes.
In Ready for Revitalization neighborhoods, the City
may want to continue abatements and explore
targeted use of additional subsidy or infrastructure and
public realm to catalyze development. In contrast, in
Market-Ready neighborhoods, the City may want to
right-size incentives or reposition them to support high-
quality product that delivers public benefits.
3. Monitor and update typologies over time, using a
key set of demographic, market, and reinvestment
indicators. Columbus should undertake periodic review
of its neighborhood typologies, as well as a
quantitative assessment of the role of incentives in
development feasibility. This process could be
undertaken once every four to five years, which would
provide some consistency for the development process,
but also ensure that the incentive structure is relatively
up to date for market conditions. Special consideration
may want to be given in the case of any significant
shifts in the local or national economy impacting real
estate. To guide neighborhood typology development
and monitoring, a series of potential indicators is
provided on subsequent pages of this report.

HR&A Advisors, Inc. Columbus Incentives Policy Evaluation | 46
HR&A recommends alterations to the existing incentive structure to drive gains in
efficiency, support citywide investment, and promote inclusive growth.
4. Consider qualitative factors in awarding incentives in
order to prioritize public benefits realized through
development. Columbus should formalize a list of
desired public benefits that could be achieved through
rehabilitation and new development, and make these
transparent as part of the incentive review and
awarding process. Potential public benefits may include
provision of affordable housing, especially in mixed-
income projects; major infrastructure and public realm
improvements, including the creation of public parking
garages, bicycle and pedestrian infrastructure, and
open space; creation of significant amounts of high-
quality office space, especially in mixed-use
developments that promote a live-work-play
environment; serving as a “pioneer” project in an
underinvested neighborhood; and redevelopment of
large brownfield sites. This approach recognizes that
abatements fundamentally are a tool to grant
developers value in exchange for public benefits.
5. Continue to support market stability by providing a
transparent and predictable incentive structure.
Changes to the tax abatement structure can
significantly alter development economics in Columbus’s
neighborhoods, as abatement values are capitalized
into land values in most locations. While abatement
decreases could result in land price decreases in the
long term, price “stickiness” could limit changes to land
values in the near term, impacting developer returns
and potentially slowing development activity. In
addition, developers may perceive greater risk in a
changing policy environment, which also could inhibit
development activity. For this reason, it is critical for the
City of Columbus to take a series of steps to preserve
market stability, including:
• Continuing to engage the development community
in discussions about changes to the incentive policy
(which has been a consistent focus as part of this
study);
• Providing developers and landowners advance
notice of changes to the incentive structure; and
• Providing clarity and transparency in how the
programs will be amended so that all can
understand how changes may impact development
economics and can accommodate changes within
their plans.

HR&A Advisors, Inc. Columbus Incentives Policy Evaluation | 47
The three preliminary neighborhood typologies, which can be identified through
indicators, can be used to guide incentive use.
The residential market scan conducted for the four focus
neighborhoods (Hilltop, Linden, East Side, and the Short
North) provided insight into neighborhood-level indicators
that can be used to evaluate economic health and segment
neighborhoods into the three typologies. These indicators
fall into three primary groups, with selected indicators for
each group summarized below. These indicators can be
used to help assess when neighborhoods have reached a
“tipping point” for investment (see Appendix for further
details).
Persistently
Disinvested
Ready for
RevitalizationMarket-Ready
Columbus
Baseline
Demographics
Population growth,
2000-2016
Below baseline Can be below or above baseline,
depending on presence of vacant
parcels awaiting redevelopment
Above baseline +19%
Median household income
growth,
2000-2016
Significantly below
baseline
Ideally, at or above baseline Above baseline +17%
Poverty rate,
2015
Significantly above
baseline
Can be above or below baseline,
depending on concentrated,
persistent poverty
Below baseline 21%
Residential
Market
Demand
Median rent growth PSF,
2010-2017
Below baseline Above baseline Above baseline +19%
Housing vacancy rate,
2015
Above baseline Can be below or above baseline,
depending on presence of vacant
parcels awaiting redevelopment
Below baseline 11%
Foreclosure
Activity
Mortgage foreclosure rate: # of
foreclosures per 10,000 homes,
2017
Above baseline Ideally, below baseline Below baseline 3.2
HR&A Advisors, Inc. Columbus Incentives Policy Evaluation | 48
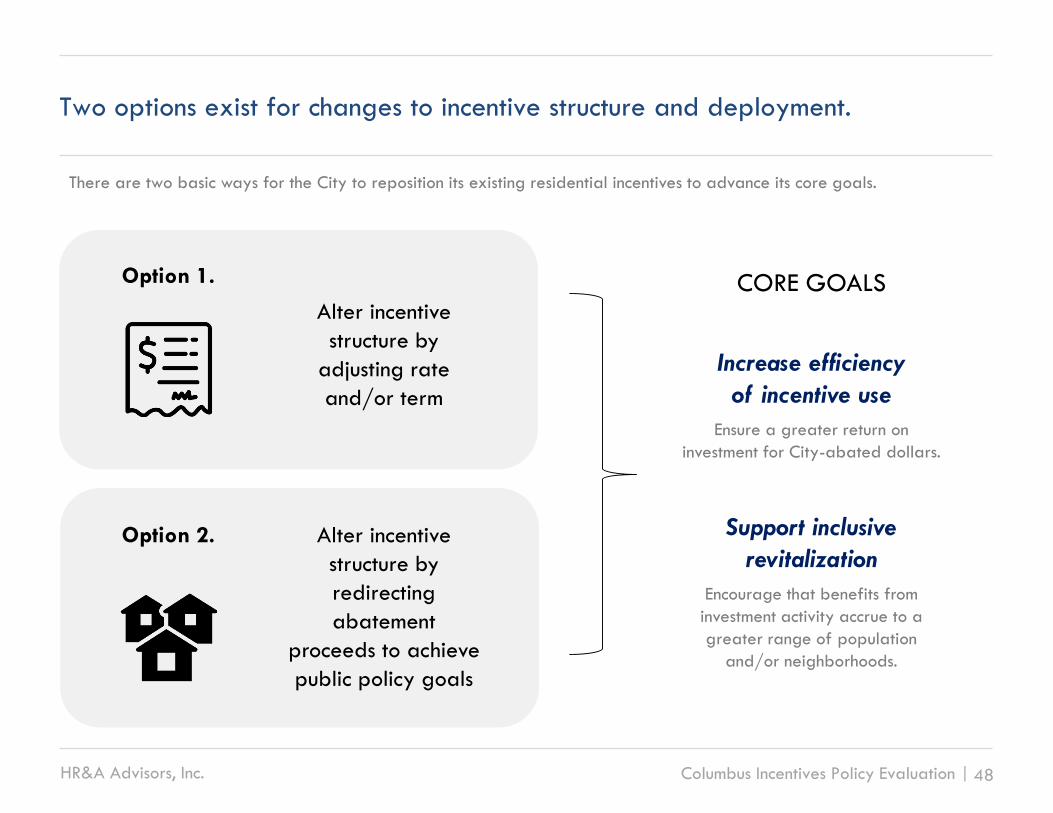
Two options exist for changes to incentive structure and deployment.
CORE GOALS
Increase efficiency
of incentive use
Ensure a greater return on
investment for City-abated dollars.
Support inclusive
revitalization
Encourage that benefits from
investment activity accrue to a
greater range of population
and/or neighborhoods.
There are two basic ways for the City to reposition its existing residential incentives to advance its core goals.
Alter incentive
structure by
redirecting
abatement
proceeds to achieve
public policy goals
Alter incentive
structure by
adjusting rate
and/or term
Option 2.
Option 1.

HR&A Advisors, Inc. Columbus Incentives Policy Evaluation | 49
Ability to achieve core goals:
Increase efficiency of use ✓+
Support equitable revitalization ✓–
Columbus could alter incentive structure by adjusting the rate and/or term.
In Ready for Revitalization and
Persistently Disinvested neighborhoods:
• Increase incentive value by extending
rehab incentive term, currently set at
12 years, to 15 years.
In Market-Ready neighborhoods:
• Reduce incentive value by either
reducing rate below 100% or
shortening term.
Application Precedents
✓ Indianapolis’s “burn-off” system. Indianapolis has established
an abatement system wherein the rate “steps down” over time.
The developer receives a higher rate during the early years of
the project, when abatement proceeds are already worth more
due to the time value of money, and a lower rate during the
later years.
✓ Cincinnati’s definition of multifamily as Commercial CRA. In
Ohio, jurisdictions can classify multifamily housing of 4 or more
units as Commercial CRA, meaning that each abatement deal
is individually negotiated, or Residential CRA, meaning that
abatements are granted as-of-right to eligible projects in the
district. Columbus has chosen to classify multifamily as
Residential CRA to date. If it were to reclassify, Columbus
would gain greater control over rate and term for deals, but
increase its administrative burden, require School Board
approval for deals, and increase developer perception of risk.
✓ Columbus’s past decisions to establish lower base rates in
select districts. Generally, the residential abatement rate is
100%. However, the AC Humko (75%) and Fifth By Northwest
(80%) districts were established with lower rates.
HR&A Advisors, Inc. Columbus Incentives Policy Evaluation | 50
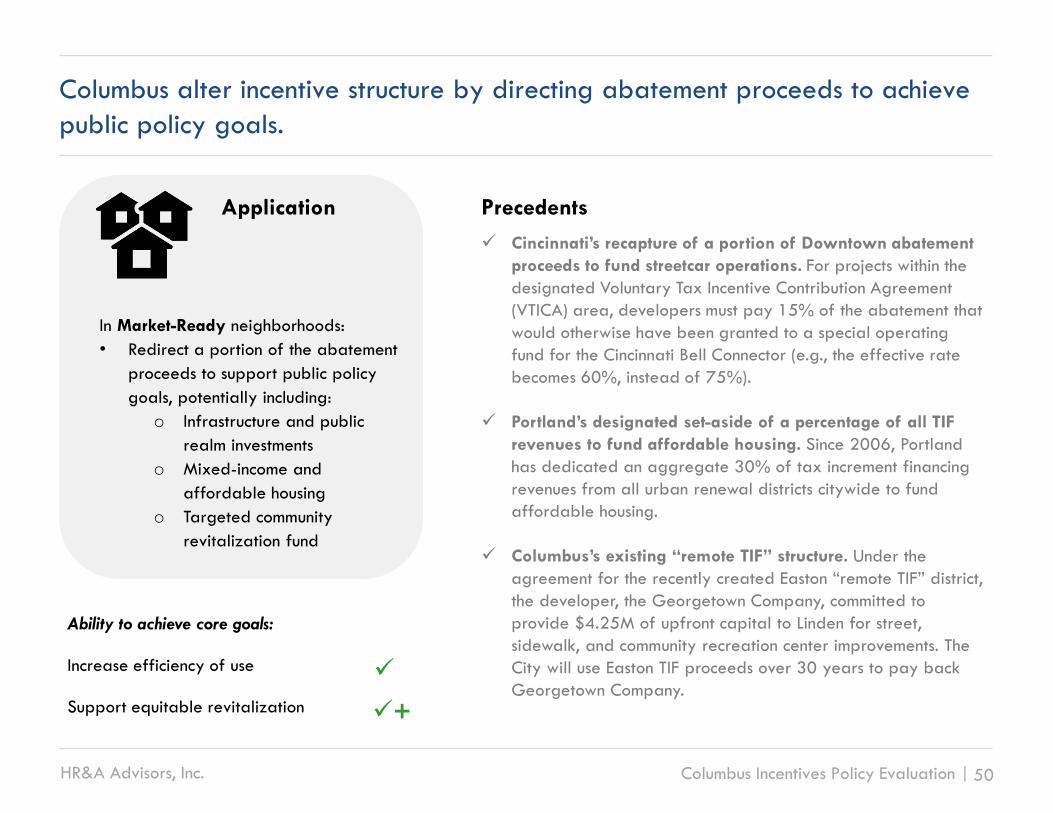
In Market-Ready neighborhoods:
• Redirect a portion of the abatement
proceeds to support public policy
goals, potentially including:
o Infrastructure and public
realm investments
o Mixed-income and
affordable housing
o Targeted community
revitalization fund
Application Precedents
✓ Cincinnati’s recapture of a portion of Downtown abatement
proceeds to fund streetcar operations. For projects within the
designated Voluntary Tax Incentive Contribution Agreement
(VTICA) area, developers must pay 15% of the abatement that
would otherwise have been granted to a special operating
fund for the Cincinnati Bell Connector (e.g., the effective rate
becomes 60%, instead of 75%).
✓ Portland’s designated set-aside of a percentage of all TIF
revenues to fund affordable housing. Since 2006, Portland
has dedicated an aggregate 30% of tax increment financing
revenues from all urban renewal districts citywide to fund
affordable housing.
✓ Columbus’s existing “remote TIF” structure. Under the
agreement for the recently created Easton “remote TIF” district,
the developer, the Georgetown Company, committed to
provide $4.25M of upfront capital to Linden for street,
sidewalk, and community recreation center improvements. The
City will use Easton TIF proceeds over 30 years to pay back
Georgetown Company.
Columbus alter incentive structure by directing abatement proceeds to achieve
public policy goals.
Ability to achieve core goals:
Increase efficiency of use ✓
Support equitable revitalization ✓+

HR&A Advisors, Inc. Columbus Incentives Policy Evaluation | 51
Leveraging recaptured abatement proceeds, Columbus could create a
designated Community Revitalization Fund to catalyze investment across the city.
Recapture mechanism. The abatement proceeds could be
recaptured in Market-Ready neighborhoods by (i) dedicating
a specific percentage of the abatement granted throughout
the entire term (e.g., Cincinnati VTICA model) or (ii) requiring
the developer to make a PILOT equivalent to the abatement
proceeds during the later years of the term to this purpose.
Fund structure and leverage. The City should explore the
potential to leverage the recaptured abatement proceeds
against other sources of funding to increase the overall size
and impact of the Community Revitalization fund. Funds may
be leveraged against philanthropic capital, social impact
investments, and bank CRA lending. While not relying on tax
increment, similar funds have been created across the country,
including the New York City Acquisition Fund, the Los Angeles
New Generation Fund, and the soon-to-be-launched San
Francisco Housing Accelerator Fund. In addition, the
revitalization of Cincinnati’s Over-the-Rhine neighborhood
followed a similar funding model, with City investment
leveraged against local corporate-sponsored social investment
funds, foundation contributions, and CRA lending. Columbus
should also explore whether there is a role for an independent
quasi-public entity – new or existing – to run and strategically
deploy fund capital.
Potential uses. The resources in the Community Revitalization
Fund could be used to catalyze investment in Persistently
Disinvested and Ready for Revitalization neighborhoods, by:
• Building community development corporation capacity to
both support effective stakeholder coalitions in pursuing
large redevelopment projects (per the Southside and
Weinland Park neighborhood models) and provide
technical to homeowners and smaller developers;
• Providing essential infrastructure and funding support for
site assembly and remediation;
• Providing gap financing for affordable and mixed-income
projects;
• Providing funds for owner-occupied rehab for low-income
owners who cannot access abatement value without upfront
capital.
While there is no doubt a wide variety of funding needs
across the city, the use of the fund should be strategically
targeted for specific purposes in a limited set of
geographies to ensure maximum impact. These targets can
evolve over time as the fund matures.

HR&A Advisors, Inc. Columbus Incentives Policy Evaluation | 52
The Community Revitalization Fund could achieve significant scale over time.
Sizing Community Redevelopment Fund Potential, Using
the Short North as a Model
• From 2011-2015, 6 projects with investments of over $1
million were awarded residential abatements in the
Short North, with all abatements commencing in 2014 or
2015. In recent years, the Short North has been seeing 2
to 3 large projects per year. These projects generally
have ranged in size from 60,000 to 80,000 GSF.
• Using Short North as a proxy for a Market-Ready
neighborhood, and assuming 3 large projects per year,
equivalent to about 240,000 GSF of space, with the
City recapturing approximately one-fifth of abatement
proceeds otherwise flowing to developers, the City could
add $1.7 million per year to a community revitalization
fund.
240,000 X $34 X 21% = $1.7M
GSF of new
development
Average
abatement
value per GSF
for 2 mid-rise
products tested
in SN
Percentage of
abatement
proceeds
recaptured
Proceeds
flowing to
community
revitalization
fund
Over 10 years, assuming that this quantity of
projects continues to be realized, the fund
could represent $17 million in new City
contributions for community revitalization. An
examination of affordable housing trust funds
identified a typical leverage ratio of 1 to 3
for every dollar of public investment.
Assuming a similar ratio, this could translate
to more than $50 million in new community
investment across Columbus in the coming
decade. As additional momentum builds in the
market, and as the fund becomes more fully
established, this amount may further grow.
Source: Leverage ratio sourced from 2011 State Housing Trust Fund Survey, Center for Community Change

HR&A Advisors, Inc. Columbus Incentives Policy Evaluation |53
IV. Commercial Incentives
& Recommendations

HR&A Advisors, Inc. Columbus Incentives Policy Evaluation | 54
HR&A assessed Columbus’s commercial incentive portfolio in the context of
national peers and neighboring municipalities.
1. Economic Context 2. Comparison 3. Recommendations
HR&A reviewed economic and
demographic data for Columbus, as
well as its national peers and
regional neighboring municipalities,
in order to understand the economic
context in which each of their
commercial incentive portfolios are
being deployed.
Based on the findings from the
benchmarking analysis and a
review of the Columbus’s economic
development goals, HR&A
identified best practices and
produced recommendations to
better align the City’s incentive
portfolio with its broader
economic and community
development objectives.
HR&A conducted a comparative
analysis of the commercial incentive
portfolios offered by national peer
cities and neighboring suburban
municipalities. In addition to
gathering information on the types
of incentives that each jurisdiction
offers, HR&A interviewed key
economic development staff in each
city to better understand their
incentive deployment practices.
How can incentives enhance Columbus’s
competitiveness in a regional & national context?
How can the portfolio
best support
achievement of
Columbus’s
economic objectives?

HR&A Advisors, Inc. Columbus Incentives Policy Evaluation | 55
Commercial Incentive Overview
Photo: Wikimedia

HR&A Advisors, Inc. Columbus Incentives Policy Evaluation | 56
Commercial incentives are most helpful to cities to address competitive
disadvantages at the margins.
RelocationFirms generally consider relocation only when faced with significant challenges
operating in their current location. Relocation is expensive and risky.
Local Economic FactorsThe quality of the labor pool, economic fundamentals, and quality of life drive
location decision making, often times allowing an employer to narrow down to a
key region or competitive set of cities.
IncentivesIncentives become most influential after a firm has narrowed down location
options, and can be used to address specific competitive disadvantage within a
regional market with a shared labor pool or between comparable markets.

HR&A Advisors, Inc. Columbus Incentives Policy Evaluation | 57
Columbus’s office market is stable, but has experienced very little growth in
recent years.
0
200,000
400,000
600,000
800,000
1,000,000
1,200,000
1,400,000
1,600,000
1,800,000
2,000,000
2000 2001 2002 2003 2004 2005 2006 2007 2008 2009 2010 2011 2012 2013 2014 2015 2016
Completions (All) Completions (Class A) Completions (Class B/C)
Completions, 2000-2016
While relatively limited, the majority of the completions
added to the market over the past 16 years consists of
class A office space. A moderate supply of office product
was introduced into the market during the first part of the
last decade. There was a slight decline in completions from
2003 to 2005 followed by a few years of increased
activity. Very little new office product has been added to
the market in the past several years coming out of the
Great Recession.

HR&A Advisors, Inc. Columbus Incentives Policy Evaluation | 58
Downtown is the strongest office submarket within the Columbus MSA, and
certain suburban areas are facing very high vacancy rates and low rents.
Columbus Downtown Suburbs
Inventory Total office inventory increased
by 19% from 2000 to 2016,
mostly among class A space
Represents more than a third of
all office square footage
throughout the Columbus market
Most suburban office space is
concentrated in Dublin/Hilliard
and Worthington, accounting for
over a third of total MSA
inventory, with the rest more
dispersed throughout.
Rent Asking rent of $19.00 per square
foot
Asking rent of $20.50 per square
foot
Asking rent of $18.50 per square
foot, although rents vary among
submarkets, with Dublin-Hilliard
at $20.50, Worthington at
$17.50, and Upper Arlington at
$16.00.
Vacancy Overall vacancy rate of 18%
with a class A vacancy rate of
15%
Vacancy rate is less than 14%,
4% lower than the overall
Columbus market
Southeast and Westerville
submarkets have the highest
vacancy rates of 25% and 28%,
respectively.

HR&A Advisors, Inc. Columbus Incentives Policy Evaluation | 59
Industrial space is primarily suburban, with Rickenbacker International Airport
driving industrial growth to the southeast of the City in recent years.
Columbus Downtown Suburbs
Inventory Total industry inventory increased
by 10% from 2000 to 2016
Represents 1% of the industrial
square footage space in the
Columbus MSA
Significant development occurring
in the Southeast submarket near
the airport.
Rent Median asking rent of $4 per
square foot
Highest asking rent among all
submarkets
The Southeast submarket has the
lowest average asking rent,
partially due to the concentration
of bulk warehouses.
Vacancy 8% overall vacancy rate 7% vacancy rate The Southeast submarket, which
contains the most square footage,
has a higher vacancy rate (9%)
than Downtown.

HR&A Advisors, Inc. Columbus Incentives Policy Evaluation | 60
Downtown
Office Incentive (DOI)
Job Growth
Incentive (JGI)
Jobs Creation
Tax Credit (JCTC)
Structure
Financial payment equal to a
percentage of local income tax
withholding on eligible new jobs.
Financial payment equal to a
percentage of local income tax
withholding on eligible new jobs.
Non-refundable tax credit equal to
a percentage of local income tax
withholding on eligible new jobs,
applied against net profits tax. The
credit’s usefulness depends on firms’
municipal net profits tax liability.
Rate
Automatic 50% Typically 25%,
with a 5-10% incremental credit for
resident hiring
Generally 60%
Term
Up to 8 years, depending on jobs
created and lease length. To realize
8-year term, firm must create at
least 400 jobs.
Typically 5 years, depending on
jobs created and lease length. To
realize 8-year term, firm must
create at least 400 jobs.
Generally 7 years
Purpose
Create new Downtown jobs and
strengthen office market by
offsetting higher parking and
leasing costs. Program is limited to
firms using office space.
Create new jobs outside Downtown.
Designed to fill gap that existed
between DOI and JCTC and
increase competitiveness of locations
outside Downtown.
Create new jobs across City.
Other Reqs.
A minimum of net new 10 jobs must be created over up to 3 years.
Firms must show that the incentive is a major factor in their decision to move forward.
Among the City’s performance-based incentives, JCTC offers both the most
aggressive average rate and longest average term.

HR&A Advisors, Inc. Columbus Incentives Policy Evaluation | 61
JGI, with its 25% cash payment for businesses locating
outside Downtown, is both the most used incentive and the
most costly to the City in terms of foregone revenue.
However, on a cost per deal basis, JCTC is slightly more
expensive.
While DOI is as frequently used as JCTC, despite being
subject to geographic limitations, its cost on a per-deal
basis is much lower.
Among the City’s performance-based incentives, JGI represents the greatest
number of deals and total foregone revenue to the City.
Performance-Based Incentives Active Deals, 2011-2105
Program TypeNumber
of Deals
Total Cost
to City
Average Cost
Per Deal
Downtown Office Incentive 41 $ 4M $ 0.1M
Jobs Growth Incentive 75 $ 76M $ 1.0M
Jobs Creation Tax Credit 41 $ 46M $ 1.1M

HR&A Advisors, Inc. Columbus Incentives Policy Evaluation | 62
JCTC deals tend to deliver more jobs and capital investment, but at a greater
cost to the City and with jobs at relatively lower wage levels than DOI or JGI.
DOI JGI JCTC
Total deals 41 deals 75 deals 41 deals
Median
new jobs40 jobs 62 jobs 90 jobs
Median
investment
(real property)
$225k $623k $1.7M
Median wage $70k $55k $43k
Median cost
per job $2.6k $1.2k $4.7k
JCTC supports projects that tend to be more job-intensive,
especially compared to DOI. This partially reflects the fact
that JCTC, like JGI, is able to incentivize large
manufacturing projects, which DOI does not do, by virtue of
both its geographic limitations and fundamental focus on
office product. JCTC’s use for manufacturing projects also
means that it is associated with relatively large capital
investments. However, on average, JCTC-supported jobs
have the lowest median wage levels of the three incentive
programs.
DOI’s focus on Downtown office jobs means that it tends to
support projects with higher-wage jobs, in sectors such as
professional services or finance & insurance, but relatively
small capital investments. DOI-linked capital expenditures
tend to involve supplemental investments, such as furniture
and fixtures and information technology upgrades.
0%
20%
40%
60%
Manu
fact
urin
g
Who
lesa
le T
rade
Reta
il Tr
ade
Trans
p. &
Ware
housi
ng
Info
rmation
Financ
e &
Insu
ranc
e
Pro
fess
ional
Serv
ices
31-33 42 44-45 48-49 51 52 54
Sectoral Breakdown
DOI JGI JCTC

HR&A Advisors, Inc. Columbus Incentives Policy Evaluation | 63
Per program requirements, DOI deals are concentrated Downtown, but JGI and
JCTC are relatively dispersed throughout Columbus.
6
9
5 54 4
Airp
ort
Bre
wery
Dis
tric
t
Bro
oks
ide C
olo
ny
Cro
ssw
ood
s
Devo
n T
ria
ngle
Dow
ntow
n
East
Bro
ad
East
Colu
mbus
East
land
East
on
Fore
st P
ark
East
Germ
an
Vill
age
Golf
view
Wood
s
Gra
nd
view
Sout
h
Harr
ison W
est
Hilltop
Ind
ep
endenc
e V
illa
ge
Indus
tria
l Site
Innis
Ga
rden
Vill
age
Livin
gst
on
Pa
rk N
ort
h
Marb
le C
liff
Cro
ssin
g
Mari
on F
rank
lin
Milb
rook
Milo
-Gro
ga
n
Nort
h Fra
nklint
on
Nort
hga
te
Nort
hern
Woods
Pa
rkvi
ew
Pola
ris
Riv
erv
iew
Sa
lem
Villa
ge
Sci
oto
Tra
ce
South
sid
e
South
west
Air
port
The O
hio S
tate
Uni
vers
ity
Tri-V
illa
ge
Tuttle
West
Vass
er
Vill
ag
e (Li
ncoln
Park
)
West
belt
West
sid
e 1
& 2
Wexm
oor
Pend
ing
JGI JCTC
Top locations for JGI:
Downtown, Brewery District, Easton, Grandview South
Top locations for JCTC:
Downtown, Easton, Southside
Note: Deals were coded by neighborhood using the Columbus Neighborhoods file from Columbus Open Data.
Number of Deals by Program & Neighborhood
JGI and JCTC deals are generally well-distributed
throughout Columbus, with most neighborhoods having at
least one deal. However, there are several areas of
concentration across the city. Downtown, as the core
commercial district in Columbus, has the largest number of
JGI and JCTC deals. Easton, a major corporate and retail
center, also has received a substantial number of both
types of deals. The Brewery District and Grandview South
are hubs for JGI deals, while Southside attracts more JCTC
deals.

HR&A Advisors, Inc. Columbus Incentives Policy Evaluation | 64
Among abatement programs, Enterprise Zone deals are driven by job creation
and capital investment, while Commercial CRA deals focus on the latter.
Enterprise Zone (EZ) Commercial CRA (C-CRA)
StructureAbatement on incremental property tax value
created by improvements.
Abatement on incremental
property tax value created by
improvements.
RateTarget 75%*
(rates higher than 75% require School District approval)
Average 75%
TermUp to 10 years
(terms from 10-15 years require School District approval)
For rehab, up to 12 years
For new construction, up to 15
years
PurposeTo promote capital investment and job creation via the establishment,
expansion, renovation, and occupation of facilities.
To promote significant capital
investment.
Minimum
Investment
Generally, $1 million, although there is statutory
criteria by project type
• Establish: “Significant” investment
• Expand: Investment equal to at least 10% of existing facility’s value
• Renovate: Investment equal to at least 50% of existing facility’s value
• Occupy: Investment equal to at least 20% of existing facility’s value
Generally, $1 million
Other
Reqs.
If project creates new annual payroll of at least $1 million (including construction and project jobs), the City
must enter into an income tax-sharing agreement with the relevant school district. If no agreement can be
reached within 6 months, default income-sharing is 50/50. If the City incurs infrastructure costs that benefit the
project, it can claim up to 35% of the new local income tax revenue before 50/50 sharing begins.
* Target rate represents the rate that the City pursues as a policy decision, while average rate reflects the actual rate offered.

HR&A Advisors, Inc. Columbus Incentives Policy Evaluation | 65
Due to its more extensive availability throughout Columbus, more deals are
done under the Enterprise Zone versus Commercial CRA structure.
EZ areas cover the vast majority of the City, while
Commercial CRA is limited to specific authorized districts,
with their boundaries generally drawn to encompass a
particular project or set of projects.
Due to its more extensive availability throughout Columbus,
the City generally has encouraged the majority of firms to
seek EZ, and reserved the use of Commercial CRA for a
smaller number of large projects. It follows that CRA deals
are associated with a higher median number of jobs than
EZ deals, as well as higher median investment. The jobs
created through CRA deals also have a higher median
wage than those created through EZ deals.
Relevant to the City’s reliance on the EZ structure, the State
of Ohio established the CRA program in perpetuity, but the
EZ program is subject to regular reauthorization by the
General Assembly.
Enterprise Zone Commercial CRA
Deals 78 deals 10 deals
Median new jobs 15 jobs 73 jobs
Median investment $6.4M $18.5M
Median wage $35k $50k
Median cost
per job $2.5k $2.1k

HR&A Advisors, Inc. Columbus Incentives Policy Evaluation | 66
The City has three Enterprise Zones, covering the majority of Columbus, with the
Central Zone representing the oldest and largest zone.
Columbus Enterprise Zones
Source: City of Columbus map.
Zone Name Est. Year % of Active Deals
Central Zone 1985 92%
North Zone 2003 8%
Southeast Zone 2003 0%
Central ZoneThe Central Zone, established in 1985, is the oldest EZ in
Columbus. It is a full-authority (urban distress) zone, and
represents the largest and most active zone, with the majority
of active deals. Under state law, the MSA can have only one
full-authority (urban distress) EZ. In this zone, retail projects
are permitted, and firms do not have to obtain a waiver to
relocate from other parts of Ohio.
North ZoneThe North Zone, established in 2003, is a limited-authority
(non-urban distress) zone. It contains the balance of active
non-Central Zone deals.
Southeast ZoneThe Southeast Zone, also established in 2003, is also a
limited-authority (non-urban distress) zone. It is not heavily
utilized, and currently has no active deals.

HR&A Advisors, Inc. Columbus Incentives Policy Evaluation | 67
EZ deals are relatively distributed throughout Columbus, notwithstanding
some notable pockets of concentration. Downtown, Marion-Franklin, and the
Airport lead in total number of EZ deals.
Reflecting the fact that they are tied to districts, CRA deals have been
concentrated in specific locations. While 35+ CRAs exist in the City, there
are only 8 CRA zones with recent deals, with two, Old State Road and Short
North, having more than one deal.
EZ deals demonstrate relatively extensive geographic distribution, while CRA
deals are concentrated in select districts.
0
5
10
15
Note: Deals were coded by neighborhood using the Columbus Neighborhoods file from Columbus Open Data.
CRA Deals by District Deals
Easton Square Place 1
Old State Road 2
Rickenbacker 1
Short North 2
Cassady/I-670 1
Brewer’s Yard 1
Front St./West St. 1
South Washington II 1Enterprise Zone Deals By Neighborhood

HR&A Advisors, Inc. Columbus Incentives Policy Evaluation | 68
The City’s CRAs have differing capacity to support various project types.
Residential Commercial
Pre-1994New Rehab New Rehab
Primarily Commercial
Easton Square Place N Limited Y N
Hamilton-161 N N Y Y
Lazelle/Highbluffs N N Y Y
Leonard Taylor N N Y N Pre-
Norton-Crosswind N N Y N Pre-
Old State Road N N Y N
Rickenbacker N N Y Y
Roberts Road N N N Y Pre-
Stelzer-Stygler N Y Y Y Pre-
Both Project Types
Brewers District Y Y Y Y Pre-
Columbus Downtown Y Y Y Y Pre-
Jeffrey Residential Y Y Y N Pre-
Short North Y Y Y N
South Grove Y Y Y N Pre-
Since the CRA program was established in the 1970s, the City
has created a large number of districts, many of which have
been amended and/or consolidated over time. Depending on
the districts’ authorizing ordinances, different project types are
eligible, with some districts focused primarily on residential,
some focused primarily on commercial, and some on both types.
The list below summarizes the 14 “active” CRA districts that the
City considered available for future commercial deals as of
January 2017.* The districts’ status as pre-1994 vs. post-1994
zones also affects their capacity to support projects. While
commercial deals can be granted as-of-right in pre-1994
districts, they must be individually negotiated in post-1994
districts, and a pre-1994 district can only be amended twice
before transitioning to a post-1994 district.
*The City considers CRA
districts to be “active” if
1) its authorizing
ordinance does not
contain a set date by
which construction must be
complete; 2) the CRA is
still within that window; or
3) the date has passed,
but City Council did not
exercise its right to direct
the Housing Officer to no
longer accept new
applications.

HR&A Advisors, Inc. Columbus Incentives Policy Evaluation | 69
National Peers and Neighbors

HR&A Advisors, Inc. Columbus Incentives Policy Evaluation | 70
Our study assessed the City’s competiveness and incentive structures relative to
national peers.
DALLAS CHARLOTTE INDIANAPOLIS
Charlotte is a rapidly expanding
banking and professional service hub,
with a substantial employment base in
finance and insurance. The city has a
strong central business district which is
home to several Fortune 500
companies. Charlotte is confronting
challenges with upward mobility,
ranking last in intergenerational
mobility according to a 2014 Harvard
study.
Unlike the other national peer cities
where growth is being led by the center
city, Dallas’s rapid growth is regional
in nature encompassing much of the
Dallas - Ft. Worth Metroplex, which is
home to more than 10,000 corporate
headquarters, the largest concentration
in the United States. Relatively
affordable rents compared to other
submarkets have attracted companies
downtown.
Indianapolis is a moderately growing,
comparably affordable city that as the
Indiana state capital serves as a hub of
government and higher education
institutions. Indianapolis benefits from a
substantial, albeit shrinking
manufacturing base, as well as a robust
healthcare sector. Its governance is
fundamentally different because it
operates under a consolidated city-
county government.
Photo: Pixabay Photo: Wikimedia Photo: Wikimedia

HR&A Advisors, Inc. Columbus Incentives Policy Evaluation | 71
These peers have many characteristics in common with Columbus, with
comparable populations, industry mixes, and educational attainment.
Sources: U.S. Census, ESRI, U.S. Census LEHD, Bureau of Labor Statistics
Columbus Indianapolis Charlotte Dallas
Population& percent growth
from 2000
860,000 +21%
855,000+9%
842,000+56%
1,318,000 +11%
Top industries by
concentration
1. Financial Activities
2. Professional and
Business Services
3. Education & Health
Services
1. Financial Activities
2. Information
3. Professional &
Business Services
1. Financial Activities
2. Information
3. Professional &
Business Services
1. Professional &
Business Services
2. Financial Activities
3. Education and Health
Services
Percent with
bachelors degree35% 31% 42% 29%
▪ The peer cities selected for this study have many characteristics in common with the City of Columbus. While Dallas is
over 50% larger than Columbus, Charlotte and Indianapolis have roughly equal populations.
▪ Relative to the rest of the country, these cities share a similar mix of competitive industries, Financial Activities is either
the first or second most concentrated industry in each and Professional Services & Business Services ranks amongst the
top three in each city. Dallas and Columbus both share an “Eds and Meds” concentration, while Charlotte and
Indianapolis are concentrated in Information.
▪ All four cities are magnets for young talent; Columbus ranks second in educational attainment of the four peers,
outpacing Indianapolis and Dallas but lower than Charlotte.

HR&A Advisors, Inc. Columbus Incentives Policy Evaluation | 72
Columbus Indianapolis Charlotte Dallas
Average Class A
Office Rents (PSF)$18 $21 $23 $20
Land Price for a Home* $27K $17K $66K $77K
Corporate Property Tax Rate
Rank (1=highest taxes;
73=lowest taxes)**
41st
12th
60th
20th
Cost of Living (Percent greater
than Columbus)*** - 1% 7% 8%
▪ Class A office rents for peer cluster in the $20 to $23 per square foot range for the selected peer cities, around 15%
more expensive than Columbus at $18.
▪ There is a wide variation in the corporate property tax burdens for each city, with Indianapolis and Dallas having a
relatively higher burden than Charlotte and Columbus.
▪ Columbus rates basically equal to Indianapolis in terms of cost of living, but 7% to 8% cheaper than both Charlotte and
Dallas on this key metric.
Columbus is competitive with peer cities from both a cost of doing business and
cost of living perspective.
* Average value of the land for a single-family detached owner-occupied unit
** Effective Tax Rate for $1-Million Valued Commercial Property, with $200k in Fixtures
*** Based on the COLI index comparing 60 goods and services collected at the local level
from independent researchers
Sources: CoStar, Lincoln Institute of Land Policy, Council for Community and Economic Research

HR&A Advisors, Inc. Columbus Incentives Policy Evaluation | 73
ApproachProperty Tax
Incentives
Performance
Incentives for
Job Creation
Business &
Development
Support Grants
TIF
ColumbusEnterprise Zone,
Commercial Community
Reinvestment Areas
Downtown Office
Incentive, Jobs
Growth Initiative,
Job Creation Tax
Credit
TIF
Indianapolis
Real & Personal
Property Tax
Abatements, Vacant
Building Incentive
TIF
CharlotteBusiness Investment
Program grant
Synthetic TIF
(TIG)
DallasProperty Tax
Abatement, Historic Tax
Incentive
Economic
Development 380
Grant, Neighborhood
Redevelopment Grant
TIF
The suite of incentives emphasized by each city is shaped by their statutory
contexts and the particular competitive challenges they face.
Use of abatements and TIF to
accomplish policy goals, with
most conservative terms of any
peer.
Has only TIF and economic
development grants at
disposal, but City finds
flexibility within limited toolkit.
Frequently uses performance-
based incentives, with those
targeting earning carrying the
largest deals.
Frequently uses abatements,
with localized use of TIF to
focus investment.
Columbus has a wide variety of programs available to the
City, compared to some of its national peers. However,
even among cities with more flexibility, each has distinct
preferences among the tools they have and how they are
deployed. The only consistency between all cities is the use
of some version of Tax Increment Financing (TIF).

HR&A Advisors, Inc. Columbus Incentives Policy Evaluation | 74
We also examined the incentive toolkits of regional peers to derive best
practices within the greater Columbus market.
DUBLIN
NEW ALBANY
GROVEPORT
Dublin is a well-
established suburb of
Columbus, home to the
Wendy’s headquarters,
a distribution center for
Cardinal Health, and
other leading businesses.
A planned community,
New Albany is the
wealthiest of the regional
peers and is home to the
corporate headquarters
for Abercrombie & Fitch
and Bob Evans.
Groveport is a smaller
community close to
Rickenbacker Airport,
with an industrial focus
and a plethora of
manufacturing and
warehousing properties.
Columbus DublinNew
AlbanyGroveport
Population,
2016
& growth
from 2000
860,000
+21%
46,000
+45%
10,000
+179%
5,500
+44%
Jobs, 2014
& growth
from 2002
499,000
+4.5%
40,000
+8%
11,000
+92%
10,000
+109%
Photo: Wikimedia
Photo: City of New Albany
Photo: City of Groveport

HR&A Advisors, Inc. Columbus Incentives Policy Evaluation | 75
These regional peers all operate under shared enabling legislation from the
State of Ohio, but each utilize different tools to different ends.
As these cities largely share a legal framework, there is
more alignment across their programs, but still not complete
uniformity. Here too, the larger economic context plays a
major role in shaping program emphasis, with cities like
Groveport leaning on CRA and others relying more on
grants. Still, across all of Franklin County, TIF remains one of
the most common economic development tools, exempting
$1.9 billion in 2015, accounting for 72% of all abated
real property values.
Approach
Property Tax
Performance-Based
Incentive
Earnings Tax
Incentives
Business &
Development
Support Grants
TIF
ColumbusEnterprise Zone,
Commercial Community
Reinvestment Areas
Downtown Office
Incentive, Jobs
Growth Initiative, Job
Creation Tax Credit
TIF
DublinJob Creation Tax
Credit
Land acquisition,
Green building,
Technology, Relocation
grants
TIF
New AlbanyCommercial Community
Reinvestment Areas
Job Creation Tax
Credit
Green building,
Economic development
fund grants
TIF
GroveportCommercial Community
Reinvestment Areas
Job Creation Tax
Credit
Not much flexibility in deal-
making, relying on generous
automatic pre-1994 CRA terms.
Uses full range of programs, but
as a master-planned community
is very selective in choosing
companies to work with.
Does not offer abatements and
emphasizes land acquisition
assistance and technology
grants.
Frequently uses performance-
based incentives, with those
targeting earning carrying the
largest deals.

HR&A Advisors, Inc. Columbus Incentives Policy Evaluation | 76
Best Practices to Ensure Competitiveness

HR&A Advisors, Inc. Columbus Incentives Policy Evaluation | 77
HR&A identified three policy realms where Columbus can adapt strategies
employed by other cities to achieve its goals.
1. Real estate: Mitigating cost drivers and
enhancing competitivenessReducing the costs for businesses to locate in
Columbus, or improving the value of existing
building assets, enhances the city’s
competitiveness. Relative to regional and
national peers, Columbus is largely cost
competitive, but the comparatively generous
incentives available within the region
complicates this dynamic.
2. Neighborhoods: Targeting areas for
commercial development Getting businesses to create local jobs and invest
in neighborhoods can bring positive spillover
effects to the surrounding area. By selectively
incentivizing commercial growth in targeted
areas, the City can leverage its incentive
portfolio to advance important neighborhood
development goals and compete within the
region for a variety of business types.
3. Jobs: Promoting job quality and access
to opportunityOther communities have elected to establish
industry and/or job quality targets in order to
receive a deeper incentive or any incentive at
all. Columbus can clarify its policy on the
minimum wage required to receive incentive
awards, and also explore ways to encourage
certain types of jobs and career ways for local
residents.

HR&A Advisors, Inc. Columbus Incentives Policy Evaluation | 78
Columbus remains competitive with national peers, but faces significant
competition from neighboring municipalities’ generous terms.
▪ Groveport and New Albany’s long terms and 100%
rates present strong competition when a downtown
location is not a factor. As smaller and more
homogenous municipalities than Columbus, these cities
aggressively pursue deals that fit their profile.
Groveport makes available pre-1994, maximum CRA
abatements to industrial and distribution businesses
seeking proximity to Rickenbacker Airport. New
Albany has maximum rates that are similarly generous
for office and manufacturing, allowing it to extend
offers when desired that can greatly exceed anything
from Columbus under the same program.
▪ While its terms are different, the maximum cost in
Dallas is comparable to Columbus, while the
incentive structure in Indianapolis is considerably
more conservative due to the burn-off schedule
employed.
Incentive Terms
Ohio Cities
Columbus CRA
Typically 50% or 100%, 15 year max
Enterprise Zone
Typically 75%, 10 year max
Groveport CRA, industrial/warehousing
100% rate, 15 year max
New Albany CRA, office/manufacturing
> 150k sf: 100% rate, 15 year max
< 150k sf: 100% rate, 10 year max
National Peers
Dallas Property Tax Abatement
90% rate, 10 year max
Indianapolis Property Tax Abatement
Initial 100% rate decreasing each
year, 10 year max

HR&A Advisors, Inc. Columbus Incentives Policy Evaluation | 79
Typical incentive awards in Indianapolis follow a standard burn-off schedule,
but the City maintains the flexibility to be more aggressive for some deals.
▪ Indianapolis’s burn-off means that rate declines
each year. This has major implications for the amount
of money Indianapolis is laying out over the course
of the deal, particularly on the back end. For
example, in year nine of a deal under the standard
schedule in Indianapolis, the recipient would be
paying 90% of their tax (10% abated), while in
Columbus, they could still be receiving a 100%
abatement.
▪ Indianapolis is willing to commit to a more
aggressive schedule for priority projects. A 70%
abatement for 10 years can be a negotiated
schedule for significant deals. As such they have the
flexibility, when needed, to put together larger
deals, although these terms and rates are both lower
than what is available to Columbus.

HR&A Advisors, Inc. Columbus Incentives Policy Evaluation | 80
Some cities have developed targeted real estate incentives designed to solve
specific challenges.
DUBLIN, OH
INDIANAPOLIS, IN
▪ Incentivizing physical improvements to aging commercial products
such as Dublin’s technology upgrades to aging office buildings, makes
the building more competitive in attracting and retaining tenants.
Upgrades in Dublin have included the installation of 100 gigabit
fiber optic networks to buildings within its Metro Center office park.
Dublin views these investments as safer than issuing incentives specific
to a single company, as positive impacts from investments within a
building are sure to remain with the community.
▪ Incentives can be directed to encourage green building. New Albany
provides tax credits and permit discounts for such investments, and
Cincinnati offers automatic max durations for projects achieving LEED
Silver or higher certification. The Cincinnati program has been one of
most well-used incentive programs within their portfolio.
▪ Indianapolis’s vacant building program offers up to two years in
abatements to help stabilize commercial districts and keep
buildings in use, bringing investment to long-neglected areas. This
program can offer an abatement on current taxes in addition to
future taxes and is restricted to nuisance buildings that have been
vacant for extended periods of time.
Photo: Wikimedia
Photo: Google Streetview

HR&A Advisors, Inc. Columbus Incentives Policy Evaluation | 81
National peer cities have continued to prioritize development in their
downtowns, the core of the cities’ business, vitality, and identity.
▪ Dallas prioritizes commercial deals in downtown. This is
important to maintaining a competitive CBD, as stronger
submarkets exist in the region. Previously, Dallas had
additionally incentivized residential developments
downtown, but has begun to move away from this as these
projects have found success. Successful deals have
included recruiting the headquarters of AT&T to bring
thousand of jobs downtown. They are currently in the
process of further expanding their presence, bringing an
additional 1,000 employees and making improvements to
surrounding public spaces through improved restaurant,
retail, and event center offerings.
▪ Uptown Charlotte (the CBD) remains a focus of
incentive awards despite a healthy real estate market.
This helps Charlotte to continue to attract headquarter
users to its most prominent business district and support
related economic development initiatives.
DALLAS, TX
Photo: Pixabay

HR&A Advisors, Inc. Columbus Incentives Policy Evaluation | 82
Peer cities also give special consideration to areas in need of investment.
▪ Indianapolis considers increased levels of incentive
for deals in areas in need of revitalization. Geography
is an important consideration as they assess deals, which
is guided by local priorities, as well as national
programs such as Promise Zones and census tracts
identified as low and moderate income for the purpose
of Community Development Block Grants.
▪ Dallas applies a strict impact analysis, but also
weighs incentives relative to policy goals. Deals that
are more borderline via traditional metrics can still be
considered if they are in priority areas of the city.
▪ Both Indianapolis and Dallas have used TIF to fund
affordable housing. These cities have expanded the
focus of this tool to increase the supply of affordable
units throughout the city. In the case of Dallas, it is the
primary tool used to promote mixed-income housing,
facilitating 2,300 affordable units in just over ten years.
INDIANAPOLIS, IN
Photo: Flickr

HR&A Advisors, Inc. Columbus Incentives Policy Evaluation | 83
Columbus should strengthen its commercial abatements in view of both local and
national dynamics.
1. Columbus should revise its commercial and
industrial incentive policies to be more competitive
with the awards offered by suburban
municipalities. Especially for projects that are highly
sensitive to costs, the City of Columbus risks being
uncompetitive without changes to its policies to allow
for deeper incentives in specific circumstances.
Columbus should develop an approach for enhancing
the competitiveness of its commercial and industrial
awards in outlying parts of the City that are less
differentiated from suburban municipalities. Selection
of these locations should be strategic and targeted
so as to encourage the strengthening of outlying
employment hubs.
2. Columbus should implement new initiatives
targeted to enhance the quality of aging existing
office product throughout the city. A green
building/rehabilitation incentive (possibly utilizing
the PACE program being advanced by the Port
Authority) or other program promoting physical
upgrades would improve the competitiveness of
underperforming buildings or allow for an easier
conversion to residential.
3. Columbus should implement tiered levels of
incentives to prioritize targeted jobs centers. This
could provide bonuses on top of a base incentive to
provide the best rates and terms for actions that
align with City interests. For example, a recipient
could be eligible for a higher rate or term by
choosing to locate in a disinvested area.
4. Columbus must continue to prioritize the use of
downtown incentives to strengthen the national
presence of Downtown Columbus. As existing
market rents are not yet high enough to justify
commercial construction with structured parking, the
City should continue to focus on building a critical
mass of downtown activity that can sustain itself and
further enhance the profile of Downtown Columbus
as a national and global business destination. The
availability of downtown incentives is critical to
supporting the continued evolution of Downtown
Columbus, which is of benefit to the City and region
as a whole.

HR&A Advisors, Inc. Columbus Incentives Policy Evaluation | 84
Several of the peer cities are more targeted in the kinds of jobs and industries
they are incentivizing, as well as their rationale for wage thresholds.
▪ Some cities focus on incentivizing only those deals
that create quality jobs contributing to an existing
industry ecosystem. Peer cities are using a variety
of methods to weigh the benefits of these deals, even
as they desire to keep some flexibility in these
assessments, by adjusting factors and their weights to
reflect priorities.
▪ Indianapolis enhances term and rate depending on
target industries and the number of jobs being
produced in addition to factoring in wages by
utilizing a scorecard with weights that can change
with priorities. For example, when Indianapolis
evaluates prospective deals, they provide a bonus
for businesses providing jobs in targeted industries
and generally tries to keep projects with a minimum
average hourly wage of $11 to $15. For jobs below
those wages, Indianapolis may consider not counting
those jobs in their scorecard, or may forgo the deal
entirely.
▪ Dublin heavily considers its target industries, which
are in categories with relatively higher income, such
as corporate headquarters, medical research and
development, business support services, information
technology, marketing, and companies supporting the
Honda factory. Dublin’s programs, particularly their
technology retrofits, are highly oriented towards
these industries and the well-paying jobs they
provide.
▪ Charlotte aims to incentivize jobs that pay above
the average for call center jobs, setting their
standard relative to call center jobs because they are
a common project undertaken in the city. Still,
Charlotte recognizes the need for jobs at different
levels and skills and maintains a preference for
higher paying positions.
▪ Local suburban municipalities, such as New
Albany, focus on incentivizing well-paying jobs. As
the entire City of New Albany is master planned, with
98% of the 3,000 acres in the business park owned
by a single developer, they have the ability to be
highly selective in the businesses they seek to attract –
and will forgo incentives unless the prospect fits a
very clear profile. Given its strong economic position,
New Albany competes not just on a regional basis,
but also with many of the cities considered peers of
Columbus, such as Dallas, Charlotte, and Pittsburgh.

HR&A Advisors, Inc. Columbus Incentives Policy Evaluation | 85
Suburban neighbors and national peers are additionally seeking to strengthen
workforce development and preferences for marginalized populations.
▪ Charlotte’s Economic Development Department is
considering implementing a 10% MWDBE
participation goal as a part of their grant programs
and is examining ways to further incorporate
workforce development requirements into their
incentives.
▪ New Albany makes special grants available for
training and development on a case-by-case basis.
This increases the ability of New Albany to maintain
flexibility and customize their approach for each
prospective business while aligning these discussions
closely with workforce development goals.
▪ Indianapolis is exploring incentive enhancements
in partnership with the City’s ex-offender re-entry
program and workforce development programs,
with possible implementation methods including
bonuses to the incentive, or as an interim step
towards receiving incentives.

HR&A Advisors, Inc. Columbus Incentives Policy Evaluation | 86
HR&A tested the potential impacts of alternative wage requirements by
examining them in the context of jobs created by incentivized firms to date.
Program Ohio Min. Wage$12 Per Hour
Wage
$13 Per Hour
Wage
$15 Per Hour
Wage
Annual Mean Hourly
Wage,. Columbus MSA
DOI 100% 100% 100% 98% 90%
JGI 100% 100% 99% 96% 63%
JCTC 100% 98% 95% 80% 51%
Percent of deals where average wage would have met or exceeded relevant wage threshold
Source: HR&A Advisors, Inc.
▪ Setting the threshold wage at $13 per hour would affect
less than 1% of DOI and JGI deals, and only 5% of JCTC
deals. In contrast, setting the minimum threshold at $15 per
hour would affect 20% of JCTC deals, but only 2% and
4% of DOI and JGI deals, respectively.
▪ The vast majority of DOI deals incentivize jobs with
wages above the MSA average, while this is the case for
only about half of JCTC deals.
▪ The differing capacity of jobs tied to deals under the three
programs to meet the thresholds is tied to their different
sectoral focuses.
▪ A $15 hour minimum wage floor would exclude a number of
jobs in the wholesale trade and manufacturing sectors.
▪ In considering changes to the average minimum wage, it is
important to recognize the relative size of employment for
average deals in each of the programs, with JCTC
representing slightly larger deals. As an example, JCTC had
a median of 90 jobs per deal between 2011 and 2015, as
compared to 62 jobs for JGI and 40 jobs for DOI,
respectively.
The City currently requires firms that are receiving incentives to
create jobs with wages of at least $12 per hour. To test the
potential impacts of setting a higher wage threshold for jobs to
be created under the City’s performance-based incentives,
HR&A determined the average wage per job for all DOI, JGI,
and JCTC deals awarded between 2011 and 2015, using data
on total payroll and number of jobs. HR&A then evaluated the
share of deals falling under each program where the average
wage (indexed for inflation) would have met or exceeded the
relevant wage threshold ($13 per hour, $15 per hour, and the
annual mean hourly wage for the Columbus MSA).

HR&A Advisors, Inc. Columbus Incentives Policy Evaluation | 87
Columbus can better leverage its incentive policies to drive job quality and
encourage economic opportunity.
1. Columbus should consider developing a scorecard
to support standardized decision-making and
enable consistent evaluation of deals according to
a set of quantitative and qualitative factors. The
scorecard could enable Columbus to assess deals by
comparing them both within and across programs
based on quantitative and qualitative factors
identified by City policymakers as important. For
example, cost per job (in terms of foregone revenue
to the City) could be used as a quantitative metric to
compare deals both within the JCTC program and
across all three performance-based incentive
programs (DOI, JGI, and JCTC). Other factors, such
as job quality, could be assessed more qualitatively
(e.g., support for workforce development programs).
2. Columbus should consider implementing tiered
levels of incentives to prioritize job quality and
workforce development outcomes. Similar to the
approach for geographic bonuses, the City can
likewise incorporate bonuses for offering jobs with a
higher median wage, providing education and
training opportunities, and other means of
expanding economic opportunity.
3. Columbus should consider enhancing the $12 per
hour floor for incentives across programs, in light
of data on jobs incentivized to date. The majority
of firms are already meeting this threshold,
suggesting that there is an opportunity to both
support higher-wage jobs across the board and to
encourage firms that are lagging behind.
4. Columbus should explore new programs to
support economic inclusion, including incentives
for participating in restored citizen re-entry and
overall workforce development programs. For
maximum feasibility, the City may want to focus its
recruitment efforts for these programs on firms that
are currently located within Columbus and have a
relationship with the City, so that it can work with
them to overcome implementation barriers.
HR&A Advisors, Inc. Columbus Incentives Policy Evaluation |88
Appendix I:
Neighborhood Decision
Support Tool

HR&A Advisors, Inc. Columbus Incentives Policy Evaluation | 89
Neighborhood Indicators | Decision Support Tool (1/2)
The residential scan conducted for the four focus
neighborhoods (Hilltop, Linden, East Side, and Short North)
provided insight into indicators that can be used to
evaluate neighborhood health and segment neighborhoods
into typologies. The indicators have been divided into three
categories: demographic, residential market demand,
and reinvestment activity.
The specific indicators were selected based on three
criteria:
• Their usefulness in illuminating neighborhood market
health;
• Their ability to be quantified and thus benchmarked
across neighborhoods; and
• The accessibility of the underlying data.
While quantitative factors were prioritized because of their
ability to be easily compared across neighborhoods, there
also are qualitative factors useful in evaluating
neighborhood health and investment readiness (e.g.,
neighborhood commitment to a shared vision, community
development corporation capacity, etc.).

HR&A Advisors, Inc. Columbus Incentives Policy Evaluation | 90
Neighborhood Indicators | Decision Support Tool (2/2)
As needed, we have identified caveats to guide usage of
specific indicators. However, there are three overarching
items to highlight:
1. The indicators represent a “snapshot” in time, and data
must be updated moving forward.
2. To make market segmentation decisions, indicators
should be considered in concert, as some, such as high
housing vacancy, can reflect both a neighborhood in
distress and one engaged in the early stages of
revitalization.
3. While the indicators are designed for cross-
neighborhood use, variations in economic health also
likely exist within neighborhoods, such that a Ready for
Revitalization neighborhood might include sub-areas
more characteristic of Persistently Distressed or Market-
Ready neighborhoods.
This set of indicators also complements other efforts in
Columbus and the State of Ohio to define characteristics of
neighborhoods that are primed for development if catalytic
investment is provided.
• In 2013, the Greater Ohio Policy Center evaluated
indicators of housing investment and revitalization
activity in Weinland Park (“Achieving Healthy
Neighborhoods: The Impact of Housing Investments in
Weinland Park”).
• In 2017, the Homes on the Hill Community Development
Corporation worked with the Mid-Ohio Regional
Planning Commission to develop a street-level tool for
investment decisions in the neighborhood.
• In 2017, the Greater Ohio Policy Center assessed
relevant indicators and developed neighborhood
typologies for Akron (“Build in Akron: Opportunities for
Residential Reinvestment in Akron’s Neighborhoods”).

HR&A Advisors, Inc. Columbus Incentives Policy Evaluation | 91
Demographic Indicators
Persist.
Disinvested
Ready for
Revitalization
Market-Ready Columbus
Baseline
Rationale
a. Population
growth, 2000-
2016
Below baseline Below or above baseline,
depending on presence of
vacant parcels awaiting
redevelopment
Above baseline In general, population declines
suggest that the neighborhood is
becoming less attractive to existing
residents and/or new residents are
not entering it. Population decline
can be associated with
redevelopment in the short term,
but sustained declines are likely
due to disinvestment.
Hilltop / Linden
-9% / -6%
East Side
-8%
Short North
+23%
+19%
b. Median
household
income growth,
2000-2016
Significantly
below baseline
Ideally, at or above baseline
with slower growth in areas
with large numbers of
students or subsidized
housing residents
Above baseline Rising median household incomes
suggest that higher-income
residents are entering the
neighborhood, existing residents
are increasing their earning
potential, or lower-income residents
are leaving. Hilltop / Linden
+1% / -3%
East Side
+28%
Short North
+65%
+17%
c. Poverty rate Significantly
above baseline
Above or below baseline,
depending on concentrated,
persistent poverty
Below baseline High levels of poverty suggest
social and economic challenges
that may pose a barrier to
reinvestment. However, in
neighborhoods that are otherwise
prosperous, small, but
concentrated, areas of poverty
can raise the overall poverty rate.
Hilltop / Linden:
36% / 33%
East Side
42%
Short North
19%
21%

HR&A Advisors, Inc. Columbus Incentives Policy Evaluation | 92
Residential Market Demand Indicators
Persist.
Disinvested
Ready for
Revitalization
Market-Ready Columbus
Baseline
Rationale
a. Growth in
median rents
PSF, 2010-2017
Below baseline Below or above baseline,
depending on presence of
vacant parcels awaiting
redevelopment
Above baseline Higher rates of rent growth reflect
rising housing demand. When
considering rent growth rates, it is
important to take base rent levels
into account. Revitalizing
neighborhoods may have higher rent
growth rates relative to market-
ready ones because they are
starting from a lower base.
Hilltop / Linden
+13% / +15%
East Side
+26%
Short North
+58%
+19%
b. Housing vacancy
rate
Above baseline Can be below or above
baseline,
depending on presence of
vacant parcels awaiting
redevelopment
Below baseline Higher levels of vacancy can reflect
lower housing demand or the
presence of dilapidated housing.
However, they also can indicate
revitalization in progress, as units sit
vacant before or immediately after
redevelopment. Hilltop / Linden
20% / 16%
East Side
28%
Short North
9%
10%

HR&A Advisors, Inc. Columbus Incentives Policy Evaluation | 93
Reinvestment Activity Indicators
Persist.
Disinvested
Ready for Revitalization Market-Ready Columbus
Baseline
Rationale
a. Mortgage
foreclosure rate:
# of
foreclosures per
10,000 homes,
2017
Above baseline May be above or below
baseline,
due to speculation.
Revitalizing neighborhoods
may have foreclosure spikes
during downturns, as
speculators retrench.
Above baseline Higher foreclosure rates suggest an
environment of ongoing housing
price declines, such that current
prices fall below current mortgage
values. Under these conditions,
homeowners have both a reduced
economic incentive to make their
payments and difficulty locating
investors to buy them out.Hilltop / Linden
8.7 / 2.1
East Side
5.2
Short North
0
3.2

HR&A Advisors, Inc. Columbus Incentives Policy Evaluation |94
Appendix II:
Advisory Committee
Acknowledgements
HR&A Advisors, Inc. Columbus Incentives Policy Evaluation | 95
Incentive Study Advisory Committee Acknowledgements
This Advisory Committee helped guide the City of Columbus and its consultants through the initial scope, draft reviews, and
recommendations for the Incentive Study:
Liz Brown, Councilperson, Columbus City Council
Greg Daniels, Partner, Squire Patton Boggs
Amanda Hoffsis, Senior Director of Physical Planning & Real Estate, The Ohio State University
Bruce Luecke, President and CEO, Homeport
Bruce McClary, Vice President, Alliance Data Systems
Kenny McDonald, President and CEO, Columbus2020
Sean Mentel, Attorney, Kooperman Mentel Ferguson Yaross
Jaiza Page, Councilperson, Columbus City Council
Lisa Patt-McDaniel, President, Workforce Development Board of Central Ohio
Mark Wagenbrenner, President, Wagenbrenner Development
Trent Smith, Executive Director, Franklinton Board of Trade
Steven Schoeny, Director, City of Columbus Department of Development
Department of Development Staff:
Quentin Harris, Deputy Director
Tonya Barnett, Program Coordinator

HR&A Advisors, Inc. Columbus Incentives Policy Evaluation |96
Appendix III:
Study Timeline

HR&A Advisors, Inc. Columbus Incentives Policy Evaluation | 97
Study Timeline
Jan. 30 & 31, 2017
Initial Meetings with HR&A and VSI (Mayor, Department of Development Internal Review Team, Incentive Study Advisory Team)
May/June, 2017
Presentation of Incentive Study Findings by HR&A and VSI to Department of Development and Incentive Study Advisory Team
June 20,2017
Final Draft of Incentive Study and Recommendations
Aug. through Oct., 2017
Five Community Incentive Study Hearings led by Director of Development
Nov. through Dec., 2017
Final Recommendations for Policy Implementation reviewed internally
Jan. 2018 Final Incentive Study presented to Administration and City Council

Final Report
Incentives Policy Evaluation