“income distribution in ireland: through recession ... · income distribution in ireland through...
TRANSCRIPT

INCOME DISTRIBUTION IN IRELANDTHROUGH RECESSION, TOWARDS RECOVERYTIM CALLAN, MARK REGAN, MICHAEL SAVAGE AND JOHN R. WALSH
BUDGET PERSPECTIVES 2018PAPER 2June 2017
EVIDENCE FOR POLICY

INCOME DISTRIBUTION IN IRELAND: THROUGH RECESSION, TOWARDS RECOVERY
Tim Callan Mark Regan Michael Savage John R. Walsh
June 2017
BUDGET PERSPECTIVES 2018
PAPER 2
Available to download from www.esri.ie
The Economic and Social Research Institute Whitaker Square, Sir John Rogerson’s Quay, Dublin 2

ABOUT THE ESRI
The mission of the Economic and Social Research Institute is to advance evidence-based policymaking that supports economic sustainability and social progress in Ireland. ESRI researchers apply the highest standards of academic excellence to challenges facing policymakers, focusing on 12 areas of critical importance to 21st Century Ireland.
The Institute was founded in 1960 by a group of senior civil servants led by Dr T.K. Whitaker, who identified the need for independent and in-depth research analysis to provide a robust evidence base for policymaking in Ireland.
Since then, the Institute has remained committed to independent research and its work is free of any expressed ideology or political position. The Institute publishes all research reaching the appropriate academic standard, irrespective of its findings or who funds the research.
The quality of its research output is guaranteed by a rigorous peer review process. ESRI researchers are experts in their fields and are committed to producing work that meets the highest academic standards and practices.
The work of the Institute is disseminated widely in books, journal articles and reports. ESRI publications are available to download, free of charge, from its website. Additionally, ESRI staff communicate research findings at regular conferences and seminars.
The ESRI is a company limited by guarantee, answerable to its members and governed by a Council, comprising 14 members who represent a cross-section of ESRI members from academia, civil services, state agencies, businesses and civil society. The Institute receives an annual grant-in-aid from the Department of Public Expenditure and Reform to support the scientific and public interest elements of the Institute’s activities; the grant accounted for an average of 30 per cent of the Institute’s income over the lifetime of the last Research Strategy. The remaining funding comes from research programmes supported by government departments and agencies, public bodies and competitive research programmes.
Further information is available at www.esri.ie

THE AUTHORS
Tim Callan is a Research Professor at the ESRI and an Adjunct Professor at TCD. Mark Regan is a Research Assistant, Michael Savage is a Research Officer and John R. Walsh is a Software Architect at the Economic and Social Research Institute (ESRI).
ACKNOWLEDGEMENTS
We thank the SILC team at CSO for facilitating access to the Research Microdata File used in this analysis. Funding from the SWITCH Research Programme (supported by the Departments of Public Expenditure and Reform, Social Protection, Health and Finance) is gratefully acknowledged. We thank two anonymous referees, and participants at ESRI internal seminar for their insightful comments.
This paper has been accepted for publication by the Institute, which does not itself take institutional policy positions. The paper has been peer reviewed prior to publication. The authors are solely responsible for the content and the views expressed.

3
TABLE OF CONTENTS
ABSTRACT ................................................................................................................................................ 4
1. INTRODUCTION ......................................................................................................................... 4
2. INCOME INEQUALITY: A CROSS-SECTIONAL VIEW ............................................................................. 5
3. MOVEMENTS IN HOUSEHOLD INCOME FROM YEAR TO YEAR ............................................................ 10
4. ASSESSING POLICY IMPACT: DISCRETIONARY POLICY AND AUTOMATIC STABILISATION .......................... 14
5. CONCLUSIONS ......................................................................................................................... 17
REFERENCES ........................................................................................................................................... 19
LIST OF TABLES
Table 1 Gini coefficient, Ireland, 2004-2015 ................................................................................... 8
Table 2 Decile shares of household income, Ireland, 2008, 2013, 2015 ........................................ 9
Table 3 Percentage change in average household income by decile, Ireland, before housing costs (BHC) and after housing costs (AHC), 2008-2013 .................................................... 10
Table 4 Income Inequality measures for market, gross, disposable incomes, and Reynolds-Smolensky indices, 2008 and 2013................................................................................... 15
LIST OF FIGURES
Figure 1 GNP and household income growth, 2006-2013 ............................................................... 6
Figure 2 Unemployment rate (ILO definition), 2000-2017 ............................................................... 7
Figure 3 Change in average income between Year t and Year t+1, by Year t decile ...................... 12
Figure 4 Change in average inome between Year t-1 and Year t, by Year t decile ........................ 13
Figure 5 DIstributional Impact of discretionary changes in direct tax and welfare policy, percentage change in household income by decile, budgets 2009-2013 ........................ 17

4
INCOME DISTRIBUTION IN IRELAND: THROUGH RECESSION, TOWARDS RECOVERY
ABSTRACT
This paper provides an overview of how Ireland’s income distribution evolved over the Great Recession and the early years of the recovery. Three distinct perspectives are used to give a rounded view. First, the standard approach in the literature on income distribution, focusing on ‘snapshots’ of the income distribution at the beginning and end of the recession. These results suggest that the Gini coefficient was increased slightly between 2008 and 2013, but fell back to the 2008 level by 2015. During the crisis (2008-2013) income fell by more than average at the bottom of the distribution and less than average for the top income deciles. Second, detailed investigation of how household incomes changed from year to year finds that the sharp falls for the bottom income decile during this period arose mainly from falls in income for those who were initially in a higher income decile but experienced substantial losses in income. Third we find that the automatic stabilisation impact of Ireland’s tax-transfer system at the start of the recession played a strong role in limiting the increase in inequality over the period. Discretionary policy changes in direct tax and welfare played a supporting role in this regard.
1. INTRODUCTION
Has inequality increased or remained constant over the years of the Great Recession? What role has tax and welfare policy played in shaping the outcomes? And are there new trends in the distribution of income as Ireland emerges from the years of recession and austerity? These questions have attracted considerable attention over recent years, with divergent views as to what actually happened to incomes, and the impact of austerity policies. Here we draw on the latest available data and on some new types of analysis to provide an overview of how income inequality has evolved in Ireland during the recession and in the early years of recovery, and the impact of tax and transfer policies in arriving at these outcomes. There will of course be differences in views on what constitute desirable distributional goals and policies, but our analysis allows debate on such topics to be conducted on the basis of firm evidence.

5
We use three different approaches to examine these issues. First, we use the standard tools of income distribution analysis to examine the distribution of income across households over the 2008 to 2015 period. These standard measures relate to ‘snapshots’ of the income distribution1 taken at yearly intervals. Thus, when taken from year to year, it provides an analysis of ‘income positions’ or ‘income slots’ rather than people. This is by far the most common approach in the international literature on trends in income inequality.
Our second approach looks at how some of the key results from these cross sections are to be interpreted, drawing on new findings regarding movements in income for individuals from year to year. The CSO’s Survey on Income and Living Conditions follows a substantial proportion of individuals from year to year so that income changes can be measured. This allows for new insights into how the cross-sectional results are generated.
Our third focus is on the role of tax and welfare policy. Much of the debate about policy impact has centred on the effects of policy changes, such as tax increases and cuts in welfare payment rates on the distribution of income.2 There is, however, another policy effect: the impact of the pre-existing tax/transfer system when faced with changed economic circumstances such as greatly increased unemployment. Here we report new findings from Savage et al. (2017) which help to identify the extent of this ‘automatic stabilisation’ effect during the crisis period, which depends on the structure of the pre-existing tax-transfer system.3
2. INCOME INEQUALITY: A CROSS-SECTIONAL VIEW
Before considering evidence on the household income distribution, we examine how average household incomes measured by the Survey of Income and Living Conditions (SILC) changed over the 2008-2013 period, and how this relates to the evidence from national accounts statistics. The Great Recession brought to an end a long period of rising household incomes. GNP per capita, illustrated in Figure 1, did not grow in 2007 and fell sharply in 2008 and 2009.
We plot household incomes from SILC with a lag of one year, partly reflecting the fact that SILC incomes are measured with respect to the 12 months prior to
1 These are referred to as ‘repeated cross sections’. 2 A notable exception is FitzGerald (2014) who stressed the redistribution arising from the pre-existing tax and transfer
system. 3 This paper draws from existing research by the SWITCH team, based mainly on the recession period (2008-2013).
Where possible, we also provide up-to-date analysis based on the latest available household income microdata in Ireland, SILC 2015.

6
interview. Household incomes (mean real disposable income per adult equivalent) track the fall in GNP, with the exception of a timing difference in the 2009-2010 years. Household incomes did not fall as fast as the initial GNP shock in 2009, but fell while GNP rose in 2010, so that over the two-year period both income measures fell by similar proportions. The gap between GNP and household income changes in these years could be interpreted as reflecting some smoothing of the shock to household incomes by tax and welfare policy.
FIGURE 1 GNP AND HOUSEHOLD INCOME GROWTH, 2006-2013
Source: CSO Survey on Income and Living Conditions, 2006-2013; CSO National Income Accounts 2015. Notes: Incomes in SILC refer to a 12-month period prior to interview. Given that fieldwork is spread evenly through the year, the
average lag in incomes is approximately six months. Divergences between household income and GNP are to be expected on several grounds, including policy ‘smoothing’ of income changes, and policy lags in the adjustment to recession over this period – hence the use of a 12-month lag in the graph.4
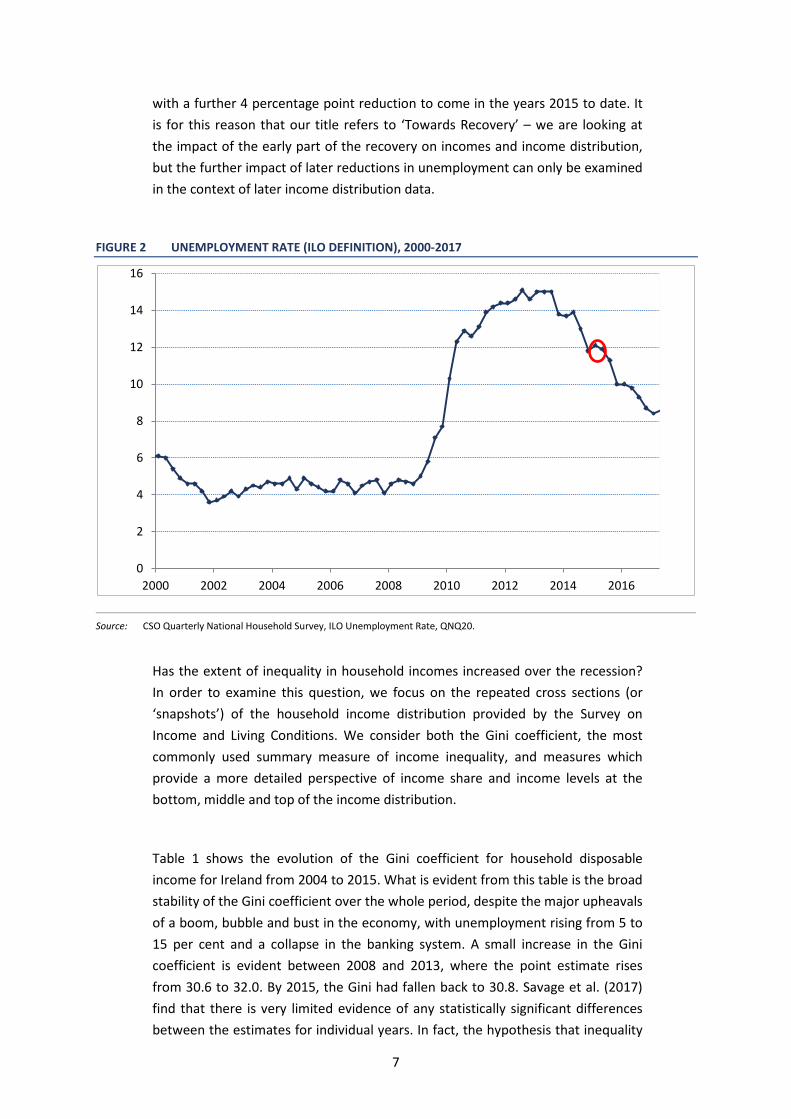
The unemployment rate is a key indicator of the state of the economy and one of the most critical influences on household incomes. Figure 2 shows how the unemployment rate, close to 5 per cent for the years 2001-2008, rose sharply to a peak of 15 per cent in 2012 as the recession took hold. The latest Survey on Income and Living Conditions is for 2015, and relates to incomes for the 12 months prior to the interview date. Given that interviewing is spread evenly through the year, the average lag in incomes is approximately six months. This means that the incomes recorded in SILC 2015 relate, on average, to a date close to end-2014 or early 2015. The unemployment rate at that time was close to 12 per cent; a 3 percentage point reduction from the peak value of 15 per cent, but
4 The period covered here pre-dates the 26 per cent recorded growth rate in 2015. The smaller year-to-year impacts of
earlier multinational activities (such as redomiciled plcs), identified by FitzGerald (2015), do not affect the broad point made in relation to Figure 1.
-10%
-8%
-6%
-4%
-2%
0%
2%
4%
6%
8%
2005 2007 2009 2011 2013
AverageHouseholdIncome (SILC)
GNP per capita
7
with a further 4 percentage point reduction to come in the years 2015 to date. It is for this reason that our title refers to ‘Towards Recovery’ – we are looking at the impact of the early part of the recovery on incomes and income distribution, but the further impact of later reductions in unemployment can only be examined in the context of later income distribution data.
FIGURE 2 UNEMPLOYMENT RATE (ILO DEFINITION), 2000-2017
Source: CSO Quarterly National Household Survey, ILO Unemployment Rate, QNQ20.
Has the extent of inequality in household incomes increased over the recession? In order to examine this question, we focus on the repeated cross sections (or ‘snapshots’) of the household income distribution provided by the Survey on Income and Living Conditions. We consider both the Gini coefficient, the most commonly used summary measure of income inequality, and measures which provide a more detailed perspective of income share and income levels at the bottom, middle and top of the income distribution.
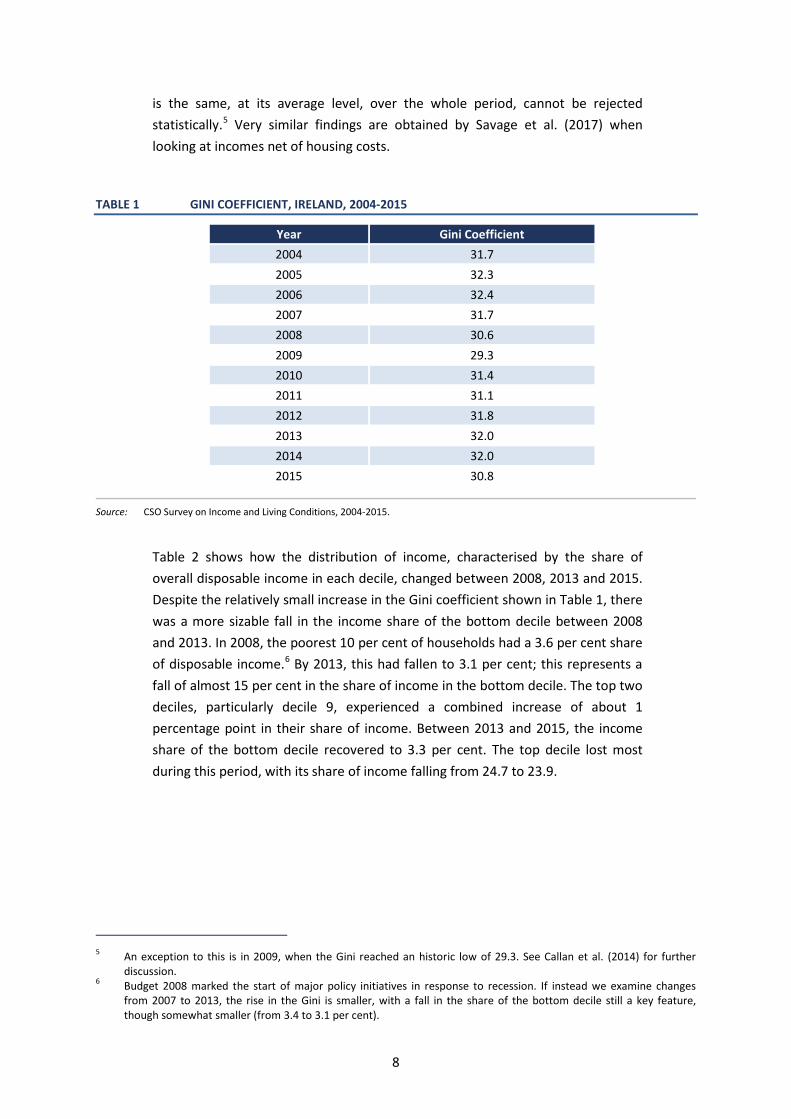
Table 1 shows the evolution of the Gini coefficient for household disposable income for Ireland from 2004 to 2015. What is evident from this table is the broad stability of the Gini coefficient over the whole period, despite the major upheavals of a boom, bubble and bust in the economy, with unemployment rising from 5 to 15 per cent and a collapse in the banking system. A small increase in the Gini coefficient is evident between 2008 and 2013, where the point estimate rises from 30.6 to 32.0. By 2015, the Gini had fallen back to 30.8. Savage et al. (2017) find that there is very limited evidence of any statistically significant differences between the estimates for individual years. In fact, the hypothesis that inequality
0
2
4
6
8
10
12
14
16
2000 2002 2004 2006 2008 2010 2012 2014 2016
8
is the same, at its average level, over the whole period, cannot be rejected statistically.5 Very similar findings are obtained by Savage et al. (2017) when looking at incomes net of housing costs.
TABLE 1 GINI COEFFICIENT, IRELAND, 2004-2015
Year Gini Coefficient 2004 31.7 2005 32.3 2006 32.4 2007 31.7 2008 30.6 2009 29.3 2010 31.4 2011 31.1 2012 31.8 2013 32.0 2014 32.0 2015 30.8
Source: CSO Survey on Income and Living Conditions, 2004-2015.
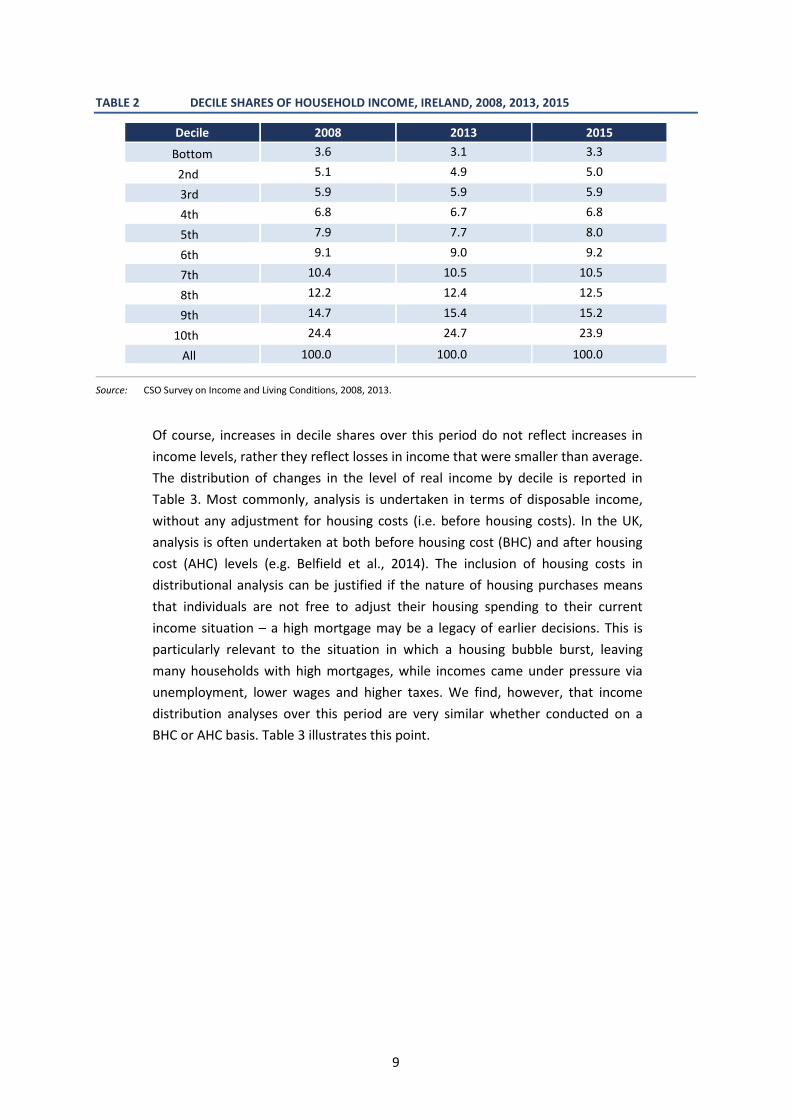
Table 2 shows how the distribution of income, characterised by the share of overall disposable income in each decile, changed between 2008, 2013 and 2015. Despite the relatively small increase in the Gini coefficient shown in Table 1, there was a more sizable fall in the income share of the bottom decile between 2008 and 2013. In 2008, the poorest 10 per cent of households had a 3.6 per cent share of disposable income.6 By 2013, this had fallen to 3.1 per cent; this represents a fall of almost 15 per cent in the share of income in the bottom decile. The top two deciles, particularly decile 9, experienced a combined increase of about 1 percentage point in their share of income. Between 2013 and 2015, the income share of the bottom decile recovered to 3.3 per cent. The top decile lost most during this period, with its share of income falling from 24.7 to 23.9.
5 An exception to this is in 2009, when the Gini reached an historic low of 29.3. See Callan et al. (2014) for further
discussion. 6 Budget 2008 marked the start of major policy initiatives in response to recession. If instead we examine changes
from 2007 to 2013, the rise in the Gini is smaller, with a fall in the share of the bottom decile still a key feature, though somewhat smaller (from 3.4 to 3.1 per cent).
9
TABLE 2 DECILE SHARES OF HOUSEHOLD INCOME, IRELAND, 2008, 2013, 2015
Decile 2008 2013 2015
Bottom 3.6 3.1 3.3
2nd 5.1 4.9 5.0
3rd 5.9 5.9 5.9
4th 6.8 6.7 6.8
5th 7.9 7.7 8.0
6th 9.1 9.0 9.2
7th 10.4 10.5 10.5
8th 12.2 12.4 12.5
9th 14.7 15.4 15.2
10th 24.4 24.7 23.9
All 100.0 100.0 100.0
Source: CSO Survey on Income and Living Conditions, 2008, 2013.
Of course, increases in decile shares over this period do not reflect increases in income levels, rather they reflect losses in income that were smaller than average. The distribution of changes in the level of real income by decile is reported in Table 3. Most commonly, analysis is undertaken in terms of disposable income, without any adjustment for housing costs (i.e. before housing costs). In the UK, analysis is often undertaken at both before housing cost (BHC) and after housing cost (AHC) levels (e.g. Belfield et al., 2014). The inclusion of housing costs in distributional analysis can be justified if the nature of housing purchases means that individuals are not free to adjust their housing spending to their current income situation – a high mortgage may be a legacy of earlier decisions. This is particularly relevant to the situation in which a housing bubble burst, leaving many households with high mortgages, while incomes came under pressure via unemployment, lower wages and higher taxes. We find, however, that income distribution analyses over this period are very similar whether conducted on a BHC or AHC basis. Table 3 illustrates this point.

10
TABLE 3 PERCENTAGE CHANGE IN AVERAGE HOUSEHOLD INCOME BY DECILE, IRELAND, BEFORE HOUSING COSTS (BHC) AND AFTER HOUSING COSTS (AHC), 2008-2013
2008-2013 2013-2015 2008-2013 2013-2015 Decile BHC AHC
Bottom -21.1 12.2 -25.6 12.2
2nd -13.6 8.2 -17.6 9.6
3rd -9.6 6.4 -14.2 8.1
4th -10.5 7.8 -12.7 7.5
5th -11.0 9.2 -13.0 9.5
6th -9.9 8.0 -12.0 7.6
7th -8.3 6.8 -11.0 8.3
8th -7.8 6.8 -6.5 7.1
9th -5.2 4.7 -6.8 4.7
10th -8.3 2.7 -9.1 1.8
All -9.1 6.0 -10.7 6.1
Source: CSO Survey on Income and Living Conditions, 2004-2015.
Again, between 2008 and 2013, the largest losses are concentrated at the bottom of the income distribution, where average income in the bottom decile fell by more than 20 per cent on a BHC basis, or by more than 25 per cent on an AHC basis. Income changes tend to become smaller higher up the income distribution, with income losses higher than average for the bottom 60 per cent of the population (BHC), or bottom 70 per cent of the population (AHC). Income losses for the top 40 per cent (BHC) or top 30 per cent (AHC) were lower than average. Average real income grew in each decile between 2013 and 2015, with the largest gains concentrated at the bottom of the distribution, partially offsetting the larger than average losses for the lowest income households during the crisis.
3. MOVEMENTS IN HOUSEHOLD INCOME FROM YEAR TO YEAR
Most work on trends in income inequality looks at snapshots of income distributions from year to year. This largely reflects the cross-sectional nature of the data available on income distribution. There is, however, additional information in the CSO’s Survey on Income and Living Conditions which can shed light on how movements in individual incomes from year to year contribute to the observed patterns at household level. SILC has a ‘rotating panel’ design: in Year 2, it seeks to re-interview 75 per cent of the households interviewed in Year 1. Typically SILC achieves a re-interview in about two-thirds of these cases. Thus, for about half of the cases interviewed in Year 1, information is also provided on Year 2 incomes.7
7 Ideally, we would follow households for more than one year. However, due to the combination of sample design and
attrition, as few as 25 per cent of households in a given year of SILC can be followed for more than one year.

11
Given that income information for adjacent years is available for only half the sample, a key question is whether this half of the sample is broadly representative of the whole sample. Savage et al. (2017) find that, on a wide range of characteristics, the evidence suggests that the panel sample is broadly representative of the full sample. However, the combination of the rotating panel design, which drops one-quarter of the sample each year, and attrition, means that both the number of cases available for analysis and the issue of potential bias become much more problematic if attempting to follow households for more than one year.
We use the available information on incomes in adjacent years in three ways.
• First, we examine what this information tells us about the fall in the share of the bottom decile observed in cross-sectional data;
• Second, we consider what happens to the incomes of those at a particular income level or decile at Year t when moving forward to Year t+1;
• Third, we look again at those in a given income decile in Year t, and identify what has been the income change between Year t-1 and Year t.
We noted in Section 2 that one of the key changes in the income distribution between 2008 and 2013 was a fall in the share of the bottom income decile, and a corresponding sharp fall in the mean income for that group.8
In recent work, Savage et al. (2017) have identified more precisely the forces which generated the sharp fall in the income share of the bottom decile. They find that the sharpest falls in average income for the bottom decile were in 2009-2010 and 2010-2011. Using the panel element of SILC, they found that for those who remained in the bottom decile in each of these years, incomes were stable or rose slightly. The fall in average income for the bottom decile was not due to a fall in income for those already in the bottom decile. Instead, it relates to sharp falls in income for those previously in deciles 2, 3 and above, which brought these individuals into the bottom decile
8 As noted by Callan et al. (2014), ‘comparisons of corresponding deciles in different years are not comparing the
incomes of the same people but are instead comparing what might be termed “income positions”, e.g. the incomes of the poorest ten per cent in each year. Changes in composition (e.g. more of the bottom decile being unemployed or self-employed with very low incomes in the recession) can also affect the observed patterns.’

12
FIGURE 3 CHANGE IN AVERAGE INCOME BETWEEN YEAR T AND YEAR T+1, BY YEAR T DECILE
Source: Analysis based on SILC 2004-2013.
Figure 3 illustrates how the average income for individuals in a given household income decile in Year t increased or decreased in Year t+1. We group the three ‘pre-recession’ years together, and then look at changes averaged over pairs of years, including 2009 to 2011, which had the sharpest falls in overall household income (in the years 2010 and 2011). The pattern is strikingly different from that provided by the usual snapshot analyses. There are substantial gains from year to year for the individuals that began in the lowest income deciles, while the greatest losses are for those that began in the top income decile. This broad pattern holds both in the pre-recession years, and during the period of recession and austerity. Moreover, similar patterns are found in other countries, such as Jenkins (2016) for the UK.
One potential explanation for such patterns is that movements into the bottom decile and top decile tend to reflect temporary shocks to income, and that it is the reversal of such temporary shocks which generates large percentage gains at the bottom and large percentage losses at the top. Jenkins (2016) however, cautions against a simple interpretation of this type, as some sensitivity tests he conducts suggest that the ‘reversion to the mean’ story does not fit well with the data. Caution is also needed in interpreting the size of the gains at the bottom: the fact that average incomes for the bottom decile are so low means that even large percentage gains typically lead to upward movement only to the second or third income decile.
-30
-20
-10
0
10
20
30
40
50
60
Bottom 2 3 4 5 6 7 8 9 Top
2004-07 2007-09 2009-11 2011-13

13
FIGURE 4 CHANGE IN AVERAGE INOME BETWEEN YEAR T-1 AND YEAR T, BY YEAR T DECILE
Source: Analysis based on SILC 2004-2013.
Figure 4 provides an alternative perspective, focusing on the recent (previous year) experience of households at different income positions (deciles). Thus, we look here at the average change in income over the previous year experienced by households who are currently in a given decile. The pattern now contrasts sharply with that of Figure 2 (which looked not at past income changes for the decile group, but the prospective changes in the following year). In Figure 2 we find that the greatest losses are at the lowest income deciles, and the largest gains are experienced by top income deciles. Broadly speaking, the contrast between Figures 2 and 3 arises because those who have arrived in the bottom decile are likely to have had a fall, while those who have arrived in the top are likely to have had an income rise. Given that some of these income ‘shocks’ are likely to be temporary, in the next period the individuals are likely to experience a change in the opposite direction.
The patterns in Figure 4 may be of interest in the light of the findings of Whelan et al. (2016), who find that while income losses were greatest at the top and middle of the distribution, a measure of ‘economic stress’ shows greater increases in middle income groups. The Whelan et al. analysis, which is based on a series of cross-sections between 2008 and 2012, identifies a number of factors which may be relevant to the explanation of this combination of results. Two points from the present analysis are also relevant. First, the fact that results which take account of ‘income net of housing costs’ remain similar to those for ‘income before housing costs’ suggests that the role of housing costs in explaining the contrast may be quite limited. Second, the analysis here identifies patterns of income mobility which could play a role in explaining the contrast. In particular, one might expect
-60
-50
-40
-30
-20
-10
0
10
20
30
Bottom 2 3 4 5 6 7 8 9 Top
2004-07 2007-09 2009-11 2011-13

14
that recent changes in income, as shown in Figure 4, could play a role in influencing patterns of economic stress.
From an income perspective, further analysis of the trajectories for individual households within SILC will be of interest. It may also be helpful to examine results for countries which have a longer run of panel data, to get an understanding of how longer-range income dynamics work.
4. ASSESSING POLICY IMPACT: DISCRETIONARY POLICY AND AUTOMATIC STABILISATION
A progressively designed tax-benefit system, when faced with an increase in unemployment and falling incomes, will automatically increase the level of state support to those affected through, for example, an increase in the number of individuals entitled to unemployment benefits and lower average tax rates on income. This is known as the automatic stabilisation effect of the tax-benefit system. When comparing the redistributive work done by a tax-benefit system over time however, discretionary changes to tax-benefit policy (for example, changes in the level of unemployment compensation available to the unemployed) also affect how much redistributive work is done by the tax-benefit system. In this section, we identify the balance between these two different elements – automatic stabilisation and discretionary changes in policy – on the overall change in the redistributive impact of the Irish tax-transfer system over the 2008 to 2013 period.
Between 2008 and 2013 in Ireland, substantial changes were made to the tax-benefit system as part of the austerity measures brought in in response to the crisis (specific changes have been well documented, see for example, Keane et al., 2014). In addition, the crisis in Ireland resulted in significant changes in the structure of the population, with the unemployment rate increasing from just above 4 per cent to approximately 15 per cent in less than five years. We begin the section by examining how the overall impact of the tax-benefit system changed during the recession. We then examine how much of this work was due to discretionary changes in tax-benefit policy during the period, and how much can be attributed to automatic stabilisation.
Table 4 shows the combined impact of the discretionary changes in policy and the impact of automatic stabilisation on the redistribution of income in 2008 (second column), 2013 (third column) and 2015 (final column). For each year, the top row of the table shows the Gini coefficient based on market income; that is, the distribution of income before any taxes are paid or transfers received. There is a marked increase in the inequality of the distribution of market income between

15
2008 and 2013 offset by a small reduction in 2015, with the Gini coefficient increasing from 0.52 to 0.59 between 2008 and 2013, falling back to 0.56 in 2015. The difference between the Gini based on market income and the Gini based on disposable income is known as the Reynolds-Smolensky (RS) index, and shows the overall reduction in inequality due to the tax-benefit system. Despite the marked increase in inequality of the distribution of market income between 2008 and 2013, the Gini coefficient based on disposable income increased only marginally.9 This is due to an increase in the redistributive work of the tax-benefit system, with the RS index increasing from 0.21 to 0.27. Separating the impact of the tax system from the impact of the benefit system, the final two rows of the table show that the benefit system had approximately three times more redistributive power compared to the tax system in Ireland, though both components of the overall system served to reduce income inequality. With the fall in market income inequality between 2013 and 2015, the RS index also fell slightly to 0.25.
TABLE 4 INCOME INEQUALITY MEASURES FOR MARKET, GROSS, DISPOSABLE INCOMES, AND REYNOLDS-SMOLENSKY INDICES, 2008 AND 2013
2008 2013 2015 Gini Coefficient
Market 0.52 0.59 0.56 Gross 0.36 0.39 0.38 Disposable 0.31 0.32 0.31 Reynolds-Smolensky Index Taxes and Transfers 0.21 0.27 0.25 of which: Taxes 0.05 0.07 0.07 Transfers 0.16 0.20 0.18
Source: Savage et al. (2017).
The increased work of the tax-benefit system in 2013 compared to 2008 is the combined impact of discretionary changes to policy and automatic stabilisation. Savage et al. (2017) developed a formal decomposition method that separately identifies the contribution of discretionary policy and the contribution of automatic stabilisation to changes in overall levels of inequality between two points in time. Applying the methods to Ireland between 2008 and 2013, they showed that approximately 75 per cent of the increase in the index of redistribution (Reynolds-Smolenksy) was due to automatic stabilisation, and the remaining 25 per cent was due to discretionary changes in policy. This implies
9 Savage et al. (2017) show that the difference in the Gini coefficient between 2008 and 2013 is not statistically
significant.

16
that, over the full 2008 to 2013 period, discretionary changes to direct tax and welfare policy during this period made a contribution towards offsetting the inequality-increasing influences of the crisis, as measured by the Gini coefficient; but that the major role in this regard was played by the pre-existing structure of the Irish tax and welfare system.
Figure 5 examines the impact of discretionary policy during the period in greater detail, showing the distributional impact of the set of austerity budgets between 2008 and 2013 on a fixed population.10 Discretionary policy changes during this period included reductions in nominal levels of working-age welfare payments, reduction in income tax bands and credits, the introduction of the Universal Social Charge, and the introduction of the Local Property Tax.11
The impact of discretionary policy during the period varied across the income distribution.12 The largest impact is at the top decile, where discretionary policy resulted in a 14 per cent reduction in income. The next largest impact is at the bottom of the income distribution, where the bottom two deciles lost just over 10 per cent of income. The 9th decile also suffered a loss of income of just over 10 per cent. Income losses in the middle of the income distribution were slightly lower, with income in deciles 3 to 8 declining by between 8 and 9 per cent. Broadly speaking, welfare changes play the main role in driving changes at the bottom of the distribution, while tax and public sector pay changes dominate for the top of the distribution.
10 Figure 1 is based on the 2013 population and income levels. A similar analysis on the 2008 population and income
levels produces similar results. More details can be found in Savage et al. (2017). 11 See Callan et al. (2013) for full details on the range of discretionary policy changes made during the period. In this
paper, we do not include the impact of indirect tax reforms, such as reforms to VAT, Carbon Tax, or DIRT. Callan et al. (2013) draw on existing research to include an approximation of the impact of such reforms, while Savage (2017) analyses the possibility of extending the SWITCH database to allow for analysis of indirect tax reforms.
12 Figure 5 shows the combined impact of reforms to tax and welfare schemes. Similar to the analysis of the RS index above, we can separate the distributional impact of tax reforms from welfare reforms using the SWITCH model. This is an area for future research.

17
FIGURE 5 DISTRIBUTIONAL IMPACT OF DISCRETIONARY CHANGES IN DIRECT TAX AND WELFARE POLICY, PERCENTAGE CHANGE IN HOUSEHOLD INCOME BY DECILE, BUDGETS 2009-2013
Source: Analysis based on SWITCH, the ESRI tax-benefit microsimulation model.
The tax-benefit system played an important role in offsetting increases in the inequality of the market income distribution during the crisis in Ireland. Even in the absence of any discretionary changes to tax-benefit policy during the period, substantially more people became dependent on welfare support, thereby increasing the redistributive work done by the tax-benefit system. This automatic stabilisation was responsible for the majority of the additional work done by the tax-benefit system in offsetting inequality increases. Analysis done here, complementing research by Savage et al. (2017), shows that discretionary policy changes also offset part of the increase in market income inequality, as measured by the Gini coefficient. Detailed analysis of the impact of discretionary policy however showed that the reduction in income due to these policy changes varied across the income distribution; the largest losses in income were concentrated at the extremes of the income distribution, resulting in income declines of up to 11 per cent at the bottom and up to 14 per cent at the top of the distribution.
5. CONCLUSIONS
Our findings point to a more nuanced view of the impact of the recession, and of tax-transfer policy, than has been available heretofore. There is no simple single answer to the question ‘Where did the burden fall?’. Instead, the answer to this question depends on the frame of reference.
The standard approach internationally is to assess inequality in incomes using cross-sectional or ‘snapshot’ evidence for pre-recession and end-recession years
-16%
-14%
-12%
-10%
-8%
-6%
-4%
-2%
0%Bottom 2 3 4 5 6 7 8 9 Top

18
(2008 and 2013). On this approach, the greatest losses are at the bottom, with lower losses in the middle reaches of the distribution, and the lowest losses at the top of the income distribution. There is also a small rise in the Gini coefficient, though this is not statistically significant. Updating these results with the latest available microdata on the distribution of incomes, real income at the bottom of the income distribution increased by more than average between 2013 and 2015, partially offsetting larger than average losses during the crisis.
An alternative approach looks at income changes from one year to the next. On this basis, between 2008 and 2013 the greatest losses are at the top of the income distribution, with lower losses for middle income deciles, and gains in particular for the bottom income decile. This pattern is common internationally.
Looking at policy impacts, we find that discretionary policy imposed losses which were greatest at the top and bottom of the income distribution with smaller losses in the middle income groups. However, the overall impact of policy on inequality is strongly influenced by the automatic stabilisation features of the tax/transfer system, such as the provision of unemployment compensation to those losing jobs. The combined impact of discretionary and automatic stabilisation components greatly limited the rise in inequality, as measured by the Gini coefficient.

19
REFERENCES
Atkinson, A. and Brandolini (2013). ‘On the Identification of the Middle Class’ in J. C. Gornik and M. Jäntti (eds), Economic Disparities in the Middle Class in Affluent Countries, Stanford: Stanford University Press.
Belfield, C., J. Cribb, A. Hood, and R. Joyce (2014). Living Standards, Poverty and Inequality in the UK: 2014, Institute for Fiscal Studies, London, 2014.
Callan, T., C. Keane, M. Savage and J.R. Walsh (2013). ‘Distributional Impact of Tax, Welfare and Public Service Pay Policies: Budget 2014 and Budgets 2009-2014’, ESRI Quarterly Economic Commentary Special Article, Winter.
Callan, T, C. Keane, M. Savage, J.R. Walsh and B. Colgan (2014). ‘Ireland’s Economic Adjustment: From Crisis to Recovery’ Intereconomics 49:6, 300-322.
FitzGerald, J. (2014). ‘The Distribution of Income, Social Welfare and the Public Finances’, Research Note Quarterly Economic Commentary, Summer, Economic and Social Research Institute, Dublin.
FitzGerald, J. (2015). ‘Problems Interpreting National Accounts in a Globalised Economy – Ireland’, Quarterly Economic Commentary, Summer, Economic and Social Research Institute, Dublin.
Keane, C., T. Callan, M. Savage, J.R. Walsh (2014). ‘Distributional Impact of Tax, Welfare and Public Service Pay Policies: Budget 2015 and Budgets 2009-2015’, in Quarterly Economic Commentary, Winter, ESRI, Dublin
Jenkins, S. and P. Van Kerm (2016). ‘Assessing Individual Income Growth’, Economica 83, 679-703.
Reynolds, M. and E. Smolensky (1977). Public Expenditures, Taxes, and the Distribution of Income: the United States, 1950, 1961, 1970. New York: Academic Press.
Savage, M., T. Callan, B. Nolan, B. Colgan (2017). ‘The Great Recession, Austerity and Inequality: Lessons from Ireland’, forthcoming Review of Income and Wealth.
Savage, M. (2017). ‘Integrated Modelling of the Impact of Direct and Indirect Taxes Using Complementary Datasets’ forthcoming Economic and Social Review.
Whelan, C.T., H. Russell, B. Maître (2016). ‘Economic Stress and the Great Recession in Ireland: Polarization, Individualization or ‘Middle Class Squeeze’?’, Social Indicators Research, 126: 503-526.

Whitaker Square, Sir John Rogerson’s Quay, Dublin 2Telephone +353 1 863 2000Email [email protected] www.esri.ieTwitter @ESRIDublin