increasing energy efficiency in new buildings … · southwest energy efficiency project saving...
TRANSCRIPT

INCREASING ENERGY EFFICIENCY IN NEW BUILDINGS IN THE SOUTHWEST
Energy Codes and Best Practices
August 2003

Southwest Energy Efficiency Project
Saving Money and Reducing Pollution through Energy Conservation
INCREASING ENERGY EFFICIENCY IN NEW BUILDINGS IN THE SOUTHWEST
Energy Codes and Best Practices
by
Larry Kinney
Howard Geller Mark Ruzzin
Prepared for
E-Star Colorado Colorado Governor’s Office of Energy Management and Conservation
The Energy Foundation
2260 Baseline Road, Suite 212 • Boulder, CO 80302 • tel: 303-447-0078 • fax: 303.786.8054 • www.swenergy.org

Acknowledgements The report was researched and written by Larry Kinney, Howard Geller, and Mark Ruzzin of the Southwest Energy Efficiency Project (SWEEP). Its sponsors include E- Star Colorado, the Colorado Governor’s Office of Energy Management and Conservation with funds from the U.S. Department of Energy, and the Energy Foundation with funds from the Hewlett Foundation. A number of people contributed to information contained in this document and/or provided useful feedback on an earlier draft. These include Alison Bailie, Mark Case, Jim Colgan, Barbara Collins, Craig Conner, Mike DeWein, Linda Douglas, Troy Ence, Jill Gilmore, Michael Glenn, Charlie Gohman, Mark Halverson, Dale Hoffman, Paul Hughett, Eric Makela, Joe McElvaney, Cosimina Panetti, Doug Parker, Bill Prindle, Rita Ransom, Carl Rald, Carl Schmidt, Doug Swartz, Paul Tschida, Dave Van Allen, Matt Wald, Daran Wastcjak, and David Wilson. Special thanks are due to Megan Edmunds and Steve Andrews of E-Star Colorado, Dan Hagan of the New Mexico Department of Energy, Minerals and Natural Resources, Dave McNeil of the Nevada State Energy Office, and to Diana Shankle, Dave Belzer, and other members of the staff of the Pacific Northwest National Laboratory’s Building Energy Codes Program. Each of these people provided substantial written comments on a draft of this report and made a number of useful suggestions. The authors are indebted to everyone who made suggestions and we took them all seriously. If errors remain, they are due to us, not to others. Of course, energy codes and related matters both in the Southwest and elsewhere remain large and important topics to which SWEEP intends to continue to contribute. Accordingly, all readers are urged to provide further suggestions concerning this report or related work that should to be undertaken. All views and opinions expressed herein are those of SWEEP and do not necessarily reflect the views of funders, contributors, or reviewers.
ii
Table of Contents
Section Page Acknowledgement . . . . . . . . . . . . . . . . . . . . . . . . . . . . . . . . . . . . . . . . . . . . . . . . . . ii Executive Summary. . . . . . . . . . . . . . . . . . . . . . . . . . . . . . . . . . . . . . . . . . . . . . . . . ES-1 1- A Brief Orientation on Energy Codes . . . . . . . . . . . . . . . . . . . . . . . . . . . . . . . . 1-1 Prescriptive, trade-off, and performance approaches 1-1 Some history 1-3 Current policy issues 1-5 What’s it all mean? 1-7 2- Building Codes and Activities to Achieve Efficiency in Buildings . . . . . . . . . . 2-1 Arizona 2-2 Colorado 2-12 Nevada 2-20 New Mexico 2-24 Utah 2-26 Wyoming 2-28 3- Analysis of Energy Savings Potential . . . . . . . . . . . . . . . . . . . . . . . . . . . . . . . . . 3-1 Residential building analysis 3-1 Housing characteristics 3-2 Residential building overall savings potential 3-8 Commercial building analysis 3-17 Analytical approach 3-17 Case studies of efficient commercial buildings 3-18 Description of buildings modeled 3-19 Deriving state-wide energy consumption estimates 3-28 Comparison of residential and commercial results 3-35 4- Recommendations . . . . . . . . . . . . . . . . . . . . . . . . . . . . . . . . . . . . . . . . . . . . . . . . 4-1 References . . . . . . . . . . . . . . . . . . . . . . . . . . . . . . . . . . . . . . . . . . . . . . . . . . . . . . . . R-1 Appendix A: Energy Code History Outline . . . . . . . . . . . . . . . . . . . . . . . . . . . . . . A-1 Appendix B: HVAC Installations in Arizona . . . . . . . . . . . . . . . . . . . . . . . . . . . . . .B-1
iii

Executive Summary Energy code adoption and enforcement in much of the Southwest is not far advanced in comparison with many other states. Of the six states, only Utah has up-to-date residential and commercial energy codes that are mandatory statewide. Areas without strong energy codes or enforcement tend to fall into two classes: those in which a very small number of buildings are being built, such as northern New Mexico, and those in which ENERGY STAR® and other programs that promote energy efficiency are active and growing quickly, such as Phoenix. Further, in virtually all jurisdictions, there is movement to adopt better codes or, where adopted, to increase efforts to enforce codes and educate the building community as to the value of designing and building energy-efficient structures. Energy codes can set the tone for energy efficiency, establish threshold criteria, affect the marketplace for both raw materials (e.g., windows) and finished products (buildings), and can be communicated to key actors (architects, engineers, builders). Further, supporting code implementation through education, training, and enhancing building inspection can maximize the energy savings and other benefits of up-to-date energy codes. Codes define the minimum necessary to achieve what currently counts as adequate energy performance, but they cannot ensure that first-rate buildings result. Stronger coordination between the code community and other entities like utility and government-supported efficiency programs will create natural synergisms in achieving the most important goal: fine, very energy-efficient buildings whose lifetime costs are substantially lower than the ordinary buildings that constitute most of current building stock. As ENERGY STAR, Building America®, and other energy efficient programs draw the public’s attention to the practicality and cost effectiveness of energy efficient buildings, the new awareness of better-educated consumers promotes better quality. The response of the marketplace to a more sophisticated buying public in such fast-growing cities as Tucson and Las Vegas is remarkable. Nevertheless, there remains large potential for cost-effective savings from better energy codes and promotion of “beyond code” new buildings throughout the Southwest region. Status of Codes and other Activities Arizona, the most populous state in the Southwest, adds over 50,000 new dwellings to the energy grids each year. A home rule state, many jurisdictions do not have any energy codes at all, including the City of Phoenix. Tucson implemented the 2000 version of the International Energy Conservation Code (IECC 2000) in July of 2003, and a number of other smaller jurisdictions have adopted this or a similar up-to-date code. Phoenix appears to be on a course to adopt the National Fire Protection Association 5000 (NFPA
ES-1

5000) code, probably by the end of 2003. The commercial component of the NFPA 5000 refers to ASHRAE Standard 90.1, as does the IECC 2000, so a wealth of documentation, training material, and software support is available. However, the NFPA 5000 references ASHRAE Standard 90.2 for its residential energy code, which is both less stringent than the IECC 2000 code and is largely without supporting user manuals, training materials, or software. Accordingly, the implementation process may be fraught with difficulty, and support tools should be developed if Phoenix and other jurisdictions adopt the NFPA code. Arizona has over 61 ENERGY STAR certified builders and has produced 20,000 ENERGY STAR homes through July 2003, over 20% of the nation’s total. In fact, Tucson’s more than 50% market share for ENERGY STAR new homes leads the nation, due in large part to well-designed, effective utility programs. Colorado is also a home rule state, so code adoption has to be accomplished piecemeal, jurisdiction by jurisdiction. The Denver metropolitan area is growing quickly, but it has out-of-date energy codes and the process of updating is delayed by the fact that most members of the Denver City Council and its Mayor were recently replaced. There is local support for both IECC codes and the NFPA 5000. Fully two dozen jurisdictions in Colorado have up-to-date international codes on the books, and more are being added. It is expected that as many as 75% of Colorado’s jurisdictions will have up-to-date energy codes on the books by 2004. The state has an active residential energy efficiency program conducted by E-Star Colorado, which trains code officials and builders and tracks the certification process for both existing and new homes. There are 30 certified ENERGY STAR builders in Colorado. Over 75% of the ENERGY STAR homes built in the state, a total of 1200, were built in the 12 months preceding July 2003, so the program is growing rapidly. On the other hand, a field study of new homes built in Fort Collins showed that many new homes fail to perform as well as they should, pointing out the need for better education and training. Colorado’s largest utility company, Xcel Energy, conducts a program that targets new commercial buildings, helping in the design process and providing financial incentives for achieving buildings whose energy performance is substantially superior to a model commercial building code. Nevada is growing quickly, particularly in the south. The population of the Las Vegas metropolitan area has doubled to 1.5 million since 1990, and Clark County adds about 7,000 new citizens each month—and 25,000 new single-family homes each year. Although state-owned buildings must comply with ASHRAE 90.1-1999, most jurisdictions in Nevada have out-of-date versions of model energy codes on the books, predominantly the 1992 MEC. Nonetheless, there are now 41 builders that are official
ES-2

ENERGY STAR partners, ten of which are now producing only ENERGY STAR homes, most of them large production builders. In the last 12 months, these builders have produced 78% of the ENERGY STAR homes in Nevada. As of July 2003, 12,100 homes have been labeled ENERGY STAR since the Nevada program’s inception; of these, 61% were labeled in the 12 months preceding July 2003. In addition to ENERGY STAR, Nevada has a very active Environments for Living program, whose builders guarantee that heating and cooling bills will be no greater than an amount specified at the initial sale of the building. Officials estimate that 4,800 Environments for Living homes will be built in Nevada in 2003, at least 50% of which will be platinum level homes designed to exceed the energy performance of MEC 1995 code levels by 50% (Davenport 2003). New Mexico has a decade-old version of the model energy code (with state amendments), but implementation is vigorous only in the Albuquerque area, where about half of the 700 new homes in the state each month are being built. A two-year process to adopt a version of the IECC 2000 code was sidetracked in December of 2002 by code opponents and advocates of the NFPA 5000 code. As of the summer of 2003, the status of adopting up-to-date energy codes in New Mexico was still in flux. Nonetheless, there are 15 ENERGY STAR builders in New Mexico, one of which, Artistic Homes in Albuquerque, builds only ENERGY STAR homes. Artistic has constructed 1,339 ENERGY STAR-labeled homes, 75% of which were built in the 12 months preceding July 2003. Utah is the only state in the Southwest that has passed a mandatory statewide IECC 2000 code for all new residential and commercial buildings. Implementation of the code, which became effective in January of 2002, is largely a local matter and those involved in both training and testing estimate that code compliance was roughly 50% in the first year after the new code became effective. By way of setting a good example for the private sector, all new state buildings are being designed to use at least 25% less energy that required by the ASHRAE 90.1-99 commercial energy code. There are 22 ENERGY STAR builders in Utah, one of which, Ence Homes, has built over 892 ENERGY STAR homes, 98% of the ENERGY STAR homes built in the state as of July 2003. Wyoming had about 1400 new housing starts in 2000, and the state is growing slowly. The 1997 Uniform Building Code is the current statewide code, and while it references the 1995 Model Energy Code (MEC) in an appendix, the Fire Marshal's office, which has code responsibility, has yet to officially adopt the appendix. Accordingly, the code is not in effect. A new policy adopted in April 2003 directs the Fire Marshal to adopt and implement a recent energy efficiency code, such as the IECC 2000, and apply that code
ES-3

to all state buildings by the summer of 2003. The policy also recommends that local jurisdictions add recent versions of the model energy code to cover both residential and commercial privately-owned new buildings. There are 11 builders active in Wyoming listed by the U.S. EPA as ENERGY STAR partners, but as of July 2003, there have been no houses labeled as ENERGY STAR homes in Wyoming. Energy Savings Potential Analyses in this report suggest that energy savings of well over 50% above base-case structures are not only possible but are achievable very cost-effectively. More important, studies of innovative programs throughout the Southwest illustrate that a large number of efficient buildings are being built in certain jurisdictions as a result of well-designed and implemented public/private partnerships. Residential Toward estimating savings associated with building homes at various levels of energy efficiency, we defined and modeled two generic home types, each of 1800 square feet. In Colorado, Utah, and Wyoming, the home was built with two stories and had both a basement and crawl space. In Arizona, Nevada, and New Mexico, the home was built as a single story slab-on-grade. A number of energy-relevant characteristics of each home were varied to produce homes reflective of common practice today (base), just-meets-code (IECC 2000) and best practice (ENERGY STAR +) levels of performance in the climates of the major cities in each of the six states. The results are illustrated in Figure S-1.
ES-4

Figure S-1. Annual Site Energy Use of Three Representative Homes in Six Southwestern States
0
20
40
60
80
100
120
140
160
180
AZ CO NV NM UT WY AVG
Ann
ual E
nerg
y U
se, M
MB
tu/y
ear
Base Code ES+
In order to estimate costs and benefits of building new homes to higher levels of efficiency, three scenarios were defined which are reflective of the relative percentages of each dwelling that may be built over the periods of 2001-2010 and 2011-2020. We term these as business-as-usual (BAU), moderate improvement, and strong improvement scenarios (Table S-1). The BAU scenario assumes that minimal effort is made to expand the adoption and enforcement of energy codes or promote the construction of high-performance ENERGY STAR (and ENERGY STAR +) homes. Table S-1. Penetration of Energy-Efficient Homes Built between 2001 and 2020 under Three Scenarios of Efficiency Efficiency Scenario
Base between 2001-2010
Code between 2001-2010
ES+ between 2001-2010
Base between 2011-2020
Code between 2011-2020
ES+ between 2011-2020
BAU 60% 30% 10% 35% 50% 15% Moderate 20% 65% 15% 10% 70% 20% Strong 10% 50% 40% 5% 35% 60%
ES-5

We estimate that almost 2.3 million new single-family homes (2.95 million total dwellings) will be built in the Southwest in the two decades following the millennium. These results show that if policies are pursued that result in a business-as-usual scenario, by the year 2020 the single family dwellings built between 2000 and 2020 will be consuming almost 216 trillion Btu in the Southwest. This scenario assumes that 30% of new homes built during 2001-2010 meet the IECC code and another 10% achieve Energy Star + performance, and that half of the new homes built during 2011 and 2020 will meet code and 15 percent will be beyond-code, ENERGY STAR + dwellings. Under the moderate-improvement scenario, we assume that 65% of new homes built during 2001-2010 meet the code and another 15% are Energy Star +, and that during 2011-2020, 70% meet code and 2% achieve ENERGY STAR + performance levels. Savings in the Southwest versus BAU new housing stock of all of the new homes built in the region from 2001 through 2020 will be 12.8 trillion Btu in 2010 and 18.8 TBtu in 2020. This amounts to improvements of the moderate-improvement scenario over BAU of 11.5% in 2010 and 8.7% in 2020. Under the strong-improvement scenario, we assume that 50% of new homes built during 2001-2010 meet code and 40% are ENERGY STAR + homes. During 2011-2020, we assume that 35% will meet code while 65% will be ENERGY STAR + homes. Savings reach 27.5 TBtu in 2010 and 62.2 TBtu in 2020. This amounts to an improvement of 24.7% over the BAU scenario in 2010 and 29.0% in 2020. The enhancement of the high over the moderate-improvement scenario is 14.9% in 2010 and 22.0% in 2020. For residential buildings, gas savings tend to dominate over electric, especially in the second time period. Gas savings in the region average 66.2% of the total savings achieved in the moderate improvement scenario in 2010, and 72.2% of the total savings achieved in the strong improvement scenario in 2020. In other words, there is substantial potential to reduce energy use in new residential building through expanded adoption of up-to-date codes and promotion of “beyond code” construction techniques. The incremental costs to build homes that just meet code versus base-case homes vary by location from $1,500 to $3,700. The incremental cost to build ENERGY STAR + homes versus base-case homes varies form $7,000 to $8,500. In spite of somewhat higher initial costs, lifetime (30-year) savings of ENERGY STAR + homes versus base homes average $17,000 under the conservative assumption that energy costs will track inflation. If energy prices outstrip inflation, conservation investments will yield even better returns.
ES-6

Commercial The commercial analysis begins by defining four generic building types that represent approximately 85% of the commercial/institutional floor area in the Southwest: an office; a retail outlet; a school; and a food services building. Similarly to the residential analysis, these buildings are modeled at three levels of energy efficiency which we term base, just-meets-code, and best practice. Figure S-2 shows the results of simulations of the relative energy intensity of these commercial buildings in the Denver and Las Vegas weather regions. The base case represents the efficiency of the average of existing commercial building stock. This is followed by a “just-meets-IECC 2000-code” case and by a case in which best current energy efficiency practices are employed in the design of new buildings. Figure S-2. Total Energy Intensity in kBtu/square foot/year of Each Building Type for the Southern (S) States (on the left) and Northern (N) States (on the right)
0
50
100
150
200
250
300
350
400
Office S Retail S School S Food S Office N Retail N School N Food N
kBtu
/sq
ft/yr
Base Code Best Practices As with the residential analysis, to predict energy use and savings in new commercial building construction associated with implementing codes and adopting best practices, we develop three scenarios. We call these business-as-usual (BAU), moderate-improvement and strong-improvement scenarios. Each scenario envisions different rates of implementation of code and best practices commercial and industrial buildings as shown in Table S-3. Again, the BAU scenario assumes a continuation of current policies, programs, and construction practices.
ES-7

Table S-3. Penetration of Energy-Efficient Commercial Buildings Built between 2001 and 2020 under Three Scenarios of Efficiency Efficiency Scenario
Base between 2001-2010
Code between 2001-2010
ES+ between 2001-2010
Base between 2011-2020
Code between 2011-2020
ES+ between 2011-2020
BAU 40% 50% 10% 25% 60% 15% Moderate 20% 65% 15% 10% 70% 20% Strong 10% 50% 40% 5% 35% 60% We estimate that approximately 3.1 billion square feet of new commercial buildings will be built in the Southwest in the two decades following the millennium. These results show that if policies are pursued that result in a moderate-improvement scenario, the savings versus the business-as-usual case building stock of all of the new commercial buildings constructed in the region from 2001 through 2020 will be 9.90 trillion Btu in 2010 and 20.1 TBtu in 2020. Under the strong-improvement scenario, the savings reach 23.5 TBtu in 2010 and 55.4 TBtu in 2020, 2.8 times the savings in the mid-efficiency scenario. For commercial buildings, electricity savings tend to dominate over gas, especially in the second time period and more so in the strong improvement scenario. Electric savings in the region average 72.1 percent of the total savings achieved in the moderate improvement scenario in 2010, but fully 84.2% of the total savings achieved in the strong improvement scenario in 2020. To put these savings figures in context, the strong improvement scenario will save the annual energy consumption equivalent of 10,800 just-meets-code moderate sized (30,000 square foot) office buildings in the region in 2010 and 25,600 office buildings in 2020. The results of the analyses of savings of both residential and commercial buildings are illustrated in Figure S-3.
ES-8

Figure S-3. Region-wide Comparison of Commercial and Residential Energy Savings Potentials under Two Scenarios of Energy Efficiency Improvement; Annual Energy Savings in 2010 and 2020 (TBtu)
9.9
23.520.1
55.4
12.8
27.5
18.8
62.2
0
10
20
30
40
50
60
70
Moderate 2010 Strong 2010 Moderate 2020 Strong 2020
Savi
ngs (
Tri
llion
Btu
/yea
r)
Commercial Residential The 3.1 billion square feet of projected new commercial construction in the Southwest between 2001 and 2020 corresponds to 1.7 million new 1800 square foot homes, about 25% less than the number of new single-family homes (2.3 million) projected to be constructed in the region over the same time period. Yet as illustrated in Figure S-3, under the strong-improvement scenario, residential savings opportunities are only about 10 percent greater than commercial, and in the moderate-efficiency scenario, opportunities for commercial savings slightly exceed those in residential in 2020. Thus, there is somewhat greater energy savings potential per unit of floor area in new commercial buildings compared to new homes, but the absolute savings potential is approximately equal in the two sectors. Table S-4 shows the energy savings potential in the two scenarios of efficiency improvement broken down by state and fuel type, for both building types. It indicates that the largest electric savings potential is in Arizona, while Colorado followed by Utah offer the largest gas savings potential. The electricity savings under the strong improvement scenario of 18,700 gigawatt hours in 2020 are equivalent to the power supply of about 3,273 megawatts of generating capacity. Thus, by following the strong improvement scenario, the region could avoid building six 550 megawatt new power plants. The savings in natural gas, 53.7 trillion Btu in 2020, is the equivalent of 60 billion cubic feet of natural gas. This in turn is equivalent to the output of 1,200 typical natural gas wells in the region.
ES-9

Table S-4 also shows aggregate dollar savings in 2010 and 2020 versus the BAU scenario of the moderate and strong improvement scenarios. The dollar savings are on a net basis, meaning they are the value of the energy savings (both gas and electric) in 2010 and 2020 minus the incremental first cost for constructing more efficient new buildings in those years. Table S-4. Combined Residential and Commercial Savings by State, Region, Fuel Type, and Millions of 2003 constant dollars in 2010 and 2020 under the Moderate and Strong Scenarios.
Moderate Improvement Scenario State Total
Savings in 2010 (TBtu)
Total Elec Savings in 2010 (GWh)
Total Gas Savings in 2010 (TBtu)
Total Dollar Savings in 2010 (Mil $)
Total Savings in 2020 (TBtu)
Total Elec Savings in 2020 (GWh)
Total Gas Savings in 2020 (TBtu)
Total Dollar Savings in 2020 (Mil $)
AZ 7.53 1,871 1.15 42.7 14.6 3,360 3.13 155.6CO 6.72 476 5.1 37.7 10.41 845 7.53 116.0NV 3.56 743 1.03 6.8 6.29 1,074 2.62 56.2NM 1.37 56 1.18 6.5 2.18 199 1.51 21.0UT 3.31 208 2.6 20.6 4.98 351 3.77 57.0WY 0.26 14 0.21 2.3 0.44 24 0.35 5.4Region 22.8 3,369 11.3 116.5 38.9 5,851 18.9 411.2
Strong Improvement Scenario State Total
Savings in 2010 (TBtu)
Total Elec Savings in 2010 (GWh)
Total Gas Savings in 2010 (TBtu)
Total Dollar Savings in 2010 (Mil $)
Total Savings in 2020 (TBtu)
Total Elec Savings in 2020 (GWh)
Total Gas Savings in 2020 (TBtu)
Total Dollar Savings in 2020 (Mil $)
AZ 16.39 4,156 2.21 98.2 40.83 9,407 8.73 432.4CO 15.04 1,448 10.1 95.2 31.68 3,239 20.63 362.7NV 8.72 1,960 2.03 33.8 21.22 3,948 7.75 211.3NM 3.06 155 2.54 14.9 7.42 754 4.85 76.5UT 7.3 600 5.25 48.2 15.37 1,307 10.91 177.7WY 0.47 37 0.34 4.1 1.08 72 0.83 12.6Region 51.0 8,355 22.5 294.3 117.6 18,726 53.7 1,273.1 The pattern that emerges is quite clear: the strong improvement scenario is the most cost effective and achieves the most savings of total energy, electricity, gas, and dollars. A net of about $1.3 billion is saved in the year 2020 in the strong improvement scenario, compared to about $410 million in 2020 in the moderate improvement scenario.
ES-10

Furthermore, we estimate that the net savings during 2001-2020 would equal about $2.8 billion in the moderate improvement scenario and $8.4 billion in the strong improvement scenario. These estimates are conservative in that they do not reflect the energy and dollar savings that will occur after 2020 as a result of more efficient buildings constructed prior to and during 2020. This analysis shows that for both residential and commercial buildings, there are clear economic advantages to the strong-improvement scenario which accelerates the adoption of efficiency measures over time, in large measure reflecting the greater percentage of best practice buildings being constructed. By furthering the adoption and enforcement of up-to-date building codes and expanding efforts to promote and stimulate “best practice,” the Southwest region can realize significant energy and economic benefits. Recommendations This report urges the passing, supporting, and enforcing of up-to-date codes as well as expanding efforts to promote the construction of highly-efficient new buildings that significantly exceed minimum code requirements. This should go hand-in-hand with increasing the stringency of the codes over time as new design techniques and efficiency measures become widely accepted. Finally, we recommend expanded efforts at evaluating the actual energy savings consequences of implementing up-to-date codes and building structures to ENERGY STAR and Building America standards. In particular, we recommend:
• Upgrading to Up-to-Date Building Codes. Up-to-date energy codes such as the latest version of the IECC can help states and municipalities raise energy efficiency and reduce electricity consumption and peak demand cost-effectively. Adopting a recent version of the IECC (i.e., 2000 or more recent) is especially important in the Southwest region because this model energy code has a window efficiency requirement pertaining to maximum solar heat gain coefficient (SHGC) of 0.4 for windows for warmer regions with 3,500 heating degree-days or less. This requirement, if followed, will lead to substantial cooling load reductions and thus air conditioning electricity use and peak demand savings in hotter states such as Arizona, New Mexico, and Nevada.
• Expanding Training and Technical Assistance Efforts to Achieve High Levels
of Code Compliance. Training and assisting architects, builders, building contractors, and building code officials is critical to the successful implementation of new building codes. Such activities can significantly improve code compliance and can be very cost-effective in terms of energy savings per program dollar. Training and technical assistance is needed in a variety of areas including
ES-11

integrated building design, proper sizing and installation of HVAC systems, proper air tightness and insulation procedures, and the use of state-of-the-art technologies and design strategies such as daylighting, duct sealing, air infiltration reduction, indirect-direct evaporative cooling, and reflective roofing options. Compliance tools and training materials that support energy codes have been developed by a number of organizations, most significantly the Pacific Northwest National Laboratory (PNNL) which is funded by DOE. Most of PNNL’s recent work has been in support of the IECC. However, if a number of jurisdictions adopt NFPA 5000, it would be appropriate to develop training materials and compliance software in support of the residential portion of the code, ASHRAE 90.2.
• Expanding Efforts to Promote the Construction of Highly Efficient New
Buildings that Exceed Minimum Code Requirements. Through integrated design approaches as advocated in the ENERGY STAR and Building America programs, it is possible to reduce energy consumption by 30 to 50 percent relative to code requirements, and do so cost-effectively. In order to foster increased construction of highly-efficient new homes and commercial buildings, energy agencies and utilities should expand design assistance efforts, financial incentives, demonstration and promotion programs, and performance guarantees. These efforts can be modeled on the successful programs for promoting highly-efficient new homes and new commercial buildings operating throughout the U.S.
• Raising the Performance Bar. The history of the evolution of energy codes has
followed improvements in building practices which in turn are influenced by programs such as ENERGY STAR and Building America. Raising the performance criteria for meeting ENERGY STAR and Building America minimums can have immediate positive effects in these “upper end” homes and eventually upgrade the performance of buildings at the lower end of the efficiency curve via code upgrades. The ENERGY STAR threshold is far from being unduly demanding in the Southwest, as evidenced by the large fraction of new homes qualifying in cities like Tucson, Phoenix, and Las Vegas. There is still plenty of room for improvement, particularly in this region where dry climates allow for cost-effective space cooling.
• Evaluating Real Savings. Good evaluation can suggest mid-course corrections
that will enhance the effectiveness of the code-approval process as well as programs aimed at promoting energy efficiency. We suggest a mix of instrumentation of a small number of buildings in conjunction with a phone survey-and-bill analysis of a larger number of buildings, following up with on-site visits to both high and low outliers in search of practical wisdom. The idea is to quantify actual performance efficiently while producing rational explanations of performances that are both better and worse than expectation. We would expect
ES-12

the results to enlighten designers, builders and code officials. Finding out what works and what doesn’t helps tailor training for all parties, makes the inspection process more pointed (and thereby efficient), and produces better buildings with fewer callbacks.
ES-13

Section 1
A Brief Orientation on Energy Codes Building codes were developed to ensure the mechanical integrity and safety of buildings and their systems. Without codes, more buildings would be destroyed in natural disasters, more would be consumed by fires, and more would experience plumbing, wiring, and a host of other problems. As a consequence, insurance companies, mortgage companies, code officials, as well as consumers have an interest in ensuring that new buildings meet—and preferably exceed—code. Energy codes have been added to building codes to help make buildings more energy efficient. Success in achieving an energy-efficient building can easily result in a structure that is more comfortable, easier to maintain, less expensive to operate, lasts longer, and has lower lifetime costs. As builders master the craft of producing energy efficient structures, construction costs approach costs for less efficient buildings (Kinney 2003a). A number of builders have developed effective new building tactics and have trained their workers and subcontractors to “do the right things right.” The marketplace for building materials is also being affected. Increasing demand for such products as efficient HVAC equipment, low-e windows, and duct-sealing mastic drives down the price. Codes affect other market forces as well. Increasingly, lenders are taking into consideration lower lifetime costs (particularly as reflected in the likely magnitude of future energy bills) in qualifying potential buyers. This opens the market for energy-efficient homes to a larger audience. Codes specify minimum requirements that must be met for a building to be approved by local code authorities. In a given jurisdiction, the energy efficiency of a group of new buildings is likely to be distributed relative to a “just-meets-code” building with some below and some above code. By hypothesis, the shape of the distribution is likely to be reflective of the degree to which builders and code officials are knowledgeable about energy-efficient building in general and the current code in particular, the stringency with which the code is enforced, and a host of market factors. Although we have some evidence of the effect of these factors, some of which is shown in Section 2, little systematic data is available to be able to produce precise distributions of the frequency of energy-efficient buildings at all. Nonetheless, the mere fact of the existence (or even planned existence) of an energy code in a jurisdiction often has the effect of opening an informative dialog about meeting code requirements and building energy-efficient buildings.
1-1

Prescriptive, Trade-Off, and Performance Approaches The prescriptive approach to producing an energy code requires specifying the minimum energy-related characteristics that must be present in a building. For example, the characteristics of the insulation (ability to retard heat flow, R-values) used for ceilings, walls, basements, crawl spaces, ducts, and service hot water pipes are specified, as are the conductive properties (U-factors) and Solar Heat Gain Coefficients (SHGC) of fenestration, and seasonal energy efficiency rating (SEER) for air conditioning equipment. Many of these specifications vary with climate zone; others, like allowable techniques and material for sealing building envelopes and duct work, do not. Historically, the prescriptive approach has been somewhat detailed, for it must take into account not only different climate zones (Texas alone has nine), but also the myriad options designers might choose in designing foundations, walls, attics, ceilings, HVAC systems, service hot water, and other key building elements. Given these complexities, a number of techniques and tools for simplifying the understanding and implementation of energy codes have been developed to make things easier for both code officials and builders. Toward the simple end of the spectrum of simple-to-complex statements of code requirements, the state of Montana reproduces key information about its residential model energy code on the broad side of a rectangular-shaped white carpenter’s pencil. “It’s the minimum: Ceiling R-38, Wall R-19, Crawlspace R-19, Basement (finished) R-10, Window R-2.5 (U – 0.4).” This approach is a handy reminder that raises builders’ awareness of code issues, but is insufficiently detailed to address issues that go beyond insulation and window specifications. As a consequence, the carpenters’ pencils also include the phone number of code-knowledgeable staff of Montana’s Department of Environmental Quality (Tschida, 2003). An upgraded version of Montana’s “key-code- information-on-a-stick” is yellow and adds information about the State’s ENERGY STAR program to the statement on codes.
The trade-off approach lies between the prescriptive and performance approaches. It is best implemented by software that allows designers to check their plans for code compliance, but permits the alteration of key elements as necessary. A trade-off approach allows for trading off enhanced efficiency in one component against decreased energy efficiency in another component. Typically, this approach is applied to envelope components (windows, walls, roofs, and foundations) and defines an overall efficiency for the entire envelope, measured in terms of an area-weighted U-factor. With this method, one may, for example, trade decreased wall efficiency (lower R-value or higher U-factor [U = 1/R]) for increased window efficiency (lower U-factor), or increased roof insulation. This method is less restrictive than prescriptive approaches because the components that exceed the requirements can compensate for those that do not meet the
1-2

code, yet the objective of realizing a home that is as energy efficient as called for in the code is met in ways that may be less onerous (or costly) for the builder.
The trade-off approach is implemented in the compliance software developed by the Pacific Northwest National Laboratory (PNNL) with support from the U. S. Department of Energy (DOE). This software may be downloaded for free to visitors of DOE’s Buildings Energy Codes website, www.energycodes.gov. For example, users of REScheck™ (for residential structures) may choose from three model energy codes (MEC 1992, 1993, or 1995) and two International Energy Conservation Codes (IECC 1998 or 2000), while users of COMcheck-EZ™ (for commercial structures) may choose ASHRAE Standard 90.1-1989, 90.1-1999, or IECC 1998, 2000, or 2001. The user interfaces for the residential and commercial programs are quite similar. In both cases, the user indicates the geographical area of interest and simply enters key information on the potential building’s envelope and its mechanical system. The software keeps a running tally of the percentage by which the potential building fails to meet or passes the chosen code. The process, which a user with modest experience can complete in ten minutes or so, yields both a compliance certificate and a checklist useful to both the code inspector and the builder. Note that although there is a good deal of complexity involved in the software development, the process is remarkably simple from the standpoint of the user. It quickly produces a clear, adequately detailed answer to the user’s question, “how does changing a particular building characteristic affect its energy performance?” It’s virtually impossible to produce this result as efficiently with the written form of the prescriptive process. Accordingly, REScheck and COMcheck-EZ are in wide use. The performance approach allows more creativity on the part of the designer. It’s an invitation to “embrace energy efficiency and build how you like,” but adds a key caveat. One must demonstrate that the proposed building is highly likely to be energy efficient using a method of proof all parties agree is trustworthy. In practice, this means that the building must be designed with the aid of a widely-used computer model approved by the code inspector. Typical software simulates energy performance on an hourly basis for a whole year as a function of relevant variables like the weather in a typical meteorological year and patterns of occupancy. The building’s energy use must be shown to be less than that of a “standard design” building that just-meets-code according to the prescriptive approach. Of course, the standard design building must have the same size and geometry as the proposed design and be simulated with the same software. Some History The development of energy codes piggybacked on other building codes and to some extent still does. A number of code-making bodies played a role, with the consequence that the history of code making is something of an alphabet soup with plenty of letters
1-3

and uneven texture. In the last few years, most bodies responsible for the development of codes have seen fit to make their contributions to enhancing the International Energy Conservation Code (IECC). For over a decade, DOE has actively promoted the adoption of energy codes and has funded a number of activities to enhance the process. For example, DOE supports the Building Codes Assistant Project (BCAP) to help states and localities in adopting, strengthening, and implementing energy codes. DOE also funds the PNNL to develop and maintain the above-mentioned software, analyze the energy-saving and economic consequences of code adoption in a number of states, and provide a range of services to enhance the codes on a periodic basis. At the 2002 National Workshop on State Building Energy Codes, PNNL staff gave a brief history of code development, portions of which are outlined in Appendix A of this report. The American Society of Heating, Air Conditioning, and Refrigeration Engineers (ASHRAE) is a professional body of tens of thousands of members. Many members play an active role in subcommittees that guide research leading to the periodic upgrading of a wealth of energy information contained in four major handbooks and dozens of standards. In 1980, ASHRAE published an update to the 1975 standard, 90-1980, that consisted of three parts. Part A of that standard contained energy requirements for all buildings, and thus the primary outcome of this process was commonly referred to as ASHRAE Standard 90A-1980. Within several years, the Council of American Building Officials (CABO) developed a codified version of this standard termed the Model Energy Code (MEC). The 1983 MEC was followed by updates generally on a three-year cycle up through 1995. The 1992 MEC is important as it was designated in the 1992 Energy Policy Act as the minimum residential code (or equivalent state-developed code) that was required to be adopted by all states. During the 1980s, the updates to the MEC generally were related only to residential buildings. The portion of the MEC for commercial buildings essentially maintained the 90A-1980 standard. In 1989, ASHRAE produced Standard 90.1-1989 entitled Energy Efficient Design of New Buildings Except Low-Rise Residential Buildings. This was a comprehensive revision to its then-current Standard 90A-1980 for commercial buildings. A version of the 90.1-1989 standard written in code-compliant language was published in 1993, which became the basis of the commercial code portions of the 1993 MEC and subsequent revisions. A similarly comprehensive revision for residential buildings came out in 1993, Standard 90.2, Energy Efficient Design of New Low-Rise Residential Buildings. However, unlike 90.1 for commercial buildings, until recently, 90.2 for residential structures has not been adopted by national or international code-making organizations.
1-4

In 1994, representatives of a number of code-making bodies—BOCA, ICAO, and SBCCI-- formed the International Code Council (ICC). The aim was to produce a single set of national model building codes that could be approved by jurisdictions throughout North America. In 1998, the group released the first of the international codes, International Energy Conservation Code 1998 (98 IECC). The commercial element of the 98 IECC was based on the code-compliant language version of ASHRAE 90.1-89 but a simplified compliance section was added. In 1999, ASHRAE released Standard 90.1-1999, Energy Standard for Buildings Except Low-Rise Residential Buildings. Written in code-enforceable language (it incorporates directives), 90.1-1999 is a comprehensive revision of the standard of a decade earlier, 90.1-1989. This standard (and its successor 90.1-2001) became the basis for the commercial portion of the latest I codes--2001 supplement to the 2000 IECC and the 2003 IECC--the latter of which was released in the spring of 2003. In general, subsequent codes are more stringent than their forebears and modern codes tend to reflect new building practices and findings in building science. Three decades ago, only 36% of new homes were air conditioned; the number in 2002 was almost 90% (Halverson 2002). (However, in some mountainous areas of the Southwest, the percentage of new homes with central air conditioning is still much lower, only 10 to 20 percent.) Now air sealing of ducts and building envelopes are standard requirements of all modern codes, although these requirements are reputed to be enforced only rarely (Andrews 2003) Although minimal insulation values have always reflected the severity of the winter as expressed in local heating degree days, previous to the I codes, windows were treated as merely a part of the wall. Now, the whole window system, frame and all, must have a U value that does not exceed a specified maximum. More important for the Southwest, current I codes specify that the solar heat gain coefficient (SHGC) of all windows in cooling-dominated climates must be 0.4 or lower. Current Policy Issues Upgrading of energy codes is an ongoing process and a number of organizations are involved. Since energy codes effectively define the least energy-efficient building that may be built under the law, upgrading codes is a way of establishing the floor of building energy efficiency. As this report is being written, the U.S. Department of Energy is considering proposals to upgrade the next version of the IECC. A number of organizations are pressing to upgrade the code via a more robust performance approach which, unlike the present prescriptive approach, allows for such energy effects as building orientation and thermal mass to be taken into account. After decades of code development and modification, much of the debate still hinges on the above-mentioned issue of simplicity. On the one hand, it is desirable to have a code
1-5

written in simple-to-follow language with minimal references to arcane tables, so improvements to prescriptive codes concentrate on making the written version of requirements simpler or more flexible. For example, one proposed change of the prescription approach is to allow building window areas to be as large as a designer pleases, provided that the overall requirement for the envelope’s area adjusted heat transfer function (UA) is maintained at or below the code-specified maximum. This is an issue that reflects market trends in higher-end dwellings as well as empirical evidence that code inspectors rarely measure window areas in the field (Conner 2003). This is an area of particular concern in the Southwest since both peak demand and energy use increase with window area during cooling seasons (PNNL 2002). Nonetheless, a radical simplification to the IECC code has been developed and is being considered by DOE which shortens over 100 pages in the IECC 2000 code to 27 and simplifies climate zones by limiting their number to only 9 for the entire US while keeping demarcation lines along political boundaries (DOE 2003). The argument in its favor is that simpler codes are both easier to understand and easier to enforce, so compliance should be substantially greater. Since simplicity should also translate into lower costs to enforce, the new version of the code should yield more energy savings per dollar invested. On the other hand, very energy-efficient, elegant buildings can be achieved whose systems interrelate in complex but quite successful ways—yet parameters such as wall R-values may be less than values required by the prescriptive approach. Complex analyses are necessary to project the performance of such buildings, but much of the complexity can be hidden from the user thanks to modern computers that can accomplish hour-by-hour simulations for a typical year quite quickly. One approach to permitting these tradeoffs while achieving simplicity from the point of view of the designer (and the code official) is to use software sanctioned by an up-to-date performance code to analyze complex designs as well as to produce ratings. Officials of the National Resources Defense Council, the Residential Energy Services Network (RESNET), and the Florida Solar Energy Center argue that the resulting documentation could actually ease the compliance process for all parties while resulting in substantially better energy performance at lower cost (Goldstein et al, 2002). A second key issue revolves around which codes to adopt. In addition to the code bodies responsible for its development, I codes have been promoted by the U.S. DOE, BCAP, RECA (the Responsible Energy Codes Alliance), and other organizations which see advantages in energy savings and ease of compliance and enforcement of having up-to-date, uniform energy codes be maintained in as many jurisdictions across the country as possible. As of April 2003, approximately 20 states had adopted the 2000 IECC (Panetti 2003). Figure 1-1 at the end of this section shows BCAP’s July 2003 map of residential code status; Figure 1-2 shows the map of commercial code status.
1-6

However, just as advocates of international codes have achieved confluence of opinion by a number of codes bodies, thereby opening the way to what seemed to be something approaching a national code, the National Fire Prevention Association (NFPA) code seems to be developing advocates, particularly among union members of various building trades. A comprehensive code published in 2003, NFPA 5000 includes as its commercial requirement the current version of ASHRAE 90.1, which will make it consistent with up-to-date commercial IECC codes. On the other hand, the NFPA 5000 includes the 2001 version of ASHRAE 90.2 as its residential code. Since 90.2 has never been integrated into national-level codes, there is little supporting documentation and no software to aid in understanding the functional details of the code, a circumstance that threatens to delay practical residential energy code implementation by jurisdictions which adopt it. Several jurisdictions in the Southwest are considering adopting NFPA 5000, including the state of New Mexico and the cities of Denver and Phoenix. Should this transpire, we recommend that DOE and PNNL develop tools analogous to REScheck for the NFPA 5000 residential energy code.1 What’s it all mean? The energy code process can be a powerful and effective pathway to achieving energy-efficient buildings: state-of-the-art building codes can contribute to the reduction of energy use in new buildings by 15 to 30 percent or higher (Johnson and Nadel 2000, Kinney 2002). However, the path to achieving energy efficiency via the code process has both bumps and curves, and full savings potential is not easily achieved (Halverson et al 2002). Ideally, for a building energy code process to be successful, an aggressive but practical code must be developed—usually via accepting or slightly modifying a recent version of an existing model code based on an ASHRAE or International Energy Conservation Code (IECC) standard. The code must be one that is understood by all parties, adopted through at least a quasi-consensus process, enforced, and, most importantly, exceeded by most builders. None of these steps are painless or particularly easy, but codes are arguably the most cost-effective tool available for raising the energy efficiency of new buildings.
1 In preparation of this report, the authors used REScheck to examine a home typical of those being constructed in the Denver area, and in one case defined its energy-relevant features to just meet IECC 2000 code (see below, Section 3). We then adjusted details of fenestration, insulation, and the HVAC system to the minimums specified in ASHRAE 90.2 for the Denver area. The result was almost identical, and the 90.2 home also just met the IECC 2000 code. Although this single case is insufficient for making sweeping conclusions, it suggests that technical requirements of each code are not substantially inconsistent with one another in climate zones where heating dominates. For those in which cooling dominates, the IECC requirement that solar heat gain coefficients of windows must not exceed 0.4 is not matched by the ASHRAE 90.2, so it is likely that homes meeting the IECC would outperform those that merely meet 90.2.
1-7

As we shall see in the following section of this report, there are examples of successful code processes that have approached this ideal in the Southwest—and others where the reality in the field is substantially at variance with what’s called for in the codes.
1-8

Figure 1-1. Status of Residential Energy Codes as of July 2003 (Source: BCAP)
Residential Energy Code As of July 2003
ME WA
MT ND*VT MN
NY OR NH ID WISD MA
WY* MI CT PA RI
NJ
IANV* NE OH
UT MD INIL*VA CA DE WVCOt* MOt
KYKS
NC TNAZt* OK SCAR
NM GAMS* AL
LATX
FLAKt
Mandatory statewide code including state-owned buildings
HI*
*Code implementation depends upon voluntary adoption by local jurisdictions.
t90.1 Mandatory for state owned residential buildings three stories or less in height. NOTE: This map should be used in conjunction with BCAP’s Status of the State newsletter. Go to bcap-energy.org to view current newsletter.
2000 IECC or IRC or equivalent state code adoption or in adoption process (23
1998 IECC(11995 MEC or equivalent state code(71995 MEC or equivalent state code (partial adoption) (11993 MEC or equivalent state code (31992 MEC or equivalent state code(5No code or code not EPAct compliant(10
Building Codes Assistance Project Residential Map 7/10/03
1-9

Figure 1-2. Status of Commercial Energy Codes as of July 2003 (Source: BCAP)
As of July 2003Commercial Energy Codes Status
WA ME
VTt ND*MT MN
OR NH
DE CA
AK
AZt*
UT
WY
SD
NE
COt*
NM
TX
OK
KS
IA
WI
ILt
MOt
AR
LAMS GA
FL
SC
NC
VA KY
IN
MI
OHPA
NY MA T ID
C
NJ RI
MD NVt WV*
TN*
AL
Mandatory statewide code including state-owned buildings (21) ASHRAE 90.1-1999 or equivalent state code adoption or in adoption
process. HI*(15) ASHRAE 90.1-1989
State developed code does not meet 90.1-1989 (1)Weaker/None(12)
Building Codes Assistance Project * Code implementation depends upon voluntary adoption by local jurisdictions.Commercial Map 7/10/03 t Mandatory for State Owned Buildings
NOTE: This map should be used in conjunction with BCAP’s Status of the State newsletter. Go to bcap-energy.org to view current newsletter.
1-10

Section 2
Building Codes and Activities to Achieve Efficiency in Buildings
By way of orientation, we begin this section by looking at some population, building, and energy statistics of the six states in the Southwest (Tables 2-1 and 2-2). Table 2-1. Population, Land, and Energy Statistics for the Southwest State 2000
Pop (Mil-lions)
2020 Pop (Mil-lions)
Pop Growth 2000-2020
Land area (sq. mi.)
Land Area Rank in US
Pop Density (people/ sq mi)
Elec per capita in 1999 (kWh/yr)
Gas per capita in 2000 (millions of ft3 /yr
Arizona 5.13 7.15 39.4% 114,006 6th 45.0 12,200 41.9Colorado 4.30 5.44 26.5% 104,100 8th 41.3 10,100 83.6Nevada 2.00 2.70 35.0% 109,806 7th 18.2 14,600 98.7N Mexico 1.82 2.63 44.5% 121,365 5th 15.0 10,700 131.6Utah 2.23 3.23 44.8% 84,904 13th 26.3 10,400 77.0Wyoming 0.49 0.67 36.7% 97,818 10th 5.0 26,000 200.3SW Total 15.97 21.82 36.6% 631,999 25.3 11,936 80.2US Total 281.4 325.3 15.6% 3,537,438 79.6 11,975 79.0SW % of US
5.7% 6.7% 17.5% 17.9% 31.8% 93.6% 101.5%
Sources: US Census, EIA, Tellus Institute, State sources Table 2-2. Building Statistics for the Southwest State Housing
units 2000 % MF Housing
units 2020 Projected increase
Commercial area in 2000 (ft2 x 106)
Commercial area in 2020 (ft2 x 106)
Projected Increase (ft2 x 106)
Arizona 2,189,189 22.1% 3,315,965 1,126,776 1,183 2,287 1,104 Colorado 1,808,037 25.7% 2,425,482 617,445 1,269 2,172 903 Nevada 827,457 32.2% 1,226,788 399,331 588 1,218 630 N Mexico 780,579 15.3% 1,131,449 350,870 345 467 122 Utah 768,594 22.0% 1,148,279 379,685 490 826 336 Wyoming 223,854 15.2% 295,263 71,409 94 114 20 SW Total 6,597,710 23.3% 9,543,226 2,945,516 3,969 7,085 3,116 US Total 115,904,641 26.4% 133,714,815 17,810,174 SW % of US
5.69 7.14 16.54
Source: US Census; Tellus Institute
1-11

The land mass is large and the population is growing much faster than most of the rest of the nation. This will be reflected in high rates of construction of residential and commercial buildings over the first two decades of the century. Note that almost three million single and multi-family homes are projected to be built in the Southwest region over the 20 year period ending in 2020, an increase of 44.6 %. The additional 3.1 million square feet of commercial space to be constructed represents an increase of 78.5 %. There are areas in the Southwest where energy codes are non-existent or routinely ignored and where efficient new building stock is the exception, not the rule. Fortunately, most of these areas are not associated with substantial demand for new buildings and there is little construction. There are other areas where no energy codes exist but which are in a building boom where market competition and a number of other forces are resulting in a preponderance of buildings whose energy performance is quite good. Accordingly, in the following, we first look at the patterns of code adoption and compliance in each state, describing current circumstances and relating what appears to be on the near horizon. Then we note other trends in the new building sector that point toward increasing energy efficiency. ARIZONA Status of Energy Codes The most populous of the states in SWEEP’s region, Arizona has the highest rate of increase in energy demand and is adding the largest number of new residential and commercial structures to the grid each year. Arizona has state legislation calling for the voluntary adoption of the 2000 IECC for residential buildings and ASHRAE 90.1-1999 for commercial codes statewide. However, since Arizona is a “home rule” state—which in practice means that it’s quite difficult to pass state-wide energy codes that include concrete requirements for implementation—there are no readily-available mechanisms for applying pressure at the state level that could require local enforcement. On a statewide level, there has been an effort to develop consistent baseline standards and guidelines for potential incentive programs operating in Arizona. In May of 2001, Arizona’s governor signed legislation to establish a voluntary and incentive-based State Energy Code and to establish a State Energy Code Advisory Commission to review and recommend changes. The committee has met for close to a year and plans to produce a report in the fall of 2003 (Gohman, 2003). Although this and other forces are getting codes on the books in most parts of the state, the City of Phoenix, in the heart of the second fastest growing urban area in the nation (Atlanta is first), still has no energy code. That said, Phoenix and its surrounding suburbs are working to adopt energy codes. The Maricopa Association of Governments (MAG) is an active intergovernmental planning
2-2

and working group whose 27-member Building Codes Committee meets regularly to discuss code-related issues and to coordinate building permitting across jurisdictions. As of July 2003, 11 of the 25 jurisdictions in Maricopa County have up-to-date international codes on the books (Maricopa Association of Governments). The City of Phoenix itself is considering adopting a variation of the new comprehensive National Fire Prevention Association (NFPA) 5000 building code before the end of 2003 (McElvaney 2002). NFPA includes ASHRAE Standard 90.2-2001 as a residential energy code and ASHRAE Standard 90.1-2001 as a commercial code. As of July 2003, the committee responsible for developing the new code in Phoenix was working on changes associated with residential energy portions of the NFPA code (Lee 2003). The present schedule anticipates delivery of the recommendations to the Phoenix City Council and mayor shortly after a new Council is formed in the aftermath of November elections. The City of Tempe, which shares a common boundary with Phoenix, is also involved in a process aimed at adopting a residential energy code. Its city council has passed a resolution authorizing the citizens’ committee examining the issue to consider both NFPA 5000 and the IECC. Actions by Phoenix may influence Tempe’s code adoption process. The nearby City of Scottsdale plans to adopt IECC 2003 sometime during 2003.
Tucson, which is also experiencing a housing boom, passed IECC 2000 in the spring of 2003 and is implementing the new code as of July 2003 (Rald 2003). In addition, 21 communities in the area around Tucson (Pima County) have in place IRC (International Residential Code) or IECC codes.
The IRC contains a chapter on energy that is a simplified prescriptive compliance option written to be entirely consistent with the IECC. The IRC has two compliance options: (1) to follow a simplified prescriptive option in its Chapter 11; or (2) follow the IECC.
Table 2-3 summarizes progress as of the winter of 2002-2003.
2-3

Table 2-3. Status of Code Adoption in Arizona, April 2003
City/Town Code on Books Avondale 2000 IRC Cave Creek 2000 IRC Chandler 2000 IRC Gila River 2000 IRC Gilbert 2000 IRC Goodyear 2000 IRC, 2000 IECC Litchfield Park 2000 IRC Maricopa County (unincorporated) 2000 IRC Oro Valley 2000 IECC Peoria 2000 IRC Pinal County 2000 IECC Queen Creek 2000 IRC Sahuarita 2000 IECC Scottsdale 2000 IRC Surprise 2000 IRC Tempe 1994 UBC Tucson 2000 IECC Yavapai County 2000 IRC 21 communities in Pima County 2000 IRC
Source: League of Arizona Cities and Towns, Maricopa Association of Governments, Bob Lee
Other Efficiency Work
The absence of an energy code in Phoenix does not mean that all new dwellings are poor energy performers. The State Energy Office has been very active in promoting high-quality construction to builders in Phoenix, Tucson, and elsewhere. Charlie Gohman, Conservation & Engineering Manager of the Arizona Department of Commerce, has played a lead role in promoting energy-efficient construction practices to Arizona’s builders. A key part of this strategy has been to provide Arizona builders access to nationally-known trainers who preach the virtues of healthy, energy-efficient housing through holistic understanding of how homes work and attention to detail in insulating, air sealing, fenestration, and ventilation.
The strategy is clearly paying off. There are over half a dozen enlightened production builders like Pulte who routinely build to ENERGY STAR standards and beyond.2 A
2 ENERGY STAR is a national, voluntary program that promotes energy-efficient products, including new homes. To earn the ENERGY STAR label, a home must be 30 percent more efficient in heating, cooling, and hot water use than a comparable home built to the 1995 Model Energy Code (MEC), or 15 percent more efficient than a comparable home built to a state code, whichever is more stringent. Performance is assessed by a certified third-party rater who uses blower doors, duct blasters, and other instruments to verify that new dwellings meet or exceed 86 on the scale used by the Home Energy Rating System (HERS).
2-4

representative of an HVAC company that installs on average 120 new HVAC systems in the Phoenix and Tucson areas each working day estimates that at least half of the homes being built in those two areas are built to be very energy-efficient. Daren Wastchak, who runs a building energy inspection company, estimates that almost 6,000 of the 35,000 homes built in the Phoenix area in 2002 earned the ENERGY STAR rating, and the market share is rising rapidly (Wastchak 2002). Indeed, Arizona builds far and away more ENERGY STAR-rated homes than any other state in the union—Phoenix alone accounts for over 20% of the national total. As of July 2003, there were 61 ENERGY STAR certified builders in Arizona, and eight have committed to building all of their homes to ENERGY STAR standards. The three largest of these builders who have made the 100% commitment are Beazer homes of Arizona, a Tempe-based builder which has built over 3,900 ENERGY STAR homes; Trend Homes of Phoenix, which has built over 2,100; and Hacienda Builders of Scottsdale, which has built over 1,400. There have been 19,600 ENERGY STAR homes built in Arizona (EPA 2003). Several builders explained to SWEEP that the motivating factor is not energy codes, but rather the fact that they’ve figured out how to do the job right, and they want to deliver to their customers better homes with reasonable energy bills. Good homes means satisfied new homeowners and fewer expensive call backs. The fact that there’s usually a third party inspector to verify that ENERGY STAR standards have been met helps, of course, as does good old fashioned competition. When many Phoenix production builders are constructing tight, comfortable homes with monthly cooling bills of $40 or less, builders must compete by producing energy-efficient homes, or lose business. It’s clear from advertising brochures and buying patterns that consumers are becoming wiser and have grown to expect new homes on the market to be energy efficient. To be sure, up-to-date energy codes will help substantially in improving the products of those builders not constructing ENERGY STAR homes, but the rapid pace of ENERGY STAR market acceptance shows promise of playing a key role for years to come. Appendix B of this report describes how Chas Roberts, one of the largest residential HVAC companies in the US, has adopted a variety of tactics to increase the efficiency of HVAC installations in new homes in Phoenix and Tucson. The City of Scottsdale has an active voluntary Green Building Program that was initiated in 1998. According to a recent article written by the program’s administrators, “the program’s goals are to reduce the environmental impact of building; achieve both short and long-term savings of energy, water and other natural resources; and encourage a healthier indoor environment” (Floyd and Peaser, 2003). As of the end of 2002, 79 builders had submitted 183 buildings for building permits under Scottsdale’s green program, which includes mandatory measures consistent with modern energy codes and a
2-5

number of other energy and environmental measures which can earn points toward achieving “entry level” or “advanced level” green buildings. Importantly, Scottsdale’s code inspectors are now fully qualified to assess green buildings, and builders who submit their homes under the program have their permits processed in two weeks rather than the traditional four.
Both the electric and the gas utility companies in the Tucson area sponsor programs that provide incentives to builders to build homes that are 30% better than the Model Energy Code. Carl Rald, Energy Programs Coordinator for the City of Tucson’s Operations and Energy Office tells SWEEP that the homes are not only constructed better, they also have two important qualities that make them stand above both conventional “just meet” code homes or ENERGY STAR homes: they are all required to have controlled mechanical ventilation, and every home is thoroughly tested by well-trained technicians provided by the utility companies, as described in the sidebar below (Rald 2002).
* * * * * * *
Tucson Utilities’ Efficiency Programs for New Homes
(Note: this is an abbreviated version of a case study on Tucson Utilities’ efficiency programs for new homes; the full version is available for download on SWEEP’s web site, www.swenergy.org/programs/index.html.)
Tucson grew 20% in population and 24% in area from 1990-2000; the metropolitan area (Pima County) has a population of about 900,000. In recent years, Pima County has averaged about 10,000 new residential building permits per year, with single-family residential structures being added at the rate of almost 500 per month (Tucson Planning Department 2001).
With this many new homes coming on line, a healthy competition has developed between the electric and gas utilities serving the Tucson metropolitan area, resulting in a number of comfortable, healthy homes whose energy use is quite moderate. Both utilities conduct programs that promote energy-efficient new construction—and work closely with builders to make it happen.
Tucson Electric Power Program
Tucson Electric Power (TEP) is an investor-owned utility. Its Guarantee Home program was designed to include the steps shown by building science research to be key in constructing homes that are healthy, safe, comfortable, durable, and affordable. TEP guarantees that its homes will cost less than some maximum amount to heat and cool for the year, expressed to customers in dollars per day. In practice this runs from $0.80 per day for 900 square foot homes built by Habitat for Humanity to $4.00 per day for 10,000 square foot mansions constructed by custom builders. More typical homes, like 1850 square foot structures constructed by
2-6
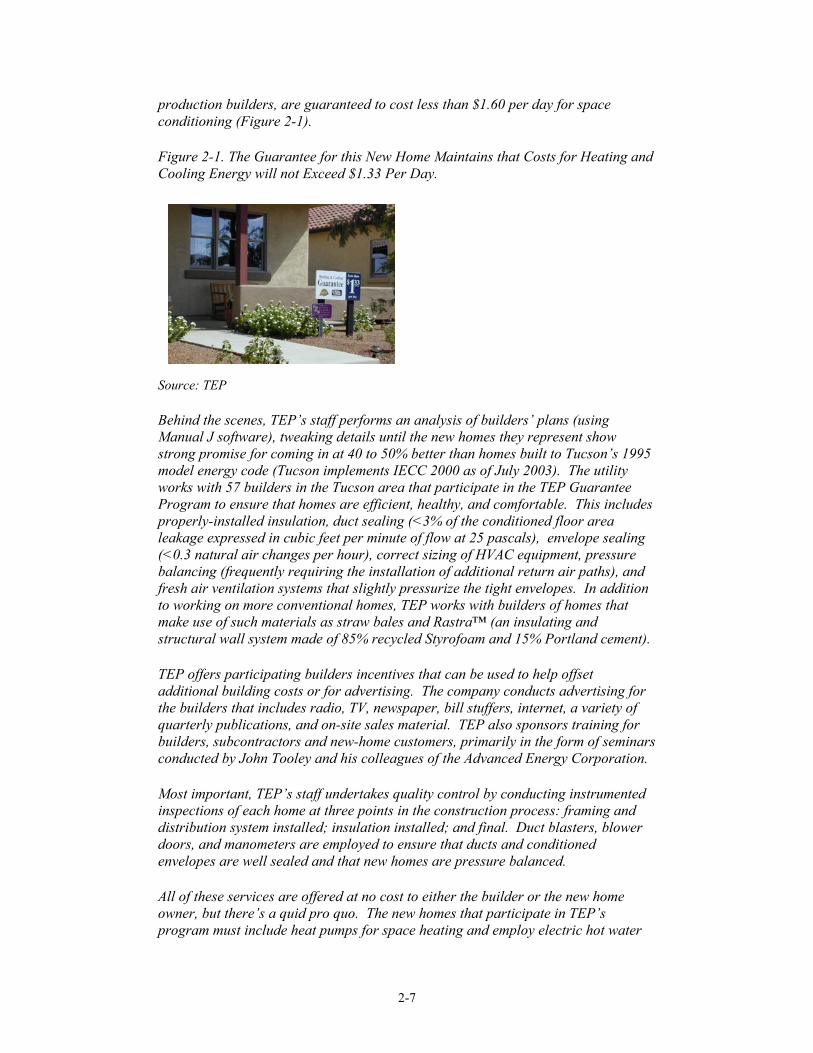
production builders, are guaranteed to cost less than $1.60 per day for space conditioning (Figure 2-1).
Figure 2-1. The Guarantee for this New Home Maintains that Costs for Heating and Cooling Energy will not Exceed $1.33 Per Day.
Source: TEP
Behind the scenes, TEP’s staff performs an analysis of builders’ plans (using Manual J software), tweaking details until the new homes they represent show strong promise for coming in at 40 to 50% better than homes built to Tucson’s 1995 model energy code (Tucson implements IECC 2000 as of July 2003). The utility works with 57 builders in the Tucson area that participate in the TEP Guarantee Program to ensure that homes are efficient, healthy, and comfortable. This includes properly-installed insulation, duct sealing (<3% of the conditioned floor area leakage expressed in cubic feet per minute of flow at 25 pascals), envelope sealing (<0.3 natural air changes per hour), correct sizing of HVAC equipment, pressure balancing (frequently requiring the installation of additional return air paths), and fresh air ventilation systems that slightly pressurize the tight envelopes. In addition to working on more conventional homes, TEP works with builders of homes that make use of such materials as straw bales and Rastra™ (an insulating and structural wall system made of 85% recycled Styrofoam and 15% Portland cement).
TEP offers participating builders incentives that can be used to help offset additional building costs or for advertising. The company conducts advertising for the builders that includes radio, TV, newspaper, bill stuffers, internet, a variety of quarterly publications, and on-site sales material. TEP also sponsors training for builders, subcontractors and new-home customers, primarily in the form of seminars conducted by John Tooley and his colleagues of the Advanced Energy Corporation.
Most important, TEP’s staff undertakes quality control by conducting instrumented inspections of each home at three points in the construction process: framing and distribution system installed; insulation installed; and final. Duct blasters, blower doors, and manometers are employed to ensure that ducts and conditioned envelopes are well sealed and that new homes are pressure balanced.
All of these services are offered at no cost to either the builder or the new home owner, but there’s a quid pro quo. The new homes that participate in TEP’s program must include heat pumps for space heating and employ electric hot water
2-7

heaters. The company recommends (but does not require) 12 SEER heat pumps and encourages consideration of solar water heaters.
New homeowners who participate in TEP’s program are rewarded with lower electric rates than non-participants for the life of the home. The three-tier rate is designed to provide an annualized 12%, 18% or 22% lower rate to the new homeowner and subsequent owners for the lifetime of the dwelling. All TEP Guarantee homes automatically receive the 12% option. If the homeowner agrees to time-of-use residential tariffs, the rates are lower still (the 18% option). Finally, if program participants elect time-of-use rates and agree to install solar or heat pump water heaters, their rates are the lowest offered by the utility to residential customers (the 22% option). According to Linda Douglas, TEP’s Project Director, close to 60 percent of participants choose time-of-use rates, and in some projects, close to 100 percent install solar (Douglas 2002).
Every TEP Guarantee home meets or exceeds ENERGY STAR criteria because of requirements for fresh-air ventilation, properly installed insulation, pressure management, and lower duct leakage standards. In addition, they employ a 100% inspection protocol rather than inspecting only a 15% sample of homes, the minimal requirement for production builders under EPA’s ENERGY STAR program guidelines.
The period of guarantee is three years, and customers receive annual reports of total energy use and cost plus electric costs of space conditioning. (TEP calculates space conditioning costs by subtracting average energy used in shoulder months--when neither heating nor cooling is required--from months in which one or the other is used.) Occasionally, perhaps one in twenty, a customer will also receive a credit on their energy bill. However, if the amount over the guaranteed amount is of much magnitude, TEP will re-inspect the home to identify and solve the problem (Figure 2-2).
2-8

Figure 2-2. TEP guaranteed maximum daily average costs for heating and cooling (total space conditioning) versus actual are shown in the figure below for 108 new homes between 1601 and 2000 square feet. Note that most actual costs are substantially below guaranteed, although about 5 percent are above. (Source: TEP)
July 2001- July 2002 General Housing Group 1601 - 2000 Sq. Ft. (Avg 1740)
$-
$0.50
$1.00
$1.50
$2.00
$2.50
1 7 13 19 25 31 37 43 49 55 61 67 73 79 85 91 97 103Individual Homes
Spac
e C
ondi
tioni
ng $
/ Day
Guarantee H/C Cost Actual H/C Cost
Builders are pleased with the program primarily because potential homeowner demand is high—the program helps sell homes. They also like the fact that the higher-quality homes they build minimize call backs, and if there are problems, TEP usually gets called before builders do (Sandweiss 2002).
For its part, TEP is enthusiastic because the program renders a useful service for their customers that’s clearly appreciated—comfortable homes and modest energy bills build loyalty and the process enhances TEP’s branding. Further, the construction standards result in homes with a lower peak demand for energy, with is particularly important during the summer. This coupled with the increased number of heat pumps and electric water heaters on line during the wintertime plus time-of-use pricing helps to smooth the load profile—and enhance the utility’s bottom line. Most funds for the program come out of the company’s operating expenses so represent shareholder investments. In short, the program is a solid business venture for TEP (Figure 2-4). One of four new homes in Tucson is a TEP Guarantee program home; there were 2047 homes built under the program in 2002 and the company is optimistic that by virtue of several new large national builders joining, the program will expand (Douglas 2003).
Figure 2-3 shows weather-normalized total electric energy consumption of homes that participated in the TEP program through 2002 and that of “baseline” homes—non-participating homes with conventional compressor-based air conditioning, as well as gas-fired hot water heaters and furnaces. Note that participant homes both diminish peaks in the summer and fill in valleys in the winter. The result is a much more attractive load profile from TEP’s point of view—and lower energy bills for customers.
2-9

Guarantee vs Baseline Homes Total SampleYear Ending July 2002
Both Samples Weather Normalized
0200400600800
100012001400160018002000
1 2 3 4 5 6 7 8 9 10 11 12
Months of Year
kWh
Con
sum
ptio
n
Guarantee Homes Baseline Homes
Source: TEP
Southwest Gas Program
Southwest Gas (SG) conducts a new homes program in Tucson called Energy Advantage Plus. It was established shortly after the TEP Program in part to help the gas company compete for heating market share. Participating builders usenatural gas appliances for both space and water heating. Although there are no guaranteed savings to the new homeowner, the Southwest Gas program, which uses HERS software, gives each home a HERS rating, and the homes that are in the top tier are ENERGY STAR dwellings.
The SG program has three tiers. “Program Level 1” represents a target of a 15 % improvement over Tucson’s modified 1995 MEC, providing builders with plan reviews and visual inspection of energy-relevant features of new homes. In the Home Energy Rating System (HERS) rating scheme, Level 1 homes rate at 83 to 84.5. SG pays an incentive of $125 per home, where the money is made available to participating builders to underwrite their advertising efforts on a 50% cost-share basis.
In response to builder interest, Energy Advantage Plus now has two additional tiers, HERS 85 and HERS 86 and beyond. This third tier qualifies dwellings as ENERGY STAR homes, and SG puts $150 into the cooperative advertising fund for each of these. For both of these higher level homes, SG uses a combination of visual inspections and instrumented testing on all models and on a sample of participating dwellings. For custom built homes, they sample at 100 % and for production-built homes, they sample at 15% or more, often exceeding ENERGY STAR requirements.
2-10

So far, 138 builders participate in the SG program, and almost 20,000 homes have been built or committed to its standards since the program’s inception. According to Rita Ransom, Residential Marketing Specialist who has been with the Southwest Gas program from the start, as the program matures, first tier homes are becoming the exception and ENERGY STAR homes are becoming the rule. The utility estimates that in 2002 about 3500 dwellings will be constructed to Energy Advantage Plus guidelines in the Tucson area, roughly 35% of the new residential market (Ransom 2002).
Southwest Gas hires nationally-known trainers like Mark LaLiberte to conduct seminars for groups of builders and also to work with individual builders in the field on a one-on-one basis. In addition, the company advertises the program in local print media as well as via bill stuffers, routinely including the names of all participating builders. Southwest Gas also provides a handful of advertising services for its builders, including multi-color brochures and information packets that would be expensive for builders to produce on their own.
Overall Results
Over 70 percent of the new single-family homes being constructed in Tucson are built under one or the other of these utility-sponsored programs. As a direct result, practical wisdom in achieving energy-efficient homes has become the rule among both the local and national builders operating in the Tucson area. Each utility spends in the neighborhood of one million dollars per year to run its program, and this fiscal commitment is increasing. In addition to defraying the costs of plan reviews and home inspections, this includes healthy budgets for training and advertising. This works out to be less than $500 per home.
* * * * * * *
Another code development in Tucson stems from the work of an intentional community, Civano, which was formed on set-aside land in the 1970s in response to the first energy crisis. Working with the City of Tucson, the community has developed what it calls “IMPACT (Integrated Method of Performance and Tracking) Standards.” According to Civano’s web site, “the IMPACT Standards explore how it is possible, over time, to reach a balance between growth, affordability, and achieving a greater integration with our environment. The Standards address energy efficiency, resource and environmental awareness, and community-strengthening goals, and provide a means of measuring progress toward attaining them.” Under IMPACT, all homes in the Civano community are built to use less than 50% of the energy of a dwelling designed to just meet MEC 95 standards (Figure 2-4).
2-11

Figure 2-4. South-Facing Facades of Homes in the Civano Community
Many homes in the Civano area have active solar hot water systems, but unhappily a number of the collectors have developed leaks (Rald 2002). “We’re still in the finger-pointing phase,” Carl Rald reports, “but the problem seems to stem from a collector manufacturer in the Phoenix area.” There doesn’t appear to be widespread disenchantment with the solar energy as such, but the incident serves as a reminder of the importance of quality control in achieving good, long-term performance from energy efficiency and renewable energy measures.
2-12

COLORADO Status of Energy Codes Colorado is a home rule state, so local jurisdictions preside over the energy code adoption and implementation processes. At least ten large jurisdictions and a handful of smaller towns have adopted IECC 2000 residential energy codes and ASHRAE 90.1 1999 commercial codes. In addition, there is activity in at least six other cities and counties that show promise that up-to-date codes will be adopted soon. A number of other jurisdictions, including the City of Denver, have implemented modified versions of the 1995 MEC as a residential energy code as well as some version of ASHRAE 90.1 for commercial buildings. According to a City of Boulder building official who chairs a Colorado Statewide Codes Committee, 75% of Colorado’s jurisdictions are expected to have adopted an International code by early in 2004 (Dardano 2003). Table 2-4 describes the state of building energy codes in the largest of Colorado’s jurisdictions. Table 2-4. Code Adoption Status in Colorado as of July 2003 County City Residential Energy Code Commercial Energy Code Adams None None Brighton None None Commerce City Planning for IECC Planning for IECC Thornton 2000 IECC ASHRAE 90.1-99 Westminster 2000 IECC ASHRAE 90.1-99 Arapahoe 1995 MEC ASHRAE 90.1-89 Aurora 1989 MEC ASHRAE 90.1-89 Columbine Valley IRC Englewood None None Greenwood Village 2000 IECC ASHRAE 90.1-99 Littleton IRC Archuleta IRC Boulder 2003 IECC, Feb 03 ASHRAE 90.1-99 Boulder 2000 IECC ASHRAE 90.1-99 Lafayette IECC Longmont 1998 IECC Colorado Energy Guidelines
(ASHRAE 90.1-89) Louisville 1995 MEC ASHRAE 90.1-89 Superior IECC Broomfield Broomfield 1995 MEC MEC 95 (97 UBC) Chaffee IRC Poncha Springs IRC Denver Denver 1995 MEC ASHRAE 90.1-89 Douglas Local Code None Castle Rock 1995 MEC ASHRAE 90.1-89 Parker 2000 IECC ASHRAE 90.1-99 Eagle Minturn IRC
2-13

El Paso 2000 IECC ASHRAE 90.1-99 Colorado Springs Planning for IECC Fremont Planning for IECC Planning for IECC Canon City IRC Garfield Glenwood Springs 2000 IECC Jefferson 2000 IECC ASHRAE 90.1-99 Arvada 1995 MEC ASHRAE 90.1-89 Golden None None Lakewood 1986 MEC 1986 MEC Larimer None Colorado Energy Guidelines
(ASHRAE 90.1-89) Fort Collins 1995 MEC (amended)
Planning for IECC ASHRAE 90.1-89
Logan IRC Sterling IRC Mesa Collbran IECC DeBeque IECC Fruita IECC Grand Junction 1998 IECC ASHRAE 90.1-89 Palisade IECC Montezuma 2000 IECC 2000 IECC Cortez 2000 IECC Mancos IECC Morgan Planning for IECC Planning for IECC Pitkin Aspen Planning for IECC Planning for IECC Rio Blanco IRC Rangely IRC Summit IRC (Planning for IECC) Planning for IECC Breckenridge IRC Frisco 2000 IECC 2000 IECC Silverthorne IRC Weld Planning for IECC Planning for IECC Updates on code adoption in Colorado are available at http://coloradoenergy.org/codes/colorado.asp E-Star Colorado, a public-interest organization based in Denver, is active both in promoting the adoption of up-to-date codes and in training code officials throughout the state. Fort Collins has a residential code that is a modified version of 1995 MEC and a commercial code that incorporates ASHRAE 90.1-89. Plans are afoot to pass an up-to-date International code, perhaps the simplified version due out in 2004. In early 2003, the municipal utility and City Council in Fort Collins adopted goals of 15% peak demand reduction and 10% electricity savings per customer over a ten-year period. To achieve these goals, the municipal utility will implement a number of energy-efficiency programs, among them the provision of training and technical assistance tailored to both code inspectors and builders active in Fort Collins. This, in combination with adopting
2-14

an up-to-date IECC by early 2004, should result in new buildings with better energy performance. MEC 95 is on the books in Colorado Springs, but it is not well enforced (Andrews 2002). Colorado Springs Utilities is the largest municipal utility in Colorado and has recently expanded programs to promote energy efficiency. There is interest on the part of the utility’s staff in promoting the adoption and enforcement of modern energy codes. There is a great deal of new construction underway in the Denver area, but the City has only a modified version of MEC 95 for a residential code and ASHRAE 90.1-89 for commercial. There is interest in passing modern International codes, but there are a number of barriers to adopting up-to-date energy codes in Denver. Some relate to perceptions on the part of trade unions that IECC 2000 codes would force changes in procedures that would entail job loss, so there is a contingent that is supporting NFPA 5000 as an overall building code. While this would have the effect of upgrading commercial codes to ASHRAE 90.1-99, it would involve switching to ASHRAE 90.2 for residential, which may have the effect of retarding the implementation of an energy efficiency code. In June of 2003, Denver elected a new mayor and many new members of the City Council (most incumbent office holders in Denver could not run due to term limits.) There is hope that these officials will move to adopt policies that actively promote energy efficiency, including modern building codes. A number of organizations, including E-Star Colorado, the Sierra Club, the Wirth Chair in Environmental and Community Development Policy of the University of Colorado, and SWEEP are active in promoting up-to-date energy efficiency codes in Colorado. Several code jurisdictions in Colorado give permit fee reductions for buildings that analysis shows have ratings above a certain threshold. For example, the City of Longmont qualifies dwellings for rebates that meet ENERGY STAR standards, and whose final blower door tests, taken by an independent third party, show that homes are as tight as claimed in the permit documentation. Although Longmont’s rebate is only $75, it has stimulated production builders such as Centex to undertake a comprehensive quality control program (Van Allen 2003). Boulder County has IECC 2003 on the books and the City of Boulder has adopted IECC 2000 codes, but with an interesting twist reflective of the community’s interest in sustainability and being as “green” as possible. See sidebar.
2-15

* * * * * * *
Residential Energy Efficiency in Boulder, CO
Boulder has had a green points program for residential construction for five years, so when officials decided to implement the 2000 IECC, they elected to combine key features of the green points program with the new code. According to Cory Schmidt, Chief Building Official, all building permits for new homes and additions are required to attain a minimum number of “green points” on a sliding scale that varies directly with the size of the dwelling (Schmidt 2002). Accordingly, a new home of up to 1500 square feet must attain 50 points, where one of 3,000 square feet must attain 75 points. Remodeling jobs are also required to attain a minimal number of green points, again depending on the extent of the job. Before any other points can be earned, points reflective of the current IECC must be integrated into the green points building permit process as illustrated in Table 2-5 below: Table 2-5. Number of Green Points Awarded for IECC Values
Category IECC Values
Green Points
Glass U-Value 0.05 0 0.45 2 0.40 4 0.35 6 0.30 8 Wall Insulation R-11 0 R-13 1 R-15 2 R-19 3 R-24 4 Ceiling Insulation
R-30 0
R-34 1 R-38 2 R-42 3 Floor Insulation
R-15 0
R-19 1 R-24 2 Basement Insulation
R-10 0
R-13 1 R-19 2 R-24 3 Slab Insulation R-5 0 R-7 1 R-10 2
2-16

Crawl Insulation
R-15 0
R-19 1 R-24 2 Heating Equipment
78% 0
84% 2 90% 4 94% 6 Air Conditioning
11 SEER
0
12 SEER
1
13 SEER
2
14 SEER
3
In addition to these measures, green points may also be accumulated by:
• The use of recycled materials; • Simplicity of design to minimize land use; • Water conservation and xeriscape landscaping; • Energy efficient plumbing (demand water heater; device for saving hot water); • Hard-wired CFL lighting; • Energy-efficient appliances; • Natural cooling measures; • Extra HVAC measures (e.g., heat recovery ventilation, hydronic heating, radiant
slab, whole house fan); • Solar (hot water and both active and passive space heating); • Air quality measures (e.g., closed combustion heating appliances; HEPA filter,
low VOC paints, infrastructure to support alternative fuel vehicle); and • Other innovative approaches (products or designs that help exceed IECC and
Green points program overall building performance). In practice, plans must be submitted along with the results of a REScheck computer printout and a Green Points form. These are reviewed before a building permit is issued. Compliance with some of the items are self reported by the builder, but City inspectors check most items during the construction process. Doug Parker, a Boulder-area builder who specializes in solar additions and major retrofits, finds the energy-efficiency elements of Boulder’s code to be reasonable. “After I got my architect up to speed in running REScheck, it’s usually a piece of cake to get the Green Points I need for plan approval.” (Parker 2002). Parker routinely does careful air sealing, super insulation, high-quality window replacement, and upgrades the heating system in his retrofits, so his view may not represent builders in the area who are less oriented toward energy efficiency. When major retrofits entail work on more than half of the home, the Boulder code stipulates that the whole house must be brought up to code. That’s usually
2-17

practical, but once in a while, it would be outlandishly expensive and virtually impossible to do. Fortunately, a modification to Boulder’s code implemented in October 2002 allows a variance when, for example, gaining access to existing attics would entail major surgery, since such would be inconsistent with the “reuse and recycle” spirit of the Green Points program. Corey Schmidt reports that the first year of implementation was difficult for both the City’s staff and local builders, but with experience and a handful of practical modifications, things are going more smoothly as of the winter of 2002-2003. Nonetheless, plans are afoot to do more training for both builders and the City’s code enforcement staff, and E Star Colorado gave a seminar in Boulder for code officials and builders in early 2003.
* * * * * * *
Other Efficiency Work ENERGY STAR The ENERGY STAR program in Colorado is active and is accelerating its pace. E-Star Colorado is the primary organization that conducts the ENERGY STAR program for Energy Rated Homes of Colorado and provides Home Energy Rating Service (HERS) ratings for both new and existing dwellings. E-Star Colorado trains inspectors, advocates for energy efficiency improvements in buildings, trains builders and code inspectors, and has alliances with the financial community to help secure mortgages linked to energy efficiency. As of July 2003, there were 30 ENERGY STAR partner builders in Colorado who have built 1200 ENERGY STAR labeled homes since the program’s inception. The program is accelerating; in the 12 months preceding July 2003, 71% of the program’s total were built (EPA 2003). The two most productive ENERGY STAR builders in the past 12 months were Engle (579), which became an ENERGY STAR builder in 2002, and Lifestyle Homes (178). Lifestyle Homes, McStain Neighborhoods, Sopris Development, and Habitat for Humanity of Denver have all committed to building 100 % of their homes to the ENERGY STAR standard. E-Star Colorado conducts an annual New Millennium ENERGY STAR Builder Awards program through which innovative ENERGY STAR builders may compete in several categories (region of operation, builder type, etc.). The award process, which aims at promoting good buildings, good builders, and the ENERGY STAR program itself, seems successful on all counts and award-winning builders are quick to include the fact in their promotional materials. The state sponsors a BUILT GREEN COLORADO new homes program that has certified over 15,000 homes as of 2003. While the performance requirements of the program are
2-18

not as stringent as ENERGY STAR, the program is moving towards performance levels comparable to ENERGY STAR. New Commercial Building Design Assistance Xcel Energy, the largest utility in Colorado, conducts a design assistance program modeled after the award-winning program the utility has been conducting in Minnesota for a decade.3 The utility works with designers of commercial buildings as early in the process as possible to encourage the adoption of an integrated design approach that weighs dozens of energy-relevant options via sequential modeling using DOE-2 modeling software. The utility absorbs some soft costs associated with the modeling process and extended design time and also provides incentives to the builders keyed to peak load savings achieved by better-designed buildings. Importantly, the utility sticks with the building through the construction, commissioning, and monitoring-and-verification steps. As of August 2003, Xcel Colorado has nine buildings representing 2.4 million ft2 enrolled in the new commercial buildings program. No buildings are completed yet but one should be soon. According to Bill Gruen, Xcel’s manager of the program, projected energy savings relative to code (ASHRAE 90.1-1989) range from 17 to 56%, with 30% being the mean (Gruen 2003). The structure that came in at 56% savings is a new $70 million Kaiser Permanente office building in Denver that was the subject of a June 2, 2003 article in the Denver Post, “Xcel investing millions in conservation plans: Savings means fewer new power plants.” The owners received a $220,000 cash award from Xcel, and annual energy bills are expected to be lower by $90,000 per year versus a “just-meets-code” building. Evaluation The history of code development has resulted in but few in-field evaluations of actual before-and-after code building quality and energy use. An instructive exception was undertaken in Fort Collins, which implemented a modified version of the 1995 MEC in 1996. Toward assessing the energy-related consequences of the code, the municipal utility that serves the area co-sponsored a study of new single-family homes built between 1994 and 1999. The analysis indicated an average annual savings of 175 therms after the code went into effect, about half the savings predicted to result from code-driven improvements. The assessment also included instrumented field inspections of 20 homes in construction and 40 that were recently completed. The inspections revealed a pattern of leaky duct work, oversized HVAC equipment, and inadequate air sealing that together account for the disappointing savings.
3 The American Council for an Energy-Efficient Economy (ACEEE) engaged in an extensive process leading to bestowing awards for particularly innovative and effective energy efficiency programs. In March 2003, ACEEE published “America’s Best: Profiles of America’s Leading Energy Efficiency Programs” (York and Kushler, 2003). The report included a profile of Xcel Energy’s Commercial and Industrial New Construction Program in Minnesota, which won an award as an “Exemplary Program.”
2-19

“Now that we know what the problems are, we can seek solutions,” observes Doug Swartz, an official of Fort Collins Utilities and principal author of the evaluation report. (Swartz 2002). Providing feedback and training to builders heads the list.
* * * * * * *
Problems and Opportunities in New Fort Collins’ Homes
The City of Fort Collins produced a useful brochure with the above title that draws inferences from the study of new homes and gives practical counsel to both builders and potential homeowners. Here are some highlights: Problems: Minimums versus optimums: Energy codes set minimum requirements rather than defining the best way to build a house. However, code requirements often became standard building practices; there were few attempts to exceed codes. Nonetheless, code violations were commonplace, with oversized and poorly-installed air conditioning equipment and leaky ducts being the most frequent offenders. Low construction standards: Construction standards varied widely. For work in hard-to-access areas, standards sometimes appeared low, suggesting speed often took priority over quality. Lost opportunities: Many problems could have been avoided easily and at moderate cost on the front end, but solutions are prohibitively expensive in completed homes. Solutions: “Whole house” approach: Use it in both design and construction to produce homes that deliver what buyers expect: comfort, health and safety, durability, and low energy bills. Sun-conscious design: Take advantage of daylighting and wintertime heating benefits while reducing unwanted summer solar gains. Pay close attention to orientation of the home and placement, sizing, and shading of windows. Select low-solar-heat-gain windows where needed to avoid too much solar heat. Quality shell: Build a tight, well-insulated shell to improve comfort and reduce heating and cooling needs. Specify high-performance windows. Indoor air quality: Build a tight house so that ventilation can be controlled and pollutant paths sealed. Use materials that produce few pollutants. Specify sealed-combustion gas equipment. Heating and cooling systems: Size the equipment and distribution system appropriately. With forced air ductwork, consider a simpler duct system, make the ducts permanently airtight, and provide a way to balance air flow to different rooms.
2-20

Quality control: Establish procedures to ensure that components have been installed, that they meet construction standards, and that they work as part of the whole house system.
* * * * * * *
NEVADA The population of the Las Vegas metropolitan area has doubled to 1.5 million since 1990, and Clark County adds about 7,000 new citizens each month. Percentage wise, this makes Las Vegas the fastest growing metropolitan area in the U.S., a fact that is reflected in the over two thousand new single-family housing starts per month and rapidly increasing electric use. Status of Energy Codes
Nevada has a mandatory state-wide energy code consisting of modified versions of the 1986 MEC for both new residential and commercial buildings. As of 2002, State-owned facilities must comply with the 1999 version of ASHRAE 90.1. In addition, many local jurisdictions, including most where substantial numbers of new homes are being built, have adopted more recent versions of the MEC. The 1992 version of MEC has been adopted in the greater Las Vegas area. The 1995 version of MEC is enforced by the City of Reno and Washoe County in northern Nevada. Table 2-6 gives the current state of code adoption as of the summer of 2003.
Table 2-6. Energy Code Adoption in Nevada.
Jurisdiction/Area Residential Code Commercial Code State Buildings ASHRAE 90.1 1989 Clark County MEC 1992 MEC 1986 Las Vegas MEC 1992 MEC 1986 North Las Vegas MEC 1992 MEC 1986 Henderson MEC 1992 MEC 1986 Mesquite MEC 1992 MEC 1986 Boulder City MEC 1995 MEC 1986 Reno MEC 1995 MEC 1986 Lyon County MEC 1993 MEC 1986 Balance of State MEC 1986 MEC 1986
According to Dave McNeil, Energy Program Manager with the Nevada State Office of Energy, only the state legislature can authorize changes in state-wide minimum standards for building energy efficiency, and the last time they authorized changes was in 1985, resulting in the state's adoption of the 1986 MEC (McNeil 2002). In 1995, an attempt was made to secure authority to update these minimum standards, but the legislation died in committee. The state legislature has provided that local jurisdictions may adopt more
2-21

stringent energy codes, which has occurred as noted above. There are only outdated commercial energy codes in the state, save for state-owned facilities where plans are checked for an engineer’s stamp that the building is consistent with ASHRAE 90.1, but enforcement is not undertaken.
The Nevada State Energy Office promotes awareness of energy codes and tries to stimulate more energy-efficient building practices generally. To evaluate the degree to which as-built homes meet or exceed current codes, in 2002 the State Energy Office contracted for an independent study of 200 recently-built homes in the Las Vegas and Reno areas, where the vast majority of new homes in the state are being constructed. Both plan review and on-site inspections (the latter including air leakage testing of each home's envelope and duct system) were analyzed. Funding for the study was provided by the State Energy Office, Sierra Pacific and Nevada Power companies, and DOE. Findings of the study project, entitled “In-Field Residential Energy Code Compliance Assessment and Training Project,” will be delivered to the report sponsors in August of 2003 (Makela 2003). The goal of the study project was to provide a reference point of common understanding for both home builders and code officials regarding current construction practice. The report examines the construction upgrades that would likely be necessary to achieve compliance with various code upgrades under consideration, thus supporting constructive discussion of construction industry impact associated with adoption of up-to-date codes.
Other Efficiency Work
Above-code building efficiency efforts are supported in Nevada by Energy Rated Homes of Nevada, the U.S. DOE Building America Program, Environments for Living, and the U.S. EPA's ENERGY STAR Program, all of which are supported by the Nevada State Energy Office. Only a few large builders in the Las Vegas area were involved in the ENERGY STAR program until a big push was made to add others in mid-2002. This followed on the heals of the region’s 2001 energy crisis and resultant renewed interested in the role of energy efficiency in reducing electric and natural gas bills. This very public process resulted in extensive media coverage of various builders and building inspectors in the local newspapers—and a healthy competition ensued. As a result, there are now 41 builders that are official ENERGY STAR partners in Nevada, 10 of which are now producing only ENERGY STAR homes. Importantly, those who have committed to producing only ENERGY STAR homes tend to be large production builders. In the last 12 months, they have produced 78 percent of the ENERGY STAR homes in Nevada.
As an illustration of the recent rapid growth of the ENERGY STAR program, as of July 2003, 12,079 ENERGY STAR homes have been labeled in Nevada. Of these, 7,384, or 61 percent, were labeled in the 12 months preceding July 2003 (EPA 2003). One knowledgeable representative from Energy Rated Homes of America estimates that the market share for ENERGY STAR homes in the Las Vegas metro area was around 25% in
2-22

2002, up from about 10% in 2001 (Collins 2002). The primary electricity utilities in Nevada, Nevada Power Company and Sierra Pacific Power Company, are also training builders and promoting the construction of more efficient new homes.
This growth in ENERGY STAR homes has been paralleled by growth in inspection companies. There are seven rating companies active in Nevada that have rated over 11,000 homes. Builders’ Choice is a Las Vegas-based rating company with more than 4,000 ratings for both Engineered for Life and ENERGY STAR home programs over the last five years. The company observes that five years ago only 3% of new buildings were rated, two year ago it was 15 to 17%, and now it’s 30 to 35%. At present, they have six raters on staff, most of whom were trained by Advanced Energy to become certified HERS raters (Gilmore 2002).
In practice, raters go into a home twice. The first visit is at “rough,” just after the duct work and air handling unit are installed. Duct blaster tests are performed (with separate supply and return measurements) to verify that leakage is below 5%. If further sealing is needed the ducts are still easily accessible at this stage in construction. A blower door test is performed at the final test with a maximum allowable air flow for certification of 1 cfm per square foot at 50 Pascals pressure on the home.
Builders, who pay $300 or more for the service, are becoming proactive in ensuring their HVAC, insulating, and air sealing subcontractors are doing a good job. An indication that the services supplied by Builders’ Choice are appreciated is that they routinely test 1 of every 4 homes constructed by production builders instead of the 1 of 7 required by ENERGY STAR.
Some builders, like Pulte, an ENERGY STAR builder, are building energy-efficient homes that also meet the Environments for Living program platinum standard. This includes building very tight envelopes tested with a blower door at 0.25 cfm or less per square foot of envelope area at 50 pascals accompanied by standards for fresh air ventilation (EFL 2003). An important detail of these homes includes a DOE Building America Program innovation through which the conditioned envelope is defined at the roof deck instead of the attic floor. See sidebar below.
* * * * * * *
The Unvented Attic Approach
Environments for Living homes are very tight, well-insulated structures with high-quality fenestration. They have air handler/furnaces and duct work in the attic, but unlike conventional construction with insulation at the attic floor, the thermal envelope includes the attic. This is achieved by insulation just under the roof deck. In practice a mesh is stapled to the underside of the 24-inch-on-center attic trusses which extends down to the sidewalls. Cellulose is blown into each bay by inserting
2-23

a tube into a temporary slit made in the mesh toward the top of the ceiling and fishing the tube down toward the perimeter walls. This facilitates blowing insulation tightly against the roof deck and ensuring that there are no voids (Figure 2-5). The result is attic temperatures that are much lower than is usually the case in Las Vegas homes during the cooling season, with the consequence that the air handler and ducts are subject to lower losses. Although still in the conditioned envelope, the ductwork is carefully sealed as are recessed lighting fixtures.
Figure 2-5. Netted insulation next to attic ceiling
Source: Building Science Corporation
Lower losses in the thermal envelope coupled with higher system efficiency of the HVAC system enables downsizing the furnace and chiller. According to Paul Hughett, President of Silverado Mechanical and partner in Sierra Air Conditioning, a 2,000 square foot Environments for Living home requires a 75,000 Btu/hour furnace and a 3.5 ton air conditioner rather than the 100,000 Btu/hour furnace and 5 ton air conditioning unit more typical of conventional new homes of the same size in the Las Vegas area. Closed combustion condensing furnaces rated at >90% steady state efficiency and SEER 12 A/C units are routinely installed, along with mechanical fresh-air ventilation. Hughett’s companies are doing 4,000 to 5,000 installations per year. “The whole system cost is very little more than the way we used to do things with the air handler and ducts in hot attics,” Hughett maintains (Hughett 2002).
* * * * * * * Nevada State Energy Office staff maintain that DOE's Building America program and the Environments for Living program represent the best application of building science-based "systems thinking" into home design and construction, and thus the best value to Nevada residents (McNeil 2003). Benefits include a high degree of energy efficiency, air quality, comfort, moisture control, structural integrity, and therefore enhanced customer value. This is the key message brought to home builders by John Tooley of Advanced Energy, who conducted a February 2003 workshop in Reno, Nevada through the sponsorship of the Nevada State Energy Office, Sierra Pacific, and the Builders Association of Northern Nevada. Builders were shown a variety of building tactics that produce energy efficiency
2-24

as well as reduce comfort complaints, call backs, and potential defect litigation exposure related to moisture control. As a routine part of the Environments for Living program, at all levels (silver, gold, and platinum), homes are guaranteed for at least two years to have heating and cooling bills no greater than an amount specified at the initial sale of the building. According to Rick Davenport, Director of Building Science at Masco Contractor Services, Inc, there will be 4,800 Environments for Living homes built in Nevada in 2003, at least 50% of which will be platinum level homes designed to exceed the energy performance of MEC 1995 code levels by 50% (Davenport 2003).
2-25

NEW MEXICO Status of Energy Codes The 1992 MEC (with state amendments) is the mandatory minimum energy efficiency requirement for all new homes built in New Mexico, but implementation is spotty in most areas. An exception is the fast-growing Albuquerque area, where the building permitting and inspection process is rigorous. State wide, new homes are going in at the rate of about 700 per month, over half of which are in the vicinity of Albuquerque. All new state-owned commercial buildings must comply with ASHRAE Standard 90.1-1989. All other new commercial buildings must only comply with older codes, ASHRAE 90A-1980 and 90B-1975. In some cases, local jurisdictions do not have staff qualified to enforce the code, so the State’s Construction Industries Division undertakes both plan reviews and inspections. The Construction Industries Division relies on the Energy Conservation and Management Division of the Energy, Minerals, and Natural Resources Department for technical assistance. In 2001, New Mexico’s Governor established a building code commission to develop a version of IECC 2000 code suitable for New Mexico. A final decision to adopt the code was originally scheduled for December 2002 with implementation slated for May of 2003. State amendments to the IECC code considered by the commission included a provision to allow lighting densities of up to 2 watts per square foot in commercial buildings and another to accommodate log homes based on an “effective” U value that reflects an annual analysis that includes the effects of solar gain. At the last hour in its December meeting, the commission decided not to adopt the IECC codes, leaving the status of adopting up-to-date energy codes in New Mexico in flux. The new governor, Bill Richardson, has replaced many members of the commission that is considering energy codes. Most members of the current commission appear to favor adopting the NFPA 5000 code (Trujillo 2003). Early in 2003, legislation was introduced in the New Mexico legislature whose effect would have been to preclude consideration of I-codes for the state. However, an amended version of the bill was approved by the legislature in March that removed this proviso. As this report was prepared, the New Mexico Attorney General’s office has been directed to examine the current state of affairs concerning building codes and their enforcement. Energy efficiency advocates are urging prompt adoption of the IECC. However, at present, the likelihood of this view prevailing seems slim. Accordingly, New Mexico may soon face the need to implement ASHRAE 90.2 for its new residential code, a task that is likely to be quite onerous.
2-26

Other Efficiency Work As of July 2003, there were 15 ENERGY STAR builders in New Mexico, one of which, Artistic Homes in Albuquerque, builds only ENERGY STAR homes. Artistic has constructed 1339 ENERGY STAR-labeled homes, 75 percent of which were built in the 12 month preceding July 2003. In addition, there are 13 builders who are “Building America” partners, nine of them in the fast-growing Albuquerque area.
2-27

UTAH Status of Energy Codes Effective January 1, 2002, Utah implemented a mandatory statewide IECC 2000 code for all new residential and commercial buildings. Utah’s state energy office is pleased to have a state-of-the-art energy code in place, but implementation of the code is largely a local matter. Most cities ask builders of residential structures to submit a REScheck analysis with their plans as part of the building permit process. COMcheck is required by most jurisdictions for small commercial buildings. The Utah Energy Conservation Coalition, Inc. is a non-profit organization hired by the Utah Energy Office to train code officials and builders in attaining code compliance and building energy efficient structures. Much of the Coalition’s work is in the field, where instruments like duct blasters and blower doors are employed to both test structures and demonstrate to builders details that need more attention. Shortly after the new code took effect, the Coalition found that around 50% of new homes tested were not in compliance with the new code (Wilson 2002). Hopefully this situation will improve over time through training and the growing awareness of energy- efficient building techniques. Plans are afoot to extend the Coalition’s work into the commercial buildings sector. Utah is strongly committed to energy efficiency in state-owned buildings. All new state buildings are being designed to use at least 25% less energy that required by the ASHRAE 90.1-99 model code. According to Mike Glenn of the Utah Energy Office, this “raising the bar” on commercial building codes for state buildings is one of several steps recently taken to increase the energy efficiency of state buildings. The ultimate aim is to adopt Silver LEED4 as the standard for state buildings (Glenn 2002). Utah’s program for new state buildings strives to achieve energy savings without increasing first cost through an integrated design approach. It is estimated that seven new buildings constructed during 1996-98 achieved 22-50 percent energy cost savings (relative to buildings that just comply with the ASHRAE 90-1-1999 standard) as a result of the program (Case and Wingerden 1998). An area of particular emphasis has been ensuring that both new and retrofit school buildings in Utah are energy efficient. In practice, University of Utah Experimental Station staff work with architects and review school designs for code compliance. In addition, inspections are made to ensure that new or retrofit schools match the energy
4 Leadership in Energy and Environmental Design (LEED) Green Building Rating System™ is a program of the U.S. Green Building Council. It assigns points for design elements that contribute to achieving energy-efficient buildings. Silver LEED ratings usually result in efficiency levels that exceed ASHRAE 90.1-1999 standards by 35 to 50- percent. Information on the LEED Green Building Rating System is available from www.usgbc.org/LEED/leed_main.asp.
2-28

efficiency of the buildings depicted by approved drawings. Concerning privately-owned commercial buildings, there is a de facto distinction between large buildings and smaller ones. If a professional engineer does the drafting, code officials routinely accept his PE stamp for meeting code. Small commercial buildings like fast food chains and quick oil change shops are asked to run COMcheck software and submit the results with their plans. Other Efficiency Work ENERGY STAR There are 22 ENERGY STAR builders in Utah, one of which has built over 892 ENERGY STAR homes as of July 2003, 98 percent of the total in the state (EPA 2003). Ence Homes, out of St. George, operates in both southern Utah and Nevada, and builds over 400 homes each year. Ence builds only ENERGY STAR homes and advertises the fact heavily in their sales literature and other media.5 They have won two major awards from the EPA in the past three years, most recently the ENERGY STAR Builder of the Year award. In the fall of 2002, Ence broke ground on a group of houses slated to meet the requirements for the Engineered for Life Platinum standard. This is Ence’s first set of houses in which they have insulated at the attic ceiling instead of its floor, thus allowing for the HVAC system to be enclosed in the thermal envelope (Ence 2002). Approximately 14,400 new homes were built in Utah in 2002, of which slightly less than three percent were ENERGY STAR labeled (Utah Office of Planning and Budget 2003).
5 While on hold, the caller to Ence hears the following: “Ence is modern and forward thinking! EPA has recognized only one home builder in the nation to get a nationwide award from EPA, Ence Homes. We walked onto the stage to receive a beautiful crystal award. But what’s this mean for you? Reduced utility bills, increased comfort, and possibly preferred financing ratings (because of lowered energy bills) for your Ence home.”
2-29

WYOMING Status of Building Codes The Wyoming State Fire Marshal’s office develops minimum building codes and standards for the state. The 1997 Uniform Building Code (UBC) is the current statewide code, and while it references the 1995 Model Energy Code (MEC) in an appendix, the Fire Marshal's office has yet to officially adopt the appendix, and thus the code is not in effect. There were a total of 1,392 housing starts in Wyoming in 2000, the most recent year for which statistics are available. The state energy office reports that they have no indication that energy-efficient buildings are being constructed in the state. The combination of weak energy codes, harsh weather, and low energy prices results in quite high energy use per household. Up until the past two years, there has been little activity toward developing up-to-date energy codes in Wyoming. However, in 2001, Wyoming’s state legislature formed an energy commission aimed at developing a cogent energy policy. The 15-member Wyoming Energy Commission (WEC) was composed of six state legislators and nine private sector members who represented energy and related interests, and was staffed by the State Energy Program and Natural Resources Program. The Commission met for over a year and produced a final energy policy in April, 2003. The process involved substantial public comment and its work is available on a website developed for the purpose, www.wyomingbusiness.org/minerals/energy_commission/commission_meetings.cfm. The new policy has a number of positive elements related to building energy efficiency. First, it directs the fire marshal to adopt and implement a recent energy efficiency code, such as the IECC 2000, and apply that code to all state buildings (Wyoming Business Commission 2003). Second, the policy recommends that local jurisdictions add recent versions of the model energy code to cover both residential and commercial privately-owned new buildings. The state plans to supply training for builders and building code officials as well as to provide co-funding for code compliance and enforcement activities. The policy includes establishing an office in Washington D.C. to represent Wyoming’s energy interests and seeking funding from the U.S. Department of Energy to help defray costs for training and enforcement activities.
2-30

Other Efficiency Work ENERGY STAR According to EPA’s web site, there are 11 builders active in Wyoming listed as ENERGY STAR builders, all of whom are listed as “New Partners.” As of July 2003, there have been no houses labeled as ENERGY STAR homes in Wyoming. Three of the ENERGY STAR builders are active only in Wyoming, the others are national or regional builders (EPA 2003).
2-31

Section 3
Analysis of Energy Savings Potential Buildings that are not energy efficient tend to be uncomfortable, with cold, drafty areas in the winter and overheated areas in the summer. They are also wasteful, and expensive to operate and maintain. It is possible to build efficient buildings (whose initial costs are little more than inefficient ones) that are more comfortable, less expensive to operate and maintain, and less vulnerable to such contingencies as extremes in weather and power outages. Of course, in areas where there are codes, sometimes codes aren’t enforced or actual performance is less than might be predicted by the code. On the other hand, there are new buildings that substantially outperform buildings that exactly meet codes. In this section, we estimate the energy and economic consequences that would result in each state from two levels of efficiency improvement: (1) bringing new buildings into compliance with the 2000 IECC; and (2) bringing new buildings to superior levels of energy performance represented by exceeding ENERGY STAR levels, or in the case of commercial buildings, what we here call best practice. The analysis of residential buildings precedes that of commercial buildings. Residential Building Analysis The analysis here is restricted to single-family dwellings, although it is likely that the economics and energy savings numbers for multifamily buildings are proportional to those associated with single-family homes. We begin by envisioning homes whose energy-relevant features and overall performance is “representative” of the base stock presently being built in each state under current levels of energy codes and their enforcement. We then envision similar homes that are built to just meet IECC 2000. Finally, we examine a similar home built to standards that are somewhat above ENERGY STAR given reasonable first cost constraints that result in lower lifetime costs. We call this the ENERGY STAR Plus case. Energy performance and cost data are then compared along with lifetime costs. Finally, aggregate energy and cost savings are examined for each state under two scenarios of greater energy efficiency—moderate improvement and strong improvement. The degree to which sample homes fall short of or meet IECC 2000 code is judged using REScheck 3.5, Release 1d. Energy-10, Version 6 software is used to model residential buildings in Albuquerque, Cheyenne, Denver, Las Vegas, Phoenix, and Salt Lake City. An hourly simulation program developed by NREL’s Doug Balcomb and others, the software is technically sound and produces a variety of useful outputs (Balcomb 2003).
3-1

Housing Characteristics The characteristics of the home chosen to represent the energy-relevant features of most new dwellings in the northern states, Colorado, Utah, and Wyoming, is a two-story, 1800 square foot wood-framed structure with both a basement and crawl space each of which is half of the footprint of the home. The home chosen to represent the energy-relevant features of most dwellings in the southern states, Arizona, Nevada, and New Mexico, is a single-story 1800 square foot wood-framed structure built as a slab-on-grade. Since most new homes are built by production builders in new neighborhoods where homes are not optimized for solar orientation, we did not control for orientation, choosing instead to balance glazing on all four facades. The homes in the northern states are modeled with five double-glazed vinyl windows on each of the four facades that total 258 square feet of glazing, plus an extra pair windows on the north- and south-facing sides of the basement. Since they have no basements, the homes in the southern states do not include the latter two windows. Accordingly, the conditioned areas of all dwellings have windows whose glazing represents 14.3 percent of their wall areas. We chose this approach because it quantifies the effects of various energy efficiency options in ways that realistically reflect the diversity of new housing stock in the Southwest. Of course, optimizing window strategies to orientation (including overhangs and other shading devices as well as the characteristics of the glazing and frames) can substantially improve both summertime and wintertime energy performance of structures in the sunny Southwest. Table 3-1a shows the characteristics common to the residential structures whose non-energy-related elements are identical and whose energy-related elements reflect a typical new building (base), an IECC 2000 building, and an ENERGY STAR+ building. Note that homeowner activities like changing thermostat settings were not included so the analysis could focus on building energy performance. Table 3-1a. Residential Building Descriptions, Common Elements.* Building Element Base IECC 2000 ENERGY STAR+ Floor Area ft2 1800 1800 1800 Volume ft3 16,200 north, 18,000
south 16,200 north, 18,000 south
16,200 north, 18,000 south
Glazed area ft2 284 north, 258 south 284 north, 258 south 284 north, 258 south Number of windows 22 north; 20 south 22 north; 20 south 22 north; 20 south Orientation (N/E/S/W) 5/6/5/6 north; 5/5/5/5
south 5/6/5/6 north; 5/5/5/5 south
5/6/5/6 north; 5/5/5/5 south
HVAC system DX cooling w/ gas furn DX cooling w/ gas furn DX cooling w/ gas furn Efficiency AFUE = 80%
SEER = 10.3 AFUE = 80% SEER = 10.3
AFUE = 92% SEER = 13
Heating Thermostat 70F, no setback 70F, no setback 70F, no setback Cooling Thermostat 76F, no setup 76F, no setup 76F, no setup Envelope infiltration, ACH 0.5 0.3 0.2 Duct leakage % 9 6 2 Lighting Incandescent Incandescent CFL *”North” denotes Colorado, Utah, and Wyoming; “south” Arizona, Nevada, and New Mexico.
3-2

Table 3-1b shows key characteristics—insulation and window parameters—that were adjusted in the simulations to reflect circumstances in each of the six states. Table 3-1b. Residential Building Descriptions, Unique Elements by State State Building
Element Base IECC 2000 ENERGY STAR+
AZ Attic Insulation R = 12 R = 12 R = 30 CO Attic Insulation R = 31 R = 31 R = 42 NV Attic Insulation R = 30 R = 30 R = 42 NM Attic Insulation R = 29 R = 34 R = 42 UT Attic Insulation R = 31 R = 31 R = 31 WY Attic Insulation R = 29 R = 29 R = 42 AZ Wall Insulation R = 14 R = 14 R = 19 CO Wall Insulation R = 13 R = 19 R = 30 NV Wall Insulation R = 14 R = 14 R = 19 NM Wall Insulation R = 14 R = 19 R = 19 UT Wall Insulation R = 13 R = 16 R = 30 WY Wall Insulation R = 13 R = 26 R = 30 AZ Foundation Ins None None R = 15 CO Foundation Ins R = 5 R = 5 R = 18 NV Foundation Ins None None R = 15 NM Foundation Ins None None R = 15 UT Foundation Ins R = 5 R = 5 R = 18 WY Foundation Ins R = 5 R = 5 R = 18 AZ Windows U = 0.73; SHGC = 0.77 U = 0.50; SHGG = 0.40 U = 0.27; SHGC = 0.40 CO Windows U = 0.49; SHGC = 0.78 U = 0.26; SHGC = 0.56 U = 0.26; SHGC = 0.56 NV Windows U = 0.49; SHGC = 0.78 U = 0.50; SHGG = 0.40 U = 0.27; SHGC = 0.40 NM Windows U = 0.49; SHGC = 0.78 U = 0.49; SHGC = 0.78 U = 0.27; SHGC = 0.40 UT Windows U = .50; SHGC = 0.77 U = 0.40; SHGC = 0.56 U = 0.40; SHGC = 0.56 WY Windows U = .50; SHGC = 0.77 U = 0.40; SHGC = 0.56 U = 0.40; SHGC = 0.56 Note that the base homes are not poorly built; on the contrary their envelopes and ducts are fairly tight and their insulation values moderate. For the case of Arizona, where weather regions in the middle and southern parts of the state have low heating degree days (and where demand for new housing is quite high), it’s quite easy to just meet code with a poorly-insulated structure. Even where there are no building codes, it’s likely that most homes being built would meet IECC 2000 save for the all-important prescriptive requirement to keep window solar heat gain coefficients (SHGC) at 0.4 or below. Analysis of Sample Homes The next step in the analysis is to compute energy and dollar consequences associated with various levels of energy efficiency of new residential structures. The electricity and gas prices in each state used in this analysis are as shown in Table 3-2. These are the most recent average energy prices as provided by the Energy Information Administration of the U.S. Department of Energy, typically for 2001. In the analysis, we assume that these prices remain constant over time in real dollars, a conservative assumption.
3-3
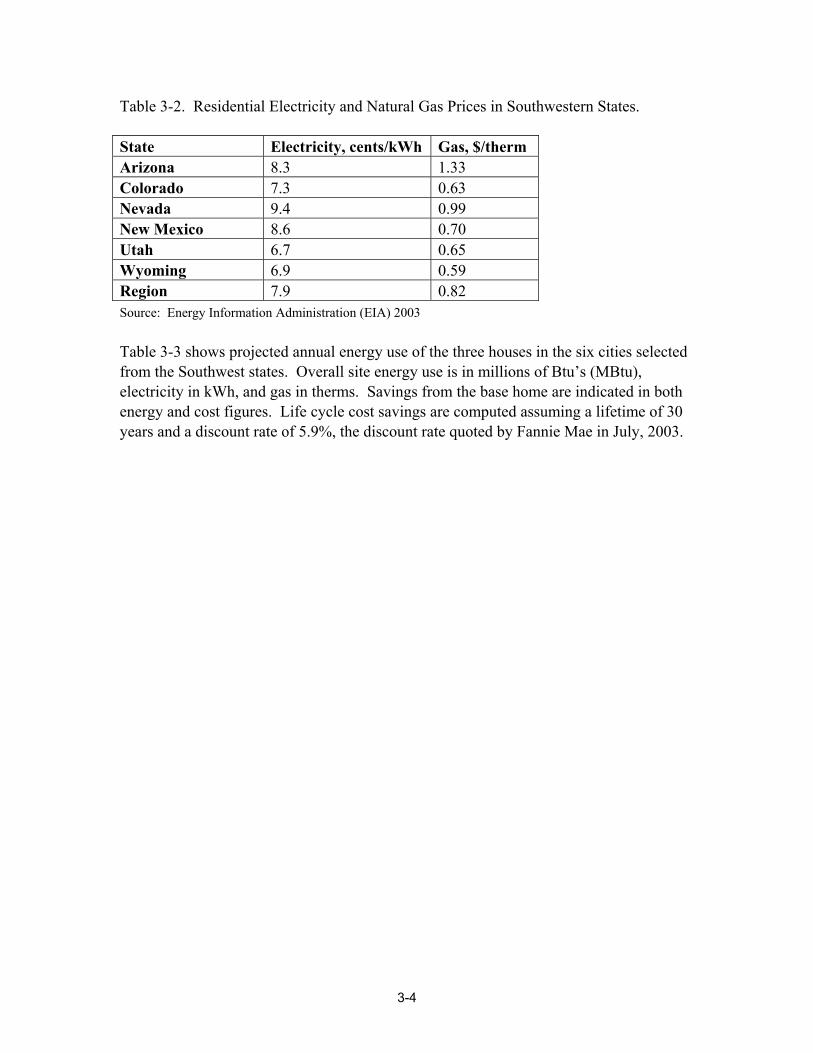
Table 3-2. Residential Electricity and Natural Gas Prices in Southwestern States. State Electricity, cents/kWh Gas, $/therm Arizona 8.3 1.33 Colorado 7.3 0.63 Nevada 9.4 0.99 New Mexico 8.6 0.70 Utah 6.7 0.65 Wyoming 6.9 0.59 Region 7.9 0.82 Source: Energy Information Administration (EIA) 2003 Table 3-3 shows projected annual energy use of the three houses in the six cities selected from the Southwest states. Overall site energy use is in millions of Btu’s (MBtu), electricity in kWh, and gas in therms. Savings from the base home are indicated in both energy and cost figures. Life cycle cost savings are computed assuming a lifetime of 30 years and a discount rate of 5.9%, the discount rate quoted by Fannie Mae in July, 2003.
3-4

Table 3-3. Projected Energy Use and Savings in Six Southwest Cities
PHOENIX DENVER LAS VEGAS
Base IECC 2000 En Star + Base IECC 2000 En Star + Base IECC 2000 En Star +Annual energy use, MBtu 96.6 78.8 40.8 145.2 112.0 58.6 94.3 77.4 39.9 Annual energy savings over base, MBtu 17.8 55.8 33.2 86.6 16.9 54.4 Annual electric use, kWh 17,812 13,638 8,284 10,435 9,712 8,198 12,887 9,549 6,951 Annual electric savings over base, kWh 4,174 9,528 723 2,237 3,338 5,936 Annual gas use, therms 358 323 125 1,096 788 306 503 448 162 Annual gas savings over base, therms 35 233 308 790 55 341 Annual energy cost, $ 1,955 1,561 854 1,452 1,205 791 1,709 1,341 813 Annual Energy cost savings over base, $ 394 1101 247 661 368 896 Annual Energy cost savings over base, % 20.2% 56.3% 17.0% 45.5% 21.5% 52.4% Construction costs $ 143,600 145,117 152,147 145,071 147,482 151,930 143,600 145,102 152128 Construction cost $ > base 1,517 8,547 2,411 6,859 1,502 8,528 Simple Payback, years 3.9 7.8 9.8 10.4 4.1 9.5 Life-cycle cost, $ 232,822 221,594 205,962 198,376 192,283 184,052 224,766 214,339 204,664 Life-cycle savings, $ 11,228 26,860 6,093 14,324 10,427 20,102
3-5

Table 3-3. Projected Energy Use and Savings in Six Southwest Cities (cont)
ALBUQUERQUE SALT LAKE CITY CHEYENNE
Base IECC 2000
En Star + Base
IECC 2000
En Star + Base
IECC 2000
En Star +
Annual energy use, MBtu 110.6 87.7 44.2 151.3 118.2 62.5 160.6 114.5 60.2 Annual energy savings over base, MBtu 22.9 66.4 33.1 88.8 46.1 100.4 Annual electric use, kWh 7,552 7,210 4,728 11,509 10,533 8,623 9,071 8,584 7,524 Annual electric savings over base, kWh 342 2,824 976 2,886 487 1,547 Annual gas use, therms 849 631 281 1,121 823 331 1,296 852 346 Annual gas savings over base, therms 218 568 298 790 444 950 Annual energy cost, $ 1,243 1,061 603 1,499 1,240 793 1,391 1,095 723 Annual Energy cost savings over base, $ 182 640 259 706 296 668 Annual Energy cost savings over base, % 14.6% 51.5% 17.3% 47.1% 21.3% 48.0% Construction costs $ 143,600 146,653 152,128 145,000 147,222 151,724 145,000 148,684 152,062 Construction cost $ > base 3,053 8,528 2,222 6,724 3,684 7,062 Simple Payback, years 16.8 13.3 8.6 9.5 12.5 10.6 Life-cycle cost, $ 209,236 206,708 197,694 199,921 193,084 184,047 196,266 189,696 182,034 Life-cycle savings, $ 2,528 11,542 6,837 15,874 6,570 14,232
3-6

Although IECC code and ENERGY STAR + homes have a higher first cost, they save a great deal of money on a lifetime basis and the homes are more comfortable. The average life cycle savings of the IECC code to base homes over the region is $7,281. The average life cycle savings of the ENERGY STAR + homes to base homes is $17,059, ranging from $11,542 (in Albuquerque, where the climate is mild) to $26,860 (in Phoenix where energy prices are higher and cooling savings are substantial). Of course, well-built, energy-efficient homes may be expected to have a lifetime of up to three times the assumed 30 years, so this analysis is also conservative in that regard. The cost increment for energy-efficient homes is on the order of 1 - 2% for homes upgraded to meet the 2000 IECC and 4 - 6% for homes upgraded to ENERGY STAR +. However, real paybacks are quite likely to be shorter than those shown in Table 3-3 due to anticipated steep increases in retail natural gas costs. (Our model made the conservative assumption that energy prices will track inflation.) Extra costs reflect more efficient HVAC equipment, more insulation, higher-quality windows, more efficient lighting, and the additional labor associated with more care in air sealing of the envelope and ducts. One of the most significant finding of this analysis is the substantial savings achievable by the ENERGY STAR + homes, which should perform at least as well as Building America homes. This has principally to do with better quality windows, but also to a substantial degree on further sealing of both the envelope and the ducts beyond the IECC and base homes. Other improvements in the ENERGY STAR + homes stem from compact fluorescent light fixtures that save both lighting and cooling energy. To be sure, there are a number of opportunities for further savings that are not included in this analysis. For example, we did not introduce savings associated with improved efficiency of domestic hot water (DHW) systems or appliances. Hot water use constitutes 12.1 percent of total energy consumption for the base home in Colorado, for example, but a full 30 percent for the low-energy home (since heating energy use is much lower). Energy-efficient appliances such as efficient washing machines and dishwashers save both water and the energy used to heat it, and improvements in pipe insulation, the use of low flow devices, and lifestyle changes can substantially lower DHW energy use. Such savings are quite worthy of pursuit, but are not included here. Figure 3-1 summarizes total annual energy use of the three building types for each state.
3-7

Figure 3-1. Annual Energy Use of Three Representative Homes in Six Southwestern States
0
20
40
60
80
100
120
140
160
180
AZ CO NV NM UT WY AVG
Ann
ual E
nerg
y U
se, M
MB
tu/y
ear
Base Code ES+
Residential Building Overall Savings Potential In order to understand the significance of the foregoing analysis, it is useful to project the aggregate energy consequences of the three levels of residential new home performance over time: the base case, the just-meets IECC 2000 code case, and the ENERGY STAR + case. Population and housing start projections are derived from a combination of data from the U.S. Department of Census, the National Energy Modeling System (NEMS) data base, the Arizona Department of Economic Security, the Colorado Department of Local Affairs, the Nevada State Demographer, the University of New Mexico Bureau of Business and Economic Research, the Utah Governor’s Office of Planning and Budget, and the State of Wyoming Economic Analysis Division. Table 3-4 shows estimates of the number of single family homes in each state as of the 2000 Census plus projected rates of the growth of single family housing starts by state based on census data.
3-8

Table 3-4. Single Family Housing Units in 2000 and Projected Annual Percent Growth in Number of Single-Family Households in the Southwest State Single family
units in 2000 Growth Growth Growth Growth
2001-2005 (%)
2006-2010 2011-2015 2016-2020(%) (%) (%)
Arizona 1,705,378 2.43 2.16 2.11 1.68Colorado 1,343,371 1.74 1.48 1.39 1.19Nevada 561,016 2.88 1.96 1.85 1.77New Mexico 661,150 1.94 1.89 1.80 1.77Utah 599,503 2.31 2.06 2.05 1.69Wyoming 189,828 1.55 1.43 1.44 1.12Region 5,060,247 2.20 1.90 1.86 1.51Note: Region average percentage growth figures are population weighted. Table 3-5 shows the results of projecting the energy numbers for new single family construction in each state, where site energy use is shown. (In general, primary energy use of electricity is on the order of three times site energy use owing to inefficiencies in generation and losses in transmission and distribution.) Projections of single family starts in each period are based on information from state sources, save for the last two periods from Wyoming. Table 3-5. State-by-State Projections. Energy Use Per Dwelling Unit are in Millions of Btu’s (MBtu); State Figures are in Trillions of Btu’s, 1012 Btu’s. Arizona Energy Use per Housing
Unit (MBtu/yr) Improvement over Base Improvement over
Code Base 96.6 - -
IECC 2000 78.8 18.4% -
ENERGY STAR+
40.8 57.8% 48.2%
Energy Used and Saved (TBtu)
IECC 2000 E-Star+ Time Period Projected
Single Family Housing Starts (AZ)
Base (Use) Use Saved over
Base Use Use Saved over
Base Use 2001 – 2005 143,531 13.9 11.3 2.6 5.9 8.0 2006 – 2010 196,834 32.9 26.8 6.1 13.9 19.0 2011 – 2015 199,626 52.2 42.5 9.7 22.0 30.2 2016 – 2020 206,019 72.1 58.7 13.4 30.4 41.7
3-9
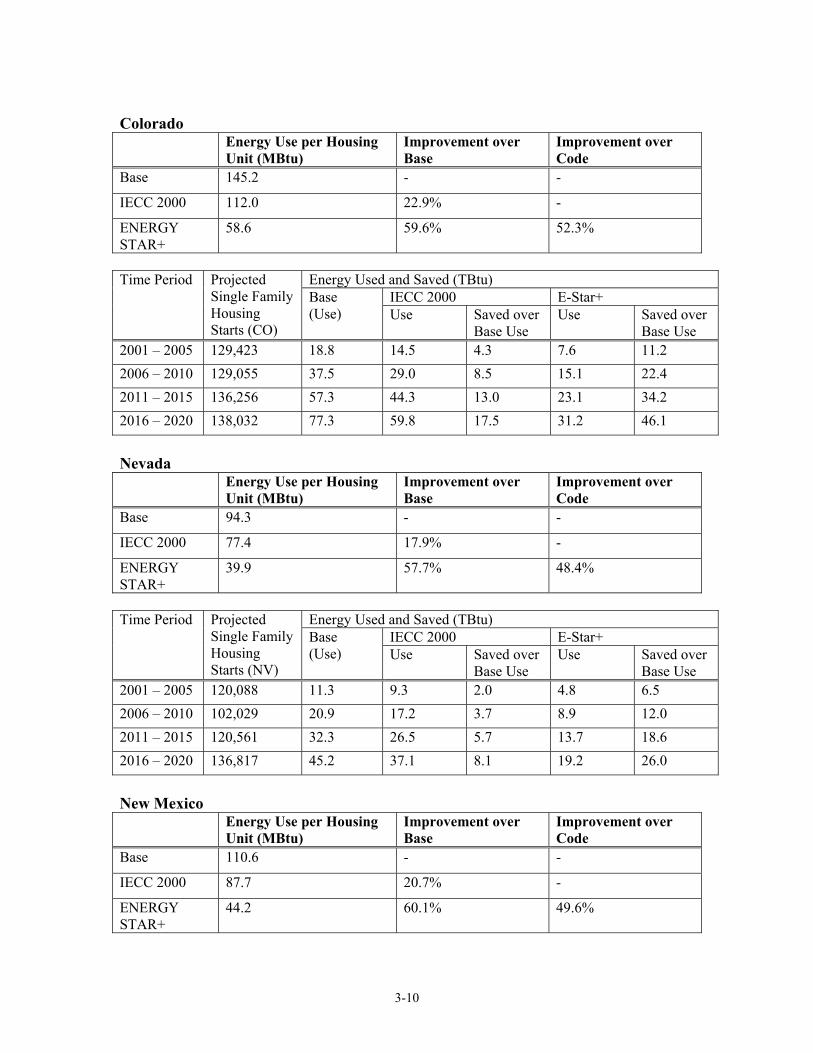
Colorado Energy Use per Housing
Unit (MBtu) Improvement over Base
Improvement over Code
Base 145.2 - -
IECC 2000 112.0 22.9% -
ENERGY STAR+
58.6 59.6% 52.3%
Energy Used and Saved (TBtu)
IECC 2000 E-Star+ Time Period Projected
Single Family Housing Starts (CO)
Base (Use) Use Saved over
Base Use Use Saved over
Base Use 2001 – 2005 129,423 18.8 14.5 4.3 7.6 11.2 2006 – 2010 129,055 37.5 29.0 8.5 15.1 22.4 2011 – 2015 136,256 57.3 44.3 13.0 23.1 34.2 2016 – 2020 138,032 77.3 59.8 17.5 31.2 46.1
Nevada Energy Use per Housing
Unit (MBtu) Improvement over Base
Improvement over Code
Base 94.3 - -
IECC 2000 77.4 17.9% -
ENERGY STAR+
39.9 57.7% 48.4%
Energy Used and Saved (TBtu)
IECC 2000 E-Star+ Time Period Projected
Single Family Housing Starts (NV)
Base (Use) Use Saved over
Base Use Use Saved over
Base Use 2001 – 2005 120,088 11.3 9.3 2.0 4.8 6.5 2006 – 2010 102,029 20.9 17.2 3.7 8.9 12.0 2011 – 2015 120,561 32.3 26.5 5.7 13.7 18.6 2016 – 2020 136,817 45.2 37.1 8.1 19.2 26.0
New Mexico Energy Use per Housing
Unit (MBtu) Improvement over Base
Improvement over Code
Base 110.6 - -
IECC 2000 87.7 20.7% -
ENERGY STAR+
44.2 60.1% 49.6%
3-10

Energy Used and Saved (TBtu) IECC 2000 E-Star+
Time Period Projected Single Family Housing Starts (NM)
Base (Use) Use Saved over
Base Use Use Saved over
Base Use 2001 – 2005 55,340 6.1 4.9 1.2 2.4 3.7 2006 – 2010 51,610 11.8 9.4 2.4 4.7 7.1 2011 – 2015 50,272 17.4 13.8 3.6 6.9 10.5 2016 – 2020 47,893 22.7 18.0 4.7 9.0 13.7
Utah Energy Use per Housing
Unit (MBtu) Improvement over Base
Improvement over Code
Base 151.3 - -
IECC 2000 118.2 21.9% -
ENERGY STAR+
62.5 58.7% 47.1%
Energy Used and Saved (TBtu)
IECC 2000 E-Star+ Time Period Projected
Single Family Housing Starts (UT)
Base (Use) Use Saved over
Base Use Use Saved over
Base Use 2001 – 2005 61,120 9.2 7.2 2.0 3.8 5.4 2006 – 2010 86,587 22.3 17.4 4.9 9.2 13.1 2011 – 2015 90,884 36.1 28.1 6.0 14.9 21.2 2016 – 2020 65,492 46.0 35.8 10.2 19.0 27.0
Wyoming Energy Use per Housing
Unit (MBtu) Improvement over Base
Improvement over Code
Base 160.6 - -
IECC 2000 114.5 40.2% -
ENERGY STAR+
60.2 62.5% 47.4%
Energy Used and Saved (TBtu)
IECC 2000 E-Star+ Time Period Projected
Single Family Housing Starts (WY)
Base (Use) Use Saved over
Base Use Use Saved over
Base Use 2001 – 2005 2,906 0.5 0.3 0.2 0.2 0.3 2006 – 2010 4,466 1.2 0.8 0.4 0.5 0.7 2011 – 2015 6,113 2.2 1.5 0.7 0.9 1.3 2016 – 2020 7,929 3.5 2.4 1.1 1.4 2.1
3-11

Scenario Development and Analysis The level of energy efficiency actually achieved by the totality of new homes built in the Southwest over the coming decades is a complex function of many variables, none of which can be predicted with high accuracy. These include market forces, code development and enforcement, education of all parties in the building process, energy price and availability, and technical developments. On the theory that judgments formed by those in a position to influence policy will be improved by understanding patterns of energy use resulting from the market penetration of energy-efficient dwellings, we offer three scenarios. We call these business-as-usual (BAU), moderate improvement, and strong improvement. Each scenario envisions different rates of implementation of code and ENERGY STAR+ homes versus time as depicted in Table 3-7. Table 3-7. Penetration of Energy-Efficient Dwellings between 2001 and 2020 under Three Scenarios of Efficiency Efficiency Scenario
Base 2001-2010
Code 2001-2010
ES+ 2001-2010
Base 2011-2020
Code 2011-2020
ES+ 2011-2020
BAU 60% 30% 10% 35% 50% 15% Moderate 20% 65% 15% 10% 70% 20% Strong 10% 50% 40% 5% 35% 60% The BAU scenario is consistent with only modest additional efforts of adopting and implementing modern codes and lackluster efforts on the part of most builders to build highly-efficient homes. The moderate improvement scenario assumes both wider adoption and enforcement of up-to-date energy codes and expanded efforts to promote ENERGY STAR and beyond ENERGY STAR homes. The strong improvement scenario envisions concerted and effective programs to transform construction practices to very high efficiency as exemplified by our ENERGY STAR + model homes. In this scenario, we assume 40% of new homes achieve this level of performance during 2001-2010 and 60% during 2011-2020. The analysis that follows counts savings only as improvements to the BAU scenario, which itself includes a substantial number of code and beyond code homes, especially in the time interval between 2011 and 2020. Table 3-8 shows total savings due to new residential construction for each state in the year 2010 and the year 2020 under the moderate improvement and strong improvement scenarios.
3-12

Table 3-8a. Moderate Improvement Scenario of Energy Savings Due to Homes Constructed between 2000 and 2020; Annual Energy Savings in 2010 and 2020 (gigawatt hours for electricity, trillions of Btu for gas and total energy)
2010 Moderate Improvement Scenario State BAU
2010 (TBtu)
Moderate Improvement 2010 (TBtu)
Total Savings in 2010 (TBtu)
Total Elec Savings in 2010 (GWh)
Total Gas Savings in 2010 (TBtu)
AZ 29.17 26.09 3.09 724.5 0.62CO 32.71 28.61 4.1 88.9 3.80NV 18.59 16.69 1.9 375.3 0.62NM 10.37 9.17 1.2 17.9 1.14UT 19.52 17.14 2.38 70.5 2.14WY 1.01 0.83 0.18 1.9 0.17Region 111.37 98.56 12.82 1279.0 8.49
2020 Moderate Improvement Scenario State BAU
2020 (TBtu)
Moderate Improvement 2020 (TBtu)
Total Savings in 2020 (TBtu)
Total Elec Savings in 2020 (GWh)
Total Gas Savings in 2020 (TBtu)
AZ 59.15 54.39 4.76 813.3 1.98CO 61.64 55.84 5.8 149.6 5.29NV 37.25 34.33 2.92 318.4 1.83NM 18.3 16.68 1.62 68.9 1.39UT 36.85 33.46 3.39 110.3 3.01WY 2.64 2.32 0.32 5.0 0.30Region 215.81 196.98 18.83 1465.4 13.81 Table 3-8b. Strong Improvement Scenario of Energy Savings Due to Homes Constructed between 2000 and 2020; Annual Energy Savings in 2010 and 2020 (gigawatt hours for electricity, trillions of Btu for gas and total energy)
2010 Strong Improvement Scenario State BAU
2010 (TBtu)
Strong Improvement 2010 (TBtu)
Total Savings in 2010 (TBtu)
Total Elec Savings in 2010 (GWh)
Total Gas Savings in 2010 (TBtu)
AZ 29.17 22.25 6.92 1622.5 1.38CO 32.71 24.29 8.42 182.6 7.80NV 18.59 14.25 4.34 857.3 1.41NM 10.37 7.76 2.61 39.0 2.48UT 19.52 14.61 4.91 145.3 4.41WY 1.01 0.72 0.29 3.1 0.28Region 111.37 83.88 27.49 2849.9 17.77
3-13

2020 Strong Improvement Scenario State BAU
2020 (TBtu)
Strong Improvement 2020 (TBtu)
Total Savings in 2020 (TBtu)
Total Elec Savings in 2020 (GWh)
Total Gas Savings in 2020 (TBtu)
AZ 59.15 42.39 16.76 2863.74 6.99CO 61.64 43.52 18.12 467.34 16.53NV 37.25 26.76 10.49 1143.69 6.59NM 18.3 12.84 5.46 232.03 4.67UT 36.85 26.23 10.62 345.49 9.44WY 2.64 1.86 0.78 12.12 0.74Region 215.81 153.59 62.22 5064.41 44.95 Almost 2.3 million new single-family homes (2.95 million total dwellings) will be built in the Southwest in the two decades following the millennium. These results show that if business-as-usual policies are pursued, single family dwellings built between 2000 and 2020 will be consuming almost 216 trillion Btu in the Southwest by 2020. This assumes that half of the new homes built in the decade of 2011-2020 will meet code and 15 percent will be beyond code, ENERGY STAR + dwellings. This explicitly recognizes that modern codes are now largely in place and ENERGY STAR efforts underway in parts of the region and that efficiency improvements will continue to some degree even without significantly expanded efforts. Under the moderate improvement scenario, new homes built in the region from 2001 through 2020 will save 12.8 trillion Btu in 2010 (1279 GWh of electricity and 8.5 trillion Btu of natural gas) over BAU and 18.8 TBtu in 2020 (1465 GWh of electricity and 13.9 trillion Btu of natural gas) relative to the BAU scenario. This amounts to relative savings of the moderate improvement scenario over BAU of 11.5% in 2010 and 8.7% in 2020. Under the strong improvement scenario, the savings numbers are 27.5 TBtu in 2010 (2850 GWh of electricity and 17.8 trillion Btu of natural gas) and 62.2 TBtu (5064 GWh of electricity and 45 trillion Btu of natural gas) in 2020. This amounts to an improvement of 24.7% over the BAU scenario in 2010 and 29.0% in 2020. To put these numbers in context, the strong improvement scenario will save the annual energy consumption equivalent of 289,000 just-meets-code homes in the region in 2010 and 654,000 homes in 2020. The total energy savings are the greatest in Colorado, followed by Arizona. But the electricity savings are by far the greatest in Arizona, followed by Nevada. This is because air conditioning is the dominant end use in the hotter states. On the other hand, Colorado offers the largest gas savings potential, followed by Utah, as these are space heating-intensive states. These results are shown graphically in Figure 3-2.
3-14

Figure 3-2. Region-wide Energy Savings Resulting from the Moderate and Strong Efficiency Scenarios versus Business-as-Usual; Energy Savings in 2010 and 2020 (TBtu)
12.8
27.5
18.8
62.2
0
10
20
30
40
50
60
70
Moderate 2010 Strong 2010 Moderate 2020 Strong 2020
Savi
ngs (
Tri
llion
Btu
/yea
r)
In the following economic analysis, we use an average energy cost of $16.34 per MBtu for residential energy, a figure that is weighted by state to reflect the relative savings of gas and electricity with energy-efficient designs. Assuming that energy prices remain level in constant dollars, the total energy cost savings over BAU that would be achieved in the region in 2010 and 2020 under the scenarios is shown in Table 3-9. Incremental costs to secure those savings are also shown, as well as net savings. The costs shown are the costs for upgrading energy efficiency in homes built in 2010 and 2020, and the savings are the savings in those same years from homes built cumulatively.
3-15

Table 3-9. Estimated Costs and Savings in the Region for New Residential Structures under Moderate and Strong Scenarios of Improved Energy Efficiency in 2010 and 2020 in Millions of (Constant 2003) Dollars
Moderate Improvement Scenario State 2010
Costs 2010 Savings
2010 Net Savings
2020 Costs
2020 Savings
2020 Net Savings
AZ 41.7 50.5 8.8 35.1 77.8 42.7CO 31.7 67.0 35.3 23.7 94.8 71.0NV 27.2 31.0 3.8 22.3 47.7 25.4NM 13.1 19.6 6.5 8.5 26.5 18.0UT 18.1 38.9 20.8 13.5 55.4 41.9WY 0.9 2.9 2.0 1.2 5.2 4.0Region 132.6 209.5 76.8 104.3 307.7 203.4
Strong Improvement Scenario State 2010 Costs 2010
Savings 2010 Net Savings
2020 Costs
2020 Savings
2020 Net Savings
AZ 95.0 113.1 18.0 126.1 273.8 147.7CO 72.2 137.6 65.4 85.3 296.1 210.8NV 62.0 70.9 8.9 80.0 171.4 91.4NM 29.9 42.6 12.8 30.5 89.2 58.7UT 41.2 80.2 39.0 48.6 173.5 124.9WY 2.1 4.7 2.7 4.4 12.7 8.4Region 302.4 449.2 146.8 374.9 1016.7 641.8 Considered in this manner, the value of the energy savings are about 50% greater than the cost of efficiency improvements in 2010 and nearly three times greater than the cost in 2020. The net savings reach $147 million in 2010 and $642 million in 2020 in the strong improvement scenario. Furthermore, the net economic savings are two to three times greater in the strong improvement scenario relative to the moderate scenario. The very substantial increase in net savings in the year 2020 reflects the greater percentage of ENERGY STAR+ homes with time in each scenario.
3-16

Commercial Buildings Analysis The form of the analysis of commercial buildings is akin to that of residential structures but not identical to it. In particular, toward evaluating the energy savings that would flow from implementing up-to-date energy codes and building both code and beyond code buildings in the commercial sector, it is useful to estimate electricity and gas energy consumption by building type. The following analysis of commercial buildings examines the four most commonly-occurring commercial building types in the Southwestern states: office buildings, retail stores, schools, and food service/sales establishments. In total, these represent about 85 percent of the energy consumption in the commercial and institutional sectors (SWEEP 2002). Table 3-10 shows the estimated square footage of these building types in each of the Southwestern states in 1999. Table 3-10. Estimated Floor Space by Building Type in 1999 (Millions of Square Feet) Building Type Region AZ CO NV NM UT WYOffice 1035 311 311 201 88 101 24Retail 1245 377 374 206 115 135 38School 775 220 265 49 75 153 13Food Service/Sales 176 56 53 29 16 18 5Other 570 170 177 86 52 72 14Total 3801 1133 1180 570 345 479 94Source: BEA 2002; ACEEE and Tellus estimates Analytical Approach Many existing commercial buildings were constructed well before the inception of energy codes. We begin by describing energy-relevant features of a set of prototypical buildings modeled to attain an estimate of typical annual energy use. The first set of buildings represent what we herein term the base case, which reflects the energy performance of many older building as well as some new ones that are not being built to modern energy code levels. Most commercial buildings today are built with more attention being paid to energy matters, using materials and equipment that were not available when most of the existing commercial stock was constructed. Accordingly, each base building type is remodeled, as it were, to include a number of energy-efficient features. The results are plus or minus a few percent of “just-meets-code” buildings, where the code in question is IECC 2000 or NFPA 5000, both of which incorporate ASHRAE 90.1-1999 standards. Of course, many commercial buildings are being constructed in the Southwest which fall short of the buildings described below—in part because many jurisdictions have not yet adopted a
3-17

commercial code that includes ASHRAE 90.1-1999--but others that exceed their performance are also being constructed. Buildings that “just meet code” have better performance than those built without serious attention to energy matters, but they are also “as bad as the law allows.” Many designers and builders are finding that it is cost effective to build commercial buildings that exceed code requirements by 25 to 50%. In the United States, exemplary utility design assistance and incentive programs such as those in Connecticut, Massachusetts, and Minnesota help designers and builders achieve energy savings of 30% or more above local building codes, and have influenced a large fraction of new buildings (York and Kushler 2003). Also, the government of Canada has a program that gives incentives to builders which exceed ASHRAE 99.1-1999 requirements by more than 25%, and almost all new buildings in Canada exceed this figure substantially (Kinney 2002). Some examples of highly-efficient new commercial buildings in the Southwest are outlined below.
* * * * * * *
Case Studies of Efficient Commercial Buildings Before describing the buildings analyzed, it is important to note that there are real energy- efficient commercial buildings in the Southwest that perform as well or better than the “best practices” buildings modeled here. Indeed, there are a number of case studies posted on the SWEEP web site that describe commercial building in the Southwest that exceed code requirements by 25 to 50 percent or more. Below are snapshots of four of these case studies. Full case studies on these buildings (and others) may be found at www.swenergy.org/casestudies/index.html. Harmony Public Library, Fort Collins, Colorado Built in the late 1990s, the 31,000 square foot Harmony Library features integrated design, efficient lighting and windows, daylighting, a computer-controlled energy management system, and other energy-efficient features. Although it cost about the same as other buildings on the Front Range Community College campus ($97 per square foot), it uses 46 percent less energy. The structure uses both overhangs and low-transmittance windows. This lessens the perceived contrast with the outside, making it visually comfortable to minimize electric lighting. These design features also limit solar gain in the cooling season, so the building uses only a ton of chiller per 500 square feet of conditioned space. First-cost savings in the chiller allowed for installing other energy efficient features while keeping the project within budget. The library saves approximately $12,000 in annual overall energy costs, resulting in a simple payback period of 3.75 years to defray the extra costs of the integrated design work.
3-18

Southeast Service Center, Tucson, Arizona Constructed in 1999, this 3,700 square foot City of Tucson administration building was designed and built to be 50 percent more efficient than the 1995 Model Energy Code. The building features insulated masonry walls on the east and west; window wall construction on the north and south; high performance, low-E windows with thermally broken frames; a grid-tied 5kW solar photovoltaic system; skylights; occupancy sensors; dimmer controls; and an energy management system. Incremental cost, relative to the cost of a very similar new building that would just meet code, is estimated at $24,200. Estimated avoided energy cost as a result of the energy-efficient features is $3,100 per year, resulting in a simple payback period of 7.8 years. Big Horn Home Improvement Center, Silverthorne, Colorado Completed in 2000, this 43,000 square foot retail store and warehouse was designed and built to be 60 percent more efficient that ASHRAE Standard 90.1-89. Energy efficiency features include skylights, energy-efficient lighting, and occupancy sensors; computer-controlled windows; a transpired solar collector to heat ventilation air; and a 9kW integrated photovoltaic system that provides up to 25 percent of the building’s electricity demand. The building also features an energy-efficient envelope with double-layered Styrofoam® walls and R-34 insulation in the roof. The energy-efficient design increased construction costs by ten percent, but utility bill savings will pay back the extra first cost in five years. Utah Department of Natural Resources, Salt Lake City, Utah This 120,000 square foot facility features numerous energy efficiency measures, including an HVAC system with high efficiency motors and variable speed drives, an energy-efficient lighting system, and passive solar design. Seven hundred linear feet of light shelves mounted on the south side of the building channel daylight 38 feet into the interior of the building. At an incremental cost of $300,000, the energy efficiency measures are expected to cut energy consumption 42 percent as compared to constructing the building to just meet the state’s energy code. This yields a 15 – 20 percent return on investment. In 2002 the U.S. EPA certified the facility as an ENERGY STAR building.
* * * * * * *
Given these considerations, each building type is remodeled again to reflect what we here call “best practice” in the Southwest and which are cost effective from a life cycle cost point of view. Description of Buildings Modeled The building prototypes described below were developed and modeled by Robert Mowris of Robert Mowris and Associates of Olympic Valley, CA for an earlier SWEEP study (SWEEP 2002).
3-19

Office The base office building is a three-story building with 60,000 square feet of conditioned floor area. It has no insulation in the walls and an average of R-7.1 insulation in the roof. Peak lighting power intensity is 2.0 watts per square foot (W/ft2)assuming standard T12 fluorescent lamps and electromagnetic ballasts (E SOURCE 1997a). The office equipment peak power intensity is 1.4 W/ft2 (RMA 2002). Windows are metal frame single-pane with a U-value of 1.11 Btu/hr-ft2-F and a solar heat gain coefficient of 0.72. The window-to-wall area ratio is 0.30, floor to ceiling height is 10 ft, and floors are medium weight (70 lb/ft3). Peak occupancy level is 275 ft2/person. The HVAC system is a reheat fan system serving two zones per floor (perimeter and core) with a 70 hp fan supply fan and a 23 hp return fan. Chilled water is provided by two 75 ton hermetic reciprocating chillers (3.82 COP, 150 tons total). Heat rejection is accomplished with two induced-draft cooling towers with a total capacity of 190 tons. Space heating is provided by two 75 percent efficient hot water boilers with a total capacity of 3,510 kBtu/hr. Occupancy, lighting, miscellaneous equipment, and service hot water schedules and minimum outdoor air ventilation requirements are taken from ASHRAE (ASHRAE 1989a, ASHRAE 1989b). The new office building that just-meets-code has a number of energy-related features that are different from the base building. It has metal-frame walls with nominal R-11 insulation and R-19 insulation in the ceiling. Lighting peak power intensity is 1.76 W/ft2
based on use of energy saving fluorescent lamps and energy-efficient magnetic ballasts. The office equipment peak power intensity is 1.4 W/ft2. Windows are metal frame double-pane with a U-value of 0.65 Btu/hr-ft2-F and a solar heat gain coefficient of 0.62. The HVAC system is a variable air volume (VAV) system serving two zones per floor (perimeter and core) with a 55 hp fan supply fan and a 18 hp return fan. Chilled water is provided by two 65 ton hermetic centrifugal chillers (4.23 COP, 130 tons total). Heat rejection is accomplished with two induced-draft cooling towers with a total capacity of 165 tons. Space heating is provided by two 80 percent efficient hot water boilers with a total capacity of 3,874 kBtu/hr. The best practices office building has the following energy-related features that are different from the just-meets-code building:
• Cool roof with an absorptivity of 0.3 • Efficient lighting at 0.7 W/ft2 • Efficient office equipment at 0.65 W/ft2 • Roof insulation at R-30, sidewalls R-19 • Specularly-selective windows with a shading coefficient of 0.3, U of 0.36 • HVAC with efficient fans, chiller at .56 kW/ton (COP = 6.28)
3-20

Retail The base retail building is a one-story building with 10,000 square feet of conditioned floor area. The base has no insulation in the walls and R-11 insulation in the roof. Lighting peak power intensity is 2.1 W/ft2 and electronic equipment peak power intensity is 0.5 W/ft2. The windows are metal frame single-pane with a U-value of 1.11 Btu/hr-ft2-F and a solar heat gain coefficient of 0.72. Window-to-wall area ratio is 0.19, floor to ceiling height is 15 ft, floor weight is medium (60 lb/ft3). Peak occupancy level is 300 ft2/person. The HVAC system consists of two packaged single-zone (PSZ) systems with a cooling capacity of 12.5 tons and a 240 kBtu/hr gas furnace. The PSZ system serving the northeast zone has a 2.6 hp fan and the PSZ system serving the southwest zone has a 3.3 hp fan. Occupancy, lighting, miscellaneous equipment, and service hot water schedules and minimum outdoor air ventilation requirements are taken from ASHRAE (ASHRAE 1989a, ASHRAE 1989b). The new retail building that just-meets-code has a number of energy-related features that are different from the base building. It has metal-frame walls with nominal R-11 insulation and R-19 insulation in the ceiling. Lighting peak power intensity is 1.76 W/ft2
and electronic equipment peak power intensity is 0.5 W/ft2. The windows are metal frame double-pane with a U-value of 0.65 Btu/hr-ft2-F and a solar heat gain coefficient of 0.62. The HVAC system consists of two packaged single-zone (PSZ) systems with cooling capacity of 10 tons and 195 kBtu/hr gas furnace. The PSZ system serving the northeast zone has a 1.9 hp fan and the PSZ system serving the southwest zone has a 2.5 hp fan. The best practices retail building has the following energy-related features that are different from the just-meets-code building:
• Cool roof with an absorptivity of 0.3 • Efficient lighting at 0.93 W/ft2 • Roof insulation at R-30, sidewalls R-19 • Specularly-selective windows with a shading coefficient of 0.3, U of 0.36 • Packaged HVAC with 11.5 EER • Enhanced duct sealing
School The base school is a two-story building with 40,000 square feet of conditioned floor area. It has metal-frame walls with nominal R-11 (R-5.5) insulation in the walls and R-11 insulation in the roof. Lighting peak power intensity is 2.4 W/ft2 in the classrooms, library, kitchen, and dining areas, 0.65 W/ft2 in the gym, and 0.8 W/ft2 in the auditorium. Electronic equipment peak power intensity is 0.2 W/ft2 in the classrooms, 0.9 W/ft2 in the library and auditorium, 0.02 W/ft2 in the gym, 0.1 W/ft2 in the dining room and 15 W/ft2 in the kitchen. Peak gas equipment intensity is 148 Btu/hr-ft2 in the kitchen. The windows are metal frame single-pane with a U-value of 1.11 Btu/hr-ft2-F and a solar heat gain coefficient of 0.72. Window-to-wall area ratio is 0.30, floor to ceiling height is 10 ft
3-21

in all rooms except the gym and auditorium that have 32 ft ceiling height. Floor weight is medium (60 lb/ft3). Average peak occupancy level is 86.5 ft2/person. The building is served by packaged single zone AC systems with the following capacity levels: all classrooms 35-tons, library-7 tons, auditorium-4 tons, gym-5 tons, kitchen-7 tons, and dining rooms-6 tons (Las Vegas prototypes have roughly 50% more installed cooling capacity). Occupancy, lighting, miscellaneous equipment, and service hot water schedules and minimum outdoor air ventilation requirements are taken from ASHRAE (ASHRAE 1989a, ASHRAE 1989b). The new school building that just-meets-code has a number of energy-related features that are different from the base building. It has metal-frame walls with nominal R-11 (R-5.5) insulation and R-19 insulation in the ceiling. Lighting peak power intensity is 2.1 W/ft2 in the classrooms, library, kitchen, and dining areas, 0.65 W/ft2 in the gym, and 0.8 W/ft2 in the auditorium. Electronic equipment peak power intensity is 0.2 W/ft2 in the classrooms, 0.9 W/ft2 in the library and auditorium, 0.02 W/ft2 in the gym, 0.1 W/ft2 in the dining room and 15 W/ft2 in the kitchen. Peak gas equipment intensity is 148 Btu/hr-ft2 in the kitchen. The windows are metal frame double-pane with a U-value of 0.65 Btu/hr-ft2-F and a solar heat gain coefficient of 0.62. The best practices school building has the following energy-related features that are different from the just-meets-code building:
• Cool roof with an absorptivity of 0.3 • Efficient lighting at 1.03 W/ft2 • Roof insulation at R-30, sidewalls R-19 • Efficient office equipment at 0.5 W/ft2 • Specularly-selective windows with a shading coefficient of 0.3, U of 0.36 • Packaged HVAC with 11.5 EER • Enhanced duct sealing
Food Service/Sales The base food service/sales prototype is a one-story building with 4,000 total square feet of conditioned floor area (2,000 kitchen/office/storage and 2,000 restaurant/food sales area). The base has no insulation in the walls and R-11 insulation in the roof. Lighting peak power intensity is 1.88 W/ft2. The peak power intensity for other electrical equipment is 1.15 W/ft2 in the kitchen and 0.20 W/ft2 in the restaurant area. The windows are metal frame single-pane with a U-value of 1.11 Btu/hr-ft2-F and a solar heat gain coefficient of 0.72. The window-to-wall area ratio in the office is 0.39. Floor to ceiling height 15 ft and floor weight is medium (60 lb/ft3). Peak occupancy is 250 ft2/person in the kitchen, office, and storage areas and 40 ft2/person in the restaurant. The HVAC system consists of two packaged single-zone (PSZ) systems, one for the kitchen/office/storage areas and one for the restaurant. The kitchen/office/storage PSZ has cooling capacity of 14 tons and heating capacity of 430 kBtu/hr. The restaurant PSZ has cooling capacity of 10 tons and heating capacity of 360 kBtu/hr. Base cooling EER
3-22

is 8.1 and furnace efficiency is 75%. Custom and packaged display refrigeration systems are each modeled as 50% of the refrigeration load. Occupancy, lighting, miscellaneous equipment, and service hot water schedules and minimum outdoor air ventilation requirements are taken from ASHRAE (ASHRAE 1989a, ASHRAE 1989b). The new food services/sales building that just-meets-code has a number of energy-related features that are different from the base building. It has metal-frame walls with nominal R-11 (R-5.5) insulation and R-11 insulation in the ceiling. The windows are metal frame double-pane with a U-value of 0.65 Btu/hr-ft2-F and a solar heat gain coefficient of 0.62. The kitchen/office/storage PSZ has cooling capacity of 2 tons and heating capacity of 100 kBtu/hr. The restaurant PSZ has cooling capacity of 5 tons and heating capacity of 280 kBtu/hr. Base cooling EER is 8.5 and furnace efficiency is 80%. The best practices food services/sales building has the following energy-related features that are different from the just-meets-code building:
• Cool roof with an absorptivity of 0.3 • Efficient lighting at 1.27 W/ft2 • Roof insulation at R-30, sidewalls R-19 • Efficient office equipment at 0.5 W/ft2 • Specularly-selective windows with a shading coefficient of 0.3, U of 0.36 • Packaged HVAC with 11.5 EER • Efficient packaged refrigerators (30 % improvement) • Efficient custom refrigeration systems (30 % improvement) • Enhanced duct sealing
Results of Modeling Analysis Each of these building types was modeled using DOE 2.2 simulation software using typical meteorological year weather data from Las Vegas to represent the three southern states and Denver to represent the three northern states. The paragraphs below describe changes in energy intensity from the base case to the just-meets-code and best practices cases for each of the building types in the two weather regions in the Southwest. The prose description is followed by a table and graphics illustrating the same information. Office Simulation of the base office building in the southern states (AZ, NV, and NM) shows an electric energy intensity of 27.56 kWh/ft2/yr and a gas intensity of 25.18 kBtu/ft2/yr. Simulation of the base office building in the northern states (CO, UT, WY) shows an electric energy intensity of 23.42 kWh/ft2/yr and a gas intensity of 43.46 kBtu/ft2/yr. Simulation of the just-meets-code office building in the southern states shows an electric energy intensity of 21.59 kWh/ft2/yr, 21.7 % less than the base office building, and a gas intensity of 9.38 kBtu/ft2/yr, 62.7 % less than the base office building. Simulation of the
3-23

just-meets-code office building in the northern states shows an electric energy intensity of 19.19 kWh/ft2/yr, 18.1 % less than the base office building, and a gas intensity of 18.80 kBtu/ft2/yr, 56.7 % less than the base office building. The addition of just-meets-code features increases the first cost by $2.57 per square foot versus the base office building in both weather regions. Simulation of the best practices office building in the southern states shows an electric energy intensity of 9.98 kWh/ft2/yr, 53.8 percent less than the just-meets-code office building, and a gas intensity of 8.49 kBtu/ft2/yr, 9.5% less than the just-meets-code office building. Simulation of the best practices office building in the northern states shows an electric energy intensity of 8.88 kWh/ft2/yr, 53.7 % less than a just-meets-code office building, and a gas intensity of 18.30 kBtu/ft2/yr, 2.7% less than the just-meets-code office building. The addition of best practices features increases the first cost by $1.15 per square foot versus the just-meets-code office building in both weather regions. Retail Simulation of the base retail building in the southern states shows an electric energy intensity of 19.01 kWh/ft2/yr and a gas intensity of 8.48 kBtu/ft2/yr. Simulation of the base retail building in the northern states shows an electric energy intensity of 14.25 kWh/ft2/yr and a gas intensity of 34.10 kBtu/ft2/yr. Simulation of the just-meets-code retail building in the southern states shows an electric energy intensity of 15.25 kWh/ft2/yr, 19.8 % less than the base retail building, and a gas intensity of 5.2 kBtu/ft2/yr, 38.7 % less than the base retail building. Simulation of the just-meets-code retail building in the northern states shows an electric energy intensity of 12.32 kWh/ft2/yr, 13.5 % less than the base retail building, and a gas intensity of 16.16 kBtu/ft2/yr, 52.6 % less than the base retail building. The addition of just-meets-code features increases the first cost by $4.25 per square foot versus the base retail building in both weather regions. Simulation of the best practices retail sales building in the southern states shows an electric energy intensity of 6.87 kWh/ft2/yr, 55.0 percent less than a just-meets-code retail sales building, and a gas intensity of 5.51 kBtu/ft2/yr, 6.0 % more than the just-meets-code retail sales building. The slight increase in gas usage is due to lower internal gains (due to more efficient lighting) and fenestration that limits passive solar heating, thereby achieving substantial electric savings during the cooling season. Simulation of the best practices retail sales building in the northern states shows an electric energy intensity of 5.96 kWh/ft2/yr, 51.6 % percent less than a just-meets-code retail sales building, and a gas intensity of 15.47 kBtu/ft2/yr, 4.3 % less than the just-meets-code retail sales building. The addition of best practices features increases the first cost by $1.76 per square foot versus the just-meets-code retail building in both weather regions.
3-24

School Simulation of the base school building in the southern states shows an electric energy intensity of 15.77 kWh/ft2/yr and a gas intensity of 16.48 kBtu/ft2/yr. Simulation of the base school building in the northern states shows an electric energy intensity of 12.00 kWh/ft2/yr and a gas intensity of 47.86 kBtu/ft2/yr. Simulation of the just-meets-code school building in the southern states shows an electric energy intensity of 12.99 kWh/ft2/yr, 17.6 % less than the base school building, and a gas intensity of 14.94 kBtu/ft2/yr, 9.3 % less than the base school building. Simulation of the new school building in the northern states shows an electric energy intensity of 10.40 kWh/ft2/yr, 13.3 % less than the base school building, and a gas intensity of 42.45 kBtu/ft2/yr, 11.3 % less than the base school building. The addition of just-meets-code features increases the first cost by $3.45 per square foot versus the base school building in both weather regions. Simulation of the best practices school building in the southern states shows an electric energy intensity of 6.24 kWh/ft2/yr, 52.0 percent less than the just-meets-code school building, and a gas intensity of 13.21 kBtu/ft2/yr, 11.6 % less than the just-meets-code school building. Simulation of the best practices school building in the northern states shows an electric energy intensity of 5.45 kWh/ft2/yr, 47.6 % less than a just-meets-code school building, and a gas intensity of 35.12 kBtu/ft2/yr, 17.3 % less than the just-meets-code school building. The addition of best practices features increases the first cost by $1.59 per square foot versus the just-meets-code school building in both weather regions. New Food Service/Sales Simulation of the base food service/sales building in the southern states shows an electric energy intensity of 50.69 kWh/ft2/yr and a gas intensity of 113.85 kBtu/ft2/yr. Simulation of the base food service/sales building in the northern states shows an electric energy intensity of 39.50 kWh/ft2/yr and a gas intensity of 240.78 kBtu/ft2/yr. Simulation of the just-meets-code food service/sales building in the southern states shows an electric energy intensity of 40.40 kWh/ft2/yr, 20.3 % less than the base food service/sales building, and a gas intensity of 112.15 kBtu/ft2/yr, 1.5 % less than the base food service/sales building. Simulation of the just-meets-code food service/sales building in the northern states shows an electric energy intensity of 31.89 kWh/ft2/yr, 19.3 % less than the existing food service/sales building, and a gas intensity of 256.78 kBtu/ft2/yr, 6.6 % more than the existing food service/sales building. Trade offs with electricity savings sometimes have this effect in predominantly heating climates since inefficient lighting contributes more to meeting the heating load than does efficient lighting. (Of course, inefficient lighting has deleterious effects on cooling loads in all climates.) The addition
3-25

of just-meets-code features increases the first cost by $10.52 per square foot versus the base food service building in both weather regions. This high incremental cost is primarily due to code-required window upgrades and the relatively high window area in grocery stores, fast-food restaurants, and other food services/sales buildings. Simulation of the best practices food services building in the southern states shows an electric energy intensity of 25.05 kWh/ft2/yr, 38.0 % less than the just-meets-code food services building, and a gas intensity of 114.96 kBtu/ft2/yr, 2.5 % more than the just-meets-code food services building. Simulation of the best practices food services building in the northern states shows an electric energy intensity of 21.86 kWh/ft2/yr, 31.5 % less than a just-meets-code food services building, and a gas intensity of 230.3 kBtu/ft2/yr, 10.3 % less than the just-meets-code food services building. Note that the savings in the food services building are not as great as the savings in the other building types because lighting and air conditioning, which routinely lend themselves to very good savings, represent a smaller percentage of energy consuming elements in food services buildings. The addition of best practices features increases the first cost by $3.04 per square foot versus the just-meets-code food services building in both weather regions. Table 3-11 summarizes these modeling results in tabular form. Table 3-11. Electric and Gas Intensity of Base, Just-Meets-Code, and Best Practices Commercial Buildings (kWh/ft2/yr and kBtu/ft2/yr) Building Type
AZ, NM, NV Elec
kWh/ft2/yr
AZ, NM, NV Gas
kBtu/ft2/yr
CO, UT, WY Elec
kWh/ft2/yr
CO, UT, WY Gas
kBtu/ft2/yr Base Code Best Base Code Best Base Code Best Base Code BestOffice 27.6 21.6 9.9 25.2 9.4 8.5 23.4 19.2 8.9 43.5 18.8 18.3Retail 19.0 15.3 6.9 8.5 5.2 5.5 14.3 12.3 6.9 34.1 16.2 15.4School 15.8 13.0 6.2 16.5 14.9 13.2 12.0 10.4 5.5 47.9 42.5 35.1Food Svc 50.7 40.4 25.0 114 112 115 39.5 31.9 21.8 241 257 230 Figures 3-3, 3-4, and 3-5 show the gas, electric, and total energy intensity of each building for base, just-meets-code, and best practices buildings in the southern and northern states.
3-26

Figure 3-3. Gas Energy Intensity in kBtu/square foot/year of Each Building Type for the Southern (S) States (on the left) and Northern (N) States (on the right)
0
50
100
150
200
250
300
Office S Retail S School S Food S Office N Retail N School N Food N
kBtu
/sq
ft/y
r
Base Code Best Practices Figure 3-4. Electric Energy Intensity in kWh/square foot/year of Each Building Type for the Southern (S) States (on the left) and Northern (N) States (on the right)
0
10
20
30
40
50
60
Office S Retail S School S Food S Office N Retail N School N Food N
kWh/
sq ft
/yr
Base Code Best Practice
3-27

Figure 3-5. Total Site Energy Intensity in kBtu/square foot/year of Each Building Type for the Southern (S) States (on the left) and Northern (N) States (on the right)
0
50
100
150
200
250
300
350
400
Office S Retail S School S Food S Office N Retail N School N Food N
kBtu
/sq
ft/yr
Base Code Best Practices Deriving State-Wide Energy Consumption Estimates In 1999, the Energy Information Administration State Energy Data Report gave estimates of commercial energy consumption by fuel type and state (EIA 2001). Combining this information with the simulation result above yields an estimate of the annual consumption of electricity and gas by building types in each of the southwest states. This is shown in Tables 3-12 and 3-13. Table 3-12. Annual Electric Consumption in 1999 by Building Type and State (GWh) Building Type Region AZ CO NV NM UT WY Office 21,236 6,592 5,850 3,271 2,310 2,658 555 Retail 16,925 5,519 4,286 2,321 2,091 2,172 539 School 9,051 2,667 2,558 457 1,128 2,080 161 Food Service/Sales 6,504 2,200 1,710 857 765 782 190 Other 12,094 5,710 3,515 101 1,136 382 1,250 Total Electricity 65,810 22,688 17,919 7,007 7,430 8,074 2,692
3-28

Table 3-13. Annual Gas Consumption in 1999 by Building Type and State (Trillion Btu) Building Type Region AZ CO NV NM UT WYOffice 62.0 9.3 20.9 10.9 8.3 10.5 2.1Retail 49.0 7.8 15.3 7.8 7.5 8.6 2.1School 27.3 3.7 9.1 1.5 4.0 8.2 0.6Food Service/Sales 18.6 3.1 6.1 2.9 2.7 3.1 0.7Other 31.3 8.0 12.5 0.3 4.1 1.5 4.8Total Gas 188.1 31.9 63.9 23.4 26.6 32 10.3
Note that these patterns of consumption reflect the performance of the entire stock of commercial buildings existing in 1999. Many were built decades ago with little regard to energy efficiency. Even in jurisdictions with up-to-date commercial energy codes, many newer commercial buildings pre-date these codes or no longer perform as well as when they entered operation, due to the degradation of HVAC energy performance, for example. Toward estimating the energy consequences over time of building increasingly efficient commercial buildings, we begin by normalizing the consumption of each building type to the percentage of floor space of that building type in each state. Recalling that the four building types represent 85% of commercial buildings in the region, we assume that the remaining 15% share the energy-relevant features of the average of the main four building types. Six tables were produced to capture this data for the base, just-meets-code, and best practice cases for electricity and natural gas intensity. An example is shown in Table 3-14. Table 3-14. Electricity Energy Intensity in kWh/sq ft/year of All Commercial Buildings that Just Meet Code Adjusted to Percentage of Floor Space of Each Building Type by Region and State Building Type Region AZ CO NV NM UT WY Office 5.50 5.92 5.06 7.61 5.49 4.05 4.89 Retail 4.67 5.07 3.90 5.51 5.07 3.47 4.97 School 2.11 2.52 2.34 1.12 2.82 3.32 0.55 Food Service/Sales 1.71 1.99 1.43 2.05 1.87 1.20 1.69 Other 0.52 0.58 0.48 0.61 0.57 0.45 0.45 Averages 2.90 3.22 2.64 3.38 3.16 2.50 2.51 Sum 14.51 16.09 13.21 16.89 15.82 12.49 12.57 Note that multiplying the figures by the number of square feet of commercial buildings that just meet code in a state in a given year would produce an estimate of the energy
3-29

consumption of those commercial buildings in the state. In the case illustrated in Table 3-14, electric energy consumption would be estimated. Table 3-15 shows the energy intensity of the aggregate of all commercial buildings in the region normalized by percentage of floor space in each state for the base, just meets code, and best practices cases. Table 3-15. Energy Intensity Normalized by Percentage of Floor Space at Three Levels of Energy Efficiency by State and Region Energy Intensity Region AZ CO NV NM UT WY Electric (existing) kWh/ft2/yr 19.16 27.22 15.73 21.30 19.84 14.81 16.06
Electric (code) kWh/ ft2/yr 14.51 16.09 13.21 16.89 15.82 12.49 12.57
Electric (best practice) kWh/ ft2/yr 7.22 7.75 6.68 8.10 7.61 6.35 6.83
Gas (existing) kBtu/ ft2/yr 32.33 19.24 45.47 19.85 18.74 44.74 45.91
Gas (code) kBtu/ft2/yr 22.68 13.21 32.31 12.62 13.01 32.93 31.98
Gas (best practice) kBtu/ft2/yr 20.85 12.86 29.01 12.41 12.63 29.15 29.05
Total (existing) kBtu/ ft2/yr 97.70 112.12
99.13 92.54 86.43 95.28 100.72
Total (code) kBtu/ ft2/yr 72.19 68.10 77.38 70.25 66.99 75.56 74.86
Total (best practice) kBtu/ ft2/yr 45.48 39.30 51.79 40.03 38.60 50.81 52.36
Scenario Development and Analysis As with the residential analysis, to predict energy use and savings in new commercial building construction associated with implementing codes and adopting best practices, we examine gradual adoption rates under three scenarios, business-as-usual (BAU), moderate improvement, and strong improvement scenarios. Each scenario envisions different rates of implementation of code and best practices commercial and industrial buildings as shown in Table 3-16. Table 3-16. Penetration of Energy Efficient Commercial Buildings between 2001 and 2020 under Three Scenarios of Efficiency Efficiency Scenario
Base 2001-2010
Code 2001-2010
ES+ 2001-2010
Base 2011-2020
Code 2011-2020
ES+ 2011-2020
BAU 40% 50% 10% 25% 60% 15%Moderate 20% 65% 15% 10% 70% 20%Strong 10% 50% 40% 5% 35% 60%
3-30

These estimates assume a somewhat larger number of commercial buildings will meet code in the BAU scenario than those associated with the housing sector. This is because we observe greater adoption of the current ASHRAE model code for commercial building than the IECC code for residential buildings in the region. On the other hand, even in the strong improvement scenario, we assume that there will still be a few buildings built in the period of 2011 to 2020 that do not perform any better than the base buildings. The BAU scenario is consistent with maintaining current trends, but note that it envisions that 60% of buildings constructed between 2000 and 2010 will be code or beyond code buildings, 75% between 2011 and 2020. The moderate improvement scenario is much more effective in achieving new commercial buildings that meet code and moderately effective in the production of high-efficient buildings. The strong improvement scenario envisions strong support for efficiency by all involved in the construction process and results in achieving a substantial percentage of “best practice” new buildings by 2020. The final step toward projecting energy savings requires an estimate of the number of square feet of new commercial space that will be constructed in each state of the region over the next decades. At the beginning of 2001, there were approximately 4 billion square feet of commercial space in the region. As shown in Table 3-17, about 3.1 billion square feet of commercial space will be added by 2020, an increase of 78%. Table 3-17. Projected New Commercial Building Square Feet (millions) State 2001- 2005 2006 - 2010 2011 - 2015 2015 - 2020 2001 - 2020 Arizona 204.9 228.7 314.1 356.5 1,104.2Colorado 270.9 195.0 225.7 212.0 903.5Nevada 142.3 135.9 168.2 183.5 629.9New Mexico 17.5 14.0 41.3 48.9 121.8Utah 102.8 76.1 80.1 76.8 335.9Wyoming 8.7 3.7 4.0 3.8 20.1Region 747.1 653.5 833.4 881.4 3,115.4Source: Tellus Institute These estimates are derived from National Energy Modeling System (NEMS) data, which only provides information on commercial square footage by region. State estimates were produced based on the fraction of commercial sector gross state product (GSP) in each state compared to the region total (Bailie 2002). Given these projections, it is possible to estimate energy savings that would occur in the commercial sector under two scenarios of efficiency, moderate improvement and strong improvement. The analysis counts savings only as improvements to the BAU scenario.
3-31

Table 3-18 shows total site energy savings due to new commercial construction for each state in the year 2010 and the year 2020 under the moderate and strong improvement scenarios. Table 3-18a. Moderate Improvement Scenario of Energy Savings Due to Commercial Buildings Constructed between 2000 and 2020; Annual Energy Savings in 2010 and 2020
2010 Moderate Improvement Scenario State BAU
2010 (TBtu)
Moderate Improvement 2010 (TBtu)
Total Savings in 2010 (TBtu)
Total Elec Savings in 2010 (GWh)
Total Gas Savings in 2010 (TBtu)
AZ 35.92 31.47 4.44 1146.5 0.53CO 38.91 36.29 2.62 386.8 1.30NV 21.19 19.52 1.66 367.9 0.41NM 2.27 2.10 0.17 38.3 0.04UT 14.49 13.56 0.93 137.9 0.46WY 1.03 0.95 0.08 12.2 0.04Region 113.79 103.90 9.90 2089.6 2.77
2020 Moderate Improvement Scenario State BAU
2020 (TBtu)
Moderate Improvement 2020 (TBtu)
Total Savings in 2020 (TBtu)
Total Elec Savings in 2020 (GWh)
Total Gas Savings in 2020 (TBtu)
AZ 50.15 44.76 9.84 2,546 1.15CO 34.56 32.58 4.61 695 2.24NV 25.07 23.37 3.37 755 0.79NM 6.10 5.71 0.56 130 0.12UT 12.05 11.39 1.59 241 0.76WY 0.60 0.57 0.12 19 0.05Region 128.54 118.36 20.07 4,386 5.11 Table 3-18b. Strong Improvement Scenario of Energy Savings Due to Commercial Buildings Constructed between 2000 and 2020; Annual Energy Savings in 2010 and 2020
2010 Strong Improvement Scenario State BAU
2010 (TBtu)
Strong Improvement 2010 (TBtu)
Total Savings in 2010 (TBtu)
Total Elec Savings in 2010 (GWh)
Total Gas Savings in 2010 (TBtu)
AZ 35.92 26.44 9.47 2,533 0.83CO 38.91 32.29 6.62 1,265 2.30NV 21.19 16.80 4.38 1102 0.62NM 2.27 1.82 0.45 116 0.06UT 14.49 12.10 2.39 454 0.84WY 1.03 0.85 0.18 34 0.06Region 113.79 90.30 23.49 5,505 4.71
3-32

2020 Strong Improvement Scenario State BAU
2020 (TBtu)
Strong Improvement 2020 (TBtu)
Total Savings in 2020 (TBtu)
Total Elec Savings in 2020 (GWh)
Total Gas Savings in 2020 (TBtu)
AZ 50.15 35.56 24.07 6,543 1.74CO 34.56 27.62 13.56 2,772 4.10NV 25.07 18.72 10.73 2,804 1.16NM 6.10 4.59 1.96 522 0.18UT 12.05 9.68 4.75 961 1.47WY 0.60 0.49 0.30 60 0.09Region 128.54 96.66 55.37 13,662 8.76 These results show that if policies are pursued that result in a moderate improvement scenario, the savings versus the business-as-usual scenario of all of the new commercial buildings constructed in the region from 2001 through 2020 will be 9.9 trillion Btu in 2010 and 20.1 TBtu in 2020. Under the strong improvement scenario, the savings numbers are 23.5 TBtu in 2010 and 55.4 TBtu in 2020, an improvement of 176% over the moderate improvement scenario. It is interesting to note that electricity savings tend to dominate, especially in the second time period and more so in the strong scenario. Electric savings in the region average 72% of the total savings achieved in the moderate improvement scenario in 2010, but fully 84% of the total savings achieved in the strong improvement scenario in 2020. To put these savings in context, the strong improvement scenario will save the annual energy consumption equivalent of 10,800 just-meets-code moderate-sized (30,000 square foot) office buildings in the region in 2010 and 25,600 office buildings in 2020. In the commercial sector, Arizona represents nearly half of the overall energy savings potential, followed by Colorado and Nevada. Similar to the residential sector findings, the electric saving potential is greatest in Arizona and the gas savings potential is greatest in Colorado. These overall results are illustrated graphically in Figure 3-6.
3-33
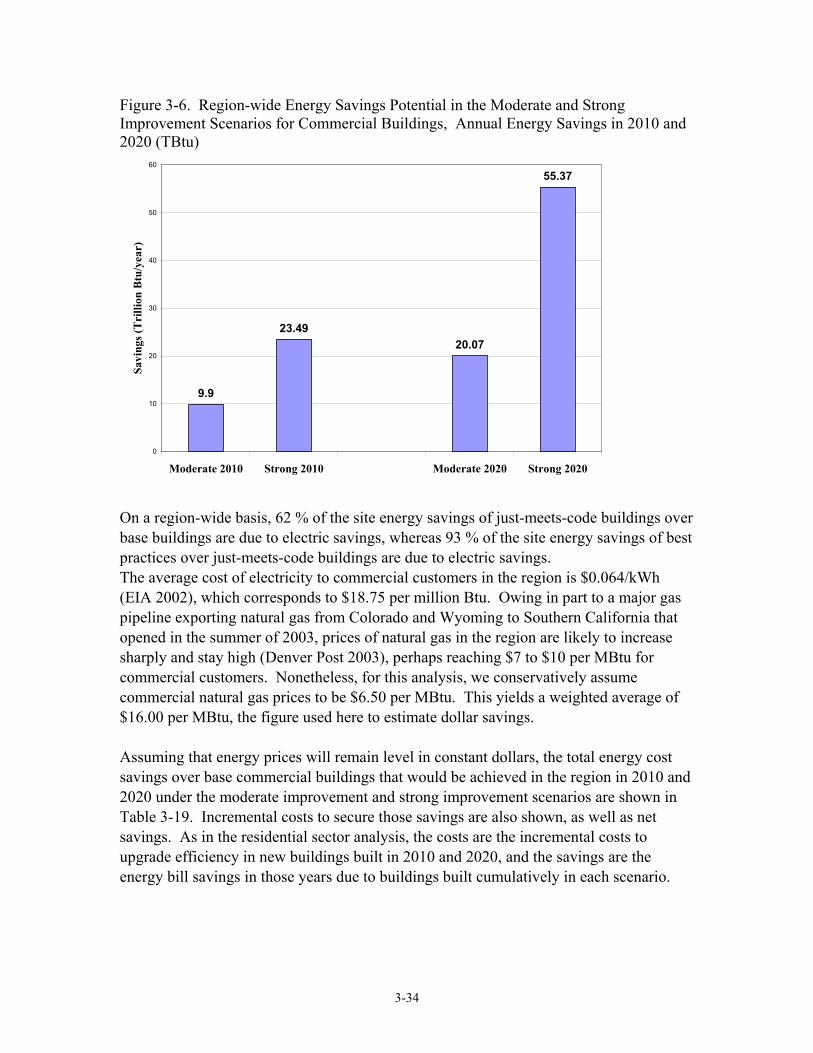
Figure 3-6. Region-wide Energy Savings Potential in the Moderate and Strong Improvement Scenarios for Commercial Buildings, Annual Energy Savings in 2010 and 2020 (TBtu)
9.9
23.4920.07
55.37
0
10
20
30
40
50
60
Moderate 2010 Strong 2010 Moderate 2020 Strong 2020
Savi
ngs (
Tri
llion
Btu
/yea
r)
On a region-wide basis, 62 % of the site energy savings of just-meets-code buildings over base buildings are due to electric savings, whereas 93 % of the site energy savings of best practices over just-meets-code buildings are due to electric savings. The average cost of electricity to commercial customers in the region is $0.064/kWh (EIA 2002), which corresponds to $18.75 per million Btu. Owing in part to a major gas pipeline exporting natural gas from Colorado and Wyoming to Southern California that opened in the summer of 2003, prices of natural gas in the region are likely to increase sharply and stay high (Denver Post 2003), perhaps reaching $7 to $10 per MBtu for commercial customers. Nonetheless, for this analysis, we conservatively assume commercial natural gas prices to be $6.50 per MBtu. This yields a weighted average of $16.00 per MBtu, the figure used here to estimate dollar savings. Assuming that energy prices will remain level in constant dollars, the total energy cost savings over base commercial buildings that would be achieved in the region in 2010 and 2020 under the moderate improvement and strong improvement scenarios are shown in Table 3-19. Incremental costs to secure those savings are also shown, as well as net savings. As in the residential sector analysis, the costs are the incremental costs to upgrade efficiency in new buildings built in 2010 and 2020, and the savings are the energy bill savings in those years due to buildings built cumulatively in each scenario.
3-34
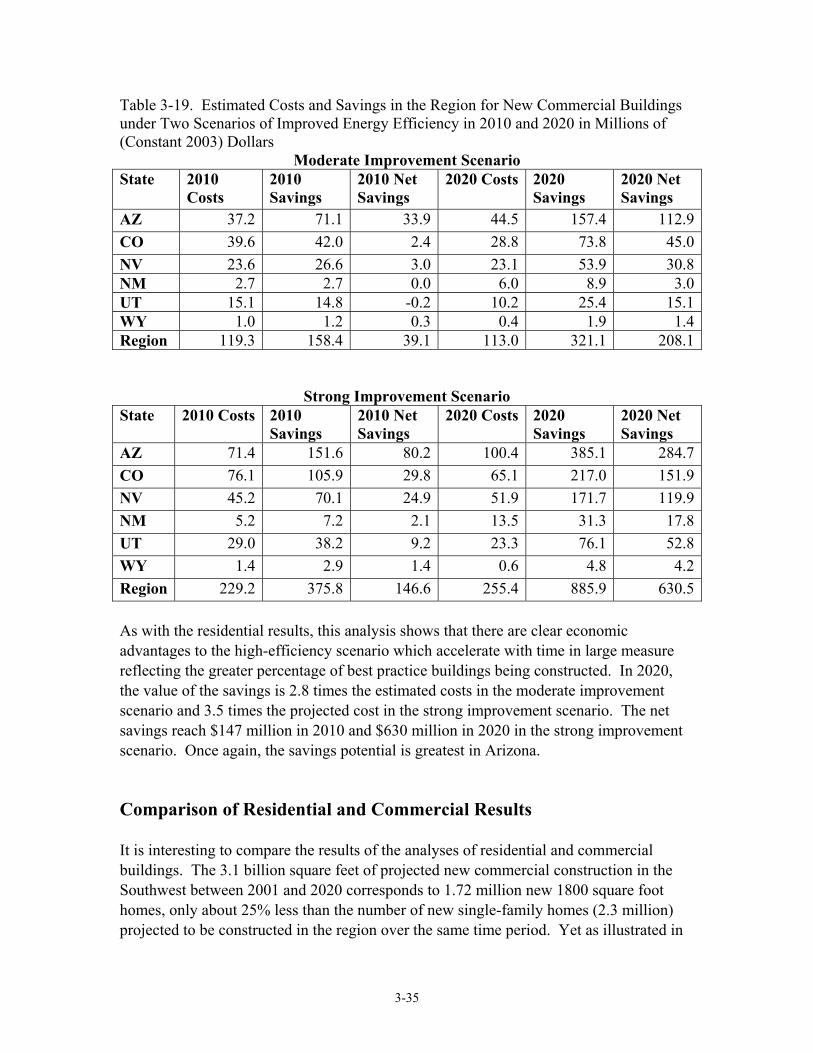
Table 3-19. Estimated Costs and Savings in the Region for New Commercial Buildings under Two Scenarios of Improved Energy Efficiency in 2010 and 2020 in Millions of (Constant 2003) Dollars
Moderate Improvement Scenario State 2010
Costs 2010 Savings
2010 Net Savings
2020 Costs 2020 Savings
2020 Net Savings
AZ 37.2 71.1 33.9 44.5 157.4 112.9CO 39.6 42.0 2.4 28.8 73.8 45.0NV 23.6 26.6 3.0 23.1 53.9 30.8NM 2.7 2.7 0.0 6.0 8.9 3.0UT 15.1 14.8 -0.2 10.2 25.4 15.1WY 1.0 1.2 0.3 0.4 1.9 1.4Region 119.3 158.4 39.1 113.0 321.1 208.1
Strong Improvement Scenario
State 2010 Costs 2010 Savings
2010 Net Savings
2020 Costs 2020 Savings
2020 Net Savings
AZ 71.4 151.6 80.2 100.4 385.1 284.7CO 76.1 105.9 29.8 65.1 217.0 151.9NV 45.2 70.1 24.9 51.9 171.7 119.9NM 5.2 7.2 2.1 13.5 31.3 17.8UT 29.0 38.2 9.2 23.3 76.1 52.8WY 1.4 2.9 1.4 0.6 4.8 4.2Region 229.2 375.8 146.6 255.4 885.9 630.5 As with the residential results, this analysis shows that there are clear economic advantages to the high-efficiency scenario which accelerate with time in large measure reflecting the greater percentage of best practice buildings being constructed. In 2020, the value of the savings is 2.8 times the estimated costs in the moderate improvement scenario and 3.5 times the projected cost in the strong improvement scenario. The net savings reach $147 million in 2010 and $630 million in 2020 in the strong improvement scenario. Once again, the savings potential is greatest in Arizona. Comparison of Residential and Commercial Results It is interesting to compare the results of the analyses of residential and commercial buildings. The 3.1 billion square feet of projected new commercial construction in the Southwest between 2001 and 2020 corresponds to 1.72 million new 1800 square foot homes, only about 25% less than the number of new single-family homes (2.3 million) projected to be constructed in the region over the same time period. Yet as illustrated in
3-35
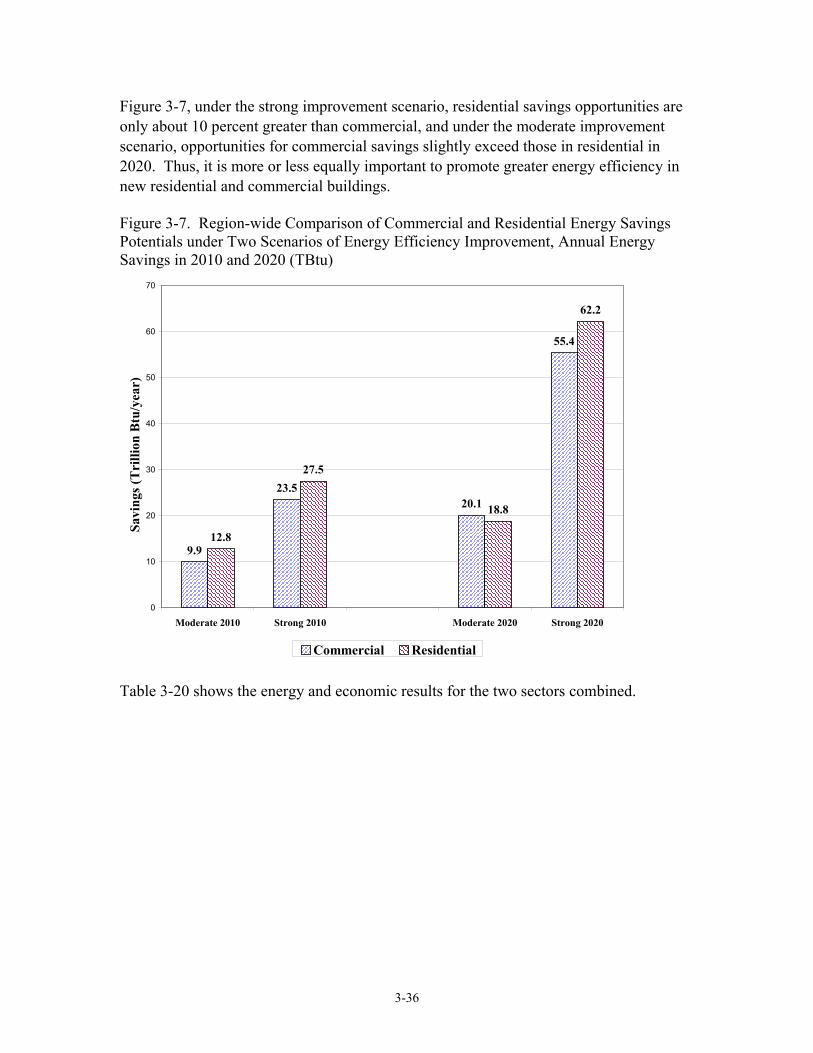
Figure 3-7, under the strong improvement scenario, residential savings opportunities are only about 10 percent greater than commercial, and under the moderate improvement scenario, opportunities for commercial savings slightly exceed those in residential in 2020. Thus, it is more or less equally important to promote greater energy efficiency in new residential and commercial buildings. Figure 3-7. Region-wide Comparison of Commercial and Residential Energy Savings Potentials under Two Scenarios of Energy Efficiency Improvement, Annual Energy Savings in 2010 and 2020 (TBtu)
9.9
23.520.1
55.4
12.8
27.5
18.8
62.2
0
10
20
30
40
50
60
70
Moderate 2010 Strong 2010 Moderate 2020 Strong 2020
Savi
ngs (
Tri
llion
Btu
/yea
r)
Commercial Residential Table 3-20 shows the energy and economic results for the two sectors combined.
3-36

Table 3-20 Combined Residential and Commercial Savings by State, Region, Fuel Type, and Millions of 2003 constant dollars in 2010 and 2020 under the Moderate and Strong Scenarios.
Moderate Improvement Scenario State Total
Savings in 2010 (TBtu)
Total Elec Savings in 2010 (MWh)
Total Gas Savings in 2010 (TBtu)
Total Dollar Savings in 2010 (Mil $)
Total Savings in 2020 (TBtu)
Total Elec Savings in 2020 (GWh)
Total Gas Savings in 2020 (TBtu)
Total Dollar Savings in 2020 (Mil $)
AZ 7.53 1,871 1.15 42.7 14.6 3,360 3.13 155.6CO 6.72 476 5.1 37.7 10.41 845 7.53 116.0NV 3.56 743 1.03 6.8 6.29 1,074 2.62 56.2NM 1.37 56 1.18 6.5 2.18 199 1.51 21.0UT 3.31 208 2.6 20.6 4.98 351 3.77 57.0WY 0.26 14 0.21 2.3 0.44 24 0.35 5.4Region 22.8 3,369 11.3 116.5 38.9 5,851 18.9 411.2
Strong Improvement Scenario State Total
Savings in 2010 (TBtu)
Total Elec Savings in 2010 (MWh)
Total Gas Savings in 2010 (TBtu)
Total Dollar Savings in 2010 (Mil $)
Total Savings in 2020 (TBtu)
Total Elec Savings in 2020 (GWh)
Total Gas Savings in 2020 (TBtu)
Total Dollar Savings in 2020 (Mil $)
AZ 16.39 4,156 2.21 98.2 40.83 9,407 8.73 432.4CO 15.04 1,448 10.1 95.2 31.68 3,239 20.63 362.7NV 8.72 1,960 2.03 33.8 21.22 3,948 7.75 211.3NM 3.06 155 2.54 14.9 7.42 754 4.85 76.5UT 7.3 600 5.25 48.2 15.37 1,307 10.91 177.7WY 0.47 37 0.34 4.1 1.08 72 0.83 12.6Region 51.0 8,355 22.5 294.3 117.6 18,726 53.7 1,273.1 The pattern that emerges is quite clear; the strong improvement scenario is the most cost effective and achieves the most savings of total energy, electricity, gas, and dollars. A net of $294 million is saved in 2010 and $1.27 billion is saved in the year 2020 in the strong improvement scenario. Furthermore, we estimate that the net savings during 2001-2020 would equal about $2.8 billion in the moderate improvement scenario and $8.4 billion in the strong improvement scenario. These estimates are conservative in that they do not reflect the energy and dollar savings that will occur after 2020 as a result of more efficient buildings constructed prior to and during 2020.
3-37

The electricity savings under the strong improvement scenario reach 18,700 gigawatt hours in 2020. This is equivalent to the electricity supplied by about 3,270 megawatts of electricity, meaning that the region could avoid building six 550 megawatt new power plants. The savings in natural gas, 53.7 trillion Btu in 2020, is the equivalent of 60 billion cubic feet of gas. This in turn is equivalent to the average output of 1,200 natural gas wells in the region—meaning this number of wells could be avoided by 2020 if the strong improvement scenario is followed.6
6 A typical natural gas well in the southwest region produced 137,000 cubic feet of gas per day, or about 50 million cubic feet per year as of 2001. There is considerable variation in gas output within the region, however, with wells in Colorado producing 75,000 cubic feet per day on average, wells in New Mexico producing 116,000 cubic feet per day, and wells in Wyoming producing 287,000 cubic feet per day. Furthermore, there were 22,100 wells producing gas in Colorado, 35,200 wells in New Mexico, and 14,000 wells in Wyoming as the end of 2001. Data on gas production by state are available from the U.S. Energy Information Administration, Natural Gas Annual 2001, http://www.eia.doe.gov/oil_gas/natural_gas/data_publications/natural_gas_annual/nga.html
3-38

SECTION 4
RECOMMENDATIONS Adopting and enforcing up-to-date energy codes, providing training to both building inspectors and builders, evaluating actual savings achieved, and surpassing the energy performance specified by codes are among the most effective mechanisms states and local jurisdictions can employ to effect energy efficiency in buildings. The results of the analyses in this report and others demonstrate that far better performance than is routinely achieved with new buildings is both practically achievable and economically sound. “Building buildings right” will save consumers and businesses money for decades after a new building is constructed, and will also provide broad societal benefits such as reduced water use, reduced emissions of pollutants, and added jobs in local economies (SWEEP 2002). Consequently, we urge state and local authorities as well as electric and gas utilities to bolster their policies and programs aimed at improving the energy efficiency of new buildings. Upgrade to State-of-the-Art Building Codes Up-to-date energy codes such as the latest version of the IECC can help states and municipalities raise energy efficiency and reduce electricity consumption and peak demand cost-effectively. It is critical to complement code adoption with training and technical assistance as well as rigorous code enforcement efforts in order to maximize energy savings and other benefits. These implementation-oriented activities are addressed in the second recommendation in this section. Adopting a recent version of the IECC (i.e., 2000 or more recent) is especially important in the Southwest region because this model energy code has a window efficiency requirement pertaining to maximum solar heat gain coefficient (SHGC) of 0.4 for windows for warmer regions with 3,500 heating degree-days or less. This requirement, if followed, will lead to substantial cooling load reductions and thus air conditioning electricity use and peak demand savings in hotter states such as Arizona, New Mexico, and Nevada (Prindle and Arasteh 2001). ASHRAE 90.2, the residential code included in NFPA 5000, still uses the outdated parameter shading coefficient (SC) to specify the net solar transmitting properties of a glazing unit. For climate zones in hot states, a SC of at most 0.5 is required, which roughly corresponds to a SHGC of 0.44 (ASHRAE 2001). In the southwest region, up-to-date building codes should be adopted statewide in New Mexico, Nevada, and Wyoming since these are not home rule states. Likewise up-to-date codes should be adopted at the local level where this has not yet been done in Arizona (especially in the Phoenix area) and Colorado (especially in the Denver and Colorado
4-1

Springs areas) given that these are home rule states. In addition, Colorado should adopt the IECC or ASHRAE 90.1-1999 standard for all new state-owned buildings, as recommended by a commercial buildings energy efficiency advisory group that met in Colorado in 2002 (E-Star Colorado 2002). All of these states and localities should consider enhancing the IECC or ASHRAE standards with modifications that further improve energy efficiency in a hot, dry region, in ways akin to the additions to the Title 24 building efficiency standards that California adopted in 2001 (Mahone et al. 2002). The Codes and Standards Enhancement (CASE) initiatives in California cover residential issues such as hardwired lighting, multifamily and single-family DHW measures, advanced evaporative cooling, and night ventilation cooling. Commercial aspects of the CASE initiatives cover automatic bi-level lighting controls, optimizing cooling towers and large HVAC equipment, and daylighting systems and associated controls. CASE initiatives also address retrofit measures for both residential and commercial building that include duct sealing when HVAC systems are replaced, and ensuring that enhanced performance windows are installed when windows are replaced. Each of these measures or others like them may be worthy of emulation by codes and standards bodies in the Southwest. The Mahone et al paper cited above includes useful advice on criteria decision-making bodies should employ in choosing particular measures to enhance codes and standards. These include technical feasibility, market readiness, economic benefits, political feasibility, level of effort required to develop a given initiative, and activities of others that should be taken into account. At least three jurisdictions, the State of New Mexico and the cities of Denver and Phoenix, are considering adopting NFPA 5000. SWEEP supports the adoption of the IECC codes, both because they represent the outcome of an extensive consolidation and analytical process and because they are effective, supported by a number of groups, and evolving toward greater simplicity and ease of enforcement. However if adoption of IECC codes proves politically impossible for areas with weak codes or none at all, NFPA 5000 will be an improvement. Its commercial code is allied with the most up-to-date version of ASHRAE 90.1, just like the commercial IECC codes. The NFPA 5000 residential code, based on ASHRAE 90.2 for residential structures, will need to be supported, as recommended below. Expand Training and Technical Assistance Efforts to Achieve High Levels of Code Compliance Training and assisting architects, builders, building contractors, and building code officials is critical to the successful implementation of new building codes. Various studies have shown that such activities can significantly improve code compliance and
4-2

can be very cost-effective in terms of energy savings per program dollar invested (Halverson et al. 2002; Johnson and Nadel 2000; Smith and Nadel 1995). Indeed, utility involvement in developing and implementing codes and standards that result in energy savings can be many times as effective as conventional energy conservation programs. This is a primary conclusion of a recent study entitled “What’s a Utility Codes and Standards Program Worth, Anyway?”(Stone et al. 2002). The authors studied the consequences of using public goods funds to support work by California’s investor-owned utilities to analyze potential energy savings, market penetration potential, device availability, and other issues associated with additions to California’s building and appliance standards put in place in 2001. “On a per kWh basis, C&S [Codes and Standards] programs cost about 2-6% of what efficiency programs cost,” the authors maintain. Whether these numbers will hold in the six states of the Southwest is unclear, but it is highly likely that supporting the implementation of modern energy codes can have major impacts at modest investment throughout the region. Training and technical assistance is needed in a variety of areas including:
• Integrated building design; • Proper sizing and installation of HVAC systems; • Appropriate air tightness and insulation procedures; and • The use of state-of-the-art technologies and design strategies such as daylighting,
duct sealing, air infiltration reduction, indirect-direct evaporative cooling, and reflective roofing options.
Of course, such training should not be focused uniquely on the attempt to achieve code compliance with new buildings, but on inculcating techniques for designing and building structures that are highly efficient—that is, that go well beyond minimum code requirements. Compliance tools and training materials that support energy codes (and beyond them) have been developed by a number of organizations, most significantly the Pacific Northwest National Laboratory (PNNL) which is funded by DOE. Most of PNNL’s recent work has been in support of IECC codes, but if a number of jurisdictions adopt NFPA 5000, it would be appropriate to develop training materials and compliance software in support of the residential portion of the code, ASHRAE 90.2. (Since both NFPA 5000 and IECC use ASHRAE 90.1 at the base of their commercial code, COMcheck should function as adequate compliance software for both sets of commercial codes.) We recommend that state energy agencies, local energy offices, and utilities in the Southwest expand their efforts related to energy code implementation. Utilities in
4-3

particular should support code implementation as part of their energy efficiency programs, in addition to encouraging construction of highly efficient “beyond code” new homes and commercial buildings. Also, consideration should be given to starting a regional energy codes support project, as has been done successfully in Northeastern states (DeWein, Abrey, and Slote 2002). Energy agencies and utilities should also consider providing technical support to building code inspectors (e.g., help in reviewing commercial building plans) and possibly providing supplementary funding to enhance code enforcement efforts in jurisdictions where such capability is limited. Building code inspectors typically have relatively little energy expertise as well as relatively little time to review energy issues during either plan reviews or field inspections (Smith and Nadel 1995). Expand Efforts to Promote the Construction of Highly-Efficient New Buildings that Exceed Minimum Code Requirements The review of building codes and new construction programs in the region showed a number of examples where new homes and commercial buildings far exceed the energy performance requirements of building energy codes. This, in combination with the analyses in Section 3 of this report, suggest that through integrated design approaches such as those advocated in the ENERGY STAR and Building America programs, it is possible to reduce energy consumption by 30 to 50 percent relative to code requirements, and do so in a cost-effective manner. This potential is not speculative; it has been proven in the residential sector in Civano, AZ, and in the housing developments of Ence, Pulte, and other leading builders in the region. Such savings have also been achieved in numerous commercial buildings throughout North America. Xcel Energy’s commercial and industrial building program in Minnesota has addressed over 44 million square feet of new building space and has achieved 28% savings compared to local code; Xcel’s commercial new construction program in Colorado shows promise of slightly better savings (ACEEE 2003; Gruen 2003). Builders in Canada benefit from a federal cash incentive whose amount varies with the amount to which the structure exceeds ASHRAE 90.1 1999 standards by more than 25%. As a consequence almost all new commercial buildings in Canada are being built to exceed this figure (Kinney 2002). In order to foster increased construction of highly efficient new homes and commercial buildings, energy agencies and utilities should expand technical and financial assistance efforts, demonstration and promotion programs, and performance guarantee efforts, including:
• Replication of the training, promotion, financial incentive, and energy bill guarantee programs that are leading to large numbers of highly efficient new homes in the Phoenix and Tucson areas as well as in Nevada. Programs like the
4-4

one conducted by Tucson Electric Power Co. that promote 30 percent beyond-code new homes and provide builders with free inspection services merit emulation.
• Expansion and replication of exemplary commercial building new construction
programs such as Utah’s state buildings design assistance and incentive program or the Energy Design Assistance Program implemented by Xcel Energy in Colorado.
Raise the Performance Bar The history of the evolution of energy codes has followed improvements in building practices which in turn are influenced by programs such as ENERGY STAR and Building America. Raising the performance criteria for meeting ENERGY STAR and Building America minimums can have immediate positive effects in these “upper end” homes and eventually upgrade the performance of buildings at the lower end of the efficiency curve via code upgrades. The ENERGY STAR threshold is far from being unduly demanding in the Southwest, as evidenced by the large fraction of new homes qualifying in cities like Tucson, Phoenix, and Las Vegas. There is still plenty of room for improvement, particularly in this region where dry climates allow for cost-effective space cooling. In addition to better quality windows (which have low U values and low SHGC), there are improvements in technologies for sun control to maximize solar benefits when they are needed—for wintertime space heating, hot water heating, and daylighting—and minimize solar space heating in warm periods. Clear skies in the Southwest typically produce quite moderate temperatures a night, so strategies that include limiting direct beam solar during cooling months, coupled with excellent insulation and high mass, can result in comfortable structures for most of the year using nighttime ventilation alone (Kinney 2003b). Further, although building science and “whole house” approaches to higher performing building design have achieved remarkable advances in saving space conditioning energy, there has been inadequate attention paid to other end uses (Holton and Rittelmann 2002). Yet there are many new homes with ENERGY STAR and Building America logos on their “For Sale” signs that have only incandescent bulbs in their light fixtures. The ENERGY STAR program has not raised its minimum thresholds since the program was initiated in 1995. We recommend raising the qualification level in the hotter climate zones, if not for the nation as a whole. Of course adequate lead times should be allowed so that builders and others involved in the program can adjust. In particular, we recommend raising the bar on building envelope performance and including ENERGY STAR appliance and lighting requirements. We believe that with adequate lead time, this
4-5
change will be supported by outstanding builders who use energy efficiency and the ENERGY STAR logo to distinguish their homes from the competition.
Evaluate Real Savings The careful study of the effect of energy codes in Fort Collins has been very instructive for many parties—energy analysts, code officials, utilities, builders, and trainers (Swartz 2002). Good evaluation can suggest mid-course corrections that will enhance the effectiveness of the code enforcement process as well as programs aimed at promoting better building construction. That has been the outcome in Fort Collins where lessons learned have become integrated into training modules for builders and code officials alike. Unfortunately, there are relatively few real-world new building monitoring studies analogous to that in Fort Collins. An evaluation of residential energy performance, conducted by Advanced Energy, is underway is Arizona, but no results have been made available as of the summer of 2003. In addition, the National Renewable Energy Laboratory has an ongoing High Performance Buildings Research program which examines the performance of high-profile commercial and institutional buildings whose energy features merit case study analysis that frequently includes detailed monitoring (NREL 2003). The Weatherization Assistance Program is the nation’s longest-running energy conservation program; it has been operational for almost three decades. However, the magnitude and cost effectiveness of the savings achieved have increased by at least a factor of two since DOE sponsored a comprehensive evaluation of all aspects of the program in the early 1990’s. Findings have been integrated into training activities and been useful in securing program support from utilities and others. In addition, the evaluation spurred many states to implement management controls that continually track measures taken, their costs, and energy-saving consequences.
Given these experiences, SWEEP recommends that all states and utilities in the region undertake field studies of construction practices and the energy performance of a sample of new residential and commercial buildings. Such studies would aid code implementation and beyond code programs in a number of ways, not the least of which is to accelerate the pace of producing more energy-efficient buildings more cost effectively. We suggest a mix of an instrumented approach to test and directly measure energy use of major end users in a small number of buildings in conjunction with a phone survey-and-bill analysis approach with a larger number of buildings. Some follow-up sampling for high and low outliers is often useful as well. The idea is to quantify actual performance and produce rational explanations of performances that are both better and worse than expectation.
4-6

At a minimum, the results of carefully conducted evaluations can be expected to:
• Enlighten builders and code officials. Finding out what works and what doesn’t helps tailor training for all parties, makes the inspection process more pointed (and thereby efficient), and produces better buildings with fewer callbacks. For example, evaluation of homes with unvented attics in various climate zones is needed to confirm the effectiveness of this promising strategy.
• Enhance marketing materials. Concrete numbers from evaluations of actual
performance provide proof of the pudding—and thereby enhance builders’ marketing materials and spur competition that will ultimately raise the energy efficiency performance of an increasing number of new buildings.
• Sharpen analytical tools. Computer modeling is a very powerful, useful, and cost-effective building design tool. However, relying uniquely (or even mostly) on computer analysis can be misleading. Intelligently gathered and analyzed field data should inform computer codes, allowing the replacement of constants based on rules of thumb by subroutines based on patterns of empirical data.
4-7

References Andrews, S. 2003. Personal communication with Steve Andrews, E-Star Colorado,
Denver, CO, June 2003. ASHRAE Handbook of Fundamental. 2001. American Society of Heating, Refrigerating
and Air-Conditioning Engineers, Inc., Atlanta, 2001. Chapter 30 on Fenestration contains a detailed discussion of solar heat gain coefficients and shading coefficients.
Bailie, L. 2002. Personal communication with Alison Bailie, Associate Scientist, Tellus
Institute, Boston, MA, December 12. Balcomb, D. 2003. Energy 10 software is available through the Sustainable Buildings
Industry Council (SBIC), 1331 H Street NW, Suite 1000, Washington, DC 20005, phone 202-628-7400, www.SBICouncil.org.
BEA 2002. U. S. Bureau of Economic Analysis Regional Accounts Data, Series SA25.
Available online at . www.bea.doc.gov/bea/regional/spi Case, M. and J. Wingerden. 1998. “Incentive Program for Energy Efficient Design of
State Buildings.” In Proceedings of the 1998 ACEEE Summer Study on Energy Efficiency in Buildings. Washington, DC: American Council for an Energy-Efficient Economy.
Colgan, J. 2002. Personal communication with Jim Colgan, Vice President for Sales and
Engineering, Chas Roberts, Phoenix, AZ. September 17. Collins, B. 2002. Personal communication with Barbara Collins of Energy Rated Homes
of America, December 3. Conner, C. 2003. Personal communication with Craig Conner of PNNL, April 4. Dardano, S. 2003. Sam Dardano, Boulder building official and chairman of a State of
Colorado codes committee, quoted in “The New E-Star™ Times,” Third Quarter 2003.
Davenport, R. 2003. Personal communication with Rick Davenport, Director of Building
Science, Masco Contractor Services, Inc. August 13. Denver Post 2003. “Pipeline spells end to cheap natural gas,” March 6, 2003. Source
data cited from Western Gas Resources. DeWein, M. D. Abrey, and S. Slote. 2002. “The Northeast States Residential Energy
Codes Support Project: A Model for Improved Energy Code Implementation through Integrated Code and Building Science Training.” In Proceedings of the
R-1

2002 ACEEE Summer Study on Energy Efficiency in Buildings. Washington, DC: American Council for an Energy-Efficient Economy.
DOE 2003. The web site for downloading proposed new versions of the IECC is
http://www.energycodes.gov/implement/doe_2004_proposals.stm. Douglas, L. 2002, 2003. Personal communications with Linda Douglas, Director of
Tucson Electric Power’s Guarantee Home Program, October-December 2002; August 8, 2003.
Edmunds 2002. Personal communications with Megan Edmunds, Executive Director, E-
Star Colorado, October. EIA [Energy Information Administration]. 2002 Electric $ales and Revenue 2000.
DOE/EIA-0540(2000). Washington, DC: Department of Energy, Energy Information Administration.
EIA 2003/ Residential and Commercial Natural Gas Prices by State are available at
http://www.eia.doe.gov/oil_gas/natural_gas/info_glance/prices.html; electricity prices by states are available at http://www.eia.doe.gov/cneaf/electricity/epm/epmt55p1.html
Ence, T. 2002. Personal communication with Troy Ence, Principal, Ence Homes, St.
George, UT., September 25. EPA 2003. The web address for updates on ENERGY STAR Program progress by
building type and builders for each state is http://energystar.gov/index.cfm?c=new_homes.hm_index.
Energy Design Resources. 2001. “Building Case Study, Biotech Lab and Office: The
R.W. Johnson Pharmaceutical Research Institute.” Available online at www.energydesignresources.com.
E-Star Colorado. 2002. “Commercial Building Energy Efficiency: The Challenges, the
Opportunities,” final report of the Colorado Commercial Building Energy Efficiency Advisory Group.
Floyd, A. and E. Peaser. 2003. “Integrating Green Building Practices into the Building
Regulatory Process,” ICC Building Safety Journal, May. See also Scottsdale’s web site www.scottsdaleaz.gov/greenbuilding for details on Scottsdale’s Green Building Program.
Gilmore, J. 2002. Personal communication with Jill Gilmore, President, Builders Choice,
Las Vegas, NV., September 26.
R-2

Glenn, M. 2002. Personal communication with Michael Glenn, Utah Energy Office, September.
Gohman, C. 2003. Personal communications with Charlie Gohman, Conservation and
Engineering Manager, Arizona Department of Commerce, August 11. Goldstein, D., S Baden, and P. Fairley. 2002. “DOE Comprehensive Residential
Proposal for the IECC” (letter to Ron Majette of the U.S. DOE). Available at RESNET’s web site, http://www.natresnet.org/codes/default.htm.
Gruen, B. 2003. Personal communication with Bill Gruen, Program Manager, Xcel
Colorado, August 4. Hagan, D. 2002. Personal communication with Dan Hagan, Project Manager, Energy,
Minerals and Natural Resources Department, Energy Conservation and Management Division, Santa Fe, NM., September 19.
Halverson, M. 2002. “Energy Code Development for Cooling Climates,” presentation at
the National Workshop on State Building Energy Codes, July. Halverson, M., J. Johnson, D. Weitz, R. Majette, and M. LaLiberte. 2002. “Making
Residential Energy Codes More Effective: Building Science, Beyond Code Programs, and Effective Implementation Strategies.” In Proceedings of the 2002 ACEEE Summer Study on Energy Efficiency in Buildings. Washington, DC: American Council for an Energy-Efficient Economy.
Holton, J. K and W. Rittelmann. 2002. “Base Loads (Lighting, Appliances, DHW) and
the High Performance House,” ASHRAE Paper 4515, presented at the Winter Meeting.
Hughett, P. 2002. Personal communications with Paul Hughett, Principal, Silverado Mechanical LLC in Las Vegas, NM, December.
Johnson, J. and S. Nadel. 2000. “Commercial New Construction Programs: Results from
the 90s, Directions for the Next Decade.” In Proceedings of the 2000 ACEEE Summer Study on Energy Efficiency in Buildings. Washington, DC: American Council for an Energy-Efficient Economy.
Kinney, L. 2002. “Energy Performance Workshops: Making the Integrated Design
Process Fast and Effective.” E source Report ER02-8, Boulder, CO: Platts. Kinney, L. 2003a. “Program Profile: Tucson Utilities’ Efficiency Programs for New
Homes.” See www.swenergy.org/programs/index.html.
R-3

Kinney, L. 2003b. “Homes that Work: Practical, Energy-Efficient Residential Designs,” Proceedings of the European Council for an Energy Efficient Economy Summer Study, June.
Lee, B. 2003. Personal communications with Bob Lee, chair of the Mariposa
Association of Governments’ Codes Committee, August 2003. Makela, E. 2003. Personal communications with Eric Makela, April 4, 2003, July and
August 2003. Nevada residential baseline study by Eric Makela and Michelle Britt of the Britt/Makela Group.
Mahone, D., S. Blanc, P. Eilert, G. Fernstrom, and M. Hunt. 2002. “Upgrading Title 24:
Residential and Nonresidential Building Energy Standards Improvements in California.” In Proceedings of the 2002 ACEEE Summer Study on Energy Efficiency in Buildings. Washington, DC: American Council for an Energy-Efficient Economy.
McElvaney, J. 2002. Personal communication with Joe McElvaney, December 17. City
of Phoenix official in charge of facilitating the code adoption process. McNeil, D. 2002, 2003. Personal communication with Dave McNeil, Energy Program
Manager, Nevada State Energy Office, December 2002, August 2003. NREL 2003. The objectives and a number of case studies on NREL’s work on high
performance buildings may be viewed at www.nrel.gov/buildings/highperformance/research_development.html.
Panetti, C. 2003. Personal communication with Cosimina Panetti, Technical Associate,
Building Codes Assistance Project, April 4. Parker, D. 2002. Personal communication with Doug Parker, Principal, Big Horn
Builders, Boulder, CO December 17, 2002. PNNL 2002. Presentation entitled ANSI/ASHRAE/IESNA Standard 90.1 produced for
the USDOE Building Energy Codes Program. Prindle, B. and D. Arasteh. 2001. Energy Savings and Pollution Prevention Benefits of
Solar Heat Gain Standards in the International Energy Conservation Code. Berkeley, CA: Lawrence BerkeleyNational Laboratory.
Ransom, R 2002. Personal communication with Rita Ransom, October 18. Southwest
Gas official in Las Vegas who co-founded the SG Energy Advantage Program. Rald, C. 2002. Personal communication with Carl Rald, Energy Programs Coordinator,
City of Tucson Operations/Energy Office, Tucson, AZ. September-December 2002.
R-4

Schmidt, C. 2002. Personal communication with Carl Schmidt, Chief Building Official, City of Boulder, CO. December 19.
Smith, L and S. Nadel. 1995. “Energy Code Compliance.” Washington DC: American
Council for an Energy-Efficient Economy. Stone, N., D. Mahone, P. Eilert, and G. Fernstrom. 2002. “What’s a Utility Codes and
Standards Program Worth, Anyway?” In Proceedings of the 2002 ACEEE Summer Study on Energy Efficiency in Buildings. Washington, DC: American Council for an Energy-Efficient Economy.
Swartz, D., R. deKieffer, et al, Evaluation of New Home Energy Efficiency: An
assessment of the 1996 Fort Collins residential energy code and benchmark study of design, construction and performance for homes built between 1994 and 1999, June 2002. Available in PDF format for downloading at www.fcgov.com/building or http://fcgov.com/utilities/home-study.php. In addition to Fort Collins Utilities, the work was co-sponsored by the Colorado Governor’s Office of Energy Management and Conservation and the Western Area Power Administration.
SWEEP 2002. The New Mother Lode: The Potential for More Efficient Electricity Use in
the Southwest. Southwest Energy Efficiency Project, Boulder, CO Available at www.swenergy.org.
Tschida, P. 2003. Personal communication with Paul Tschida, Montana Department of
Environmental Quality, Technical and Financial Services Bureau, Helena, MT, February 6.
Utah Office of Planning and Budget. 2003. Governor’s Office of Planning and Budget,
Demographic and Economic Analysis, www.governor.utah.gov/dea/default.html. Van Allen, D. 2003. Personal communication with Dave Van Allen, code official, City
of Longmont, CO, July 28. Wastchak, D. 2002. Personal communication with Daran R. Wastcjak, President, D. R.
Wastchak, LLC, Phoenix, AZ. September 20. Wilson, D. 2002. Personal communication with David Wilson, Executive Director, Utah
Energy Conservation Coalition, Inc., Orem, UT. September 18. Wyoming Business Commission. 2003. See report of the commission on this website: www.wyomingbusiness.org/minerals/energy_commission/commission_meetings.cfm York and Kushler. 2003. America’s Best: Profiles of American’s Leading Energy
Efficiency Programs. Washington, DC: American Council for an Energy-Efficient Economy. March.
R-5
Appendix A
Energy Code History Outline
At the 2002 National Workshop on State Building Energy Codes, PNNL staff gave a brief history of code development (PNNL 2002), portions of which are outlined below: Residential Energy Code Development 90-75 Energy Conservation in New Building Design ASHRAE’s first comprehensive standard to address the design and construction of new buildings from an energy standpoint MCEC 77 Code for Energy Conservation in New Building Construction Developed by BOCA, ICBO, SBCCI, and the National Conference of States on Building Codes and Standards; based on 90-75 90A-1980 Energy Conservation in New Building Design ASHRAE’s update to 90-75 83 MEC Model Energy Code 1983 Edition Maintained by the Council of American Building Officials Based on 90A-1980 86 MEC Model Energy Code 1986 Edition Maintained by the Council of American Building Officials Based on 90A-1980 and 83 MEC with a few changes 89 MEC Model Energy Code 1989 Edition Maintained by the Council of American Building Officials Based on 90A-1980 and 86 MEC with a few changes 10 CFR 435 Energy Conservation Voluntary Performance Standards for New Buildings; Mandatory for Federal Buildings Includes requirements for both Federal commercial buildings and Federal residential buildings. For residential buildings, use of the software program “Conservation Optimization Standard for Savings in Federal Residences (COSTSAFR) is referenced.
A-1

COSTSAFR to be used to derive the energy consumption goal for the Federal residential building. 92 MEC Model Energy Code 1992 Edition Maintained by the Council of American Building Officials Based on 90A-1980 and 89 MEC with a few changes 93 MEC Model Energy Code 1993 Edition Maintained by the Council of American Building Officials Based on 90A-1980 and 92 MEC with a few changes 90.2-1993 Energy Efficient Design of New Low-Rise Residential Buildings A complete revision to the low-rise residential building provisions in Standard 90A-1980. 95 MEC Model Energy Code 1995 Edition Maintained by the Council of American Building Officials Based on 90A-1980 and 93 MEC with a few changes 98 IECC International Energy Conservation Code 1998 Maintained by the International Code Council. Chapter 6 “Residential Building Design by Acceptable Practice” was consolidated into Chapter 5 in a rewritten form. 00 IECC International Energy Conservation Code 2000 Maintained by the International Code Council. A new Chapter 6 was added containing a four-page optional and stand-alone approach to prescriptive compliance. The approach can only be used on single-family buildings with less than or equal to 15% glazing area or multifamily buildings with less than or equal to 25% glazing area. 01 IECC International Energy Conservation Code 2001 Supplement Maintained by the International Code Council NFPA 5000 NFPA 5000, Building Code This is planned to be the National Fire Protection Association’s first complete building code and will contain ANSI/ASHRAE Standard 90.2-2001 as its residential energy provisions
A-2

Commercial Energy Code Development 90-75 Energy Conservation in New Building Design ASHRAE’s first comprehensive standard to address the design and construction of new buildings from an energy standpoint MCEC 77 Model Code for Energy Conservation in New Building Construction Developed by BOCA, ICBO, SBCCI, and the National Conference of States on Building Codes and Standards; based on 90-75 90A-1980 Energy Conservation in New Design ASHRAE’s update to 90-75 83 MEC Model Energy Code 1983 Edition Maintained by the Council of American Building Officials Based on 90A-1980 86 MEC Model Energy Code 1986 Edition Maintained by the Council of American Building Officials Based on 90A-1980 89 MEC Model Energy Code 1989 Edition Maintained by the Council of American Building Officials Based on 90A-1980 90.1-1989 Energy Efficient Design of New Buildings Except Low-Rise Residential Buildings A complete revision to the previous ASHRAE standards for buildings, excluding low-rise residential buildings. 10 CFR 435 “FEDCOM 0” Energy Conservation Voluntary Performance Standards for New Buildings; Mandatory for Federal Buildings Included requirements for both Federal commercial buildings and Federal residential buildings. 92 MEC Model Energy Code 1992 Edition Maintained by the Council of American Building Officials Based on 90A-1980
A-3
93 MEC Model Energy Code 1993 Edition Maintained by the Council of American Building Officials First version of the MEC to meet EPACT’s requirements to meet or exceed Standard 90.1-1989 – Chapter 7 of the 93 MEC adopts 90.1-1989 by reference. 90.1-1989 Code Version Energy Code for Commercial and High-Rise Residential Buildings Published in 1993, contains a code language version of 90.1-1989. Technically equivalent to the mandatory minimum provisions in 90.1-1989. 95 MEC Model Energy Code 1995 Edition Maintained by the Council of American Building Officials. Changes reference from Standard 90.1-1989 to the Codified Version of 90.1-1989 first published in 1993. 98 IECC International Energy Conservation Code 1998 Maintained by the International Code Council. The reference to the codified version of 90.1-1989 was moved from Chapter 7 to Chapter 6. A new Chapter 7 “Design by Acceptable Practice for Commercial Buildings” was added as a simplified compliance approach consistent with 90.1, specific to buildings not over three stories in height with “reasonable” glass areas and “simple” mechanical systems. 10 CFR 434 “FEDCOM I” Energy Conservation Voluntary Performance Standards for New Commercial and Multi-Family High Rise Residential Buildings With the publication of 10 CFR 434, the Federal commercial requirements were removed from 10 CFR 435 (which is now only residential) and were updated to meet or exceed the codified version of Standard 90.1-1989. 90.1-1999 Energy Standard for Buildings Except Low-Rise Residential Buildings Published in 1999, this document provides a complete revision to the previous standard. It is written in mandatory, enforceable language suitable for code adoption. 00 IECC International Energy Conservation Code 2000 Maintained by the International Code Council. Chapter 7 of the 1998 IECC became Chapter 8 of the 2000 IECC with several changes as it was extended to cover virtually all commercial buildings. Some changes were made in the Lighting section to update some values to be equivalent to 90.1-1999. 01 IECC International Energy Conservation Code 2001 Supplement Maintained by the International Code Council
A-4

90.1-2001 Energy Standard for Buildings Except Low-Rise Residential Buildings Published in 2001, this document provides a revision to the previous standard to include approved addenda. 10 CFR 434 “FEDCOM II” Energy Code for New Federal Commercial and Multi-Family High-Rise Residential Buildings This is a planned update to FEDCOM I to update requirements to meet Standard 90.1-2001. NFPA 5000 NFPA, 5000 Building Code This is planned to be the National Fire Protection Association’s first complete building code and will contain ANSI/ASHRAE/IESNA Standard 90.1-2001 as its commercial energy provisions.
A-5

Appendix B
HVAC Installations in Arizona
Jim Colgan is Vice President for Sales and Engineering for Chas Roberts, one of the largest residential HVAC companies in the US. They complete almost 32,000 new residential installs per year, about 120 per working day. Their crews do about 75% of all new residential jobs in Phoenix and close to half in Tucson, the largest markets in Arizona. Colgan and many of Chas Roberts’ designers and field crews have attended training sessions offered by John Tooley of Advanced Energy—and the way they approach HVAC installations these days reflects the findings of recent building science.
In the following paragraphs, Colgan reports on key differences between field practices now and what the company’s technicians were doing a few years back:
• Careful attention is paid to overall duct design. Designers use modern software (Wright J™) to do a room-by-room load analysis to choose proper flows, duct sizes, and specify the appropriate air handler for the job.
• Duct sizes and air filters are both much larger to keep velocities and static pressures down. This results in a flow of about 400 cfm/ton across the air conditioning coil—the optimal rate for most residential coils—so units are more efficient at transferring energy to the conditioned space and fan motors have lighter loads.
• Air sealing of ducts is done carefully with attention to detail. The result is that installers routinely achieve less than 6% of nominal flow duct loss for ENERGY STAR houses and 3% of nominal flow for “engineered for life” super-efficient houses. (These flows are measured at 25 pascals with a duct blaster.)
• Flex duct rated at R-4 are used for most production homes, but R-6 ducts are used for engineering for life homes, about 10% of Chas Roberts’ production.
• Every house has pressure relief for critical rooms, with master bedrooms at the front of the list. In the case of engineered for life homes, pressures are balanced throughout the home so that no area is pressurized at over 3 pascals even with the doors closed. This enhances overall system efficiency of the HVAC system, improves comfort and safety, and extends the lifetime of the home itself. Chas Roberts uses any of three strategies to achieve balance: add an extra return in such critical spaces as master bedrooms; add transfer grills above the door of critical spaces; or add “jump ducts” between a critical space and an adjacent hallway where there is unimpeded flow to the return duct, regardless of patterns of door openings. Jump ducts are short lengths of 12 to 20 inch diameter flex that “jump” into the attic then back down again. Grills used with jump ducts range from 14 x 14 inches to 20 x 30 inches, “whatever it takes” to ensure pressure differences are safe (less than 3 pascals in the case of EFL houses). Of course the particularly tight engineered for life dwellings require larger cross section grills and ducts to achieve pressure balance. Jump ducts are more effective at ensuring privacy than are transfer grills, which transfer sound efficiently as well as air.
B-1
B-2
• Care is taken to ensure that compressors have the correct refrigerant charge. (Studies in many cooling-dominated climates show that well over half do not.)
• The home is equipped with a high-quality digital thermostat.
Why does Chas Roberts undertake these measures since there are no energy codes? “In addition to market forces, it’s the right thing to do--it makes houses work better. We have fewer customer complaints and fewer warrantee calls,” says Colgan. “There’s nothing better than a happy homeowner.” (Colgan 2002). It seems clear that energy-efficient HVAC systems are positively correlated to both happy homeowners and Chas Roberts’ business growth.