incremental product development - imp group · incremental product development four essays on...
TRANSCRIPT

Incremental Product Development Four essays on activities, resources, and actors
Nina Veflen Olsen
A dissertation submitted to BI Norwegian School of Management for the Degree of Dr.Oecon
Series of Dissertations 1/2006
BI Norwegian School of Management Department of Marketing

Nina Veflen Olsen: Incremental Product Development. Four essays on activities, resources, and actors © Nina Veflen Olsen 2006 Series of Dissertations 1/2006 ISBN: 82 7042 748 9 ISSN: 1502-2099 BI Norwegian School of Management N-0442 Oslo Phone: +47 4641 0000 www.bi.no Printing: Nordberg The dissertation may be ordered from our website www.bi.no (Research - Research Publications)

III
Abstract Most innovations are incremental, and incremental innovations play an important role for the firm. In spite of that, traditional NPD studies most often emphasize moderate to highly innovative product development projects. In this dissertation the overall objective is to increase our understanding of incremental innovation. The dissertation is organized around four essays that emphasize different aspects of incremental innovation. NPD in hotels, retailers and food manufacturers (e.g. dairy and fish) have been investigated. The different essays vary in accordance to both methodology and theoretical platform, and illustrate how my own understanding has evolved throughout the research process. Open- and closed-ended questions, emerging and predetermined approaches, and quantitative and qualitative data and analyses were utilized. The theoretical frame of reference is first and foremost traditional NPD research (here labeled the Cooper school). In addition to this school, literature from the IMP approach has been utilized. Other theories, such as transaction cost analysis (TCA) and the resource-based view of the firm (RBV), have been drawn upon in particular cases. One theoretical contribution of the dissertation lies in its attempt to illustrate how the different actors’ access to resources influences incremental innovation. In essay two and three we highlight that actors with access to different resources conduct different NPD activities, thus access to resources influences how actors organize the NPD process. Another contribution of the dissertation is the attention drawn to an actor’s utilization of resources in incremental innovation. We emphasized the manager’s role in incremental innovation by exploring resource friction. The numbers of resource combinations possible are infinite, and the opportunities offered are only limited by the manager’s thoughts. Accordingly, a manager’s lack of imagination is a strong restrictor of innovation. Finally, one contribution of the dissertation lies in its identification of the interplay between activities, resources and actors in incremental innovation. Resources in NPD can be created, not only allocated and utilized. The conventional perspective of resources as scarce and limited is broadened to include the possibilities associated with new resource combinations. Incremental innovation is a dynamic process where access to resources, utilization of resources, and creation of new resources influence what activities are conducted, and visa versa.

IV

V
Acknowledgements Mountain climbing has always fascinated me. I am fascinated by the combination of hard work, risk and last, but not least, the feeling I imagine mountain climber’s get when they reach the top. I have never climbed any mountains. My kind of mountain climbing has been more metaphorical, like for instance to write this dissertation. It has been both hard work and a scary experience. The fear of not reaching the top has hit me more than once. This fear of not succeeding is probably why it feels so good to reach the goal. Standing on the top and looking down the path I have walked another symbolic picture strikes me. Not only is this dissertation about incremental innovation, the process of writing it has also been like an incremental innovation in itself, where activities, resources and actors have interacted to form the outcome. Activities, that I perceived to be important for the outcome, have been more or less successfully conducted. In retrospect I can see that a better predevelopment phase would have reduced the “Time-to-market”. However, as always in new product development, it is hard to know in advance what you want to develop. The dissertation has been formed along the way, where ideas for articles have been presented at conferences, in course papers and in seminars. To write this dissertation has not been like a one-man-band, but rather more like a jazz-band consisting of people with different resources and capabilities. Without these helpful and inspiring band members, this dissertation had never been finished. First and foremost my main supervisor Professor Geir Gripsrud deserves my gratitude and thanks. I am so grateful that you took me under your wings and helped me through this process. You are an intelligent, insightful and nice person that is easy to cooperate with. In addition to Geir and I, the jazz-band had three other members, Professor Håkan Håkansson, Professor Sigurd V. Troye and Associate Professor Inge-Jan Henjesand. Håkan is probably one of the most inspiring people I have ever met. He has the rare ability to motivate people, and in addition to Geir he is the one that has influenced my work the most. Sigurd and Inge-Jan also deserve my gratitude. They were the people who got me started. Thank you Inge-Jan, for believing in me, and thank you Sigurd, for your creative ideas and helpful comments on my writing. In addition to this jazz-band, I would like to thank a lot of my fellow PhD. students. Before James Sallis moved to Sweden and became an Assistant

VI
Professor at the University of Uppsala, he and I commuted together and came to know each other very well. We still keep in contact and I do believe we have a future as co-writers in front of us. Thank you James, for writing together with me on the first essay in this dissertation. I would also like to thank my roommate during the last two years, Ingunn Elvekrok. Ingunn, I am very found of you. Thank you for listening to all my frustrating thoughts. My colleagues in the NewMark project, Sophie Cantillon, Ann Karin Refsland Fougner, Atle Følesfold and Svanhild Haugnes have also earned my appreciation. The spirit within this project has been warm, including and helpful. I hope to be as much help in your dissertation writing as you have been in mine. Thank you all. The members of the NetLog project, especially Associate Professor Debbie Harrison, as well as fellow PhD students at the department of Marketing: Ragnhild Silkoset, Håvard Hansen, Line Lervik Olsen, Bengt Lorentzen, Bendik Samuelsen, Pål Silseth, Arne Morten Ulvnes, Siv Marina Karlsen and Liv Karin Slåttebrekk deserve my gratitude. Thank you for all the inspiring discussions and social happenings we shared. Associate Professor Carl Arthur Solberg, which was head of the Department of Marketing throughout most of my PhD period, present head of the department Professor Fred Selnes, Associate Professor Harald Biong and Executive Officer Ingvild Kobberstad, also deserve my gratitude. Thank you for always helping me out. The life as a Doctoral fellow at BI would not have been the same without you. My new colleagues at Matforsk inspired me to finish off my dissertation. For that, I am ever grateful. Kari Clausen, the head of the department, deserves a special thanks. Thank you Kari for allowing me to use spare time on my dissertation. Without your understanding the dissertation would not have been finished. The process of writing a dissertation is tough. The more or less constructive comments you get all the time, tear you apart and make you feel like a fool. For me it has been important to think of it as “only a dissertation”. Other things in life are much more important than to finish off a dissertation. My husband Geir and my daughters Maja and Oda have helped me to remember what is important in life. Geir, thank you for listening to me and for giving me time to write. Your love and support has been of tremendous help. Thank you Maja and Oda for taking me away from the writing and filling my life with laughter and joy. I love you. Without your support there would not have been any dissertation. Nina Veflen Olsen Ås, September 2005
VII
Table of Contents 1. Introduction.................................................................................................. 13
1.1 NPD Outcome ..........................................................................................15 1.2 NPD Theories ...........................................................................................16 1.3 NPD Methodology ...................................................................................17 1.4 Purpose of the dissertation........................................................................20 1.5 Structure of the dissertation......................................................................23 1.6 References ...............................................................................................25
2. Theoretical Frame of Reference ................................................................. 29
2.1 The Cooper School ...................................................................................29 2.1.1 NPD Activities.......................................................................................30
2.1.1.1 Predevelopment activities ..............................................................31 2.1.1.2 Development Activities..................................................................32 2.1.1.3 Post development activities............................................................33
2.1.2 NPD Actors ...........................................................................................34 2.1.3 NPD Resources......................................................................................35 2.2 The IMP Approach ...................................................................................35 2.3 Summary of the literature and presentation of the essays ........................39
2.3.1 Essay one...........................................................................................40 2.3.2 Essay two ..........................................................................................41 2.3.3 Essay three ........................................................................................41 2.3.4 Essay four..........................................................................................42
2.4 References ................................................................................................43 3.0 Market Scanning for New Service Development .................................... 47
3.0 Abstract ....................................................................................................47 3.1 Introduction ..............................................................................................48 3.2 Literature Review .....................................................................................49 3.3 Theoretical Model ....................................................................................52 3.4 Methodology ............................................................................................56
3.4.1 Sample and Data Collection..............................................................56 3.4.2 Measure development .......................................................................57
3.5 Results ......................................................................................................59 3.6 Implications ..............................................................................................63

VIII
4. Outsourcing New Product Development: Exploring the Effects on the NPD Process ..................................................................................................... 75
4.0 Abstract ....................................................................................................75 4.1 Introduction ..............................................................................................76 4.2 New Product Development (NPD) and Outsourcing ...............................77 4.3 The case....................................................................................................80 4.4 Discussion ................................................................................................87 4.5 References ................................................................................................90
5. Development of Distributor Brands vs. Development of Manufacturer Brands............................................................................................................... 95
5.0 Abstract ....................................................................................................95 5.1 Introduction ..............................................................................................96 5.2 Theoretical Background ...........................................................................98
5.2.1 Actors ................................................................................................98 5.2.2 Activities .........................................................................................100
5.3 Outcome .................................................................................................102 5.4 Study 1....................................................................................................103
5.4.1 Goals ...............................................................................................103 5.4.2 Activities .........................................................................................105 5.4.3 Conclusion Study 1 .........................................................................109
5.5 Study 2....................................................................................................110 5.5.1 Outcome ..........................................................................................112 5.5.2 Conclusion Study 2 .........................................................................117
5.6 Concluding remarks................................................................................117 5.7 Limitations and Directions for Further Research ...................................119 5.8 References ..............................................................................................120

IX
6. Incremental innovation: a way to handle friction?................................. 123 6.0 Abstract ..................................................................................................123 6.1 Incremental innovation and change........................................................124 6.2 Resource friction and change .................................................................125 6.3 Management and Change .......................................................................126 6.4 Methodology ..........................................................................................128
6.4.1 WestFish (WF)................................................................................129 6.4.2 REMA .............................................................................................130
6.5 The Case .................................................................................................130 6.5.1 The product –facility interface ........................................................131 6.5.2 The product-business unit interface ................................................131 6.5.3 The product-business relationship interface....................................132
6.6 Discussion ..............................................................................................133 6.7 Concluding Remarks ..............................................................................135 6.7 References ..............................................................................................136
7. Discussion and concluding Remarks........................................................ 141
7.1 Results ....................................................................................................141 7.2 Resources and incremental NPD ............................................................143
7.2.1 What is a resource? .........................................................................144 7.2.2 The role of resources in incremental innovation.............................148
7.3 Implications ............................................................................................150 7.3.1 Theoretical implications..................................................................150 7.3.2 Methodological implications...........................................................152 7.3.3 Practical implications ......................................................................153
7.4 Limitations and Future Research............................................................154 7.5 References ..............................................................................................155
Appendix......................................................................................................... 157

X
List of Tables
Table 1.1: Summary of the four essays...............................................................23 Table 2.1: IMP publications on technical development......................................37 Table 3.1: Measures............................................................................................58 Table 3.2: Summary Statistics ............................................................................60 Table 3.3: Exploratory Factor Analysis ..............................................................60 Table 3.4: Measurement Model Fit Statistics .....................................................61 Table 3.5: Individual Parameters in the Measurement Model ............................61 Table 3.6: Chi-square Difference Test................................................................62 Table 3.7: Correlation Matrix and Cronbach´s Alpha ........................................62 Table 3.8: Results: Structural Model ..................................................................63 Table 4.1: Product specifications in the predevelopment phase. ........................84 Table 5.1: Brand definitions ...............................................................................99 Table 5.2: New products launched January 2000 to January 2003...................110 Table 5.3: Average retail price (unit price in NOK per kilo)............................113 Table 5.4: Mean growth in market share (salesvolume in kilo or liter)............114 Table 5.5: Mean growth in market share for distributor brands and
manufacturer brands under high and low brand concentration ................115 Table 5.6: Number of failures...........................................................................116 Table 5.7: Summary manufacturer brands and distributor brands....................118 Table 7.1: Tangible and intangible resources ...................................................144 Table 7.2: Illustration of existing theories view on actors and resources .........150

XI
List of Figures Figure 1.1: Outline of the dissertation ................................................................24 Figure 2.1: The NPD process..............................................................................31 Figure 2.2: The Network Model .........................................................................36 Figure 2.3: The Resource Entity Model..............................................................39 Figure 3.1: Conceptual Framework ....................................................................56 Figure 4.1: Illustration of the Case Studied ........................................................82 Figure 4.2: Picture of the TINE Cheesecake and the fluid margarine from
Fjordland ....................................................................................................83 Figure 5.1: Distributor vs. Manufacturer Brand Strategies...............................106 Figure 7.1: Illustration of the Resource-Capability Process .............................146 Figure 7.2: A dynamic framework of incremental innovation activities,
resources, and actors ................................................................................149


13
1. Introduction
Now more than ever, innovation is the answer (Business Week, March 2004). A successful new product does more good for an organization than anything else that can happen…a high percentage of sales and profit comes from new products (Crawford. 1997:3,4). Get Innovative or Get Dead (Peters 1990:9).
The statements above illustrate how innovation and new product development is acknowledged in popular books, well known academic journals and in the business press. Product development is perceived to be an important activity leading to increased sales, economic growth, profitability and prosperity. Innovation is even considered as an antecedent to the industrial revolution and capitalism. Technical development and process development made it possible to produce products more efficiently. Development of the railroad and steam driven machines led to savings in transportation and production, which greatly stimulated the growth in, for example, the coal industry and the cotton textile industry in Britain (McCraw 2000:60). Innovation is a broad concept, spanning from invention of disruptive technology to incremental product and process development. Not only do innovations vary according to level of newness, they also vary according to content. An innovation can be an idea, a practice, or a new object that is perceived as new by an individual (Rogers, 2003). A central theme in the literature on innovation is that of continuous versus discontinuous change. While invention of disruptive technology leads to discontinuous change, continuous change arises from an accumulation of incremental innovations. Even though incremental innovations are not as novel as radical innovations they play an important role for the firm. Of all new products developed, incremental changes are much more frequent than radical innovations. The well-known Professor at Harvard Business School, Theodore Levitt, stated that, “imitation is not only more abundant than innovation, but actually a much more prevalent road to business growth and profits” (Levitt, 1966:33).

14
The returns expected from incremental innovations are not as high as from radical innovations, but since the risk associated with their development and commercialization is lower than from radical innovations, incremental innovations are important for the firms overall profitability (Kleinschmidt and Cooper, 1991). Risk is an essential aspect of product development. Firms invest time and money without knowing how successful the new product will be. Generally speaking, approximately 35 to 45% of all new products still fail, and the failure rate has not changed greatly during the last 25 years (Boulding, Morgan, and Staeling, 1997). These numbers will of course vary depending on industry, type of product and business strategy. While the creation of radical innovations involves an enormous commitment of manpower and money, with no assurance of reasonable payout, the character and costs of commitment are quite different for incremental innovations. In some industries it is relatively easy to develop incremental innovations; there are few setup problems and the capital requirement is small. But when setup problems are great, and when capital requirements are big, then several years’ time and greatly increased risk may be involved (Levitt, 1966). Due to the fact that product development is a complex and multifaceted phenomenon that can create small incremental changes in an existing product or lead to discontinuous innovations, it is questionable whether NPD theory can be generalized to all kind of new product development projects. One criticism of innovation research concerns the assumption that a universal theory can be developed that applies to all types of innovation (Dewar and Dutton, 1986). Since development of moderate to high innovative new products has been studied1 more than development of low innovative new products (Cooper, 1994), incremental new product development is to be emphasized in this thesis. Lack of market turbulence and technology turbulence seems to distinguish actors that mostly develop incremental innovation from more highly innovative actors. It looks like the stability in the environment reduces the actor’s willingness to take on the risk associated with radical product development. Consequently, exploitation strategies, which include refinement and efficiency, are applied more frequently than experimental and risky exploration strategies (March, 1991). Two industries, the hotel
1 A search in the Business Source Premier database revealed more than 10 000 hits on the word “innovation”, while “imitation” gave 271 hits. 49 articles had “radical innovation” in the title, while 9 had “incremental innovation” in the title, and 6 out of the 9 articles contained a comparison of radical and incremental innovations.

15
industry and the grocery industry in Norway, both characterized by their stable environment are to be investigated. 1.1 NPD Outcome The variety in NPD processes and outcome makes it inadequate to compare the success of all kinds of innovations. The goal for the development process must be considered, and success should be measured according to what firms want to achieve. Radical innovators have other ambitions than incremental innovators. As a consequence, the outcome from incremental innovations should not be judged against the outcome from radical innovations. The overriding goal for many firms is to enhance profitability. Generally speaking, an increase in the income and/or decrease in the costs can improve firm profitability. Different strategies can be applied to accomplish this goal. To develop differentiated products, which the customer is willing to pay a higher price for, is one way to go. Another feasible way is to improve the process. If the product can be produced more efficiently and sold at a lower price, the sales volume might increase and thereby enhance the profitability. While radical innovations offer opportunities for product advantage and differentiation, incremental innovators most often utilize a cost efficiency strategy. As an example, when retailers develop their own brands, which mainly are incremental innovations, they are driven by the opportunity to gain higher margins. By efficiently developing their own low priced distributor brands, they attain profit margins that otherwise would have been given to the manufacturer. Acknowledging the difficulty in tracing how day-to-day NPD actions and decisions are influencing financial results, firms establish intermediate goals. Efficiency, time-to-market, product newness, product advantage, customer satisfaction, market share and competitive advantage are just some of the goals applied to achieve the ultimate goal, increased profitability. While product newness and product advantage are good measures for radical innovations, the outcome from incremental innovations is better measured with constructs such as efficiency, time-to-market and market share. According to Davis (1993) success is survival in the long run, which is not necessarily the same as short term financial success, indicating that the firms’ time horizon must be considered. If an organization reduces all investments in product development their short-term financial result will be drastically improved. But what will happen in the long run? We need to keep in mind the necessary balance between short-term and long- term success
16
(March, 1991). Since companies live in both the present and the future, with the need to satisfy current customers and to anticipate the future of markets, the successful managers will, according to Connor (1999), be those who select wisely the balance between the present and the future. How innovative industries balance exploitation and exploration strategies, is a topic that deserves more attention. To examine the outcome of a single NPD project might be insightful, but sometimes a broader view needs to be considered. Cannibalism and complementary products are two of the factors that complicate the picture. Success of a new product might affect the outcome of old established products, indicating that NPD outcome sometimes is better investigated at the product portfolio level. 1.2 NPD Theories The complexity in NPD has triggered a lot of research within the field, and multiple models and theories have been developed. One of the most common streams of research within NPD treats product development as a rational plan (Brown and Eisenhardt, 1995:348). Simply put, they perceive a NPD project that is well planned, implemented, and appropriately supported to be a success. Cooper, who is one of the most cited researchers within NPD, belongs to this school of thought (Cooper, 1993, 1998). The Stage-GateTM
model developed by Cooper can be described as a recipe for how to develop new products more successfully (Cooper, 1994). The focus within the "Cooper school2" is on discovering which of many independent factors are correlated with the success of a NPD project, and success is normally measured in retrospect (ex. post). Researchers within this field aim to reduce the NPD failure rate, and thereby to increase NPD performance. Predictability is the main goal of the research and activities are the focal points, while resources are perceived as given. The implicit view of resources, probably inherited from classical economists3, defines resources
2 "The Cooper school" is not an established name for a school of though within NPD. But since Coopers work is conducted within the traditional NPD approach where NPD is perceived as a rational plan, this tradition is here labeled "The Cooper school". 3 In neoclassical perfect competition theory ”firms are identical because perfect information together with a specifiable production function assures that each firm has equal access to production technology; perfect information plus resource mobility and divisibility assures that each firm is able to obtain exactly the right inputs (Conner, 1991:123)”.

17
as something the firm has or can gain. The role of resources in NPD is not very often emphasized. Managers’ action is highlighted, but not resources. Contrary to the Cooper approach, the resource-based view of the firm (RBV) is a theoretical approach that emphasizes resources. Much of the work within this field draws inspiration from Penrose (1959). She conceptualizes the firm as a collection of productive resources, emphasizing the services that the resources render. Based on the assumptions that resources are heterogeneously distributed across firms, and that resource differences persist over time, researchers have theorized that firms with valuable, rare, inimitable, and nonsubstitutable resources can achieve sustainable competitive advantages (Barney, 1991). RBV is an influential theoretical framework for understanding resources. While the Cooper approach emphasizes predictability, the RBV focuses on increased understanding. Another research stream, which is influenced by Penrose (1959) is the research conducted by the IMP-group4. This group, who’s focal interests are interactions, relationships, and networks within the industrial market, has frequently investigated technical development. Contrary to the Cooper School, the IMP group does not emphasize general success factors. Every company and its context are perceived as unique. Accordingly, no single best way to develop products exists (Gressetvold, 2004, von Corswant, 2003). One of the main contributions of the IMP research is the development of the ARA framework, which provides insight into the interdependencies between activities, actors and resources (Håkansson, 1987:17). According to this framework, actors perform activities and control resources- either alone or jointly, and activities are linked to resources. 1.3 NPD Methodology NPD researchers, especially within the Cooper school, have often applied a postpositivistic approach to knowledge. Postpositivism refers to the thinking after positivism5, challenging the traditional notion of the absolute truth of
4 IMP is an abbreviation for the Industrial Marketing and Purchasing Project Group. The original IMP group started September 1976 as collaboration between researchers in France, Italy, Sweden, West Germany, and Great Britain. The intention of the project group was to challenge existing theory on the functioning of business markets. An alternative theoretical framework drawing on both economic and behavioral paradigms have been presented by the IMP-group. 5 Logical Positivism is the ferocious version of empiricism that emerged from the Vienna Circle in the 1930s. The driving idea was that, because claims to knowledge
18
knowledge. Postpositivism reflects a deterministic philosophy in which causes determine effects or outcomes. It is also reductionistic in that the intent is to reduce the ideas into a small, discrete set of ideas to test, such as the variables that constitute hypotheses and research questions. The knowledge that develops through a postpositivstist lens is based on careful observation and measurement of the objective reality that exists “out there” in the world. Laws or theories govern the world, and these need to be tested and refined so that we can understand the world. From a postpositivist point of view the goal is generalizability, and for a phenomenon to be generalizable it must follow a general law. An important aspect of postpositivism is the focus on predictability. According to Hunt (2002), all adequate explanations have predictive capacity, and explanation is necessary for understanding. Postpositivist researchers are skeptical to knowledge claims without the ability to predict6. They state that models and theories that do not explain and predict do not contribute to scientific understanding (Hunt, 2002). This notion that there is a perfect, logical symmetry between the nature of explanation and the nature of prediction has been attacked from a number of standpoints (Blaikie, 1993). That explanation and prediction follow the same logical structure7 indicates that to explain is to show in retrospect that an action was expected, due to a general law (Nyeng, 2004). This point of view has been criticized and perceived as problematic when studying human beings. It implies that society follows a trajectory without radical changes, and that humans do not change as a consequence of new insights. One of the critiques comes from Social Constructivism, which is an interpretive approach to human and society. They argue that prediction need not imply explanation, and denies the existence of general laws outside
of the world can be justified only by experience, we are never entitled to assert the existence of anything beyond all possible experience. It can never be probable, let alone certain, that there are, for instance, unobservable structures, forces, instincts or dialectical processes. Knowledge is grounded in particular observations and can extend to general beliefs only in so far as experience can confirm them (verification) (Hollis, 1994) 6 According to Hunt 2002, all adequate explanations of phenomenona must be potentially predictive. However, all adequate predictions of phenomena are not necessarily adequate explanations because prediction can be made without the use of lawlike generalizations. And lawlike generalizations are necessary for the scientific explanation of phenomena (Hunt, 2002: 142) 7 The symmetry thesis constitutes the heart of the hypothetico-deductive or covering-law model of scientific explanation. The point of the model is that it employs no other rules of logical inference than that of deduction (Blaike, 1993)

19
natural science (Nyeng, 2004). Prediction only requires a correlation, whereas explanation cries out for something more. The goal of the research is to rely as much as possible on the participant’s views of the situation being studied. This kind of research, which often addresses the processes of interaction among individuals, does also exist within NPD. When IMP researchers investigate product development they recognize that their own background shapes their interpretation, and they position themselves in the research to acknowledge how their interpretation flows from their own personal experience (Gressetvold, 2004; Von Corswant, 2003). The researcher’s intent is to make sense of the meaning others have about the world. Rather than starting with a theory, inquirers generate or inductively develop a theory or pattern of meaning (Creswell, 2003). Researchers within this tradition are often skeptical to postpositivstic knowledge claims and visa versa. These two very different views of reality make it sometimes difficult for researchers to understand and accept research conducted within different research traditions. Researchers are making epistemological8 choices even if implicit and by default, which provide the framework for methodological issues. To make these implicit values and beliefs explicit might be fruitful both for the researcher and for the audience who investigates her work. Below, the epistemological standpoint behind this dissertation will be described. Postpositivism and social constructivism are often perceived as the two main choices within research epistemology. I am not entirely a postpositivist, nor a social constructivist. The philosophy that fits best with my values and beliefs with regard to research is pragmatism. Pragmatism9 derives from the
8 Epistemology (from Greece, episteme=knowledge and logos= learning) is the learning about knowledge and knowledge creation. 9 According to Creswell (2003), who refer to Murphy (1990), pragmatism provides a basis for the following knowledge claims: • Pragmatism is not committed to any one system of philosophy and reality. This
applies to mixed methods research in that inquirers draw liberally from both quantitative and qualitative assumptions when they engage in their research.
• Individual researchers have a freedom of choice. They are “free” to choose the methods, techniques, and precedures of research that best meet their needs and purposes.
• Pragmatists do not see the world as an absolute unity. In a similar way, mixed methods researchers look to many approaches to collecting and analyzing data rather than subscribing to one way (e.g. quantitative or qualitative)
• Truth is what works at the time; it is not based in a strict dualism between the mind and a reality completely independent of mind. Thus, in mixed methods

20
work of Peirce, James, Mead, and Dewey (Cherryholmes, 1992). Essentially it means that the individual researcher has freedom to choose the research approach that best fits what she wants to investigate. The abductive reasoning and logic Peirce used to contrast the polar opposites of inductive and deductive logic has influenced my way of thinking. Abductive reasoning implies that we start from the particular. We identify a particular phenomenon – in this case incremental product development. We then try to account for that phenomenon by relating it to broader concepts. We seek to go beyond the data itself and to locate it in explanatory or interpretive frameworks (Coffey and Atkinson, 1996). 1.4 Purpose of the dissertation Most innovations are incremental, and incremental innovations play an important role for the firm. In spite of this, traditional NPD studies most often emphasize moderate to highly innovative product development projects. In this dissertation incremental innovations are highlighted. The dissertation is organized around four essays, each emphasizing different aspects of incremental innovation. The different essays vary in both methodology and theoretical platform, and illustrate how my own understanding has evolved throughout the research process. Both open- and closed-ended questions, emerging and predetermined approaches, and quantitative and qualitative data and analysis were utilized.
research, investigators use both quantitative and qualitative data because they work to provide the best understanding of a research problem.
• Pragmatist researchers look to the “what” and “how” to research based on its intended consequences- where they want to go with it. Mixed methods researchers need to establish a purpose for their “mixing”, a rational for the reasons why quantitative and qualitative data need to be mixed in the first place.
• Pragmatists agree that research always occurs in social, historical, political, and other contexts. In this way, mixed methods studies may include a postmodern turn, a theoretical lens that is reflexive of social justice and political aims
• Pragmatists believe that we need to stop asking questions about reality and the laws of nature (Cresswell, 2003:12)
The overall objective of this dissertation is to increase our understanding of incremental innovation.

21
I started out, without knowing it, as a postpositivist. During my master degree I was trained in quantitative methods that implied a postpositivistic philosophy. Hypotheses were tested statistically, and the goal was predictability. The literature review in my master thesis10 consisted mostly of articles from the Cooper School. The point of departure for this dissertation is, accordingly, within the Cooper School. In essay one we test hypotheses and try to obtain predictability. The procedure to ensure falsification is followed (Calder, Phillips, and Tybout, 1981). This entails that the process of selecting research design, selecting respondents, operationalizing variables, and choosing research setting is followed. The focus in the study is on theoretical propositions involving causal relationships between constructs. The Cooper School is the theoretical platform applied, and the essays focus is on the relationship between NPD activities and NPD outcome. As a doctoral fellow I was introduced to the IMP tradition. Their way of doing research was very different from what I was used to. Consequently, I started out being very skeptical to their single case studies. However, working close with IMP researchers has taught me to appreciate different ways of doing research. Statistical generalizability, although fine, is not the only way of gaining insight. Theoretical generalizability may also contribute to a new understanding. We always need to go beyond the empirical data to be able to theorize about a phenomenon. Consequently, the researcher’s interpretation of data is important for theorizing. The point of departure theoretically for essays two and three is still within the Cooper School, but the methodology and overall goal has changed. Contrary to essay one, increased understanding is the goal for these essays. Rather than testing theories, the goal is to derive new theories. In stead of a cross-sectional survey, case studies are conducted. While the three first essays start out from the Cooper school, the last essay utilizes the IMP approach, both theoretically and methodologically. Essay four is based upon an interpretive study of a single case, and the method applied is very different from the postpositivistic approach in essay one.
10 The title of my master thesis was “NPD from a learning perspective”, and the aim was to predict how different NPD activities affected NPD outcome.

22
The research process in essay two, three and four can be described as what Dubois and Gadde (2002) label “systematic combining”. They argue that the, “main characteristic of this approach is a continuous movement between an empirical world and a model world. During this process, the research issues and the analytical framework are successively reoriented when they are confronted with the empirical world (p.554). The starting point varies in the different case studies11. In essay two the starting point is in the theory, while essay three and four start out from the empirical world. Then, the study iterates between theory and empiri. Empirical observations inspire changes of the view of theory and visa versa. In triangulation studies researchers often start out qualitatively. They generate new ideas, which are tested by quantitative methods, before a new qualitative study is conducted. The different studies in this dissertation are not based upon each other as in triangulation. Each study is independent. The focus on incremental innovation, in one way or another, is the only common aspect of the four essays. All the studies highlight different aspects of incremental innovation and hopefully contribute to new understanding of incremental innovation.
11 The term case is used in so many different ways that researchers sometimes struggle with the question “what is a case?” and consequently “what is a case study?”. In this dissertation we lean on Eisenhardt (1989) who states that: “Case studies typically combine data collection methods as archives, interviews, questionnaires, and observations.” Our case studies are based on three main sources: in depth interviews, official company information and confidenical NPD reports.

23
Table 1.1: Summary of the four essays Essay 1 Essay 2 Essay 3 Essay 4 Main theory The Cooper
School The Cooper School
The Cooper School
IMP
Method Cross-sectional
Case-study
Case-study Comparativestatistical analyzes of sales data
Case-study
Data Quantitative Qualitative Qualitative and quantitative
Qualitative
Questions Closed Open
Open Open
Goal Predict Understand Understand
Understand
Theoretical objective
Theory testing Theory development
Theory development
Theory development
1.5 Structure of the dissertation Figure 1.1 illustrates the structure of the dissertation, which consists of seven chapters. This first chapter introduces the main topic, incremental innovation, and the reason why incremental innovation is worth studying. A short summary of NPD theory and NPD methodology is given, before the aim of the dissertation and the research approach is offered. In chapter 2, a theoretical frame of reference is presented. The Cooper school, which is the theoretical point of departure for three of four essays, and the IMP approach are both described. The chapter ends with a summary of the four essays, including the research questions stated. The different essays are presented in chapters 3, 4, 5 and 6, while chapter 7 sums up the results from the different studies and presents a discussion of the

24
role of resources in incremental innovation. Finally, implications and limitations of the studies are brought forward.
Figure 1.1: Outline of the dissertation
Chapter 1 - Introduction • Why incremental innovation? • How NPD has been studied? • Purpose of the dissertation • Research approach
Chapter 2- Theoretical Frame of Reference • A review of the Cooper school and the IMP
approach. • Summary of the essays
Chapter 7 – Discussion and concluding remarks • Summary • Discussion of resources role in incremental innovation • Implications and limitations
Chapter 3 Essay 1
Chapter 4 Essay 2
Chapter 5 Essay 3
Chapter 6 Essay 4

25
1.6 References Barney, J. (1991). "Firm Resources and Sustained Competitive Advantage."
Journal of Management 17(1): 99-120. Blaikie, N (1993): ”Approaches to Social Enquiry”, Polity Press, Cambridge. Boulding, W., R. Morgan, et al. (1997). "Pulling the Plug to Stop the New
Product Drain." Journal of Marketing Research 34: 164-176. Brown, S. L. and K. M. Eisenhardt (1995). "Product Development: Past
Research, present findings, and future directions." Academy of Management Review 20(2): 343-378.
Business Week, March (2004) Calder B.J., L. W. Phillips, and A. W.Tybout (1981). ”Designing Research
for Application,” Journal of Consumer Research, 8 (September), 197-207.
Cherryholmes, C.H. (1992). ”Notes on pragmatism and scientific realism”.
Educational Researcher, 14, 13-17. Coffey, A., Atkinson, P. (1996). “Making Sense of Qualitative Data.
Complementary research strategies”. SAGE Publications, California.
Conner, K. R. (1991). "A Historical Comparison of Resource -Based Theory
and Five Schools of Thought Within Industrial Organization Economics: Do We Have a New Theory of the Firm?" Journal of Management 17(1): 121-154.
Connor, T. (1999). Customer-Led and Market-Oriented: A Matter of
Balance. Strategic Management Journal 20, (12): 1157-1163 December.
Cooper, R. G. (1993). Winning at New Products, Addison-Wesley, Reading. Cooper, R. G. (1994). "New Products: The Factors that Drive Success."
International Marketing Review 11(60-76). Cooper, R. G. (1998). "Benchmarking new product performance: Results of
the best practices study." European Management Journal 16: 1-17.
26
Crawford, C. M. (1997). New Product Management. Boston MA, Irwin/McGraw-Hill.
Creswell, J.W. (2003). Research Design. Qualitative, quantitative and mixed
methods approaches. SAGE Publication, California. Davis, D. C. (1993). Marketing in High-Technology Industries: The
Biotechnology Example. Michigan, UMI Dissertation Services. Dewar, R. D. and J. E. Dutton (1986). "The Adoption of Radical and
Incremental Innovations: An Empirical Analysis." Management Science 32(11): 1422-1433.
Dubois, A. and L-E. Gadde (2002): ”Systematic combining: an abductive
approach to case research”. Journal of Business Research, 55, pp. 553-560.
Eisenhardt, K. (1989). “Building Theories from Case Study Research”.
Academy of Management Review, Vol. 14, No. 4. Pp.532-550. Gressetvold, E. (2004). “Product Development. Effects on a Company's
Network of Relationships.” Department of Industrial Economics and Technology Management. Trondheim, NTNU: 254.
Gressetvold, E. (2004). Product Development. Effects on a Company's
Network of Relationships. Department of Industrial Economics and Technology Management. Trondheim, NTNU: 254.
Hollis, M (1994): ”The Philosophy of Social Science. An introduction”.
Cambridge University Press. Hunt, S.D. (2002): “Foundations of Marketing Theory: Towards a General
Theory of Marketing”, Armonk, NY Håkansson, H. (1982). International Marketing and Purchasing of Industrial
Goods. London, John Wiley. Kleinschmidt, E. J. and R. G. Cooper (1991). "The Impact of Product
Innovativeness on Performance." Journal of Product Innovation Management 8: 240-251.
Levitt, T. (1966). "Innovative Imitation." Harvard Business Review
September-October.

27
March, J. G. (1991). "Exploration and Exploitation in Organizational Learning." Organizational Science 2(1): 71-87.
McCraw, Thomas K. (2000). Creating Modern Capitalism. How
Entrepreneurs, Companies, and Countries Triumphed in Three Industrial Revolutions, Cambridge, Massachusetts, and London, England, Harvard University Press
Murphy, J.P. and R. Rorty (1990). Pragmatism: From Peirce to Davidson.
Boulder, CO: Westview Press. Nyeng, F. (2004): ”Vitenskapsteori for økonomer”. Abstrakt forlag, Oslo Penrose, E. T. (1959). The Theory of the Growth of the Firm. Oxford, UK,
Basil Blackwell. Peters, T. (1990). "Get Innovative or Get Dead." California Management
Review Fall: 9-26. Rogers, Everett M. (2003). Diffusion of Innovation, Fifth edition, New York,
Free Press. Von Corswant, F. (2003). Organizing Interactive Product Development.
Department of Operations Management and Work Organization School of Technology Management and Economics. Göteborg, Sweden, Chalmers

28

29
2. Theoretical Frame of Reference The theoretical frame of reference for this dissertation is first and foremost the Cooper school. In addition to this school, literature from the IMP approach has been utilized. Other theories such as transaction cost analysis (TCA) and the resource based view of the firm (RBV) have been used, as has the literature on market orientation and retailing. Below, a literature review of the Cooper school and the IMP approach is presented. At the end of the chapter, short summaries of the four essays are offered. 2.1 The Cooper School In 1994 Montoya-Weiss and Calantone conducted a comprehensive review of 47 empirical studies within the product development field and found 18 antecedent factors to new product performance. 7 years later Henard and Szymanski (2001) published a meta-analysis of 60 empirical studies from the current literature. They revealed 24 predictors of new product performance, and highlighted that ten of the antecedents can be considered relatively dominant drivers. These ten factors, which can all be traced back to Montoya-Weiss and Calantone (1994), can be categorized as product characteristics, firm strategy characteristics, firm process characteristics and marketplace characteristics12. Except for market potential, all the dominant drivers of NPD success include managerial activities. Dedicating resources, which is the only resource aspect mentioned, refers to a firm's planned
12Product characteristics capture elements pertaining to the offering, such as price, innovativeness, and manager's perception of how well the offering meets customer’s needs. Strategy characteristics refer to a firm's planned actions that have the potential for providing it a competitive advantage in the marketplace separate from any factors associated with the new product development process. These strategic elements include dedicating resources to the new product development initiative and timing market entry. Process characteristics refer specifically to elements associated with the new product development process and its execution. They encompass firm proficiency in the development, marketing and launch of new offerings. Finally, marketplace characteristics capture elements that describe the target market and include market potential, competitive activities, and the intensity of the activity (i.e., turbulence) in response to new product introductions

30
actions, and the actor most often considered is a moderate to high innovative manufacturer. Below, a brief literature review of the Cooper school is presented. Due to the strong focus on activities within this school, literature concerning NPD activities is a natural point of departure. 2.1.1 NPD Activities NPD is important, but difficult. Many new products fail. To reduce the probability of failure after launch, a great deal of research within NPD has focused on improving the initial go/no go decision. Models and frameworks consisting of managerially controllable factors associated with new product success have been presented (Cooper, 1993; Song and Parry, 1997). The four most important process activities in NPD are predevelopment activities (e.g. idea generation/screening, market research, and financial analyses), marketing activities, use of technology in new product initiative and launch activities. As can be seen, some of these activities overlap each other. The quotation below highlights how marketing activities take place both early and late in the process.
Successful businesses and teams, that drive winning new product projects, have a slave-like dedication to the voice of the customer. New product projects that feature high-quality marketing actions – preliminary and detailed market studies, customer tests, field trials, and test markets, as well as launch – are blessed with more than double the success rates and 70% higher market share than those projects with poor marketing action. (Cooper, 1999)
Using time as the categorization criterion, the process can split into three parts: 1. Predevelopment, 2. Development, and 3. Post development. The predevelopment phase includes the front end of innovation, or what is often called the Fuzzy Front End. Idea generation, elaboration, and evaluation belong here, as do business and market opportunity analyses. The next phase, called development, embraces technical development and product testing. This is where the physical product is designed and built. The last phase is where the new product launch is coordinated, implemented, and monitored. Planning of advertising programs and other marketing activities take place here. This is the commercialization or post development phase.

31
Figure 2.1: The NPD process 2.1.1.1 Predevelopment activities The predevelopment phase is considered to be important for new product development. It is at this early stage of the NPD process that the seeds for ultimate success or failure of the new product are sown. Song and Parry (1997) report positive and significant correlation between new product success and measures of proficiency in screening, preliminary market assessment, and marketing research. They found in a study of 788 Japanese and 612 American new product development projects that proficiency in the Business and Market Opportunity Analysis Stage led to better products. These findings, also reported by Souder and Jenssen (1999), Song and Montoya-Weiss (1998) and Song, Souder, and Dyer (1997), underscore the importance of careful analyses of customer segments and competitors to determine desired product features and benefits. As all students know, it is important to do your homework'. This is also the case when developing new products. Too many projects move, according to Cooper, from idea stage right into development, with little or no assessment or up-front homework. The results of this "ready, fire, aim" approach is usually disastrous. Research shows that inadequate up-front homework is a major reason for failure (Hopkins, 1980), whereas other studies show that solid up-front homework drives up new product success rates significantly and is correlated strongly with financial performance (Cooper, 1998). Concept definition is another important aspect of the predevelopment phase. It is vital to describe what sort of product you want to develop as early as possible in the process. A failure to define the product – its target market; the concept, benefits and positioning; and its requirements, features and specs - before development begins is a major cause of new product failure and leads to serious delays in time to market (Cooper and Kleinschmidt, 1990; Montoya-Weiss and Calantone, 1994).
Predevelopment Development Post development

32
The fuzziest part of the predevelopment stage is idea development. Studies of this topic show divergent results. Song and Montoya-Weiss (1998) did not find any significant relation between idea development and product quality. Song and Parry (1997) found, contrary to what they expected, a negative correlation between the two variables. Still, results from Goldenberg, Lehmann, and Mazursky (2001) indicate that most failures and successes can be correctly predicted by the idea-source. It turns out that following a trend and mental invention tend to be associated with failure, while need and solution spotting tend to predict success. Koen et al. (2001) highlight the predevelopment phase as offering of the greatest opportunities for improving the overall innovation process. There has been, according to them, relatively little research to date on best practices for the front end, and many of the practices carried out during the NPD process do not apply to the front end. The nature of the work is fundamentally different in the predevelopment phase. The front end is experimental, often chaotic and difficult to plan, while the rest of the NPD process is structured, disciplined and goal-oriented. 2.1.1.2 Development Activities Technical development is one of the most studied factors in New Product Development, and results indicate that technical proficiency has a positive effect on performance (Cooper, 1994; Song and Parry, 1997; Souder and Jenssen, 1998). Proficiency in the Technical Development Stage includes, according to Song and Parry (1997), a lot of different activities. Conducting preliminary engineering, technical and manufacturing assessments, evaluating laboratory tests, executing prototype or "in house" sample product testing, designing and testing manufacturing facilities, determining the final product design and specifications, specifying a detailed program for full-scale manufacturing, and continuously working for cost reduction and quality control are some of the activities mentioned. The more proficient these activities are conducted the greater impact on product differentiation, and findings indicate a relationship between product differentiation and relative product performance (Song and Parry, 1997). Development proficiencies are found to be important for NPD success in both the U.S. and Scandinavia, and for both familiar and unfamiliar breakouts (Souder and Jenssen, 1999).

33
2.1.1.3 Post development activities Not surprisingly, a strong market launch underlies successful products. New product winners devote more than twice as many person-days and dollars to the launch as do failure teams. Similarly, quality of execution – well planned, and properly resourced - of the market launch is significantly higher for winners. Cooper (1999)
The Post Development Phase is often called the product commercialization stage. Proficiency in this stage includes activities like completing the final plan for manufacturing and marketing, establishing the overall direction for commercialization of the products, deciding the individuals responsible for each part of the commercialization program, launching the product in the marketplace (selling, promoting and distributing), studying feedback from customers regarding the product, and specifying activities and tentative plans for the product commercialization phase. Proficiency in these activities has a positive effect on product differentiation (Song and Parry, 1997). Customers perceive the product to have a higher quality, meet their needs better, and be more innovative when the commercialization phase is done right. Quality of execution of launch activities is important for both new products and services. Proficient launch activities were found by Athuahene-Gima (1996) to be the third most important factor affecting success of services. His findings show that using a formal procedure to evaluate the results of the launch, training of sales people and front-line personnel, and effective marketing of the new service to them are all ingredients in an effective launch process for new services. Song and Montoya-Weiss (1998) compared current practice to best practice in a study that examined the development of both really new products and incrementally new products. When comparing the NPD processes and performance outcome, they found room for improvement. For both really new and incrementally new products, the firms in the study did not place sufficient emphasis on product commercialization activities. Their findings suggest that efficient and coordinated execution of product commercialization activities is a fundamental and equally important requirement for both types of new products. However, firms are currently placing significantly greater emphasis on product commercialization activities when developing really new products. This implies suboptimal resource utilization.

34
The methodology applied to study these NPD activities is mostly cross-sectional benchmark studies, distinguishing new product successes from failures (Cooper, 1994). Since most of the studies referred to above have investigated the development of moderate to highly innovative new products, we do not know if the results can be generalized to incremental innovations. Consequently, we want to investigate the link between activities and outcome for low innovative NPD. 2.1.2 NPD Actors Within the NPD literature mostly intra-organizational studies have been reported (Montoya-Weiss and Calanone, 1994). Independent organizations with clear boundaries are in focus and the question is how to manage and organize the different departments and projects within these organizations to improve the outcome. Topics like centralization and formalization (Ayers, Dahlstrom, and Skinner, 1997; Olson, Walker, and Reukert, 1995) top management involvement, and cross-functional communication (Sethi, 2000; Sivadas and Dwyer, 2000; Song, Xie, and Dyer, 2000; Souder and Jenssen, 1999) have all been thoroughly studied. Even though most NPD studies emphasize intra-organizational processes, some inter-organizational studies have been conducted. An emerging literature highlights how supplier involvement (Clark and Fujimoto, 1991; Dyer and Ouchi, 1993; Handfield, Ragatz, Petersen, and Monczka, 1999) and customer involvement (Hauser and Clausing, 1988; von Hippel, 1986, 1998; von Hippel and Katz, 2002) affect the NPD process, but few studies have looked at NPD conducted in relationships by organizations at the same level. The focal actor in traditional NPD studies is usually a moderate to highly innovative manufacturer organization, and the main concern is managerial implications for manufacturer action. Low innovative actors, as, for example retailers, are seldom treated as focal. The importance of large retailers in many industries seems to escape the attention they deserve. Large retailers design products and/or outsource production to manufacturers who compete to gain orders for distributor brands (Gripsrud, 2004). In many cases, manufacturers also have to pay large amounts in slotting allowances/listing fees just to gain access to the shelves of large retailers for their manufacturer brands (Corstjens and Corstjens, 1995). Retailer's or other low innovative actors NPD activities are, accordingly, interesting topics to investigate.

35
2.1.3 NPD Resources Even though resources are claimed to be important (Cooper and Kleinschmidt, 1995, Henard and Szymanski, 2001), relatively few studies within NPD have dived deeply into the resource phenomenon. According to Montoya-Weiss and Calantone (1994) company resources, defined as capital, manufacturing facilities, and manpower requirement, are among the six least studied factors in NPD. What have been studied are the effects of marketing and technical synergies on NPD performance. The results indicate that an increase in a project's fit with the firm's existing base of marketing and technical skills leads to an increase in the quality of implementation during the NPD process (Song and Parry 1997, Gatignon and Xuereb, 1997). Focused commitment from senior management is another factor that has been studied and found to be important for NPD performance (Cooper and Kleinscmidt, 1995; Henard and Szymanski, 2001). Product support can, for example, according to Sorescu, Chandy and Prabhu (2003), explain differences in the financial reward of an innovation. Even though these factors are important for NPD success, we can hardly say that they cover the whole resource phenomenon. 2.2 The IMP Approach The IMP approach, also referred to as the interaction approach, the Markets-as-Networks tradition, and the Industrial Network approach (Gressetvold, 2004:27), is a research tradition that emerged at Uppsala University around 1970. In addition to Håkan Håkansson, Jan Johanson and Björn Wootz from Uppsala University, academics from France, Germany, Italy and the UK participated in the first research project which led to the publication of, “International Marketing and Purchasing of Industrial Goods – An Interaction Approach” (Håkansson, ed., 1982). The main contribution of this IMP research project can, according to Gressetvold (2004), be defined as, “the empirical evidence of the existence of stable, long-term buyer-seller relationships along with an analytical framework as a basis for understanding a single relationship”. The recognition that each company operates within a complex network was made in the first IMP research project, and led to a new IMP research project in 1986. The network model – or the ARA-model (Håkansson, 1987) became central in this research project. This model takes actors, resources and activities as three interdependent aspects of a network. Actors are defined as those who, alone or jointly, control resources and/or perform

36
activities. Actors can be individuals or firms, as well as groups of individuals or groups of firms, depending on the level of analysis. Actors have intentions and goals and strive to increase their control, but they do not act in isolation. Hence, as von Corswant sums it up in his dissertation, relationships between actors are based on interaction and each actor is part of a larger actor network. Actors perform activities that are interconnected into activity chains and activity networks. To perform activities, actors need to control resources and, as a consequence, these resources are interrelated. Therefore, the three layers; actors, activities and resources are interrelated (von Corswant, 2003:30).
Figure 2.2: The Network Model The IMP- approach is primarily qualitative, inductive, theory developing, holistic and descriptive (Johanson and Mattsson, 1994), and the focus is mainly on exchange processes, interactions and networks. Within the field of business, the IMP-approach has found its application and made theoretical
Actors
Activities Resources
Network
Håkansson (1987:17)

37
contributions within a number of areas, as, for example, industrial marketing and purchasing, logistics, internationalization and technical development (Gressetvold, 2004:32). Of particular interest for this dissertation is literature concerning technical development. A number of books and dissertations focusing on technical development from the IMP-approach have been published.
Table 2.1: IMP publications on technical development
Håkansson, ed. 1987: Industrial Technical Development – A Network Approach
Håkansson, 1989: Corporate Technological Behavior – Co-operation and Networks
Laage-Hellman, 1989: Technological Development in Industrial Networks Waluszewski, 1989: The Emergence of a New Pulp Technique Lundgren, 1991: Technical Innovation and Industrial Evolution – The
Emergence of Industrial Networks Biemans, 1992: Managing Innovation Within Networks. Wedin, 2001: Networks and Demand – The use of Electricity in an Industrial
Process Holmen, 2001: Notes on a Conceptualization of Resource-Related
Embeddedness of Inter-organizational Product Development Håkansson and Waluszewski, 2002: Managing Technological Development –
IKEA, the Environment and Technology Forbord, 2003: New Uses of an Agricultural Product? – Case Study of
development in an Industrial Network Bengtson, 2003: Framing Technological Development in a Concrete Context –
the use of wood in the Swedish Construction Industry Baraldi, 2003: When Information Technology Faces Resource Interaction –
Using IT tools to Handle Products at IKEA and Edsbyn Von Corswant, 2003: Organizing Interactive Product Development Gressetvold, 2004: Product Development – Effects on a Company’s Network
of relationships A lot of these IMP-publications focus on resources. In neoclassical economics resources are perceived as given. In the resource based view of the firm (RBV) control over scarce resources is perceived to provide the firm with an advantage. Contrary to these perspectives, the IMP-approach looks

38
at resources as a relative concept, implying that the value of a particular resource is related to its use. The IMP-approach is strongly influenced by Penrose (1959), who states that, “Strictly speaking, it is never resources themselves that are the inputs in the production process, but only the services that the resources can render (Penrose, 1959:25)”. Penrose, who mainly focused on the growth of a single firm, has provided fruitful inspiration to the IMP-group’s development of interorganizational frameworks and theories. One of the aspects highlighted within the IMP-approach is that the value of resources is not given, but changes over time. As stated by Håkansson and Snehota (1995:133), “resources are not entities given once and for all but variables”. A resource may be adapted in a way that increases its value in relation to other resources. This means that the value of a particular resource is dependent on how and with which other resources it is combined. This view of resources is very different from neoclassical economic theory, where resources are often assumed homogenous and measurable. Another concept frequently used within the IMP-group is embeddedness. When resources are adapted and combined with other resources, they are also tied up in the larger resource structure. According to the IMP-approach the resource then becomes embedded. This embeddedness influences product development. Von Corswant (2004:35) states that, “By considering how resources are embedded in larger resource structures, the limits to as well as opportunities for technical development can be described and explained”. Since a product is embedded with other resources, changes in these other resources may affect the feature of the product and, thus, its value. To be able to analyze this embeddedness, Håkansson and Waluszewski (2002) developed a framework based on four different resource categories: products13, production facilities14, business units15 and business relationships16. This framework has frequently been utilized in a lot of IMP studies to create an understanding of the interactive resource development process. For a further description of the resource entity model see Håkansson and Waluszewski (2002).
13 Products are physical items or services that are developed and produced through the interaction between resource elements. 14 Production facility is a resouce that transforms products into other products. 15 Business units incorporate social features related to knowledge, experience, capabilities, routines and traditions. Through interaction, the feature of one business unit becomes embedded with the features of other business units. 16 Business relationships can be regarded as resources since actors can use relationships to develop and utilize resources controlled by themselves or other actors.

39
Figure 2.3: The Resource Entity Model To summarize, the IMP approach focuses on interdependencies, heterogeneity and embeddedness between activities, resources and actors. Contrary to the conventional assumption of actors as homogeneous comparable entities, the IMP-approach perceives actors as heterogeneous and unique. Accordingly, the goal is not to develop general success factors that predict outcomes. Rather, the main objective is to create an increased understanding by investigating each case thoroughly. 2.3 Summary of the literature and presentation of the essays The literature review of the Cooper school indicates that the activity- outcome link has been emphasized in a lot of NPD research, while the role of resources and the interplay between different actors in NPD rarely are explored. The main focus within this school is intraorganizational NPD
Product
Production facilities
Business relationships
Business units
Håkansson and Waluszewski (2002)

40
activities, and the goal is to predict how future organizational action will affect the outcome. The IMP approach is very different from the Cooper school. The focus is on interorganizational relationships and networks, while intraorganizational aspects seldom are highlighted. The unit of analysis is often the relationship, while the Cooper school analyzes NPD projects or NPD programs17. The IMP approach captures the interdependencies between activities, resources and actors, with a special emphasize on resources, while the Cooper school primarily focuses on activities. The goal for the two approaches also differs. While the Cooper School tries to predict future NPD outcomes, the IMP-approach tries to increase our understanding of, among other things, the complexity associated with technical development. The differences between these two schools of though make them complementary. While the Cooper School contributes to knowledge on NPD activities within the firm, the IMP approach gives us an understanding of the interdependencies between activities, resources and actors in inter-organizational product development. In this dissertation, the traditional focus on intraorganizational activities in NPD is extended to include resources and interorganizational aspects. The Cooper school is utilized in essay one, while the IMP approach is utilized in paper four. Essay two and three starts out from the Cooper school, but the research topics investigated and the methodologies applied are influenced by the IMP approach. Incremental product development is explored, and topics such as new service development in hotels, retailer’s development of distributor brands and manufacturer’s development of product improvements and line extensions are investigated. Below, a short description of the four essays is presented. 2.3.1 Essay one A test of how exploitation and exploration strategies affect new service development in hotels is described. The study is conducted within the Cooper school, where resources are perceived as given, and where a cross-sectional methodology is applied to explore the links between activities and outcome at the intra-organizational level.
17 NPD program studies investigate what a firm usually does when developing new products, while NPD project studies highlight specific projects.

41
We argue that actors due to scarce resources need to balance wisely between exploration and exploitation. Exploration entails diverting scarce resources from existing services. Exploiting existing services generates today’s profits, whereas exploring new services, while positive for knowledge development, implies spending these profits on an uncertain future. The following research question is stated: How do narrow and broad scanning affect new service development outcome? The different effects of narrow and broad scanning on short-term outcome (service adaptation) and long-term outcome (spin-off knowledge) are explored within the hotel industry. 2.3.2 Essay two The second essay looks at inter-organizational NPD. Even though there is widespread consensus on the importance of firms' vertical integration decisions and NPD, it remains unclear whether or how these boundary decisions affect NPD performance. In the case, two manufacturing firms are compared according to what NPD activities they conduct. One of the firms conducts all NPD activities in-house, while the other firm outsources the technical development. How these different ways to organize NPD affects predevelopment activities and "Time-to-market" are investigated. The research question stated is: How does outsourcing of technical development affect predevelopment activities and time-to-market? 2.3.3 Essay three The third essay looks at NPD within the grocery retail industry in Norway. While most NPD studies so far have investigated NPD from the manufacturers’ point of view, the distributor is the focal actor in this study. First, distributor brand development activities are compared with manufacturer brand development activities. Then, the outcome of a NPD process controlled by a manufacturer is compared with the outcome of a process controlled by a distributor. The research questions stated are:

42
1. Do manufacturers and distributors conduct different NPD activities?
2. Does the outcome of a NPD process controlled by a manufacturer differ from the outcome of a process controlled by a distributor?
2.3.4 Essay four In the last essay, the IMP approach is utilized. We elaborate on the dynamic resource perspective presented by Vargo and Lusch (2004) where resources “not are, but become”. In the case, empirical observations of incremental changes in a simple saithe block product illustrate important resource interfaces, and the concept of friction is introduced to emphasize the contradictory aspect of resources, as both a possibility and a hindrance of development. Friction is used as a tool to shed light on the manager’s role in organizational change. Change and friction are interrelated, and the focal point to explore is the manager’s role in this interaction. The overall objective of the study is to: 1. Illustrate the level of resource friction in an incremental innovation,
and 2. Discuss the manager’s role in handling resource friction.

43
2.4 References Athuahene-Gima, K. (1996). "Differential Potency of Factors Affecting
Innovation Performance in Manufacturing and Service Firms in Australia." Journal of Product Innovation Management 13: 35-52.
Ayers, D., R. Dahlstrom, et al. (1997). "An Exploratory Investigation of
Organizational Antecedents to New Product Success." Journal of Marketing Research 34(Feb): 107-116.
Bengtson, A. (2003) “Framing Technological Development in a Concrete
Context: The use of Wood in the Swedish Construction Industry”, Doctoral thesis, Department of Business Studies, Uppsala University, Uppsala.
Biemans, W.G. (1992) “Managing Innovation Within Networks”, Routledge,
London Clark, K. and T. Fujimoto (1991). Product Development Performance.
Boston, MA, Harvard Business School Press. Cooper, R. G. (1993). Winning at New Products, Addison-Wesley, Reading Cooper, R. G. (1994). "New Products: The Factors that Drive Success."
International Marketing Review 11(60-76). Cooper, R. G. (1998). "Benchmarking new product performance: Results of
the best practices study." European Management Journal 16: 1-17. Cooper, R. G. (1999). "From Experience. The Invisible Success Factors in
Product Innovation." Journal of Product Innovation Management 16: 115-133.
Cooper, R. G. and E. J. Kleinschmidt (1990). "New Products: The Key
Factors in Success." American Marketing Association Monograph. Corstjens, J. and M. Corstjens (1995). StoreWars. West Sussex, England,
John Wiley & Sons Ltd. Dyer, J. H. and W. G. Ouchi (1993). "Japanese-Style Partnerships: Giving
Companies a Competitive Edge." Sloan Management Review Fall.

44
Forbord, M. (2003) “New Uses of an Agricultural Product? A Case Study of Development in an Industrial Network”, Doctoral thesis, Department of Industrial Economics and Technology Management, Norwegian University of Science and Technology, Trondheim.
Gatignon, H. and J.-M. Xuereb (1997). "Strategic Orientation of the Firm
and New Product Performance." Journal of Marketing Research 34: 77-90
Goldenberg, J., D. R. Lehmann, et al. (2001). "The Idea Itself and the
Circumstances of Its Emergence as Predictors of New Product Success." Management Science 47(1 (Jan)): 69-84.
Gressetvold, E. (2004). Product Development. Effects on a Company's
Network of Relationships. Department of Industrial Economics and Technology Management. Trondheim, NTNU: 254.
Gripsrud, G. (2004). The Marketing Discipline and Distribution Research:
Time to Regain Lost Territory? Rethinking Marketing. H. Håkansson, D. Harrison and A. Waluszewski. West Sussex, John Wiley & Sons Ltd: 189-206.
Handfield, R. B., G. L. Ragatz, et al. (1999). "Involving Suppliers in New
Product Development." California Management Review 42(1). Hauser, J. R. and D. Clausing (1988). "The House of Quality." Harvard
Business Review (May-June): 63-73. Henard, D. H. and D. M. Szymanski (2001). "Why Some New Products Are
More Successful Than Others." Journal of Marketing Research: 362-375.
Holmen, E. (2001) “ Notes on a Conceptualisation of Resource-Related
Embeddedness of Inter-organizational Product Development. Ph.D. thesis, Department of Marketing, University of Southern Denmark, Sønderborg.
Hopkins, D. S. (1980). "New Product Winners and Losers." Conference
Board Report 773. Håkansson, H. (ed. 1982) “International Marketing and Purchasing of
Industrial Goods – an Interaction Approach”, John Wiley & Sons, Chichester.

45
Håkansson, H. (1987) “Product Development in Networks”, in H.
Håkansson (ed.): Industrial Technological Development- A Network Approach, Croom Helm, London
Håkansson, H. (1989). “ Corporate Technological Behavior – Co-operation
and Networks, Routledge, London Håkansson, H. and A. Waluszewski (1987) “Managing Technological
Development - IKEA, the Environment and Technology, Routledge, London
Johanson, J. and L. G. Mattson (1994) “The Markets-as-Networks Tradition
in Sweden, in G. Laurent, G.L. Lilien & B. Pras (eds.): Research Traditions in Marketing, Kluwer Academic Publishers, Boston.
Koen, P., G. Ajamian, et al. (2001). "Providing clarity and a common
language to the "fuzzy front end"." Research Technology Management (March-April): 46-55.
Laage-Hellman, J. (1989) “Technological Development in Industrial
Networks, Doctoral thesis, Department of Business Studies, Uppsala University, Uppsala.
Lundgren, A. (1991) “Technological Innovation and Network Evolution”,
Routledge, New York. Montoya-Weiss, M. M. and R. Calantone (1994). "Determinants of New
Product Performance: A Review and Meta-Analysis." Journal of Product Innovation Management: 397-417.
Olson, E. M., O. C. J. Walker, et al. (1995). "Organizing for Effective New
Product Development: The Moderating Role of Product Innovativeness." Journal of Marketing 59(Jan): 48.
Penrose, E. T. (1959). The Theory of the Growth of the Firm. Oxford, UK:
Basil Blackwell. Sethi, R. (2000). "New Product Quality and Product Development Teams."
Journal of Marketing 64(April): 1-14. Sivadas, E. and F. R. Dwyer (2000). "An Examination of Organizational
Factors Influencing New Product Success in Internal and Alliance-Based Processes." Journal of Marketing 64(Jan): 31-49.
46
Song, X. M. and M. M. Montoya-Weiss (1998). "Critical Development Activities for Really New versus Incremental Products." Journal of Product Innovation Management 15: 124-135.
Song, X. M. and M. E. Parry (1997). "A Cross-National Comparative Study
of New Product Development Processes: Japan and the United States." Journal of Marketing 61(4): 1-18.
Song, X. M., W. E. Souder, et al. (1997). "A Causal Model of the Impact of
Skills, Synergy, and Design Sensitivity on New Product Performance." Journal of Marketing Research 14: 88-101.
Song, X. M., J. Xie, et al. (2000). "Antecedents and Consequences of
Marketing Managers Conflict-Handeling Behaviors." Journal of Marketing 64(Jan): 50-66.
Sorescu, A. B., R. K. Chandy, et al. (2003). "Sources and Financial
Consequences of Radical Innovation: Insights from Pharmaceuticals." Journal of Marketing 67(4): 82-102.
Souder, W. E. and S. A. Jenssen (1999). "Management Practices Influencing
New Product Success and Failure in the United States and Scandinavia: A Cross-Cultural Comparative Study." Journal of Product Innovation Management 16: 183-203.
von Hippel, E. (1986). "Lead Users: A Source of Novel Product Concepts."
Management Science 32(7): 791-805. von Hippel, E. (1998). "Economics of Product Development by Users: The
Impact of "Sticky" Local Information." Management Science 44(5): 629-644.
von Hippel, E. and R. Katz (2002). "Shifting Innovation to Users via
Toolkits." Management Science 48(7): 821-833. Von Corswant, F. (2003). Organizing Interactive Product Development.
Department of Operations Management and Work Organization School of Technology Management and Economics. Göteborg, Sweden, Chalmers
Wedin, T. (2001). “Networks and Demand – The Use of Electricity in an
Industrial Process, Doctoral thesis, Department of Business Studies, Uppsala University, Uppsala

47
3. Market Scanning for New Service Development18 3.0 Abstract We consider two levels of innovation (incremental and discontinuous) in the new service development process. From this we derive the concepts of narrow market scanning and broad market scanning. Narrow scanning has a positive affect on short-term success, while broad scanning has a positive affect on long-term success. The implications are that market scanning can be divided two ways (narrow and broad), each way requires different activities, and they have different outcomes. Therefore, service managers need to be aware that service innovation outcomes will vary depending on how they scan their markets.
18 Co-authored with Associate Professor James Sallis. Accepted for publication in European Journal of Marketing, June 2005.

48
3.1 Introduction Service firms represent an increasingly important business sector, yet the new product development literature is inclined toward production firms (Gray and Hooley, 2002; Song et al., 2000). Production-oriented theories, while often applicable, are not entirely appropriate. Services are unique in that usually they are intangible actions or performances (Looy et al., 2003). They often involve customer participation and inputs are variable, thus service experiences are heterogeneous and more difficult to evaluate; and they are typically delivered in real time and thus cannot be stockpiled (Grönroos, 2000; Lovelock, 2001). This inseparability element means that customers play a more active role in the service development process (de Brentani, 2001), leading to the supposition that service firms are, by nature, more market oriented than product firms (Atuahene-Gima, 1996). The highly active role of the customer in the service development process has implications for innovation. By being so close to their customers, service firms have intimate access to customer problems and their developing needs. On the positive side, when customer preferences are forming or changing rapidly, firms that adapt offerings more closely to customer needs, i.e., are market oriented, perform better (Atuahene-Gima, 1995; Darroch and McNaughton, 2003). Problems may arise, however, because listening too closely to customers limits strategic options for new services to those envisaged by customers (Christensen and Bower, 1996), and because customers have difficulty articulating their latent needs, emerging opportunities that provide solutions to unexpressed needs may not be discovered or recognized (Atuahene-Gima, 2003). This creates a dilemma for service firms pursuing short- and long-term innovation. How can service firms maintain both a broad and narrow perspective of their markets? In this paper our primary research agenda is to develop a theoretical model that encompasses the outcomes of narrow and broad market scanning. Given the nature of narrow and broad scanning, we aim to define short-term and long-term outcomes. Finally, we will test the proposed relationships on data from a service industry. This should help answer the questions: How do narrow and broad scanning affect new service development outcomes? What are the managerial implications for new service development of focusing on narrow and/or broad scanning?

49
3.2 Literature Review As with products, the innovativeness of a new service idea may be defined by the degree of newness it has relative to the firm and to the outside world (Kleinschmidt and Cooper, 1991; Olson et al., 1995), and new service ideas may be dichotomized into incremental and discontinuous innovations (Song and Montoya-Weiss, 1998). Incremental innovations are based on improvements to existing technology, whereas, discontinuous innovations incorporate substantially different technology into services that satisfy customer needs better than existing services (Chandy and Tellis, 1998). Generally, incremental innovation is associated with the short-term viability of the firm because through fine-tuning services it directly addresses short-term performance. In contrast, discontinuous innovation is associated with long-term viability because it provides a broader view of trends and aids in developing the necessary capabilities to capitalize on major market shifts (Connor, 1999; Darroch and McNaughton, 2003). Firms that introduce discontinuous innovations stand to benefit from pioneering advantages by being the first-mover in the market (Song et al., 2000). Market orientation, broadly speaking, refers to, “The ability to diagnose and respond to customer needs (Fahy et al., 2000, p. 67).” From a culturally based behavioral perspective (Lafferty and Hult, 2001), the three pillars of market orientation are customer orientation, competitor orientation, and interfunctional coordination (Day, 1994; Jaworski and Kohli, 1996; Lado et al., 1998; Narver and Slater, 1990). A customer orientation puts the customer’s interest first, while not excluding other stakeholders (Dalgic, 1998). Largely because of this, market orientation research has been criticized because serving customer needs too closely traps firms into cycles of incremental innovation at the cost of discontinuous innovation (Gatignon and Xuereb, 1997). Critics suggest customers should be merely an additional source of ideas along with technology, engineering, production, inventions, other firms, and management and employees (Berthon et al., 1999). March (1991) related exploration and exploitation to innovation. “Adaptive systems that engage in exploration to the exclusion of exploitation are likely to find that they suffer the costs of experimentation without gaining many of its benefits. They exhibit too many underdeveloped new ideas and too little distinctive competence. Conversely, systems that engage in exploitation to the exclusion of exploration are likely to find themselves trapped in sub-optimal stable equilibrium. As a result, maintaining an appropriate balance between exploration and exploitation is a primary factor in system survival and prosperity (March, 1991, p. 71).”

50
The dilemma in striking this balance arises from scarce resources. Resources are limited and exploration entails diverting scarce resources from existing services. Exploiting existing services generates today’s profits, whereas exploring new services, while positive for knowledge development, spends those profits on an uncertain future. Consider McKinsey & Company when Rajat Gupta took over as Managing Director in the early 1990s. “We have easily doubled our investment in knowledge over these past couple of years. There are lots more people involved in many more initiatives. If that means we do 5-10% less client work today, we are willing to pay that price to invest in the future (Bartlett, 1996a, p. 13).” Given the number of partners at the time, a drop of 5-10% in client work translates to a 190,000-380,000 USD cost (or loss) per partner per year (Bartlett, 1996b), until the investment pays off - assuming it does. Imagine the commitment to exploration necessary to support such a cost! To assuage the critics, proponents of market orientation point out that reacting to customer’s expressed needs is inadequate (Jaworski and Kohli, 1996). Narver, Slater, and MacLachlan (2000) propose that “total” market orientation exists in two forms: “reactive” market orientation and “proactive” market orientation. Important facilitators of reactive market orientation are staying close to customers and focusing on articulated customer needs. Important facilitators of proactive market orientation are industry foresight and customer insight (Slater and Narver, 1999), broad market scanning (Day, 1994), and long-term focus (Narver et al., 2000). Proactive market orientation aims to expose latent customer needs and emerging markets by focusing on exploration, thereby enhancing discontinuous innovation. In line with this thinking, we distinguish two types of market scanning. Narrow scanning is defined as the generation of market intelligence pertaining to current needs. It is linked to exploiting existing competencies within a familiar frame of reference. Managers apply their market knowledge and service knowledge to adapt services to fit customer preferences and competitor strategies. For example, customer tracking systems capture information on individual customer preferences. This can be used to individually tailor services, or to identify trends across segments of customers. In a hotel we investigated they received feedback from a regular customer as to a special type of bread they liked to have with their breakfast. This proved to be popular with other guests as well, and is now a regular part of their breakfast buffet. In this way they increased loyalty and satisfaction through direct adaptation to their immediate environment.

51
Broad scanning is defined as information search in the peripheral environment, and among new markets and services that the firm does not presently emphasize. It is linked to exploring new alternatives that challenge the status quo way of thinking. What happens in one branch is often driven by what happens in other branches, and broad scanning provides information that may be useful outside of current solutions. In a hotel chain we investigated they instituted policies where each hotel was required to be involved in local community activities, and to seek partnership with research and interest organizations. Through this they detected environmental concerns for the wastefulness of their operations. One direct result was tighter business relationships with eco-friendly detergent suppliers, as well as a program where, for guests staying multiple nights, only towels that have been left on the floor are washed. In this way they increased loyalty and satisfaction through adaptation to their peripheral environment, and saved money by reducing laundry volume.
This dichotomy is supported in the strategic marketing literature (Darroch and McNaughton, 2003; Mullins et al., 2005; Ranchhod, 2004). Facilitating a broad spectrum of innovation requires a broad set of knowledge management practices (Darroch and McNaughton, 2003). Firms are encouraged to define markets in terms of customer needs on a served market, that is, the market where the firm competes for customers (Best, 2005) Narrow market definitions concentrate focus on articulated customer needs, whereas broad market definitions extend the focus to include unarticulated needs. The implication is that a broad perspective enables the firm to assess the market potential of opportunities outside of immediate markets.
While inseparability implies that service firms may be more inclined towards incremental innovation, intangibility has other ramifications. Service intangibility implies that services can be developed more quickly and easily than products (Atuahene-Gima, 1996; de Brentani, 2001), thus service managers perceive less risk with pioneering (Song et al., 1999), meaning they are more inclined than product managers to introduce discontinuous innovations (Song et al., 2000). These somewhat incongruent findings expose a gap in the literature with regard to incremental and discontinuous innovation, and thus how service firms should address narrow and broad scanning. By default, service firms do narrow scanning, however, it would seem that there may be a substantial opportunity for enhancing discontinuous innovation.

52
3.3 Theoretical Model Market scanning affects innovation, and there are distinctly different outcomes for different types of market scanning (Darroch and McNaughton, 2003; Narver et al., 2000). Griffin and Page (1996) state that new product development outcomes are multifaceted and difficult to measure. In their research they found 75 distinct measures of product development success, which they divided into three independent dimensions: consumer-based, financial, and technical or process-based (Griffin and Page, 1993). Their findings strongly support the hypothesis that the most appropriate set of measures for assessing success depends on the new product development strategy (Griffin and Page, 1996). This would suggest distinct measures for narrow and broad scanning. For discontinuous innovations, Griffin and Page (1996) suggest customer acceptance, customer satisfaction, competitive advantage, and profit goals. For incremental innovations the most appropriate measures are concerned with customer satisfaction, competitive advantage, profit goals, and market share goals. Profitability, while important, is an outcome, not determinant of performance, and cannot be managed directly (Day, 1990). The same can be said for customer acceptance, customer satisfaction, and market share. The temporal gap between market scanning and outcome measures like profitability is likely to be quite large (Matear et al., 2002), especially for broad scanning. Therefore, we need intermediary measures that are more directly coupled to narrow and broad scanning. Several studies show that an active customer information process positively influences new product advantage (Cooper, 1994; Darroch and McNaughton, 2003; Song and Parry, 1997; Souder and Jenssen, 1999). Information about what sort of services customers want, how customers behave, and competitor services, will increase the likelihood of successful incremental innovation (Atuahene-Gima, 1996; de Brentani, 2001). A firm with a superior ability to adapt services to fit customer needs has a competitive advantage (Weerawardena, 2003). In accordance with this, we propose service adaptation as a mediating performance measure between narrow scanning and profitability. Service adaptation is defined as the degree that a service has unique benefits and value for users. Our rationale is that service performance is largely based on the degree of fit between customer needs and the service offering (de Brentani, 2001). The needs-offering fit is a function of services that are continually adapted to customers through narrow scanning. Thus, we hypothesize: H1a: Narrow scanning has a positive effect on service adaptation.
53
Through narrow scanning, the firm may gain knowledge that has no current use, however, may be applicable to future new service development projects. Given that the knowledge is a by-product of the process, we expect its effect to be weak. Thus, we hypothesize: H1b: Narrow scanning has a positive effect on spin-off knowledge, however, the effect is weaker than for broad scanning. Broad scanning is principally concerned with information search among new markets and services that the firm does not presently emphasize, providing fodder for discontinuous innovation. To show a direct link to discontinuous innovation is, however, difficult. The extant literature focuses on organizing for innovation (Johannessen et al., 1997), through post hoc analysis of successful discontinuous innovators (de Brentani, 2001). There is little consensus as to specific causal relationships, which may be why discontinuous innovation is a priority research topic (Chandy and Tellis, 1998). Given this, we need a proxy measure of broad scanning success that relates to how service firms organize for discontinuous innovation. For this we turn to Griffin and Page’s (1996) suggestion of competitive advantage. Competitive advantage is something held by the firm, it can be directly managed, and leads to performance outcomes (Porter, 1996). Organizational learning is often described as an important source, if not the only source of sustainable competitive advantage (Weerawardena, 2003). A review of the literature reveals several definitions of organizational learning. However, despite their diversity, there seems to be a general consensus that organizational learning involves some kind of information processing (Selnes and Sallis, 2003). For example, Huber defined organizational learning as, “An entity learns if, through its processing of information, the range or likelihood of its potential behaviors is changed (1991, p. 89).” Menon and Varadarajan (1992) described the conceptual use of research findings that do not directly apply to a current problem or situation. The research findings provide general enlightenment or the development of a managerial knowledge base, affecting managerial orientation towards problems and solutions. The influence is subtle and indirect, thus not easily attributable to specific effects. Moorman (1995) operationalized conceptual utilization as information commitment (which is conducive to organizational learning), and information processing (which is part of the cognitive process of organizational learning (Selnes and Sallis, 2003)). The outcome of organizational learning is knowledge, and in the context of this paper, knowledge about new markets and services that the firm does not presently emphasize. Admittedly, knowledge per se does not directly represent

54
performance, however, in line with Menon and Varadarajan’s (1992) reasoning, we believe a stock of knowledge about new markets and services outside of served markets will positively affect firm performance. Hurley and Hult (1998) support this logic by relating market orientation to organizational learning, and then extending the link to include a firm’s capacity to innovate. Innovative capacity is a function of structural properties of the firm working in concert with cultural attributes that create a capacity for absorbing innovation from the environment. Operationally, it is how actively management seeks innovative ideas from the market, and is related to the success of new products (Adams et al., 1998). In accordance with this reasoning, we offer spin-off knowledge as a proxy performance measure for discontinuous innovation. This is not unlike saying that absorptive capacity (Cohen and Levinthal, 1990) or transformative capacity (Garud and Nayyar, 1994) affect innovation and performance. Spin-off knowledge is defined as general knowledge about new technology, products, or markets that the firm can first exploit at a later point in time. In contrast to the utilized knowledge from narrow scanning on product adaptation, spin-off knowledge is relatively dormant, subtly, and potentially radically affecting performance. The construct "spin-off knowledge" is an extension of "organizational memory" as defined by Moorman and Miner (1997). While organizational memory captures knowledge of a particular familiar domain and inhibits action outside preexisting action patterns, spin-off knowledge is a measure of the ability to meet future markets. Spin-off knowledge is an effectiveness measure that mirrors the organization's ability to learn, and thereby indirectly measures a competitive advantage that may lead to long-term success. Thus, we hypothesize: H2a: Broad scanning has a positive effect on spin-off knowledge.
Knowledge gained from customers or competitors in other markets can be adapted and applied into served markets, therefore, even though broad scanning is primarily concerned with the long-term market potential of opportunities outside of immediate markets, it also affects the current service offering (Chandy and Tellis, 1998). Nevertheless, given the explorative nature of broad scanning it is less efficient in the short-term (March, 1991; Slater and Narver, 1998). Thus, we hypothesize; H2b: Broad scanning has a positive effect on service adaptation, however, the effect is weaker than for narrow scanning.
55
Profitability is defined as the perceived relative profitability compared with the nearest competitor (Narver et al., 1993). There is consensus in the literature that product adaptation leads to profitability (Atuahene-Gima, 1996; Cooper and Kleinschmidt, 1987; Li and Calantone, 1998; Song et al., 2000; Song and Montoya-Weiss, 1998). Customers purchase more and are willing to pay a higher price for products they perceive to be best in competitive markets. The literature on services is less developed (Matear et al., 2002); nevertheless, we propose the same link with services (Hooley et al., 2003). Customers are willing to pay more for services they perceive to be best in competitive markets (Best, 2005), thus, everything else being equal, incremental service adaptation leads to profitability (Anderson et al., 1994). Thus, we hypothesize: H3a: Service adaptation has a positive effect on profitability. When discontinuous innovations provide better value for money than incumbent’s services, customers will switch (Chandy and Tellis, 1998). The result for the discontinuous innovator can be sustainable competitive advantage (Wind and Mahajan, 1997), and large, long-lasting profits (Geroski et al., 1993). With regard to spin-off knowledge, there is no guarantee as to its successful use, thus it may never lead to discontinuous innovation. Therefore, the link to profitability is only present when mediated by a successful discontinuous innovation. Given the infrequency and unpredictability of these sorts of innovations, the link may not be present, and thus the hypothesis not supported. There is also the issue of temporal distance between broad scanning, spin-off knowledge, discontinuous innovation, and profits. Nevertheless, we hypothesize: H3b: Spin-off knowledge has a positive effect on profitability, however, the effect is weaker than for service adaptation. These hypotheses form the model in figure 1.

56
Figure 3.1: Conceptual Framework
NarrowScanning
BroadScanning
ServiceAdaptation
Spin-OffKnowledge
Profitability
H1a
H1b
H2a
H2b
H3a
H3b
NarrowScanning
BroadScanning
ServiceAdaptation
Spin-OffKnowledge
Profitability
H1a
H1b
H2a
H2b
H3a
H3b
3.4 Methodology 3.4.1 Sample and Data Collection Services exhibit a tremendous heterogeneity when crossing between industries, and even within industries (Erramilli and Rao, 1990). As such, several researchers have proposed various forms of classification (Contractor et al., 2003; Grönroos, 1999). One such classification distinguishes between soft services, where production and consumption cannot be decoupled, and hard services where decoupling is feasible (Erramilli and Rao, 1990). This distinction is important for our research because we consider inseparability of production and consumption to be influential on the new service development process. When production and consumption can be separated we assume the development process is essentially the same between services and products. The implication is that we needed to use a soft service in our sample. In order to not confound the relationships between variables with an overly heterogeneous sample, we also decided to limit ourselves to a single service industry. Our data was collected from hotels in Norway. Over a five year period all hotels had developed some sort of incremental new services, like improvements in the restaurant or changes in the booking system. 24.6% of the hotels developed more radical innovations that were new to the market and new to the hotel. It is an appropriate setting because in hotels, most front-stage service activities, like in the restaurant, bar, and reception, are co-productions between employees and customers. While some parts of the

57
service are separable, like cleaning rooms, in general the hotel stay is inseparable from the service, thus hotels make a good setting for our study. There is also quite high variance in the service development processes amongst hotels, thus facilitating the test of our model. The sampling frame consisted of all Norwegian hotels listed in DM-HUSETs database. Norway is a good setting because European firms have inherently (through culture) been market oriented, traditionally emphasizing long-term business relationships (Dalgic, 1998; Håkansson and Snehota, 1989; Johanson and Mattsson, 1987). We randomly sampled 500 hotels. After two follow-up letters we received usable questionnaires from 126 hotel managers, which translates to a 25% response rate. We evaluated non-response bias by comparing early respondents with late respondents as recommended by Armstrong and Overton (1977). A comparison of the two groups did not reveal any significant differences in our focal constructs. 3.4.2 Measure development Except for spin-off knowledge, we developed scales from other empirical work; all measures were pre-tested and modified before the instrument was professionally drafted. The questionnaire language was Norwegian, an English translation is shown in table 3.1, below. For narrow scanning and broad scanning we used two items for each construct, with 7-point scales ranging from totally disagree to totally agree. Narrow scanning was adapted from Song and Parry (1997), broad scanning from Sandvik (1998). Measures for service adaptation were modified from Cooper (1994). On a 7-point scale respondents indicated to what degree they perceived the hotel service to be unique and of superior quality relative to competitors. Profitability was a one-dimensional measure adopted from Narver, Jacobson, and Slater (1993). We used a 7-point scale ranging from much weaker profitability to much better profitability. Although the measure may be criticized for being subjective, the advantage is that it allows for the direct comparison of different types of hotels and different types of innovation. Han, Kim, and Srivastava (1998) found a significant correlation between subjective performance measures and financial data, and they are the most used profitability measures within product development studies (Song and Montoya-Weiss, 1998; Song and Parry, 1997; Song et al., 1997; Souder and Jenssen, 1999; Yap and Souder, 1994).

58
Spin-off knowledge was measured with 4 new items on a 7-point scale from totally disagree to totally agree.
Table 3.1: Measures Narrow scanning (Song and Parry 1997) 1. We track what sort of services the market wants. 2. In the market, we track trends in service features. 3. *We evaluate our competitors and their services – both existing and potential. Broad scanning (Sandvik 1998) 1. Compared to our competitors, we have much more information about new trends in
the hotel industry. 2. Compared to our most important competitors, in our service development process
we are much more concerned with discovering new customer segments. 3. *We concentrate all our attention on customers and competitors we already have
when we develop new services (r). Service adaptation (Cooper 1994) 1. Customers perceive our hotel's service to contain many advantages not available
from competitors. 2. Our hotel offers a complete service that provides good value for the price. 3. *Regarding satisfying customer needs, our hotel’s complete offer is better than our
competitors. 4. From the customer’s perspective on service quality, our hotel delivers better service
quality than average in our branch. 5. *Our hotels offering can be described as having a better price/quality relationship
than our competitors. 6. The strength with our hotel’s offering is easy for the customer to perceive. Profitability (Narver, et al. 1993)
How profitable was your hotel in 1999 compared to your most important competitor?
Spin-off knowledge (New) 1. Our new service development process has given our hotel new customer knowledge
that we would not have obtained otherwise. 2. Through developing new services we have obtained knowledge on other customer
segments that we do not emphasize today. 3. Through our new service development process we have obtained new knowledge
about our competitors.
4. Through our new service development process we have obtained new knowledge about market trends.
*Dropped items.

59
3.5 Results We screened the data for skewness, kurtosis, and variance, all of which were satisfactory (see table 3.2). We then ran an exploratory factor analysis using maximum likelihood estimation to see if the indicators loaded significantly on the proper factors. With a sample size of 126 the cutoff for significance is about 0.49 (Hair et al., 1998). All indicators loaded on the correct factors, although two indicators (in factor 1 and factor 4) were not significant (see table 3.3). Nevertheless, we tested all indicators in the confirmatory factor analysis. Our rationale was that as the number of factors increases, the cutoff for significance decreases, although we do not know by how much (Hair et al., 1998). The two insignificant indicators had their highest loading on the correct factor, 0.417 and 0.393, which may be in the realm of significance given the number of factors.
In confirmatory factor analysis the a priori measurement model did not fit the data well. Anderson and Gerbing (1988) suggest dropping those indicators with low factor loadings, which we did. Specifically, we dropped narrow scanning (Nscan) 3, broad scanning (Bscan) 3, and service adaptation (Adapt) 3 and 5. Nscan 3 asks about both existing and potential competitors and their services. In retrospect, this wording contains two questions in one, which may have confounded the results. Also, “potential” is more in the domain of broad scanning, thus the measure is not conceptually consistent with the construct. Bscan 1 and 2 are direct measures of broad scanning relative to competitors, whereas, Bscan 3 has a reverse logic and is concerned with concentrating “all our attention” on narrow scanning. It becomes an ultimatum between do or don’t, failing to measure how much. It may have confused the respondent and is conceptually unique from the first two measures. The wording of Adapt 3 and 5 may have misled the respondents. Nevertheless, Adapt 3 and Adapt 2 (retained) are both concerned with the complete offering, thus this aspect of the theoretical domain is still represented by the measures. Adapt 5 and Adapt 4 (retained) are both concerned with quality, so again, this particular aspect of the theoretical domain is still represented.

60
Table 3.2: Summary Statistics N Mean St. dev. Skewness Kurtosis Narrow Scanning Nscan 1 126 5.12 1.28 -0.48 -0.27 Nscan 2 126 4.96 1.31 -0.27 -0.46 Broad Scanning Bscan 1 126 3.71 1.31 -0.16 -0.11 Bscan 2 126 3.74 1.36 0.59 -0.18 Service Adaptation Adapt 1 126 4.87 1.48 -0.46 -0.35 Adapt 2 126 5.80 1.01 -0.96 1.10 Adapt 3 126 4.98 1.34 -0.48 0.15 Adapt 4 126 4.87 1.45 -0.60 0.08 Spin-Off Knowledge
Spin-off 1 123 4.76 1.40 -0.54 -0.40 Spin-off 2 124 4.70 1.31 -0.43 -0.46 Spin-off 3 124 4.70 1.37 -0.39 -0.36 Spin-off 4 123 4.94 1.29 -0.61 -0.03 Profitability Profit 1 121 4.77 1.28 -0.13 -0.24
Table 3.3: Exploratory Factor Analysis 1 (Nscan) 2 (Bscan) 3 (Adapt) 4 (Spin-off) Nscan 1 0.756 0.198 0.417 0.285 Nscan 2 0.984 0.223 0.397 0.307 Nscan 3 0.417* 0.258 0.257 0.215 Bscan 1 0.310 0.571 0.382 0.339 Bscan 2 0.231 0.766 0.288 0.377 Bscan 3 0.131 0.393* 0.109 0.256 Adapt 1 0.287 0.304 0.673 0.209 Adapt 2 0.429 0.082 0.732 0.104 Adapt 3 0.256 0.513 0.750 0.256 Adapt 4 0.336 0.317 0.740 0.250 Adapt 5 0.256 0.194 0.613 0.085 Adapt 6 0.406 0.087 0.672 0.134 Spin-Off 1 0.219 0.373 0.205 0.686 Spin-off 2 0.202 0.342 0.096 0.927 Spin-off 3 0.398 0.349 0.200 0.751 Spin-off 4 0.194 0.428 0.221 0.529 Maximum likelihood estimation, direct Oblimin rotation, *Not significant
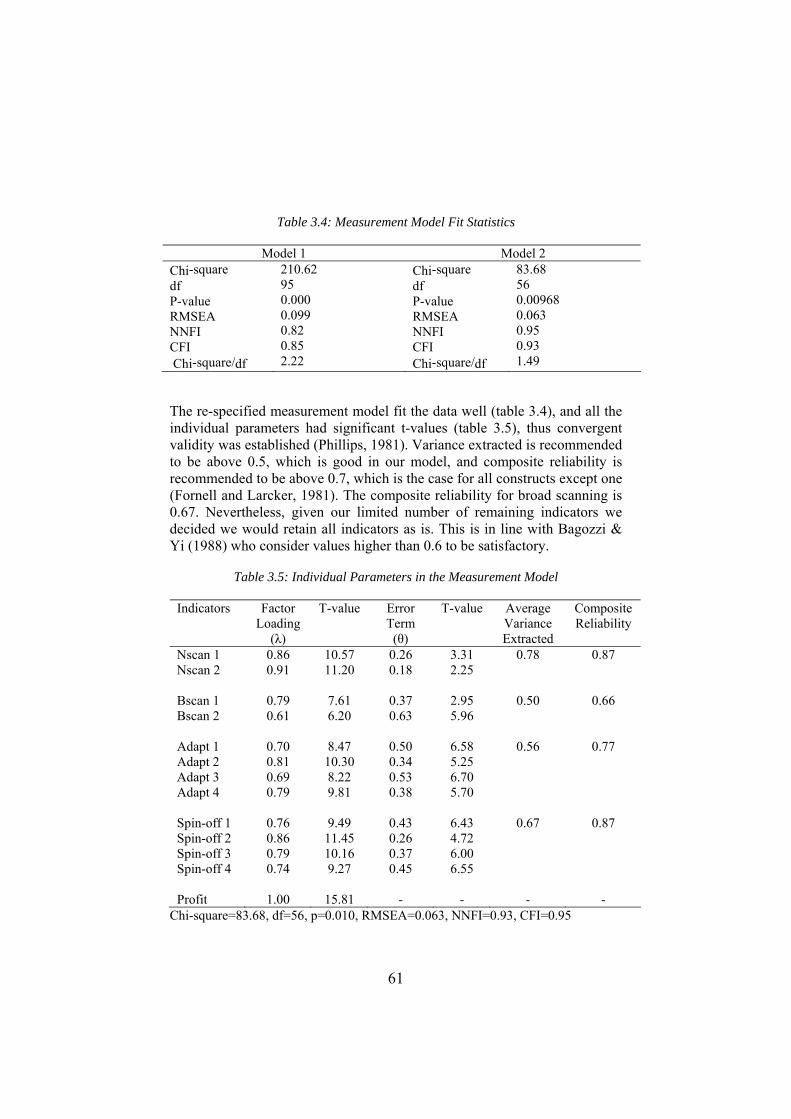
61
Table 3.4: Measurement Model Fit Statistics
Model 1 Model 2 Chi-square df P-value RMSEA NNFI CFI Chi-square/df
210.62 95 0.000 0.099 0.82 0.85 2.22
Chi-square df P-value RMSEA NNFI CFI Chi-square/df
83.68 56 0.00968 0.063 0.95 0.93 1.49
The re-specified measurement model fit the data well (table 3.4), and all the individual parameters had significant t-values (table 3.5), thus convergent validity was established (Phillips, 1981). Variance extracted is recommended to be above 0.5, which is good in our model, and composite reliability is recommended to be above 0.7, which is the case for all constructs except one (Fornell and Larcker, 1981). The composite reliability for broad scanning is 0.67. Nevertheless, given our limited number of remaining indicators we decided we would retain all indicators as is. This is in line with Bagozzi & Yi (1988) who consider values higher than 0.6 to be satisfactory.
Table 3.5: Individual Parameters in the Measurement Model
Indicators Factor
Loading (λ)
T-value Error Term
(θ)
T-value Average Variance Extracted
Composite Reliability
Nscan 1 0.86 10.57 0.26 3.31 0.78 0.87 Nscan 2 0.91 11.20 0.18 2.25 Bscan 1 0.79 7.61 0.37 2.95 0.50 0.66 Bscan 2 0.61 6.20 0.63 5.96 Adapt 1 0.70 8.47 0.50 6.58 0.56 0.77 Adapt 2 0.81 10.30 0.34 5.25 Adapt 3 0.69 8.22 0.53 6.70 Adapt 4 0.79 9.81 0.38 5.70 Spin-off 1 0.76 9.49 0.43 6.43 0.67 0.87 Spin-off 2 0.86 11.45 0.26 4.72 Spin-off 3 0.79 10.16 0.37 6.00 Spin-off 4 0.74 9.27 0.45 6.55 Profit 1.00 15.81 - - - -
Chi-square=83.68, df=56, p=0.010, RMSEA=0.063, NNFI=0.93, CFI=0.95
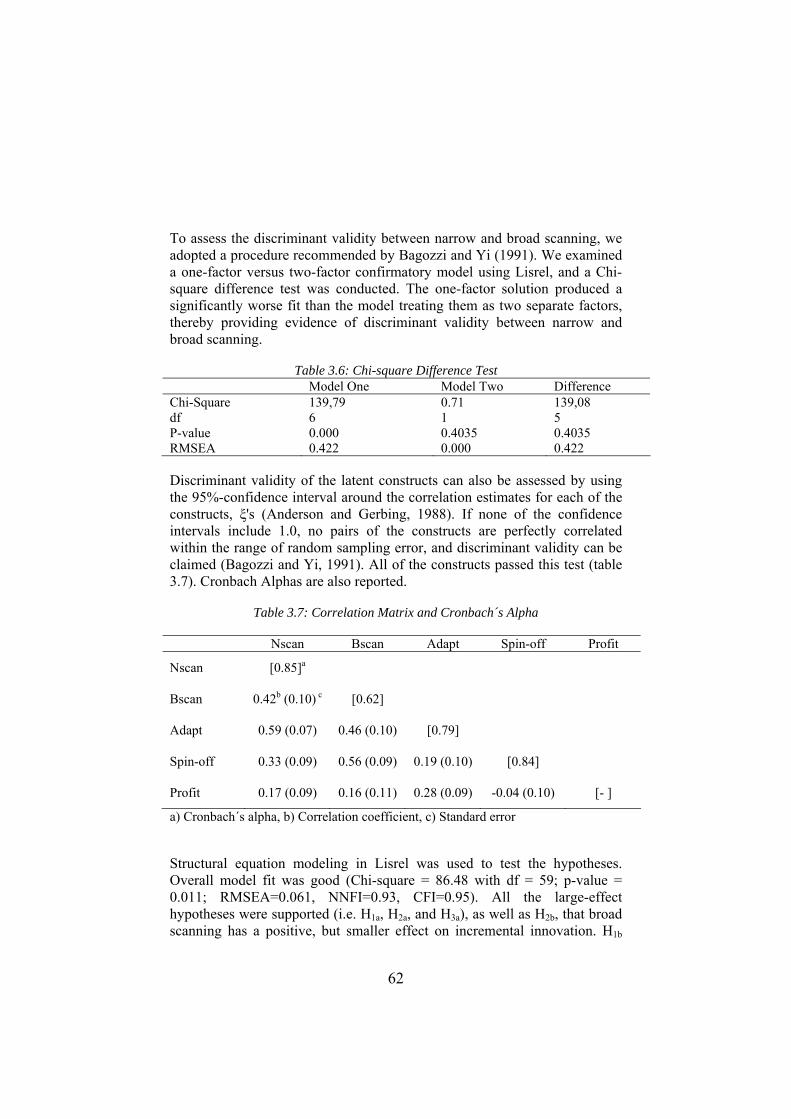
62
To assess the discriminant validity between narrow and broad scanning, we adopted a procedure recommended by Bagozzi and Yi (1991). We examined a one-factor versus two-factor confirmatory model using Lisrel, and a Chi-square difference test was conducted. The one-factor solution produced a significantly worse fit than the model treating them as two separate factors, thereby providing evidence of discriminant validity between narrow and broad scanning.
Table 3.6: Chi-square Difference Test Model One Model Two Difference Chi-Square 139,79 0.71 139,08 df 6 1 5 P-value 0.000 0.4035 0.4035 RMSEA 0.422 0.000 0.422
Discriminant validity of the latent constructs can also be assessed by using the 95%-confidence interval around the correlation estimates for each of the constructs, ξ's (Anderson and Gerbing, 1988). If none of the confidence intervals include 1.0, no pairs of the constructs are perfectly correlated within the range of random sampling error, and discriminant validity can be claimed (Bagozzi and Yi, 1991). All of the constructs passed this test (table 3.7). Cronbach Alphas are also reported.
Table 3.7: Correlation Matrix and Cronbach´s Alpha
Nscan Bscan Adapt Spin-off Profit
Nscan [0.85]a
Bscan 0.42b (0.10) c [0.62]
Adapt 0.59 (0.07) 0.46 (0.10) [0.79]
Spin-off 0.33 (0.09) 0.56 (0.09) 0.19 (0.10) [0.84]
Profit 0.17 (0.09) 0.16 (0.11) 0.28 (0.09) -0.04 (0.10) [- ]
a) Cronbach´s alpha, b) Correlation coefficient, c) Standard error Structural equation modeling in Lisrel was used to test the hypotheses. Overall model fit was good (Chi-square = 86.48 with df = 59; p-value = 0.011; RMSEA=0.061, NNFI=0.93, CFI=0.95). All the large-effect hypotheses were supported (i.e. H1a, H2a, and H3a), as well as H2b, that broad scanning has a positive, but smaller effect on incremental innovation. H1b

63
and H3b were not significant, meaning we did not detect even a weak effect between narrow scanning on spin-off knowledge, or spin-off knowledge on profitability. One plausible explanation is that the hypothesized small effects in combination with a relatively small sample size (n = 126) led to low power in the model, thus the insignificant results. Alternatively, the effects do not exist.
Table 3.8: Results: Structural Model
Proposed
Relationship Loading T-value Conclusion
H1a: Nscan → Adapt
H1b: Nscan → Spin-off
+
+
0.49
0.13
4.27
1.16
Supported
Not Supported
H2a: Bscan → Spin-off
H2b: Bscan → Adapt
+
+
0.48
0.23
3.43
2.05
Supported
Supported
H3a: Adapt → Profit
H3b: Spin-off → Profit
+
+
0.30
-0.10
2.93
-1.06
Supported
Not Supported
Chi-square=86.48, df=59, p-value=0.011, RMSEA=0.061, CFI=0.95, NNFI=0.93 3.6 Implications We have developed a theoretical model encompassing the outcomes of narrow and broad market scanning; defined short-term and long-term outcomes; and tested the model on data from the hotel industry. The reported findings support our argument that narrow and broad scanning each affect the new service development process in a unique way. Narrow scanning has a strong positive effect on profitability through incremental service adaptation; broad scanning has a weak, but significant effect on profitability through incremental service adaptation, and broad scanning positively influences spin-off knowledge. Although we did not find a significant relationship between spin-off knowledge and profitability, there is strong evidence in the literature that discontinuous innovation can lead to sustainable competitive advantage and substantial profits (Chandy and Tellis, 1998; Geroski et al., 1993; Wind and Mahajan, 1997). We believe

64
that spin-off knowledge is comparable to the constructs of absorptive capacity (Cohen and Levinthal, 1990) and transformative capacity (Garud and Nayyar, 1994), operating in a similar manner with a positive effect on profitability. Within the confines of the selected methodology, we believe our findings have implications for how service managers should address narrow and broad market scanning. There may be a danger that service firms, by being inherently market oriented (Atuahene-Gima, 1996), are trapped in cycles of incremental innovation (Gatignon and Xuereb, 1997). The underlying logic is that many services are performed in concert with customers in real time (de Brentani, 2001; Lovelock, 2001), creating an inseparability between provider and customer. Service development is a natural extension of the interaction because services are often customized for each service encounter (de Brentani, 2001). Through interaction, firms and people adapt to each other (Hallén et al., 1991), conforming to the norms in their environments (Martinez, 1999). This isomorphism means that constructive conflict may drop (Eisenhardt et al., 1997), as value systems converge and the parties develop a common identity (Gaertner et al., 1996). This reduces the ability to be objective within the relationship, diminishing the capacity to question assumptions upon which actions are based (Moorman et al., 1992). There will be an overall decline in innovative processes found in more heterogeneous groups (Selnes and Sallis, 2003). The outcome is that service firms excel at reactive market orientation at the expense of proactive market orientation (Narver et al., 2000). It is encouraging to note that, in line with our findings, closely adapting to customer needs leads to superior performance (Atuahene-Gima, 1995; Baker and Sinkula, 1999; Narver et al., 2000). However, service managers must distinguish between short-term and long-term performance. Adapting to customers to the exclusion of exploring new opportunities threatens long-term viability (March, 1991). From a strategic perspective, narrow scanning is part of the natural operational effectiveness of service firms. All service firms do it to some degree, so relative performance is related to how well they do it. However, these sorts of best practices diffuse rapidly (Porter, 1996), especially for service firms (de Brentani, 2001). Broad screening, conversely, does not happen by default, and may actually be relatively difficult for service firms. However, becoming proficient at broad screening has the potential for building superior sustainable profits (Wind and Mahajan, 1997).
The advice is, as with inter-organizational learning (Hamel, 1991), service firms need to scan their markets by design, not default. Without conscious

65
attention to scanning activities, service firms are likely to forego the potential benefits of broad scanning. For higher-order learning and discontinuous innovation, service firms need to consciously avoid the incremental innovation trap (McKee, 1992).
A limitation of our study, which translates to an important avenue for future research, would be to develop a better measure of discontinuous innovation. While we believe in the theoretical rationale of our measure, we obviously had difficulty in empirically demonstrating the relationship. It is difficult to reconcile the potentially large temporal distance between broad scanning and profitability. While broad scanning may be assumed to have a general positive impact on profitability in the long run, actually demonstrating the link in a cross-sectional study is dubious. In addition, service managers perceive that pioneering discontinuous innovations may not be an advantage in terms of profitability because of low first-mover advantages (Song et al., 2000). Regarding the link between narrow scanning and spin-off knowledge, hotels are very dependent on locality and surrounding, thus narrow scanning is likely to be concentrated on local adaptation. It may be that in branches with less static boundaries the link between narrow scanning and spin-off knowledge is significant. Our logic is that with less static boundaries there is likely to be greater variety in knowledge gained from narrow scanning, thus increasing the chances of contributing to spin-off knowledge. This would be valuable to explore in future research.

66
3.7 References Adams, M. E., Day, G. S. and Dougherty, D. (1998) "Enhancing New
Product Development Performance: An Organizational Learning Perspective", Journal of Product Innovation Management, Vol. 15, No. 5, pp. 403-422.
Anderson, E. W., Fornell, C. and Lehmann, D. R. (1994) "Customer
Satisfaction, Market Share, and Profitability: Findings from Sweden", Journal of Marketing, Vol. 58, No. 3, pp. 53-66.
Anderson, J. C. and Gerbing, D. W. (1988) "Structural Equation Modeling in
Practice: A Review and Recommended Two-Step Approach", Psychological Bulletin, Vol. 103, No. 3, pp. 411-423.
Armstrong, J. S. and Overton, T. S. (1977) "Estimating Nonresponse Bias in
Mail Surveys." Journal of Marketing Research, Vol. 14, No. 3, pp. 396-402.
Atuahene-Gima, K. (1995) "An Exploratory Analysis of the Impact of
Market Orientation on New Product Performance: A Contingency Approach", Journal of Product Innovation Management, Vol. 12, No. 4, pp. 275-293.
Atuahene-Gima, K. (1996) "Market Orientation and Innovation." Journal of
Business Research, Vol. 35, No. 2, pp. 93-104. Atuahene-Gima, K. (2003) "The Effects of Centrifugal and Centripetal
Forces on Product Development Speed and Quality: How Does Problem Solving Matter?" Academy of Management Journal, Vol. 46, No. 3, pp. 359-373.
Bagozzi, R. P. and Yi, Y. (1988) "On the Evaluation of Structural Equation
Models", Journal of the Academy of Marketing Science, Vol. 16, No. 1, pp. 74-94.
Bagozzi, R. P. and Yi, Y. (1991) "Assessing Construct Validity in
Organizational Research", Administrative Science Quarterly, Vol. 36, No. 3, pp. 421-458.

67
Baker, W. E. and Sinkula, J. M. (1999) "The Synergistic Effect of Market Orientation and Learning Orientation on Organizational Performance", Journal of the Academy of Marketing Science, Vol. 27, No. 4, pp. 411-427.
Bartlett, C. A. (1996a) Mckinsey & Company: Managing Knowledge and
Learning, Harvard Business School Publishing, Cambridge, MA. Bartlett, C. A. (1996b) Mckinsey & Company: Managing Knowledge and
Learning: Teaching Note, Harvard Business School Publishing, Cambridge, MA.
Berthon, P., Hulbert, J. M. and Pitt, L. F. (1999) "To Serve or Create?
Strategic Orientations toward Customers and Innovation", California Management Review, Vol. 42, No. 1, pp. 37-58.
Best, R. J. (2005) Market-Based Management: Strategies for Growing
Customer Value and Profitability, Prentice-Hall, Upper Saddle River, N.J.
Chandy, R. K. and Tellis, G. J. (1998) "Organizing for Radical Product
Innovation: The Overlooked Role of Willingness to Cannibalize", Journal of Marketing Research, Vol. 35, No. 4, pp. 474-487.
Christensen, C. M. and Bower, J. L. (1996) "Customer Power, Strategic
Investment, and the Failure of Leading Firms", Strategic Management Journal, Vol. 17, No. 3, pp. 197-219.
Cohen, W. M. and Levinthal, D. A. (1990) "Absorptive Capacity: A New
Perspective on Learning and Innovation", Administrative Science Quarterly, Vol. 35, No. 1, pp. 128-152.
Connor, T. (1999) "Customer-Led and Market-Oriented: A Matter of Balance", Strategic Management Journal, Vol. 20, No. 12, pp. 1157-1163.
Contractor, F. J., Kundu, S. K. and Hsu, C.-C. (2003) "A Three-Stage
Theory of International Expansion: The Link between Multinationality and Performance in the Service Sector", Journal of International Business Studies, Vol. 34, No. 1, pp. 5-18.
Cooper, R. G. (1994) "New Products: The Factors That Drive Success",
International Marketing Review, Vol. 11, No. 1, pp. 60-76. Cooper, R. G. and Kleinschmidt, E. J. (1987) "New Products: What
Separates Winners from Losers?" Journal of Product Innovation Management, Vol. 4, No. 3, pp. 169-184.

68
Dalgic, T. (1998) "Dissemination of Market Orientation in Europe: A
Conceptual and Historical Evaluation", International Marketing Review, Vol. 15, No. 1, pp. 45-60.
Darroch, J. and McNaughton, R. (2003) "Beyond Market Orientation:
Knowledge Management and the Innovativeness of New Zealand Firms", European Journal of Marketing, Vol. 37, No. 3/4, pp. 572-593.
Day, G. S. (1990) Market Driven Strategy, Free Press, New York, NY. Day, G. S. (1994) "The Capabilities of Market Driven Organizations",
Journal of Marketing, Vol. 58, No. 4, pp. 37-52. de Brentani, U. (2001) "Innovative Versus Incremental New Business
Services: Different Keys for Achieving Success." Journal of Product Innovation Management, Vol. 18, No. 3, pp. 169-187.
Eisenhardt, K. M., Kahwajy, J. L. and Bourgeois, L. J. I. (1997) "Conflict
and Strategic Choice: How Top Management Teams Disagree", California Management Review, Vol. 39, No. 2, pp. 42-62.
Erramilli, M. K. and Rao, C. P. (1990) "Choice of Foreign Market Entry
Modes by Service Firms: Role of Market Knowledge", Management International Review, Vol. 30, No. 2, pp. 135-151.
Fahy, J., Hooley, G., Cox, T., Beracs, J., Fonfara, K. and Snoj, B. (2000)
"The Development and Impact of Marketing Capabilities in Central Europe", Journal of International Business Studies, Vol. 31, No. 1, pp. 63-81.
Fornell, C. and Larcker, D. F. (1981) "Evaluating Structural Equation
Models with Unobservable Variables and Measurement Error", Journal of Marketing Research, Vol. 18, No. 1, pp. 39-50.
Gaertner, S. L., Dovidio, J. F. and Bachman, B. A. (1996) "Revisiting the
Contact Hypothesis: The Induction of a Common Group Identity", International Journal of Intercultural Relations, Vol. 20, No. 3-4, pp. 271-290.
Garud, R. and Nayyar, P. R. (1994) "Transformative Capacity: Continual
Structuring by Intertemporal Technology Transfer", Strategic Management Journal, Vol. 15, No. 5, pp. 365-385.

69
Gatignon, H. and Xuereb, J.-M. (1997) "Strategic Orientation of the Firm and New Product Performance", Journal of Marketing Research, Vol. 34, No. 1, pp. 77-90.
Geroski, P., Machin, S. and Van Reenen, J. (1993) "The Profitability of
Innovating Firms", RAND Journal of Economics, Vol. 24, No. 2, pp. 198-211.
Gray, B. J. and Hooley, G. J. (2002) "Market Orientation and Service Firm
Performance - a Research Agenda", European Journal of Marketing, Vol. 36, No. 9/10, pp. 980-988.
Griffin, A. and Page, A. L. (1993) "An Interim Report on Measuring Product
Development Success and Failure", Journal of Product Innovation Management, Vol. 10, No. 4, pp. 291-308.
Griffin, A. and Page, A. L. (1996) "Pdma Success Measurement Project:
Recommended Measures for Product Development Success and Failure", Journal of Product Innovation Management, Vol. 13, No. 6, pp. 478-496.
Grönroos, C. (1999) "Internationalization Strategies for Services", Journal of
Services Marketing, Vol. 13, No. 4/5, pp. 290-297. Grönroos, C. (2000) Service Management and Marketing: A Customer
Relationship Management Approach, Wiley, Chichester. Hair, J. F. J., Anderson, R. E., Tatham, R. L. and Black, W. C. (1998)
Multivariate Data Analysis with Readings, Macmillan Publishing Company, New York, NY.
Håkansson, H. and Snehota, I. (1989) "No Business Is an Island: The
Network Concept of Business Strategy", Scandinavian Journal of Management, Vol. 5, No. 3, pp. 187-200.
Hallén, L., Johansen, J. and Seyed-Mohamed, N. (1991) "Interfirm
Adaptation in Business Relationships", Journal of Marketing, Vol. 55, No. 2, pp. 29-37.
Hamel, G. (1991) "Competition for Competence and Interpartner Learning
within International Strategic Alliances", Strategic Management Journal, Vol. 12, No. 4, pp. 83-103.
Han, J. K., Kim, N. and Srivastava, R. K. (1998) "Market Orientation and
Organizational Performance: Is Innovation a Missing Link?" Journal of Marketing, Vol. 62, No. 4, pp. 30-45.

70
Hooley, G., Fahy, J., Greenley, G., Beracs, J., Fonfara, K. and Snoj, B.
(2003) "Market Orientation in the Service Sector of the Transition Economies of Central Europe", European Journal of Marketing, Vol. 37, No. 1/2, pp. 86-106.
Huber, G. P. (1991) "Organizational Learning: The Contributing Processes
and the Literatures", Organization Science, Vol. 2, No. 1, pp. 88-115. Hurley, R. F. and Hult, G. T. M. (1998) "Innovation, Market Orientation,
and Organizational Learning: An Integration and Empirical Examination", Journal of Marketing, Vol. 62, No. 3, pp. 42-54.
Jaworski, B. J. and Kohli, A. K. (1996) "Market Orientation: Review,
Refinement, and Roadmap", Journal of Market Focused Management, Vol. 1, No. 119-135.
Johannessen, J.-A., Olsen, B. and Olaisen, J. (1997) "Organizing for
Innovation", Long Range Planning, Vol. 30, No. 1, pp. 96-109. Johanson, J. and Mattsson, L.-G. (1987) "Interorganizational Relations in
Industrial Systems: A Network Approach Compared with the Transaction-Cost Approach", International Studies of Management and Organization, Vol. 17, No. 1, pp. 34-48.
Kleinschmidt, E. J. and Cooper, R. G. (1991) "The Impact of Product
Innovativeness on Performance", Journal of Product Innovation Management, Vol. 8, No. 4, pp. 240-251.
Lado, N., Maydeu-Olivares, A. and Rivera, J. (1998) "Measuring Market
Orientation in Several Populations", European Journal of Marketing, Vol. 32-39, No. 1/2, pp. 23.
Lafferty, B. A. and Hult, G. T. M. (2001) "A Synthesis of Contemporary
Market Orientation Perspectives", European Journal of Marketing, Vol. 35, No. 1/2, pp. 92-109.
Li, T. and Calantone, R. J. (1998) "The Impact of Market Knowledge
Competence on New Product Advantage: Conceptualization and Empirical Examination." Journal of Marketing, Vol. 62, No. 4, pp. 13-29.
Looy, B. v., Gemmel, P. and Dierdonck, R. v. (2003) Services Management:
An Integrated Approach, Financial Times Prentice Hall, Harlow.

71
Lovelock, C. H. (2001) Services Marketing, Prentice Hall International, Upper Saddle River, N.J.
March, J. G. (1991) "Exploration and Exploitation in Organizational
Learning", Organizational Science, Vol. 2, No. 1, pp. 71-87. Martinez, R. J. (1999) "Efficiency Motives and Normative Forces:
Combining Transaction Cost and Institutional Logic", Journal of Management, Vol. 25, No. 1, pp. 75-96.
Matear, S., Osborne, P., Garrett, T. and Gray, B. J. (2002) "How Does
Market Orientation Contribute to Service Firm Performance? An Examination of Alternative Mechanisms", European Journal of Marketing, Vol. 36, No. 9/10, pp. 1058-1075.
McKee, D. (1992) "An Organizational Learning Approach to Product
Innovation", Journal of Product Innovation Management, Vol. 9, No. 3, pp. 232-245.
Menon, A. and Varadarajan, P. R. (1992) "A Model of Marketing
Knowledge Use within Firms." Journal of Marketing, Vol. 56, No. 4, pp. 53-71.
Moorman, C. (1995) "Organizational Market Information Processes:
Cultural Antecedents and New Product Outcomes", Journal of Marketing Research, Vol. 32, No. 3, pp. 318-335.
Moorman, C. and Miner, A. S. (1997) "The Impact of Organizational
Memory on New Product Performance and Creativity", Journal of Marketing Research, Vol. 34, No. 1, pp. 91-106.
Moorman, C., Zaltman, G. and Deshpandé, R. (1992) "Relationships
between Providers and Users of Market Research: The Dynamics of Trust within and between Organizations", Journal of Marketing Research, Vol. 29, No. 3, pp. 314-328.
Mullins, J., Walker, O. C., Boyd, H. W. and Larréché, J.-C. (2005)
Marketing Management: A Strategic Decision-Making Approach, McGraw-Hill/Irwin, London.
Narver, J. C., Jacobson, R., Slater, S. F. and MacLachlan, D. L. (1993)
"Market Orientation and Business Performance: An Analysis of Panel Data", Marketing Science Institute Working Paper Series, Vol., No. 93-121, pp. 1-21.

72
Narver, J. C. and Slater, S. F. (1990) "The Effect of Market Orientation on Business Profitability", Journal of Marketing, Vol. 54, No. 4, pp. 20-35.
Narver, J. C., Slater, S. F. and MacLachlan, D. L. (2000) "Total Market
Orientation, Business Performance, and Innovation", Marketing Science Institute Working Paper Series, Vol., No. 00-116, pp. 1-33.
Olson, E. M., Walker Jr., O. C. and Ruekert, R. W. (1995) "Organizing for
Effective New Product Development: The Moderating Role of Product Innovativeness", Journal of Marketing, Vol. 59, No. 1, pp. 48-62.
Phillips, L. W. (1981) "Assessing Measurement Error in Key Informant
Reports: A Methodological Note on Organizational Analysis in Marketing", Journal of Marketing Research, Vol. 18, No. 4, pp. 395-415.
Porter, M. E. (1996) "What Is Strategy?" Harvard Business Review, Vol. 74,
No. 6, pp. 61-78. Ranchhod, A. (2004) Marketing Strategies: A Twenty-First Century
Approach, Prentice Hall, London. Sandvik, K. (1998) The Effects of Market Orientation, The Norwegian
School of Economics and Business Administration, Bergen. Selnes, F. and Sallis, J. (2003) "Promoting Relationship Learning", Journal
of Marketing, Vol. 67, No. 3, pp. 80-95. Slater, S. F. and Narver, J. C. (1998) "Customer-Led and Market-Oriented:
Let's Not Confuse the Two", Strategic Management Journal, Vol. 19, No. 10, pp. 1001-1006.
Slater, S. F. and Narver, J. C. (1999) "Market-Oriented Is More Than Being
Customer-Led", Strategic Management Journal, Vol. 20, No. 12, pp. 1165-1168.
Song, X. M., di Benedetto, C. A. and Song, L. Z. (2000) "Pioneering
Advantage in New Service Development: A Multi- Country Study of Managerial Perceptions", Journal of Product Innovation Management, Vol. 17, No. 5, pp. 378-392.
Song, X. M., Di Benedetto, C. A. and Zhao, Y. L. (1999) "Pioneering
Advantages in Manufacturing and Service Industries: Empirical Evidence from Nine Countries", Strategic Management Journal, Vol. 20, No. 9, pp. 811-836.

73
Song, X. M. and Montoya-Weiss, M. M. (1998) "Critical Development Activities for Really New Versus Incremental Products", Journal of Product Innovation Management, Vol. 15, No. 2, pp. 124-135.
Song, X. M. and Parry, M. E. (1997) "A Cross-National Comparative Study
of New Product Development Processes: Japan and the United States", Journal of Marketing, Vol. 61, No. 4, pp. 1-18.
Song, X. M., Souder, W. E. and Dyer, B. (1997) "A Causal Model of the
Impact of Skills, Synergy, and Design Sensitivity on New Product Performance", Journal of Product Innovation Management, Vol. 14, No. 2, pp. 88-101.
Souder, W. E. and Jenssen, S. A. (1999) "Management Practices Influencing
New Product Success and Failure in the United States and Scandinavia: A Cross-Cultural Comparative Study", Journal of Product Innovation Management, Vol. 16, No. 2, pp. 183-203.
Weerawardena, J. (2003) "Exploring the Role of Market Learning Capability
in Competitive Strategy", European Journal of Marketing, Vol. 37, No. 3/4, pp. 407-429.
Wind, J. and Mahajan, V. (1997) "Issues and Opportunities in New Product
Development: An Introduction to the Special Issue", Journal of Marketing Research, Vol. 34, No. 1, pp. 1-12.
Yap, C. M. and Souder, W. E. (1994) "Factors Influencing New Product
Success and Failure in Small Entrepreneurial High-Technology Electronics Firms", Journal of Product Innovation Management, Vol. 11, No. 5, pp. 418-432.

74

75
4. Outsourcing New Product Development: Exploring the Effects on the NPD Process19
4.0 Abstract New product development (NPD) is vital for all companies. Previous research indicates that the success of new products is dependent upon how professionally the development process is performed. In particular, the proficiency of NPD activities has a positive effect on product quality. While the literature indicates that the way NPD is organized is important, very few studies have analyzed to what extent one or more stages in the NPD process may be outsourced. In this study, an in-depth case study in the food production industry in Norway is reported. A comparison is made between one company that is outsourcing part of their NPD process and another company that carries out all the tasks involved "in-house". The inter-organizational solution, where parts of the process are outsourced, is found to create a less efficient NPD process than the "in-house" solution. The outsourcing firm has a better predevelopment process and uses less time on new product development.
19 Co-authored with Professor Geir Gripsrud

76
4.1 Introduction Product development is important. Approximately 50 % of corporate income and revenue come from products that have been in the market for less than 5 years (Cooper, 1994). Product development is inherently risky, since corporations must invest time and money without knowing how successful the new products will be. The failure rate has not changed greatly in the last 25 years and approximately 35 to 45% of all new products still fail (Boulding, Morgan and Staelin, 1997). Due to the importance of new products, all studies that might help to reduce the failure rate are welcome. The NPD process is often described as a sequential linear process consisting of activities from idea generation to product launch. According to Quinn (2000), all of these activities can be outsourced. Despite the fact that NPD and outsourcing represent two of the most important issues facing a firm's management, the effects of outsourcing different parts of NPD have not attracted much attention in the literature so far (Rindfleisch and Moorman, 2001). The most obvious benefit from outsourcing an activity is that the outsourcing company may experience cost reductions due to scale economies and/or get access to unique resources it does not possess itself. Problems associated with outsourcing are related to a potential increase in transaction costs. Transaction cost analysis (TCA) predicts that several problems related to governance are handled more efficiently within the border of a single company. The argument rests upon the assumption that human beings – or at least some of them – are inclined to behave opportunistically. A hierarchy allows ideally the employer to control and correct such behavior. An alternative view may be to focus upon the type of governance structure that motivates effort and creativity. It is not evident that an authority relationship (“hierarchy”) is the most stimulating one in this respect. The paper reports an in-depth case study in the food production industry in Norway. The case is limited to two organizations, TINE and Fjordland. TINE conducts all NPD activities “in-house”, while Fjordland is outsourcing its technical development activities to TINE. This means that the two companies utilize the same people and have access to the same facilities in their technical product development. Thus, there is no difference concerning scale economies between the two companies at this stage of the process. TINE owns a major share of Fjordland, but Fjordland is still a separate company and cannot rely upon a hierarchy to govern the transactions involved. A traditional interpretation of TCA indicates that product development conducted for the external company (Fjordland) is the most inefficient due to lack of ability to control opportunistic behavior. An

77
alternative outcome is that employees are more motivated by working for an external client and thus perform better in this case. To investigate this issue a number of specific product development projects in the two companies have been analyzed and compared. The focus is on how outsourcing seems to affect predevelopment activities and time-to-market. The paper proceeds as follows: First, a brief review of the NPD literature is presented and outsourcing as a strategic option is discussed. Based upon this review, relevant research questions are derived. Second, the case is described and our empirical observations reported. In the third section, the findings are analyzed while the implications, as well as the limitations of these findings, are discussed in the final section of the paper. 4.2 New Product Development (NPD) and Outsourcing The NPD process may be divided into three broad stages. The pre-development stage includes the front end of innovations and is often referred to as the Fuzzy Front End. Idea generation, elaboration, and evaluation take place at this stage, as well as business and market opportunity analysis. Technical development is the stage where the physical product is actually designed, built, and tested. The third and last stage in NPD – commercialization - is where the launching of the new product is coordinated, implemented, and monitored. Advertising programs and other marketing activities are important at this stage. Outsourcing means to let external partners undertake activities that could be performed internally (Takeishi, 2001). Often, a cooperative, interdependent, and long-term relationship is established with the external partner. In transaction cost terms, outsourcing means that “hierarchy” is substituted with “market” as the mode of governance. Transaction cost analysis (TCA) seeks to analyze the optimal way of governing various interrelated activities and dates back to the classical question formulated by Coase (1937), regarding the boundaries of a firm. Developed principally by Williamson (1975, 1979, 1985), important determinants of governance structure are transaction specific investments, external and internal uncertainty, as well as the frequency of interactions. The theory also rests upon two important underlying assumptions concerning human nature: 1) an inclination towards opportunistic behavior (“self seeking behavior with guile”) and 2) “bounded rationality”. The transaction costs that arise for different governance modes must be balanced by other considerations. In particular, the resources needed to carry

78
out the relevant activities may not be available within the company. Even if the resources may be bought, lack of scale economies may make an “in-house” solution too expensive to pursue. The choice whether to outsource or not is, therefore, not only dependent upon the transaction costs that arise from different modes of governance. Still, the transaction costs that arise in the “in-house” solution (“hierarchy”) should be compared to the transaction costs associated with an outsourcing solution (“market”). Rindfleisch and Heide (1997) discuss the different types of transaction costs that are relevant and how they are related to the three sources: asset specificity, environmental – and behavioral uncertainty. According to this article, the direct costs include: 1) costs of creating safeguards, 2) communication, negotiation, and coordination costs, and 3) screening and selection costs (ex ante), and measurement costs (ex post). In many cases, the opportunity costs may be more important. They include: 1) failure to invest in productive assets, 2) maladaptation; failure to adapt, and 3) failure to identify appropriate partners (ex ante) and productivity losses through effort adjustments (ex post). We will argue that the failure to conduct efficient new product development creates opportunity costs. To develop new products is one way to adapt to the ever-changing environment, and a failure to conduct an efficient NPD process reduces the opportunities and thereby increases the opportunity costs. Opportunity costs are the expected costs that result when actors fail to perform their tasks (Malone, 1987). The link between governance form and opportunity cost is an interesting topic to study. According to Zajac and Olsen (1993), TCA has focused on ex ante and ex post structural properties, and has not emphasized the process involved. They suggest that interorganizational exchange relationships over time need to be understood primarily in terms of developmental processes (Zajac and Olsen, 1993). Here, this underlying problem in TCA is to be treated as a research opportunity. To explore how in-house development and outsourcing effects the NPD process is the overall goal for this study. The activities in the predevelopment stage are instrumental for the ultimate success or failure of the new product. Song and Parry (1997) report positive and significant correlations between new product success and measures of proficiency in screening, preliminary market assessment, and marketing research. Similar findings, reported by Souder and Jenssen (1999), Song and Montoya-Weiss (1998) and Song, Souder, and Dyer (1997), underscore the importance of careful analyses of customer segments and competitors to determine the desired product features and benefits. Too many projects

79
move, according to Cooper (1999), from the idea stage right into development, with little or no assessment or up-front homework. The result of this "ready, fire, aim" approach is usually disastrous. Research shows that inadequate up-front homework is a major reason for failure (Hopkins, 1980), whereas other studies indicate that solid up-front homework drives up the success rate significantly and improves the financial performance (Cooper, 1998). Concept definition is another important task in the predevelopment phase. It is vital to describe what sort of product you want to develop as early as possible in the process. A failure to define the product – its target market; the concept, benefits and positioning; and its requirements, features and specs - before development begins, is a major cause of new product failure and leads to serious delays in time to market (Cooper and Kleinschmidt, 1990). The fuzziest part of the predevelopment stage is idea development. Studies of this topic show divergent results. Song and Montoya-Weiss (1998) did not find any significant relationship between idea development and product quality. Song and Parry (1997) found - contrary to what they expected - a negative correlation between the two variables. Still, results reported by Goldenberg, Lehmann, and Mazursky (2001) indicate that following a trend and mental invention tends to be associated with failure, while need and solution spotting tends to predict success. Koen et al. (2001) emphasize that the predevelopment phase presents one of the greatest opportunities for improving the overall innovation process. According to these authors, there has been relatively little research to date on best practice for the front end. Many of the practices carried out during the NPD process do not apply to the front end since the nature of the work is fundamentally different in the predevelopment phase. The front end is experimental, often chaotic and difficult to plan, while the rest of the NPD process is structured, disciplined, and goal-oriented (Koen et al, 2001). While the importance of the various predevelopment activities seems well documented in the literature, less is known about the factors that influence the way these activities are performed. If a decision initially has been made that the technical development of the new product shall be left to an outside partner, this fact may promote the efficiency of the predevelopment activities. At least, it is not unreasonable to assume that such a decision will affect predevelopment activities in one way or the other. This leads to the following research question:

80
Research Question 1: How does outsourcing of technical development affect predevelopment activities? “Time-to-market”, according to the outsourcing literature, is one of the success factors20 for the NPD process that is affected by governance form. Strategically, outsourcing decreases the company's design-cycle times, as multiple best-in-class suppliers work simultaneously on individual components of the system. Each supplier can have more personnel depth and sophisticated technical knowledge about a specific area and also support more specialized facilities for higher quality than the coordinating company might possibly achieve alone (Quinn and Hilmer, 1994). Outsourcing reduces the need to delay projects based on availability of resources, which improves scheduling and reduces time to market. While these findings may be expected in a situation where a number of companies specialize on individual components, the effect of outsourcing on “time-to-market” is less clear when a single supplier of technical development is being used. The next research question may be stated in the following way: Research question 2: How does outsourcing of technical development affect time-to-market? 4.3 The case In this study, an in-depth case study in the food production industry in Norway is reported. A comparison is made between one company that is outsourcing part of their NPD process and another company that carries out all the tasks involved "in-house". Case studies provide unique means of developing theory by utilizing in-depth insights of empirical phenomena. In this specific study, a single case consisting of two firms was investigated. These two firms had access to the same people and facilities, but varied according to governance form, which made the case very well suited for what we wanted to investigate. Interviews with 12 key people were conducted. We talked with people in charge of R&D and marketing, but also people working hands-on with the 20 NPD studies indicate divergent results. Some studies indicate that the sooner the product is on the market, the better (Cooper, 1994). Several studies of PIMS (profit impact of market strategies) databases show that mean market shares over a large cross section of business are higher for market pioneers than for followers. Others like Tellis and Golder (1996) are more skeptical. According to them many pioneers fail, while most current leaders are not pioneers.

81
project, like project- and production managers. One of the main sources of information was all the written material we got access to. General NPD process prescriptions were studied as well as documents including different project reports and saved e-mails. The case was limited to two organizations, TINE and Fjordland. TINE is the sales and marketing organization for Norway's dairy cooperative and is responsible for product development, quality assurance, production and distribution planning, marketing and the export of TINE products. The Dairy Cooperative is Norway's largest food industry with a total of 5300 employees and an annual turnover of 11.1 billion NOK. Fjordland was established in 1994 by the Norwegian Dairy Cooperative and is today partly owned by TINE (49%). The company had a turnover in 2000 of NOK 375 million, is located in Oslo and has 60 employees. Fjordland's corporate mission is to develop product ideas mainly based on the owners' raw materials, and to create values through product-development, branding, and sales. While TINE conducts all development and production "in-house", Fjordland outsources these activities to TINE. All R&D activities for both TINE and Fjordland projects are conducted at TINE Voll. TINE Voll, located on the West Coast of Norway, is one of two R&D facilities within TINE. To be able to compare the NPD processes conducted in-house with the ones outsourced, the relevant units are the different departments in TINE. TINE Market and TINE R&D, which are the departments studied in TINE, are approximately the same size as Fjordland. Fjordland is basically a marketing organization, comparable in many ways to TINE Market. Fjordland and TINE Market are both located in Oslo, geographically far away from TINE Voll. TINE Market is the market department in TINE, and most of the project managers in NPD teams are located here. It is the interface between TINE Market and TINE R&D on the one hand, and the interface between Fjordland and TINE R&D on the other hand, that has been studied. We have investigated six NPD projects. Four of the projects were internally organized by TINE, while two of the projects were organized by Fjordland and the technical development was outsourced to TINE. The projects studied in TINE were the development of a cheesecake, a new dessert and two different new drinks based on milk. In Fjordland, we studied two margarine projects. One was the development of a light margarine with omega 3 acid, while the other was the development of a fluid margarine. The projects were approximately at the same “product newness” level.

82
Figure 4.1: Illustration of the Case Studied To analyze the data material in-depth we have concentrated on two projects, the TINE cheesecake project and the fluid margarine project from Fjordland. The cheesecake project had a manager from R&D, and was carried out by a team of eight persons from different departments in TINE (market, R&D, catering, economy, logistic, packaging, and one of the regional dairies). This team reported to the board of product development in TINE at given "stage gates". A cross-sectional team of five persons conducted the fluid margarine project at Fjordland. Employees from both TINE and Fjordland, and from different departments (R&D and market) took part in the project. The project leader was hired as such, but her background was from R&D. Also, this team had to report to a product development board. The cheesecake team developed a portion packed two layer cheesecake with a toping of orange or strawberry, while the Fjordland team's mission was to develop a margarine that stayed fluid when refrigerated. Both the cheesecake and the fluid margarine were launched in 2001.
TINE R&D * * * * *
Market* * Production * *
Fjordland * * *
* Key informant Project

83
Figure 4.2: Picture of the TINE Cheesecake and the fluid margarine from Fjordland
People involved in these projects spent a lot of time describing the whole process to us, and in addition we got access to various types of written material. Pre-development reports, project reports and evaluation reports, plans for progression and decisions, minutes from meetings and saved e-mails concerning the projects were all studied in detail. At first glance, the content of the predevelopment phase seemed quite similar for the two companies. Screening of the market and the available technology, as well as assessment of risk and investments needed, were conducted in both organizations. A closer look, however, revealed some interesting differences.
The greatest difference between TINE and Fjordland are the sharp product definition activities conducted by Fjordland (TINE).
Fjordland concentrates on the product that is to be developed, while TINE presents thoughts according to product portfolio, price level, communication and distribution. This makes Fjordland’s description of the product more comprehensive. Fjordland presents both physical features, sensory features and features for use, while TINE only comments on the product portfolio.

84
Table 4.1: Product specifications in the predevelopment phase.
TINE Cheesecake Fjordland Flytende Bremykt A fluid margarine
Portion packed fresh cheesecake, approx. 125 g 2 variants: Cheesecake with lemon taste, bottom of crackers/butter Cheesecake natural, or e.g. pineapple taste (not yet decided), bottom of crackers/butter Cheesecake, round whole form, 16 cm. Diameter 1 variant: Cheesecake with lemon taste, or natural on bottom of crackers/butter. Cream cheese base, approx. 600 gr. in ½ liter cups: 1 variant: Natural (Recipe for a bottom and advice for taste admixture and ornaments must be printed on the cup and/or in a brochure)
Physical features: "Flytende Bremykt" is to be fluid at refrigerator temperature. The product is to be used for frying and must therefore be stable at high temperatures. The product ought to be without trans fat acid, and with a law peroxide number. Salt approx. 1,3%. As little admixtures as possible. Durability at least 3 months. Sensory features: Appearance: thick fluid, light yellow color (looks like egg custard) Consistence: Thick fluid, homogeneous Smell/taste: Butter taste and aroma Features for use: - Suitable for frying (brown color
when fried) - Very suitable for baking (Experience
with the mixture of vegetable oil and milk fat has shows good baking abilities.)
Early product conceptualization is apparently very important in Fjordland. In the product specification presented above Fjordland has a much more detailed description than TINE.
Conceptualization is something we have to do, but it can be painful. You don't know exactly what you want, and then you have to describe it. We try to be strict with ourselves to manage to launch the product on time. To be able to do that, we need to define the product. (Fjordland)
This early product definition is probably why many of the respondents perceive Fjordland as better than TINE in the predevelopment phase. It takes much more time to finish a project when the product lacks a sharp, stable, and clear definition (Cooper, 1999).

85
Throughout the interviews many of the respondents claimed that Fjordland was better than TINE in generating new ideas.
Fjordland is more thorough than TINE when it gets to idea generation. In TINE idea generation is something that happens once a year. In Fjordland they have a continuous idea generation process. (TINE)
Everyone at Fjordland contributes with new ideas. If an employee has been on holidays and observed something new and relevant for the business, she will present the idea when returning back to work. Such behavior is not as common in TINE. As an example, we were told a story from one of TINE's production facilities that may serve to underline this: One person from R&D was given credit and reward for coming up with a promising new idea. However, after the celebration, nothing more happened. Several years later, after the same person talked with a newly employed person in the market department, the idea was pulled out of the shelves and developed into a new product. They admit at TINE that there are coincidences related to the selection of new project. One half of the projects they are working on today have more or less randomly popped up during the year. Some of the projects were spin-off projects, linked to already existing projects. Other projects resulted from single persons selling their ideas directly to R&D. It seems to be a tendency in TINE towards a random idea generation process. When looking at the project procedures in TINE and Fjordland, further differences were discovered. The first step in Fjordland's procedure is to "gather and evaluate product and concept ideas". This is a continuous process, and new ideas are stored in a database. The first step in TINE's product development procedures is "Pre-development". They do not have a formalized step for evaluation of new ideas.
Up-front homework and especially the product description is much more thorough in Fjordland than in our system. This is of great importance for timeliness. Fjordland skip a lot of trying and failing, and the progress is faster. (TINE)
The predevelopment phase takes much more time in TINE than in Fjordland. In TINE the pre-development report was between 13-36 pages, while in Fjordland this report was 2-3 pages long, and a 14-day project in Fjordland can take as much as half a year in TINE. Instead of carrying out their mandate, which often is to screen market and business opportunities, they leap on to activities that naturally belong in the main development phase. As an example, a new TINE project was initiated during August 2000. Five

86
months later, in January 2001, the project was presented. The predevelopment report was so extensive that it became unnecessary to write a project report. This example is not unique. It took 6 month to write up a pre-development report for another project. The market evaluation, concluding that there was no market for this product, was presented after 600 hours of work was spent on the project, and after the budget had to be expanded. In spite of the fact that no money was to be spent on the project in 2001, more than NOK 100 000,- was used on purchasing market reports. The interviews clearly showed that this is not unusual for TINE. If someone believes in a project, money can be found. Some of the delay in time-to-market might be explained by new persons having to be involved in the project. This was particularly the case for the cheesecake project in TINE. According to TINE R&D, TINE Market changed their opinion throughout the process. The cheesecake went from being a two-layer cake, to a three-layer cake. This change, which was a result of new people in the market department and no clear product concept description, had great consequences for the progress of the process. The project was initiated back in 1997, but the product was not launched before 2002. We were also told that there was a much closer communication between TINE R&D and Fjordland, compared to the one between TINE R&D and TINE Market.
We have much closer communication with Fjordland, both in the pre-development phase, the idea phase, and last but not least in the technical development phase than we have internally in TINE.(TINE)
One explanation for the close communication between the firms was that the outsourcer is dependent on a good relationship with the developer.
We can not demand that TINE R&D produce and develop products for us. We are dependent on a win-win model, where both TINE and Fjordland find the relationship to be fruitful. (Fjordland)
It also seems to be the case that TINE employees behave differently towards actors from "outside" than they do towards internal actors. An employee in TINE R&D stated that Fjordland is perceived as a customer, and customers are prioritized.
We work harder to fulfill their (Fjordland’s) wishes. (TINE)

87
4.4 Discussion This case study shows that the firm that outsources the technical development conducts the predevelopment phase in a superior way. Fjordland's products are clearly defined at an early stage, and the whole pre-development phase takes less time. A clear and early product definition reduces time-to-market according to the existing NPD literature (e.g. Cooper, 1999). The interesting question is if the observed difference can be explained by governance form. The outsourcing literature indicates that outsourcing is an efficient way to develop new products, and that time-to-market will be reduced with external organization. According to the case described above this efficiency can be achieved without multiple suppliers working simultaneously. How can we explain this? One explanation might be that competition, and the external actors' fear of loosing the contract, decreases time-to-market. But in this case there is no real competition. The close financial and historical ties between TINE and Fjordland make it difficult for Fjordland to drop TINE. We propose as an alternative explanation that the actors will behave differently when working with external actors. Before you ask someone outside the firm to do something for you, for example develop a new product, you will define what you want them to do. You will do as much as you can before you hand the product over, since you know you have to pay for the amount of time the external part puts into the project. Within a firm it might be tempting to forward the "problem". It is sometimes hard to define what you want to develop. The R&D department in TINE was frustrated by all the badly described products the market department wanted them to go further with.
They just tell us to develop a new yogurt, without saying what sort of yogurt they want. (TINE R&D about TINE market)
The forwarding of unsolved problems is less likely between firms. In Fjordland it seems they always describe what they want to develop as early as possible in the process, even though this can be hard to do. Another difference concerns how the idea generation process is performed. Fjordland seems to have a much more proficient idea generation process than TINE. Can governance form explain this difference? We find it hard to see a clear link between governance form and idea generation. Why should an internal organizer be less proficient in developing new ideas than an outsourcer? One plausible explanation might be that the outsourcer has more time and effort to spend on what they perceive to be their core business. This is a very hypothetical explanation and other factors like organizational culture and size might as well explain the difference.

88
The last observation from the case is the difference in communication and coordination. According to Sivadas and Dwyer (2000) internal organization increases process capabilities by improved communication and coordination throughout the different NPD steps. They found that internal NPD outperformed alliances on communication and coordination, since there is higher communication frequency and stronger relational norms inside the company than in other inter-firm arrangements. This is, according to our results, not always the case since we observed the contrary. A closer and more frequent communication existed between TINE and Fjordland, than between TINE R&D and TINE Market. An explanation may be that the outsourcer, because they do not have formal control over external actors, use tight communication as a tool to build relationships, and thereby increase informal control. Fjordland wants to integrate TINE R&D as early as possible in the product development process. They want TINE R&D to feel that they own the project, and thereby become committed to the task. TINE R&D perceives this as positive and wishes they had a similar early contact with the market department in TINE. It also seems to be the case that the external client is given priority. To summarize; this study focuses on the process, and extends the structural approach applied by TCA. We observed that different governance forms had different effects on the NPD process. Based on what we observed we propose that an "in-house" solution might create more opportunity costs than an outsourcing solution. The "in-house" solution is perceived as a governance form that gives the firm control over the actors, and thereby it reduces the direct transaction cost related to safeguarding, negotiation, and screening. When motivation and creativity are taken into account the picture becomes more complicated. An in-house solution might not be the most stimulating governance form for developing new products. Even though the two firms had access to the same people and facilities, the actors behaved differently. Less efficient pre-development and a longer time-to-market period characterized the in-house solution. As usual, when conducting case studies the question arises to what extent the findings may be generalized. Two factors are particularly relevant in the context. First, given the different sizes of the two organizations the relative importance of the new products studied clearly differ between Fjordland and TINE. Each of the new products in Fjordland are more important for the company's total sales than the case is in TINE, which have high volume milk products as their major source of income. This fact may influence the differences observed in the NPD processes. Second, TINE is a cooperative, while Fjordland is an investor owned firm (IOF). It might be the case that it is the ownership structure, not the governance form that actually explains the

89
differences in the new product development process between the two organizations. Our findings indicate clear differences between outsourcing and internal governance of the NPD process. In particular, outsourcing may improve the level of proficiency in the pre-development phase and thereby shorten time-to-market. Future research should explore if our findings may be generalized to other companies and industries. If these results are corroborated in other studies it is of great importance for managers.
90
4.5 References Ayers, Doug, Dahlstrom, Robert, and Skinner, Steven J. (1997). An
Exploratory Investigation of Organizational Antecedents to New Product Success. Journal of Marketing Research, 34(Feb), 107-116.
Boulding, William, Morgan, Ruskin and Staelin, Richard (1997): Pulling the
Plug to Stop the New Product Drain: Journal of Marketing Research, 34, 164-176.
Coase, Roland H. (1937). The Nature of the Firm, Economica. 4(Nov): 386-
405 Cooper, Robert G. (1993). Winning at New Products (2nd ed.): Addison-
Wesley, Reading. Cooper, Robert G. (1994). New Products: The Factors that Drives Success,
International Marketing Review, 11: 60-76 Cooper, Robert G. (1998). Benchmarking new product performance: Results
of the best practices study. European Management Journal, 16, 1-17.
Cooper, Robert G. (1999). From Experience. The Invisible Success Factors
in Product Innovation. Journal of Product Innovation Management, 16, 115-133.
Cooper, Robert G., and Kleinschmidt, Elko J. (1990). New Products: The
Key Factors in Success. American Marketing Association, Monograph.
Goldenberg, Jacob, Lehmann, Donald R., and Mazursky, David (2001). The
Idea Itself and the Circumstances of Its Emergence as Predictors of New Product Success. Management Science, 47(1 (Jan)), 69-84.
Hopkins, D. S. (1980). New Product Winners and Losers. Conference Board
Report 773.

91
Koen, Peter, Ajamian, Greg, Burkart, Robert, Clamen, Allan, Davidson, Jeffrey, D'Amore, Robb, Elkins, Claudia., Herald, Kathy., Incorvia, Michael, Johnson, Albert, Karol, Robin, Seibert, Rebecca, Slavejkov, Aleksandar., and Wagner, Klaus (2001). Providing clarity and a common language to the "fuzzy front end". Research Technology Management(March-April), 46-55.
Malone, Thomas W. (1987). Modeling Coordination in Organizations and
Markets. Management Science, 33(10), 1317-1332. Montoya-Weiss, Mitzi M., and Calantone, Roger (1994). Determinants of
New Product Performance: A Review and Meta-Analysis. J Prod Innov Manag, 397-417.
Quinn, James B. (2000): Outsourcing Innovation: The New Engine of
Growth. Sloan Management Review(sommer), 13-28. Quinn, James B., and Hilmer, Frederick G. (1994). Strategic Outsourcing.
Sloan Management Review(Summer), 43-55. Rindfleisch, Aric, and Heide, Jan B. (1997). Transaction Cost Analysis: Past,
Present, and Future Applications. Journal of Marketing, 61(October), 30-54.
Rindfleisch, Aric., and Moorman, Christine (2001). The Acquisition and
Utilization of Information in New Product Alliances: A Strength-of-Ties Perspective. Journal of Marketing, 65(April), 1-18.
Sivadas, Eugene, and Dwyer, F. Robert (2000). An Examination of
Organizational Factors Influencing New Product Success in Internal and Alliance-Based Processes. Journal of Marketing, 64(Jan), 31-49.
Song, X. Michael, and Montoya-Weiss, Mitzi M. (1998). Critical
Development Activities for Really New versus Incremental Products. Journal of Product Innovation Management, 15, 124-135.
Song, X. Michael, and Parry, Mark E. (1997). A Cross-National
Comparative Study of New Product Development Processes: Japan and the United States. Journal of Marketing, 61(4), 1-18.

92
Song, X. Michael, Souder, W. E., and Dyer, Barbara (1997). A Causal Model of the Impact of Skills, Synergy, and Design Sensitivity on New Product Performance. Journal of Marketing Research, 14, 88-101.
Souder, W. E., and Jenssen, Svenn A. (1999). Management Practices
Influenciing New Product Success and Failure in the United States and Scandinacia: A Cross-Cultural Comparative Study. Journal of Product Innovation Management, 16, 183-203.
Takeishi, Akira (2001). Bridging inter- and intra-firm boundaries:
Management of supplier involvement in automobile product development. Strategic Management Journal, 22, 403-433.
Tellis, Gerard J. and Golder, Peter, N. (1996). First to market, First to Fail?
Real Causes of Enduring Market Leadership. Sloan Management Review, 37(Winter), 45.
Williamson, Oliver (1975). Markets and Hierarchies: Analysis and Antitrust
Implications. New York, NY: The Free Press. Williamson, Oliver E. (1979). Transaction-Cost Economics: The
Governance of Contractual Relations. Journal of Law and Economics, 22(October), 233-261.
Williamson, Oliver E. (1985). The Economic Institutions of Capitalism: Free
Press; New York. Zajac, Edward J., and Olsen, Cyrus P. (1993). From transaction cost to
transaction value analysis: implications for the study of interorganizational strategies. Journal of management studies, 30(1), 131-145.

93
Appendix: Interview guide Theoretical constructs: Success criterions[8]
Empirical questions
1. Up-front homework
What kind of homework do you conduct before the product is developed? • Early and detailed market studies, customer tests,
market tests and test launch? • Do you define target groups, concepts, product
advantage, positioning and specific product features?
2. Market orientation
How do you gather market information? What kind of information is generated? How is the information disseminated? " stored? " used?
3. Product advantage
What kind of products do you develop? Would you say that your products have sustainable competitive advantage? What kind of advantage?
4. Early product definition
How is the product definition activities conducted?
5. Market launch
What kind of preparations do you do before the product is launched in the market? How is the commercialization conducted?
6. GO/KILL Do you have clear GO/KILL points? How do they work?
7. Organization How is the product development process organized? • Cross-functional team • Strong project leaders • Top management involvement • Outsourcing/ Vertical integration • How is the cooperation with external actors?

94
95
5. Development of Distributor Brands vs. Development of Manufacturer Brands
5.0 Abstract
Most mainstream NPD studies have been conducted among manufacturers, while few studies have looked at how distributors develop new products. Our objective in this paper is to investigate if manufacturers and distributors conduct different NPD activities, and if the outcome of a NPD process controlled by a manufacturer differs from the outcome of a process controlled by a distributor. In-depth interviews within the grocery industry in Norway and analysis of sales numbers from an AC Nielsen Scan Track database illustrate that manufacturers and distributors conduct different activities and reach different outcome. While distributors develop copycat products of large volume manufacturer brands, outsource the technical development, and down play launching activities, manufacturers proficiently launch value-added new products developed in-house. As expected the failure rate was higher for manufacturer brands than for distributor brands, while distributor brands had a faster growth in market share than manufacturer brands when the brand concentration was low.

96
5.1 Introduction New product development (NPD) is perceived to be central to business prosperity, and many studies have been conducted to detect what drives success in NPD (Cooper, 1990; 1993; Cooper and Kleinschmidt, 1986; 1987). According to Cooper (1999), two classes of success factors have been uncovered. The first deals with doing the right projects; the second with doing projects right (Cooper, 1999:115). Doing the right project is captured by a number of external or environmental success factors over which the project team has little control. Although perceived as important these factors are not as often investigated. The second type of success factors emphasize doing projects right and focus on how different activities are performed. Many NPD studies have been occupied with revealing these controllable factors that are perceived to make the difference between winners and losers. The aim of this study is to investigate if different kind of actors might emphasize different controllable factors in NPD. NPD studies have been criticized for focusing too much on activities. According to the IMP group, interdependencies exist between activities, actors, and resources and to emphasize only activities is a too narrow approach (Håkansson, 1987). Contrary to the traditional approach within NPD, where resources are perceived as given and actors are viewed as independent and distinct units with clear boundaries, the IMP approach perceives resources to be heterogeneous and actors to be unique. One of the main contributions of the IMP research is the development of the ARA-framework, which provides insight into interdependencies between activities, actors, and resources (Håkansson, 1987:17). To try to extend the activity focus within NPD, the actor perspective from the ARA framework is included in this article. The setting studied is NPD within the grocery industry in Norway, and two different kinds of actors, manufacturers and retailers are investigated. The retail structure within this industry has changed drastically the last 15 years. Outlets have been reduced in number, become organized in chains, and increased in size. 8202 grocery stores existed in 1980. Ten years later the number was reduced to 5926, and in 2001 only 4308 grocery stores existed (AC Nielsen, dagligvarefasiten 2001)21. Along with these changes in structure, distributors have started to
21 The development of grocery chains in Norway started late, but it developed rapidly and became concentrated around fewer actors than in most of Europe. The four largest retailer groups had a market share of 48.2% in 1990. Four years later the market share had increased to 97% (Kleven and Steen 1996), and today four actors, Hakon Gruppen, Coop Norge, NorgesGruppen and REMA 1000 Norge AS have

97
develop their own products. While the manufacturer’s primary commitment always has been to develop and produce new products, the distributor’s traditional task has been to distribute and sell these products. Lately, distributors have extended their long-established commitment to distribution by including product development. The level of penetration for distributor brands varies widely across industries and countries (Steenkamp and Dekimpe, 1997), and different products are obviously at different stages of evolutionary development (Glémet and Mira, 1993). But evidence suggest that distributor brands will continue to grow - driven, in part by the self interest of retailers, which view distributor brands as a strong contributor to profitability, as measured in terms of return on sales (Glémet and Mira, 1993). In spite of the emergence and growing importance of distributor brands, most conceptual and empirical research still focuses on manufacturer brands (Steenkamp and Dekimpe, 1997). Accordingly, many NPD studies have been conducted among manufacturers, while less is known about how NPD is performed among distributors. In this article we want to investigate whether the NPD process for distributors differs from the manufacturer's NPD process, and if the outcome of a NPD process controlled by a manufacturer differs from the outcome of a process controlled by a distributor. The article is structured as follows. First a brief literature review of branding definitions, NPD activities, and NPD outcome is presented to motivate two research questions. Then the methodology is described, and finally empirical observations are described and discussed.
99% market share (The volume from kiosks and gasoline stations are not included in these numbers (www.dagligvarehandelen.com). These retailer groups consist of different marketing chains (appendix 5.1) with different product assortments and profiles.

98
5.2 Theoretical Background 5.2.1 Actors One of the requisites for the development of science in marketing is precision in language. Definitions need to be explicit, and people should not use the same word with different meaning. Already back in 1969 Schutte recognized what he called the outdated and confusing terminology within branding. He presented a list of many different terms and descriptors and their respective fuzziness in meaning used to characterize different kinds of brands. Concepts such as national brands, private labels, store brands, manufacturer brands, and our own brands are just some of the terms mentioned as troublesome by Schutte. All of these terms are still actively used within marketing (see table 4.1), but the meaning of the words has changed over time. Historically, the concept national brand captured brands advertised and sold throughout an entire nation. These national brands were owned by manufacturers and marketed to wholesalers and retailers. The term private brand was coined in the early part of the last century to denote products that were not advertised in national magazines. These private brands referred to those products that were branded privately by distributors (Schutte, 1969:8). Today it is often ownership and control that distinguishes national brands from private brands. It seems like the two concepts presented by Schutte (1969) have influenced how the concepts are understood and defined (Raju, Sethuramen and Dhar, 2001; Dhar and Hoch, 1997; Richardson, Dick and Jain, 1994), even though the labels, manufacturer brand and distributor brand, not are frequently used. In this article, the concepts presented by Shutte (1969) are to be applied. Manufacturer brand: owned and controlled by an organization whose primary commitment is production. Distributor brand: owned and controlled by an organization whose primary commitment is distribution. The focal actor in traditional NPD studies is usually an intra-organizational project team within a manufacturer organization. The main concern is managerial implications for manufacturer action. Other actors, as for example retailers, are seldom treated as focal. The importance of large retailers in many industries seems to escape the attention they deserve. Large retailers design products and/or outsource production to manufacturers who compete to gain orders for distributor brands (Gripsrud, 2004). Consequently, two types of actors, those who develop manufacturer brands
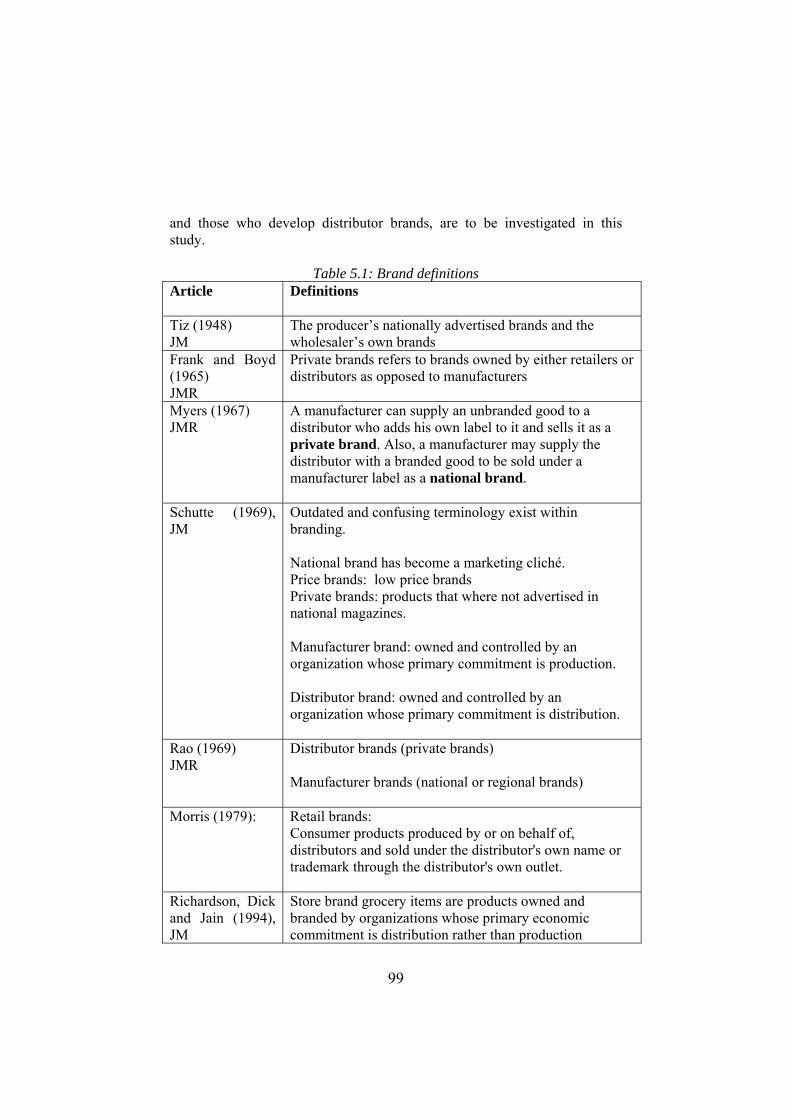
99
and those who develop distributor brands, are to be investigated in this study.
Table 5.1: Brand definitions Article Definitions
Tiz (1948) JM
The producer’s nationally advertised brands and the wholesaler’s own brands
Frank and Boyd (1965) JMR
Private brands refers to brands owned by either retailers or distributors as opposed to manufacturers
Myers (1967) JMR
A manufacturer can supply an unbranded good to a distributor who adds his own label to it and sells it as a private brand. Also, a manufacturer may supply the distributor with a branded good to be sold under a manufacturer label as a national brand.
Schutte (1969), JM
Outdated and confusing terminology exist within branding. National brand has become a marketing cliché. Price brands: low price brands Private brands: products that where not advertised in national magazines. Manufacturer brand: owned and controlled by an organization whose primary commitment is production. Distributor brand: owned and controlled by an organization whose primary commitment is distribution.
Rao (1969) JMR
Distributor brands (private brands) Manufacturer brands (national or regional brands)
Morris (1979): Retail brands: Consumer products produced by or on behalf of, distributors and sold under the distributor's own name or trademark through the distributor's own outlet.
Richardson, Dick and Jain (1994), JM
Store brand grocery items are products owned and branded by organizations whose primary economic commitment is distribution rather than production

100
Hoch (1996),SMR
Private labels differ from national brands in several distinct ways: 1. PL is the only trademark that recurs throughout the
store. 2. PL is the only product (other than fresh meat,
produce, and deli items) for which the retailer absorbs all marketing and inventory investments.
3. PL are guaranteed full distribution. 4. PL get 100 percent pass-through on trade deals.
Dhar and Hoch (1997), MS
Store brands are the only brand for which the retailer takes on all responsibility, from development, sourcing, and warehousing; to merchandising and marketing.
Raju, Sethuraman, Dhar (2001), MS
Store brands, or private labels are brands owned, controlled, and sold exclusively by a retailer
5.2.2 Activities Product development activities are perceived to be vital for the outcome of the product development process. The dictum: If you do not like the result, then look at the process that delivers it (Cooper, 1993); illustrates that the NPD process is perceived to be an important success factor. The Fuzzy Front End of innovation (idea generation, elaboration, and evaluation), business and market opportunity analysis, technical development and product testing, and product commercialization where the new product launch is coordinated, implemented, and monitored, are all different activities included in the NPD process. According to Song and Parry (1997) and Cooper (1999), the quality of implementation of these activities will affect the NPD result. According to Dhar and Hoch (1997) understanding best practices is generally important to all industries, but it is even more important in retailing. The reason is that retailers can easily observe each other's actions, assess the impact of those actions, and quickly imitate successful strategies. Hoch and Banerji (1993) studied when distributor brands succeeded, and found significant determinants of distributor brand market share. Number of national manufacturers, total manufacturer advertising, dollar category volume, retail margin, average quality, quality consistency and distribution of store brands all correlated positively with the market share. Contrary to the manufacturing brand where the success factors are related to how the

101
manufacturer conducts the NPD project, success factors for distributor brands are related to the nature of the product and to the manufacturer's behavior (Glémet and Mira, 1993). The retailer's action is less emphasized. How retailers conduct their NPD process has not been accentuated. A distributor brand is the only brand for which the distributor must take on all responsibility - from development, sourcing, and warehousing, to merchandising and marketing. Unlike the decisions distributors take about manufacturer brands, which are largely driven by the manufacturer's action, the distributor plays a more determinant role in the success and failure of its own label (Dhar and Hoch, 1997). We find it therefore interesting to explore how the distributor conducts their NPD process. Questions to investigate are: What kind of products do distributors develop? Differentiated products, with unique benefits and superior value for the customer are perceived to be important for manufacturers (Cooper, 1999:118). Are these kinds of products also important for distributors? How do distributors launch their new products? A well-planned, adequately resourced, and proficiently executed launch are perceived to be important for manufacturer brands (Cooper, 1999:118). How does this apply for distributor brands? How do distributors conduct technical development activities? Technical development is one of the most studied factors in New Product Development, and results indicate that technical proficiency has a positive effect on manufacturer brand performance (Song and Parry, 1997). Conducting preliminary engineering, evaluating laboratory tests, executing prototype or "in house" sample product testing, designing and testing manufacturing facilities, determining the final product design and specifications, specifying a detailed program for full-scale manufacturing, and continuously working for cost reduction and quality control are all important activities for manufacturers. However, how important are these factors for distributors? How do distributors conduct pre development activities? Solid up-front-homework to define and justify the project, as well as a slave-like dedication to the voice of the customer are important success factors for manufacturers (Cooper, 1999:118). Are these kind of predevelopment activities also important for distributors?
The following research question, which covers the questions above, is stated:

102
RQ1: Does the NPD process differ for manufacturers and distributors? How? 5.3 Outcome NPD outcomes for manufacturer brands have been measured in many different ways. Customer satisfaction, financial return, and technical advantage are just some of the NPD success measures applied (Griffin and Page, 1996). Recognizing that no single measure suffices for gauging the success of every product development project, Abbie Griffin and Albert L. Page hypothesized and found that the most appropriate set of measures for assessing NPD success depends on the strategy. They present a typology to help researchers and practitioners to think through their measurement needs.
“A logical approach for a firm to take would be to determine which type of project or firm strategy situation needs to be measured and then use the appropriate set of measures in the table (typology) as their measurement benchmark (Griffin and Page, 1996:492).”
Market share or revenue growth are suggested as the most useful success measures for product improvement strategies or line extension strategies, according to this typology. Most NPD project within the grocery industry can be classified as either a product improvement or a line extension. New-to-the-world or new-to-the-firm products are rarely developed and launched within this industry. Store differentiation and loyalty (Corstjens and Lal, 2000), percentage retail margins, dollar margins per unit, total dollar profit (Ailawadi and Harlam, 2004) and private label market share (Hoch and Banerji, 1993; Hoch, 1996), are some of the success measures applied for distributor brands. Studies have shown that distributor brands can contribute to store differentiation and loyalty (Corstjens and Lal, 2000), which leads to higher percentage retail margins than manufacturer brands (Ailawadi and Harlam, 2004), and enables retailers to earn higher percentage margins on manufacturer brands. However, the dollar margin per unit may be smaller for distributor brands because of their lower retail price, and Ailawadi and Harlam (2004) found that heavy distributor brand users contribute much less to the total dollar profit of the retailer than do light distributor brand users. Manufacturer brands and distributor brands have complementary roles, and it is important for the retailers to retain a balance between these brands to attract and retain the most profitable customer.

103
While the manufacturer has been occupied with tracing the success of each NPD project, the distributor has emphasized the total profitability of the store. In this study the project-study approach will be applied, and the following research question has been stated: RQ2: Do the outcomes of a NPD process controlled by a manufacturer differ from the outcome of a process controlled by a distributor? Below, two different studies are presented. Study 1 is an exploratory case study consisting of in-depth interviews with key informants from the Norwegian grocery industry. In this study distributors and manufacturers different goals for NPD are emphasized, before the NPD activities for the two groups are compared. Study 2 is a quantitative study consisting of a database analysis. In this study distributor brand outcome, measured as growth in market share and failure rate, are compared with manufacturer brand outcome. 5.4 Study 1 Case studies provide unique means of developing theory by utilizing in-depth insights of empirical phenomena. In this specific study, the process behind development of new products was investigated. A comparison was made between how the distributors and the manufacturers developed new products. In-depth interviews with key informants were conducted. In addition to persons in charge of distributor brands within each of the four retailer groups, interviews were conducted with a store manager and a vice president for one of the retailer groups. Interviews with key informants in food manufacturing firms in Norway were also performed. Marketing managers, R&D managers, project leaders, and people in charge of production were interviewed. In addition to the 18 face-to-face interviews among manufacturers and distributors, follow up phone calls and e-mails were carried out 5.4.1 Goals Generally speaking, the manufacturer's goals seem to differ from the distributor's goals. The manufacturer's most important goal seems to be product category growth, and the challenge is to create growth without

104
destroying existing brands. To be able to create growth manufacturers highlight innovation. As one manufacturer states it:
We must innovate to get into the retailer shelves. Manufacturer
The relationship with the retailer is important for the manufacturer. After all, it is the retailer that controls the access to the customer. The retailer wants the manufacturer to innovate, and the manufacturer wants to create value-added products to meet the retailer's demand.
It is a goal for us to develop new products that the customer is willing to pay a higher price for, so that the retailer can get a higher margin. Manufacturer
Continuous innovation is important for the manufacturer's relationship with the retailer. By continuously launching new products, successful or not, the manufacturer sends out an important signal to the retailer. "We are willing to take a risk when developing new products for you". It is the total growth within a product category over time that is important for the manufacturer. Consequently, to give the consumer time to get used to new ideas or new products might be the appropriate thing to do. While growth, increased price, and access to the retailer store are effects from launching new manufacturer brands; higher margin, customer loyalty, and increased knowledge are three reasons for development of distributor brands. Distributor brands, which are only available in one specific retailer chain, might distinguish this chain from the rest and give them a competitive advantage. A spin-off product from developing distributor brands is increased knowledge for the distributor, which makes them better suited to negotiate with the manufacturer. Higher margin is a result of fewer intermediary actors from production to consumption and economies of scale. Synergies from developing and in-sourcing products together with Nordic sister organizations are perceived to be an economic potential that will increase the margin for distributor brands.

105
5.4.2 Activities What kind of products do distributors develop? The grocery industry develops mostly incremental innovations. Very few of the new products launched can be classified as radically new. For distributor brands the product benefit is often a low price. None of the Norwegian retailers go for premium distributor brands like what we can observe in England and France (e.g. Tesco Finest). Two different distributor brand platforms are observed, price fighters and standard. The standard platform comprises two categories. The base product category, containing copy products of national market leaders, is the largest group (80-90%). Examples might be copy products of Kellogg's Cornflakes and Uncle Ben's rice. By copying these volume products the distributor intends to increase the total category profitability. The next category is called profile products and consists of copy products of manufacturer brands with a great customer engagement (10-20%). Examples might be fresh juice and frozen fish loins. The aim for the profile product is to build the store profile. Both these two categories of distributor brands are on average sold 10-20% below the national market leader. Price fighters are different low priced volume products. Reference points for price fighter products are the cheapest ordinary products sold by soft discounters. Examples might be non-food and dry food products like detergent, dog food, or coffee. Contrary to distributors, manufacturers develop value-added products that the customer is willing to pay a higher price for. The most successful innovations for manufacturers seem to be those that are medium new-to-the-firm and medium new-to-the-world. Consequently, manufacturers often modify existing products and use existing technology in a new way when developing new products.
The opportunity is to apply new ideas into existing technology. Manufacturer
A lot of the product development conducted by manufacturers is product modifications and brand extensions. To keep a brand alive, manufacturers need to develop it continuously. An example of a product modification might be to develop a new taste for an existing product. A brand extension might also consist of changes in packaging. Changing the package can make the product user-friendlier and thereby increase the customer value. The goal for most manufacturers is to add value and thereby be able to charge a higher price for their product modifications. Manufacturers also develop line-

106
extensions and products with a higher level of product newness. Although high-risk project are most often avoided, they do exist. Development of functional food is one example.
Figure 5.1: Distributor vs. Manufacturer Brand Strategies
Distributor brand strategies
Low High
Manufacturer brand strategies
Low High How do distributors launch their new products? Distributor brands differ from manufacturer brands in several distinct ways. With a manufacturing brand the retailer has little or no influence over advertising and brand image. With a distributor brand retailers have more
Price
Quality
Standard
Quality
Value added products
Low
High
Price fighters
Brand improvements
Price
High
Low

107
control, but also absorb all marketing and inventory investment. Distributor brands are guaranteed full distribution and good shelf placement. Compared to manufacturer brands, this substantially reduces the marketing resources that the retailer must expend (Hoch, 1996). When looking at the post-development phase for manufacturer brands and distributor brands both differences and similarities emerge. First, a reduced need for market communication for distributor brands is observed. Retailers spend less money on advertising than manufacturers, and distributor brand advertising is mostly limited to the distribution of direct mail. While manufacturer brands quite frequently are presented in TV, newspapers and magazines, only one of the four retail chains in Norway presents their distributor brands in TV commercials. Instead of branding individual products, the retailer store concept is branded by the distributor. Secondly, while different commercialization activities are conducted for distributor brands and manufacturer brands, the organization of the process is quite similar. All advertising and brand building for distributor brands is outsourced to advertising agents and design houses, which define product profiles and design product packages. Most manufacturers also buy commercialization services from advertising agents. In-house advertising agencies are rarely observed among grocery manufacturers in Norway. How do distributors conduct technical development activities? Contrary to the manufacturer, whom most of the time develops and produces brands in-house, the distributor often separates the production from the development. Although some distributors produce in-house by their own manufacturing operations, most commonly the production is taken care of by an external actor. The relationship between the external actor and the distributor varies. Close, long-term relationships are established between some of the actors, while other distributors keep their producers at an arms length distance, and give the contract to those that best meet their specifications. To distinguish those that both produce and develop from those that outsource the production is important, since these actors' activities seems to differ. In-house production triggers a more continuous development process. Consequently, distributors with in-house production have more in common with manufacturers than those that outsource the production. Even when the technical development is outsourced, some technical activities need to be conducted in-house by the distributor. When retailers start to develop their own products they must take on the responsibility for food safety and product quality, and activities such as product testing and

108
product specification need to be conducted. Both human skills and technical facilities, like access to laboratories, are necessary to be able to govern product development internally. How do distributors conduct predevelopment activities? The predevelopment phase seems to be quite similar for manufacturers and distributors. Both types of actors find it important to screen the market, analyze sales figures, define product concepts and listen to the voice of the customer. In addition to the similarities, differences are also observed. While the distributor often looks at the sales numbers, and is concerned with transportation and how the product is exposed in the store, the manufacturer seems to be more concerned with brand management and how the product meets the consumer’s demands. Unutilized capacity in production facilities and observation of new trends might generate new product ideas. A new manufacturer brand is often a result of the combination of a marketing pull and a technology push strategy. Successful manufacturers listen to both the voice of the customer and the voice of the internal organization. They satisfy customer needs by utilizing existing technology since production facilities and organizational knowledge limits what they are able to do. The closeness to the customer is an advantage for the retailer, and employees, who observe and talk to the customer daily, are vital idea sources for new distributor brands. Retailers identify holes in the product portfolio that need to be filled, and try to spot underdeveloped product categories with great growth potential. Distributors also listen to the voice of the customer.
By looking at the consumer's understanding of the product we changed the package for our coffee. We used to sell different kinds of coffee in the same kind of paper bag. The only difference was the label tag. By vacuum-packing the coffee in more appealing aluminum boxes we tripled our sales. Distributor
The distributor's ability to think holistically is, according to one of the distributors interviewed, what distinguishes them from the manufacturer.
Manufacturers develop products that are very well customer segmented, but they do not take into consideration distribution and handling in the store. We sit on the top of the distribution chain, and

109
need to understand how the product functions in the store. Distributor We have to consider how to make the most out of the raw material. If we do not utilize all the raw material, the end-product price will increase. Distributor
Both distributors and manufacturers need to define in advance what they want to develop, since a lack of conceptualization increases the time-to-market. Without a clear product definition the technical development becomes more difficult, and consequently the development takes longer. To define a sharp and stable product definition early on can be difficult. How difficult depends on the type of products to be developed. For "copy cat" products the conceptualization stage might be very simple.
We send off a branded bottle of ketchup to different producers and ask for a product as close to this ketchup as possible. Those who come up with the best product get the contract. Distributor
As the level of product newness increases, so does the need for specification. A successful project that is developed on time is often very well defined up front.
The reason why it took five years to develop this product was the lack of a precise and stable product definition. Manufacturer
While conceptualization is an activity that is conducted in-house, commonly both manufacturers and distributors include an external design bureau in the process. These bureaus help the actors describe the products profile, define the customer segment and propose how the product is to be positioned. 5.4.3 Conclusion Study 1 The results reveal that distributors conduct different activities than manufacturers when developing new products. The main differences exist within product uniqueness, technical development and product launch. While new manufacturer brands most often are value-added and higher priced products, new distributor brands are mostly low priced copies of volume products. Manufacturers develop products in-house, while distributors outsource the technical development to manufacturers who

110
compete to gain orders for distributor brands. Whereas manufacturer brands are heavily advertised, new distributor brands are launched without almost any market communication. As for the predevelopment stage the process seems quite similar. For successful projects both manufacturers and distributors conduct up-front homework and define product concepts in advance. Manufacturers and distributors also listen to the voice of the customer. Whereas manufacturers generate information directly from focus groups and different consumer tests, distributors gain most of their information from in-store customer interactions. 5.5 Study 2 In study two we investigated how the outcome of a process controlled by a distributor differed from the outcome of a process controlled by a manufacturer, and products were grouped according to manufacturer brands and distributor brands.
Table 5.2: New products launched January 2000 to January 2003 Manufacturer brand (MB) Distributor brand (DB) Jam Orkla: NORA (7)
Lerum Konserves: Lerum (15) Rogaland Konserve-fabrikk: Hervik (4) Div. manufacturers: Rognebær gele (1) Total: 27
Coop: XP (2) Hakon Gruppen: Rimi (8) Hakon (8) Norges Gruppen: Eldorado (5) Oluf Lorentzen Import: Den Gamle Frukthage (13), St.Dalfour (3), Brimi (5), Teksle Broker AS: Gøtt (4) Total: 48
Juice TINE: Meierienes (4) NEN Produkter: NEN (3) Lerum Konserves: Lerum (7) Bramhults AS: Bramhults (3) Div. manufacturers: Chiquita (3),Cranberry (1), Country Choice (5), V8 (1), Ocean Spray (1) Total: 28
Coop: XP(2) Norges Gruppen: Eldorado (3) Farmers (1) Hakon Gruppen: RIMI (4), Hakon (5) Total: 15
Pizza Orkla: Stabburet (3), Mia (3) Gilde: Favoritt pizza (1) Keco AS: DrOetker (7) Total: 14
Norges Gruppen: Eldorado (2) Hakon gruppen: Rimi (1) Total: 3

111
The unit of analysis was new pizza, jam, and juice products launched in the period January 2000 to January 2003 by the four grocery retailer groups in Norway. These three product categories were chosen because both distributor brands and manufacturer brands exist within them. Variance according to brand concentration was another reason for selecting these three categories. A much higher brand concentration exists within the pizza category than within the jam and juice category22. This opens up for the possibility to control for brand concentration effects. The sampling frame is the AC Nielsen ScanTrack database23, which is based upon income scanning data from 390 representative grocery stores in Norway every week. The population is approximately 4000 stores with total annual revenue of 98,1 billion NOK (1999). From this sampling frame, consisting of 750 jam, juice, and pizza products, a sample is made up of all new products launched within the time period studied. To be able to compare distributor brands and manufacturer brands, growth in market shares24 is investigated at the individual marketing chain level. Six months after a new product was launched the market share was investigated in 11 different marketing chains25. Comparative statistical analyses were performed to examine the difference between means of the groups. A t-test, which assesses the statistical significance of the difference between distributor brand outcome and manufacturer brand outcome, was utilized. In addition to growth in market share, which is a measure of success, the failure rate for manufacturer brands and distributor brands is investigated. The failure rate is the percentage of new products that fail in the time period studied26. 22 Brand concentration is measured with a Herfindahl-Hirschman Index: C=√ΣA2 + B2 +C2 +D2 were A, B, C, and D are the % market share for the largest brands in the product category (Hirschman, 1945). The index varies from 0 to 100. HHI Pizza: 85,17, Jam:49,09 and Juice: 36,19 23 To be included in the database, the stores must be larger than 100 m2, have a minimum NOK 200 000 in annual revenue, and be open more than 10 months a year. Gasoline stations are not included even though they fulfil these requirements. The scanning penetration in Norway (by December 2002) is numeric 73%, but 93% of the revenue comes from stores with scanning equipment. These stores represent those without such equipment. 24 A products market share is measured as this product’s salesvolum divided by the total salesvolum within the product category. Mean market share is the average market share within a category. 25 The AC Nielsen ScanTrack database distinguishes between 11 marketing chains. See highlighted chains in table 5.4. 26 The failure rate is calculated as number of new failures (new products removed from the shelves) divided by total number of new products launched.

112
5.5.1 Outcome The in-depth interviews and the distributor brand literature have given us expectations for how the outcome of distributor brands differs from manufacturer brand outcome. First, we expect distributor brands to have a lower price than manufacturer brands. The distributors goal is to launch new products with a 10-20% lower price than existing manufacturer brands, while manufacturers want to develop value-added products that they can charge a higher price for. Second, we expect manufacturer brands to grow faster due to more extensive market launch activities. Manufacturers build brands, while distributors downplay the importance of branding. As a consequence, we expect the introduction of manufacturer brand extensions to be faster than the introduction of distributor brand extensions. Since distributors control the activities that take place within the store, we alternatively hypothize that distributor brands grow faster than manufacturer brands. Distributors control the shelf placement and can give their own brand’s a favorable position, which might positively affect distributor brands growth rate. Lastly, we expect distributor brands to have a lower failure rate than manufacturer brands. The low level of product newness for distributor brands reduces the level of risk, since to copycat successful volume products is less uncertain than to develop new value-added products. We observed that average retail price was higher for manufacturer brands than for distributor brands in two out of three categories. In the pizza and the juice category manufacturer brands were more expensive than distributor brands, while in the jam category distributor brands had the highest mean average retail price in six out of eleven stores. A closer investigation revealed that some low volume distributor brands had a relatively high price. By excluding these brands, which had an average retail price at NOK 28.79 and counted for only 11.9% of the total volume, the same pattern was observed for the jam category.

113
Table 5.3: Average retail price (unit price in NOK per kilo) Pizza Jam Juice
MB DB MB DB MB DB
13Β 20.10Χ
5 30.35
16 12.82
2 9.70
Coop Mega Α
5.104Δ (0.000Ε) -1.177 ( 0.264) 12 17.35
8 28.97
12 13.89
2 9.44
Coop Obs! Α
4.729 (0.000) -1.006 (0.334) 8 16.50
2 16.90
7 14.06
2 9.40
Coop Prix Α
0.144 (0.889) -1.051 (0.328) 6 21.83
9 17.17
4 15.08
5 10.75
ICA Sparmat Α
-2.048 (0.061) -1.25 (0.247) 11 21.38
20 22.43
14 20.19
5 11.22
ICA Supermarked
Α
0.465 (0.646) -2.334 (0.031)
9 28.82
1 18.90
8 19.07
14 15.39
9 16.95
4 11.16
RIMI
-1.36 (0.204) -2.087 (0.047) -1.876 (0.075) 4 32.78
2 19.40
3 19.07
3 11.83
2 14.77
1 12.40
KIWI
-2.733 (0.052) -3.849 (0.018) -0.458 (0.692) 5 32.89
2 21.19
7 20.77
4 15.17
4 11.51
2 15.435
Joker
-1.384 (0.225) -4.713 (0.001) 1.258 (0.249) 9 29.62
2 20.47
26 21.01
21 24.58
20 18.22
3 13.90
Meny
-1.914 (0.082) 1.741 (0.089) -1.149 (0.262) 8 31.44
2 21.86
19 19.61
10 20.14
9 15.99
2 14.94
SPAR
-1.509 (0.162) -0.259 (0.798) -0.297 (0.771) REMA 1000 Α Α Α Α no distributor brands, Β number of products, Χ mean market share 6 month after launch, Δ t-value, Ε significance level

114
Table 5.4: Mean growth in market share (salesvolume in kilo or liter) Pizza Jam Juice
MB DB MB DB MB DB
1Β 0.0093Χ
6 0.0035
16 0.0015
2 0.0242
Coop Mega Α
-1.563Δ (0.131Ε) -3.275 ( 0.05) 10 0.0074
12 0.0028
12 0.0047
2 0.0732
Coop Obs! Α
2.013 (0.069) -2.878 (0.014) 3 0.0185
2 0.0320
7 0.0004
2 0.0776
Coop Prix Α
-0.813 (0.476) -2.321 (0.053) 10 0.083
8 0.0464
4 0.0003
5 0.0925
ICA Sparmat Α
-3.408 (0.004) -2.487 (0.042) 10 0.0207
20 0.0126
14 0.0018
5 0.0393
ICA Supermarked
Α
1.270 (0.215) -5.491 (0.000)
9 0.030
1 0.075
8 0.009
14 0.0254
9 0.0019
4 0.1262
RIMI
-1.326 (0.222) -1.337 (0.196) -4.01 (0.002) 4 0.058
2 0.047
3 0.025
2 0.0190
2 0.0007
1 0.1477
KIWI
0.299 (0.780) 0.264 (0.809) -281.4 (0.002) 5 0.0324
2 0.0356
7 0.0072
4 0.0108
4 0.0016
2 0.0259
Joker
-0.094 (0.929) -0.404 (0.696) -1.534 (0.2) 9 0.0328
2 0.0362
18 0.005
29 0.002
20 0.002
3 0.0332
Meny
-0.181 (0.860) 2.081 (0.043) -4.086 (0.001) 8 0.018
2 0.046
31 0.003
4 0.0076
9 0.0008
2 0.0383
SPAR
-1.783 (0.112) -1.037 (0.307) -3.029 (0.014) REMA 1000 Α Α Α Α no distributor brands, Β number of products, Χ mean market share 6 month after launch, Δ t-value, Ε significance level
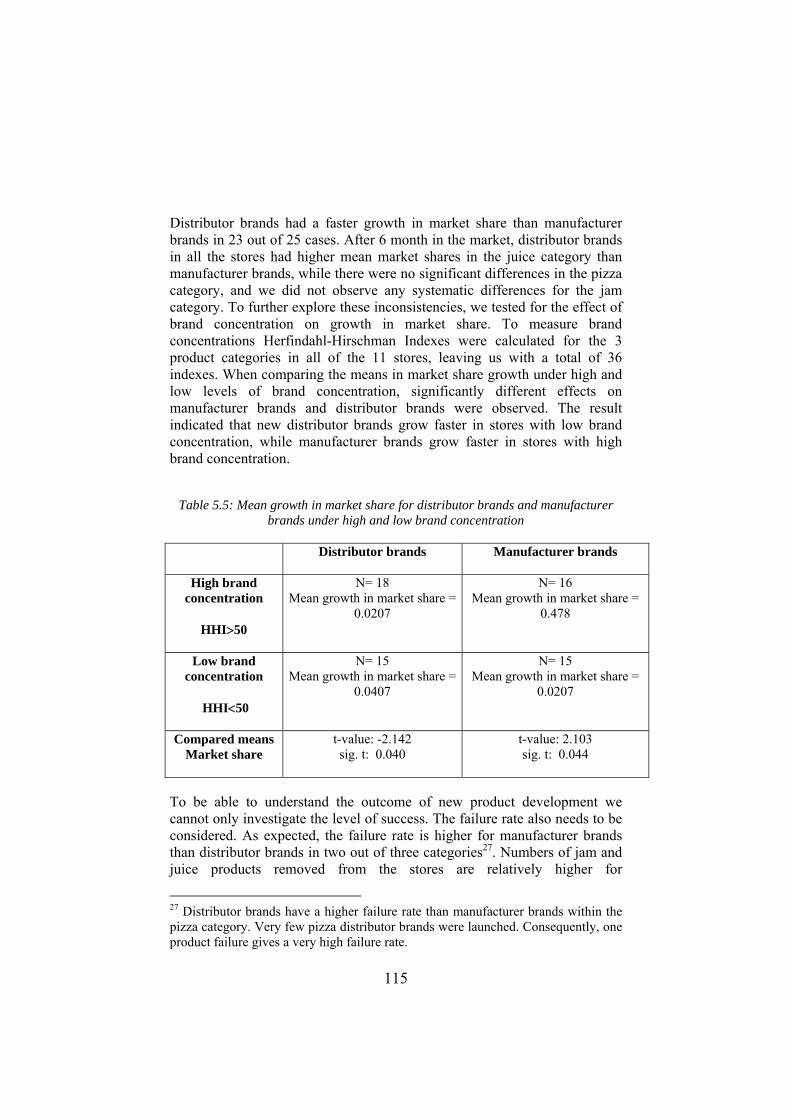
115
Distributor brands had a faster growth in market share than manufacturer brands in 23 out of 25 cases. After 6 month in the market, distributor brands in all the stores had higher mean market shares in the juice category than manufacturer brands, while there were no significant differences in the pizza category, and we did not observe any systematic differences for the jam category. To further explore these inconsistencies, we tested for the effect of brand concentration on growth in market share. To measure brand concentrations Herfindahl-Hirschman Indexes were calculated for the 3 product categories in all of the 11 stores, leaving us with a total of 36 indexes. When comparing the means in market share growth under high and low levels of brand concentration, significantly different effects on manufacturer brands and distributor brands were observed. The result indicated that new distributor brands grow faster in stores with low brand concentration, while manufacturer brands grow faster in stores with high brand concentration.
Table 5.5: Mean growth in market share for distributor brands and manufacturer brands under high and low brand concentration
Distributor brands
Manufacturer brands
High brand concentration
HHI>50
N= 18 Mean growth in market share =
0.0207
N= 16 Mean growth in market share =
0.478
Low brand concentration
HHI<50
N= 15 Mean growth in market share =
0.0407
N= 15 Mean growth in market share =
0.0207
Compared means Market share
t-value: -2.142 sig. t: 0.040
t-value: 2.103 sig. t: 0.044
To be able to understand the outcome of new product development we cannot only investigate the level of success. The failure rate also needs to be considered. As expected, the failure rate is higher for manufacturer brands than distributor brands in two out of three categories27. Numbers of jam and juice products removed from the stores are relatively higher for
27 Distributor brands have a higher failure rate than manufacturer brands within the pizza category. Very few pizza distributor brands were launched. Consequently, one product failure gives a very high failure rate.

116
manufacturer brands than for distributor brands. This is the case both for new products and for the total product assortment in the time period studied. We also notice that manufacturers launch more new products than distributors.
Table 5.6: Number of failures Manufacturer brands Distributor brands Share of total
failures Share of new failures
Share of total failures
Share of new failures
Juice Meierienes NEN Nora Lerum Chiquita Røra XP Eldorado Farmers RIMI Hakon
6/21=0.29 3/10=0.30 11/25=0.44 6/13=0.46 0/9=0 ⎯Σ=0.30⎯
2/7=0.29 0/3=0 1/11=0.09 0/7=0 0/5=0 ⎯Σ=0.08
2/12=0.17 0/1=0 0/7=0 0/1=0 1/6=0.17 0/6=0 ⎯Σ=0.06
0/0=0 0/1=0 0/3=0 0/1=0 1/6=0.17 0/6=0 ⎯Σ=0.03
Jam Nora Lerum Hervik XP RIMI Hakon Eldorado DGF St.Dalfour Brimi
18/56=0.32 22/54=0.41 0/16=0 ⎯Σ=0.24
2/9=0.22 3/18=0.17 0/4=0 ⎯Σ=0.13
0/2=0 0/8=0 0/8=0 5/15=0.33 6/30=0.20 0/8=0 0/5=0 ⎯Σ=0.08
0/2=0 0/8=0 0/8=0 0/5=0 2/17=0.12 0/5=0 0/5=0 ⎯Σ=0.02
Pizza Stabburet Mia Favoritt pizza Dr.Oetker Eldorado Rimi
6/19=0.32 0/3=0 0/3=0 2/11=0.18 ⎯Σ=0.18
2/7=0.29 0/3=0 0/1=0 2/11=0.18 Σ=0.22
1/3=0.33 0/1=0 ⎯Σ=0.25
1/2=0.50 0/1=0 ⎯Σ=0.33
117
5.5.2 Conclusion Study 2 Distributors had, according to study 2, a faster market share growth rate than manufacturers in product categories with low levels of brand concentration, while no systematic or significant differences were observed in product categories with medium to high brand concentration. Considering that the manufacturer's goal is growth, it is surprising that the growth rate measured in market share is not higher for new manufacturer brands than for new distributor brands. One explanation might be that distributors develop very familiar products (orange juice, strawberry jam and ham/cheese pizza) that are easily accepted by the customer, and low prices make it uncomplicated for the customer to try new distributor brands. The adaptation of new distributor brands is especially fast in categories without strong manufacturer brands. It seems like this fast market growth for new distributor brands is moderated by the manufacturer's ability to build stronger brands. It is more difficult for distributors to establish new brands in product categories with strong manufacturer brands, while the opposite might be the case for manufacturers, since strong established brands makes it easier to launch brand extensions. As expected, we observed that manufacturers launch more new products and fail more often than distributors. To continuously develop new products is more risky than to copy market leaders. Consequently, the failure rate for manufacturer brands is higher than for distributor brands. 5.6 Concluding remarks Perhaps the most appropriate way to discuss this research's implications is to discuss what is not suggested by the findings. The study should not be interpreted to suggest that distributors are better than manufacturers due to the low failure rate and the fast growth in market share. Since manufacturers and distributors have different goals, it is understandable that they conduct different activities, and reach different outcome. The most important objective for distributor brands is to increase their margins. They select low risk projects with high economic potential. Since many distributors lack the resources necessary for developing these products in-house, manufacturers conduct the technical development for them. To gain access to the customer, manufacturers need to consider what kind of products the distributors want from them. That is, mostly value-added product with a higher level of product newness than what is the case for distributor brands. Continuous development for value added products is more risky, resulting in more

118
failures. To perceive all actors as equal is accordingly a wrong assumption to make. The main contribution of this research is the insights provided into the distributor’s NPD process and NPD outcome. By emphasizing distributors own NPD activities we extend the traditional focus on manufacturers within NPD literature.
Table 5.7: Summary manufacturer brands and distributor brands Manufacturer brands Distributor
brands Goals • Growth
• Access to the store
• Increase margins • Create loyalty • Knowledge
Activities Type of products developed
• Value-added and higher priced products
• Continuous innovation
Copy of large volume products sold at a lower price
Pre development
Both do there homework Both define product concept Both listen to the voice of the customer
Technical development
Develop new products in-house
"Outsource" a lot of technical development activities to external actors
Launch activities
• Heavy market communication
• Build product brands
• Little market communication for product brands
• Build store brand
Outcome Growth in market share
Growth in market share seems to be affected by brand concentration and product newness. Distributor brands with low product newness has highest mean market share in product categories with low brand concentration.
Failure rate Medium Low
119
5.7 Limitations and Directions for Further Research It is important to note that the sample in this study was limited to only three product categories (pizza, juice, and jam). These categories were chosen because of the existence of both manufacturer brands and distributor brands, and due to the variance in brand concentration. Replication of this research with other product categories and in other industries would provide a means of validating the results. Another limitation to consider is the variables applied to measure activities and outcomes. Product development is a multifaceted phenomenon that needs to be measured with multiple variables. Means for growth in market share, and number of failures made it possible to compare manufacturer brand outcome with distributor brand outcome, and some success factors (Cooper, 1998) were applied as antecedent variables, but further research should investigate different antecedent and effect variables. In summary, researchers have made significant progress towards understanding the role of activities in new product development. To further extend our understanding of what affects new product development outcomes, we need to consider actors in addition to activities. Since different actors have different goals and conduct different activities, NPD ought to be considered not only from the manufacturer's point of view. Other actors as, for example, raw material suppliers, retailers, and consumers play important roles in NPD and need to be considered as focal actors in future studies.

120
5.8 References ACNielsen (2002), "NITRO 1, Course material." Oslo. Ailawadi, Kusum L. and Bari Harlam (2004), "An Empirical Analysis of
Determinants of Retail Margins: The Role of Store-Brand Share," Journal of Marketing, 68 (January), 147-65.
Cooper, Robert G (1998), "Benchmarking new product performance: Results
of the best practices study.," European Management Journal, 16, 1-17.
---- (1999), "From Experience. The Invisible Success Factors in Product
Innovation," Journal of Product Innovation Management, 16, 115-33.
---- (1993), Winning at New Products (2nd ed.): Addison-Wesley, Reading. Cooper, Robert G and E.J. Kleinschmidt (1990), "New Products: The Key
Factors in Success," American Marketing Association, Monograph. Corstjens, Marcel and Rajiv Lal (2000), "Building Store Loyalty Through
Store Brands," Journal of Marketing Research, XXXVII (August), 281-91.
Dhar, Sanjay and Stephen J. Hoch (1997), "Why Store Brand Penetration
Varies by Retailer," Marketing Science, 16 (No.3), 208-27. Frank, R. E. And H.W. Boyd (1965), “ Are Private –Brand Prone Grocery
Customers Really Different?”, Journal of Marketing Research, vol. 2, No. 4, 27-35.
Frankfort-Nachmias, Chava and David Nachmias (1996), Research Methods
in the Social Sciences (Fifth ed.). London: St Martin's Press. Glèmet, Francois and Rafael Mira (1993), "The brand leader's dilemma," in
The McKinsey Quarterly. Griffin, Abbie and Albert L. Page (1996), "PDMA Success Measurement
Projects: Recommended Measures for Product Development Success and Failures.," Journal of Product Innovation Management, 13, 478-96.

121
Gripsrud, Geir (2004): The Marketing Discipline and Distribution Research: Time to Regain Lost Territory? In "Rethinking Markets. Towards a New Understanding of Marketing" edited by Harrison, Debbie and Håkansson, Håkan
Hirschman (1945): “National Power and the Structure of Foreign Trade”,
Berkley, University of California Press. Hoch, Stephen J. (1996), "How Should National Brands Think about Private
Labels?," Sloan Management Review, winter, 89-102. Hoch, Stephen J. and Shumeet Banerji (1993), "When Do Private Labels
Succeed?," Sloan Management Review (summer), 57-67. Kleven, Kjersti and Arild H. Steen (1996), "Kjedemakt mot industrimakt:
Om endringene i norsk næringsmiddelindustri under framveksten av dagligvarekjedene." Oslo: FAFO.
Myers, John G. (1967), “Determinants of Private Brand Attitude, Journal of
Marketing Research, 4 (February), 73-81 Raju, Jagmohan S., Raj Sethuraman, and Sanjay Dhar (1995), "The
Introduction and Performance of Store Brands," Management Science, 41 (No.6, June), 957-77.
Rao, Tanniniru R. (1969): Are Some Consumers More Prone to Purchase
Private Brands?, Journal of Marketing Research, Vol. VI (November), 447-450
Schutte, Thomas F. (1969), "The Semantics of Branding," Journal of
Marketing, 33, 5-11. Song, X. Michael and Mark E. Parry (1997), "A Cross-National
Comparative Study of New Product Development Processes: Japan and the United States," Journal of Marketing, 61 (4), 1-18.
Steenkamp, Jan-Benedict E. M. and Marnik G. Dekimpe (1997), "The
Increasing Power of Store Brands: Building Loyalty and Market Share," Long Range Planning, 30 (6), 917-30.
www.dagligvarehandelen.com

122
Appendix 1: Retailer groups in Norway
Retailer groups and marketing chains
Retailer groups
NorgesGruppen Coop Hakon Gruppen
REMA 1000
Marketing Chains
SPAR Joker Kiwi Meny Centra Ultra Bunnpris Eurospar K-Kjøpmenn Safari Butikkringen Nærmat Bikuben
Coop Prix Coop Mega Coop Obs!
RIMI ICA Sparmat ICA Supermarked
REMA 1000
Retailer groups in Norway 2001 NorgesGruppen,1913 stores,34,5%Coop, 980 stores,24,3%
Hakon Gruppen,1110 stores,23,9%REMA 1000Norge AS, 359stores, 16,7%Oth 47 t

123
6. Incremental innovation: a way to handle friction?
6.0 Abstract In this paper, friction is used as a tool to shed light on the manager’s role in organizational change. The concept of friction has recently been used as a metaphor to understand organizational action, and previous articles have highlighted how friction between organizational resources both restricts and facilitates change. Change and friction are interrelated, and the focal point to explore in this paper is the manager’s role in this interaction. The question emphasized is, “How do managers handle friction when developing incremental innovations?” Empirical observations of incremental changes in a simple saithe block product illustrate our theoretical discussion.
124
6.1 Incremental innovation and change Innovation refers to a process by which an organization transforms labor, capital, material, and information into products and services of greater value. A distinction is sometimes made between innovations that require very different technological capabilities, so-called radical change, and those that build upon well-practiced technological capabilities, often called incremental innovations (Christensen, 2002). This distinction between incremental and radical change can be traced all the way back to Schumpeter (1942). He stated that “the function of entrepreneurs is to reform or revolutionize the pattern of production by exploiting an invention or an untried technological possibility…down to such things as making a success of a particular kind of sausage or toothbrush (Schumpeter, 1942:132) ”.
Incremental innovations are changes in products that score low on both level of newness to the firm and level of newness to the market (Booz, Allen, and Hamilton, 1982). Modifications to existing products, redesigned products to achieve cost reductions, and product repositioning are three examples of incremental innovation (Kleinschmidt and Cooper, 1991). Incremental innovations are small step-wise changes. Although not as novel as radical innovations, incremental innovations can contribute positively to firm performance. The well-known Professor at Harvard Business School, Theodore Levitt, stated that “imitation (which is one kind of incremental innovation28) is not only more abundant than innovation, but actually a much more prevalent road to business growth and profits (Levitt, 1966:33)”. The returns expected from incremental innovations are not as high as from radical innovations, but since the risk associated with their development and commercialization is lower than from radical innovations, incremental innovations are important for the firm’s overall profitability (Kleinschmidt and Cooper, 1991). While radical
28 According to Garcia and Calantone (2002) imitative innovations will most likely be incremental innovations, although on rare occasions they will be radically new innovations. They quote Grupp (1998), who provides a very succinct definition of imitative innovations. “Innovations occur only in the first company to complete industrial R&D which culminates in the launch of the first product to markets. Rival innovations are designated imitations even if, in intracorporate term, very similar R&D processes are only a short distance from one another chronologically. The imitator need not necessarily be aware of or be able to benefit from the first innovator. Imitations can thus be just as resource-intensive, especially R&D intensive, as the first innovation (p. 20).”

125
innovations offer opportunities for product advantage and differentiation, incremental innovations are close enough to the base business to gain profit from the effects of resource synergies. Contrary to radical innovation where firms explore new possibilities and often need to invest in new facilities, existing resources are more widely utilized when incremental innovations are developed. 6.2 Resource friction and change Over the past 50 years the perception inherited from classic economics29, of resources as tangible and static entities, has gradually evolved into an understanding of resources also as intangible and dynamic assets. Resources have come to be viewed not only as “stuff” that is static and to be captured for advantage, but also as functions of human initiative and consideration. Influenced by Penrose (1959)30, which was one of the first economists to recognize the shifting role and view of resources, current literature within strategic management (e.g.Teece, Pisano and Shuen, 1997; Eisenhardt and Martin, 2000; Kusunoki, Nonaka and Nagata, 1998) and marketing (e.g. Dickson 1992; Day 1994; Slotegraaf, Moorman, and Inmann, 2003; Vargo and Lusch, 2004) emphasizes the dynamic aspects of resources. Resources are now perceived as arising from a firm’s interaction with the market (Slotegraaf, Moorman, and Inmann, 2003), and resources, “enable humans both to multiply the value of natural resources and to create additional operant31 resources (Vargo and Lusch, 2004)”. In this paper, the concept of resource friction32 is applied to capture the dynamic interplay between resources. According to Håkansson and
29 In neoclassical perfect competition theory ”firms are identical because perfect information together with a specifiable production function assures that each firm has equal access to production technology; perfect information plus resource mobility and divisibility assures that each firm is able to obtain exactly the right inputs (Conner, 1991:123)” 30 According to Penrose (1959:25) it is never resources themselves that are the inputs to the production process, but only the services that the resources can render. 31 Operant resources are resources that produce effects. They are often invisible and intangible. They are likely to be dynamic and infinite and not static and finite (Vargo and Lusch, 2004:3) 32 In its original connotation, friction is a disposition that appears when a force is directed towards two interacting surfaces. As Harré (1993) puts it: “Whenever two surfaces are in contact and one surface is moved in relation to the other, the friction forces are quite noticeable”. Without friction, we would not be able to walk, sit in a

126
Waluszewski (2002), the concept of resource friction captures how a force directed towards a certain resource creates a reaction, affecting both the resource exposed to the original force and the resources it interfaces with. Friction is often considered negative. Organizational friction as resistance to change or hostility is often perceived as an organizational problem. However, disagreement or dispute might also be a positive force. Friction is not only an outcome of change, but also an antecedent to change. Change creates friction, which again creates change. Friction creates energy, which is positive for organizational creativity. Friction makes managers look for new solutions. Consequently, friction stimulates the manager’s imagination. Friction as diverse opinions within an organization or between organizations, or technical maladaptations might result in new products, new facilities, new competence, or new relationships. → Change→ Friction →Change→ The greater the change, the greater the level of friction. Small, incremental changes will accordingly not produce as much friction as radical changes. Incremental innovations are dependent on an efficient utilization of existing technical facilities and organizational resources to be able to deliver good economic results. High levels of friction, which might reduce efficiency, are therefore not very welcome. The paradox is that a low level of friction, which is good for the outcome of incremental innovations, might hinder future change. Friction stimulates creativity. If harmony exists, radical changes are unlikely to take place. As Åkerman expresses it: “without friction, no movement whatsoever (1993)”. Without friction, few new ideas will come up and less opposing information will be shared. 6.3 Management and Change Manager’s actions are vital forces that influence change. A manager enables change and innovation by combining existing resources as products, technical facilities, competencies, and relationships in new ways. The
chair, or climb stairs. Everything would just keep slipping and falling all over the place.
127
number of possible resource combinations is infinite, and the opportunities offered are only limited by the manager’s intellect. Accordingly, a manager’s lack of imagination is a strong restrictor of innovation. Although managers might play an active role in change, all changes that occur are not initiated directly by managers. Along with change comes friction, and friction leads to new changes. Some level of friction will always exist. An interesting question is how managers respond to this friction. They may focus on handling the friction, or they may focus on handling the consequences of friction. Resource friction is a complex matter, and managers are trapped in a dilemma between the facilitating and restricting forces associated with resource friction. How are managers to handle this dilemma? What is right; to avoid friction, to utilize resource friction, or to go along with the existing organizational friction? Managers might play an active role in the creation of resource friction. If managers introduce a new strategy, hire new people, invest in new technical facilities, establish new business relationships, or question established routines, increased friction might be the outcome. By doing so managers can utilize the opportunities that resource friction offers. A positive outcome of friction might be joint problem solving and increased creativity. According to Arrow (1969), transaction costs are friction in the channel. Thus, friction is a cost that managers ought to avoid or reduce. When people with different background, experiences, and skill sets engage with one another problems and misunderstandings arise, arguments occur, and time is consumed before resolution and learning take place (if they do at all) (Hagel and Brown, 2005). The cost associated with friction (e.g. communication, negotiation, coordination and maladaptation costs), makes avoidance of friction a tempting way to walk. As oil decreases the friction between a car wheel and the road, managers can take action to reduce organizational friction. Activities such as team building, customer relationship management, and internal marketing might reduce the level of resistance in the organization. A more indirect way for managers to react is to handle the consequences of friction Instead of initiating or reducing friction, managers might go along with the existing energy in the organization and make the most out of the friction that exist.

128
In this paper, we are to investigate how managers handle resource friction in one specific type of change , an incremental innovation33.
6.4 Methodology The concept “resources” captures a broad range of specific physical, human, and organizational assets, tangible as well as intangible (Teece, Pisano, and Shuen, 1997). When collecting data for this case the resource entity framework was applied (see appendix 2). The resource entity framework is a research tool for investigating resource interfaces developed within the IMP34 group. According to the IMP group, product development is influenced by technical and organizational resource entities, and one of the basic assumptions is that products are created and/or formed in interaction processes. Håkansson and Waluszewski (2002) state that four types of resources are highly dependent on each other. These resources are products, facilities, business units (which incorporate social features related to knowledge, capabilities, routines, and traditions), and business relationships. Thus, it is important to include all of them in an analysis when the intention is to understand product development.
“In order to produce a product, we need a facility that is owned by a business unit, and in order to sell the product we need a business relationship.”
(Håkansson and Waluszewski, 2002:38)
33 Incremental innovations are less frequently studied than the development of moderately to highly innovative new products (Cooper 1993:15). A search of Business Source Premier (BSP), which is a computerized business database that tracks articles published in 7400 business journals, for articles with “innovation” in the title gave more than 10 000 hits, while a search for “incremental innovations” only gave 9 hits, indicating that low innovative products seldom are focal in new product development (NPD) studies. As a comparison the search for “radical innovations” gave 49 hits. 34 IMP is an abbreviation for the Industrial Marketing and Purchasing Project Group. The original IMP group started September 1976 as collaboration between researchers in France, Italy, Sweden, West Germany, and Great Britain. The intention of the project group was to challenge existing theory on the functioning of business markets. An alternative theoretical framework drawing on both economic and behavioral paradigms have been presented by the IMP-group.

129
The case is structured as follows. First, a description of the product and the incremental changes conducted is presented. Then three interfaces are described.
1. the product-facility interface, 2. the product-business unit interface, 3. and the product-business-relationship interface.
A case study focusing on resource interfaces in an incremental innovation is presented in this paper. The case is based on a series of semi-structured interviews conducted with a group of West Fish and REMA executives and employees in the spring of 2003 (see appendix 1), and emphasizes resource interfaces in the modification of a simple saithe block product. By choosing resource interfaces as the level of analysis we were able to investigate the friction between resources, and the case was chosen because of the incremental nature in developing the saithe block products. The overall objective of the study is to: 1. illustrate the level of resource friction in an incremental innovation, 2. and discuss the manager’s role in handling resource friction. Below, we offer a short description of the two organizations investigated 6.4.1 WestFish (WF) The history of WF goes all the way back to the end of the 18th century when WF started to produce cod liver oil. The company has gone through a rather turbulent time, and has been substantially restructured over the last ten years. WF has tuned down what used to be their main business, trading, and focuses instead on industrial operations. To be one of the leading companies in Norway in catch, farming, processing, and sales of fish products is their business idea. Their main product groups are frozen white fish (cod, haddock, saithe, etc.) in various forms (fillets and blocks), klipfish, frozen pelagic fish (herring and mackerel), a wide range of products for the retail market and some fresh fish. Today WF has six trawlers and three shore-based processing plants. Two of the plants are located in Finnmark (Båtsfjord and Kjøllefjord) and one is situated in Ålesund. The saithe block is produced at the Ålesund plant, WF Industries, which is the focal actor in this paper.

130
WF Industries is strategically situated for fish landing, and consists of three production lines: the pelagic fish line, the salted and dried fish line, and the cut portion line where the saithe block is produced. 6.4.2 REMA REMA is a fully Norwegian owned franchise system with a low-price profile, where all the outlets are named REMA 1000. This grocery store chain was established in 1979 by Odd Reitan and administered by what was to become the Reitan Group. REMA consists of 379 outlets, and accounts for 17.4 % of the market share in the Norwegian grocery market (www.dagligvarehandelen.com, 2003). The company’s philosophy is to reduce their own operating costs to a minimum, allowing them to pass along the savings to the end customer. This allows REMA 1000 to maintain retail prices at a very competitive level. The sales floor of an average REMA 1000 store ranges from 400 to 900 sq. m., and a basic assortment of 2000 articles is offered in the store. 6.5 The Case In November 1996 WF Industries invested in a new cutting machine and started to produce small filet blocks of saithe. The raw material was frozen saithe filet blocks bought from sea freezing trawlers, who slaughtered, froze, and packed the fish into 7.484 kg (16.5 pounds) fish blocks on board. These big filet blocks were cut into 675g blocks, vacuum packed and sold to intermediaries. Even though the raw material was high grade saithe, which was frozen within few hours after they were caught, the saithe block product was viewed as a bulk product. All fish caught with trawlers are perceived as less valuable since the fish may be damaged in the trawler net. Since saithe has grayish flesh and is considered an inferior product, the saithe block is a low priced and low margin product. In February 2000 some small incremental changes were made to the product. The saithe block was reduced to 625g and packed in a paper box. Three small cuts were made into the block, which made it easier to cut the block into pieces. These changes improved the consumer handling and increased the sales by approximately 30%. Earlier the consumer needed to melt the entire block to be able to slice it. Everything they did not eat was discarded, since refreezing reduced the quality of the product dramatically. The new package could be placed on the edge of the kitchen table, given a thump, and one piece removed before the package was put back into the freezer. These

131
small changes were great product improvements, especially for a lot of elderly people, who did not eat more than one piece per meal. The new package made the product look more appealing, even though the changes were not drastic. WF chose a package with a gray marble background that looked similar to the old version and reminded the customer of the vacuum packed saithe. 6.5.1 The product –facility interface One technical facility, the cutting machine that cut the block into the right size, was pivotal for the modifications conducted to the saithe block. It was this machine that led to the new product. Without this machine WF would not have been able to make the product, neither the old version nor the new improved version. This machine could easily be adjusted to cut the blocks into different sizes and shapes. An extra cutting blade that made three small cuts into the saithe block was installed. This was a very straightforward technical modification. 6.5.2 The product-business unit interface WF has long traditions with frozen saithe blocks, and small incremental changes to this product did not engage people in the organization. Existing routines and competences were utilized. Consequently, WF Industry met little hindrance when they developed an improved version of the saithe block. In spite of low involvement from other business units the modified saithe block has become a valuable product for WF Industries. The product counts for approximately 50% of the production within the “cut portion” line at WF Industries and is perceived as a central product for this WF actor. Although the strategic focus in WF has moved towards individual quick-frozen fillets (IQF), the saithe block is still perceived as a vital product for WF. IQF loins, tails, and centre cuts, mostly from cod, produced at WF Båtsfjord and sold to, for example, England (Coldwater), France (Dabishell, Leaderprice), and the US (Sysco), get a much higher price than the low margin saithe block. In spite of that, saithe blocks are important for the overall profitability of WF. Tawlers do not deliver only cod. When WF Båtsfjord buys a shipment of fish approximately 60% of the fish goes right into the production of IQF,

132
while 40% is not suitable for production. Some are too big and go to production of salt fish. Some are the wrong species, like saithe, redfish, catfish etc. Some of these, like catfish, can be sold fresh on the fish market at an acceptable price, but it is hard to sell saithe. In that respect, it is important for WF that one of the business units can buy and process saithe. It is important both for the other processing plants and for the 6 WF trawlers. These trawlers have saithe quotas35 that they like to catch, and they need a buyer for the fish. 6.5.3 The product-business relationship interface The relationship between the retailer REMA and WF Industries was vital for the saithe block outcome. REMA bought almost the entire production of the improved saithe block product from May 2000 to December 2003, and by doing so they gave WF easy access to the consumer. An almost equal amount of fish was delivered every week of the year, which made it simple for WF Industries to plan the production and to gain economies of scale. Although REMA was an important actor, they were not involved in the modifications conducted to the saithe block. The changes were initiated by one of the managers at WF Industries who wanted to make the product more appealing and convenient. According to WF, REMA was pleased so long as they got a low priced saithe block with an acceptable quality. The REMA-WF business relationship can be described as a low involvement relationship with sporadic contact. Distribution and sales conditions were negotiated only once a year, which made the sales procedures very efficient. However, the lack of frequent communication between WF and REMA resulted in a vulnerable relationship. Although existing relationships can facilitate incremental innovation, they may also threaten it. In January 2004 REMA decided to buy frozen saithe blocks from another actor than WF, and WF lost a sales contract for more than 600 tons of saithe from one month to another. Suddenly, what was perceived as an advantage had become a hindrance. Continuous delivery of saithe blocks was important for REMA. Since it is more efficient to buy from one big actor than many small actors, REMA was
35 The saithe quota (north of 62°N) for Norwegian sea freezing trawlers in 2005 varies from 407 tones to 1164 tones (odin.dep.no/fkd/norsk/aktult/pressesenter/pressem/047041-070033/dok-bn.hhtml)

133
interested in keeping up the relationship with WF as long as WF could deliver the saithe block product at an acceptable price. The business relationship terminated when REMA found another supplier that they perceived to be a more rational choice. When another manufacturer offered better conditions than WF, REMA chose the new supplier. 6.6 Discussion The case above illustrates the level of resource friction in an incremental innovation. Interactions between organizational resources and technical resources were explored and the result indicates a low level of organizational involvement. According to the case, straight-forward technical changes were conducted, no other business units than WF Industry were involved, and the level of contact between REMA and WF was reduced to a minimum. Although we observed little contact and a low level of involvement in the incremental innovation investigated, that does not necessarily indicate a low level of friction. The level of friction does not depend on how large the contact space between two objects is. It is the resistance that affects the level of friction. A high level of friction is quite possible between two objects with a small interface. The improved saithe block product and the cutting machine had a large interface, but the friction between the resources was low. The saithe block product and the cutting machine had interacted for years and the process worked smoothly. An incremental technical change did not create any conflicts, and a couple of hours after the modification had been implemented the process went on as smoothly as ever. When improving the saithe block product WF utilized existing strategies, competencies, and relationships. The changes conducted did not provoke any one, and business was conducted as usual. No routines or traditions were changed, and no difficult or irritating questions were asked. Accordingly, the level of resource friction associated with this incremental innovation was very low, as was the level of energy created For WF, the opportunity for incremental innovation lies within the utilization of different technical facilities, like the cutting machine. The case illustrates how managers go along with the existing energy flow in the organization. The manager from WF Industries that got the idea and initiated the incremental changes utilized existing technical facilities and existing raw material. He improved an existing product by combining existing raw

134
material and existing technical facilities in a new way. By doing so he created very little friction. In this case managers utilized opportunities offered by the different resource interfaces. None of the interfaces were tested out, or stretched. Not even a little bit. To make the process as efficient and economic as possible it seems like WF managers avoided friction. The interaction with the retailer was reduced to a minimum, internal and external conflicts were avoided, and only straightforward technical changes were conducted. The result was a low level of resource friction. 6.6.1 How to handle friction? When utilizing friction, managers explore the energy in the organization. Disagreement within the organization or discrepancies between the organization and their business relationships are examples of organizational friction. Listening to internal critics and engaging in business relationships might give the manager information that opens up for new possibilities. By utilizing these opportunities managers might be able to adapt their product to changing consumer and supplier needs. Friction is a driving force for change, and when managers constantly explore and utilize existing friction, the innovation process becomes more dynamic. The managers’ role in radical innovation is a paradox. On the one hand, a high level of friction is necessary. A high level of energy is needed for radical changes to come about, and disagreement might help to refine and improve new ideas. Accordingly, managers ought to utilize friction. On the other hand, managers ought to avoid friction. Critical voices might kill radical ideas. Consequently, too much friction might deter radical innovations. Since no one can predict the outcome in advance, managers need to believe in their own ideas, and stay tuned to them throughout the entire process. Small incremental changes, as observed in the WF case, can take place without much friction. Often technical facilities, organizational strategies, competencies, and business relationships need not be changed. Accordingly, managers might avoid the pain and the cost associated with friction. In doing so, they increase the organization’s ability to economize on incremental innovation. If the goal is to be cost efficient and effective in the short run, to avoid friction might be a good strategy. Existing routines can run normally and managers need not engage in problem solving. Everything might seem harmonic and fine, but what will happen in the long run? Although managers might perceive a low level of friction as good for incremental innovations,

135
some friction is necessary for changes to take place. In the WF-REMA relationship the friction was so low that the two actors slipped apart and the business relationship ended. If managers close their eyes and swap organizational problems under the carpet, problems might build up and become so huge that they become unsolvable. Everything might work well for a while, but suddenly the whole relationship brakes apart. While low level of involvement increase the ongoing efficiency, low level of involvement over time can destroy the relationship. Some level of involvement, which creates friction, is necessary for a business relationship to develop. Without friction the actors in the relationship will slip apart, as in the WF-REMA case. We can only speculate as to what would have happened in this case, if the level of involvement had been higher. Maybe they would have worked things out. 6.7 Concluding Remarks In this paper, we have discussed how managers handle resource friction. We argue that a relatively low level of friction is needed for incremental innovation, while a higher level of friction is needed for radical innovation. Consequently, the manager’s role differs for radical and incremental innovation. For radical innovation managers are trapped with the dilemma of a need for friction, but not too much friction. For incremental innovation, the manager’s dilemma is a need for a low level of friction, but not too low. Resource friction consists of both restricting forces and facilitating forces, which makes it challenging for managers to choose action. Even though managers play an active role in innovation, they do not control the whole process. Friction between two resources creates features that might affect other resources and thereby create a domino effect. The effect of the manager’s action will consequently never be only local. The action will create some kind of reaction within a number of related resources – changing some and perhaps even destroying some interfaces (Håkansson and Waluszewski, 2001:10). When REMA decided to stop buying saithe from WF, this action influenced WF Industries, the WF trawlers, and the new supplier that got the order. It is like a game of billiard where a billiard player activates a ball, which hits and activates other balls. The direction of the third or fourth billiard ball is difficult to predict in advance. New product development activities, which have been emphasized in a lot of innovation studies, cannot explain all changes that occur. Resources and the interaction between them needs to be considered. The process of friction, which we have discussed in this paper, is probably one of the economic processes we know least about. We believe that a further investigation of the interactive process between resources can teach us much more about it.

136
6.7 References Annual Reports 1998-2001 for WF - Aarsæther AS, WF Industrier AS, WF
AS, WF Norwegian Salmon AS and WF Eiendom AS. Arrow, K. J. (1969). The Organization of Economic Activity: Issues
Pertinent to the Choice of Market vs. Nonmarket Allocation. The Analysis and Evaluation of Public Expenditure: The PPB System. Washington DC, US Government Printing Office. 1, U.S.: 59-73.
Arthur, WB (1986): Industry location and the importance of history.
Standford: Centre for Economic Policy Research, 84, Stanford University
Barney, J. (1991). Firm Resources and Sustained Competitive Advantage.
Journal of Management, 17(1), 99-120. Booz, Allen, et al. (1982). New Product Management for the 1980's. New
York, Booz, Allen, and Hamilton Inc. Christensen, Clayton M. 2002: The Innovators Dilemma, New York, Harper
Business Essentials Conner, K. R. (1991). "A Historical Comparison of Resource -Based Theory
and Five Schools of Thought Within Industrial Organization Economics: Do We Have a New Theory of the Firm?" Journal of Management 17(1): 121-154.
Cooper, Robert G (1993): Winning at New Products (2nd ed.): Addison-
Wesley, Reading. Cooper, Robert G. (1999): From Experience. The Invisible Success Factors
in Product Innovation. Journal of Product Innovation Management, 16, 115-133.
David, PA (1985): Clio and the economics of QWERTY. Am Econ Rev, 75
(2), 332-337. Day, George S. (1994): The Capabilities of Market-Driven Organizations,
Journal of Marketing, 58 (October), 37-52

137
Dickson, Peter (1996): The Static and Dynamic Mechanics of Competition: A Comment on Hunt and Morgan’s Comparative Advantage Theory, Journal of Marketing, 60 (October), 102-106
Eisenhardt, K. M. and J. A. Martin (2000). "Dynamic Capabilities: What are
they?" Strategic Management Journal 21: 1105-1121. Garcia, R. and R. Calantone (2002). "A critical look at technological
innovation typology and innovativeness terminology: a literature review." The Journal of Product Innovation Management 19: 110-132.
Gatignon, Hubert and Jean-Marc Xuereb (1997), "Strategic Orientation of
the Firm and New Product Performance," Journal of Marketing Research, 34, 77-90.
Grupp, H. (1998). Foundations of economics of innovation: theory,
measurement and practice. Northampton, MA: Edward Elgar Publishing Ltd.
Hagel III, John and John Seely Brown (2005): Productive Friction. How
Difficult Business Partnerships Can Accelerate Innovation, Harvard Business Review, February, 83-91
Hunt, Shelby D and Robert M. Morgan (1995): The Comparative Advantage
Theory of Competition, Journal of Marketing, 60 (October) 107-114.
Hunt, Shelby D and Robert M. Morgan (1996): The Resouce-Advantage
Theory of Competition: Dynamics, Path Dependencies, and Evolutionary Dimensions. Journal of Marketing, 59 (April), 1-15
Håkanson, Håkan and Waluszewsi, Alexandra (2001): Co-evolution in
Technological Development. The role of friction. Håkanson, Håkan and Waluszewsi, Alexandra (2002): Path dependence:
restricting or facilitating technical development?, Journal of Business Research, 55, 561-570
Kleinschmidt, E.J. and Robert G Cooper (1991): The Impact of Product
Innovativeness on Performance, Journal of Product Innovation Management, 8, 240-251.
138
Levitt, Theodore (1966): The Management of Reverse R&D or How to imitate your competitor’s products before it’s too late, Harvard Business Review, September-October
Odin.dep.no Penrose, E. T. (1959). The Theory of the Growth of the Firm. Oxford, UK:
Basil Blackwell. Prahalad, C.K. and Gary Hamel (1990): The Core Competence of the
Corporation, Harvard Business Review, (May/June), 79-91 Schumpeter, J. A. (1942). Capitalism, Socialism and Democracy. New York,
Harper & Row. Slotegraaf, Rebecca J., Christine Moorman, and J. Jeffrey Inman (2003):
The Role of Firm Resources in Returns to Market Deployment, Journal of Marketing Research, Vol. XL (August), 295-309
Song, X. Michael and Mark E. Parry (1997): A Cross-National Comparative
Study of New Product Development Processes: Japan and the United States, Journal of Marketing, 61 (4), 1-18.
Teece, D. J., Pisano, G., and Shuen, A. (1997). Dynamic Capabilities and
Strategic Management. Strategic Management Journal, 18(7), 509-533
Vargo, S. L. and R. F. Lusch (2004). "Evolving to a New Dominant Logic of
Marketing." Journal of Marketing 68(1). Wernerfelt, Birger (1984): A Resource-Based View of the Firm, Strategic
Management Journal, 5 (2), 171-187 Åkerman, R. (1993): A free-falling society? Six introductory notes. In
Åkerman, ed., The Necessity of friction, pp. 6-30. Physica-Verlag, Heidelberg, New York
Appendix 1 25.02.2003 Interview with Harald Kalvøy, REMA 1000 Norge (Product
Manager Private Labels)

139
07.03 2003 Interview with Terje Kjölsöy (marketing and sales manager WF). Rune Vågnes (export manager US WF) and Tore Gjosdal (export manager UK WF).
08.03.2003 Interview with Skarbø (former organizer WF) 09.03 2003 Interview with Tore Gjosdal. 10.03 2003 Interview with Kjell Stette (raw material responsible/fleet
manager WF) 11.03.2003 Visit to WF Skarbøvika processing plant. Interview with
Beate Sperre (quality manager) and Anton Standal (one of the founders).
29.04.2003 Mail from Beate Sperre
13.05.2003 Visit to WF Båtsfjord (Processing plant). Interview with Jan
Roger Eriksen (Managing Director) and Roy Ivar Isaksen (Production Manager).
10.06.2003 Telephone interview with Lars, Managing Director REMA 1000 Amfisenteret, Moss.
28.11.2004 Telephone interview with Anton Standal, WF
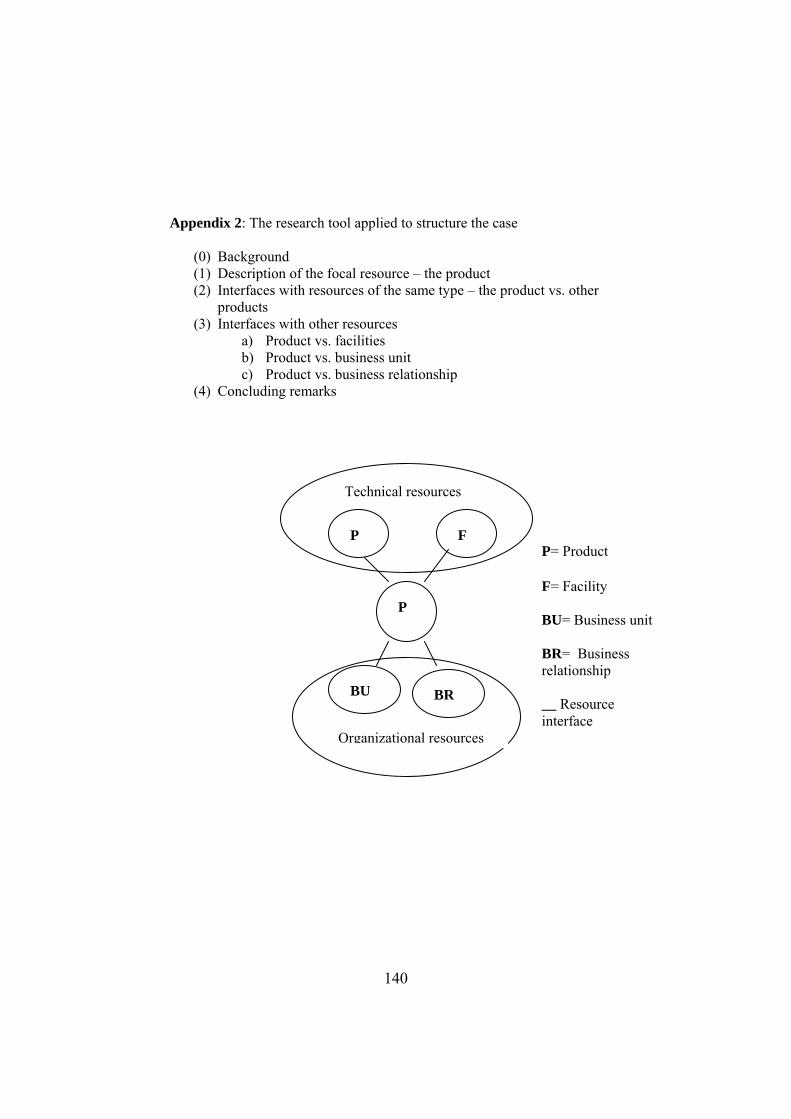
140
Appendix 2: The research tool applied to structure the case
(0) Background (1) Description of the focal resource – the product (2) Interfaces with resources of the same type – the product vs. other
products (3) Interfaces with other resources
a) Product vs. facilities b) Product vs. business unit c) Product vs. business relationship
(4) Concluding remarks
P
P F
BU BR
Technical resources
Organizational resources
P= Product F= Facility BU= Business unit BR= Business relationship __ Resource interface

141
7. Discussion and Concluding Remarks In this final chapter, I present a summary of the results and discuss further the main objective of the dissertation, which is to advance current knowledge about incremental product development. Theoretical as well as managerial implications are offered. I also identify some of the limitations of the studies, and suggest possible topics for future research. 7.1 Results The reported findings in essay one support the argument that narrow and broad scanning each affect the new service development process in a unique way. Narrow scanning has a strong positive effect on profitability through incremental service adaptation; broad scanning has a weak, but significant effect on profitability through incremental service adaptation, and broad scanning positively influence spin-off knowledge. Essay two focuses on the NPD process, and extends the structural approach applied by TCA. We observed that different ways to organize NPD had different effects on the process. Based on what we observed, we propose that an "in-house" solution might create a more efficient NPD process than an outsourcing solution. The "in-house" solution is perceived as a governance form that gives the firm control over the actors, and thereby reduces the direct transaction costs related to safeguarding, negotiations and screening. When motivation and creativity are taken into account the picture becomes more complicated. An in-house solution might not be the most stimulating governance form for developing new products. Even though the two firms had access to the same people and facilities, the actors behaved differently. Less efficient pre-development and a longer time-to-market period characterized the in-house solution. In essay three, two different types of actors within the grocery industry were studied: distributors and manufacturers. The results indicate that distributors conduct different activities than manufacturers when developing new products. The main difference exists within product uniqueness, organization of technical development, and product launch. While new manufacturer brands most often are value-added and higher priced products developed in-house, new distributor brands are mostly low-priced copies of volume products, where the technical development is outsourced to manufacturers. Whereas manufacturer brands are heavily advertised, new distributor brands

142
are launched without almost any market communication. Our results also reveal that the outcome of a new product development process controlled by a distributor differs from the outcome of a process controlled by a manufacturer. Manufacturers launch more new products and fail more often than distributors, while distributor brands had the fastest growth in market share when the brand concentration was low. Essay four emphasizes resource interfaces in incremental innovation. The overall objective is to illustrate the role of resource friction in an incremental innovation, and to discuss the manager’s role in handling resource friction. The concept friction is borrowed from physics and used as a metaphor. In the case, three resource interfaces that were important for the modification of a simple saithe block product were highlighted. These interfaces were 1) the product-facility interface, 2) the product-business unit interface, and 3) the product- business relationship interface. Based on our observation of a low level of resource friction in these interfaces, we argue that a relatively low level of friction is the goal for incremental innovation, while a higher level of friction is needed for radical innovation. Consequently, the manager’s role differs for radical and incremental innovation. For radical innovation managers are trapped with the dilemma of a need for friction, but not too much friction. For incremental innovation the managers dilemma is a need for low level of friction, but not a too low level of friction. Resource friction consists of both restricting forces and facilitating forces making it challenging for managers to choose action. To summarize, these four essays illustrate that NPD activities are important for incremental innovation, but activities do not explain all variance in the outcome. Actors and resources are also vital aspects to consider. In essay one, the point that different activities (exploration vs. exploitation strategies) lead to different outcomes is highlighted. Essay two and three illustrate that different types of actors conduct NPD differently. How intra-organizational NPD differs from inter-organizational NPD is discussed in essay two, while essay three illustrates how manufacturers and distributors conduct different NPD processes and reach different outcomes. Actors have access to different resources and, accordingly, conduct the NPD process differently. In essay four, important resource interfaces in incremental innovation are highlighted and how managers handle friction is discussed. Resources have been differently perceived throughout this dissertation. In the first essay, resources are viewed as limited, and the manager’s role is to allocate scarce resources in the best possible way. Due to scarce resources we argue that managers need to balance their exploration and exploitation strategies. The understanding of resources that we apply in this essay is very

143
different from how we view resources in essay four. While the first article focuses on the limitations of existing resource bases, the last article looks at the possibilities associated with resource combinations. Existing resources can be combined in an unlimited number of ways. Accordingly, the manager’s role is to imagine and utilize these opportunities. How different actors’ access to resources affects their NPD activities is emphasized in essay two and three. Essay two explores how organizations can cooperate, and thereby utilize each other’s resources. The article illustrates how Fjordland utilized TINE’s technical facilities and competencies in another way than TINE did themselves. Essay three, which compare manufacturers and distributor NPD processes and outcomes exemplifies how two kinds of actors with different resources conduct different NPD activities. All of the four essays explore incremental innovation in one way or another. Hotels, retailers, and food manufacturers (e.g. dairy and fish) NPD has been investigated. These are all actors associated with incremental innovations. Retailers develop copycat products of national market leaders, the fish industry in Norway is renowned for their low level of value added production, hotels conduct mostly minor improvements of existing products and so does the dairy industry in Norway. In the next section, a further discussion of the role of resources in incremental innovation is presented. 7.2 Resources and incremental NPD A firm needs resources, tangible as well as intangible, to be able to develop new products. Conducting the right activities is not sufficient for NPD success. To prepare your self for an exam is crucial, but if you read the wrong book, hard work will not improve your grades. Christensen (2002) describes this phenomenon beautifully in the introduction to his famous book "The innovator's dilemma". The ancients who attempted to fly by strapping feathered wings to their arms and flapping with all their might as they leapt from high places invariably failed. Despite their dreams and hard work, they were fighting against some very powerful forces of nature. As this picture shows, our understanding of the world (which is one of our resources) limits our abilities. Resources might give the firm the freedom to choose what activities and organizational structure they prefer, but without the right resources the firm does not have a free choice. Nelson and Winther state, "it is quite inappropriate to conceive of firm behavior in terms of

144
deliberate choice from a broad menu of alternatives… The menu is not broad, but narrow and idiosyncratic (1982)". 7.2.1 What is a resource? Resources have been defined as specific physical, human, and organizational assets that can be used to implement value-creating strategies (Teece, Pisano, and Shuen, 1997). Also business relationships, which are the tools that direct and interrelate the different company’s resources to each other, have been defined as a resource (Håkansson and Waluszewski, 2002). Resources might be both tangible and intangible.
Table 7.1: Tangible and intangible resources
Tangible
Intangible
Physical Equipment Plants Financial asset
Atmosphere
Human Number Age
Skills Knowledge
Organizational Size Age
Routines Reputation
Inter-organizational
Frequency Age
Routines Reputation
Physical resources capture tangible aspects as, for example, technical facilities (equipment and plants) and financial assets, but also more intangible aspects like atmosphere. Atmosphere is the feeling you get when you enter into a physical environment. It is the impression you obtain from what you see, smell, hear and feel. Tangible aspect of the human resource base consist of, for example, the number and age of people involved, while these people’s skills and knowledge are intangible. Organizational and inter-organizational skills and knowledge reside in routines and reputation. Reputations often summarize a good deal of information about firms (Teece, Pisano, and Shuen, 1997), and the repetitive pattern of activity in or between organizations, which we define as routines, captures the organizations memory (Nelson and Winther, 1982:105). Many organizational routines are quite tacit in nature. Accordingly, routines contain intangible aspects of an

145
organizations resource base. An organization does also have more tangible aspects, like age and size. An inter-organizational resource consists of both tangible aspects, like how often and for how long actors interact, and intangible aspects, like indefinable relationship routines and how others perceive the relationship. Many studies within the RBV have looked at organizational capabilities. An organizational capability, which is the firm's ability to create value, is closely linked to a firm's resource base. Different capability constructs and definitions exist in the literature. Local capabilities (individual units of knowledge), architectural capabilities (linkages of individual units of knowledge), and process capabilities (dynamic interaction of knowledge), which are just some of the constructs in use are different layers of the organizational capability construct (Kusunoki, Nonaka, Nagata, 1998) (see appendix 1). Recently, scholars have extended RBV to dynamic markets, and the concept dynamic capability has been introduced. RBV has been criticized for not adequately explaining how and why certain firms have competitive advantage in situations of rapid and unpredictable change, and the need for a more dynamic construct has been highlighted. According to Galunic and Eisenhardt (2001), dynamic capabilities are the organizational and strategic processes by which managers manipulate resources into new productive assets. Dynamic capabilities capture the firm's ability to sense opportunities and to renew competence (Teece, 1997). When looking at all these different capability constructs and how they are defined, some questions pop up. One question is: Is a capability a part of the resource base, an effect of the resource base, or an antecedent to the resource base? Some pioneering research defines organizational capabilities as a collection of firm specific resources (Penrose, 1959; Wernerfelt, 1984; Barney, 1986). As an example, Leonard- Barton (1992) defines a core capability as the organization's knowledge set, which is described as a set of different skills, assets, and routines. Instead of viewing organizational capabilities as equal to the firms resource-base, organizational capabilities are here perceived, based on Teece et al. (1997), as dependent on the firm's resources. Organizational assets, as facilities, skills, and knowledge, limit what an organization can do. In that respect, an organizational capability is an

146
outcome of the firms resource base. An organization is not able to do more than what the resource-base permits. One dimension of the construct organizational capability is the organizations dynamic capability. A dynamic capability is the organization's ability to change. A dynamic capability is a determinant of the resource base, since the ability to change also affects the resource base. RBV has been criticized for being tautological. When Teece et al (1997) define core competence as the competence that defines the firm's fundamental business, they come perilously close to saying that a core competence is a competence that is core (Williamson, 1999). The argument above supports this view. Resources define what an organization can do, but the resource-base is also affected by how the firm acts. Resources affect organizational capabilities, while a dynamic capability, which is one dimension of the organizational capability, affects the resource base, and the whole model becomes circular. To answer the question above, capabilities are both the means and the end of the resource base, but they are not equal to the resource base.
Figure 7.1: Illustration of the Resource-Capability Process
Dynamic capabilities
Resources • Tangible • Intangible
Organizational capabilities

147
One way to try to solve this tautology is to treat capabilities as embedded in different processes, which leads us into question number two. Is a capability to be treated as embedded in the process (activity structure), or as embedded in the resource structure? According to Teece et al. (1997) organizational capabilities are embedded in organizational processes, but the content of these processes and the opportunities they afford for developing competitive advantage at any point in time are significantly shaped by the assets the firm possesses. This way of thinking is followed by Eisenhardt and Martin (2000) who argue that dynamic capabilities are a set of specific and identifiable processes such as product development. Dynamic capabilities are detailed, analytic, stable processes with predictable outcomes (Eisenhardt and Martin, 2000:1105). By looking at what an organization does, we can paint a picture of what the organization is able to do. This must be the logic in the statements above. Is that so? To assume that activities and capabilities are the same requires assuming that all allocated resources are always deployed, which we know is not the case from the literature on resource slack (Slotegraaf, Moorman, and Inman, 2003). Organizational capabilities limit what an organization can do, but since organizations do not always utilize their full potential, activities do not mirror capabilities. Activities might only partly reflect organizational capabilities, since there might be a gap between what they are able to and what they actually do. Capabilities are therefore better understood by looking at the organization's resource-base. According to the IMP approach, resources are embedded into each other (Håkansson and Waluszewski, 2002:33). The value of resources is not given, but emerges from resource combinations. Resource combinations can refer to resources that are mainly technical and physical, such as products36 or production facilities, but it can also refer to resources of a social origin, such as the skills and knowledge of individuals or groups. Resources are embedded into a network of resources both within and outside the firm’s boundaries.
36 Håkansson and Waluszewski, 2002:33 states that: ”products are essential resources within networks and they are created and/or formed in the interaction process”.

148
7.2.2 The role of resources in incremental innovation My understanding of the role of resources in incremental innovation has emerged throughout the process of writing this dissertation. The way I see it now, incremental innovation is a dynamic process. Actor’s access to resources, utilization of resources, and creation of new resources influences what incremental innovation activities are conducted, and visa versa. A lot of studies within the Cooper school have emphasized how NPD activities influence the NPD outcome. As essay one illustrates, this is also the case for incremental innovation. Accordingly, activities conducted influence the creation of new products, which according to the IMP approach is a resource. Creation of new resources also influences the organizations total resource base, which again affects what the organization is able to do. In essay two and three we observed how actors with access to different resources conducted different incremental innovation activities. When developing incremental innovations, firms exploit their existing resource base. Contrary to radical innovation where firms explore new possibilities and often need to invest in new facilities, existing facilities and organizational capabilities need to be utilized when incremental innovations are developed. Actor’s access to resources is not the only factor that matters. How they utilize their resource base or create new resources is also important. We imply in essay four that the manager’s imagination and creativity affect incremental innovation. The ways they think affect their action. We propose that it is not only what you have, but also what you do with it that matters. Motivation and the way managers think affect resource utilization and resource creation. We also propose that manager’s motivation might be affected by their access to valuable raw material. Easy access to valuable raw material makes it possible to achieve success without being creative. Accordingly, a manager’s motivation for creativity might not be stimulated. A manager’s imagination is always important for success, but it is most important for actors without valuable raw materials. By combining existing resources in a new way new opportunities may occur37.
37 The fish industry in Norway has access to a raw material that the EU market wants. This is not the case for the agricultural firms in Norway. Consequently we observe a higher level of product development in TINE then in WF.

149
Figure 7.2: A dynamic framework of incremental innovation activities, resources, and actors
Actors utilization of resources
Actors creation of resources
Actors access to resources
Incremental Innovation activities

150
7.3 Implications The main contribution of this dissertation is the extension of the traditional focus on activities within the Cooper school to include actors and resources. Hopefully, this research will contribute to an increased understanding of the role of unique actors and heterogeneous resources in incremental product development. Below we will look further into theoretical, methodological and practical implications of this dissertation. 7.3.1 Theoretical implications Traditional NPD research focuses on the causal relationship between activities and outcome, while we argue that incremental innovation is a dynamic interplay between activities, resources and actors.
Table 7.2: Illustration of existing theories view on actors and resources Actors One More than one
Given The Cooper School
TCA
Resources
Created RBV
IMP
We propose that the Cooper school model, where NPD activities are investigated within one firm’s boundaries and where resources are perceived as given, is an underspecified model. The actor perspective needs to be extended to include more than one actor. When doing so it is easier to see the importance of resource creation. Actors may utilize each other’s capabilities and thereby create new resources. Existing schools of thought already emphasize the importance of resource creation (RBV and IMP) and interorganizational relationships (TCA and IMP), but the main focus of these research traditions is not NPD. Transaction cost analysis (TCA) seeks to analyze the optimal way of governing various interrelated activities. Resources are perceived as given, and the focus is on reducing costs. The resource based view of the firm (RBV) emphasizes the “service that

151
resources render” (Penrose, 1959). The focus here is on the opportunities resources offer within one firm. Within the IMP tradition, resource interactions in networks are investigated. The unit of analysis is not limited by a firm’s boundaries. Instead bonds, ties, or links between inter-organizational activities, resources, or actors are investigated. In this dissertation an eclectic approach is applied, and an incremental innovation framework is developed based on knowledge from TCA, RBV, and IMP. The traditional NPD model is extended to include the role of resources and the interplay between actors. One theoretical contribution of the dissertation lies in its attempt to illustrate how different actors access to resources influence incremental innovation. In essay two and three we highlight that actors with access to different resources conduct different NPD activities. Access to resources influences how actors organize the NPD process. If an organization does not have access to resources in-house, an inter-organizational NPD process might be the solution. We observed in essay two how TINE and Fjordland organized their NPD process differently. Fjordland, which lacked technical facilities, had an inter-organizational NPD process with TINE, while TINE conducted the whole NPD process in-house. The results from the comparison of the inter-organizational NPD process with the intra-organization NPD process indicates that governance form influence the NPD process, and thereby contributes to extend our understanding of inter-organizational product development. Access to resources and organizational goals also interact. Manufacturers and distributors differ in accordance to both resources and goals. By investigating the NPD process from the distributor’s point of view we observed that the development of distributor brands varied from manufacturers NPD, both in process and outcome. To perceive all actors as equal is, accordingly, a wrong assumption to make. By investigating distributor’s NPD process we highlight an actor that is seldom focal in NPD research. Another contribution of the dissertation is the attention drawn to the actor’s utilization of resources in incremental innovation. Previous research has highlighted that resource friction consists of both restricting forces and facilitating forces (Håkansson and Waluszewski, 2002). By exploring resource friction in an incremental innovation, we emphasized the manager’s role in incremental innovation. When utilizing friction, managers explore the energy in the organization. Disagreement within the organization or discrepancies between the organization and their business relationships are examples of organizational friction. Listening to internal critics and

152
engaging in business relationships might give the manager information that opens up for new possibilities. By utilizing these opportunities managers might be able to adapt their product to changing consumer and supplier needs. For change to come about a resource needs to be activated towards other resources. The number of resource combinations possible is infinite, and the opportunities offered are only limited by the manager’s intellect. Accordingly, a manager’s lack of imagination is a strong restrictor of innovation. For incremental innovation, the manager’s dilemma is to find the right balance of resource friction. Finally, one contribution of the dissertation lies in its identification of the interplay between activities, resources, and actors in incremental innovation. Resources in NPD can be created, not only allocated and utilized. Accordingly, the conventional perspective of resources as scarce and limited is broadened to include the possibilities associated with new resource combinations. In essay one we introduce the concepts of narrow and broad market scanning and investigate how these two different ways to scan the market affect organizational learning and product adaptation. By creating new products or organizational knowledge, the organization’s resource base is extended. Access to resources affects the manager’s activities, but activities also affect the resource base. The interplay between activities, resources, and actors is, accordingly, a dynamic process. 7.3.2 Methodological implications
It was six men of Indostan To learning much inclined, Who went to see the Elephant (Though all of them were blind) That each by observation Might satisfy his mind. John Godfrey Saxe (1816-1887)
The poem of the six blind men and the elephant illustrates the difficulty of capturing a good picture of an elephant by investigating only one part of it. One of the blind men, the one that touched the squirming trunk described the elephant as a snake, while another one imagined the elephant to be like a wall. That was probably the one that felt the belly. To fall into the same trap as the six blind men is easy. As researchers we try to grasp concepts and understand large phenomenon, but sometimes we look at the phenomenon from the same viewpoint over and over again. By

153
looking at the phenomenon we are interested in from different points of view, our understanding should increase. The same goes for the choice of tools. The famous quote from Mark Twain “If you have a hammer, all you see is a nail”, illustrates the problems with only one tool. The research tools we understand and are able to utilize influence what kind of problems we see and investigate. This understanding of viewpoints and research tools has influenced the research conducted in this dissertation. To be able to choose research tool that fit the research problem, and not the other way around, it has been important for me to learn more than one analytical tool throughout the time it took to write this dissertation. The methodological tools applied varied from cross-sectional studies analyzed with structural equation modeling and analyzes of longitudinal AC Nielsen data, to case studies. The different tools allowed me to investigate incremental innovation from different viewpoints. 7.3.3 Practical implications The practical implications of this dissertation are linked to the management of incremental product development. Some of the practical implications for managers that are mentioned in earlier chapters are summarized below:
1. Managers need to balance between exploration and exploitation strategies.
2. Managers must distinguish between short-term and long-term performance.
3. Managers should address both narrow and broad market scanning. 4. Managers need to be aware the differences between outsourcing and
internal governance of the NPD process. 5. Managers need to be aware the differences between manufacturer’s
and distributor’s NPD processes and outcomes. 6. Managers play a vital role in the creation of resources and
innovation. Resources can be combined in an unlimited number of ways. Accordingly, the manager’s imagination and creativity facilitate creation of new resources and innovation.

154
7.4 Limitations and Future Research To write a dissertation is a learning process, and my understanding of incremental innovation is not the same today as it was when I started this process more than 4 years ago. That things should have been done differently are, therefore, easy to see in retrospect. All the different studies conducted have their limitations, but instead of viewing these limitations as problems, let us look upon them as possibilities for future research. In essay one there is a possibility for improving the questionnaire. Especially the measures for the newly developed construct “spin-off knowledge” can be improved. An improvement potential also exists in the measurement of incremental vs. discontinues innovation, and short term vs. long-term performance. In essay two, which is restricted to a comparison of two firms, a possibility for theory testing exists. The propositions stated can be tested on a larger sample. Future research should also look further into other aspects of inter-organizational NPD. The third essay might also be extended to include other actors, other products, and other outcome measures. Three product categories, pizza, jam, and juice are investigated in the Norwegian market. We do not know if we will find the same results in other product categories and/or other markets, which opens up for new investigations. Since the manufacturer is the most studied NPD actor, research that focus on other focal NPD actors, such as suppliers and consumers is needed. The last essay, which is explorative and idea generating, opens up for theory testing. The ideas presented here need to be further investigated. Do managers utilize or avoid resource friction? Is medium level of friction the best for change? These propositions can be tested in cross-sectional studies.The proposed framework in chapter 7.2.2 of incremental innovation might also be further refined and tested. The danger of grasping a lot of different aspects and utilizing different methodologies and research tools in one dissertation is that none of the aspects or methods get the attention they deserve. Although, a calculated risk, I see in retrospect that some parts of the dissertation have been done injustices, and that follow up studies are necessary. Throughout this dissertation new questions have been asked that need to be further investigated in the time to come.

155
7.5 References Barney, J. (1991). "Firm Resources and Sustained Competitive Advantage."
Journal of Management 17(1): 99-120. Christensen, Clayton M. 2002: The Innovators Dilemma, New York, Harper
Business Essentials Eisenhardt, K. M. and J. A. Martin (2000). "Dynamic Capabilities: What are
they?" Strategic Management Journal 21: 1105-1121. Galunic, C. D. and K. M. Eisenhardt (2001). "Architectural innovation and
modular corporate forms." Academy of Management Journal 44(6): 1220-1249.
Håkansson, H. and A. Waluszewski (2002). Managing Technological
Development. IKEA, the environment and technology. London, Routledge.
Kusunoki, K., I. Nonaka, et al. (1998). "Organizational Capabilities in
Product Development of Japanese Firms: A Conceptual Framework and Empirical Findings." Organizational Science Vol. 9(6): 699-718.
Leonard-Barton, D. (1992). "Core Capabilities and Core Rigidities: A
Paradox in Managing New Product Development." Strategic Management Journal 13: 111-125.
Nelson, Richard R. and Sidney G. Winter (1982), An Evolutionary Theory of
Economic Change. Cambridge, MA: Belknop Press. Penrose, E. T. (1959). The Theory of the Growth of the Firm. Oxford, UK,
Basil Blackwell. Slotegraaf, R. J., C. Moorman, et al. (2003). "The Role of Firm Resources in
Returns to Market Deployment." Journal of Marketing Research XL(August): 295-309.
Teece, D. J., G. Pisano, et al. (1997). "Dynamic Capabilities and Strategic
Management." Strategic Management Journal 18(7): 509-533.

156
Wernerfelt, Birger (1984): A Resource-Based View of the Firm, Strategic Management Journal, 5 (2), 171-187
Williamson, O. E. (1999). "Strategic Research: Governance and Competence
Perspectives." Strategic Management Journal 20: 1087-1108.

157
Appendix
Appendix 1: Different capability constructs
Appendix 2: Different resource definitions
Appendix 3: Definitions of incremental innovation
Appendix 4: Literature review; Antecedents to NPD Success 1994-2001
Appendix 5: Different NPD Success factors

158
Appendix 1: Different capability constructs Concept Definition Dimensions Means-end Link to
NPD Core Capabilities (Leonard-Barton, 1992)
a set of differentiated skills, complementary assets, and routines that provides the basis for a firm's competitive capacities and sustainable advantage in a particular business. (Based on Teece, Pisano and Shuen 1990)
1. knowledge and skills
2. technical systems
3. managerial systems
4. values and norms
Core capabilities are institutionalized. A core capability is an interrelated, interdependent knowledge system.
Means-end capabilities-SCA
Capabilities enhance development. Core rigidities inhibit development
Organi-zational Capabilities (Kusunoki, Nonaka, Nagata, 1998)
Organizational capability consists of various types of knowledge that are created and accumulated within the firm. O.C. as a Multilayered Knowledge: Knowledge base, knowledge frame, knowledge dynamics
A. Dynamic capabilities: Process capabilities, Architectural capabilities
B. Local capabilities
(Core capabilities= particular organizational capabilities holding a crucial relationship with performance.)
Means Knowledge layers affect organizational capabilities.
Organizational capabilities = capabilities of new product development NPD capabilities affect NPD performance
Dynamic Capabilities (Teece, Pisano, Shuen 1997)
as the firm's ability to integrate, build, and reconfigure internal and external competences to address rapidly changing environments. Dynamic capabilities thus reflect an
Organizational and managerial processes: • Coordination/in
tegration • Learning • reconfiguration
and transformation
Positions • Technical
Means-end: capability-SCA. Capabilities can provide competitive advantage and generate rents only if they are based on a
Is not linked specifically to NPD.

159
organization's ability to achieve new and innovative forms of competitive advantage given path dependencies and market positions (Leonard-Barton, 1992)
assets • Complementar
y assets • financial assets • reputational
assets • structural
assets • Institutional
assets • Market
(structure) assets
• Organizational boundaries
Paths • Path
dependencies • Technological
opportunities • Assessment (Core capabilities= competences that define a firm's fundamental business.)
collection of routines, skills, and complementary assets that are difficult to imitate.
Dynamic capabilities (Eisenhardt, Marting, 2000)
The firm's processes that use resources-specifically the processes to integrate, reconfigure, gain and release resources- to match and even create market change. Dynamic capabilities thus are the organizational and strategic routines by which firms achieve new resource configurations as
Specific organizational and strategic processes (e.g. product innovation) by which managers alter their resource base. Commonalties (i.e. best practice) with some idiosyncratic details. Depending on market dynamism, ranging from detailed analytic routines to simple, experiential ones.
Means By defining dynamic capabilities in terms of their functional relationship to resource manipulation, their value is defined independent of firm performance. This enables empirical
Product development routines by which managers combine their varied skills and functional backgrounds to create revenue-producing products and services are such a dynamic capability.

160
markets emerge, collide, split, evolve, and die
Depending on market dynamism, predictable or unpredictable. Competitive advantage from valuable, and fungible dynamic capabilities. Unique path shaped by learning mechanisms such as practice, codification, mistakes, and pacing.
falsification.
First-order competences, integrated competences, second-order competences (Danneels, 2002)
First-order competence= customer and technological competences Second-order competence: the competence to acquire first-order competence, can be thought of as competence at explorative learning by exploring new markets or exploring new technology
Technological competence: • Manufacturing
plant and equipment
• manufacturing know-how
• engineering know-how
• quality assurance tools
Customer Competence • Knowledge of
customer needs and processes
• Distribution and sales channel
• Company/Brand Reputation
It is means and end, but not a means-end Competence ↑↓ New product
New products are a vehicle for organizational learning about technology and customers, and competence about technology and customers have to come together in new product development.
Cooperative competency Sivadas and Dwyer (2000)
cooperative competency (c.c.) is a property of the relationship among the organizational entities participating in
c.c. refers to the midrange variable composed of three interrelated facets: trust, communication, and coordination.
Means cooperative competency among the departmental units involved is related

161
NPD positively to internal NPD success cc. among the partners is related positively to alliance NPD success (cc is affected by governance structures, in that internally conducted innovation processes provide higher levels of cooperative competency than those in the NPD efforts of alliances)

162
Appendix 2: Different resource definitions Author(s) Definition Dynamic or static Song and Parry (1997)
Functional-Specific sources of advantage (marketing and technical skill and resources) and project-specific sources of advantage (internal commitment and cross functional integration) affect quality of implementation in the NPD process
Gatignon and Xuereb (1997)
The greater the resources of a firm, the more market power, which is a competitive advantage that translates into better performance of the new product.
Moorman and Slotegraaf (1999)
Two capabilities must be present-marketing capabilities and technology capabilities- for effective product development
Slotegraaf, Moorman, and Inman (2003)
Intangible marketing resources refer to marketing-specific resources such as brand equity and customer relationships (resources that arise from a firm’s interaction with the market) Intangible technological resources possess the same intangible features, yet are tied more closely with R&D and refer to resources such as patents and trademarks Financial resources refer to cash or financial capital that an organization possesses.
Dynamic 1. Resources arise 2. Interaction
Sorescu, Chandy and Prabhu (2003)
Marketing and technology resources.

163
In addition to aggregate resources it is necessary to examine the pre-product level of resource deployment or product support.
Henard and Szymanski, (2001)
Predictors of NP performance • Marketing synergy • Technological
synergy • Dedicated human
resources • Dedicated R&D
resources
Montoya-Weiss and Calantone (1994)
Company resources, defined as capital, manufacturing facilities, and manpower requirement, are among the six least studied factors in product development
Vargo and Lusch (2004)
Operand resources: resources on which an operation or act is performed to produce an effect. Operant resources are resources that produce effects. They are often invisible and intangible. They are likely to be dynamic and infinite and not static and finite, as is usually the case with operand resources
Dynamic Because operant resources produce effects, they enable humans both to multiply the value of natural resources and to create additional operant resources
Lee and Grewal (2004)
They use the amount of slack resources to assess organizational resources. Slack resources are the buffer of idle resources that enables firms to be flexible and improvise. Tangible resources
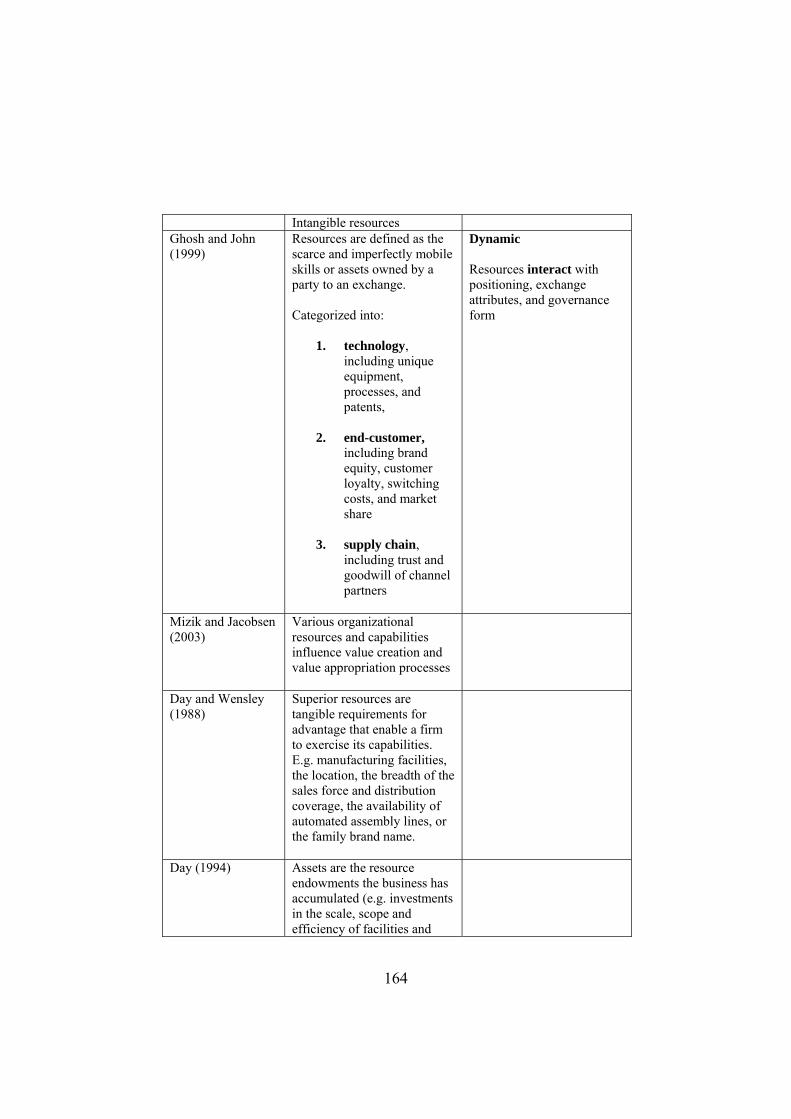
164
Intangible resources Ghosh and John (1999)
Resources are defined as the scarce and imperfectly mobile skills or assets owned by a party to an exchange. Categorized into:
1. technology, including unique equipment, processes, and patents,
2. end-customer,
including brand equity, customer loyalty, switching costs, and market share
3. supply chain,
including trust and goodwill of channel partners
Dynamic Resources interact with positioning, exchange attributes, and governance form
Mizik and Jacobsen (2003)
Various organizational resources and capabilities influence value creation and value appropriation processes
Day and Wensley (1988)
Superior resources are tangible requirements for advantage that enable a firm to exercise its capabilities. E.g. manufacturing facilities, the location, the breadth of the sales force and distribution coverage, the availability of automated assembly lines, or the family brand name.
Day (1994) Assets are the resource endowments the business has accumulated (e.g. investments in the scale, scope and efficiency of facilities and
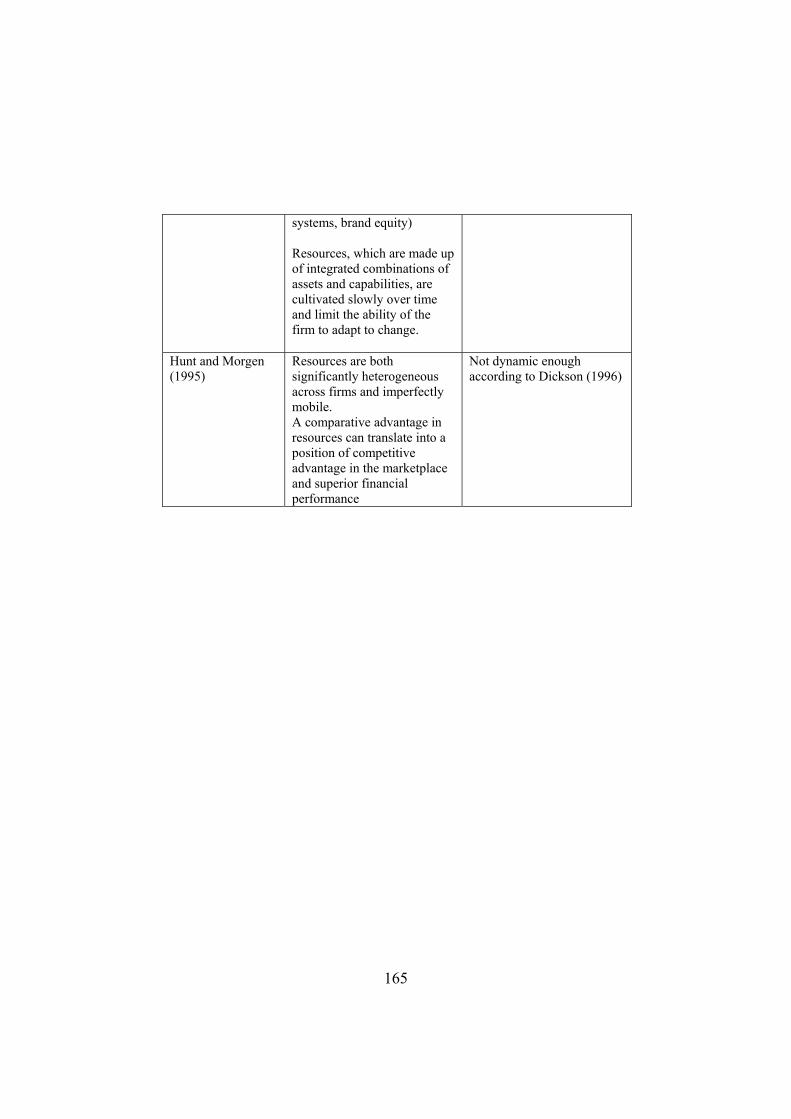
165
systems, brand equity) Resources, which are made up of integrated combinations of assets and capabilities, are cultivated slowly over time and limit the ability of the firm to adapt to change.
Hunt and Morgen (1995)
Resources are both significantly heterogeneous across firms and imperfectly mobile. A comparative advantage in resources can translate into a position of competitive advantage in the marketplace and superior financial performance
Not dynamic enough according to Dickson (1996)

166
Appendix 3: Definitions of incremental innovation Articles Definition Means-End Garcia and Calantone (2002), JPIM
Incremental innovations are low innovativeness products. Incremental innovations will occur only on a micro perspective affecting either the marketing and/or the technology S-curve(s)
End
Song and Montoya-Weiss (1998), JPIM
An incremental new product involves the adaptation, refinement, and enhancement of existing products and/or production and delivery system
Means
Rothwell and Gardiner (1988), JMM
I.I. can occur at all stages of the NPD process. At the conceptualization process, R&D may use existing technology to improve an existing product design. At the mature stage of a products life, line extensions may result in incremental innovations. I.I. = product improvements and line extensions
End
Kleinschmidt and Cooper (1991), JPIM
Low innovativeness products consist of modifications to existing products; redesigned products to achieve cost reductions; and repositioning. A low innovativeness product scores low on level of newness for the firm and level of newness for the market. Three categories of innovativeness were developed: Highly, moderate
End

167
and low innovative.
Christensen (2002) Innovation refers to changes in technology, when technology is defined as the process by which an organization transform labor, capital, material and information into products and services of greater value. Two categories of change exist; radical and incremental. Incremental changes build upon well-practiced technological capabilities, and lead to improvement in products and sustainable technology. Radical change require very different technological capabilities, and lead to disruptive or redefined performance trajectories.
Means-end
Zaltman, Duncan and Holbek (1973)
Routine (variation) innovation Radical (reorientation) innovation

168
Appendix 4: Literature review; Antecedents to NPD Success 1994-2001 Author(s) Theoretical Prediction Empirical
support Method and sample
Product Characteristics Li and Calantone (1998)
New product advantage→Market performance Buyers generally form favorable perceptions of new products with superior features and they prefer such products in terms of both purchase preference and actual behavior when the benefits of these features outweigh the costs
significant p<0.01
n= 236 (24.8 % response rate ) US software industry Key informant: Presidents and CEOs Unit of analysis: Product Design: Cross-sectional
Song, Souder and Dyer (1997)
Product Quality → New product performance
significant p<0.05
n=65 projects 34 success and 31 failure products. 17 large multidivisional Japanese firms from the high-tech industry Consensus in entire development and marketing teams. Design: Cross-sectional
Song and Parry (1997)
Positional Advantage of Product Differentiation →Relative Product Performance Differentiated products offer greater potential for customer satisfaction and loyalty
significant p<0.05
788 Japanese and 612 U.S. NPD projects from 312 U.S. firms and 404 Japanese firms. Response rate 81% and 87% Design: Cross-sectional

169
Cooper (1994)
The number one success factor is a unique superior product: A differentiated product that delivers unique benefits and superior value to the customer.
N=1000 new product launches in more than 350 firms in Europe and North America over the last two decades
Cooper (1999)
One of the top success factors is delivering a differentiated product with unique customer benefits and superior value for the user.
25 years of research into why new products succeed.
Firm Strategy Characteristics Tellis and Golder (1996)
Market pioneering is neither necessary nor sufficient for long-term success and leadership. Instead enduring market leaders embody five principles more critical to success than pioneering. 1. vision 2. persistence 3. commitment 4. innovation 5. asset leverage
1500 articles in 25 different periodicals 275 books Design: Historical method
Ittner and Larcker (1997)
Product Development Cycle Time (+) → Organizational Performance Faster development cycles in themselves do not lead to higher performance. Performance is a function of the interaction between cycle time reduction and organizational practices. Moderating hypothesis: • Greater use of Cross-functional
Development Teams • Customer and Supplier
involvement in the development process
• Use of advanced design tools • Higher perceived product quality • Less innovation in Product
Design • Greater reliance on external
sources of technology • Adapted technology from
n.s. sig. n.s. sig. sig. n.s. partial support
N= 184 (61% response rate) Automobile and computer industry in Canada, Germany, Japan, and the United States. Design: Cross-sectional

170
competitor (-)
sig.
Robinson and Min (2002)
Increase in lead time(+)→ pioneer survival Delayed market entry(+) → early followers survival
sig. sig.
N= 167 first-entrant market pioneers, and 267 early followers. Industrial goods firms. Design: Cross-sectional
Chryssochoidis and Wong (2000)
NPD timeliness (+)→Success Time delays imply that more resources are incurred, leading to costs over-run. Additionally, delays in market introduction may lead to revenue losses because of reduces sales and customer acceptance due to competitors' preemptions.
sig. p<0.01
N=30 NPD projects. 6 products from five industries. Multinational corporations, whose European headquarters are located in the U.K. Design: Case research approach
Swink (2000)
Top Management Support (+)→ NPD Goal Achievement A high level of visible support for the project generates enthusiasm, and committed top level managers are more willing to fight for resources needed for the project.
significant p<0.01
N=136 (10.1% response rate) Key informant: R&D executive Manufacturing industries in U.S. Design: Cross-sectional
Li and Calantone (1998)
Top management's perceived importance of market knowledge (+)→customer knowledge process (+)→marketing – R&D interface (+)→competitor knowledge process (+/-) →R&D streght Unless top managers understand and appreciate the value of market knowledge, the organization is unlikely to pursue vigorously those activities that generate market knowledge (+)→New product advantage
sig. p<0.01 sig. p<0.01 sig. p<0.01 sig. p<0.01 sig. p<0.01
see above
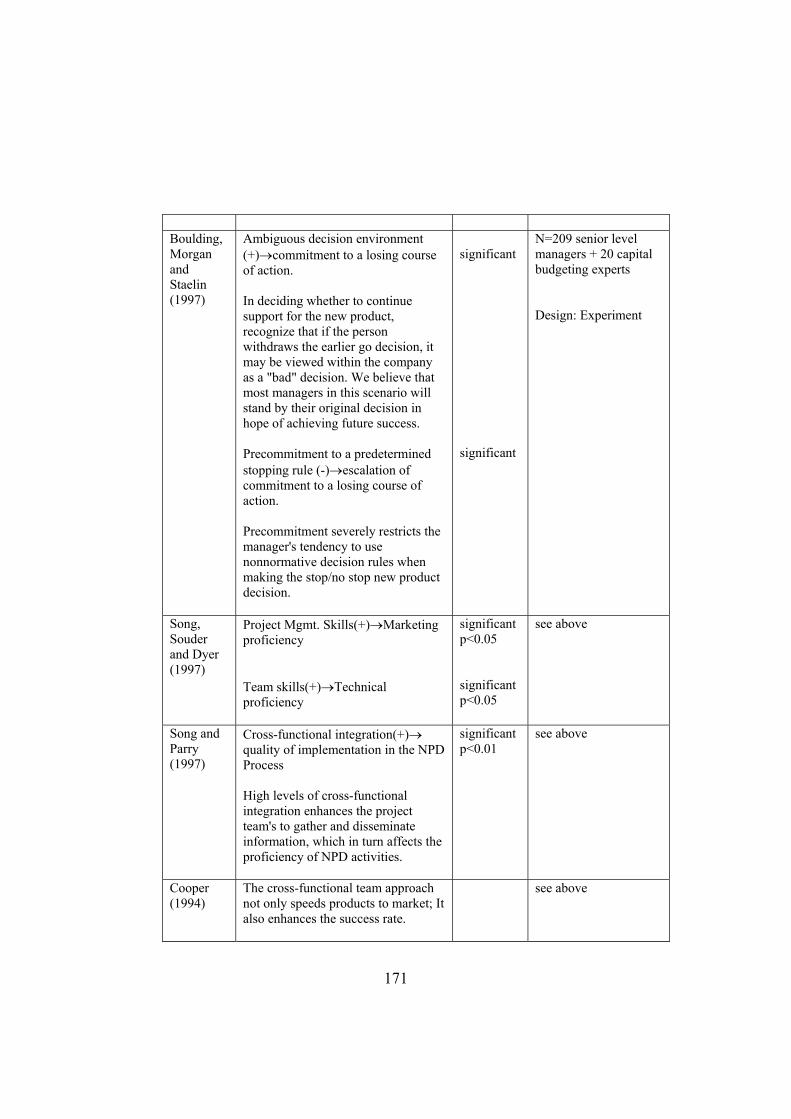
171
Boulding, Morgan and Staelin (1997)
Ambiguous decision environment (+)→commitment to a losing course of action. In deciding whether to continue support for the new product, recognize that if the person withdraws the earlier go decision, it may be viewed within the company as a "bad" decision. We believe that most managers in this scenario will stand by their original decision in hope of achieving future success. Precommitment to a predetermined stopping rule (-)→escalation of commitment to a losing course of action. Precommitment severely restricts the manager's tendency to use nonnormative decision rules when making the stop/no stop new product decision.
significant significant
N=209 senior level managers + 20 capital budgeting experts Design: Experiment
Song, Souder and Dyer (1997)
Project Mgmt. Skills(+)→Marketing proficiency Team skills(+)→Technical proficiency
significant p<0.05 significant p<0.05
see above
Song and Parry (1997)
Cross-functional integration(+)→ quality of implementation in the NPD Process High levels of cross-functional integration enhances the project team's to gather and disseminate information, which in turn affects the proficiency of NPD activities.
significant p<0.01
see above
Cooper (1994)
The cross-functional team approach not only speeds products to market; It also enhances the success rate.
see above

172
Cooper (1999)
Good organizational design is strongly linked to success Good organizational design means project that are organized as a cross-functional team, led by a strong project leader, accountable for the entire project from beginning to end, dedicated, and focused, and where top management is committed to the project.
see above
Firm Process Characteristics Cooper (1994)
Success or failure is often decided in the first few stages of the projects: The up-front homework is pivotal to success. Sharp and early product definition-before product development begins- decides the winners and helps to keep projects on time. Quality of execution is paramount: The various steps and actions which make up the innovation process- how well they are done, and whether they are done, drive new product outcomes.
see above
Cooper (1999)
Build in the Voice of the customer Demand sharp, stable and early product definition Plan and resource the market launch…..early in the game. Solid up-front homework pays off
see above
Song and Parry (1997)
Quality of implementation in the NPD process affect product differentiation idea development and screening proficiency(+)→ business and market opportunity analysis proficiency(+)→
negative (sig) significant p<0.01
see above

173
product testing proficiency(+)→ product commercialization proficiency(+)→ technical development proficiency(+)→ Proficiency affect the strength of the relationship between sources of advantage and the positional advantages of product differentiaiton.
significant p<0.05 partial support significant p<0.05
Souder and Jenssen (1999)
Development proficiency(+)→ degree of commercial success Marketing proficiency (+)→ degree of commercial success
significant p<0.01 significant p<0.001
n=150 products 20 U.S. and 20 Scandinavia SBU
Song, Souder and Dyer (1997)
Marketing proficiency (+)→Product quality Technical proficiency(+)→ Product quality
significant p<0.05 n.s.
see above
Athuahene-Gima (1995)
Market orientation (+)→New product performance
significant p<0.01
n=600 service and manufacturing firms Australia Design: Cross-sectional
Gatignon and Xuereb (1997)
Firm strategic orientation(+)→Innovation performance (Customer, Competitor, Technological)
significant p<0.01
n=393 (14% response rate) U.S. Key informant: marketing executives Design: Cross-sectional
Marketplace Characteristics Moorman and Miner
Organizational improvisation level → New product and process
two midsize U.S.firms

174
(1997) outcomes Moderator variable: Environmental turbulence level
significant p<0.05
N=107 action events key informant: team leaders
Athuahene-Gima (1995)
Market orientation (+)→New product performance Moderator variables: • Environmental hostility • Intensity of market competition
significant p<0.01 significant p<0.02
see above
Souder and Song (1997)
Moderator variables: Market uncertainty Under low market uncertainty, designing performance superiority and technical superiority is negatively correlated with commercial success for U.S. small firms.
sig. p<0.001
n=200 20 U.S. small firms 15 Fortune 500 firms 15 Japanese firms two success and two failure outcome products were sought from each firm complete agreement was required of two or more knowledgeable respondents Design: Cross-sectional
Yap and Souder (1994)
Moderating variables: Technical uncertainty: Organic organization →success Under low technical uncertainty(+) Under high technical uncertainty(-) Market uncertainty Product Advantage →success Under low market uncertainty(-) Under high market uncertainty
sig. sig. sig. ns
N=48 12 firms x (2 successful + 2 unsuccessfull projects) high-technology electronics firms in U.S. Consensus: chief executive, chief technical, and chief marketing officers.

175
Design: Cross-sectional
Gatignon and Xuereb (1997)
Moderating variables: Market growth: A stronger customer orientation and a stronger competitor orientation are required in fast-growing markets competitive intensity: A stronger customer orientation and a stronger competitor orientation are required in highly competitive markets. demand uncertainty: A stronger customer orientation and a stronger technology orientation are required in which demand uncertainty is low
significant p<0.05
see above
Li and Calantone (1998)
Competition intensity (+)→ Competitor knowledge process
n.s. see above
Song and Parry (1997)
Product Differentiation →Relative Product Performance Moderating factors: • Environmental factors The conversion of positional advantage into performance outcomes is not automatic but is moderated by other factors
significant p<0.05
see above

176
Appendix 5: Different NPD Success factors Constructs Author(s) Definition Product Characteristics Product Advantage Henard and Szymanski
(2001)
Superiority and/or differentiation over competitive offerings
Product Advantage Montoya-Weiss and Calantone (1994)
Customer's perception of product superiority with respect to quality, cost-benefit ratio, or function relative to competitors
Product meeting customer needs
Henard and Szymanski (2001)
Extent to which product is perceived as satisfying desires/needs of the customer
Firm Strategy Characteristics
Order of entry Henard and Szymanski (2001)
Timing of marketplace entry with a product/service
Speed to market Montoya-Weiss and Calantone (1994)
The speed of the development process or launch effort. Included are measures which refer to launch timing, development cycle time, and first or second to market effects.
Dedicated human resources
Henard and Szymanski (2001)
Focused commitment of personnel resources to a new product initiative
Dedicated R&D resources
Henard and Szymanski (2001)
Focused commitment of R&D resources to a new product initiative
Top Management Support, Control, and Skills
Montoya-Weiss and Calantone (1994)
Top management's commitment to the project, as well as their day-to-day involvement, guidance/direction, and control over the project development. The idea of key individuals is also included.
Organizational factors
Montoya-Weiss and Calantone (1994)
The organizational structure of the firm, specifically with respect to the new product project (teams, new venture, matrix). It also includes measures of organizational climate, size, centralization, rewards structure, and job design)
Firm Process Characteristics
Predevelopment task proficiency
Henard and Szymanski (2001)
Proficiency with which a firm executes the prelaunch activities (e.g. , idea

177
generation/screening, market research, financial analyses)
Proficiency of predevelopment activities
Montoya-Weiss and Calantone (1994)
Proficinecy of intitial screening, preliminary market and technical assessment, detailed market study and market research, and preliminary business/financial analysis
Marketing task proficiency
Henard and Szymanski (2001)
Proficiency with which a firm executes its marketing activities
Proficiency of market-related activities
Montoya-Weiss and Calantone (1994)
Proficiency of marketing research, customer tests of prototypes or samples, test markets/trial selling, service, advertising, distribution, and market launch
Technological proficiency
Henard and Szymanski (2001)
Proficiency of a firm's use of technology in a new product initiative
Proficiency of Technological Activities
Montoya-Weiss and Calantone (1994)
Proficiency of product development, in house testing of the product or prototype, trial/pilot production, production start-up, and obtaining necessary technology.
Launch proficiency Henard and Szymanski (2001)
Proficiency with which a firm launches the product/service
Marketplace Characteristics
Market potential
Henard and Szymanski (2001)
Anticipated growth in customers demand in the marketplace
Market potential Montoya-Weiss and Calantone (1994)
This factor is a measure of market (and demand) size and growth, as well as an indication of customer need level for the product type. This measure also indicates the importance of the product to the customer