incumbent and entrant incentives with network interconnection
TRANSCRIPT

INCUMBENT AND ENTRANT INCENTIVES WITH NETWORK INTERCONNECTION:THE CASE OF US TELECOMMUNICATIONS
Mark A. Jamison∗
University of [email protected]
Abstract
I examine how incumbents and entrants respond to prices for network interconnection in
telecommunications. I find that low prices for entrants to lease incumbents' facilities, exchange
traffic, and buy incumbents’ services for resale increase entry. However, if prices for leasing
incumbents' facilities are low relative to incumbents' retail prices, then less entry occurs,
presumably because incumbents hinder entry to protect profits. Higher prices for exchanging
traffic increase entrants’ market share, presumably because they target customers (such as
Internet Service Providers) who receive more calls than they make. Low prices for reselling
services do not cause entrants to choose reselling over other supply methods.
∗ This paper is a work in progress. Please do not cite or quote without permission of the author. I would like to
thank David Sappington, Steve Slutsky, and Chunrong Ai for their comments on the model. I would also like tothank Melis Uygur, Eric Chiang, Eileen Pun, and Janice Hauge for their assistance in gathering data, Verizon,SBC, Sprint, and US West for providing data, and AT&T for funding data collection. All errors and omissionsare my own.

1
1. Introduction
The situation often arises in which one firm sells an input to another firm and then
competes against the other firm in the market for the final product. Examples include local
exchange telephone companies selling access to long distance companies and then competing in
the long distance business themselves (Willig, 1979), vertically integrated electricity companies
or natural gas pipeline companies selling transport to their generating or gas supplier competitors
(Economides and White, 1995), railroads providing trackage to other railroads (Baumol, 1983),
Internet backbone providers competing with Internet Service Providers (Crémer et al., 2000;
Kende, 2000) and incumbent local exchange telephone companies interconnecting their networks
with and selling services to new entrants (Katz, 1997). The issue of how to price this input is
often couched in the context of a regulated firm interconnecting its network with a new entrant,
but the issue could also apply to an unregulated monopolist providing an essential facility to
downstream competitors (Economides and White 1995).
An extensive theoretical literature has developed on pricing these inputs and, at least in
the case of telecommunications, a number of case studies and manuals have been written to assist
industry regulators in overseeing these prices. I know of two empirical studies (Ros and
McDermott, 2000, and Rosston and Wimmer, 2000) that examine entrants’ responses to prices
for interconnecting telecommunications networks. Both find that low prices encourage entry.
Missing from this literature is an empirical test of how incumbents respond to interconnection
prices. This test is important because prices that encourage entry may also encourage
incumbents to hinder entry in order to protect profits. In this paper, I take an initial step to fill
2
this empirical void by testing how interconnection pricing in US telecommunications has
affected the early development of competition in local telephone networks.1 My main findings
are that low prices for entrants to lease incumbents' facilities, exchange traffic, and buy
incumbents’ services for resale increase entry. However, if prices for leasing incumbents'
facilities are low relative to incumbents' retail prices, then less entry occurs, presumably because
incumbents hinder entry to protect profits. Higher prices for exchanging traffic increase
entrants’ market share, presumably because they target customers who receive more calls than
they make. Entrants appear to resell incumbent services as part of a strategy to gain customers
while building networks.
The US Telecommunications Act of 1996 (1996 Act) made allowing competition in
almost all telecommunications markets a national policy and provides three methods of entry for
local telephone service (illustrated in Figure 1). Some entrants use more than one method.
Entrants can build their own facility-based network, lease portions of an incumbent local
exchange company's (incumbent) network, or buy an incumbent’s services and resell them.2 The
1996 Act requires incumbents and entrants to interconnect their networks to exchange calls.
Exchanging calls between competing networks is necessary for customers of one company to be
1 Telecommunications has traditionally been divided between long distance service and local exchange service.Local exchange service in the US consists of a telephone line and calling within a local calling area, which istypically a city or town. Long distance is calling between local exchange areas. This distinction between local andlong distance was based on late 1800's technological limits and the original city-by-city franchising arrangementsunder which the US telephone system developed. These reasons lost their relevance long ago, but the distinction hasremained for regulatory purposes.
2 Traditional voice telecommunications networks consist of lines and switches. Lines either connect customers tothe network or connect switches in the network. Switches route calls between customers. Switches are of twotypes: local switches (also called central offices) that customers connect to and that switch local calls, and longdistance switches (also called tandem or toll offices) that route long distance calls from one local switch to another.

3
able to call customers of another company. Payment for exchanging calls is called reciprocal
compensation in the US.3
Incumbentcentraloffice
Entrantcentraloffice
Interconnectiontrunks
CustomersLocallines
Incumbent Facilities
Entrant Facilities
Leased Facilities
Ownership Varies
Incumbent Customers
Entrant Customers
Legend
Figure 1. Interconnection Arrangements
Leasing portions of an incumbent’s network is called purchasing unbundled network
elements (UNEs). Figure 1 shows how an entrant would lease a local telephone line from the
incumbent. The line would connect to the incumbent’s building. It could then connect to the
incumbent’s switch or the entrant’s switch, depending on how the entrant wishes to use the
incumbent’s facilities. Entrants that have their own switches must interconnect their switches
3 “Reciprocal” means that both companies involved in an interconnection are obligated to make payments.“Symmetric” reciprocal compensation means the companies charge the same prices to each other. Reciprocalcompensation prices are generally symmetric in the US, so I assume symmetry in my models.

4
with those of an incumbent and pay reciprocal compensation for terminating telephone calls on
the incumbent’s network. Figure 1 shows how lines, called trunks, would connect the incumbent
and entrant central offices. Likewise, an incumbent must pay reciprocal compensation for
terminating calls to an entrant. The 1996 Act states that prices for UNEs and for reciprocal
compensation are to be cost-based, which regulators have generally concluded means that they
should be based on incremental cost.4 Regarding resale, Figure 1 shows an entrant’s customer
using a resold service. In a sense, reselling is little more than rebranding the incumbent’s service.
The 1996 Act says that wholesale prices must be based upon retail prices minus the portion
attributable to marketing, billing, collection, and other costs avoided by the incumbent when it
does not provide the retail service.
Ros and McDermott (2000) and Rosston and Wimmer (2000) examine how removal of
subsidies from long distance to local service, and from business customers to residential
customers, affect entry by new competitors. Both find that entrants are more likely to enter local
exchanges where incumbents' retail prices are above incremental cost. Ros and McDermott
(2000) also examine how UNE and resale affect entrants' incentives to enter markets, but do not
include reciprocal compensation in their study and do not examine how interconnection prices
affect incumbents' incentives to hinder entry. I incorporate reciprocal compensation and the
effects of interconnection prices on incumbents in this study and obtain findings that conflict
with some conclusions of Ros and McDermott (2000) and Rosston and Wimmer (2000).
4 This is based on a review of state commission interconnection decisions located on the National RegulatoryResearch Institute's web site (NRRI, 1998) for 1998, the time period for my study, the FCC and all state regulatorsbut Arkansas determined that incumbents’ prices for UNEs should be based upon incremental cost. Arkansas chosean accounting cost allocation approach called fully distributed cost as its method. Twenty-nine percent of the statesalso chose to base reciprocal compensation prices on incremental cost and the rest chose bill and keep. The FCC'spolicies allow for bill and keep, but do not mandate it. Some states that adopted bill and keep applied the policyonly as long as the traffic exchange is relatively balanced.

5
Before presenting my results, I summarize empirical research on the development of
competition in telecommunications. One of the earliest contributions in this area is Crandall
(1991), who finds that investment in private telecommunications networks increased from 1984
to 1989. Tomlinson (1995), Ai and Sappington (1998), and Woroch (2000) find that new entry
prompts incumbents to increase investment. Greenstein et al. (1995) find that entry by
competitive access providers has no measurable affect on incumbents’ investment levels, but that
removal of regulatory restrictions on entry encourages incumbents’ investment in fiber optics.
Ros (1999) finds that competition increases teledensity (telephone lines per 1000 population) and
decreases investment in the sample countries with liberalization. Dekimpe et al. (1998),
Gutierrez and Berg (2000), and Wallston (2000) also find that competition increases output.
Blank et al. (1998) show that entry by long distance companies into Bell Operating Company
intraLATA long distance markets lowers Bell Operating Company intraLATA long distance
prices.5 Spiller and Cardilli (1997) conclude that the absence of clear rules on interconnection
and parity for long distance competitors in terms of the how customers can use their services,
causes delays in entry and disadvantages new competitors. They also find that limiting rights for
entrants to use incumbents’ networks encourages investment by entrants.
The rest of this paper is organized as follows. In section 2, I describe the theories that I
am testing. Section 3 describes my data and methods. Section 4 presents my findings and
Section 5 is the conclusion.
5 The AT&T divestiture agreement of 1982 restricted the Bell Operating Companies from providing long distanceservice, except in limited areas (called Local Access Transport Areas, or LATAs).

6
2. Theory
Shepherd (1997), Noll (1995), Katz (1997), and Gulati et al. (2000) describe competitive
issues in network industries with an incumbent monopoly or a dominant firm. Shepherd (1997)
explains that a dominant firm may be able to hinder competition by controlling key inputs or
using strategic pricing, or by virtue of its information advantage relative to customers, regulators,
and rivals. Noll (1995) explains that incumbents may hinder entrants by refusing or hindering
interconnection and delaying regulatory proceedings on entry policies. Because retail prices are
generally regulated in telecommunications, he concludes that an incumbent's ability to hinder
entry may be the best available indicator of market power. Katz (1997) shows that a dominant
firm has a greater incentive to hinder entry than an entrant has to successfully enter a market
because the dominant firm receives monopoly profits if it succeeds while the entrant’s profits are
less than that if it succeeds. Gulati et al. (2000) explain that when firms form a network of
companies, the dominant firm sets the boundaries of the firms in the network. The dominant
firm sells inputs to rivals only if selling the inputs is more profitable for the dominant firm than
using the inputs itself to provide downstream products.
An extensive literature has developed on pricing inputs sold to rivals. One of the first
methods proposed was the Baumol-Willig Rule, which is now known as the Efficient
Component Pricing Rule (ECPR). (Baumol and Sidak, 1994a, 1994b, and 1995; Kahn and
Taylor, 1994; Hausman and Tardiff, 1995; Larson and Parsons, 1994; and Larson, 1997.)
Developed by Willig (1979) and Baumol (1983), the ECPR emphasizes developing prices that
ensure that the entrant survives only if it is more efficient than the incumbent is. The ECPR
ensures that an incumbent makes the same profit from selling the input as it does from selling the
final product, thus making the incumbent indifferent as to which it sells. Ordover et al. (1985)

7
explain that, if the incumbent’s profits on the input are less than its profits on the final product,
then the incumbent could be expected to protect its retail market. Examples of incumbents’
efforts to protect markets might include providing poor quality to entrants, delaying collocation,
delaying negotiations, and aggressive marketing.
The pricing method favored by regulators is to set the input price equal to the
incumbent’s incremental cost with only a small mark-up for covering common costs. The
underlying theory is that entrants would have difficulty competing if input prices were set
according to the ECPR because entrants would be denied the opportunity to take retail profits
from the incumbent. Furthermore, the ECPR is efficient only under strict assumption, which do
not apply in telecommunications. (Mitchell et al., 1995; Albon, 1994; Economides and White,
1995; Tye and Lapuerta, 1996; and Tye, 1994.)
A third method, which applies only to reciprocal compensation, is called bill and keep or
sender keeps all. The underlying theory is that the number of calls exchanged between two
networks should be about equal in both directions, so charging is unnecessary. (Brock 1995)
Laffont et al. (1998a, 1998b) show that reciprocal compensation can lead to collusive
market results. When two firms interconnect for exchanging calls, each firm’s reciprocal
compensation price is a marginal cost to the other firm. Therefore, a higher reciprocal
compensation price can both increase a firm's revenues and raise its rival’s costs. An incumbent
can preclude entry by fledgling rivals by increasing reciprocal compensation prices.
I test the effects of regulatory decisions on pricing interconnection by examining how
market entry and entrant market shares are affected by (i) price levels for UNEs and reciprocal
compensation, (ii) the relationship between an incumbent’s price-cost margin on UNEs and its
price-cost margin on retail services, and (iii) the relationships between an incumbent’s price-cost

8
margin reciprocal compensation to its price-cost margin on retail services. Because reciprocal
compensation prices can be zero (as in the case of bill and keep), I express the relationships
between price-cost margins for inputs and retail services as the ratio of two ratios: (i) the ratio of
the input’s price to its cost and (ii) the ratio of local retail service prices to their costs. If
incumbents are able to hinder entry, then higher values of this ratio of ratios should be associated
with more entry.
Some observers expressed concern that entrants would take advantage of large wholesale
discounts to simply resell services and not build networks. (Harris and Kraft, 1997) I test the
impact of wholesale discounts chosen by regulators by examining how they affect the level of
entry and entrants' market share. If entrants avoid building facilities when discounts are large,
then large discounts should be associated with (i) a low market share for entrants using their own
facilities or UNEs and (ii) higher levels of service resale. If incumbents are able to hinder entry
and incumbents make less profit on resale than on retail services, then large discounts would be
associated with less entry and fewer resold services.
The 1996 Act established other policies designed to facilitate entry into local
telecommunications exchanges. It mandates collocation, the process by which entrants locate
their equipment in incumbents’ buildings. Collocation decreases entrants' costs of
interconnection and using UNEs, relative to entrants placing their equipment some distance away
from the incumbents’ facilities. I control for the effects of the availability of collocation by
including in my models the percent of the incumbent's telephone lines that can be accessed
through collocation arrangements.
The 1996 Act also requires competitively neutral means for subsidizing local telephone
service. Some regulators have chosen to implement this policy in part by rebalancing prices, the

9
process by which incumbents increase some prices and decrease other prices in order to remove
implicit subsidies and align prices with incremental cost. Another common method for
implementing this policy is for regulators to develop a "tax" on telephone services, the monies
from which are distributed to companies based on their serving customers who the regulators
determine should have subsidized prices. I test the effects of rebalancing by including in my
model the ratio of the incumbent's revenues from local telephone services to its cost of providing
a telephone line. Higher ratios indicate higher profits for local telephone services. Higher ratios
would be associated with (i) more entry and higher market share for entrants if they are willing
and able to respond to this incentive or (ii) less entry and lower market share for entrants if
incumbents are able to hinder their rivals. Following Ros and McDermott (2000), I test for the
effects of early reforms to the subsidy system by including in my models a dummy variable that
indicates whether the state regulator for the market has begun reforming these subsidies.
4. Methods and Data
I consider three types of models. The first describes entry. The second describes how
entrants expand their market share by constructing their own networks and using UNEs. The
third describes how entrants expand their market share by reselling incumbents’ services. I first
describe the market entry models.
4.1. Entry Models
I analyze how regulatory policies affect entrants’ entry decisions and incumbents'
decisions to hinder entry by extending Bresnahan and Reiss’s (1991) and Berry’s (1992) ordered

10
probit models for entry, which apply a zero-profit equilibrium for entrants. Ordered probit
models are used when dependent variables are discrete and represent ordered outcomes. Figure
2 shows the number of entrants by market for 1998. Because of data restrictions, I consider each
incumbent’s traditional local exchange areas in a state to be a market.6 The number of entrants
ranges from 0 to 164. Over 130 entry levels in this range are not observed and many have only
one observation. This poses a problem for using an ordered probit because multiple observations
for each value of the dependent variable are necessary to estimate probabilities of observing a
market with a particular level of entry. To address this problem, I create an ordinal dependent
variable, with values from 0 to 8, and which represents ranges of entry levels. I give markets
with 0 to 2 entrants a value of 0, markets with 3 to 4 entrants a value of 1, markets with 5 to 7
entrants a value of 2, and so on as shown in Figure 2.
More entry is expected in larger markets, in markets where regulatory policies are
conducive to entry and in markets where incumbents do not hinder entry. The previous section
explains the effects of UNE, reciprocal compensation, and wholesale prices. Further explanation
is needed for the effects of reciprocal compensation prices. Entrants receive more reciprocal
compensation payments than they pay (i.e., are net receivers) if they obtain customers who are
net receivers of minutes of calling (which I simply refer to as minutes). An Internet Service
Provider (ISP) is an example of a customer that receives more minutes than it sends. A
6 This causes distortions because for a given incumbent, an entrant may choose to enter some of the incumbent’slocal exchanges and not enter others, and may choose to supply only some areas of a local exchange. Becauseregulators generally require incumbents to average retail prices across exchanges and to charge lower retail prices inrural areas than in urban areas, and because per customer costs are generally lower in high density, urban areas thanin rural areas, I expect entrants to serve urban areas first. Therefore, regions with higher than average proportions ofurban areas should have more entry than areas that are below average. To control for this effect, I include in mymodels a measure of customer density. Higher customer density indicates markets with higher than averageproportions of urban areas.

11
0 1 1 1 1 2 2 2 3 3 3 4 4 4 4 4 6 6 7 7 7 9 10 1114
18 19 20 20 22 24 24 24 25 25 25 28 28 30 32 32 34 34 35 36 37 3841 43 44
50 51 5460
7484
132
164
20
0
20
40
60
80
100
120
140
160
180
Markets
Num
ber o
f Ent
rant
s
0 1 2 3 4 5 6 7 8Value forDependentVariable
Figure 2. Entry Observations
residential customer who uses telephone lines to reach an ISP, and does so for several hours per
month, is an example of a customer that makes more minutes than it receives. High reciprocal
compensation price-cost margins encourage entry if entrants are generally better able than
incumbents to attract customers who are net receivers of minutes. This effect of high reciprocal
compensation price-cost margins decreases as additional entrants enter the market because the
number of available net-receiver customers decreases. Low symmetric reciprocal compensation
price-cost margins encourage entry for firms that net senders of minutes.
My dependent variable measures the number of entrants in a market, which includes
those that use their own facilities, those that use UNEs, those that are pure resellers, and those
that use some combination of the three entry methods. Because competition in local networks
was new at the time of this study, it is unlikely that the data represent a long-run equilibrium. I
12
adjust for this disequilibrium by including as an explanatory variable the amount of time that has
elapsed since entrants were allowed to enter each market.
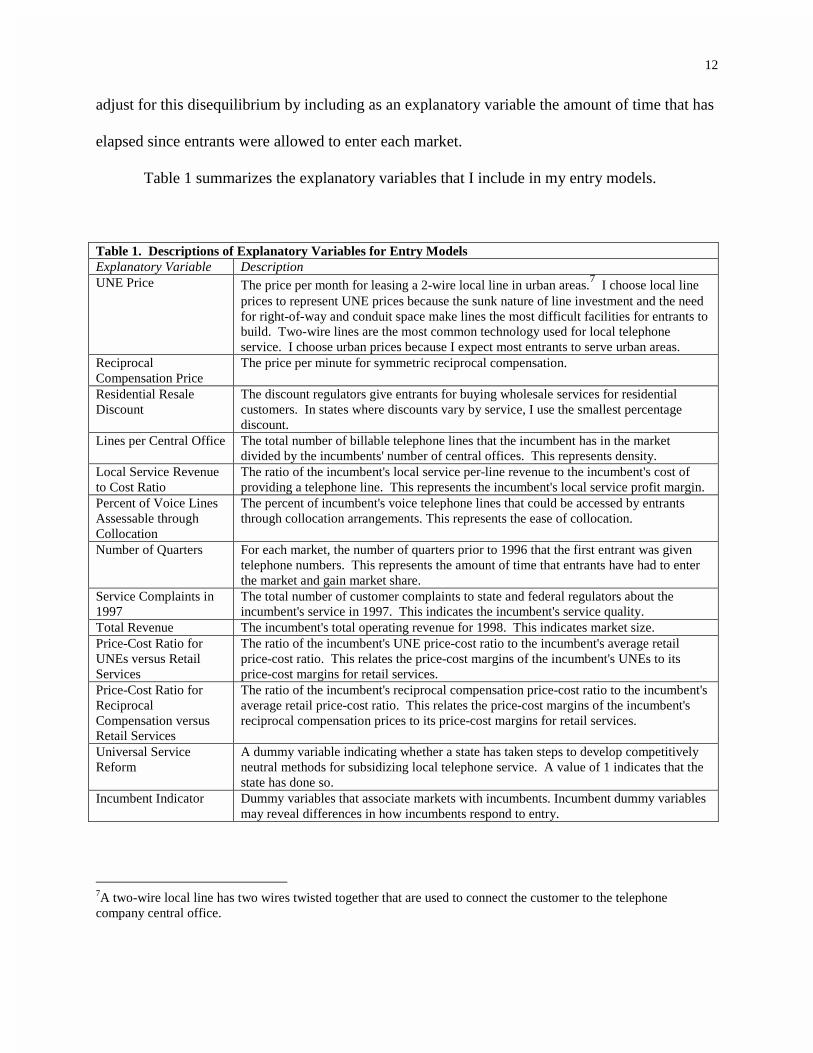
Table 1 summarizes the explanatory variables that I include in my entry models.
Table 1. Descriptions of Explanatory Variables for Entry ModelsExplanatory Variable DescriptionUNE Price The price per month for leasing a 2-wire local line in urban areas.7 I choose local line
prices to represent UNE prices because the sunk nature of line investment and the needfor right-of-way and conduit space make lines the most difficult facilities for entrants tobuild. Two-wire lines are the most common technology used for local telephoneservice. I choose urban prices because I expect most entrants to serve urban areas.
ReciprocalCompensation Price
The price per minute for symmetric reciprocal compensation.
Residential ResaleDiscount
The discount regulators give entrants for buying wholesale services for residentialcustomers. In states where discounts vary by service, I use the smallest percentagediscount.
Lines per Central Office The total number of billable telephone lines that the incumbent has in the marketdivided by the incumbents' number of central offices. This represents density.
Local Service Revenueto Cost Ratio
The ratio of the incumbent's local service per-line revenue to the incumbent's cost ofproviding a telephone line. This represents the incumbent's local service profit margin.
Percent of Voice LinesAssessable throughCollocation
The percent of incumbent's voice telephone lines that could be accessed by entrantsthrough collocation arrangements. This represents the ease of collocation.
Number of Quarters For each market, the number of quarters prior to 1996 that the first entrant was giventelephone numbers. This represents the amount of time that entrants have had to enterthe market and gain market share.
Service Complaints in1997
The total number of customer complaints to state and federal regulators about theincumbent's service in 1997. This indicates the incumbent's service quality.
Total Revenue The incumbent's total operating revenue for 1998. This indicates market size.Price-Cost Ratio forUNEs versus RetailServices
The ratio of the incumbent's UNE price-cost ratio to the incumbent's average retailprice-cost ratio. This relates the price-cost margins of the incumbent's UNEs to itsprice-cost margins for retail services.
Price-Cost Ratio forReciprocalCompensation versusRetail Services
The ratio of the incumbent's reciprocal compensation price-cost ratio to the incumbent'saverage retail price-cost ratio. This relates the price-cost margins of the incumbent'sreciprocal compensation prices to its price-cost margins for retail services.
Universal ServiceReform
A dummy variable indicating whether a state has taken steps to develop competitivelyneutral methods for subsidizing local telephone service. A value of 1 indicates that thestate has done so.
Incumbent Indicator Dummy variables that associate markets with incumbents. Incumbent dummy variablesmay reveal differences in how incumbents respond to entry.
7A two-wire local line has two wires twisted together that are used to connect the customer to the telephonecompany central office.

13
4.2. Models for Entrant Market Share
Now consider the second and third types of models, those that describe how entrants
expand their market share. I use ordinary least squares regression to examine entrants’ market
share. I consider two measures of entrant output. The first measure is the number of entrant
interconnections to the incumbent. These interconnections, called trunks, are necessary for
exchanging minutes between entrant and incumbent customers. Figure 1 illustrates how these
trunks interconnect central offices. Higher numbers of trunks indicate higher amounts of entrant
output for customers served by entrant facilities and UNEs. Trunks understate entrant supply if
the entrants are large because, as an entrant grows, the number of minutes that stay on the
entrant’s network generally increase. This happens because the probability of a call originating
on an entrant’s network also terminating on that entrant’s network generally increases as the
entrant attracts more customers. Trunks overstate entrant supply if there are many small
entrants, or entrants whose customers are dispersed geographically. This happens because these
entrants’ low traffic volumes keep them from making efficient use of their local interconnection
trunks. Figure 1 also illustrates how entrants use a local loop UNE. The local loop UNE
connects the entrant customer to the incumbent’s building that houses the incumbent’s central
office. At the central office, the entrant can either connect the customer to its own central office
or use switching UNEs to route customer traffic.
My second measure of entrant supply is the number of business resold lines, i.e., the
number of units of local telephone service that entrants resell to businesses. Figure 1 shows how
entrant customers of resold services use incumbent facilities in the same way that the
incumbents’ own customers do. For models of entrant market share, I divide the dependent

14
variables and certain explanatory variables by the number of incumbent telephone lines in the
market. This indexes these variables according to market size.
The theory underlying for these models is similar to the underlying theory for the models
for entry. Larger entrant market share is expected in markets where regulatory policies are
conducive to entrants and in markets where incumbents respond less aggressively to entrants
serving the market demand. Prices for UNEs, reciprocal compensation, and wholesale services,
and price-cost ratios retail services relative to those for UNEs and reciprocal compensation
should affect market share as described above for entry. Greater availability of collocation
should increase entrants’ market penetration and cause entrants to use less resale when
collocation lowers entrants’ costs of UNEs or facilities. Table 2 describes the explanatory
variables in my market share models that are not also in my entry models.
Table 2. Descriptions of Explanatory Variables for Market Share ModelsExplanatory Variable DescriptionBusiness Resale The discount regulators give entrants for buying wholesale business services. In states
where discounts vary by service, I use the smallest percentage discount.Local Revenue Per Line The incumbent's per-line revenue from local service.Service Complaints in1998 Per Line
The total number of customer complaints to state and federal regulators about theincumbent's service in 1998 divided by the number incumbent telephone lines.
Total Revenue Per Line The incumbent's total operating revenue for 1998 divided by the number of incumbenttelephone lines.
Total Plant in ServicePer Line
The net book value of the incumbent's assets in the market divided by the number ofincumbent telephone lines.
Minutes of Use PerLine
The number of telephone minutes of use for the incumbent in 1998.
Central Office TotalPlant in Service PerLine
The net book value of the incumbent's central office assets divided by the number ofincumbent telephone lines.
4.3. Data
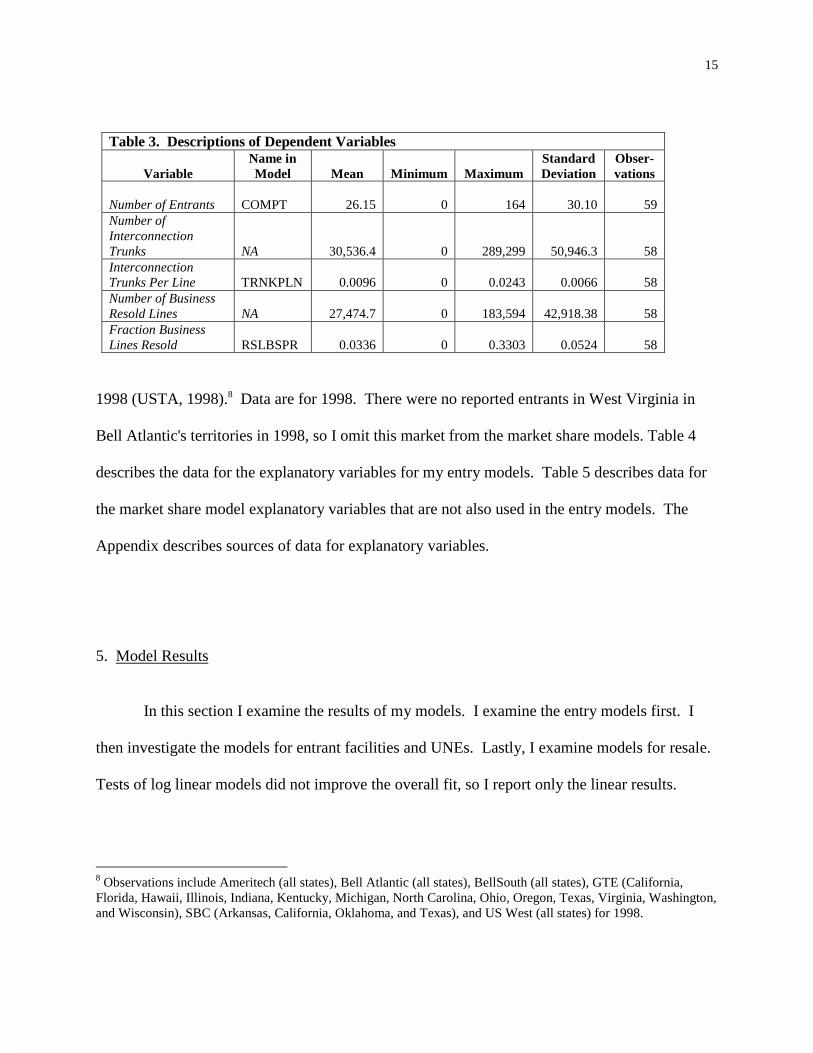
Table 3 describes the data I use for my dependent variables, which are from the United
States Telephone Association's (USTA) report to Congressman Thomas Bliley on December 9,
15
Table 3. Descriptions of Dependent Variables
VariableName inModel Mean Minimum Maximum
StandardDeviation
Obser-vations
Number of Entrants COMPT 26.15 0 164 30.10 59Number ofInterconnectionTrunks NA 30,536.4 0 289,299 50,946.3 58InterconnectionTrunks Per Line TRNKPLN 0.0096 0 0.0243 0.0066 58Number of BusinessResold Lines NA 27,474.7 0 183,594 42,918.38 58Fraction BusinessLines Resold RSLBSPR 0.0336 0 0.3303 0.0524 58
1998 (USTA, 1998).8 Data are for 1998. There were no reported entrants in West Virginia in
Bell Atlantic's territories in 1998, so I omit this market from the market share models. Table 4
describes the data for the explanatory variables for my entry models. Table 5 describes data for
the market share model explanatory variables that are not also used in the entry models. The
Appendix describes sources of data for explanatory variables.
5. Model Results
In this section I examine the results of my models. I examine the entry models first. I
then investigate the models for entrant facilities and UNEs. Lastly, I examine models for resale.
Tests of log linear models did not improve the overall fit, so I report only the linear results.
8 Observations include Ameritech (all states), Bell Atlantic (all states), BellSouth (all states), GTE (California,Florida, Hawaii, Illinois, Indiana, Kentucky, Michigan, North Carolina, Ohio, Oregon, Texas, Virginia, Washington,and Wisconsin), SBC (Arkansas, California, Oklahoma, and Texas), and US West (all states) for 1998.

16
Table 4. Descriptions of Explanatory Variables for Entry Models
VariableName inModel Mean Minimum Maximum
StandardDeviation
Obser-Vations
UNE Prices UNEPRC $16.82 $3.72 $32.00 $6.16 59Prices for ReciprocalCompensation RCP $0.0057 $0 $0.0283 $0.0067 59Residential ResaleDiscount RESRSL 0.1788 0.0700 0.2500 0.0405 59Incumbent Total BillableLines NA 2,286,606 235,862 16,071,707 2,785,059 59Number of IncumbentCentral Offices NA 230.1 29 752 174.2 59
Lines Per Central Office LNSPRCO 10,424.9 881.1 29,786.8 6,851.7 59Incumbent Local ServiceRevenues (000) NA $749,773 $71,863 $4,731,829 $902,587 59Incumbent Line CostLevel NA $265.72 $65.68 $408.81 $57.71 59Local Service Revenue toCost Ratio LCLPUSF 1.3290 0.7967 5.0431 0.5551 59Collocation Availabilityfor Voice Lines COLCV98 23.66% 0% 72.62% 17.54 59
Number of Quarters NUMQRT 10.75 0 18 15.44 59Service QualityComplaints in 1997
SCMPAM-97 274.29 6 2,637 466.18 59
Incumbent Total Revenue1998 (000) REVT $1,511,887 $170,463 $8,460,236 $1,721,406 59Price-Cost Ratio forUNEs vs. Retail Services
PRCST-UNE 0.1969 0.0546 0.4460 0.0739 59
Local Calling Minutesfor Incumbent (000) NA 7,056,890 820,771 36,441,427 7,740,706 59Price-Cost Ratio forReciprocalCompensation vs Retail
PRCST-RCP 0.1601 0 0.8236 0.1919 59
Presence of UniversalService Fund Reform USFFUND 0.2881 0 1 0.4568 59
GTE GTE 0.2373 0 1 0.4291 59
Bell Atlantic BA 0.2203 0 1 0.4180 59
BellSouth BS 0.1525 0 1 0.3626 59
SBC SBC 0. 0678 0 1 0.2536 59
US West USW 0.2373 0 1 0.4291 59
Ameritech AM 0.0847 0 1 0.2809 59

17
Table 5. Descriptions of Explanatory Variables in Market Share Models and not inEntry Models
VariableName inModel Mean Minimum Maximum
StandardDeviation
Obser-Vations
Business Resale Discount BUSRSL 0.1792 0.0800 0.2601 0.0377 58
Local Revenue Per Line LCLPRLN $329.98 $228.47 $458.84 $49.69 58Service Complaints in1998 Per Line
SCMP98-PL 0.00016 9.03 x 10⁻⁶ 0.00097 0.00019 58
Total Revenue Per Line9 REVTPL $678.02 $502.90 $955.18 $98.80 58Incumbent TotalAssets (000) NA $4,532,754 $493,351 $27,585,598 $5,118,892 58Total Plant in ServicePer Line TPISPL $206.07 $140.24 $305.62 $37.87 58
Minutes of Use Per Line MOUPL 3,288.7 2,188.4 4,592.0 599.3 58Central Office TotalPlant in Service Per Line COTPILPL $364.44 $225.44 $639.74 $89.82 58
5.1. Entry Model Results
Table 6 provides the coefficients and t-statistics for the entry models. One asterisk (*)
indicates significance at the 0.10 level. Two asterisks (**) indicate significance at the 0.05 level.
Three asterisks (***) indicate significance at the 0.01 level. I estimate three models. Model 1
examines how UNE prices, reciprocal compensation prices, resale discounts, customer density,
local service price-cost margins, service quality, market size, and UNE price-cost margins affect
entry. All coefficients are statistically significant. The signs of coefficients can be misleading in
ordered probit models, so I calculate the marginal effects of these variables in Table 7. Before
reviewing Table 7, I examine whether other explanatory variables should be included in entry
models.
9 Total revenue per line, total plant in service per line, and central office total plant in service per lines are expressedas $1000 per line in the model. Minutes of use per line is expressed as 1000s of minutes per line in the model.

18
Table 6. Regression Results for Entry (COMPT)Explanatory Variable Model 1 Model 2
UNE Prices**-0.1523
(-2.000)**-0.1964
(-2.307)
Prices for Reciprocal Compensation*-56.038(-1.879)
-51.4000(-0.501)
Residential Resale Discount**10.0708
(2.230)**10.7780
(2.288)
Lines Per Central Office (customer density)***0.0001
(2.794)0.0001(1.409)
Local Service Revenue to Cost Ratio***-1.9855
(-2.939)**-1.9342
(-2.509)
Collocation Availability for Voice Lines0.0126(0.901)
Number of Quarters-0.0643(-1.108)
Service Quality Complaints in 1997*-0.0010(-1.697)
-0.0010(-1.509)
Incumbent Total Revenue 1998 (000)***1.77e-06
(5.038)***2.00e-06
(5.039)
Price-Cost Ratio for UNEs vs. Retail Services***14.4117
(2.287)**16.7705
(2.360)Price-Cost Ratio for Reciprocal Compensation vsRetail
-0.0792(-0.021)
Presence of Universal Service Fund Reform0.2489(0.605)
GTE dummy variable0.6403(0.730)
Bell Atlantic dummy variable**1.1397
(2.065)1.447
(1.867)
BellSouth dummy variable***2.2862
(3.761)***2.845
(3.121)
SBC dummy variable***5.0165
(4.769)***5.5051
(4.183)
US West dummy variable0.8116(0.939)
χ2113.70
d.f. = 11116.97
d.f. = 17Log Likelihood -66.2809 -64.6450
Model 2 in Table 6 provides the results of adding the other variables to Model 1, namely
variables for collocation availability, time for entry, the ratio of the price-cost margin for
reciprocal compensation to the price-cost margin for incumbent retail services, and universal
service subsidy reform, and the dummy variables for GTE and US West. Using a likelihood-

19
ratio test, I fail to reject at the 0.10 level the joint hypothesis that the coefficients for these
variables are all zero (χ2(6) = 3.27). Lower price-cost margins for reciprocal compensation
relative to those for incumbent retail services have neither stimulated entry nor led incumbents to
hinder entry. This is probably because, as the market share models indicate, some entrants, but
not all, are net receivers of reciprocal compensation. Therefore, higher reciprocal compensation
prices benefit some entrants, but not all entrants. This diversity of effects of reciprocal
compensation prices probably causes the coefficient for this variable to be ambiguous. Lastly, I
do not find that subsidy reform has encouraged entry. It may be that in 1998 subsidy reform
efforts were still preliminary and so firms had not responded. I conclude that Model 1 is the most
appropriate model for examining how regulatory policies affect entry decisions.
Table 7 shows the marginal effects of explanatory variables from Model 1 for each value
of the dependent variable. The first row shows the dependent variable. Rows 2 and 3 show,
respectively, show the range of number of entrants associated with each dependent variable value
and the number of markets that fall into that range. The remaining rows show how a marginal
change in each explanatory variable affects the probability of a market being in a particular entry
range.
Higher UNE, reciprocal compensation, and wholesale prices, and higher local service
price-cost margins and incumbent service complaints decrease entry. The distribution of markets
shown in Figure 2 would shift to the left, indicating less entry. Likewise, greater customer
density and market size, and higher ratios of UNE price-cost margins to incumbent retail price-
cost margins cause the distribution to shift to the right, indicating more entry.
The marginal effects in Table 7 indicate that incumbents’ incentives and abilities to
hinder entry dominate those of entrants to enter markets. Consider the net effect of lower UNE
20
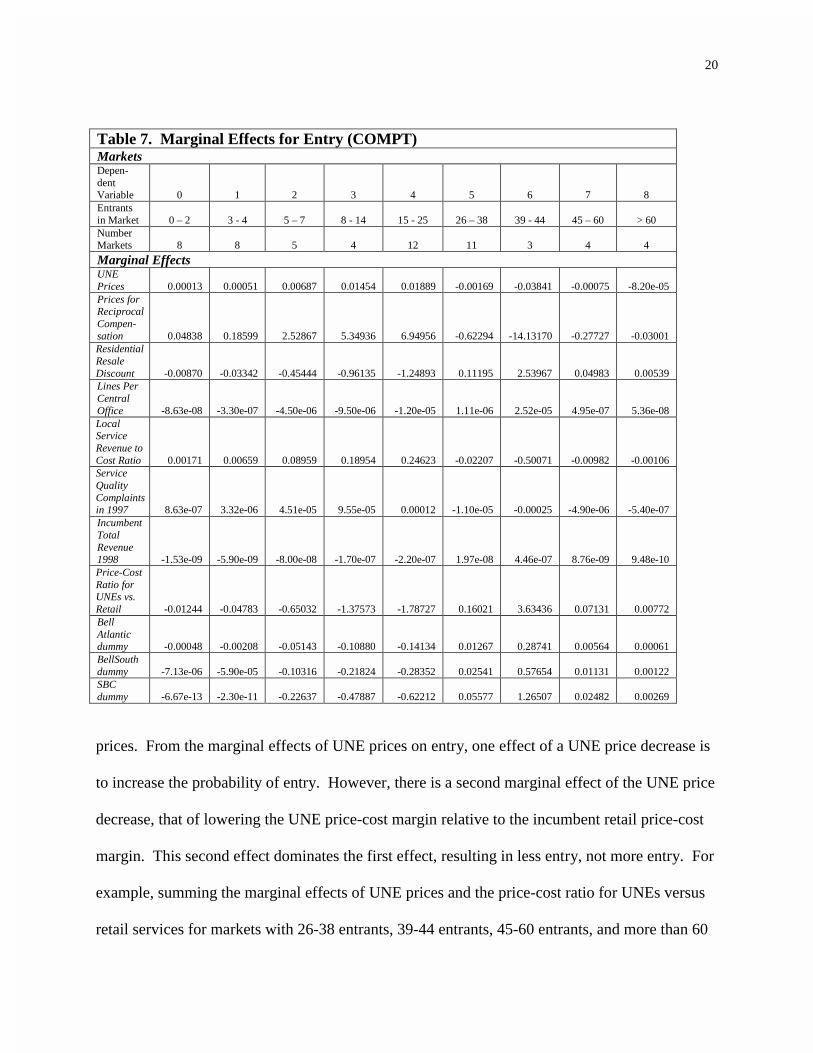
Table 7. Marginal Effects for Entry (COMPT)MarketsDepen-dentVariable 0 1 2 3 4 5 6 7 8Entrantsin Market 0 – 2 3 - 4 5 – 7 8 - 14 15 - 25 26 – 38 39 - 44 45 – 60 > 60NumberMarkets 8 8 5 4 12 11 3 4 4
Marginal EffectsUNEPrices 0.00013 0.00051 0.00687 0.01454 0.01889 -0.00169 -0.03841 -0.00075 -8.20e-05Prices forReciprocalCompen-sation 0.04838 0.18599 2.52867 5.34936 6.94956 -0.62294 -14.13170 -0.27727 -0.03001ResidentialResaleDiscount -0.00870 -0.03342 -0.45444 -0.96135 -1.24893 0.11195 2.53967 0.04983 0.00539Lines PerCentralOffice -8.63e-08 -3.30e-07 -4.50e-06 -9.50e-06 -1.20e-05 1.11e-06 2.52e-05 4.95e-07 5.36e-08LocalServiceRevenue toCost Ratio 0.00171 0.00659 0.08959 0.18954 0.24623 -0.02207 -0.50071 -0.00982 -0.00106ServiceQualityComplaintsin 1997 8.63e-07 3.32e-06 4.51e-05 9.55e-05 0.00012 -1.10e-05 -0.00025 -4.90e-06 -5.40e-07IncumbentTotalRevenue1998 -1.53e-09 -5.90e-09 -8.00e-08 -1.70e-07 -2.20e-07 1.97e-08 4.46e-07 8.76e-09 9.48e-10Price-CostRatio forUNEs vs.Retail -0.01244 -0.04783 -0.65032 -1.37573 -1.78727 0.16021 3.63436 0.07131 0.00772BellAtlanticdummy -0.00048 -0.00208 -0.05143 -0.10880 -0.14134 0.01267 0.28741 0.00564 0.00061BellSouthdummy -7.13e-06 -5.90e-05 -0.10316 -0.21824 -0.28352 0.02541 0.57654 0.01131 0.00122SBCdummy -6.67e-13 -2.30e-11 -0.22637 -0.47887 -0.62212 0.05577 1.26507 0.02482 0.00269
prices. From the marginal effects of UNE prices on entry, one effect of a UNE price decrease is
to increase the probability of entry. However, there is a second marginal effect of the UNE price
decrease, that of lowering the UNE price-cost margin relative to the incumbent retail price-cost
margin. This second effect dominates the first effect, resulting in less entry, not more entry. For
example, summing the marginal effects of UNE prices and the price-cost ratio for UNEs versus
retail services for markets with 26-38 entrants, 39-44 entrants, 45-60 entrants, and more than 60

21
entrants shows that a nationwide 1 percent decrease in UNE prices would decrease the
probability of a market having 26 or more entrants by nearly 4 percentage points.
The marginal effects of the variable for profitability of incumbents’ local services lead to
a similar conclusion. Contrary to the findings of Rosston and Wimmer (2000) and Ros and
McDermott (2000), I find that higher incumbent profits for local service are associated with less
entry, perhaps indicating that incumbents act to protect these profits.
The marginal effects of reciprocal compensation prices show that lower prices are
associated with more entry. This could imply that the lower prices directly improve entrant
profits, which encourages them to enter markets. However, as I explain below, another
explanation is that incumbents’ profits are harmed less by entrants who are net senders of calls
(whom low reciprocal compensation prices favor) than by entrants who are net receivers of calls
(whom high reciprocal compensation prices favor).
Lastly, the marginal effects of discounts for resold services indicate that higher discounts
are associated with more entry. Higher discounts increase entrant profit, which encourages
entry, and that incumbents do not hinder this entry. Furthermore, the effect of customer density
is positive, indicating that more entry occurs in densely populated markets. Poor incumbent
service quality in the previous year appears to decrease entry. This may be because of the
importance of resale to entry. If an incumbent’s retail services have poor quality, then it could
be true that the wholesale versions of these same services will have just as poor, or poorer,
service quality. Market size and selected incumbents (Bell Atlantic, BellSouth, and SBC) all

22
have positive effects.10 The importance of market size indicates that there may be some
economies of scale for entrants, or that price competition between entrants becomes more intense
as the number of entrants increases in a market.
5.2. Entrant Market Share Model Results
Tables 8 and 9 provide the results for the entrant market share models. Model 3 in Table
8 shows the results of including all of the explanatory variables in a model for entrants using
UNEs and entrant-owned facilities. This model forms the basis for testing the signs and
significance of nonlinear combinations of explanatory variables. Using an F-test, I fail to reject
the hypothesis at the 0.10 level that coefficients for price-cost margins for UNEs, reciprocal
compensation, and local telephone services, resale discounts, subsidy reform, and for the
incumbent dummy variables for GTE, BellSouth, and US West are equal to zero (F(8, 41) =
1.32). This indicates that incumbents either do not hinder this form of entrant output and that
neither higher margins on local telephone services nor potential subsidy reform prompt entrants
to increase their supply using UNEs or facilities. Indeed, the positive and significant coefficient
for reciprocal compensation prices indicates that entrants are increasing UNE and facility-based
supply primarily to customers such as ISPs that are net receivers of minutes.
Model 4 in Table 8 provides results after dropping variables that prove to be
insignificant; namely, the resale discount, universal service reform, and the dummy variables for
GTE, BellSouth, and US West. Higher UNE prices limit entrant output. Higher prices for local
10 The results could indicate that these incumbents have responded less aggressively to entry than have otherincumbents. Consistent with this result, Bell Atlantic and SBC are the only Bell Operating Companies at the time ofthis writing to receive permission to enter interLATA long distance markets.

23
Table 8. Regression Results for Output Using UNEs and Facilities (TRNKPLN)Explanatory Variable Model 3 Model 4
UNE Prices**-0.0004
(-2.287)**-0.0003
(-2.049)Prices for ReciprocalCompensation
*0.2213(1.824)
*0.1880(1.729)
Residential Resale Discount0.0119(0.686)
Local Revenue Per Line*0.00004
(2.006)**0.00003
(2.391)Collocation Availability forVoice Lines
***0.0002(3.594)
***0.0004(3.624)
Number of Quarters**0.0005
(2.571)***0.0005
(3.047)Service Complaints in 1998 PerLine
6.9654(1.553)
**9.5048(2.433)
Total Revenue Per Line0.0241(1.274)
0.0170(1.176)
Total Plant in Service Per Line-0.0076(-1.649)
-0.0050(-1.368)
Minutes of Use Per Line0.0022(1.321)
**0.0032(2.181)
Central Office Total Plant inService Per Line
0.0192(1.097)
*0.0245(1.870)
Presence of Universal ServiceFund Reform
0.0014(0.807)
GTE dummy variable0.0047(0.972)
Bell Atlantic dummy variable-0.0015(-0.455)
***-0.0051(-2.674)
BellSouth dummy variable0.0043(1.161)
SBC dummy variable**0.0077
(2.218)*0.0053(1.998)
US West dummy variable0.0063(1.591)
Constant***-0.0315
(-3.630)***-0.0297
(-3.700)
F4.71
d.f. = 17, 416.53
d.f. = 12, 46R2 0.6613 0.6300
telephone services encourage customers to buy more from entrants and incumbents do not hinder
this loss of incumbent market share. The coefficient for ease of collocation is positive and
highly significant, indicating that collocation is important for entrants that want to build their
own facilities and that want to use UNEs. The coefficient for the number of quarters is positive

24
and highly significant, showing that that building facilities and assembling UNEs takes time.
Incumbent service quality has a positive and significant coefficient in Model 4. This implies that
entrants choose to use their own facilities and UNEs, and that customers choose entrant services,
when incumbent service quality is poor. The positive and highly significant coefficient for
number of minutes per line is consistent with the conclusion that entrants use their own facilities
and UNEs to target customers based on calling patterns. The negative and highly significant
coefficient for Bell Atlantic may indicate that this incumbent has the most aggressive response to
entrants targeting ISPs as customers.
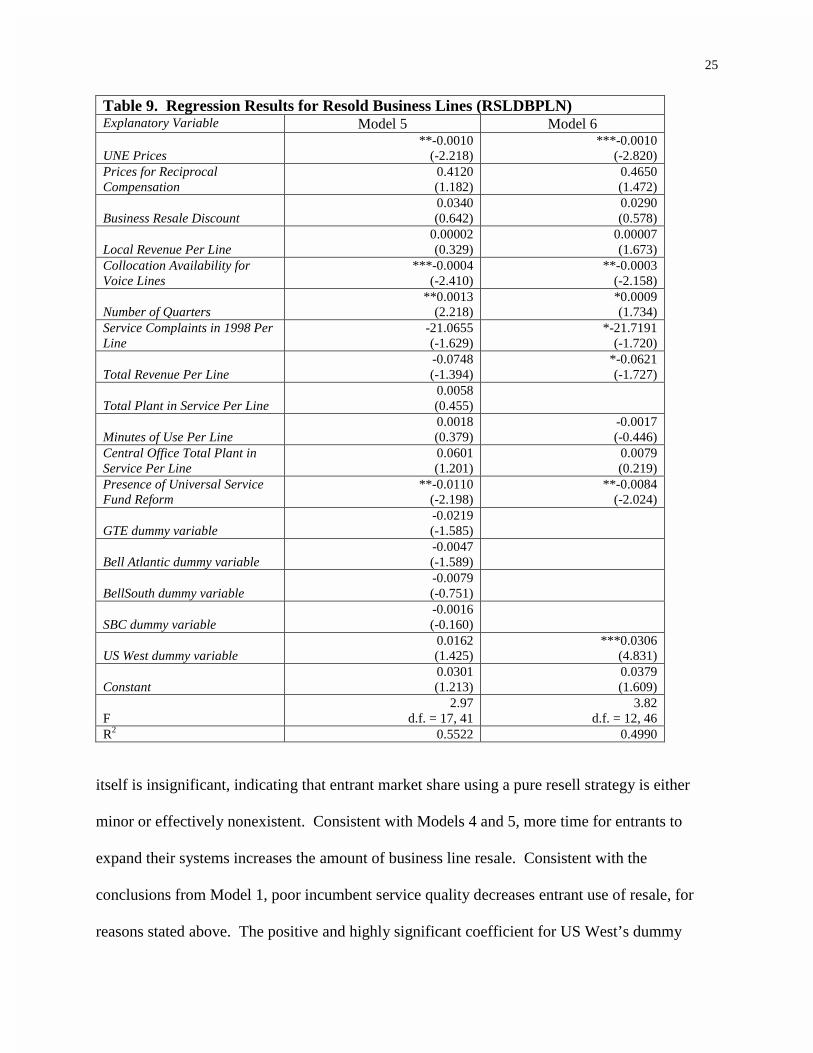
Table 9 shows the results for entrant market share using resold business services. Model
5 forms the basis for a joint hypothesis test of the significance of price-cost margins of UNEs
and local telecommunications services, and of incumbent investment, minutes, central office
investment, reciprocal compensation prices, and dummy variables for GTE, BellSouth, Bell
Atlantic, and SBC. Using an F-statistic, I fail to reject at the 0.10 level the null hypothesis that
the coefficients for all of these variables and combinations of variables are zero (F(10, 41) =
1.67). Consequently, I show the results for Model 6, which omits the insignificant variables.
The variable for reciprocal compensation prices is in Model 6 because I fail to reject the joint
hypothesis when the price-cost margin for reciprocal compensation is included.
Comparing the results of Models 5 and 6, it is apparent that higher UNE prices decrease
resold business lines. Comparing this result with the coefficients for collocation and subsidy
reform (which are negative and significant), it appears that entrants primarily use resale of
business lines as part of an entry strategy whose main intent is to use UNEs and facilities, and
that availability of collocation and universal service subsidies causes entrants to move away from
reselling business lines more quickly than they otherwise would. The business resale discount
25
Table 9. Regression Results for Resold Business Lines (RSLDBPLN)Explanatory Variable Model 5 Model 6
UNE Prices**-0.0010
(-2.218)***-0.0010
(-2.820)Prices for ReciprocalCompensation
0.4120(1.182)
0.4650(1.472)
Business Resale Discount0.0340(0.642)
0.0290(0.578)
Local Revenue Per Line0.00002(0.329)
0.00007(1.673)
Collocation Availability forVoice Lines
***-0.0004(-2.410)
**-0.0003(-2.158)
Number of Quarters**0.0013
(2.218)*0.0009(1.734)
Service Complaints in 1998 PerLine
-21.0655(-1.629)
*-21.7191(-1.720)
Total Revenue Per Line-0.0748(-1.394)
*-0.0621(-1.727)
Total Plant in Service Per Line0.0058(0.455)
Minutes of Use Per Line0.0018(0.379)
-0.0017(-0.446)
Central Office Total Plant inService Per Line
0.0601(1.201)
0.0079(0.219)
Presence of Universal ServiceFund Reform
**-0.0110(-2.198)
**-0.0084(-2.024)
GTE dummy variable-0.0219(-1.585)
Bell Atlantic dummy variable-0.0047(-1.589)
BellSouth dummy variable-0.0079(-0.751)
SBC dummy variable-0.0016(-0.160)
US West dummy variable0.0162(1.425)
***0.0306(4.831)
Constant0.0301(1.213)
0.0379(1.609)
F2.97
d.f. = 17, 413.82
d.f. = 12, 46R2 0.5522 0.4990
itself is insignificant, indicating that entrant market share using a pure resell strategy is either
minor or effectively nonexistent. Consistent with Models 4 and 5, more time for entrants to
expand their systems increases the amount of business line resale. Consistent with the
conclusions from Model 1, poor incumbent service quality decreases entrant use of resale, for
reasons stated above. The positive and highly significant coefficient for US West’s dummy

26
variable indicates that this incumbent may be more cooperative with resellers than with facilities
and UNE-based entrants, relative to other incumbents.
6. Conclusion
This paper shows that incumbents are able to hinder entry in newly opened markets when
incumbents' profit margins for inputs sold to entrants are lower than incumbents' retail profit
margins. This confirms the theories of Shepherd (1997), Noll (1995), Gulati et al. (2000), and
Ordover et al. (1985). Incumbents in local telephone markets have been unable to limit entrants
from gaining market share for facilities-based and UNE-based entry. Much of this market share
has been for customers who are net receivers of calls, such as ISPs. This may explain why
incumbents have lobbied the US Congress and the FCC to exempt incumbents from paying
reciprocal compensation for calls to ISPs, an effort that was recently successful.
This paper also shows that entrants for local telephone service use a mixture of entry and
supply strategies, but that most entrant output is based on a strategy to use UNEs and entrant-
owned facilities. Reselling incumbent services appears to primarily facilitate entry by firms that
ultimately intend to use UNEs and their own facilities. Higher UNE and reciprocal
compensation prices discourage entry, but higher reciprocal compensation prices also cause
entrants to market to customers who are net receivers of minutes.
Additional work is needed. I was unable to test whether the interLATA restriction, which
is to serve as a carrot for Bell Operating Companies to open markets to entry, is effective. Also,
I was unable to test whether competition improves welfare. Lastly, international comparisons are
lacking, as are more in-depth analyses of entrant strategies for data and voice services.

27
Appendix
Data for UNE and reciprocal compensation prices and wholesale discounts are from state
commissions (NRRI, 1998; Alabama, 1998), X-Change (1998-1999), and interviews with
incumbents. In cases where there are discrepancies, I employ the data provided in state
commissions' decisions (NRRI, 1998) when available, and other public data when the
commission data is not available. Some states have multipart prices for reciprocal compensation.
There may be separate prices for terminating minutes at a central office or a tandem office and
for different times of the day. To express these prices as a single price, I follow the convention
of assuming 6.25% of the minutes terminate at local central offices and the remainder terminate
in a tandem. Entrants often connect to the incumbent’s network at a tandem office because it
gives them access to numerous central offices. In states where residential service discounts are
different from business service discounts, I use the residential discount for the models explaining
entry and output using UNEs and entrant-owned facilities. Business and residential discounts are
highly correlated (R2 = 0.88). In tests of various models, business and residential discounts have
similar results. To avoid multicollinearity, I use only the residential discount for these models.
Data for incumbent total billable lines, number of central offices, local service revenues,
service quality complaints, total revenues, local calling minutes, and total plant in service are
from FCC ARMIS reports.11 I use the ratio of total revenues for basic local telephone services
and total billable lines to indicate incumbents’ price levels for local exchange services. Firms
charge many prices, so using a single price is inappropriate. I use incumbents’ Universal Service
Fund costs per line to represent incumbents’ costs for telephone lines. Universal Service Fund
11 All ARMIS data are from http://fcc.gov and were downloaded between March 1999 and August 2000.

28
costs are the local line costs that incumbents report to the FCC for estimating subsidies that are
given to small incumbents and rural incumbents for 1998. USF costs are based on incumbents’
regulatory accounting records and provide an average cost for all of an incumbent’s operations in
a state.12 I use total numbers of customer complaints to state and federal regulators for 1997 and
1998 in metropolitan statistical areas as my measure of incumbent service quality. Low
incumbent service quality should encourage customers to buy from facilities-based entrants. I
use 1997 data to examine entry because it represents ex ante entry information. I use 1998 data
per line in models for entrant market share because this represents the quality that customers and
entrants experienced at the time supply and purchasing decisions were put into effect. I use the
incumbent’s total operating revenues for 1998 for the market, to indicate market size.
I use the percent of incumbent voice telephone lines accessible by entrants through
collocation in 1998 to represent the ease of collocation. Data are from Tables 3.6 and 3.7 of the
FCC’s 1998 Local Competition report. (FCC, 1998) There is a risk of endogeneity because
higher entrant interest in a market should increase entrant demand for collocation. Higher
demand for collocation should increase the incidence of collocation, which could cause a higher
percentage incumbent lines to be in central offices with collocation. However, differences
between markets should also reflect the ease of obtaining collocation.
I use the number of quarters in a state from the time the first entrant was given telephone
numbers until the 1996 Act took affect to represent the amount of time that entrants have been
12 Regulatory costs are an imperfect measure of economic costs. The accounting processes (Gabel, 1967) anddistortive efficiency incentives caused by methods of regulation (Sappington and Weisman, 1996) cause theseregulatory costs to deviate from economic costs.
29
operating in a state. Data are from Table 4.8 of the FCC's December 1998 Local Competition
report (FCC, 1998).
For the entry models, I include two price-cost ratios, PRCSTUNE and PRCSTRCP, as
explanatory variables. PRCSTUNE is the ratio of the incumbent’s UNE price-cost ratio and the
incumbent’s average retail price-cost ratio. The incumbent’s average retail price-cost ratio is the
ratio of the incumbent’s 1998 total operating revenues and total plant in service. PRCSTRCP is
the ratio of the incumbent’s reciprocal compensation price-cost ratio and the incumbent’s
average retail price cost ratio.13 These ratios reflect the relationships between the price-cost
ratios for inputs incumbents sell to entrants and the price-cost ratios for the incumbent’s retail
services that the entrants displace. Low values of PRCSTUNE and PRCSTRCP indicate that
UNE and reciprocal compensation price-cost ratios are low relative to incumbents’ retail price-
cost ratios.14
I use dummy variables to indicate state efforts to reform universal service subsidies and
to identify incumbents. According to a National Regulatory Research Institute survey
(Rosenberg and Wilhelm, 1998), fourteen states had revised or were revising their subsidy
policies in 1998. I have a dummy variable for each incumbent, but omit the Ameritech dummy
13 The UNE price-cost ratio is the ratio of UNEPRC to USFCOST. The reciprocal compensation price-cost ratio isthe ratio of RCP and the incumbent’s total investment in central office switches in 1998 divided by the total numberof local exchange minutes in 1998. I use UNEPRC/REVTPL to test UNE price-cost margins because the actual ratioof interest, (UNEPRC/USF)/(REVTPL/USF) solves to UNEPRC/REVTPL. Similarly, the reciprocal compensationratio of interest, (RCP/(COTPISPL/MOUPL))/(REVTPL/COTPISPL) solves to RCP/(REVTPL/MOUPLN).
14 Including the variables PRCSTUNE and PRCSTRCP creates multicollinearity because the variables areconstructed from other variables. Therefore, I exclude these variables from the entrant output models and testhypotheses of nonlinear combinations of UNE prices, reciprocal compensation prices, and incumbent revenues,costs, and quantities supplied. That is to say, I test incumbent responses to UNE price-cost margins by testing thesignificance of the combination UNEPRC/REVTPL, and I test incumbents’ responses to RCP price-cost margins bytesting the significance of the combination RCP/(REVTPL/MOUPLN).

30
from models to avoid multicollinearity. Incumbent dummy variables may reveal differences in
how incumbents processed entrant requests interconnection from 1996 through 1998. Soon after
the passage of the Act, incumbents differed in how they processed these entrant requests. One
incumbent required entrants to fax their requests for telephone numbers or local lines. Another
required entrants to call with their requests, but assigned only one employee to the task of taking
entrant orders. Other incumbents worked on electronic methods of taking entrant orders. These
differences, as well as differences in regulatory scrutiny and enforcement, could cause incumbent
dummy variables to be significant.
To examine potential multicollinearity, I regress all explanatory variables on each other.
I also examine the linear correlation of each pair of explanatory variables. Multicollinearity
problems occur between the reciprocal compensation variables RCP and PRCSTRCP (R2 =
0.97), between the service complaint variables SCMPAM97 and SCMPAM98 (R2 = 0.92),
between the resale discounts for business and residential services (BUSRSL and RESRSL, R2 =
0.88), among variables that indicate market size (for example, REVT and TPIS), and between
PRCSTUNE and the variables that are included in it. To avoid multicollinearity in the entry
models, I include no more than one variable from each of the collinear groups, with the
exception of collinear groups involving PRCSTUNE and PRCSTRCP. I need these variables in
some entry analyses to perform likelihood ratio tests of entrant and incumbent incentives.
Regarding multicollinearity in the entrant output models, dividing market size indicators such as
REVT by LINES resolves much of the multicollinearity. Otherwise, I include in each model no
more than one variable from each collinear group.

31
REFERENCES
Ai, C., and Sappington, D. E. M. "The Impact of State Incentive Regulation on the USTelecommunications Industry." Mimeo, Department of Economics, University of Florida,1998.
Alabama Public Service Commission. Order In the Matter of Generic Proceedings:Consideration of TELRIC Studies, Docket No. 26029, August 25, 1998.
Albon, R. "Interconnection Pricing: An Analysis of the Efficient Component Pricing Rule."Telecommunications Policy, Vol. 18 (1994), pp. 414-420.
Baumol, W. J. “Some Subtle Pricing Issues in Railroad Regulation.” International Journal ofTransportation Economics, Vol. 10 (1983), pp. 341-355.
Baumol, W. J., and Sidak, G. "The Pricing of Inputs Sold to Competitors." Yale Journal onRegulation, Vol. 11 (1994a), pp. 171-202.
Baumol, W. J., and Sidak, G. Toward Competition in Local Telephony, Cambridge,Massachusetts: MIT Press, 1994b.
Baumol, W. J., and Sidak, G. "The Pricing of Inputs Sold to Competitors: Rejoinder andEpilogue." Yale Journal on Regulation, Vol. 12 (1995), pp. 177-186.
Berry, S. T. “Estimation of a Model of Entry in the Airline Industry.” Econometrica, Vol. 60(1992), pp. 889-917.
Blank, L., Kaserman, D. L., and Mayo, J. W. “Dominant Firm Pricing with Competitive Entryand Regulation: The Case of IntraLATA Toll.” Journal of Regulatory Economics, Vol.14 (1998), pp. 35-53.
Bresnahan, T. F., and Reiss, P. C. “Entry and Competition in Concentrated Markets.” Journal ofPolitical Economy, Vol. 99 (1991), pp. 977-1009.
Brock, G.W. The Economics of Interconnection. Mimeo, Teleport Communications Group,1995.
Cr�mer J., Rey, P., and Tirole, J. "Connectivity in the Commercial Internet." Journal ofIndustrial Economics, Vol. 48 (2000), pp. 433-472.
Crandall, R. After the Breakup: US Telecommunications in a More Competitive Era,Washington, D.C.: Brookings Institution, 1991.
32
Dekimpe, M. G., Parker, P. M., and Sarvary, M. “Staged Estimation of International DiffusionModels: An Application to Global Cellular Telephone Adoption.” TechnologicalForecasting and Social Change, Vol. 57 (1998), pp. 105-132.
Economides, N., and White, L. J. "Access and Interconnection Pricing: How Efficient is the'Efficient Component Pricing Rule?'" Antitrust Bulletin, Vol. 40 (1995), pp. 557-579.
Federal Communications Commission. "Local Competition." Report by the Industry AnalysisDivision, Common Carrier Bureau, 1998.
Gabel, R. Development of Separations Principles in the Telephone Industry, East Lansing,Michigan: Institute of Public Utilities, Michigan State University, 1967.
Greenstein, S., McMaster, S., and Spiller, P. “The Effect of Incentive Regulation onInfrastructure Modernization: Local Exchange Companies’ Deployment of DigitalTechnology.” Journal of Economics and Management Strategy, Vol. 4 (1995), pp. 187-236.
Gulati, R., Nohria, N., and Zaheer, A. "Strategic Networks." Strategic Management Journal,Vol. 21 (2000), pp. 203-217.
Gutierrez, Luis, and Sanford Berg, “Telecommunications Liberalization and RegulatoryGovernance: Lessons from Latin America,” Telecommunications Policy 24(10-11): 865-84, 2000.
Harris, R. G., and Kraft, C. J. "Meddling Through: Regulating Local Telephone Competition inthe United States." The Journal of Economic Perspectives, Vol. 11 (1997), pp. 93-112.
Hausman, J. A., and Tardiff, T. J. "Efficient Local Exchange Competition." Antitrust Bulletin,Vol. 40 (1995), pp. 529-556.
Kahn, A. E., and Taylor, W. E. "The Pricing of Inputs Sold to Competitors: A Comment." YaleJournal on Regulation, Vol. 11 (1994), pp. 225-240.
Katz, M. L. “Economic Efficiency, Public Policy, and the Pricing of Network InterconnectionUnder the Telecommunications Act of 1996.” In G. L. Rosston and D. Waterman, eds.,Interconnection and the Internet: Selected Papers from the 1996 TelecommunicationsPolicy Research Conference, Mahway, New Jersey: Erlbaum Associates Publishing,1997.
Kende, M. “The Digital Handshake: Connecting Internet Backbones.” Mimeo, Office of Plansand Policy, Federal Communications Commission, 2000.
Laffont, J., Rey, P., and Tirole, J. "Network Competition: I. Overview and NondiscriminatoryPricing." The Rand Journal of Economics, Vol. 29 (1998a), pp. 1-37.
33
Laffont, J., Rey, P., and Tirole, J. "Network Competition: II. Price Discrimination." The RandJournal of Economics, Vol. 29 (1998b), pp. 38-56.
Larson, A. C. "Wholesale Pricing and the Telecommunications Act of 1996: Guidelines forCompliance with the Avoided Cost Rule." University of Florida Journal of Law andPublic Policy, Vol. 8 (1997), pp. 243-260.
Larson, A. C., and Parsons, S. G. "An Economic Analysis of Transfer Pricing and ImputationPolicies for Public Utilities," In M. A. Crew, ed. Incentive Regulation for Public Utilities,Boston: Kluwer Academic Publishers, 1994.
Mitchell, B., Neu, W., Neumann, K., and Vogelsang, I. "The Regulation of Pricing ofInterconnection Services." In G. W. Brock, ed., Toward a CompetitiveTelecommunications Industry: Selected Papers from the 1994 TelecommunicationsPolicy Research Conference. Hillsdale, New Jersey: Lawrence Erlbaum Associates,1995.
National Regulatory Research Institute. Interconnection Arbitration Decisions,<http://www.nrri.ohio-state.edu/interconnect.html>, downloaded September - December1998.
Noll, R. G. “The Role of Antitrust in Telecommunications.” Antitrust Bulletin, Vol. 40 (1995),pp. 501-528.
Ordover, J. A., Sykes, A. O., and Willig, R. D. "Nonprice Anticompetitive Behavior byDominant Firms toward the Producers of Complementary Products." In F. M. Fisher, ed.,Antitrust and Regulation: Essays in Memory of John J. McGowan, Cambridge,Massachusetts: MIT Press, 1985.
Ros, A. J. “Does Ownership or Competition Matter More? The Effects of TelecommunicationsReform on Network Expansion and Efficiency.” Journal of Regulatory Economics, Vol.15 (1999), pp. 65-92.
Ros, A. J., and McDermott , K. “Are Residential Local Exchange Prices Too Low? Drivers ofCompetition in the Local Exchange Market and the Impact of Inefficiently-Set Prices.” InM. Crew, ed., Expanding Competition in Regulated Industries, Boston: KluwerAcademic Press, 2000.
Rosentberg, E. A., and Wilhelm, J. D. State Universal Service Funding and Policy: A Overviewand Survey. Columbus, Ohio: National Regulatory Research Institute, 1998.
Rosston, G. L., and Wimmer, B. S. From C to Shining C: Competition and Cross-Subsidy inCommunications, Mimeo, Stanford Institute for Economic Policy Research, StanfordUniversity, 2000.

34
Sappington, D. E. M., and Weisman, D. L. Designing Incentive Regulation for theTelecommunications Industry, Cambridge, Massachusetts: MIT Press, 1996.
Shepherd, W. G. “Dim Prospects: Effective Competition in Telecommunications, Railroads, andElectricity.” Antitrust Bulletin Vol. 42 (1997), pp. 151-175.
Spiller, P. T., and Cardilli, C. G. “The Frontier of Telecommunications Deregulation: SmallCountries Leading the Pack.” Journal of Economic Perspectives, Vol. 11 (1997), pp. 127-138.
Tomlinson, R. G. “The Impact of Local Competition on Network Quality.” In W. Lehr, ed.,Quality and Reliability in Telecommunications Infrastructure, Mahwah, New Jersey:Lawrence Erlbaum, 1995.
Tye, W. B. "The Pricing of Inputs Sold to Competitors: A Response." Yale Journal onRegulation, Vol. 11 (1994), pp. 203-224.
Tye, W. B., and Lapuerta, C. "The Economics of Pricing Network Interconnection: Theory andApplication to the Market for Telecommunications in New Zealand." Yale Journal onRegulation, Vol. 13 (1996), pp. 419-500.
United States Telephone Association. Report to House Commerce Committee Chairman ThomasBliley, 1998.
Wallsten, S. J. “An Econometric Analysis of Telecom Competition, Privatization, andRegulation in Africa and Latin America.” Mimeo, Stanford Institute for Economic PolicyResearch, Stanford University, 2000. Forthcoming in Journal of Idustrial Economics.
Willig, R. D. “The Theory of Network Access Pricing.” In H. M. Trebing, ed., Issues in PublicUtility Regulation, Proceedings of the Institute of Public Utilities Tenth AnnualConference, East Lansing, MI: Division of Research, Graduate School of BusinessAdministration, Michigan State University, 1979.
Woroch, G. A. “Competition’s Effect on Investment in Digital Infrastructure.” Mimeo,Department of Economics, University of California at Berkley, 2000.
X-Change. "Status of State Local Competition Proceedings." X-Change, 1998-1999.