india nbfc sector - rakesh...
TRANSCRIPT

India NBFC Sector March 2015

Sector Report INDIA NBFC
25 March 2015
REPORT AUTHORS
Parag Jariwala +91 22 6766 3442 [email protected]
COMPANY TICKER CMP (Rs) TP (Rs) REC
Shriram Transport SHTF IN 1,161 1,500 BUY
Mahindra Finance MMFS IN 263 250 HOLD
Chola Finance CIFC IN 571 775 BUY
Shriram City Union SCUF IN 1,887 2,300 BUY
SREI Infrastructure SREI IN 43 NA NR NR – Not Rated
Disbursement growth will be 500bps higher than volume growth over FY15-FY18E
Source: RCML Research
Strong correlation of SHTF with CV sales
Source: SIAM, Bloomberg, RCML Research
India NBFCs CV lenders: Gearing up for a joyride We believe that the worst cycle for CV/CE lenders in the last 20 years is coming to an end. A strong cyclical upturn coupled with lower fuel and funding costs could turn FY17 into a bumper year. SHTF is our top pick in the sector; we also initiate coverage on CIFC and SCUF with BUY ratings. We believe rural/semi-urban auto (ex-CV) lenders are in mid-downcycle and their profitability is likely to remain under pressure – maintain HOLD on MMFS.
FY17 a potential bumper year for CV/CE lenders: We believe the cyclical upturn in the CV industry has already begun and will last for another 3-4 years. Recovery in demand, asset quality and margins could be sharper for NBFCs this time around given that CV volumes were severely affected in the last 2-3 years. As the CV recovery gathers pace, we expect FY17 to be a bumper year for CV/CE (commercial vehicle/construction equipment) lenders.
Disbursement growth is likely to be much higher than volume growth as we expect a gradual reduction in discounts, increase in LTVs and higher churning of older vehicles over the next 2-3 years (refer chart alongside). Further, we expect steady improvement in margins and credit cost for the next 3-4 years, which will support high profit growth for CV/CE lenders (SHTF and CIFC).
NBFCs to benefit from lower fuel & funding costs: In FY13 and FY14, CV utilisation levels dropped by 30-40%, resulting in a sharp reduction in freight rate at a time when fuel cost (~50% of operating cost) was going up. Fuel cost has declined by ~15% in the last six months. Benign fuel cost will benefit CV operators as and when utilisation levels start improving. This apart, the cost of borrowings through the wholesale market is already down by ~150bps. We expect banks to cut lending rates in FY16, thereby reducing the cost of funds further for NBFCs (banks account for 40-45% of NBFC borrowings) and aiding margins.
NBFCs with strong NPA coverage to sail through regulatory changes: Our coverage NBFCs are well above the proposed tier 1 capital requirement of 10% under the new RBI norms. NBFCs have also been given considerable time to comply with 90-DPD norms. We believe that these companies will lower their coverage ratio without taking a hit on profitability. Despite a lower coverage ratio, we will continue to ascribe target price multiples on book value as there will be no change in cash flow and overall profitability on this account.
How to play the sector? SHTF is our top pick (BUY, TP Rs 1,500) due to its strong presence in the high-margin used CV market, robust capitalisation and high NPA coverage. We also initiate coverage on CIFC (TP Rs 775) and SCUF (TP Rs 2,300) with BUY ratings. Maintain HOLD on MMFS (TP Rs 250) due to cyclical pressure in the medium term and expensive valuations.
This report has been prepared by Religare Capital Markets Limited or one of its affiliates. For analyst certification and other important disclosures, please refer to the Disclosure and Disclaimer section at the end of this report. Analysts employed by non-US affiliates are not registered with FINRA regulation and may not be subject to FINRA/NYSE restrictions on communications with covered companies, public appearances, and trading securities held by a research analyst account.
19.0%24.0%1.5%
1.5%2.0%
10%
14%
18%
22%
26%
Vol
ume
grow
th
Low
er d
isco
unts
Hig
her L
TVs
Chu
rnin
g of
use
dC
Vs
Dis
burs
emen
t
0
20
40
60
80
100
0
200
400
600
800
1,000
1,200
Mar
-04
Jan-
05N
ov-0
5S
ep-0
6Ju
l-07
May
-08
Mar
-09
Jan-
10N
ov-1
0S
ep-1
1Ju
l-12
May
-13
Mar
-14
Jan-
15
SHTF's stock priceTotal domestic CV sales (R)
('000)(Rs)
Correlation = 75%

India NBFCs CV lenders: Gearing up for a joyride
Sector Report India NBFC
25 March 2015 Page 2 of 83
Contents
Valuation and Financial snapshot .................................................3
Worst cycle ever drawing to an end ..............................................4
Massive decline in CV volumes in FY13/FY14 ................................................ 4
Cyclical nature of demand suggests recovery ahead.................................... 5
NBFC consolidation phase to take 6-9 months ............................8
Disbursement trends for FTUs/SRTOs still very sluggish ............................ 8
FY17 a potential bumper year for CV/CE lenders ....................... 10
NBFC disbursal growth to outpace new CV volume growth ....................... 10
Benefits from lower fuel and funding cost ................................. 12
Lower fuel cost to benefit CV operators ....................................................... 12
Cheaper funding costs to boost NBFC margins from FY16 onward .......... 12
NBFCs with high NPA cover to sail through new norms........... 16
Tier 1 requirement of 10% ............................................................................... 16
Stringent prudential norms – NPA classification on 90 DPD ...................... 16
Investors unlikely to penalise NBFCs for lower coverage ratio ................. 18
How to play the sector?................................................................ 19
Structural BUYs – CIFC and SCUF ................................................................ 19
Upward cycle has begun for SHTF; MMFS still mid-downcycle ................. 20
Companies Shriram Transport Finance: Well worth the long haul .................................. 24
Mahindra & Mahindra Fin Secs: The worst is yet to come ........................... 35
Cholamandalam Investment and Finance: Structural growth ahead .......... 44
Shriram City Union Finance: Unique combination of high growth & high profitability ........................................................................................................ 65
SREI Infrastructure: CE lending industry still not out of the woods ........... 75

India NBFCs CV lenders: Gearing up for a joyride
Sector Report India NBFC
25 March 2015 Page 3 of 82
Valuation and Financial snapshot Fig 1 - Valuations
Companies CMP (Rs)
TP (Rs)
Upside (%)
EPS (Rs) BV (Rs) PE (x) PBV (x)
FY15E FY16E FY17E FY15E FY16E FY17E FY15E FY16E FY17E FY15E FY16E FY17E
Shriram Transport Finance 1,161 1,500 29.2 59.1 76.3 100.0 415.4 479.4 563.4 19.7 15.2 11.6 2.8 2.4 2.1 Mahindra Finance 263 250 (4.8) 15.1 17.8 21.4 105.6 119.3 135.8 17.3 14.7 12.3 2.5 2.2 1.9 Chola Finance 571 775 35.7 28.7 35.3 47.3 184.5 232.7 275.0 19.9 16.2 12.1 3.1 2.5 2.1 Shriram City Union 1,887 2,300 21.9 90.8 111.7 132.3 634.5 734.5 855.1 20.8 16.9 14.3 3.0 2.6 2.2 Source: Company, RCML Research
Fig 2 - Key ratios
Companies EPS growth (%) NIM (%) RoA (%) RoE (%)
FY15E FY16E FY17E FY15E FY16E FY17E FY15E FY16E FY17E FY15E FY16E FY17E
Shriram Transport Finance 6.0 29.1 31.1 6.5 6.9 6.9 2.5 2.8 3.3 15.1 17.0 19.2 Mahindra Finance (10.6) 17.7 20.0 8.4 8.5 8.7 2.4 2.6 2.9 15.2 15.8 16.8 Chola Finance 13.1 22.9 33.8 6.9 7.1 7.4 1.8 2.1 2.4 16.7 17.5 18.6 Shriram City Union 0.0 23.0 18.5 13.1 13.7 13.6 3.2 3.6 3.7 16.1 16.3 16.6 Source: Company, RCML Research

India NBFCs CV lenders: Gearing up for a joyride
Sector Report INDIA NBFC
25 March 2015 Page 4 of 82
Worst cycle ever drawing to an end We believe that the worst cycle for CV/CE lenders in the last 20 years is coming to an end. Our Auto analyst expects a robust ~20% CAGR in CV volumes over FY15-FY17 given (1) the ongoing macro recovery, (2) the cyclical nature of CV demand where sales dip sharply (dropping more than the automobile industry) during an economic slowdown and pick up swiftly during the ensuing cyclical recovery, (3) a softer interest rate environment (90-100% of CV purchases are financed, per our dealer check), (4) the recent lifting of mining restrictions along with stricter safety norms which will lead to an increase in transport loads and (5) GST implementation which will support demand for newer, faster vehicles.
(Read our recent CV report – India Automobiles: Wheels of fortune – BUY AL, TTMT)
Massive decline in CV volumes in FY13/FY14
In FY10 and FY11, M&HCV volumes (domestic) grew at a healthy rate of ~32%. M&HCVs grew a further 10% in FY12 on the higher base of FY11. This created a lot of latent capacity in the industry in the hope of a strong investment climate, robust GDP growth and better manufacturing activities.
But India’s economy failed to deliver and M&HCV sales dropped 23% in FY13 and 25% in FY14 – two consecutive years of sharp decline seen for the first time since FY01. This was mainly because players created excessive capacity in anticipation of robust GDP/ manufacturing activity. Our Auto analyst (Mihir Jhaveri) expects a recovery to ~10% growth in FY15 led by the lower base of last year and higher sales to large fleet operators.
LCV volumes (domestic) grew at a better rate in FY12/FY13, primarily led by consumption demand and a buoyant rural economy. Thereafter, with a slowdown in the overall economy, LCV volumes too dropped 18% in FY14 and are likely to register a decline of ~12% in FY15. Future prospects are brighter with many operators now expecting LCV volumes to follow the M&HCV path and show improvement from H2FY16 onwards.
Fig 3 - M&HCV sales down sharply in FY13/FY14 Fig 4 - LCV volumes declined in FY14/FY15E
Source: SIAM, RCML Research Source: SIAM, RCML Research
We believe a demand recovery in the LCV segment, which is currently affected by low transportation tonnage, vehicle over-capacity and a constrained financing environment, will follow through as the macro recovery deepens and demand for overall cargo improves. While FY15 will remain depressed for the segment (~12% volume decline), our Auto analyst is modeling for 14%/16% growth in FY16/FY17.
(40%)(30%)(20%)(10%)0%10%20%30%40%50%
0
50
100
150
200
250
300
350
400
FY02
FY03
FY04
FY05
FY06
FY07
FY08
FY09
FY10
FY11
FY12
FY13
FY14
FY15
E
('000) M&H CV domestic sales YoY growth (R)
(30%)(20%)(10%)0%10%20%30%40%50%60%70%
0
100
200
300
400
500
600
FY02
FY03
FY04
FY05
FY06
FY07
FY08
FY09
FY10
FY11
FY12
FY13
FY14
FY15
E
('000) LCV domestic sales YoY growth (R)
We expect 20% CAGR in M&HCV volumes in FY15-FY17 as the economy gathers steam
CV volumes were down sharply in FY12-FY14 on weak economic growth

India NBFCs CV lenders: Gearing up for a joyride
Sector Report INDIA NBFC
25 March 2015 Page 5 of 82
Cyclical nature of demand suggests recovery ahead
CV volume growth being cyclical in nature has historically exhibited sharp demand growth and decline patterns. A year (or two) of decline is generally followed by high double-digit growth in the segment. Accordingly, following the steep 43% correction in MHCV volumes over FY12-FY14 (~25% drop each in FY13 & FY14), we expect a sharp recovery in the segment over FY15-FY17.
Fig 5 - Periods of steep decline in MHCV vols. are generally followed by sharp pickup
Source: SIAM, RCML Research
Higher tonnage MHCVs taking the lead, reflecting increased industrial activity Early trends suggest that volumes in the higher tonnage segment have rebooted sharply. Our dealer interactions indicate that this can be attributed to a pick-up in the construction segment (mainly roads), where higher tonnage vehicles are used. This also possibly reflects the shift in demand over the last few years from 12-16t vehicles to >25t multi-axle vehicles (MAV) – MAV trailers are preferred for transporting heavy capital goods and automobiles, among others, while tippers are used for the mining industry.
Fig 6 - Domestic MHCV growth led by higher tonnage (>16t) segment…
Fig 7 - …growth in lower tonnage (<16t) segments also following suit
Source: SIAM, RCML Research Source: SIAM, RCML Research
8 9
(0)
(23)
13
36
23 21
(39)
(10)
34
(23)
10
29
39
23
5
33
(0)
(33)
33 32
8
(23)(25)
10 19 20
(50)
(40)
(30)
(20)
(10)
0
10
20
30
40
50
FY90
FY91
FY92
FY93
FY94
FY95
FY96
FY97
FY98
FY99
FY00
FY01
FY02
FY03
FY04
FY05
FY06
FY07
FY08
FY09
FY10
FY11
FY12
FY13
FY14
FY15
E
FY16
E
FY17
E
(%) M&H CV growth YoY %
(50)
0
50
100
150
200
250
300
350
Jan-
14
Feb-
14
Mar
-14
Apr
-14
May
-14
Jun-
14
Jul-1
4
Aug
-14
Sep
-14
Oct
-14
Nov
-14
Dec
-14
(%) 16.3-25t >25.1t
Trailers 26.5-35.2t Trailers >35.2t
Total Domestic CV
(60)(50)(40)(30)(20)(10)
010203040
Jan-
14
Feb-
14
Mar
-14
Apr
-14
May
-14
Jun-
14
Jul-1
4
Aug
-14
Sep
-14
Oct
-14
Nov
-14
Dec
-14
(%) 7.5-12t 12.1-16.2t
Demand slump in CVs is typically followed by high double-digit growth as pent-up demand unwinds

India NBFCs CV lenders: Gearing up for a joyride
Sector Report INDIA NBFC
25 March 2015 Page 6 of 82
Fig 8 - Share of >25t segment has increased over the past 4-5 years
Source: SIAM, RCML Research
Plenty of pent-up replacement demand We believe replacement demand will provide a kicker to volume growth as the number of CVs sold in the last two years is only a tenth of those running on road – our Auto analyst’s rough cut analysis suggests that there are ~4.5mn CVs running in India and if we consider a 15-year lifecycle, then ~0.29mn vehicles should be replaced per year. Over the last two years, CV sales averaged only 0.23mn, reflecting massive pent-up demand in the replacement market. Dealer checks also suggest that the on-ground improvement in demand has indeed been from the replacement side. We believe this trend will only strengthen and will also slowly percolate into the lower tonnage and LCV segments as industrial activity moves up.
Fig 9 - Vehicle age for the trucking industry Fig 10 - Organisational structure in terms of ownership
Source: Ministry of Road, Transport, Highway (2010 report), RCML Research Source: Ministry of Road, Transport, Highway (2010 report),RCML Research
Restrictions on truck overloading, vehicle age to create incremental demand Both central and state governments have started to become more stringent about adherence to cargo load restrictions, which should lead to the sale of more vehicles. Fleet operators normally overload trucks in order to improve the profitability per trip (even though this reduces the efficiency/mileage of the vehicle, hurting profitability in the long run). Strict government oversight on truck overloading will force operators to run more vehicles for the same cargo load, and thus create incremental demand.
11 12 12 15 18 15 17 19 22 20 22 26 26
49 47 45 40 3426 26 29 24 22 20 22 20
11 13 14 13 22 49 45 42 3831 26 25 27
29 28 29 32 2610 12 11 16
27 31 28 28
0
20
40
60
80
100
120
FY02 FY03 FY04 FY05 FY06 FY07 FY08 FY09 FY10 FY11 FY12 FY13 FY14
(%) 7.5-12 T 12.1-16.2 T 16.3-25 T >25T
< 6 yrs30%
6-10 yrs41%
>10 yrs29% Vehicle owner
36%
Transport operators
53%
Agents5%
Brokers6%
CVs sold in the last 2-3 years only a tenth of those running on road, reflecting high replacement potential
India NBFCs CV lenders: Gearing up for a joyride
Sector Report INDIA NBFC
25 March 2015 Page 7 of 82
In line with the government’s focus on increased road safety, we could see the implementation of norms on maximum vehicle age. Currently, CVs older than 8 years are not allowed to run in the four metro cities of Mumbai, Delhi, Kolkata and Chennai. There are virtually no norms in other states and fleet operators continue to run their vehicles for as long as 30 years. Any vehicle age regulations in non-metros would lead to a surge in replacement demand.
GST implementation could add a new dimension to demand After innumerable delays, the new Modi Govt. has indicated its firm intent to implement GST (goods & service tax) by Apr’16. GST implementation would result in removal of individual state tax, octroi and toll checkposts, thereby raising the turnaround time of transport vehicles and increasing demand for newer, faster vehicles to enhance efficiency. The overall faster movement of vehicles (to an estimated 350km per day from 250km now) will also result in a shorter replacement cycle as wear and tear increases.

India NBFCs CV lenders: Gearing up for a joyride
Sector Report INDIA NBFC
25 March 2015 Page 8 of 82
NBFC consolidation phase to take 6-9 months Although a turnaround in the CV industry has begun, it will take some time for CV lenders, especially NBFCs, to start benefiting from the same. Fleet operators, dealers and CV lenders (NBFCs) are indicating that volumes/asset quality trends have bottomed out in the last 5-6 months and are largely stable currently. This is mainly due to expectations of a GDP recovery in the next one year. However, the improvement is not broad-based enough to help NBFCs which largely cater to First Time Users (FTU) and Single Road Transport Operators (SRTO).
Disbursement trends for FTUs/SRTOs still very sluggish
Many dealers/financiers in Southern India are doing a third of their peak capacity in sales/disbursements currently. In Western India (especially Goa), volumes are down by 40-50%. Disbursement trends are unlikely to improve meaningfully in the next 6-9 months due to the absence of demand from many industries. At best, disbursement may pick up materially only post Q2FY16 if the government announces new road/port projects and private sector capex picks up by Q2/Q3FY16.
Recent uptick in M&HCV sales is not broad-based M&HCV sales have risen 30-40%+ YoY in the last four months on a very low base of last year. However, dealers and operators suggest that sales are highly skewed in favour of large fleet operators, rather than FTUs or SRTOs. These operators are buying due to multiple reasons, mainly:
1. Demand from specific sectors such as cement and auto (particularly Maruti Suzuki) is very strong. Large cement and auto companies don’t give business to fleet operators if the fleet used for transportation is very old. Therefore, large fleet operators are adding capacity as the business pipeline from cement/auto players remains strong.
2. There is a general belief in the market that discounts will narrow in coming months as sales improve and therefore price-sensitive buying by large cash-rich operators is also being seen.
Fig 11 - Recent surge in M&HCV demand is highly skewed towards large fleet operators
Source: SIAM, RCML Research
(17%)(22%)
(20%)
(38%)
(42%)
(32%)(34%)
(28%)(17%)
(24%)(21%)
(17%)
(11%)(2%)
(4%)
10%
23% 25%
40%
58%
35% 38%
(60%)
(40%)
(20%)
0%
20%
40%
60%
80%
May
-13
Jun-
13
Jul-1
3
Aug
-13
Sep
-13
Oct
-13
Nov
-13
Dec
-13
Jan-
14
Feb-
14
Mar
-14
Apr
-14
May
-14
Jun-
14
Jul-1
4
Aug
-14
Sep
-14
Oct
-14
Nov
-14
Dec
-14
Jan-
15
Feb-
15
M&HCV volume growth (% YoY)
FTUs/SRTOs aren’t participating in the market yet as recovery is not broad-based

India NBFCs CV lenders: Gearing up for a joyride
Sector Report INDIA NBFC
25 March 2015 Page 9 of 82
FTUs and SRTOs are not buying currently due to idle capacity. Fleet operators generally borrow from the top 2-3 private sector banks in India and therefore the recent uptick is unlikely to show in the disbursement numbers of NBFCs. Industry players (operators, branch managers of NBFCs, dealers) indicate that HDFC Bank is doing very well with large fleet operators in terms of incremental disbursements and asset quality.
Fig 12 - Consolidation phase will last till Q2-Q3FY16
Source: Company, RCML Research
Players pointed out that FTUs/SRTOs do not buy vehicles on sentiment and tend to be more cautious at the beginning of any upward cycle (more so due to recent losses). So far, all we’ve seen are announcements and intentions proffered by the new government – while these are positive they do not translate into buying decisions as CV operators are still awaiting concrete contracts/orders (revenue visibility for at least 1-2 years).
0%
1%
2%
3%
4%
5%
6%
1 2 3 4 5 6 7 8 9 10 11 12 13 14 15 16 17 18 19 20
Gro
ss N
PA
s
No of quarters
Phase IIIQ2FY16 to Q3FY16)
Phase I(Q2FY13 to
Q4FY14/Q1FY15)
Phase II(Q2FY15 to
Q4FY15/Q1FY16)
Phase IV(FY17/18/19)
1. Rapid increase in delinquencies
2. Sharp slowdown in growth
1. Very few new NPAs
2. Deterioration of exisitng NPA continues
3. Growth flat
1. No new NPAs
2. No further deterioration of existing NPA
3. Moderate pick up in disbursments
1. Recoveries from exisitng NPAs. Resale value of vehicles at all-time high
2. Credit cost declines sharply
3. Strong disbursement growth
Consolidation phase for CV operators and lenders to last till Q2-Q3FY16

India NBFCs CV lenders: Gearing up for a joyride
Sector Report INDIA NBFC
25 March 2015 Page 10 of 82
FY17 a potential bumper year for CV/CE lenders We expect the CV recovery to gather pace over the next two years, with a sharp rebound in late FY16/FY17. Recovery in demand, asset quality and margins could be sharper for NBFCs this time around given that CV volumes were severely affected in the last 2-3 years. Disbursement growth is likely to be much higher than volume growth as we expect a gradual reduction in discounts, increase in LTVs and higher churning of older vehicles over the next 2-3 years.
Fig 13 - M&HCVs likely to grow at ~20% in FY16/FY17 Fig 14 - LCV volumes likely to grow at 14-16% in FY16/FY17
Source: SIAM, RCML Research Source: SIAM, RCML Research
Fig 15 - NBFC disbursements to grow at 24% CAGR over FY15-FY18
Source: RCML Research, Company
NBFC disbursal growth to outpace new CV volume growth
Higher volumes to support ~19% CAGR for NBFCs over FY15-FY17E: Our Auto analyst expects new LCV and M&HCV sales to register 15% and 20% growth respectively over FY15-FY17. This will be directly reflected in disbursements of CV lenders. On an average, M&HCV value (price) is ~5 times higher than LCV value. In addition, our coverage NBFCs have a higher share in M&HCV volumes while LCV loans in the market are dominated by captive financiers. Therefore, a 20% CAGR in M&HCV volumes and 16% in LCV volumes (as projected by our Auto analyst) can translate into ~19% CAGR in for NBFCs.
Pricing to improve by ~5% as discounts narrow: Currently, CV manufacturers are offering high discounts to push sales and therefore disbursements on a like-to-like basis (same volume numbers) have declined. Regional/branch offices of CV lenders indicate that they have lost 5-7% of disbursements (~10% since the peak of the last
(40%)
(30%)
(20%)
(10%)
0%
10%
20%
30%
40%
0
50
100
150
200
250
300
350
400
FY10 FY11 FY12 FY13 FY14 FY15E FY16E FY17E
('000) M&H CV domestic sales YoY growth (R)
(30%)
(20%)
(10%)
0%
10%
20%
30%
40%
50%
0
100
200
300
400
500
600
FY10 FY11 FY12 FY13 FY14 FY15E FY16E FY17E
('000) LCV domestic sales YoY growth (R)
19.0%
24.0%
1.5%
1.5%
2.0%
10%
12%
14%
16%
18%
20%
22%
24%
26%
Volume growth Lower discounts Higher LTVs Churning of used CVs Disbursement
Overall disbursement growth is likely to be ~500bps higher than CV volume growth
India NBFCs CV lenders: Gearing up for a joyride
Sector Report INDIA NBFC
25 March 2015 Page 11 of 82
cycle in FY08) in the last two years due to high discounts. We don’t expect discounts to disappear completely but a reduction in discounts can support a 5% increase in disbursements over the next three years.
LTV can increase with economic recovery: Large and experienced lenders have cut their LTV by 5-7% in the last two years in order to check increasing delinquencies. We expect LTVs to increase gradually from FY16 onwards which in turn will support disbursement growth.
Higher churning and better pricing of older vehicles to support disbursement further: Resale prices of vehicles have corrected sharply in the last two years due to idle capacity. Younger vintage vehicles are at a steep discount to newer vehicles. The resale market is dominated by brokers and prices are determined by factors such as urgency to close loans, fear of further deterioration in prices, and availability versus demand for vehicles. Prices are generally more depressed in an economic downturn and recover rapidly once there is a broad-based recovery.
In addition, many SRTOs are holding back their replacement demand as revenue visibility is still very poor. Players indicate that they are stretching the use of existing vehicles even though these require replacement. Such buyers are likely to come back in a big way once recovery gathers pace from Q3-Q4FY16 onwards. We expect higher churning of used vehicles will support a further 2% rise in disbursement for the next three years (taking incremental disbursals up 6-8% including the discount impact).
Higher churning and lower discounts could take incremental disbursals up 6-8% by FY17/18

India NBFCs CV lenders: Gearing up for a joyride
Sector Report INDIA NBFC
25 March 2015 Page 12 of 82
Benefits from lower fuel and funding cost Fuel cost has fallen ~15% in the last six months which will benefit CV operators as and when utilisation levels start improving. This apart, the cost of wholesale market borrowings is already down by ~150bps. We expect banks to cut lending rates in FY16, thereby further reducing the cost of funds for NBFCs.
Lower fuel cost to benefit CV operators
Diesel prices went up by 21% in FY13 and 16% in FY14. During this period, CV utilisation levels dropped by 30-40%, resulting in a sharp reduction in freight rate at a time when the fuel cost (~50% of operating cost) was going up. In the last six months fuel cost has declined by ~15% due to diesel price deregulation.
Although freight rates have also come off partially as there is plenty of excess capacity, benign fuel costs will definitely help CV operators as and when utilisation levels start to improve.
Fig 16 - Fuel cost for CV operators has declined by ~15% in the last six months
Source: IOCL (diesel prices – Mumbai) RCML Research
We note that there is a very limited correlation between CV utilisation rate and fuel cost. CV utilisation is instead correlated with industrial activity and GDP growth. We are expecting GDP growth and industrial activity to pick up going forward. At this time, lower fuel cost will reduce operating costs for CV operators and thus improve their profitability.
CV operators have stated that if freight rates don’t correct further, then M&HCV operators could benefit in the range of Rs 12k-15k a month, which will help them pay their monthly loan installments. Players have also indicated that freight rates will recover sharply when utilisation levels improve, as rates in many segments are unduly low, mainly due to undercutting by SRTOs. This is especially true in the mining belt.
Cheaper funding costs to boost NBFC margins from FY16 onward
The cost of borrowing through the wholesale market is already down by ~150bps in FY15 and this trend is expected to continue. We expect banks to cut their lending rates in FY16, thereby further reducing the cost of funds for NBFCs (banks account for 40-45% of total NBFC borrowings). Securitisation volumes are likely to decline by 30-40% in FY15 but we expect steady pick up from FY16 onwards, thereby aiding NBFC margins. The delinquency rate is also expected to drop considerably in FY16 and therefore interest reversal will be very low, supporting yields.
42.2
46.3
67.3
57.1
30
35
40
45
50
55
60
65
70
Apr
-10
Jun-
10
Aug
-10
Oct
-10
Dec
-10
Feb-
11A
pr-1
1
Jun-
11
Aug
-11
Oct
-11
Dec
-11
Feb-
12A
pr-1
2
Jun-
12
Aug
-12
Oct
-12
Dec
-12
Feb-
13A
pr-1
3
Jun-
13
Aug
-13
Oct
-13
Dec
-13
Feb-
14A
pr-1
4
Jun-
14
Aug
-14
Oct
-14
Dec
-14
Feb-
15
(Rs/litre) Retail Diesel Prices (Mumbai) Lower fuel cost will benefit CV operators as and when utilisation picks up
Upside risk to FY16 margins for NBFCs due to lower cost funds, interest reversal and higher securitisation

India NBFCs CV lenders: Gearing up for a joyride
Sector Report INDIA NBFC
25 March 2015 Page 13 of 82
Short-term interest rates are headed south Retail NBFCs in India borrow for a maximum 4-5 year tenure (duration of loans is a maximum of 5 years). NBFCs borrow heavily from the bond market when short-term interest rates are benign, predictable and lower.
In Jul’13, the RBI tightened liquidity to curb rupee volatility which resulted in a sharp increase in short-term rates. Three-month CP rates touched a record high of 12.4% by the end of Aug’13. Despite an increase in banks’ lending rates in FY14, bank funding was cheaper for a considerable part of the year (FY14). As against this, interest rates in the bond market were high and volatile. During this period NBFCs/HFCs stayed away from the bond market and changed their borrowing mix in favour of bank loans.
NBFCs now increasingly borrowing through bond market CP rates are down by ~150bps in the last one year and are unlikely to be very volatile in FY15/FY16. Investor appetite for bonds has improved in the last six months as directionally interest rates are headed downwards (demand for bonds usually improves when interest rates are declining as it is a fixed-rate product). NBFCs have started paying off their bank loans and relying heavily on bond funds in the last 3-4 months.
Fig 17 - NBFC borrowings from banks declining
Source: RBI, RCML Research
NBFCs have indicated that fund raising through the wholesale market is now 50-75bps cheaper than bank loans (base rate at 10.25-10.5%). Many NBFCs are funding entire incremental requirements through the bond market instead of banks.
Fig 18 - Short-term interest rates (3M – CP rates) have corrected by ~150bps
Source: Bloomberg, RCML Research
50.0%
26.7%21.7%
5.3%
(10%)
0%
10%
20%
30%
40%
50%
60%
Mar
-12
May
-12
Jul-1
2
Sep
-12
Nov
-12
Jan-
13
Mar
-13
May
-13
Jul-1
3
Sep
-13
Nov
-13
Jan-
14
Mar
-14
May
-14
Jul-1
4
Sep
-14
Nov
-14
Jan-
15
Bank credit to NBFCs (YoY growth %)
10.49
8.94
7
8
9
10
11
12
13
Apr
-13
May
-13
Jun-
13
Jul-1
3
Aug
-13
Sep
-13
Oct
-13
Nov
-13
Dec
-13
Jan-
14
Feb-
14
Mar
-14
Apr
-14
May
-14
Jun-
14
Jul-1
4
Aug
-14
Sep
-14
Oct
-14
Nov
-14
Dec
-14
Jan-
15
Feb-
15
Mar
-15
(%)
NBFCs are borrowing more through the wholesale debt market as interest rates have softened

India NBFCs CV lenders: Gearing up for a joyride
Sector Report INDIA NBFC
25 March 2015 Page 14 of 82
Expect banks to cut lending rates in FY16 We expect short-term interest rates to remain low in FY16, aiding NBFC margins (in FY15, the benefit will be limited only to incremental funding in H2FY15). We expect banks to cut lending rates in FY16. NBFC borrowings through banks constitute 40-45% of total funding and, unlike wholesale market borrowings, are floating in nature. Therefore, entire borrowings from banks will get re-priced immediately. NBFCs have indicated that they may not pass the entire benefit in cost of funds to borrowers, leading to better margins.
Securitisation activities to pick up gradually in FY16, lowering cost of funds We expect a 30-40% drop in fresh sell-down to banks by leading NBFCs in FY15. Our interactions with rating agencies confirm our view that demand from banks for priority sector buyouts and NBFC loans is likely to remain low in FY15. For example, the proportion of off-book loans is at a record low of 14% as of Q3FY15 for SHTF.
Fig 19 - SHTF - Off-book proportion is at lowest level since last three years
Source: Shriram Transport Finance, RCML Research
Demand from banks is low due to changes in the treatment of investments in RIDF (rural infrastructure development fund) bonds and low bank credit growth. As per the latest RBI circular, banks will be allowed to consider outstanding balances of investments in RIDF and other funds for computation of priority sector lending requirements. The total outstanding amount of RIDF and other funds stood at Rs 1,150bn as on FY13, as per NABARD. This will reduce banks’ dependence on securitisation to meet shortfalls in FY15. In addition, bank credit growth is likely to remain low this year, further reducing the demand from banks.
Qualifying assets for sell-downs are also lower from the NBFC side as loans need to be seasoned for at least six months (without a single default in EMI). Due to slower disbursements and higher defaults, fewer loans are qualifying for sell-down.
Priority sector lending certificates (PSLC): a potential game-changer for NBFCs The working group of the RBI constituted especially to look into priority sector lending (PSL) targets and classifications has recommended the introduction of PSLCs to enable banks to meet their PSL targets and/or leverage on over achievements. These papers will be traded on an electronic platform and will allow the most efficient lender to provide funding access to the poor. There will not be any transfer of underlying credit risk.
39.9%
36.1%39.6%
45.3%
38.8%
33.4% 33.2%36.7%
31.6% 30.3% 29.0%31.3%
25.5%
20.6%
14.2%
10%
15%
20%
25%
30%
35%
40%
45%
50%
Q1F
Y12
Q2F
Y12
Q3F
Y12
Q4F
Y12
Q1F
Y13
Q2F
Y13
Q3F
Y13
Q4F
Y13
Q1F
Y14
Q2F
Y14
Q3F
Y14
Q4F
Y14
Q1F
Y15
Q2F
Y15
Q3F
Y15
Off-book proportion atlowest in 3 yrs level
Securitisation activities are at record low due to one-time regulatory impact, lower demand from banks
PSLCs will enable NBFCs to sell loans efficiently at a better rate, aiding their profitability

India NBFCs CV lenders: Gearing up for a joyride
Sector Report INDIA NBFC
25 March 2015 Page 15 of 82
Currently, Scheduled Commercial Banks (SCB), Regional Rural Banks (RRB), Local Area Banks (LAB), and Urban Cooperative Banks (UCB) who have are allowed to participate. In future, Small Finance Banks would also be allowed to participate. We believe the RBI will gradually allow NBFCs to participate through this route as well, rather than selling down or securitising loans through SPVs which is much more cumbersome as these papers require ratings and transfer of risk. This will also bring transparency in off-book transactions.
Interest reversals will be lower in FY16 Our estimates suggest that SHTF and MMFS are likely to lose 40-50bps and 30-40bps in margins respectively due to interest reversal on NPAs in FY14/15. We expect the delinquency rate to decline considerably in FY16, leading to low interest reversal. This is likely to support yield on loans in FY16. In addition, any recovery from written-off interest accrual can boost margins for CV lenders.
NBFCs have lost 30-50bps of margins in FY14/FY15 due to interest reversal on account of slippages
India NBFCs CV lenders: Gearing up for a joyride
Sector Report INDIA NBFC
25 March 2015 Page 16 of 82
NBFCs with high NPA cover to sail through new norms Our coverage NBFCs are well above the proposed tier 1 capital requirement of 10% under the new RBI norms. NBFCs have also been given considerable time to comply with 90-DPD (days past due) norms for NPA classification. We believe that these companies will lower their coverage ratio without taking a hit on profitability. Lower NPA coverage is not much of a concern as cash flows/profitability remain intact.
Tier 1 requirement of 10%
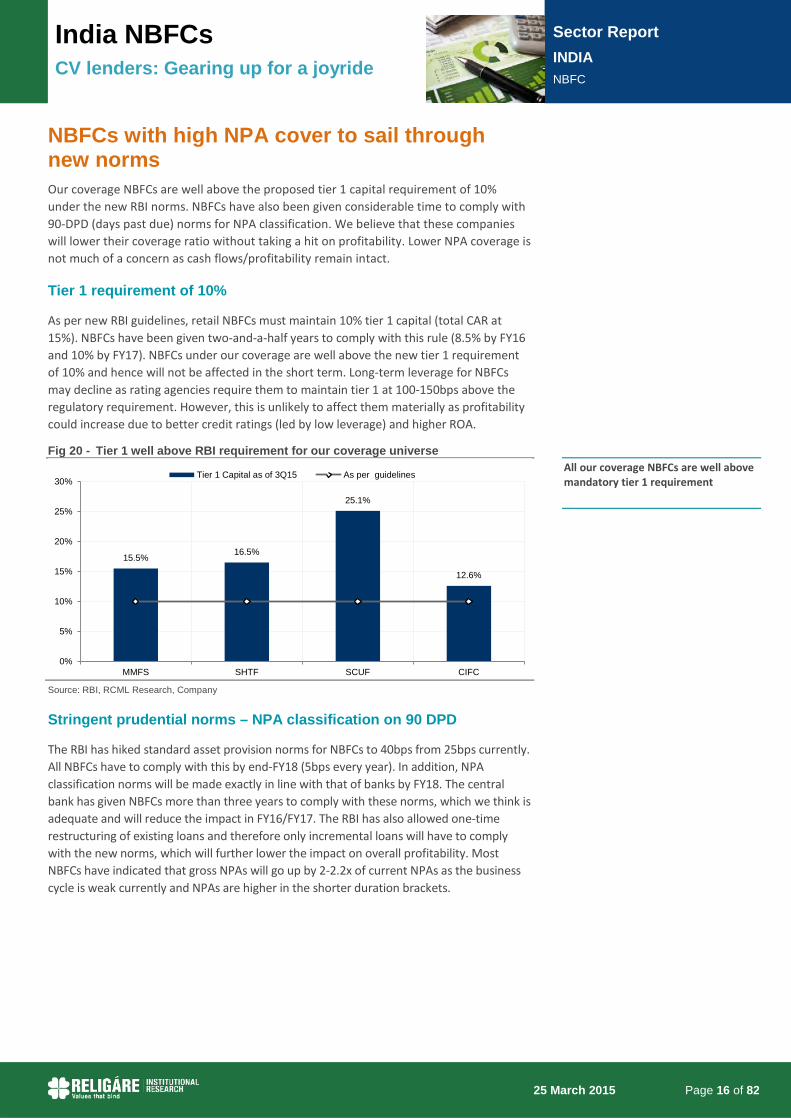
As per new RBI guidelines, retail NBFCs must maintain 10% tier 1 capital (total CAR at 15%). NBFCs have been given two-and-a-half years to comply with this rule (8.5% by FY16 and 10% by FY17). NBFCs under our coverage are well above the new tier 1 requirement of 10% and hence will not be affected in the short term. Long-term leverage for NBFCs may decline as rating agencies require them to maintain tier 1 at 100-150bps above the regulatory requirement. However, this is unlikely to affect them materially as profitability could increase due to better credit ratings (led by low leverage) and higher ROA.
Fig 20 - Tier 1 well above RBI requirement for our coverage universe
Source: RBI, RCML Research, Company
Stringent prudential norms – NPA classification on 90 DPD
The RBI has hiked standard asset provision norms for NBFCs to 40bps from 25bps currently. All NBFCs have to comply with this by end-FY18 (5bps every year). In addition, NPA classification norms will be made exactly in line with that of banks by FY18. The central bank has given NBFCs more than three years to comply with these norms, which we think is adequate and will reduce the impact in FY16/FY17. The RBI has also allowed one-time restructuring of existing loans and therefore only incremental loans will have to comply with the new norms, which will further lower the impact on overall profitability. Most NBFCs have indicated that gross NPAs will go up by 2-2.2x of current NPAs as the business cycle is weak currently and NPAs are higher in the shorter duration brackets.
15.5%16.5%
25.1%
12.6%
0%
5%
10%
15%
20%
25%
30%
MMFS SHTF SCUF CIFC
Tier 1 Capital as of 3Q15 As per guidelinesAll our coverage NBFCs are well above mandatory tier 1 requirement
India NBFCs CV lenders: Gearing up for a joyride
Sector Report INDIA NBFC
25 March 2015 Page 17 of 82
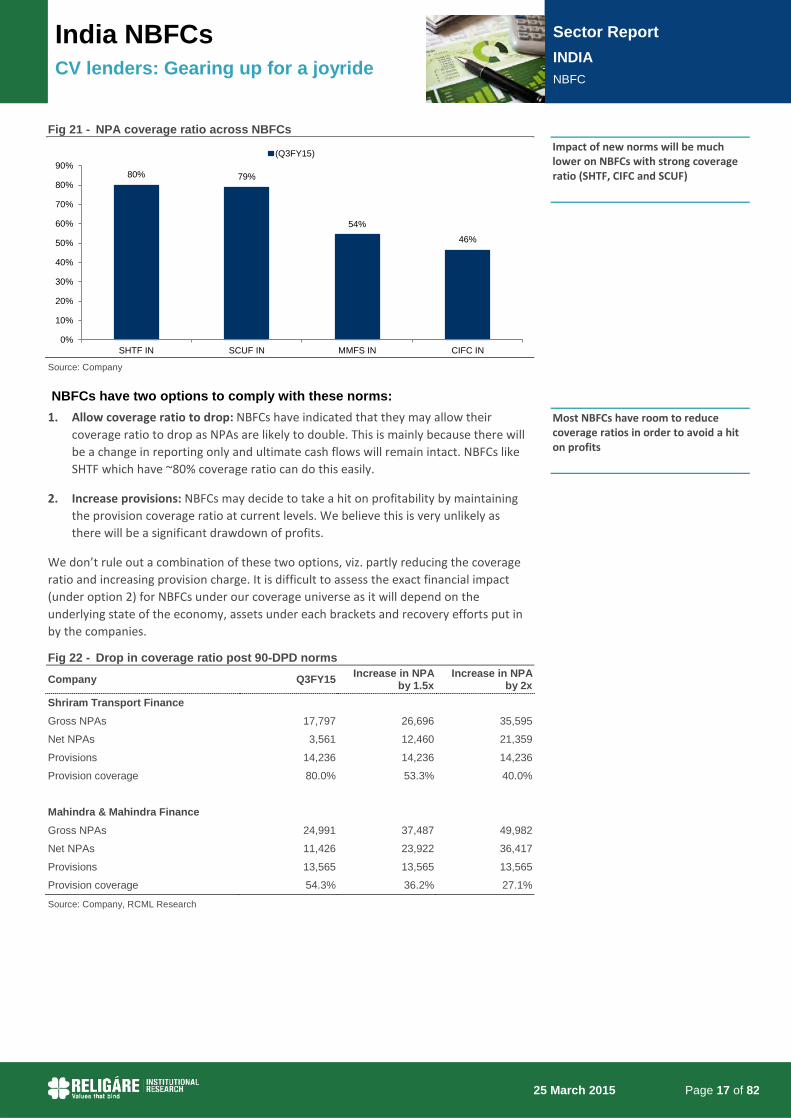
Fig 21 - NPA coverage ratio across NBFCs
Source: Company
NBFCs have two options to comply with these norms: 1. Allow coverage ratio to drop: NBFCs have indicated that they may allow their
coverage ratio to drop as NPAs are likely to double. This is mainly because there will be a change in reporting only and ultimate cash flows will remain intact. NBFCs like SHTF which have ~80% coverage ratio can do this easily.
2. Increase provisions: NBFCs may decide to take a hit on profitability by maintaining the provision coverage ratio at current levels. We believe this is very unlikely as there will be a significant drawdown of profits.
We don’t rule out a combination of these two options, viz. partly reducing the coverage ratio and increasing provision charge. It is difficult to assess the exact financial impact (under option 2) for NBFCs under our coverage universe as it will depend on the underlying state of the economy, assets under each brackets and recovery efforts put in by the companies.
Fig 22 - Drop in coverage ratio post 90-DPD norms
Company Q3FY15 Increase in NPA by 1.5x
Increase in NPA by 2x
Shriram Transport Finance
Gross NPAs 17,797 26,696 35,595
Net NPAs 3,561 12,460 21,359
Provisions 14,236 14,236 14,236
Provision coverage 80.0% 53.3% 40.0%
Mahindra & Mahindra Finance Gross NPAs 24,991 37,487 49,982
Net NPAs 11,426 23,922 36,417
Provisions 13,565 13,565 13,565
Provision coverage 54.3% 36.2% 27.1%
Source: Company, RCML Research
80% 79%
54%
46%
0%
10%
20%
30%
40%
50%
60%
70%
80%
90%
SHTF IN SCUF IN MMFS IN CIFC IN
(Q3FY15)Impact of new norms will be much lower on NBFCs with strong coverage ratio (SHTF, CIFC and SCUF)
Most NBFCs have room to reduce coverage ratios in order to avoid a hit on profits
India NBFCs CV lenders: Gearing up for a joyride
Sector Report INDIA NBFC
25 March 2015 Page 18 of 82
We believe the impact on provision coverage ratio is likely to be lower for SHTF than MMFS. In addition, we expect SHTF’s credit quality to improve and MMFS’s to decline going forward, thereby lowering/raising the negative impact of regulatory change on SHTF/MMFS respectively.
Investors unlikely to penalise NBFCs for lower coverage ratio
Cash flows are likely to remain intact and lower coverage ratios would imply only a change in accounting/reporting methodology. Book value adjusted for net NPA (adj. BV) is of no consequence here, as a large part of the adjustment is technical in nature and there is no loss in underlying value. Profitability remains unchanged. Credit costs are more important for NBFCs than reported NPAs due to the low tenure of underlying assets (at <4 years).
Change in reporting only; cash flows intact
India NBFCs CV lenders: Gearing up for a joyride
Sector Report INDIA NBFC
25 March 2015 Page 19 of 82
How to play the sector? SHTF is our top pick (BUY, TP Rs 1,500) due to its strong presence in the used CV market, robust capitalisation and NPA coverage. We also initiate coverage on CIFC (TP Rs 775) and SCUF (TP Rs 2,300) with BUY ratings. Maintain HOLD on MMFS (TP Rs 250) due to cyclical pressure in the medium term and expensive valuations
Structural BUYs – CIFC and SCUF
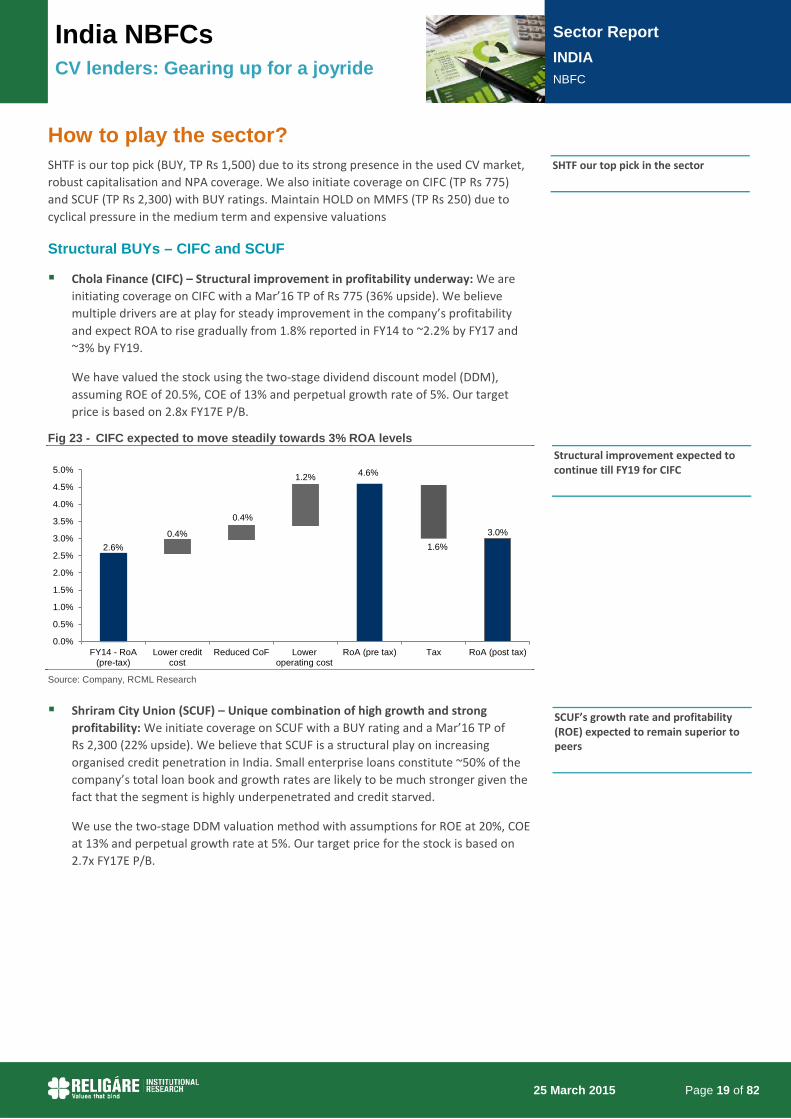
Chola Finance (CIFC) – Structural improvement in profitability underway: We are initiating coverage on CIFC with a Mar’16 TP of Rs 775 (36% upside). We believe multiple drivers are at play for steady improvement in the company’s profitability and expect ROA to rise gradually from 1.8% reported in FY14 to ~2.2% by FY17 and ~3% by FY19.
We have valued the stock using the two-stage dividend discount model (DDM), assuming ROE of 20.5%, COE of 13% and perpetual growth rate of 5%. Our target price is based on 2.8x FY17E P/B.
Fig 23 - CIFC expected to move steadily towards 3% ROA levels
Source: Company, RCML Research
Shriram City Union (SCUF) – Unique combination of high growth and strong profitability: We initiate coverage on SCUF with a BUY rating and a Mar’16 TP of Rs 2,300 (22% upside). We believe that SCUF is a structural play on increasing organised credit penetration in India. Small enterprise loans constitute ~50% of the company’s total loan book and growth rates are likely to be much stronger given the fact that the segment is highly underpenetrated and credit starved.
We use the two-stage DDM valuation method with assumptions for ROE at 20%, COE at 13% and perpetual growth rate at 5%. Our target price for the stock is based on 2.7x FY17E P/B.
2.6%0.4%
0.4%
1.2% 4.6%
1.6%3.0%
0.0%
0.5%
1.0%
1.5%
2.0%
2.5%
3.0%
3.5%
4.0%
4.5%
5.0%
FY14 - RoA(pre-tax)
Lower creditcost
Reduced CoF Loweroperating cost
RoA (pre tax) Tax RoA (post tax)
SHTF our top pick in the sector
Structural improvement expected to continue till FY19 for CIFC
SCUF’s growth rate and profitability (ROE) expected to remain superior to peers

India NBFCs CV lenders: Gearing up for a joyride
Sector Report INDIA NBFC
25 March 2015 Page 20 of 82
Fig 24 - SCUF is present in high growth and high ROE segments
Source: Company
Upward cycle has begun for SHTF; MMFS still mid-downcycle
Potential upside/downside risk to estimates for SHTF/MMFS We believe that consensus is underestimating the upside potential in SHTF’s earnings. Recovery in the CV cycle is likely to be much steeper this time around and, in our view, the stock can register a 33% CAGR in net profits over FY15-FY18 (note that consensus is estimating a 25% CAGR over FY15-FY17). We are assuming credit cost of 1.8% in FY17 as compared to the last 10-year average of 1.7%. Credit cost can be much lower than our estimates.
Credit cost for MMFS is likely to touch 2.7% in FY15 (1.8% in FY14 and 1.3% in FY13). We are assuming some moderation in credit cost in FY16 and FY17; however if rural demand does not improve and the cycle worsens, then costs may remain elevated. We note that credit cost in the last down cycle was ~3.7% on average for three years (FY08-FY10).
Fig 25 - SHTF – upside risk from credit cost Fig 26 - MMFS – downside risk from credit cost
Source: Company, RCML Research Source: Company, RCML Research
MSME Loans (yield 18-22%)
53%
MSME Loans -against gold
(yield 16-18%)6%
Gold loans(yield 16-18%)
11%
Auto loans(yield 22-24%)
8%
Two wheelers(yield 22-24%)
18%
Personal Loans(yield 24-27%)
4%
1.7%
1.6%
1.4%1.6%
1.7%
2.0%1.9%
2.2% 2.2%2.1%
1.8%
1.2%
1.4%
1.6%
1.8%
2.0%
2.2%
2.4%
FY07
FY08
FY09
FY10
FY11
FY12
FY13
FY14
FY15
E
FY16
E
FY17
E
Credit cost as % of AUM
0.7% 0.7%
2.3%
3.9%4.2%
2.9%
1.5%1.0%
1.3%1.8%
2.7%2.3%
2.0%
0.0%0.5%1.0%1.5%2.0%2.5%3.0%3.5%4.0%4.5%
FY05
FY06
FY07
FY08
FY09
FY10
FY11
FY12
FY13
FY14
FY15
E
FY16
E
FY17
E
Credit cost as % of AUM
Credit cost assumption conservative for SHTF and aggressive for MMFS

India NBFCs CV lenders: Gearing up for a joyride
Sector Report INDIA NBFC
25 March 2015 Page 21 of 82
Fig 27 - SHTF – we are ~10% ahead of consensus for FY17
FY15 FY16 FY17 Consensus EPS 58.2 73 90 YoY growth (%) 25% 24% Religare EPS 59.1 76.3 100.0 YoY growth (%) 29% 31% Religare vs. Consensus EPS 1.5% 5.0% 11.1%
Source: RCML Research, Bloomberg
Fig 28 - MMFS – we are 12-15% lower than consensus for FY16-FY17
FY15 FY16 FY17 Consensus EPS 15.4 20.2 25.3 YoY growth (%) 31.7% 25.0% Religare EPS 15.1 17.8 21.4 YoY growth (%) 17.7% 20.0% Religare vs. Consensus EPS (1.4%) (11.9%) (15.4%)
Source: RCML Research, Bloomberg
Shriram Transport Finance – Well worth the long haul: The stock has a high correlation with GDP/IIP and we expect sharp improvement in loan growth, margins and credit cost as the economic recovery gathers pace. SHTF is the best stock to play a CV cycle recovery (+75% correlation). We expect a 33% earnings CAGR in this upward cycle which is likely to last till FY19.
We assume coverage of SHTF with a BUY rating and a Mar’16 TP of Rs 1,500 (29% upside). We have used two-stage DDM to value the stock with the following assumptions: ROE of 21%, COE of 13% and perpetual growth rate of 4%. We have valued the construction equipment finance subsidiary separately using the same assumptions. Our target price is based on 2.6x FY17E P/B.
Fig 29 - SHTF should see 33% CAGR in profits over FY15-FY18
Source: Company, RCML Research
19.0%
24.0%
33.0%
1.5%1.5%
2.0%
4.5%
4.5%
15%
17%
19%
21%
23%
25%
27%
29%
31%
33%
35%
Volumegrowth (%)
Lowerdiscounts (%)
Higher LTVs(%)
Increasedchurning of
used vehicles(%)
Disbursementgrowth (%)
Highermargins (15-20bps each
year)
Lower creditcost (15-20bps
each year)
Profit growth(%)
We expect strong CAGR in profits due to recovery in loan growth, margins and credit cost

India NBFCs CV lenders: Gearing up for a joyride
Sector Report INDIA NBFC
25 March 2015 Page 22 of 82
Mahindra Finance – The worst is yet to come: We believe that MMFS is in the middle of a downward cycle and is likely to register its weakest growth and profitability in the last five years for the FY15-FY17 period. AUM growth will be poor due to a slowdown in rural income and increased discounts offered by manufacturers. NPA coverage is at a record low and credit cost is likely to remain elevated due to higher slippages and transition to 90-DPD norms.
We assume coverage of MMFS with a HOLD rating and a Mar’16 TP of Rs 250 (4.8% downside). Our target price is based on 2.17x FY17E P/B and arrived at using a two-stage DDM with assumptions for ROE at 19%, COE at 14% and perpetual growth rate at 5%.
Fig 30 - MMFS’s disbursement growth to be weaker than overall volume growth
Source: Company, RCML Research
SHTF can trade at significant premium to MMFS SHTF is currently trading at ~10% premium to MMFS (one-year forward P/B). Past trends show that this premium widens significantly when the CV cycle is favourable – for instance, in FY08 and FY11, when CV volume growth was very strong, SHTF traded at ~100% premium to MMFS. We thus expect the valuation gap between the two stocks to widen further as the CV recovery gathers pace.
Fig 31 - SHTF premium/discount to MMFS (one-year forward P/B)
Source: Company, RCML Research, Bloomberg
12%
10%
(3%)
1%
5%
6%
7%
8%
9%
10%
11%
12%
13%
Volume growth Rural India - Volumegrowth
Growth supported throughCVs/pre-owned vehicles
Disbursement
95.6% 96.6%
(50.6%)
10.3%
(80%)
(60%)
(40%)
(20%)
0%
20%
40%
60%
80%
100%
120%
Mar
-06
Jun-
06S
ep-0
6D
ec-0
6M
ar-0
7Ju
n-07
Sep
-07
Dec
-07
Mar
-08
Jun-
08S
ep-0
8D
ec-0
8M
ar-0
9Ju
n-09
Sep
-09
Dec
-09
Mar
-10
Jun-
10S
ep-1
0D
ec-1
0M
ar-1
1Ju
n-11
Sep
-11
Dec
-11
Mar
-12
Jun-
12S
ep-1
2D
ec-1
2M
ar-1
3Ju
n-13
Sep
-13
Dec
-13
Mar
-14
Jun-
14S
ep-1
4D
ec-1
4M
ar-1
5
SHTF - premium/ discount over MMFS Average
MMFS likely to post weakest profitability in the last 5-7 years
SHTF’s valuation premium to MMFS typically widens during a CV upcycle
India NBFCs CV lenders: Gearing up for a joyride
Sector Report INDIA NBFC
25 March 2015 Page 23 of 82
Companies

Financial Highlights
Company Update INDIA NBFC
25 March 2015
REPORT AUTHORS
Parag Jariwala +91 22 6766 3442 [email protected]
PRICE CLOSE (24 Mar 15) INR 1,160.75 MARKET CAP INR 263.4 bln USD 4.2 bln
SHARES O/S 226.3 mln
FREE FLOAT 74.0%
3M AVG DAILY VOLUME/VALUE 0.5 mln / USD 9.5 mln
52 WK HIGH INR 1,287.70
52 WK LOW INR 665.05
BUY TP: INR 1,500.00 29.2%
Shriram Transport Finance SHTF IN
Well worth the long haul
We believe SHTF is the best stock to play the CV recovery. Though growth will be modest till H1FY16, we expect a sharp improvement in disbursement, margins and credit cost once we hit the middle of the CV upcycle in late-FY16 or early-FY17, led by (1) stronger CV replacement demand, (2) a higher churn rate in used vehicles (SHTF’s stronghold), and (3) lower delinquencies. We model for a 30% earnings CAGR over FY15-FY17 and retain our BUY rating on the stock with a revised Mar’16 TP of Rs 1,500.
Loan growth to improve materially from FY17: Our Auto analyst expects M&HCV volumes to grow by ~20% in FY16/FY17. We believe SHTF’s disbursement growth will outpace M&HCV volume growth due to narrowing vehicle discounts (currently 5-7%), an increase in LTVs (down 5-7% since FY11 peak) and higher churning of older vehicles (>5yrs) where SHTF has a dominant position.
Multiple drivers at play for margin improvement: Margins have declined by ~200bps since FY11 and are expected to recover gradually from FY16 driven by lower interest reversal (due to lower delinquencies), a change in loan mix towards older vehicles, higher securitisation and lower cost of funds as rates soften. The proportion of off-book loans is at a record low of 14% (Q3FY15). A sell-down will reduce SHTF’s cost of funds by 100-150bps, which will flow into margins once securitisation gathers steam.
Credit cost stabilising: Credit costs have been running at Rs 3bn per quarter for the last one year and we expect the trend to continue for the next 2-3 quarters. We conservatively estimate a 20bps decline in credit cost as a percentage of AUM each in FY16 and FY17.
Strong earnings growth ahead: We are 10% ahead of consensus on FY17 earnings and expect a 33% earnings CAGR in this upward cycle which is likely to last till FY19. We have a new Mar’16 TP of Rs 1,500 (from Rs 1,250) for SHTF set at 2.6x FY17E P/B.
Y/E 31 Mar FY13A FY14A FY15E FY16E FY17E
Net interest income (INR mln) 35,264 34,961 37,456 43,920 52,102
Net revenues (INR mln) 36,932 39,557 42,971 50,814 60,719
Pre-provision profits (INR mln) 28,670 29,768 31,562 37,811 45,879
Adj. PAT (INR mln) 13,606 12,642 13,400 17,302 22,683
Adj. EPS (INR) 60.0 55.7 59.1 76.3 100.0
ROE (%) 20.6 16.3 15.1 17.0 19.2
ROA (%) 3.4 2.7 2.5 2.8 3.3
Gross NPA (%) 3.2 3.9 3.7 3.9 4.0
CAR (%) 17.9 20.4 20.7 21.1 21.0
P/BV (x) 3.7 3.2 2.8 2.4 2.1
P/E (x) 19.4 20.8 19.7 15.2 11.6
Source: Company, Bloomberg, RCML Research
14,400
19,400
24,400
29,400
390
590
790
990
1,190
(INR) Stock Price Index Price

BUY TP: INR 1,500.00 29.2%
Shriram Transport Finance SHTF IN
Company Update INDIA NBFC
25 March 2015 Page 25 of 82
Recovery will be steeper this time around Expect 33% CAGR in PAT over FY15-FY18E
Volume growth of 19%+: Industry-wide M&HCV volumes have plunged 23-25% in both FY13 and FY14 and are likely to register a modest increase of ~10% in FY15. Our Auto analyst, Mihir Jhaveri, expects M&HCV volumes to grow by 19%/20% in FY16/FY17, and LCVs to pick up with a lag at a 15% CAGR over FY15-FY17.
Lower discounts, higher LTVs to drive 3% additional loan growth each year: We expect SHTF’s disbursement growth to be much higher than M&HCV volume growth due to a likely narrowing of discounts (currently 5-7%) and an increase in LTVs (down ~5% since the FY11 peak). We model for discounts to reduce and LTVs to increase by 1.5% each per year, driving an additional 3% disbursement growth for the company over our forecast period.
Higher disbursements to used vehicles: Our channel checks with industry players (CV fleet operators, lenders and dealers) suggest that churning of vehicles that are over 5-7 years old has stopped due to poor market conditions; we expect the scenario to improve going forward. Note that SHTF has a dominant position in this high-margin segment, which should support loan growth by 2% every year.
Margin improvement, lower credit costs to add 8-9% to earnings: We expect 15-20bps NIM improvement and a drop of 15-20bps in credit costs each year over FY15-FY18, driving 8-9% additional earnings growth for the company during this period. As such, margins in this upcycle are likely to be lower than the earlier cycle due to changes in securitisation guidelines and a higher share of loans to younger vehicles (<5yrs old) and LCVs.
We remain conservative on credit costs: Despite assuming ~20bps decline in credit costs in FY16 and FY17 each, our FY17 estimate stands at 1.8% vs. the last 10-year average of 1.7%. We see upside risks to our credit cost estimates if the economic situation improves considerably.
Fig 1 - SHTF should see 33% CAGR in profits over FY15-FY18E
Source: RCML Research
19.0%
24.0%
33.0%
1.5%1.5%
2.0%
4.5%
4.5%
15%
17%
19%
21%
23%
25%
27%
29%
31%
33%
35%
Volumegrowth (%)
Lowerdiscounts (%)
Higher LTVs(%)
Increasedchurning of
used vehicles(%)
Disbursementgrowth (%)
Highermargins (15-20bps each
year)
Lower creditcost (15-
20bps eachyear)
Profit growth(%)
Expect 33% PAT CAGR over FY15-FY18 driven by higher loan growth, better margins and benign credit costs

BUY TP: INR 1,500.00 29.2%
Shriram Transport Finance SHTF IN
Company Update INDIA NBFC
25 March 2015 Page 26 of 82
We are ~10% ahead of consensus for FY17: We expect a 30% PAT CAGR for SHTF over FY15-FY17 as the economic recovery gathers pace. The company’s strong earnings profile backed by a 24% loan growth CAGR, lower credit costs and improving margins should support a re-rating to ~2.6x FY17E P/B (from current valuations of 2.1x FY17E P/B), in our view.
Fig 2 - Religare vs. consensus
FY15 FY16 FY17 Consensus
EPS (Rs) 58.2 73 90
YoY growth (%) 25% 24%
Religare FY15 FY16 FY17 EPS (Rs) 59.1 76.3 100.0
YoY growth (%) 29% 31%
Religare vs. consensus FY15 FY16 FY17 EPS (Rs) 1.5% 5.0% 11.1%
Source: Company, Bloomberg, RCML Research
Sharp recovery in loan growth from H2FY16/FY17
We note that SHTF has gained significant market share in the recent downturn, and therefore incremental growth would be limited to that extent (lower than overall disbursement growth for the industry) when the cycle begins to turn positive.
Thereafter, we believe disbursements would rebound significantly for SHTF once we are in the middle of the upcycle (late-FY16 or early-FY17), as replacement demand kicks in. Vehicle replacements have been low over the last two years due to the uncertain macro conditions and we expect a pick-up from Q2FY16 onwards (typically 25% of vehicles come up for replacement every year when the economy is doing well). Many small road transport operators (SRTO) are holding back their purchases currently, as they are typically late entrants into the market due to their stretched cash flow situation.
We expect strong disbursement growth for SHTF from FY17 onwards due to a higher churning rate of used vehicles (mainly +5-year-old vehicles), a segment where SHTF enjoys a dominant position.
Fig 3 - Disbursement growth to start improving meaningfully from FY17 onwards
Source: RCML Research, Company
66.9%
74.8%
62.2%
75.4%
(0.2%)
27.0%
35.4%
(2.0%)
35.0%
8.7% 6.9%12.9%
19.4%
(20%)
0%
20%
40%
60%
80%
100%
FY05 FY06 FY07 FY08 FY09 FY10 FY11 FY12 FY13 FY14 FY15E FY16E FY17E
Disbursement growth (%)
We are 10% above consensus for FY17 EPS
Participation from FTUs and SRTOs to increase considerably from FY17

BUY TP: INR 1,500.00 29.2%
Shriram Transport Finance SHTF IN
Company Update INDIA NBFC
25 March 2015 Page 27 of 82
Credit cost and margins are stabilising
Gross NPAs have risen by ~100bps since FY12. However, the company has maintained its NPA coverage and net NPA levels, which is encouraging in our view. NPA coverage is at ~80% with net NPA of 0.7% as of Q3FY15. Credit cost for the last 3-4 quarters has remained in the range of 2.2-2.4%.
Fig 4 - Gross NPAs have stabilised in last 4-5 quarters
Source: Company
Credit costs have been running at Rs 3bn per quarter for the last one year and we expect the trend to continue for the next 2-3 quarters. Credit cost as a percentage of AUM is likely to fall by ~40bps over FY15-FY17.
SHTF took a hit on its profits in Q1/Q2FY12 due to its mining-related exposure. Currently, ~1% of its loan book is exposed to mining-related activities (all operational currently).
Fig 5 - Credit cost stabilising and NPA coverage robust at 80%
Source: Company
2.7% 2.7%2.8%
3.1%3.0%
2.9% 2.9%
3.2%3.1%
3.3%
3.6%
3.9%3.7% 3.7%
3.6%
2.5%
2.7%
2.9%
3.1%
3.3%
3.5%
3.7%
3.9%
4.1%
Q1F
Y12
Q2F
Y12
Q3F
Y12
Q4F
Y12
Q1F
Y13
Q2F
Y13
Q3F
Y13
Q4F
Y13
Q1F
Y14
Q2F
Y14
Q3F
Y14
Q4F
Y14
Q1F
Y15
Q2F
Y15
Q3F
Y15
Gross NPA (%)
2.3%
3.0%
2.3%2.1%
2.2% 2.2% 2.2% 2.2%
2.4% 2.4%
2.6%
2.4% 2.5%
2.3%
2.4%
74%
76%
78%
80%
82%
84%
86%
88%
1.5%
1.7%
1.9%
2.1%
2.3%
2.5%
2.7%
2.9%
3.1%
Q1F
Y12
Q2F
Y12
Q3F
Y12
Q4F
Y12
Q1F
Y13
Q2F
Y13
Q3F
Y13
Q4F
Y13
Q1F
Y14
Q2F
Y14
Q3F
Y14
Q4F
Y14
Q1F
Y15
Q2F
Y15
Q3F
Y15
Credit cost on AUM (%) NPA coverage (%) - (R) Robust NPA coverage at 80% gives us significant comfort

BUY TP: INR 1,500.00 29.2%
Shriram Transport Finance SHTF IN
Company Update INDIA NBFC
25 March 2015 Page 28 of 82
Expect credit costs to moderate going forward
We believe SHTF has adequately provided for lost and delinquent assets, and therefore the company’s credit costs should decline at a faster pace when the cycle improves. Also, credit costs as a percentage of AUM are likely to drop by ~40bps over FY15-FY17 as the economy improves and manufacturing & infrastructure-related activities gather steam.
While we expect FY17 credit costs, at 1.8%, to remain marginally higher than the last 10-year average of 1.7%, we see upside risks to our estimates if economic growth and outlook remains strong.
Fig 6 - Credit cost to decline steadily
Source: Company, RCML Research
Multiple factors to drive up margins
NIMs have declined by 100bps from 7.7% in Q2FY13 to 6.6% in Q2FY15 (lowest in the last three years) due to interest reversals on high delinquencies and changes in the loan mix. However, margins have stabilised in the last 3-4 quarters and appear to have bottomed out.
Fig 7 - NIMs are stabilising at 6.5-6.6%
Source: Company
2.21%
2.07%
1.79%
0.8%
1.0%
1.2%
1.4%
1.6%
1.8%
2.0%
2.2%
2.4%
FY05
FY06
FY07
FY08
FY09
FY10
FY11
FY12
FY13
FY14
FY15
E
FY16
E
FY17
E
Credit costs as a % of AUM Average credit cost (10 years)
Avg. at 1.67%
7.6%
8.2%
7.4%7.2%
7.4%
7.7%7.5%
7.2%7.0%
6.7%6.5% 6.5% 6.5% 6.6% 6.6%
6%
7%
7%
8%
8%
9%
Q1F
Y12
Q2F
Y12
Q3F
Y12
Q4F
Y12
Q1F
Y13
Q2F
Y13
Q3F
Y13
Q4F
Y13
Q1F
Y14
Q2F
Y14
Q3F
Y14
Q4F
Y14
Q1F
Y15
Q2F
Y15
Q3F
Y15
NIM on AUM
Upside risk from credit cost does exist
While NIMs have corrected by ~120bps in FY13/FY14, they have stabilised in the last 3-4 quarters

BUY TP: INR 1,500.00 29.2%
Shriram Transport Finance SHTF IN
Company Update INDIA NBFC
25 March 2015 Page 29 of 82
We model for ~40bps improvement in NIMs over FY15-FY17 given multiple triggers for steady margin expansion in the next 2-3 years.
Cost of funds to decline gradually: Cost of borrowings through the wholesale market is already down ~150bps since FY14, with the trend expected to continue. We expect banks to cut their lending rates in FY16, thus reducing the cost of borrowings from banks.
Fig 8 - Wholesale cost of funds down ~150bps since FY14
Source: Bloomberg, RCML Research
ALM structure offers benefits in a declining rate scenario: For SHTF, nearly the entire loan book carries a fixed rate of interest, whereas 40% of its borrowings are floating in nature (bank borrowings). This kind of ALM structure will help the company in a softening rate environment, as a reduction in bank and wholesale rates would lower the company’s overall cost of funds. In addition, SHTF may look at reducing dependence on banks as the cost of wholesale borrowings is lower, which would support margins further.
Fig 9 - Break-up of borrowings for the company
Source: Company
10.49
8.94
7
8
9
10
11
12
13
Apr
-13
May
-13
Jun-
13
Jul-1
3
Aug
-13
Sep
-13
Oct
-13
Nov
-13
Dec
-13
Jan-
14
Feb-
14
Mar
-14
Apr
-14
May
-14
Jun-
14
Jul-1
4
Aug
-14
Sep
-14
Oct
-14
Nov
-14
Dec
-14
Jan-
15
Feb-
15
Mar
-15
(%)
Bank loans41%
NCDs40%
Fixed Deposits6%
Subordinated debts12%
Commercial papers1%
Cyclical tailwinds to help as lending book is fixed in nature

BUY TP: INR 1,500.00 29.2%
Shriram Transport Finance SHTF IN
Company Update INDIA NBFC
25 March 2015 Page 30 of 82
AUM mix to change in favour of high-yielding loans as macro improves: The proportion of LCVs in SHTF’s overall AUM (~10%) has gone up in the last 1-2 years as LCV volumes have declined at a much lower rate than other CV segments. Also, the proportion of low-yielding, sub-5-year-old CVs has gone up significantly over the years and now stands at 15-18% of overall AUM. We believe these changes in AUM mix (which have hit company margins in the last 2-3 years) can be attributed to industry trends, as demand for newer used CVs (mainly 1-3-year-old vehicles) was created due to a slowdown in investment-related/manufacturing activities in the last two years.
We expect this trend to reverse and the AUM mix to slowly move towards high-yielding, older vehicles (>5yrs), which in turn would support margins.
Fig 10 - AUM mix has changed dramatically in the last three years
Source: Company
Securitisation volumes to pick up from FY16 onwards: SHTF’s off-book loan proportion is at a record low of 21% as of Q2FY15 due to lower demand from banks and changes in RBI regulations. We expect securitisation volumes to pick up from FY16 onwards and touch 33-35% of AUM by FY17-end. The cost-of-funds advantage in a sell-down is 100-150bps, which should flow into SHTF’s margins in FY16/FY17.
Fig 11 - Off-book loan proportion at lowest level
Source: Company, RCML Research
76% 76%77% 77% 78% 79% 79%
81%83%
84%87%
88%90%
90%92%
24% 24% 23% 23% 22% 21% 20%19%
17%
13% 12%10% 10% 8%
0%
5%
10%
15%
20%
25%
30%
70%
75%
80%
85%
90%
95%
Q1F
Y12
Q2F
Y12
Q3F
Y12
Q4F
Y12
Q1F
Y13
Q2F
Y13
Q3F
Y13
Q4F
Y13
Q1F
Y14
Q2F
Y14
Q3F
Y14
Q4F
Y14
Q1F
Y15
Q2F
Y15
Q3F
Y15
Used CVs New CVs (R)
39.9%
36.1%39.6%
45.3%
38.8%
33.4% 33.2%36.7%
31.6% 30.3% 29.0%31.3%
25.5%
20.6%
14.2%
10%
15%
20%
25%
30%
35%
40%
45%
50%
Q1F
Y12
Q2F
Y12
Q3F
Y12
Q4F
Y12
Q1F
Y13
Q2F
Y13
Q3F
Y13
Q4F
Y13
Q1F
Y14
Q2F
Y14
Q3F
Y14
Q4F
Y14
Q1F
Y15
Q2F
Y15
Q3F
Y15
Off-book proportion atlowest level
Proportion of very old vehicles (+5 years) expected to increase, aiding profitability
Securitisation volumes are at a record low and should improve from FY16 onwards

BUY TP: INR 1,500.00 29.2%
Shriram Transport Finance SHTF IN
Company Update INDIA NBFC
25 March 2015 Page 31 of 82
Priority sector lending certificates (PSLC) – a potential game-changer for SHTF: The working group of the RBI, especially constituted to look into priority sector targets and classifications, has recommended the introduction of PSLCs to enable banks to meet their PSL targets and/or leverage on over-achievements. These papers will be traded on electronic platforms and will allow the most efficient lender to provide access to the poor. There will not be any transfer of underlying credit risk.
Currently, Scheduled Commercial Banks (SCB), Regional Rural Banks (RRB), Local Area Banks (LAB), and Urban Cooperative Banks (UCB) who have originated PSL eligible category loans are allowed to participate. In future, Small Finance Banks would also be allowed to participate.
While the RBI currently does not permit NBFCs to participate in PSLCs, we think it would gradually allow them to use this route, rather than selling down or securitising loans through SPVs which is a much more cumbersome method as these papers require ratings and transfer of risk. This will also bring transparency into off-book transactions.
Interest reversals to be lower in FY16: Our estimates suggest that SHTF has lost 40-50bps in margins due to interest reversals on NPAs in FY15. We expect the delinquency rate to decline considerably in FY16, leading to lower interest reversals and supporting the yield on loans. In addition, any recovery from written-off interest accruals would boost margins for SHTF.
Fig 12 - We expect ~40bps improvement in margins from FY15-FY17
Source: Company, RCML Research
6.8%
7.5%
7.8%8.0%
8.3%
7.9%
7.3%
6.4% 6.5%
6.9% 6.9%
5%
6%
6%
7%
7%
8%
8%
9%
9%
FY07 FY08 FY09 FY10 FY11 FY12 FY13 FY14 FY15E FY16E FY17E
NIM on AUM
PSLCs will enable NBFCs to sell loans efficiently at a better rate, thereby aiding their profitability

BUY TP: INR 1,500.00 29.2%
Shriram Transport Finance SHTF IN
Company Update INDIA NBFC
25 March 2015 Page 32 of 82
SHTF the best stock to play CV cycle recovery
SHTF’s stock price has a strong correlation with CV sales (+75%) and we expect a re-rating ahead amid an upward CV cycle. Using the two-stage dividend discount model, we have a Mar’16 TP of Rs 1,500 for the stock, which offers ~29% upside from current levels.
Fig 13 - SHTF stock price has ~75% correlation with CV sales
Source: SIAM, Bloomberg, RCML Research
Fig 14 - Valuation summary Particulars ROE 21% g (initial growth) 18% r (COE) 13% gn (perpetual growth rate) 4% n (initial growth period, yrs) 5 payout1 15% payoutn 80% K1 0.85 K2 11.26 P/BV 2.58x Value of SHTF 1,409 Value of Shriram Equipment Finance 88 TP (rounded off) 1,500
Source: RCML Research
The stock is currently trading at +1 SD forward P/B. We expect a steady re-rating as the CV cycle improves further.
Fig 15 - One-year forward P/B
Source: Bloomberg, RCML Research, Company
0102030405060708090100
0
200
400
600
800
1000
1200
Mar
-04
Aug
-04
Jan-
05
Jun-
05
Nov
-05
Apr
-06
Sep
-06
Feb-
07
Jul-0
7
Dec
-07
May
-08
Oct
-08
Mar
-09
Aug
-09
Jan-
10
Jun-
10
Nov
-10
Apr
-11
Sep
-11
Feb-
12
Jul-1
2
Dec
-12
May
-13
Oct
-13
Mar
-14
Aug
-14
Jan-
15
SHTF's stock price Total domestic CV sales (R) ('000)(Rs)
Correlation = 75%
0.0
0.5
1.0
1.5
2.0
2.5
3.0
3.5
4.0
Jul-0
4
Jan-
05
Jul-0
5
Jan-
06
Jul-0
6
Jan-
07
Jul-0
7
Jan-
08
Jul-0
8
Jan-
09
Jul-0
9
Jan-
10
Jul-1
0
Jan-
11
Jul-1
1
Jan-
12
Jul-1
2
Jan-
13
Jul-1
3
Jan-
14
Jul-1
4
Jan-
15
(x) PBV Avg +1std -1std
SHTF’s stock price has strong correlation with CV sales

BUY TP: INR 1,500.00 29.2%
Shriram Transport Finance SHTF IN
Company Update INDIA NBFC
25 March 2015 Page 33 of 82
Disbursements Y/E 31 Mar (INR mln) FY13A FY14A FY15E FY16E FY17E Disbursements 2,62,531 2,85,950 3,05,618 3,45,166 4,11,961 Growth (%) 34.7 8.9 6.9 12.9 19.4 AUM/Sanctions 4,96,760 5,31,021 5,69,411 6,58,342 7,91,104 Growth (%) 23.5 6.9 7.2 15.6 20.2
Per Share Data Y/E 31 Mar (INR) FY13A FY14A FY15E FY16E FY17E Reported EPS 60.0 55.7 59.1 76.3 100.0 Adjusted EPS 60.0 55.7 59.1 76.3 100.0 DPS 7.0 7.0 8.3 12.2 16.0 Book value 317.1 364.6 415.4 479.4 563.4 Adjusted book value 306.5 351.3 407.2 473.6 557.7
Valuation Ratios Y/E 31 Mar (x) FY13A FY14A FY15E FY16E FY17E P/E 19.4 20.8 19.7 15.2 11.6 P/BV 3.7 3.2 2.8 2.4 2.1 P/ABV 3.8 3.3 2.9 2.5 2.1
Financial Ratios Y/E 31 Mar (%) FY13A FY14A FY15E FY16E FY17E Spread Analysis Interest spreads 4.7 4.9 6.8 7.0 7.2 Yield on advances 15.0 16.5 16.9 17.0 17.1 Yield on assets 13.2 13.7 14.4 14.7 14.5 Cost of funds 11.5 12.3 11.3 11.0 10.9 NIMs 7.3 6.4 6.5 6.9 6.9 Operating Ratios Operating cost to income 22.4 24.7 26.6 25.6 24.4 Operating expenses / Avg assets 2.8 2.6 2.4 2.5 2.4 Asset Quality and Capital Gross NPA 3.2 3.9 3.7 3.9 4.0 Net NPA 0.8 0.8 0.4 0.3 0.2 CAR 17.9 20.4 20.7 21.1 21.0 Growth Ratios Net interest income 36.8 30.6 21.3 23.8 14.9 Non-interest income 64.6 175.4 20.0 25.0 25.0 Pre-provisioning profit 8.2 3.8 6.0 19.8 21.3 Net profit 8.2 (7.1) 6.0 29.1 31.1 Assets 25.5 9.8 17.2 12.0 15.6 Advances 23.5 6.9 7.2 15.6 20.2 Book value 19.7 15.0 13.9 15.4 17.5 EPS 7.9 (7.1) 6.0 29.1 31.1
DuPont Analysis Y/E 31 Mar (%) FY13A FY14A FY15E FY16E FY17E Net interest income / Assets 8.8 7.4 7.0 7.2 7.5 Non-interest income / Assets 0.4 1.0 1.0 1.1 1.2 Operating expenses / Assets 2.1 2.1 2.1 2.1 2.1 Provisions / Assets 2.1 2.4 2.3 2.1 1.9 Taxes / Assets 2.4 2.1 2.0 2.1 2.2 ROA 3.4 2.7 2.5 2.8 3.3 Equity / Assets 6.1 6.1 6.0 6.0 5.9 ROAE 20.6 16.3 15.1 17.0 19.2

BUY TP: INR 1,500.00 29.2%
Shriram Transport Finance SHTF IN
Company Update INDIA NBFC
25 March 2015 Page 34 of 82
Income Statement Y/E 31 Mar (INR mln) FY13A FY14A FY15E FY16E FY17E Interest income 63,967 74,287 83,086 94,033 1,09,215 Interest expense (28,703) (39,325) (45,630) (50,112) (57,113) Net interest income 35,264 34,961 37,456 43,920 52,102 Non-interest income 1,669 4,596 5,515 6,894 8,617 Net revenue 36,932 39,557 42,971 50,814 60,719 Operating expenses (8,262) (9,789) (11,409) (13,002) (14,840) Pre-provisioning profits 28,670 29,768 31,562 37,811 45,879 Provisions & contingencies (8,508) (11,488) (12,142) (12,736) (13,006) PBT 20,162 18,280 19,420 25,075 32,873
Extraordinaries - -
-
-
- Income tax (6,556) (5,638) (6,020) (7,773) (10,191) Reported PAT 13,606 12,642 13,400 17,302 22,683 Adj. net profit 13,606 12,642 13,400 17,302 22,683
Balance Sheet Y/E 31 Mar (INR mln) FY13A FY14A FY15E FY16E FY17E Advances 3,14,438 3,64,737 4,33,276 4,83,814 5,61,943 Investments 35,689 27,253 28,470 29,748 31,090 Current assets 94,766 96,749 1,11,095 1,28,294 1,48,912 Net block (inc CWIP) 601 1,007 1,107 1,218 1,340
Goodwill - -
-
-
- Other assets Total Assets 4,45,493 4,89,745 5,73,949 6,43,074 7,43,286 Share capital 2,269 2,269 2,269 2,269 2,269
Options/warrants/others - - - - -
Reserves & surplus 69,679 80,463 91,987 1,06,520 1,25,574 Net worth 71,947 82,732 94,256 1,08,790 1,27,843 Total borrowings 2,31,999 3,59,246 3,95,171 4,52,074 5,24,949 Current liabilities 1,26,430 34,626 70,849 67,992 75,717 Provisions 17,955 15,653 16,436 17,257 18,120 Deferred tax liabilities (2,838) (2,512) (2,763) (3,039) (3,343) Other liabilities Total Equity & Liabilities 4,45,493 4,89,745 5,73,949 6,43,074 7,43,286

Financial Highlights
Company Update INDIA NBFC
25 March 2015
REPORT AUTHORS
Parag Jariwala +91 22 6766 3442 [email protected]
PRICE CLOSE (24 Mar 15) INR 262.50 MARKET CAP INR 149.3 bln USD 2.4 bln
SHARES O/S 601.8 mln
FREE FLOAT 50.0%
3M AVG DAILY VOLUME/VALUE 2.6 mln / USD 10.9 mln
52 WK HIGH INR 344.90
52 WK LOW INR 229.25
HOLD TP: INR 250.00 4.8%
Mahindra & Mahindra Fin Secs MMFS IN
The worst is yet to come
We believe MMFS is in the middle of a downward cycle which will see the company registering its weakest growth and profitability in the last five years during FY15-FY17. Valuations at 2.2x FY17E P/ABV appear expensive given a likely 300bps drop in ROE through FY17E amid cyclical pressure on AUM growth (10% CAGR), record-low NPA coverage (~50%) and high credit costs in the medium term – maintain HOLD with a revised Mar’16 TP of Rs 250.
Single-digit growth likely in FY16: In the last 3-4 years, auto sales in rural India have outpaced volumes in urban India, resulting in robust loan growth for MMFS due to its focus on rural markets. Now, given a slowdown in rural areas and high pent-up demand in urban India, we expect urban sales to move into the lead for the next 1-2 years. MMFS’ disbursal trend in rural India has been weak over the last 4-5 quarters and could remain 200-300bps lower than overall auto industry growth. Our Auto analyst expects auto/tractor volume growth of just 10%/11% in FY16/FY17. With high discounts and low resale prices of older vehicles, we expect MMFS’ overall AUM growth to drop to sub-10% in FY16 – the weakest since FY10.
NPA coverage at record low; credit cost to remain elevated: MMFS has not provided adequately for credit cost since the beginning of this downward cycle (FY12) and hence its coverage ratio has dropped to a record low of ~50% (86% in FY11). Transition to 90-DPD norms is likely to double its NPAs. We expect credit cost to remain elevated in FY15-FY17 as there is no room to lower coverage further.
FY16 margin gains to have little earnings impact: The cost of wholesale market borrowings has corrected sharply in the last one year and banks too are likely to cut their base rate in FY16. We believe MMFS’ FY16/FY17 margins will be 30-40bps higher than FY15, but earnings gains will be offset by credit cost and growth pressures.
Maintain HOLD: Given medium-term cyclical pressure and expensive valuations, we maintain HOLD. Our new Mar’16 TP of Rs 250 (from Rs 325) is set at 2.1x FY17E P/ABV.
Y/E 31 Mar FY13A FY14A FY15E FY16E FY17E
Net interest income (INR mln) 22,238 27,681 31,206 34,340 38,433
Net revenues (INR mln) 24,424 30,196 33,851 37,514 42,398
Pre-provision profits (INR mln) 16,103 19,805 21,948 23,740 26,443
Adj. PAT (INR mln) 9,270 9,544 8,532 10,042 12,049
Adj. EPS (INR) 16.5 16.9 15.1 17.8 21.4
ROE (%) 24.4 19.3 15.2 15.8 16.8
ROA (%) 4.0 3.1 2.4 2.6 2.9
Gross NPA (%) 2.9 3.5 7.0 7.1 7.0
CAR (%) 17.5 16.2 16.4 16.9 17.2
P/BV (x) 3.2 2.8 2.5 2.2 1.9
P/E (x) 15.9 15.5 17.3 14.7 12.3
Source: Company, Bloomberg, RCML Research
14,400
19,400
24,400
29,400
70 120 170 220 270 320
(INR) Stock Price Index Price

HOLD TP: INR 250.00 4.8%
Mahindra & Mahindra Fin Secs MMFS IN
Company Update INDIA NBFC
25 March 2015 Page 36 of 82
Midway through a downward cycle We believe MMFS is still mid-downcycle and likely to register its weakest growth and profitability in the last five years during FY15-FY17. Falling AUM growth, elevated credit cost, record-low NPA coverage and sustained earnings pressure make us cautious on the stock.
Sub-10% AUM growth ahead
Disbursement growth remains weak MMFS’ disbursements declined by 8% YoY to Rs 67bn in Q3FY15 with weakness across categories and especially in the CV/CE portfolio which registered the steepest decline of 25% YoY. The car (non-M&M, parent) and tractor (M&M) segments which constitute more than 40% of total AUM declined by 13% and 17% YoY respectively during the quarter.
As shown in the chart below, MMFS’ disbursements have dropped sharply over the last 5-6 quarters. Management attributes this to slower growth in industry-wide auto sales and higher discounts offered by auto manufacturers across various products. We expect this trend to continue, leading to lower disbursement growth for the pre-owned vehicle segment (~15% of total AUM) in FY16. Note that the company’s overall AUM growth is currently being maintained at 10-11% (3Q15) due to robust growth in the pre-owned vehicles segment (15% of AUM), where disbursements are up 10% YoY (on a higher base) and total loans are up 85% YoY.
Fig 1 - Disbursement growth very weak in last six quarters
Source: Company
Rural auto sales likely to lag urban sales in the next 1-2 years Our Auto analyst expects auto volume growth of 10%/11% in FY16/FY17 and tractor sales growth of 7%/9%. Rural auto sales are likely to be lower than urban sales. Unless auto volumes in rural India pick up meaningfully in FY16 (unlikely in our view), MMFS’ AUM growth would fall below 10% for the fiscal.
34% 32%39%
35%
26% 25%
16%
25%
32%
5%8%
(11%) (13%)
(0%)
(8%)
(25%)
(15%)
(5%)
5%
15%
25%
35%
45%
Q1F
Y12
Q2F
Y12
Q3F
Y12
Q4F
Y12
Q1F
Y13
Q2F
Y13
Q3F
Y13
Q4F
Y13
Q1F
Y14
Q2F
Y14
Q3F
Y14
Q4F
Y14
Q1F
Y15
Q2F
Y15
Q3F
Y15
Disbursement growth - YoY (%)
Disbursement growth very weak since last 1
Weak disbursement trend will translate into sluggish AUM growth in FY16/FY17
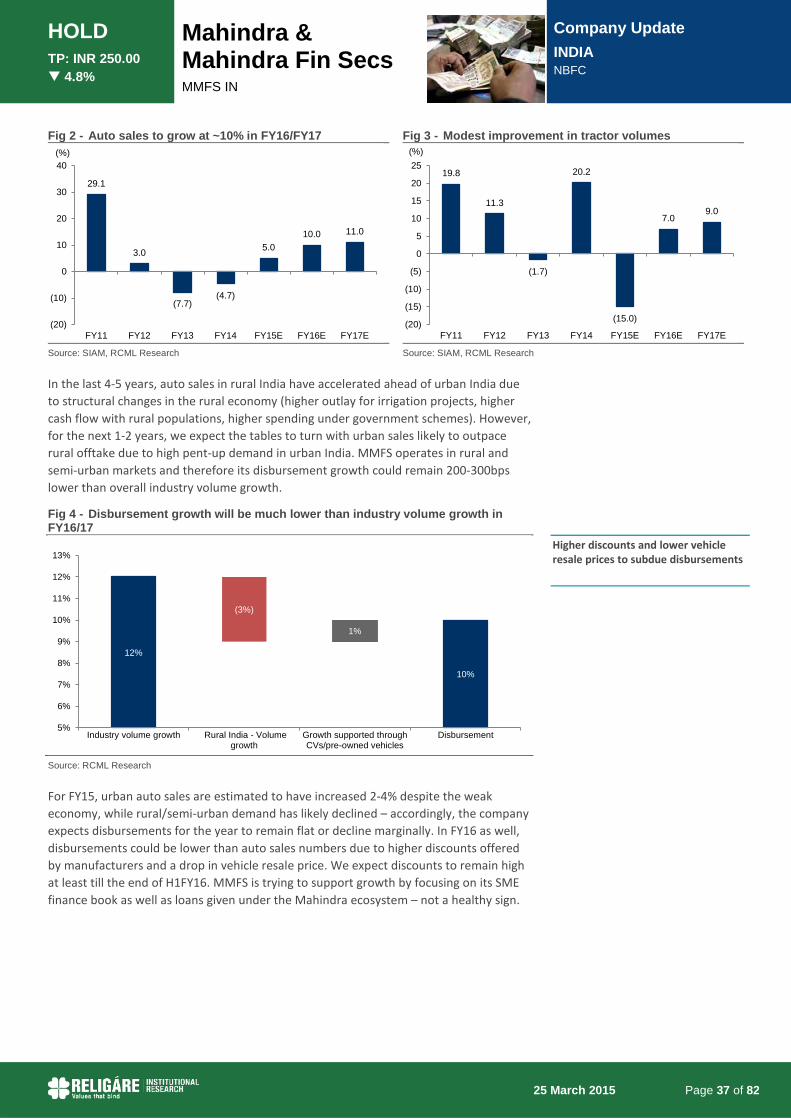
HOLD TP: INR 250.00 4.8%
Mahindra & Mahindra Fin Secs MMFS IN
Company Update INDIA NBFC
25 March 2015 Page 37 of 82
Fig 2 - Auto sales to grow at ~10% in FY16/FY17 Fig 3 - Modest improvement in tractor volumes
Source: SIAM, RCML Research Source: SIAM, RCML Research
In the last 4-5 years, auto sales in rural India have accelerated ahead of urban India due to structural changes in the rural economy (higher outlay for irrigation projects, higher cash flow with rural populations, higher spending under government schemes). However, for the next 1-2 years, we expect the tables to turn with urban sales likely to outpace rural offtake due to high pent-up demand in urban India. MMFS operates in rural and semi-urban markets and therefore its disbursement growth could remain 200-300bps lower than overall industry volume growth.
Fig 4 - Disbursement growth will be much lower than industry volume growth in FY16/17
Source: RCML Research
For FY15, urban auto sales are estimated to have increased 2-4% despite the weak economy, while rural/semi-urban demand has likely declined – accordingly, the company expects disbursements for the year to remain flat or decline marginally. In FY16 as well, disbursements could be lower than auto sales numbers due to higher discounts offered by manufacturers and a drop in vehicle resale price. We expect discounts to remain high at least till the end of H1FY16. MMFS is trying to support growth by focusing on its SME finance book as well as loans given under the Mahindra ecosystem – not a healthy sign.
29.1
3.0
(7.7)(4.7)
5.010.0 11.0
(20)
(10)
0
10
20
30
40
FY11 FY12 FY13 FY14 FY15E FY16E FY17E
(%)
19.8
11.3
(1.7)
20.2
(15.0)
7.09.0
(20)
(15)
(10)
(5)
0
5
10
15
20
25
FY11 FY12 FY13 FY14 FY15E FY16E FY17E
(%)
12%
10%
(3%)
1%
5%
6%
7%
8%
9%
10%
11%
12%
13%
Industry volume growth Rural India - Volumegrowth
Growth supported throughCVs/pre-owned vehicles
Disbursement
Higher discounts and lower vehicle resale prices to subdue disbursements

HOLD TP: INR 250.00 4.8%
Mahindra & Mahindra Fin Secs MMFS IN
Company Update INDIA NBFC
25 March 2015 Page 38 of 82
Fig 5 - Management guidance on loan growth
Segments Proportion in overall AUM
Projected disbursement growth (FY16) Comments
Tractors 18% 10%
M&M’s tractor portfolio has posted negative growth YTD and the same will be reflected in MMFS’s disbursement numbers in 9MFY15 and FY15.
Tractors in rural areas are now regarded as multipurpose vehicles (used for infrastructure and transport). Therefore, with improvement in GDP growth and IIP next year, tractors may register 8-10% growth in FY16.
If the monsoon is good next year, it may lead to a minor increase in growth (2-3%).
Auto / Utility Vehicle (M&M)
29% 8-10%
Parent company M&M commands 50%+ market share.
In the last 1-1.5 years, M&M faced very high competition in the urban market and its urban volumes are likely to decline in FY15.
However, vehicles in the pick-up segment are doing well in rural areas and volumes are expected to remain flat/show marginal growth (2-3%) in FY15.
UVs in rural areas are need/economy-based and are therefore expected to register 8-10% growth in FY16.
Cars & Others (non-M&M)
23% 8-10%
Industry players expect 5-7% volume growth in FY16. Maruti Suzuki is the only exception with guidance of ~15% growth. However, Maruti is offering discounts and therefore disbursements will be much lower than 15%.
Sales mix for many players is likely to change in favour of urban areas in the next 1-2 years.
Commercial Vehicles & Construction Equipment
14% 10-12%
MMFS had completely exited heavy commercial vehicles due to the slowdown in Q3/Q4FY14. LCV/CE volumes also slowed down considerably in Q1FY15.
M&HCV volumes declined significantly in the last two years and therefore the base is very low.
In the last 2-3 months, M&HCV volumes have increased considerably but demand is highly skewed in favour of fleet operators.
Fleet operators are buying vehicles as demand from sectors like cement and auto manufacturers are showing good traction. Many fleet operators are also buying due to high discounts and prices are likely to go up next year.
CV volumes may improve in FY16 and the industry is likely to register ~15% growth. MMFS may be able to grow its book by 10-12%.
Used Vehicles & Other Finance
16% 15-20%+
The company highlighted that its used vehicle portfolio is ~9% of AUM and the remaining portion has dealer financing, SME and TW (Two wheelers) loans.
Used vehicle financing is likely to registered better growth as demand for used vehicles is generally strong when new vehicle sales are lower.
However, it is unlikely to support overall AUM growth meaningfully as typically loans are given for 2 years and the average duration for repayment is 12-13 months.
Source: RCML Research, Company

HOLD TP: INR 250.00 4.8%
Mahindra & Mahindra Fin Secs MMFS IN
Company Update INDIA NBFC
25 March 2015 Page 39 of 82
NPA coverage at record low; credit cost to remain elevated
Steady rise in gross NPAs in the last two years MMFS’ gross NPAs have consistently gone up in the last two years due to poor monsoons, adverse climatic conditions and a slowing rural economy. Currently, gross NPA is at a multi-year high of 7%.
We have seen no meaningful improvement in ground realities over the last 2-3 quarters despite government efforts. Collections improved in the last quarter, but this is in no way indicative of a trend reversal. Further, as seen in 9MFY15, pressure on resale prices of vehicles (due to manufacturer discounts on new vehicles) is likely to push up losses from defaults for the company.
Higher NPLs in southern markets MMFS stated that contrary to earlier trends, southern states were showing a marked deterioration in asset quality. The southern market constitutes 35% of MMFS’ AUM and their contribution to NPLs is much higher.
Fig 6 - Gross NPA up steadily since FY13
Source: Company
Poor coverage and transition to 90-DPD norms to keep credit cost high MMFS has not provided adequately for credit cost since the beginning of this downward cycle (FY12), thereby failing to buffer against further deterioration in asset quality. A key concern is the steady decline in NPA coverage ratio from 86% in Q4FY11 to ~52% in Q2FY15, with only a marginal increase of ~200bps in Q3FY15 to 54%. Credit cost is expected to remain elevated in FY16-FY17 as we do not expect the company to drop coverage below 50%.
10%
3%
7%
2%
3%
4%
5%
6%
7%
8%
9%
10%
11%
Q2F
Y07
Q3F
Y07
Q4F
Y07
Q1F
Y08
Q2F
Y08
Q3F
Y08
Q4F
Y08
Q1F
Y09
Q2F
Y09
Q3F
Y09
Q4F
Y09
Q1F
Y10
Q2F
Y10
Q3F
Y10
Q4F
Y10
Q1F
Y11
Q2F
Y11
Q3F
Y11
Q4F
Y11
Q1F
Y12
Q2F
Y12
Q3F
Y12
Q4F
Y12
Q1F
Y13
Q2F
Y13
Q3F
Y13
Q4F
Y13
Q1F
Y14
Q2F
Y14
Q3F
Y14
Q4F
Y14
Q1F
Y15
Q2F
Y15
Q3F
Y15
Gross NPA (%)
Middle of the NPL cycle; credit cost is expected to remain elevated
Coverage ratio at multi-year low of ~50% which will keep credit cost very high

HOLD TP: INR 250.00 4.8%
Mahindra & Mahindra Fin Secs MMFS IN
Company Update INDIA NBFC
25 March 2015 Page 40 of 82
Fig 7 - NPA coverage ratio near 50%
Source: Company
MMFS is currently following 150-DPD norms for NPA. In FY12, when the Usha Thorat Committee recommendations were out, management was guiding for a 50% increase in NPAs, i.e. from 4% to 6%. However, the company has now highlighted that due to poor asset quality trends, the overdue accounts in each day-bracket between 90 and 150 days have gone up in the last 1-1.5 years. We estimate that NPLs are likely to double due to new norms over FY15-FY18.
MMFS has not yet finalised the strategy for transition to 90-DPD NPA norms. If the company decides to maintain its coverage ratio at 50%, credit cost will increase meaningfully. On the other hand, if credit costs are maintained at current levels (2.5-2.7% in FY15-18), the coverage ratio will drop to 30-35%.
Downside risk from credit cost persists We expect MMFS’ credit cost to touch 2.7% in FY15 (from 1.8% in FY14 and 1.3% in FY13). We are assuming credit cost moderation in FY16 and FY17, though a sustained slowdown in rural demand could keep costs much higher than our estimates. We note that credit cost in the last cycle was ~3.7% on average for three years (FY08-FY10).
Fig 8 - MMFS – downside risk from credit cost
Source: Company, RCML Research
79.7%
75.3% 74.4%78.0%
70.2%
63.5% 62.3%65.9%
56.2%54.7% 55.5%
59.0%
54.0%52.5%
54.3%
45%
50%
55%
60%
65%
70%
75%
80%
85%
Q1F
Y12
Q2F
Y12
Q3F
Y12
Q4F
Y12
Q1F
Y13
Q2F
Y13
Q3F
Y13
Q4F
Y13
Q1F
Y14
Q2F
Y14
Q3F
Y14
Q4F
Y14
Q1F
Y15
Q2F
Y15
Q3F
Y15
NPA coverage (%)
0.7% 0.7%
2.3%
3.9%4.2%
2.9%
1.5%
1.0%1.3%
1.8%
2.7%2.3%
2.0%
0.0%
0.5%
1.0%
1.5%
2.0%
2.5%
3.0%
3.5%
4.0%
4.5%
FY05 FY06 FY07 FY08 FY09 FY10 FY11 FY12 FY13 FY14 FY15E FY16E FY17E
(%) Credit cost as % of AUM
Transition to 90-DPD norms will double NPA and credit cost will increase due to poor coverage ratio
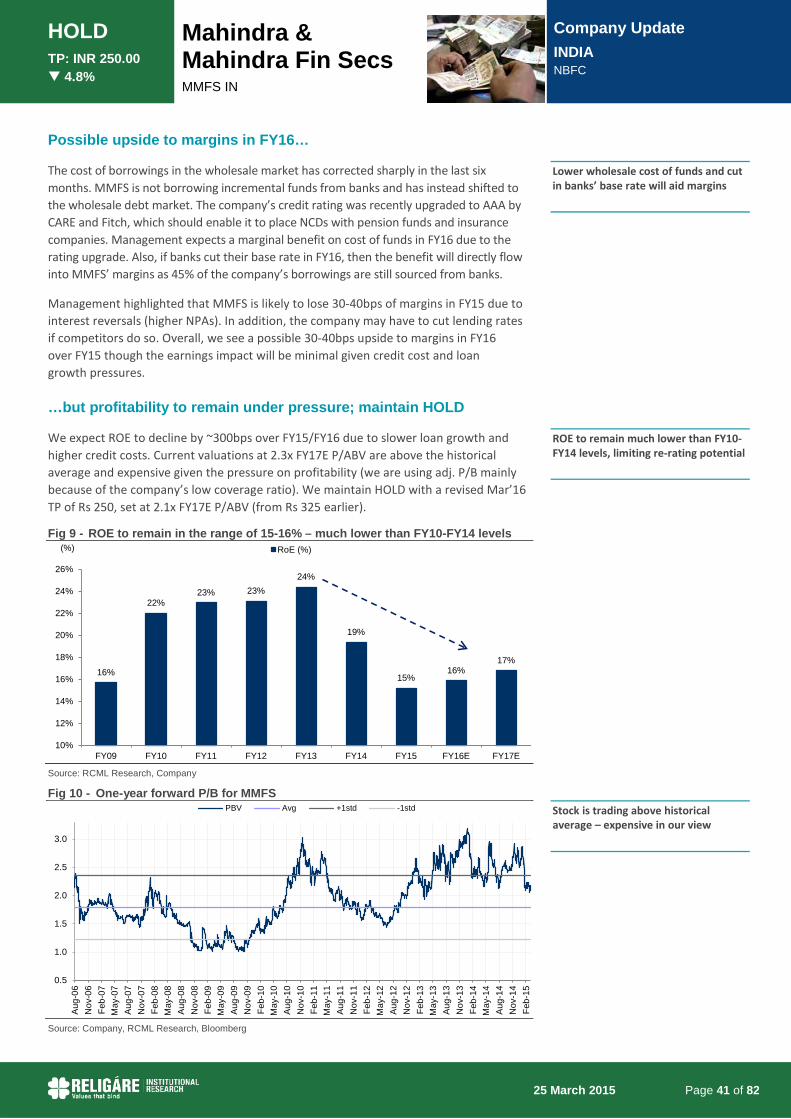
HOLD TP: INR 250.00 4.8%
Mahindra & Mahindra Fin Secs MMFS IN
Company Update INDIA NBFC
25 March 2015 Page 41 of 82
Possible upside to margins in FY16…
The cost of borrowings in the wholesale market has corrected sharply in the last six months. MMFS is not borrowing incremental funds from banks and has instead shifted to the wholesale debt market. The company’s credit rating was recently upgraded to AAA by CARE and Fitch, which should enable it to place NCDs with pension funds and insurance companies. Management expects a marginal benefit on cost of funds in FY16 due to the rating upgrade. Also, if banks cut their base rate in FY16, then the benefit will directly flow into MMFS’ margins as 45% of the company’s borrowings are still sourced from banks.
Management highlighted that MMFS is likely to lose 30-40bps of margins in FY15 due to interest reversals (higher NPAs). In addition, the company may have to cut lending rates if competitors do so. Overall, we see a possible 30-40bps upside to margins in FY16 over FY15 though the earnings impact will be minimal given credit cost and loan growth pressures.
…but profitability to remain under pressure; maintain HOLD
We expect ROE to decline by ~300bps over FY15/FY16 due to slower loan growth and higher credit costs. Current valuations at 2.3x FY17E P/ABV are above the historical average and expensive given the pressure on profitability (we are using adj. P/B mainly because of the company’s low coverage ratio). We maintain HOLD with a revised Mar’16 TP of Rs 250, set at 2.1x FY17E P/ABV (from Rs 325 earlier).
Fig 9 - ROE to remain in the range of 15-16% – much lower than FY10-FY14 levels
Source: RCML Research, Company Fig 10 - One-year forward P/B for MMFS
Source: Company, RCML Research, Bloomberg
16%
22%23% 23%
24%
19%
15%16%
17%
10%
12%
14%
16%
18%
20%
22%
24%
26%
FY09 FY10 FY11 FY12 FY13 FY14 FY15 FY16E FY17E
(%) RoE (%)
0.5
1.0
1.5
2.0
2.5
3.0
Aug
-06
Nov
-06
Feb-
07M
ay-0
7A
ug-0
7N
ov-0
7Fe
b-08
May
-08
Aug
-08
Nov
-08
Feb-
09M
ay-0
9A
ug-0
9N
ov-0
9Fe
b-10
May
-10
Aug
-10
Nov
-10
Feb-
11M
ay-1
1A
ug-1
1N
ov-1
1Fe
b-12
May
-12
Aug
-12
Nov
-12
Feb-
13M
ay-1
3A
ug-1
3N
ov-1
3Fe
b-14
May
-14
Aug
-14
Nov
-14
Feb-
15
PBV Avg +1std -1std
Lower wholesale cost of funds and cut in banks’ base rate will aid margins
ROE to remain much lower than FY10-FY14 levels, limiting re-rating potential
Stock is trading above historical average – expensive in our view
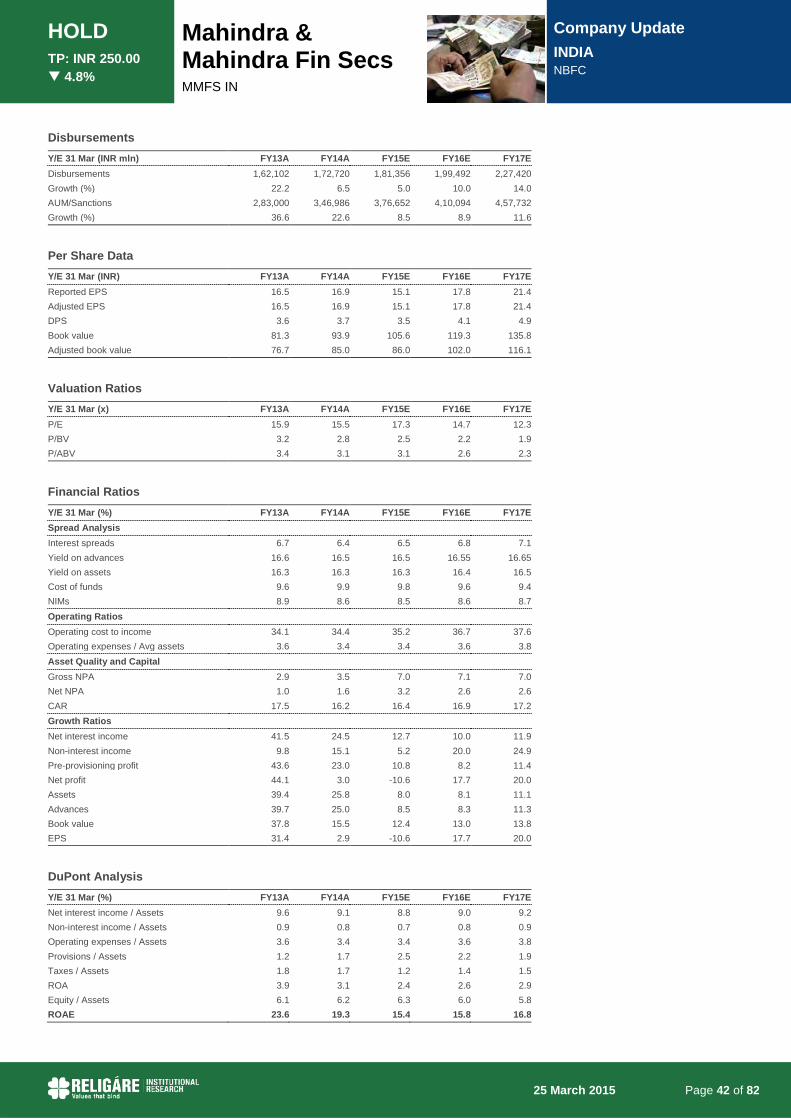
HOLD TP: INR 250.00 4.8%
Mahindra & Mahindra Fin Secs MMFS IN
Company Update INDIA NBFC
25 March 2015 Page 42 of 82
Disbursements Y/E 31 Mar (INR mln) FY13A FY14A FY15E FY16E FY17E Disbursements 1,62,102 1,72,720 1,81,356 1,99,492 2,27,420 Growth (%) 22.2 6.5 5.0 10.0 14.0 AUM/Sanctions 2,83,000 3,46,986 3,76,652 4,10,094 4,57,732 Growth (%) 36.6 22.6 8.5 8.9 11.6
Per Share Data Y/E 31 Mar (INR) FY13A FY14A FY15E FY16E FY17E Reported EPS 16.5 16.9 15.1 17.8 21.4 Adjusted EPS 16.5 16.9 15.1 17.8 21.4 DPS 3.6 3.7 3.5 4.1 4.9 Book value 81.3 93.9 105.6 119.3 135.8 Adjusted book value 76.7 85.0 86.0 102.0 116.1
Valuation Ratios Y/E 31 Mar (x) FY13A FY14A FY15E FY16E FY17E P/E 15.9 15.5 17.3 14.7 12.3 P/BV 3.2 2.8 2.5 2.2 1.9 P/ABV 3.4 3.1 3.1 2.6 2.3
Financial Ratios Y/E 31 Mar (%) FY13A FY14A FY15E FY16E FY17E Spread Analysis Interest spreads 6.7 6.4 6.5 6.8 7.1 Yield on advances 16.6 16.5 16.5 16.55 16.65 Yield on assets 16.3 16.3 16.3 16.4 16.5 Cost of funds 9.6 9.9 9.8 9.6 9.4 NIMs 8.9 8.6 8.5 8.6 8.7 Operating Ratios Operating cost to income 34.1 34.4 35.2 36.7 37.6 Operating expenses / Avg assets 3.6 3.4 3.4 3.6 3.8 Asset Quality and Capital Gross NPA 2.9 3.5 7.0 7.1 7.0 Net NPA 1.0 1.6 3.2 2.6 2.6 CAR 17.5 16.2 16.4 16.9 17.2 Growth Ratios Net interest income 41.5 24.5 12.7 10.0 11.9 Non-interest income 9.8 15.1 5.2 20.0 24.9 Pre-provisioning profit 43.6 23.0 10.8 8.2 11.4 Net profit 44.1 3.0 -10.6 17.7 20.0 Assets 39.4 25.8 8.0 8.1 11.1 Advances 39.7 25.0 8.5 8.3 11.3 Book value 37.8 15.5 12.4 13.0 13.8 EPS 31.4 2.9 -10.6 17.7 20.0
DuPont Analysis Y/E 31 Mar (%) FY13A FY14A FY15E FY16E FY17E Net interest income / Assets 9.6 9.1 8.8 9.0 9.2 Non-interest income / Assets 0.9 0.8 0.7 0.8 0.9 Operating expenses / Assets 3.6 3.4 3.4 3.6 3.8 Provisions / Assets 1.2 1.7 2.5 2.2 1.9 Taxes / Assets 1.8 1.7 1.2 1.4 1.5 ROA 3.9 3.1 2.4 2.6 2.9 Equity / Assets 6.1 6.2 6.3 6.0 5.8 ROAE 23.6 19.3 15.4 15.8 16.8

HOLD TP: INR 250.00 4.8%
Mahindra & Mahindra Fin Secs MMFS IN
Company Update INDIA NBFC
25 March 2015 Page 43 of 82
Income Statement Y/E 31 Mar (INR mln) FY13A FY14A FY15E FY16E FY17E Interest income 38,944 50,491 58,027 63,314 70,193 Interest expense (16,706) (22,810) (26,821) (28,974) (31,760) Net interest income 22,238 27,681 31,206 34,340 38,433 Non-interest income 2,186 2,515 2,645 3,174 3,966 Net revenue 24,424 30,196 33,851 37,514 42,398 Operating expenses (8,321) (10,391) (11,903) (13,774) (15,955) Pre-provisioning profits 16,103 19,805 21,948 23,740 26,443 Provisions & contingencies (2,882) (5,190) (8,870) (8,343) (7,969) PBT 13,221 14,615 13,078 15,397 18,474 Extraordinaries Income tax (4,561) (5,071) (4,547) (5,355) (6,425) Reported PAT 17,783 19,686 17,625 20,752 24,900 Adj. net profit 17,783 19,686 17,625 20,752 24,900
Balance Sheet Y/E 31 Mar (INR mln) FY13A FY14A FY15E FY16E FY17E Advances 2,56,800 3,21,105 3,48,331 3,77,140 4,19,762 Investments 4,575 7,219 6,571 6,836 7,168 Current assets 8,209 10,978 11,679 12,434 13,421 Net block (inc CWIP) 1,123 1,273 1,400 1,540 1,694 Goodwill - - - - - Other assets Total Assets 2,70,708 3,40,575 3,67,981 3,97,951 4,42,045 Share capital 1,126 1,127 1,127 1,127 1,127 Options/warrants/others - - - - - Reserves & surplus 44,670 51,810 58,379 66,112 75,389 Net worth 45,796 52,937 59,506 67,239 76,516 Total borrowings 2,01,525 2,59,953 2,87,618 3,18,892 3,59,590 Current liabilities & Provisions 23,151 27,320 20,454 11,378 5,452 Deferred tax liabilities - - - - - Other liabilities 237 365 402 442 486 Total Equity & Liabilities 2,70,708 3,40,575 3,67,981 3,97,951 4,42,045

Financial Highlights
Company Initiation INDIA NBFC
25 March 2015
REPORT AUTHORS
Parag Jariwala +91 22 6766 3442 [email protected]
PRICE CLOSE (24 Mar 15) INR 570.95 MARKET CAP INR 82.0 bln USD 1.3 bln
SHARES O/S 143.3 mln
FREE FLOAT 42.3%
3M AVG DAILY VOLUME/VALUE 0.2 mln / USD 1.9 mln
52 WK HIGH INR 618.00
52 WK LOW INR 248.50
BUY TP: INR 775.00 35.7%
Cholamandalam Investment and Finance CIFC IN
Structural growth ahead – initiate with BUY
We initiate coverage on CIFC with BUY and a Mar’16 TP of Rs 775 (~35% upside). We expect moderating credit costs, higher NIMs and rising operating efficiency to support ~100bps expansion in ROA to 3% over five years. CIFC’s loan growth would also remain ahead of peers led by expansion across geographies and products. The stock trades at 2.1x FY17E P/B and we expect a re-rating given the structural improvement in profitability ahead.
Five-year journey towards 3% RoA: We expect CIFC’s ROA to improve from 1.8% in FY14 to ~2.4% by FY17 and ~3% by FY19 led by better margins, stronger operating ratios and lower credit costs. Credit costs (~1.5% of avg. assets in FY15) are at a cyclical high and should moderate to a cyclical average of ~1.3% by FY17/18. Also, a shift in funding mix towards fixed-rate products over the next 2-3 years and higher capital adequacy would lower the cost of funds and reduce margin volatility.
CV/auto cycle recovery augurs well for growth: We expect CIFC to continue posting stronger loan growth than peers (at ~20% CAGR over FY15-FY18) given the ongoing revival in the CV/auto cycle, its pan-India presence (~600 branches in FY15E from 170 in FY10), and market share gains in new products (tractors, used vehicles). Recent capital infusion via a US$ 83mn CCPS issue should ensure adequate capital for growth.
Strong promoter profile: CIFC is a part of the Murugappa group, a leading business conglomerate founded in 1900. The promoter has stood by the company during difficult times, with a buyback of DBS’ 37.5% stake in CIFC for Rs 3.8bn in FY10 when profitability hit a record low and staunch support during top management churn.
Initiate with BUY: We value CIFC based on the two-stage Gordon growth model and arrive at a Mar’16 TP of Rs 775. We think current valuations (2.1x FY17E PBV) are cheap and earnings growth (~30% CAGR over FY15-FY17E) should support a re-rating.
Y/E 31 Mar FY13A FY14A FY15E FY16E FY17E
Net interest income (INR mln) 11,074 14,605 16,920 20,544 25,101
Net revenues (INR mln) 11,447 14,918 17,275 20,960 25,590
Pre-provision profits (INR mln) 5,751 8,335 9,894 12,764 16,191
Adj. PAT (INR mln) 3,065 3,640 4,119 5,494 7,353
Adj. EPS (INR) 21.4 25.4 28.7 35.3 47.3
ROE (%) 18.1 17.1 16.7 17.5 18.6
ROA (%) 1.9 1.8 1.8 2.1 2.4
Gross NPA (%) 1.2 1.9 2.7 2.5 2.3
CAR (%) 19.0 17.2 17.3 19.2 19.4
P/BV (x) 4.2 3.6 3.1 2.5 2.1
P/E (x) 26.7 22.5 19.9 16.2 12.1
Source: Company, Bloomberg, RCML Research
14,400
19,400
24,400
29,400
80
180
280
380
480
580
(INR) Stock Price Index Price

BUY TP: INR 775.00 35.7%
Cholamandalam Investment and Finance CIFC IN
Company Initiation INDIA NBFC
25 March 2015 Page 45 of 82
Investment rationale Five-year journey towards 3% ROA
We expect CIFC’s ROA to expand gradually from 1.8% in FY14 to ~2.4% by FY17 and ~3% by FY19 led by steady improvement in margins, credit costs and operating ratios. Credit costs (~1.5% of avg. assets in FY15) are at a cyclical high and should moderate to a cyclical average of ~1.3% over FY15-FY18 (albeit still much higher than the 0.2-0.8% in FY12/FY13 – strong years for the company). CIFC’s cost of funds is also expected to moderate with a more granular asset mix and higher capital adequacy. We expect margins to improve gradually from FY16 onwards. Increased operating efficiency should lead to ~100bps improvement in ROA over the next five years.
Fig 1 - Structural improvement in ROA underway
Source: Company, RCML Research
Higher tier 1, cyclical tailwinds to aid margins
Tier 1 to improve by ~180bps in FY16 Over the last one-and-a-half years, CIFC’s tier 1 capital has remained lower at 10-10.5% than comparable peers (12%+). Lower capital adequacy has hurt the company’s credit rating, in turn forcing it to borrow at marginally higher rates. However, the recent fund raising by CIFC is likely to increase its tier 1 capital by ~180bps. Global PE firm Apax Partners has invested ~US$ 83mn for an 8% equity stake in CIFC by subscribing to 50mn compulsorily convertible preference shares (CCPS) at a face value of Rs 100/sh. The CCPS will convert into equity shares at Rs 407 each, translating into an issue of 12.2mn shares by Jul’15, thereby boosting the company’s tier 1 capital adequacy ratio.
2.6%0.4%
0.4%
1.2% 4.6%
1.6%3.0%
0.0%
0.5%
1.0%
1.5%
2.0%
2.5%
3.0%
3.5%
4.0%
4.5%
5.0%
FY14 - RoA(pre-tax)
Lower creditcost
Reduced CoF Loweroperating cost
RoA (pre tax) Tax RoA (post tax)
Gradual improvement in margins, credit costs and operating ratios to drive ROA to 3% by FY19
Recent stake sale to boost tier 1 capital – precursor for a better credit rating

BUY TP: INR 775.00 35.7%
Cholamandalam Investment and Finance CIFC IN
Company Initiation INDIA NBFC
25 March 2015 Page 46 of 82
Fig 2 - Capital raising to boost tier 1 in FY16
Source: Company, RCML Research
Cyclical tailwinds to support margins in medium term CIFC’s vehicle loan portfolio (~71% of total loans) carries a fixed rate of interest. In comparison, ~58% of its borrowings are floating in nature. In addition, the company issues short-duration commercial papers (13% of the total) typically with 6-month average maturity and therefore these do reflect floating interest rates from a longer-term (2-3 year) perspective. While this ALM structure gives CIFC limited ability to pass on any increase in interest rate, the company does benefit when rates are falling. In the current softening rate environment, CIFC’s ALM structure would result in better margins as a reduction in wholesale cost of funds and banks’ base rate will bring down the company’s cost of borrowings while keeping yield on advances stable.
Fig 3 - Funding mix (Dec’14) Fig 4 - Asset mix (Dec’14)
Source: Company Source: Company
Better funding mix to reduce margin volatility in long term CIFC has an AA credit rating from CARE Ltd. With better capital adequacy and a diversified loan book, the company could see a rating upgrade in the next 1-2 years. This would enable CIFC to diversify its funding mix through wholesale market borrowings (insurance/pension companies and mutual funds). We expect to see a shift in funding mix towards fixed-rate products over the next 2-3 years, which would lower the company’s cost of funds and temper margin volatility. Margins are likely to improve from FY15 onwards and we are modeling for 20-30bps expansion over FY15-FY17.
10.8%11.0% 11.1%
10.5%10.3%
12.1%
9%
10%
10%
11%
11%
12%
12%
13%
FY11 FY12 FY13 FY14 FY15E FY16E
Bank Term Loans 56%
Commercial papers13%
Debentures18%
Tier II capital13%
Vehicle Finance
71%
Home Equity27%
Others2%
ALM structure will result in better margins when rates are falling

BUY TP: INR 775.00 35.7%
Cholamandalam Investment and Finance CIFC IN
Company Initiation INDIA NBFC
25 March 2015 Page 47 of 82
Fig 5 - We expect steady improvement in margins over FY15-17
Source: Company, RCML Research
Credit costs to moderate gradually
Expected to normalise at 1.2-1.3% levels CIFC along with its DBS JV started a personal loans business in FY06, but discontinued it after incurring heavy losses in Sep’08. These losses were the biggest drag on the company’s profitability over FY08-FY11, and accounted for 80% of the credit costs during this period. With the company now focusing on its traditional secured lending portfolio, credit costs are likely to be lower than the earlier cycle.
At present, CIFC’s NPAs and credit costs are high due to the CV cycle downturn and economic growth slowdown. Gross NPAs have increased from 0.8% in FY12 to 2.8% in 9MFY15, and credit costs from 0.2-0.3% in FY12 (lowest ever) to 1.7% currently. We expect this trend to continue for at least 2-3 quarters.
Thereafter, CIFC’s credit costs may fall sharply if there is a strong pick-up in growth led by improvement in the CV cycle. Adjusted for the cyclical skew, we expect credit costs to average at 1.2-1.3% over FY15-FY17 as the company lends to riskier segments in semi-urban and rural India.
Fig 6 - Trend in gross NPAs and credit costs: Expect modest recovery FY16 onwards
Source: Company, RCML Research
6.6%
7.7%
6.9%7.0% 7.1%
6.9%
7.1%
7.4%
6.0%
6.2%
6.4%
6.6%
6.8%
7.0%
7.2%
7.4%
7.6%
7.8%
8.0%
FY12 FY12 FY12 FY13 FY14 FY15E FY16E FY17E
NIM (%)
3.0%
5.5%
2.6%
0.8% 1.0%
1.9%
2.6% 2.6% 2.4% 2.2%
3.6%
3.0%
2.2%
0.2%
0.8%
1.3%1.6% 1.4%
1.0% 0.8%
0%
1%
2%
3%
4%
5%
6%
FY09
FY10
FY11
FY12
FY13
FY14
H1F
Y15
FY15
E
FY16
E
FY17
E
Gross NPA Credit cost
High NPA/Credit cost due to personal loan portfolio Increase in NPAs
mainly due to cyclical pressure
NPA and credit cost should improve as we expect growth and CV cycle to recover
NPAs and credit costs at cyclical peaks and should moderate going forward
Upside risks to ROA from further reduction in credit costs

BUY TP: INR 775.00 35.7%
Cholamandalam Investment and Finance CIFC IN
Company Initiation INDIA NBFC
25 March 2015 Page 48 of 82
Improved productivity and cross-selling to reduce operating costs
Rapid branch expansion over last 3-4 years CIFC has invested heavily towards building its branch network in the last 3-4 years, growing at a 35% CAGR over FY10-FY14 to ~600 branches (90% in semi-urban and rural areas) from 171 in FY10. With the company now penetrating most markets across India, the pace of expansion would likely be slower, as the focus shifts towards scaling up existing branches and introducing more products to boost productivity.
Fig 7 - CIFC’s pan-India presence
Source: Company
We expect CIFC to open 50 branches each year over FY14-FY17, which translates to less than 10% growth.
Fig 8 - Rapid branch expansion between FY10-FY14
Source: Company, RCML Research
171236
375
518574 579 590
640690
0
100
200
300
400
500
600
700
800
FY10
FY11
FY12
FY13
FY14
9MFY
15
FY15
E
FY16
E
FY17
E
(No. of braches)
Branches grew at a CAGR of 35% between FY10-14
Modest growth of 10%expected between FY14-17E
CIFC has expanded rapidly across India in the last 3-4 years
Expect modest growth in branches over FY14-FY17 (10% vs. 35% in FY10-FY14)

BUY TP: INR 775.00 35.7%
Cholamandalam Investment and Finance CIFC IN
Company Initiation INDIA NBFC
25 March 2015 Page 49 of 82
Technology investments to reap benefits in coming years CIFC has invested heavily in technology for loan generation, disbursements and collections, which has helped bring down the loan turnaround time from 6-7 days over the last 2-3 years to 1-2 days at present. Standardised procedures would improve operating efficiency, enabling the company to reduce loan processing/collection costs going forward.
New businesses to bring in operating efficiencies Home (equity) business: We note that the average tenure for a home loan is
~10 years (vs. 3.5-4 years for auto loans) and operating costs are lower than vehicle financing because of higher ticket sizes (~Rs 0.5mn as against Rs 500k for vehicle loans). Thus, the cost of sourcing/collections for home loans is lower and since these loans are sticky, they can grow in line with the promoters’ (borrowers’) existing business without incremental sourcing costs.
The company currently operates this business through fewer than 100 branches, but plans to rope in the remaining branches in future. The cost of generating home loans through the existing branch setup will be much lower going forward. An increasing proportion of higher-ticket and longer-duration home equity loans (up from 23% of CIFC’s total AUM in FY13 to 28% in Q3FY15) should bring in operating efficiencies for the company in coming years.
Home loan (mortgage) business: Given the success of its LAP product (loans against property), CIFC has started offering pure home loan products for non-salaried and non-professional customers, garnering a good response in many locations. The company’s current mortgage portfolio stands at Rs 800mn, with a yield of 16% and potentially strong return ratios. CIFC plans to ramp up this business without compromising on profitability and is likely to offer these loans through its existing branch setup given a largely similar customer profile concentrated in semi-urban and rural India.
Gold loans/SME and small agriculture loans: CIFC plans to cross-sell small loans to customers of group companies. The cost of sourcing these loans will be lower.
Operating cost as proportion of average AUM to decline As new businesses bring in operating efficiency, the company’s operating cost as a percentage of total AUM is likely to decline by ~40bps to ~2.6% over FY14-FY17.
Fig 9 - Operating cost as a percentage of total AUM to decline gradually
Source: Company, RCML Research
3.00%
2.85%
2.70%
2.64%
2.4%
2.5%
2.6%
2.7%
2.8%
2.9%
3.0%
3.1%
FY14 FY15E FY16E FY17E
Operating cost as % of AUM
Economies of scale from new business initiatives
Rising efficiency to shave 100bps off operating cost by FY19

BUY TP: INR 775.00 35.7%
Cholamandalam Investment and Finance CIFC IN
Company Initiation INDIA NBFC
25 March 2015 Page 50 of 82
CV/auto cycle recovery augurs well for growth
India’s economic growth to improve steadily… We believe the Indian economy is at an inflection point. Our economist Prerna Singhvi expects India’s GDP growth to pick up from 6.9% in FY14 to 7.4% and 8.3% in FY15 and FY16 respectively.
Fig 10 - Expect steady recovery in GDP growth
Source: RBI, RCML Research, Bloomberg
…leading to a pick-up in CV volumes from FY16 onwards CV sales and utilisation levels have a high correlation with GDP growth and economic cycles, while M&HCV sales are closely linked with IIP growth. CVs account for ~50% of CIFC’s total auto loans (including small CVs and three-wheelers). With a recovery in the CV cycle, we expect the company’s loan growth to pick up meaningfully from H2FY16/FY17 onwards.
Fig 11 - Long-term trend for CV sales and GDP growth
Source: RBI, Bloomberg, RCML Research
9.8%
3.9%
8.5%
10.3%
6.6%
5.1%
6.9%7.4%
8.3%
2%
3%
4%
5%
6%
7%
8%
9%
10%
11%
FY08 FY09 FY10 FY11 FY12 FY13 FY14 FY15E FY16E
Real GDP growth (%)
0%
2%
4%
6%
8%
10%
12%
(40%)
(20%)
0%
20%
40%
60%
FY91
FY92
FY93
FY94
FY95
FY96
FY97
FY98
FY99
FY00
FY01
FY02
FY03
FY04
FY05
FY06
FY07
FY08
FY09
FY10
FY11
FY12
FY13
FY14
FY15
E
FY16
E
CV growth (domestic) - YoY % Real GDP growth YoY % (R) Correlation between GDP and CV volume growth remains high

BUY TP: INR 775.00 35.7%
Cholamandalam Investment and Finance CIFC IN
Company Initiation INDIA NBFC
25 March 2015 Page 51 of 82
Fig 12 - Strong correlation between IIP growth and M&HCV growth
Source: RBI, Bloomberg, RCML Research
Our Auto analyst, Mihir Jhaveri, expects domestic CV volumes to recover from FY16 onwards and forecasts LCV/M&HCV volume growth of 14%/19% in FY16 and 16%/20% in FY17. Industry auto volumes are expected to grow 10%/11% in FY16/FY17 while tractor sales revive from a 15% decline in FY15 to 7%/9% growth in FY16/FY17. Since CIFC does not offer tractor loans from all its branches, overall growth in its tractor portfolio is likely to be higher than industry due to the base effect.
Fig 13 - Auto industry volumes to grow by ~10% in FY16/17 Fig 14 - Tractor volumes to revive modestly in FY16/17
Source: SIAM, RCML Research Source: SIAM, RCML Research
Diversified portfolio across products and geographies
CIFC has expanded its footprint aggressively in the last 3-4 years, raising the number of branches from 171 in FY09 to ~580 as of Dec’14. The company now has a pan-India presence with a well-diversified loan book across regions. Branches take 2-2.5 years to achieve initially targeted business. Therefore, we expect the growth rate to remain high despite the company opening fewer branches in FY16/FY17E.
(100)
(50)
0
50
100
150
200
250
300
(10)
(5)
0
5
10
15
20
25
May
-01
Dec
-01
Jul-0
2
Feb-
03
Sep
-03
Apr
-04
Nov
-04
Jun-
05
Jan-
06
Aug
-06
Mar
-07
Oct
-07
May
-08
Dec
-08
Jul-0
9
Feb-
10
Sep
-10
Apr
-11
Nov
-11
Jun-
12
Jan-
13
Aug
-13
Mar
-14
Oct
-14
(%)(%) IIP growth - YoY % M&H CV - YoY growth % (R)
29.1
3.0
(7.7)(4.7)
5.010.0 11.0
(20)
(10)
0
10
20
30
40
FY11 FY12 FY13 FY14 FY15E FY16E FY17E
(%)
19.8
11.3
(1.7)
20.2
(15.0)
7.09.0
(20)
(15)
(10)
(5)
0
5
10
15
20
25
FY11 FY12 FY13 FY14 FY15E FY16E FY17E
(%)
Auto and tractor sales to revive from FY16, which will boost loan disbursals
Diversified loan book augurs well for balanced growth

BUY TP: INR 775.00 35.7%
Cholamandalam Investment and Finance CIFC IN
Company Initiation INDIA NBFC
25 March 2015 Page 52 of 82
Fig 15 - Balanced portfolio across product lines (3Q15) Fig 16 - Well-diversified book across regions (3Q15)
Source: Company Source: Company
CIFC introduced tractor financing in FY12, with the portfolio now constituting ~10% of its total disbursements. We expect growth in this segment to remain high going forward. The company is also likely to see healthy growth in used vehicles (~15% of its total vehicle loans) – we expect the used vehicles market to outpace growth in the new vehicles segment as it is highly underpenetrated and currently dominated by unorganised players, especially in rural and semi-urban areas.
The company currently operates home loan equity business through fewer than 100 branches, but plans to rope in the remaining branches in future which is likely to support growth.
CIFC has started offering pure home loan products for non-salaried and non-professional customers, garnering a good response in many locations. This segment has a huge potential and support loan growth in coming years.
CIFC is planning to enter into SME loans and gold loans mainly for group company customers which will drive further improvement in loan growth.
Strong promoter backing
Murugappa group: Background and history CIFC is a part of the Murugappa Group which was founded in 1900 and is one of India’s leading business conglomerates, with 28 businesses including 11 listed companies and a workforce of 32,000 employees. The group, with a wide geographical presence spanning 13 states in India and five continents, has forged strong alliances with leading international companies such as Groupe Chimique Tunisien, Foskor, Mitsui Sumitomo, Morgan Crucible and Sociedad Química y Minera de Chile (SQM).
Tractor10%
HCV11%
LCV28%Cars & MUV
13%
Three-wheelers &
SCV9%
Refinance15%
Old vehicles14%
Tamil Nadu9%
Andhra Pradesh
7%Maharasthra
12%
Chattisgarh8%Rajasthan
10%Gujarat
7%Punjab
6%Kerala
5%
Madhya Pradesh
7%
WB5%
Delhi3%
UP5%
Orissa3%
Karnataka4% Haryana
2%
Other states7%
Strong and reputed promoter enhances market credibility

BUY TP: INR 775.00 35.7%
Cholamandalam Investment and Finance CIFC IN
Company Initiation INDIA NBFC
25 March 2015 Page 53 of 82
Fig 17 - Murugappa Group: Corporate structure
Source: Company
The group is a market leader in several businesses, with the key listed businesses as under:
Fertilizer: Coromandel International (market cap of ~US$ 1.3bn; the group owns 63%+ stake) is one of India’s leading phosphatic fertilizer companies, with a production capacity of 2.9mt of phosphatic fertilizers.
Engineering products: Tube Investments of India (market cap of ~US$ 1bn; the group owns 48%+ stake) offers a wide range of engineering products such as steel tubes, chains and car-door frames, apart from e-scooters, fitness equipment and cycles.
Sugar and bio products: EID Parry India (market cap of ~US$ 560mn, the group owns 45%+ stake) offers a wide range of agro products such as sugar, microalgal health supplements and bio products, with a capacity to crush 32,500 tonnes of cane per day (tcd).
Abrasives/electro minerals and industrial ceramics: Carborundum Universal (market cap of ~US$ 500mn; the group owns 42%+ stake) is a pioneer in coated and bonded abrasives, super re-factories, electro minerals and industrial ceramics. The company currently has a presence in Australia, South Africa, Russia, Canada and the Middle East.
Key unlisted businesses are:
Parry Agro: Parry Agro has tea plantation factories both in South and North-east India, and between the two regions, the company produces ~17mn kg of tea.
General Insurance: Cholamandalam MS General Insurance Company is a JV between Murugappa Group and Mitsui Sumitomo Insurance Group of Japan, operating through 93 branches and over 7,500 agents India. Cholamandalam MS offers a wide range of products that include accident, engineering, health, liability, marine, motor, property, travel and rural insurance for individuals and corporates. The company achieved a GWP of Rs 13bn in FY12.
Coromandel Int. Ltd (MG – 63%)
E.I.D. Parry (MG – 45%)
Murugappa Group (Listed companies)
Tube Investments of India (MG – 48%)
Carborundum Universal (MG–42%)
Chola Finance Ltd (Tube Invst – 50.3%)
Chola Securities (100%)
Chola Distribution Services (100%)

BUY TP: INR 775.00 35.7%
Cholamandalam Investment and Finance CIFC IN
Company Initiation INDIA NBFC
25 March 2015 Page 54 of 82
Cholamandalam Finance (CIFC) was established in 1978 as an equipment financing company and later diversified into vehicle loans, gold loans, home equity and business finance. The company is primarily focused on semi-urban and rural customers who do not get bank finance easily. The Murugappa Group owns 57.7% in the company through its subsidiaries – Tube Investments (50.3%), Ambadi Enterprises (5%) and others group companies (2.4%).
Fig 18 - Shareholding pattern as on Dec’14
Source: Company, Bloomberg
Promoters supportive during difficult times CIFC entered into a JV with Development Bank of Singapore (DBS) in Jun’05, with DBS taking a 37.5% stake in the company. Disbursement growth was robust in FY07/FY08 at +80% CAGR as the company grew its personal loan (PL) portfolio aggressively. However, due to a sharp slowdown in global and domestic loan growth in FY08/FY09, the company suffered significant delinquencies and heavy losses in the small-ticket PL segment.
Gross NPAs in the PL segment jumped to ~10% in FY09 from 1.5% in FY08, leading CIFC to exit the PL business in Sep’08. Due to the sharp slowdown, segment NPAs touched a record high of 32% in FY10. After discontinuing the unsecured loan business (1/3rd of total loan book), CIFC gradually brought down the exposure through effective collections, high NPA provisions, and sell-down of assets on an assignment basis from FY10-FY12. The company had a loan book of ~Rs 14bn in FY09 which was fully recovered/provided for by FY12.
The JV was originally formed to leverage on DBS’ expertise in the personal loan business. However, since CIFC was exiting the business, the promoters decided to buy out DBS’ stake in the JV. In FY10-end, the Murugappa group bought DBS’ 37.5% stake in CIFC for Rs 3.8bn (Rs 91/sh), signalling strong promoter support despite low profitability at the time.
Tube Investments (Promoter group)
50%
Ambadi Enterprises (promoter group)
5%
Others - promoters2%
FIIs32%
Domestic institutions5%
Public6%
Promoters bought back DBS’ stake in CIFC despite record low profits

BUY TP: INR 775.00 35.7%
Cholamandalam Investment and Finance CIFC IN
Company Initiation INDIA NBFC
25 March 2015 Page 55 of 82
Fig 19 - Run-down of CIFC’s personal loan portfolio
Source: Company
After exiting the unsecured personal loans business, the company focused solely on the productive/secured end of the segment, including its core competency in vehicle finance (two decades of operating experience). It introduced the home equity business in 2001 and is growing it slowly (GNPA at manageable levels, credit costs benign).
Fig 20 - Business mix – FY08 Fig 21 - Business mix – Q3FY15
Source: Company Source: Company
Senior management Mr. Vellayan Subbiah, Managing Director Mr. Subbiah was the Managing Director at Laser Words, Chennai, from January’07 to August’10. He is currently director on the boards of SRF and some other Murugappa group companies. His professional experience includes six years at McKinsey and Company, Chicago, and associations with 24/7 Customer Inc., Las Gatos and The Carlyle Group, San Francisco. He is a Bachelor of Technology in Civil Engineering from IIT Madras and a Masters in Business Administration from the University of Michigan.
Mr. Arul Selvan, Sr. Vice President & CFO Mr. Selvan is a CA from the Institute of Chartered Accountants of India and an MBA from Open University (UK). With over 20 years of experience in finance and accounts, he heads CIFC’s finance function as the CFO. Mr. Selvan has spent 19 years with the Murugappa group, with stints at Tube Investments of India, the corporate strategic planning division of the Murugappa Group, Cholamandalam Mitsui Sumitomo General Insurance and the group corporate finance division of the Murugappa Group.
28.4 27.424.9
21.219.0
16.514.5
12.5
7.65.9
2.91.6 1.1 0.6
0
5
10
15
20
25
30
Q1F
Y09
Q2F
Y09
Q3F
Y09
Q4F
Y09
Q1F
Y10
Q2F
Y10
Q3F
Y10
Q4F
Y10
Q1F
Y11
Q2F
Y11
Q3F
Y11
Q4F
Y11
Q1F
Y12
Q2F
Y12
Q3F
Y12
Q4F
Y12
(Rs bn)
Personal Loans33%
Vehicle Finance
47%
Home Equity5%
Business Finance
15%
Vehicle Finance
71%
Home Equity28%
Business Finance
1%
Gold loans0%
Business mix has changed drastically in favour of secured/productive segments
Experienced team heading various verticals

BUY TP: INR 775.00 35.7%
Cholamandalam Investment and Finance CIFC IN
Company Initiation INDIA NBFC
25 March 2015 Page 56 of 82
Mr. Kaushik Banerjee – President, Strategies & Corporate Affairs Mr. Banerjee has been in the asset finance business for close to 25 years. He began his career in financial services with ITC Classic Finance (an ITC subsidiary) and has headed the west & east operations of Esanda Finanz (a subsidiary of ANZ Grindlays Bank) where he worked for seven years. He joined CIFC in 2001 and took over as Senior Vice President of the vehicle finance vertical in 2006. The division enjoys a strong reputation as one of the largest financiers of CVs in the country with a robust portfolio quality.
Mr. Rohit Phadke, Sr. VP & Business Head – Home Equity Mr. Phadke has 20+ years of experience in asset financing. His last assignment was with Apple Finance as regional manager. He has been with the company for over 10 years and had led the west zone of the vehicle finance business with distinction. He established the home equity business in 2006, and has successfully built a significant franchisee in the mortgage space, recording both profits and growth from the time of commencement of business.

BUY TP: INR 775.00 35.7%
Cholamandalam Investment and Finance CIFC IN
Company Initiation INDIA NBFC
25 March 2015 Page 57 of 82
Valuations Initiate coverage with BUY, TP Rs 775
Since we expect CIFC to continue to post strong earnings growth, we use the two-stage Gordon growth model to set our target price, as it captures valuations in a high-growth stage.
Fig 22 - CIFC – valuation methodology Components of two-stage model Our assumptions ROE 20%
COE 13%
g (initial growth) 16%
r (COE) 13%
gn (perpetual growth rate) 5%
n (initial growth period, yrs) 5
payout1 20%
Payoutn 80%
K1 1.10
K2 13.05
P/BV 2.83x
FY17 – BV 275
TP (rounded off) 775
Source: RCML Research
CIFC is currently trading at 2.1x FY17E PBV, a 10% discount to SHTF/MMFS which we think is unjustified given higher loan growth versus peers and the structural improvement in profitability ahead. We believe strong earnings growth would eventually lead to a stock re-rating. Initiate with BUY.
Key risks
Slower-than-anticipated loan growth We expect CIFC’s loan growth to remain strong and better than industry at a 22% CAGR for the next three years. Any sharp deviation from our expectation could pose a risk to our investment thesis.
Risk from new geographies/product lines CIFC has added new loan products into its portfolio over the last few years and is planning to scale up products like home loans, SME and gold loans. There is a downside risk to growth as well as asset quality in these new loan segments as the company does not have a demonstrated track record in managing these business lines.
Similarly, CIFC has ventured into new geographies in the last 2-3 years. Growth and asset quality dynamics are different across geographies, especially in rural and semi-urban areas.
BUY TP: INR 775.00 35.7%
Cholamandalam Investment and Finance CIFC IN
Company Initiation INDIA NBFC
25 March 2015 Page 58 of 82
Increase in asset quality pressures Our earnings estimates incorporate credit costs of ~140bps over the next three years (FY15-FY17E). Gross and net NPA ratios are likely to decline by 25-30bps every year for the next three years. Any sharp deterioration in asset quality could see credit costs rising sharply, thereby adversely affecting our earnings forecasts.
Tightness in money markets and higher bank lending rates Past trends show that NBFCs and wholesale funded banks tend to de-rate sharply whenever there is a steep rise in rates in a short span of time, as occurred during the Oct’08–Feb’09 and Oct’10–Mar’11 periods.
We have assumed a benign interest rate environment and cut in banks’ lending rate in FY16/FY17, leading to a decline in cost of funds for the company and resulting in higher spreads and margins. Any adverse trend in money markets and liquidity poses a downside risk to our margin assumptions.
Regulatory changes The RBI has changed capital requirement and NPA recognition norms (from 180-day to 90-day NPA recognition). Due to recent dilution, CIFC’s tier 1 capital (12.1% in FY16E) is comfortable and well above the RBI requirement of 10%. We expect gross NPA for CIFC to go up over the next few years due to the new norms, which may lead to an increase in credit cost. However, the impact will be lower than peers.
The RBI wants to bridge the gap between regulations pertaining to banks and NBFCs. Any further tightening of regulations by the RBI (like changes in priority sector norms and liquidity requirements) can affect CIFC.

BUY TP: INR 775.00 35.7%
Cholamandalam Investment and Finance CIFC IN
Company Initiation INDIA NBFC
25 March 2015 Page 59 of 82
Appendix Q&A with business heads
Our interaction with two of CIFC’s key business heads, Rohit Padke – Business Head, Home Equity and Kaushik Banerjee – President, Strategies & Corporate Affairs, validates our confidence in the company’s ability to deliver higher-than-industry growth with a tight leash on operating cost and asset quality.
Rohit Padke – Business Head, Home Equity
Why did CIFC start the loans against property (LAP) business? This is in sharp contrast to other leading NBFCs which have concentrated only on vehicle finance and related areas?
CIFC has not added on this business segment merely to show higher growth and increase its balance sheet size. It launched this business in FY01 and has created a niche for itself by understanding the market well. CIFC has been a pioneer in many businesses such as three-wheeler finance and LCV finance, and LAP is another product that will evolve over time.
The main purpose of this business is to provide credit to the MSME sector which is neglected by banks due to lower disclosed incomes. Therefore, the target segment for the company is non-salaried and non-professional customers – these customers don’t have income proof (to justify higher loan disbursement) and therefore find it difficult to secure loans from banks.
Unlike auto finance, isn’t lending against property risky? Customers are highly leveraged as borrowing against property is the last resort, coming generally after term loans and working capital lending limits are exhausted?
Though the product is known in the market as ‘loan against property’, loans are given for business purposes and the property acts solely as collateral. Many well-known private sector banks including HDFC Bank and Yes Bank are engaged in this business and have sizeable portfolios. Both banks together have an estimated portfolio of Rs 75bn under this category in southern regions.
Loans are granted on assessment of the cash flow-generating ability of the underlying business, the borrowers’ future plans, the industry in which the company operates, and nature of the business (safe, volatile, cyclical or structural). The company does not grant loans to a customer who is overleveraged and wants to service existing debt.
Since CIFC is an NBFC and therefore not covered under the SARFEASI Act, how do you recover loans as it is not easy to repossess and sell property (compared to vehicles)?
The SARFEASI Act allows lenders to repossess the underlying asset without going to court, but borrowers can always go to court and ask for a stay order. Therefore, it isn’t easy to repossess and sell the property even if lenders are covered under the Act.
CIFC has various options including filing a complaint under the Negotiable Instrument Act for bounced cheques – this is a simple and effective law and a bounced cheque is a punishable offence. In addition, the company can opt for arbitration in the court of law – in this case, the borrowers will have to appoint a lawyer wherever the company is registered (in Chennai for CIFC), which they find time consuming and costly. CIFC can also obtain relief u/s 9 of the Companies Act, under which the court will attach the property and the borrower cannot sell/dispose of it without the lender’s permission.
CIFC is looking for balanced growth in home equity with focus on profitability and asset quality
Competes with reputed private sector banks; lending is based on assessment of cash flow
BUY TP: INR 775.00 35.7%
Cholamandalam Investment and Finance CIFC IN
Company Initiation INDIA NBFC
25 March 2015 Page 60 of 82
Credit checks, analysis of borrower capacity/business and proper documentation are key to success rather than recovery. More than 90% of CIFC’s defaults in the past were mainly due to business-related problems and fraud cases were negligible. To date, the company has written off only Rs 430mn of its portfolio.
In addition, the government has recently announced in the budget that NBFCs will be included in the SARFEASI Act – this isn’t a game-changer but will help keep credit quality in check.
What checks do you follow when granting a home loan?
Property/mortgage records: Better analysis and understanding of property law is the key as property and mortgage laws differ from state to state in India. Even land and property records are not easily available in some states. Studying the history of property that is being used as collateral is essential in order to avoid fraud. Proper documentation and creating a first charge on the business is crucial.
Understanding the business/sector and geographies in which the borrower operates: Cash flow for repayment of loans and interest will come from the underlying business and therefore the credit team should be well aware of the underlying business dynamics in each region.
CIFC’s business is divided into three verticals: sales, credit and collections. The management’s goal of building a clean loan book is clear. Every employee in each of these divisions has 30% of their KPI linked to other verticals, which in turn helps ensure a quality loan book.
What are the growth opportunities and your targets for the business?
Although opportunities are immense, the company is looking at balanced growth. This is because each category, customer segment and geography is different and rapid expansion can bring with it asset quality risk in future. The company is looking at growing the home equity lending business in the range of 20-25% going forward.
Based on the success of its LAP product, CIFC has started offering pure home loans to non-salaried and non-professional customers as well. The product has garnered a good response in many geographies, reaching a portfolio size of Rs 800mn with 16% yields. ROA/ROE too are likely to be strong. CIFC plans to ramp up this business without compromising on profitability.
What are the margins and sustainable profit ratios in the home equity lending business?
Average yield for the home equity business ranges between 12-13.5% (depending upon the market interest rate) and margins are in the range of 3.5-4%. Notably, the average tenure for home loans is ~10 years (vs. 3.5-4 years for auto loans) and operating cost is lower than vehicle financing because of the higher ticket size (~Rs 0.5mn on average for LAP vs. Rs 500k for auto loans). Apart from lower costs of sourcing/collection, these loans are sticky and hence can grow in line with the promoters’ existing business without added sourcing cost. ROA is expected to stay in the range of 3-3.5%.
What are the challenges going forward?
The biggest challenge is manpower. CIFC needs people with a solid understanding of property laws and also credit risk. The company has managed this well so far. Churning of employees at the mid and senior level is low and the team is very stable.
Detailed check on property/mortgage records, understanding of client business/economic conditions
Home equity lending is very profitable if done sensibly; ROA in the range of 3.5-4%

BUY TP: INR 775.00 35.7%
Cholamandalam Investment and Finance CIFC IN
Company Initiation INDIA NBFC
25 March 2015 Page 61 of 82
Kaushik Banerjee – President, Strategies & Corporate Affairs
What is your outlook on the CV cycle? Have you seen any improvement on the ground and in asset quality since the new government came into power?
There is no material improvement on the ground and datapoints like utilisation rates, resale prices, discounts offered by manufacturers and delinquency rates remain poor.
The M&HCV segment which caters to long distance transportation is closely linked to manufacturing and investment-related activities in the country (IIP growth). We need to see some improvement in these parameters.
At the same time, one of the worst cycles in the last 20 years is coming to an end. The consolidation phase for lenders will last for one more year before we see an improvement in growth.
In the goods segment, typically 25% of vehicles come up for replacement every year. However, over the last 1-1.5 years, replacement demand was weak due to the uncertain market conditions. This demand is likely to come back in a big way once we have clarity on growth.
Do you think operators will benefit from the recent correction in fuel price?
Diesel prices went up in FY13/FY14. During this period, utilisation levels dropped by 20-30%, resulting in a sharp reduction in freight rate when fuel cost (~50% of operating cost) was going up.
Fuel cost has declined in the last six months. Although freight rates have also come off partially due to excess capacity, benign fuel cost will definitely help CV operators as and when utilisation levels start improving.
CV operators have stated that if freight rates don’t correct further, then M&HCV operators could benefit in the range of Rs 12k-15k a month which will help them pay their loan EMI.
What is your view on the pick-up in CV sales in the last 2-3 months?
CV sales are higher mainly due to the low base effect. In addition, only large fleet operators are in the market and they are buying vehicles to fulfill standardised contracts or specific applications. SRTOs are absent and will come back only when they see actual improvement on the ground.
Higher sales in the last 3-4 months will benefit large private sector banks such as HDFC Bank and Axis Bank as fleet operators generally don’t take loans from NBFCs. Year-on-year growth for these top banks will look better as they have curtailed their operations heavily due to poor market conditions.
Have you seen any improvement in vehicle resale prices in the last 6-9 months?
Resale prices of vehicles have come off dramatically in this cycle. Younger vintage vehicles are at a steep discount to newer vehicles. Some fleet operators are also buying these vehicles as discounts are high.
However, resale volumes have recently increased at some organised auctions and the trend suggests that operators are buying vehicles in anticipation of good economic conditions ahead. This is positive for the sector.
Situation is grim and consolidation phase for lenders is expected to last for another 6-9 months
SRTOs will benefit from lower fuel cost once cycle turnaround begins

BUY TP: INR 775.00 35.7%
Cholamandalam Investment and Finance CIFC IN
Company Initiation INDIA NBFC
25 March 2015 Page 62 of 82
Why have LCV volumes declined less than M&HCVs (lower negative impact on CIFC’s books as well)?
LCVs/mini LCVs primarily cater to consumption or retail demand. They can switch products and segments easily and therefore are not affected by an investment-related slowdown if retail products are growing at a healthy rate.
However, consumption-related demand is also witnessing some slowdown as overall GDP growth has halved, and this is reflected in LCV volumes.
Lower CPI inflation going forward will bring LCVs back into the limelight as higher disposable incomes will drive demand for comfort goods among the low-to-mid income groups.
What is your outlook on the tractor business?
Tractor lending is a good product to de-risk CIFC’s business as it is largely disassociated with the CV cycle. It has good yields and is very profitable if risks are managed adequately.
The company is focusing on the profitability of this product and has adopted the strategy of a balanced portfolio across geographies. A tight check on recovery ensures NPLs are manageable. In addition, the tractor portfolio offers a good securitisation opportunity as it qualifies under priority sector lending.
What is your view on GST implementation and its impact on CV volumes?
A key upshot of the goods and services tax (GST) will be that the price to consumer will come down in the long run, which will benefit all players by way of higher demand.
Movement of goods will be much easier and therefore it will bring efficiency in overall operations, leading to lower delinquencies and better asset quality.
Higher efficiencies will also reduce the waiting time at checkpoints and can reduce the overall demand for vehicles. However, the impact will be staggered over 4-5 years and only state-to-state traffic movement will improve. Many states have already abolished octroi duty and the impact on traffic movement will not be material.
LCV volumes expected to rebound from H2FY16 onwards
Tractor lending helps de-risk CIFC’s business
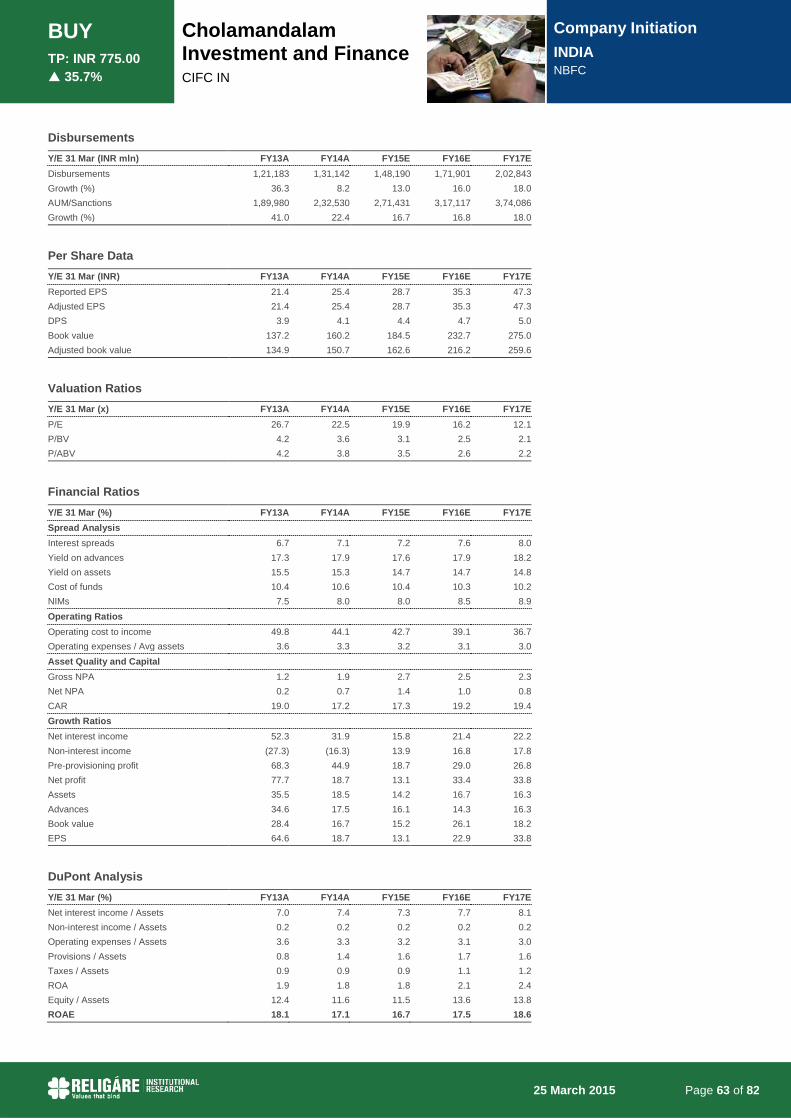
BUY TP: INR 775.00 35.7%
Cholamandalam Investment and Finance CIFC IN
Company Initiation INDIA NBFC
25 March 2015 Page 63 of 82
Disbursements Y/E 31 Mar (INR mln) FY13A FY14A FY15E FY16E FY17E Disbursements 1,21,183 1,31,142 1,48,190 1,71,901 2,02,843 Growth (%) 36.3 8.2 13.0 16.0 18.0 AUM/Sanctions 1,89,980 2,32,530 2,71,431 3,17,117 3,74,086 Growth (%) 41.0 22.4 16.7 16.8 18.0
Per Share Data Y/E 31 Mar (INR) FY13A FY14A FY15E FY16E FY17E Reported EPS 21.4 25.4 28.7 35.3 47.3 Adjusted EPS 21.4 25.4 28.7 35.3 47.3 DPS 3.9 4.1 4.4 4.7 5.0 Book value 137.2 160.2 184.5 232.7 275.0 Adjusted book value 134.9 150.7 162.6 216.2 259.6
Valuation Ratios Y/E 31 Mar (x) FY13A FY14A FY15E FY16E FY17E P/E 26.7 22.5 19.9 16.2 12.1 P/BV 4.2 3.6 3.1 2.5 2.1 P/ABV 4.2 3.8 3.5 2.6 2.2
Financial Ratios Y/E 31 Mar (%) FY13A FY14A FY15E FY16E FY17E Spread Analysis Interest spreads 6.7 7.1 7.2 7.6 8.0 Yield on advances 17.3 17.9 17.6 17.9 18.2 Yield on assets 15.5 15.3 14.7 14.7 14.8 Cost of funds 10.4 10.6 10.4 10.3 10.2 NIMs 7.5 8.0 8.0 8.5 8.9 Operating Ratios Operating cost to income 49.8 44.1 42.7 39.1 36.7 Operating expenses / Avg assets 3.6 3.3 3.2 3.1 3.0 Asset Quality and Capital Gross NPA 1.2 1.9 2.7 2.5 2.3 Net NPA 0.2 0.7 1.4 1.0 0.8 CAR 19.0 17.2 17.3 19.2 19.4 Growth Ratios Net interest income 52.3 31.9 15.8 21.4 22.2 Non-interest income (27.3) (16.3) 13.9 16.8 17.8 Pre-provisioning profit 68.3 44.9 18.7 29.0 26.8 Net profit 77.7 18.7 13.1 33.4 33.8 Assets 35.5 18.5 14.2 16.7 16.3 Advances 34.6 17.5 16.1 14.3 16.3 Book value 28.4 16.7 15.2 26.1 18.2 EPS 64.6 18.7 13.1 22.9 33.8
DuPont Analysis Y/E 31 Mar (%) FY13A FY14A FY15E FY16E FY17E Net interest income / Assets 7.0 7.4 7.3 7.7 8.1 Non-interest income / Assets 0.2 0.2 0.2 0.2 0.2 Operating expenses / Assets 3.6 3.3 3.2 3.1 3.0 Provisions / Assets 0.8 1.4 1.6 1.7 1.6 Taxes / Assets 0.9 0.9 0.9 1.1 1.2 ROA 1.9 1.8 1.8 2.1 2.4 Equity / Assets 12.4 11.6 11.5 13.6 13.8 ROAE 18.1 17.1 16.7 17.5 18.6
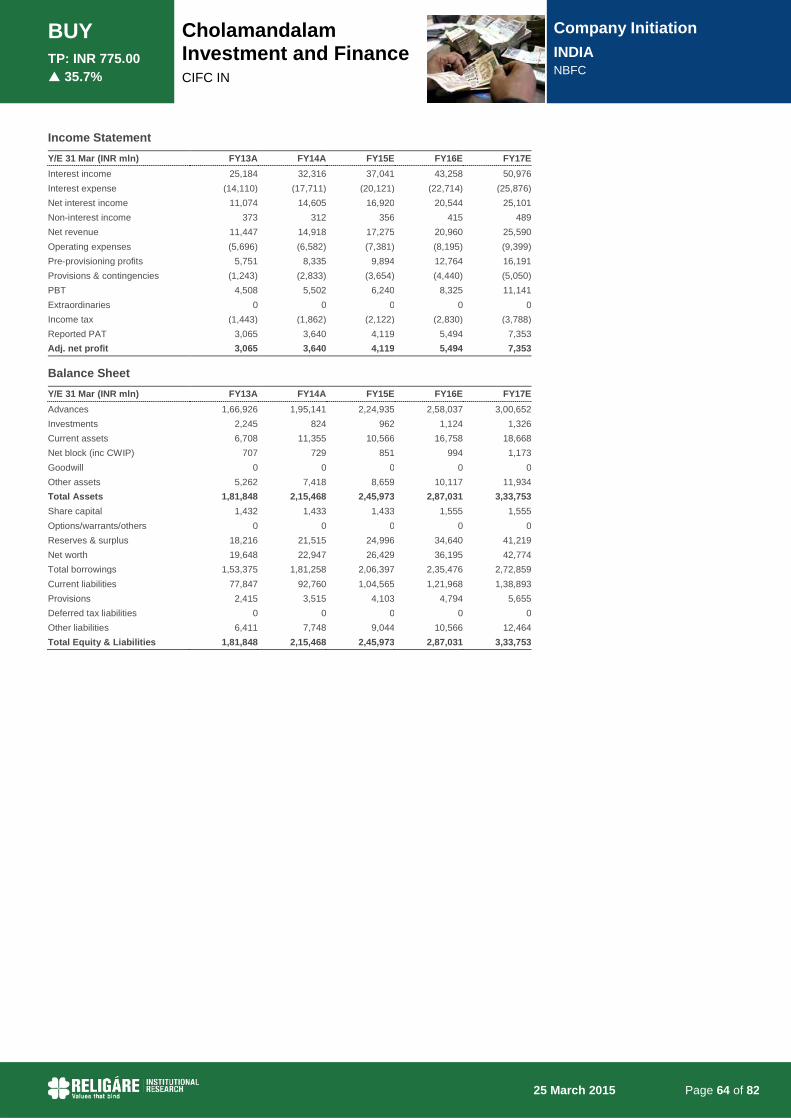
BUY TP: INR 775.00 35.7%
Cholamandalam Investment and Finance CIFC IN
Company Initiation INDIA NBFC
25 March 2015 Page 64 of 82
Income Statement Y/E 31 Mar (INR mln) FY13A FY14A FY15E FY16E FY17E Interest income 25,184 32,316 37,041 43,258 50,976 Interest expense (14,110) (17,711) (20,121) (22,714) (25,876) Net interest income 11,074 14,605 16,920 20,544 25,101 Non-interest income 373 312 356 415 489 Net revenue 11,447 14,918 17,275 20,960 25,590 Operating expenses (5,696) (6,582) (7,381) (8,195) (9,399) Pre-provisioning profits 5,751 8,335 9,894 12,764 16,191 Provisions & contingencies (1,243) (2,833) (3,654) (4,440) (5,050) PBT 4,508 5,502 6,240 8,325 11,141 Extraordinaries 0 0 0 0 0 Income tax (1,443) (1,862) (2,122) (2,830) (3,788) Reported PAT 3,065 3,640 4,119 5,494 7,353 Adj. net profit 3,065 3,640 4,119 5,494 7,353
Balance Sheet Y/E 31 Mar (INR mln) FY13A FY14A FY15E FY16E FY17E Advances 1,66,926 1,95,141 2,24,935 2,58,037 3,00,652 Investments 2,245 824 962 1,124 1,326 Current assets 6,708 11,355 10,566 16,758 18,668 Net block (inc CWIP) 707 729 851 994 1,173 Goodwill 0 0 0 0 0 Other assets 5,262 7,418 8,659 10,117 11,934 Total Assets 1,81,848 2,15,468 2,45,973 2,87,031 3,33,753 Share capital 1,432 1,433 1,433 1,555 1,555 Options/warrants/others 0 0 0 0 0 Reserves & surplus 18,216 21,515 24,996 34,640 41,219 Net worth 19,648 22,947 26,429 36,195 42,774 Total borrowings 1,53,375 1,81,258 2,06,397 2,35,476 2,72,859 Current liabilities 77,847 92,760 1,04,565 1,21,968 1,38,893 Provisions 2,415 3,515 4,103 4,794 5,655 Deferred tax liabilities 0 0 0 0 0 Other liabilities 6,411 7,748 9,044 10,566 12,464 Total Equity & Liabilities 1,81,848 2,15,468 2,45,973 2,87,031 3,33,753

Financial Highlights
Company Initiation INDIA NBFC
25 March 2015
REPORT AUTHORS
Parag Jariwala +91 22 6766 3442 [email protected]
PRICE CLOSE (24 Mar 15) INR 1,887.15 MARKET CAP INR 124.4 bln USD 2.0 bln
SHARES O/S 59.3 mln
FREE FLOAT 66.2%
3M AVG DAILY VOLUME/VALUE 0.1 mln / USD 1.7 mln
52 WK HIGH INR 2,200.00
52 WK LOW INR 1,020.05
BUY TP: INR 2,300.00 21.9%
Shriram City Union SCUF IN
Unique combination of high growth & high profitability
We initiate coverage on SCUF with BUY and a Mar’16 TP of Rs 2,300. SCUF has developed a robust business model over the last two decades and largely caters to the under-served rural and semi-urban areas. Its niche expertise in MSME lending (~50% of loan book) and large customer base sourced from group companies supports high growth along with superior profitability. In our view, significant under-penetration in key businesses – MSME lending, housing finance & pre-owned vehicle loans – should sustain a structural ROE of +20%.
Niche presence in scalable business: SCUF is well placed in MSME financing (~50% of its total AUM) due to niche experience gained over the last two decades and a large customer base of group companies. This segment is highly underpenetrated and hence growth rates are likely to remain strong with superior profitability. SCUF is able to achieve high margins and low credit costs due to its strong connect with customers and robust labour-intensive business model.
Near-term ROE subdued but ROA healthy: We expect gross spreads to remain protected at ~11% and credit cost to decline with the expected improvement in the economy. Loan growth is likely to revive from FY16 onwards. While tier 1 capital at 25% (dilution via 10% stake sale to Piramal Enterprises in May’14) is likely to be a drag on ROE in the near term, we are confident that SCUF can generate sustainable ROA of 3-3.2% (ROE of 21-23% with leverage of 7x) in the medium-to-long term.
Immense growth potential in rural housing finance: Shriram Housing, SCUF’s housing finance subsidiary (77% stake), primarily targets under-served segments in tier II and tier III cities and towns. It currently has 61 branches across 17 states, with an AUM of ~Rs 6bn and a target to reach Rs 20bn by FY17.
Initiate with BUY: Current valuations are 2.2x FY17E P/B. We have a Mar’16 TP of Rs 2,300, based on 2.7x FY17E P/B.
Y/E 31 Mar FY13A FY14A FY15E FY16E FY17E
Net interest income (INR mln) 16,326 17,848 21,505 26,175 30,460
Net revenues (INR mln) 16,725 18,879 22,021 26,783 31,190
Pre-provision profits (INR mln) 10,497 11,641 13,148 16,325 18,856
Adj. PAT (INR mln) 4,496 5,211 5,684 7,356 8,714
Adj. EPS (INR) 83.4 90.9 90.8 111.7 132.3
ROE (%) 22.5 20.2 16.1 16.3 16.6
ROA (%) 3.1 3.2 3.2 3.6 3.7
Gross NPA (%) 2.2 2.7 3.0 3.2 3.3
CAR (%) 18.6 26.1 30.5 30.1 29.5
P/BV (x) 4.6 3.8 3.0 2.6 2.2
P/E (x) 22.5 20.7 20.7 16.8 14.2
Source: Company, Bloomberg, RCML Research
14,400
19,400
24,400
29,400
410
910
1,410
1,910
(INR) Stock Price Index Price

BUY TP: INR 2,300.00 21.9%
Shriram City Union SCUF IN
Company Initiation INDIA NBFC
25 March 2015 Page 66 of 82
Investment rationale MSME segment highly underpenetrated
Demand outstrips supply There is a significant gap in credit allocation to the MSME (micro small medium enterprise) sector in India – as per the RBI’s working group recommendation on priority sectors, supply of credit to the sector in FY13 has been short of total demand by ~59%. The average gap for the entire period of the 12th five year plan (2012-17) has been ~52%.
Fig 1 - Credit penetration is very low for MSME sector (12th five year plan)
Source: RBI, Company
RBI data reveals that only 5.18% of MSME units (both registered and unregistered) had availed of finance through institutional sources, 2.05% received finance from non-institutional sources and a majority of the units, i.e. 92.77% had not availed any external finance or depended on self-finance. This under-penetration of credit hampers the growth potential of the MSME sector as a whole.
SCUF in a sweet spot to gain from MSME opportunity We believe that SCUF has an edge over banks in terms of financing MSME credit needs, as banks follow a restrictive funding approach with heavy dependence on a standardised credit policy and statutory certified information. We note that only a small portion of MSMEs route their day-to-day transactions through the banking system as many entrepreneurs find it difficult to comply with banks’ paperwork.
Banks need to alter their lending model in terms of appraisal process, collection and decentralisation of decision-making if they want to serve these categories of customers. With such structural changes unlikely to materialise anytime soon in the banking sector, we think SCUF has immense growth potential in the under-served MSME market.
Group company Shriram Chits has a large client base SCUF sources 30-35% of its loans through group company Shriram Chits. In addition, 20-25% of loans are through chit referrals and the remaining 40-50% are sourced largely through SCUF’s own branch network. Shriram Chits has a large customer base totaling 40mn clients of which 1.2mn are currently active – SCUF targets both active and non-active (past) clients.
SCUF is also expanding its MSME loan book through its own branches and reliance on Shriram Chits has come off gradually. Management highlighted that the MSME loan book
Financed through non institutional
sources2%
Financed through Institutional
Sources5%
Self Financed93%
Supply of credit to MSME sector has been short of demand by 52% during the 12th five year plan
Banks’ current business model is not suitable for MSME customers
Large client base of Shriram Chits helps the company cross-sell MSME credit

BUY TP: INR 2,300.00 21.9%
Shriram City Union SCUF IN
Company Initiation INDIA NBFC
25 March 2015 Page 67 of 82
sourced through chit members is growing slowly (~5% growth in the last 2-3 years) and it is expanding largely through own branches. Growth is picking up in areas not covered by Shriram Chits, such as in the states of Madhya Pradesh, Chhattisgarh, Maharashtra and Northern India.
Conscious slowdown in AUM growth in the last two years Management stated that it has consciously slowed down AUM growth over the last year and a half due to poor economic conditions. This strategy has paid off in terms of lower delinquencies and better asset quality performance than peers. In the gold loan segment for instance, due to regulatory challenges and volatility in gold prices, SCUF has consciously stayed away the segment. Ownership verification of jewellery can be difficult since there is no clarity on the documents/methods to be used for purchase. The company chose to lower the LTV on gold products to 50-55%, which resulted in ~50% YoY decline in gold loans in FY13/FY14.
Fig 2 - AUM growth largely muted in the last two years
Source: Company
Fig 3 - Gold loans declined by 50% YoY in FY14 Fig 4 - Gold loan proportion in AUM has come off from 36% in FY12 to 17% currently
Source: Company Source: Company
2534
46 52
80
134
158147
162
0
20
40
60
80
100
120
140
160
180
FY07 FY08 FY09 FY10 FY11 FY12 FY13 FY14 9MFY15
(Rs bn) AUM largely flat in last ~2 years
28% CAGR growthfrom FY08-13
39
22
48 47
2528
159%146%
158%119%
(2%)
(47%)
10%
(100%)
(50%)
0%
50%
100%
150%
200%
0
10
20
30
40
50
60
FY09 FY10 FY11 FY12 FY13 FY14 9MFY15
(Rs bn) Gold loans YoY growth (R)
1%4%
8%
16%
28%
36%
30%
17% 17%
0%
5%
10%
15%
20%
25%
30%
35%
40%
FY07
FY08
FY09
FY10
FY11
FY12
FY13
FY14
9MFY
15
(%)
AUM remained largely flat in the last two years due to the economic slowdown

BUY TP: INR 2,300.00 21.9%
Shriram City Union SCUF IN
Company Initiation INDIA NBFC
25 March 2015 Page 68 of 82
In the two-wheeler space, SCUF is financing ~60k two-wheelers a month. The company is the third largest player after HDFC Bank and IndusInd Bank. Bajaj Finance is the fourth largest player. Growth opportunities are expanding as customers in semi-urban and rural areas are moving from cash to cheque purchases and showing greater willingness to take loans. However, this process will be gradual – the two-wheeler segment is still a cash-heavy market and loans are taken for private vehicles rather than business use.
In auto finance, SCUF finances mainly second-hand vehicles (cars, tractors, CVs and three-wheelers), which are more than 12 years old. Capital/residual value is low and lending is based on the borrower’s profile and product end use.
AUM to clock 19% CAGR over FY15-FY17 We expect growth to revive as the slowdown due to the gold loan portfolio is already behind us and with revival in economic activities, MSME lending (+50% of portfolio) should gather momentum.
Fig 5 - AUM break-up (Dec’14)
Source: Company
Fig 6 - Growth to revive after two years of flat AUM
Source: Company, RCML Research
Small Enterprises loans53%
Small Enterprises loans (secured against gold)
6%
Gold loans11%
Two Wheelers loans18%
Auto loans8%
Personal loans4%
3446 52
80
134
158147
169
197
238
(20%)
(10%)
0%
10%
20%
30%
40%
50%
60%
70%
80%
0
50
100
150
200
250
FY08 FY09 FY10 FY11 FY12 FY13 FY14 FY15E FY16E FY17E
(Rs bn) AUM (Rs bn) YoY growth (R)
AUM expected to grow at 19% led by all verticals

BUY TP: INR 2,300.00 21.9%
Shriram City Union SCUF IN
Company Initiation INDIA NBFC
25 March 2015 Page 69 of 82
Excess capital to subdue near-term ROE but ROA set to expand
Margins largely protected at current levels We expect gross spreads (calculated) to remain in the range of 11-11.5% over FY15-FY17. SCUF expects some benefits due to a reduced cost of funds in the wholesale market and a likely cut in base rates (bank funding) in FY16. However, interest reversals are expected to go up as the company moves toward the RBI’s new 90-DPD norms from 180-DPD currently. In addition, securitisation volumes will be lower in FY15/FY16 compared to earlier years due to slower growth in bank credit and relaxation of RIDF rules by the RBI.
Fig 7 - Gross spread to remain in the range of 11-11.5%
Source: Company, RCML Research
Credit costs expected to decline marginally Despite slower economic growth over the past year and a half, SCUF has managed its asset quality well. Gross NPA is in the range of 1.5-1.8% in the MSME segment and ~4% in the vehicle finance book. The company is following 180-DPD norms for NPA classification and currently has a gross NPA ratio of ~3%. Management pointed out that under the new 90-DPD norms, gross NPAs would be 5-6%.
We believe that credit cost is unlikely to increase materially due to transition to 90-DPD norms as the company has maintained a robust provision coverage ratio of ~80%. SCUF is not likely to change its business model and will bring down its provision coverage ratio to comply with regulatory changes. Credit cost has increased steadily in the last 4-6 quarters and is expected to moderate by ~10bps each in FY16/FY17 due to the improvement in economic activity.
Fig 8 - Robust NPA coverage lends comfort Fig 9 - Credit cost to decline by 10bps each in FY16/17
Source: Company, RCML Research Source: Company, RCML Research
9.3%
13.3%
11.4%11.1%
8.8%9.3%
10.9%11.2% 11.2%
11.4%
8%
9%
10%
11%
12%
13%
14%
FY08 FY09 FY10 FY11 FY12 FY13 FY14 FY15E FY16E FY17E
70.3%
63.4%
70.7%73.5% 73.3%
77.6% 78.2%80.0% 78.9%
60%
65%
70%
75%
80%
85%
Q3F
Y13
Q4F
Y13
Q1F
Y14
Q2F
Y14
Q3F
Y14
Q4F
Y14
Q1F
Y15
Q2F
Y15
Q3F
Y15
NPA coverage ratio (%)
1.4%
2.3% 2.4%2.8%
1.7%1.9%
3.1% 3.3% 3.2% 3.0%
0%
1%
1%
2%
2%
3%
3%
4%
FY08
FY09
FY10
FY11
FY12
FY13
FY14
FY15
E
FY16
E
FY17
E
Credit cost (%)
Despite lower cost of funds, spreads to remain at current levels due to high interest reversal & lower securitisation
Managing the portfolio well with high margins and low credit costs

BUY TP: INR 2,300.00 21.9%
Shriram City Union SCUF IN
Company Initiation INDIA NBFC
25 March 2015 Page 70 of 82
High tier 1 capital Loan growth was virtually flat over FY13-FY15 due to poor economic conditions – the lower capital burn led to an increase in tier 1 capital. In addition, in May’14, Piramal Enterprises took ~10% stake in the company at Rs 1,200/sh. This has increased tier 1 to 25%. Though ROA is expected to remain strong, ROE may be lower than earlier years due to lower growth (and in turn low leverage). The company needs to grow at a much faster rate in order to attain +20% ROE which looks difficult, at least till FY17-end.
Fig 10 - Excess capital due to slower loan growth in FY14/15 and equity raising
Source: Company, RCML Research
ROA to expand 50bps through FY17 We expect ROA to expand by 50bps over FY15-FY17 due to a revival in loan growth, higher margins, declining credit cost and lower leverage. ROE is likely to remain within the 16-17% range as compared to +20% during FY08-FY14 due to low leverage.
Since growth prospects are strong in the segments in which SCUF operates, the company is likely to consume higher capital once the economic recovery gathers pace. We strongly believe that low ROE is only a near-term phenomena and long-term sustainable profitability remains intact with ROE of 20%+.
Fig 11 - ROA to expand by 50bps over FY15-FY17E Fig 12 - ROE to remain low due to lower leverage
Source: Company, RCML Research Source: Company, RCML Research
13.8%
18.1%20.0%
16.4%13.8% 14.6%
20.2%
24.0%25.2% 25.5%
0%
5%
10%
15%
20%
25%
30%
FY08
FY09
FY10
FY11
FY12
FY13
FY14
Q1F
Y15
Q2F
Y15
Q3F
Y15
Tier 1 ratio (%)
3.6%
2.6%
3.6%
3.1% 3.1% 3.1%3.2% 3.2%
3.6% 3.7%
2.0%
2.2%
2.4%
2.6%
2.8%
3.0%
3.2%
3.4%
3.6%
3.8%
FY08
FY09
FY10
FY11
FY12
FY13
FY14
FY15
E
FY16
E
FY17
E
29.0%
20.9%
24.6%21.9% 23.2% 22.5%
20.2%
16.1% 16.3% 16.6%
2%
7%
12%
17%
22%
27%
32%
FY08
FY09
FY10
FY11
FY12
FY13
FY14
FY15
E
FY16
E
FY17
E
Lower capital burn led to an increase in tier 1 capital

BUY TP: INR 2,300.00 21.9%
Shriram City Union SCUF IN
Company Initiation INDIA NBFC
25 March 2015 Page 71 of 82
Immense growth potential in housing finance subsidiary
SCUF owns a 77% stake in Shriram Housing Finance (PE investor Valiant Partners owns the balance 23%), which primarily lends to under-served segments in tier II and tier III cities and towns, via 61 branches across 17 states.
The company currently has a loan book of Rs 6bn of which ~50% comes from rural and semi-urban customers. Self-employed customers account for ~65% of the total loan book. The housing arm is planning to reach Rs 20bn in AUM by FY17 and we expect growth thereafter to be in line with the industry. Credit quality risks are low in this business as average LTV is ~54% and ROE is expected to remain in the range of 18-20%.
Fig 13 - Disbursement growth strong Fig 14 - Management targeting Rs 20bn in AUM by FY17
Source: Company, RCML Research Source: Company, RCML Research
49164
230303
451351
597686 734 771
1,1931,252
0
200
400
600
800
1,000
1,200
1,400
Q4F
Y12
Q1F
Y13
Q2F
Y13
Q3F
Y13
Q4F
Y13
Q1F
Y14
Q2F
Y14
Q3F
Y14
Q4F
Y14
Q1F
Y15
Q2F
Y15
Q3F
Y15
(Rs mn)
5,857
20,000
0
5,000
10,000
15,000
20,000
25,000
4QFY
12
1QFY
13
2QFY
13
3QFY
13
4QFY
13
1QFY
14
2QFY
14
3QFY
14
4QFY
14
1QFY
15
2QFY
15
3QFY
15
FY17
(Rs mn)
ROE in the housing finance business to remain in the range of 18-20%

BUY TP: INR 2,300.00 21.9%
Shriram City Union SCUF IN
Company Initiation INDIA NBFC
25 March 2015 Page 72 of 82
Valuations Initiate coverage with BUY and TP of Rs 2,300
Since we expect SCUF’s earnings growth profile to remain strong, we use the two-stage Gordon growth model to set our target price, as it captures higher valuations emanating from a high-growth stage.
Fig 15 - Shriram City Union Finance – Valuation methodology Components of two stage model Our Assumptions ROE 20%
COE 13%
g (initial growth) 16%
r (COE) 13%
gn (perpetual growth rate) 5%
n (initial growth period, yrs) 5
payout1 20%
payoutn 80%
K1 1.09
K2 12.14
P/BV 2.70x
FY17 - BV 855
TP (rounded off) 2,300
Source: Company, RCML Research
Key risks to our investment thesis
Slower-than-anticipated loan growth We expect loan growth to remain strong and better than industry. Any sharp deviation from our expectations could pose a risk to our investment thesis.
Increase in asset quality pressures We expect asset quality pressures to ease going forward. Conversely, any further deterioration in asset quality could see credit costs increasing, adversely affecting our earnings forecasts.
Regulatory changes The RBI has changed capital requirement and NPA recognition norms (from 180-day to 90-day NPA recognition). We expect SCUF’s gross NPA to go up over the next few years which may lead to an increase in credit cost. However, the impact will be lower than peers.
Our TP of Rs 2,300 is based on the two-stage Gordon growth model

BUY TP: INR 2,300.00 21.9%
Shriram City Union SCUF IN
Company Initiation INDIA NBFC
25 March 2015 Page 73 of 82
Disbursements Y/E 31 Mar (INR mln) FY13A FY14A FY15E FY16E FY17E Loan book 1,35,241 1,28,535 1,58,561 1,80,793 2,09,249 Growth (%) 26.1 (5.0) 23.4 14.0 15.7 AUM 1,58,280 1,46,680 1,68,682 1,96,515 2,37,783 Growth (%) 17.8 (7.3) 15.0 16.5 21.0
Per Share Data Y/E 31 Mar (INR) FY13A FY14A FY15E FY16E FY17E Reported EPS 83.4 90.9 90.8 111.7 132.3 Adjusted EPS 83.4 90.9 90.8 111.7 132.3 DPS 8.4 10.3 10.0 10.0 10.0 Book value 406.5 488.9 634.5 734.5 855.1 Adjusted book value 393.5 480.3 623.1 724.8 847.4
Valuation Ratios Y/E 31 Mar (x) FY13A FY14A FY15E FY16E FY17E P/E 22.6 20.8 20.8 16.9 14.3 P/BV 4.6 3.9 3.0 2.6 2.2 P/ABV 4.8 3.9 3.0 2.6 2.2
Financial Ratios Y/E 31 Mar (%) FY13A FY14A FY15E FY16E FY17E Spread Analysis Interest spreads 9.3 10.9 11.2 11.2 11.4 Yield on advances 21.9 21.8 22.1 21.9 22.0 Yield on assets 11.3 10.9 12.3 12.9 12.8 Cost of funds 12.6 10.9 10.9 10.8 10.6 NIMs 11.8 11.5 13.1 13.7 13.6 Operating Ratios Operating cost to income 37.2 38.3 40.3 39.0 39.5 Operating expenses / Avg assets 4.3 4.4 5.1 5.2 5.2 Asset Quality and Capital Gross NPA 2.2 2.7 3.0 3.2 3.3 Net NPA 0.8 0.6 0.7 0.5 0.4 CAR 18.6 26.1 30.5 30.1 29.5 Growth Ratios Net interest income 47.8 9.3 20.5 21.7 16.4 Non-interest income 73.8 158.4 -50.0 18.0 20.0 Pre-provisioning profit 49.4 10.9 13.0 24.2 15.5 Net profit 31.3 15.9 9.1 29.4 18.5 Assets 29.4 0.1 13.9 17.4 17.3 Advances 26.1 -5.0 23.4 14.0 15.7 Book value 22.7 20.3 29.8 15.8 16.4 EPS 24.1 8.9 0.0 23.0 18.5
DuPont Analysis Y/E 31 Mar (%) FY13A FY14A FY15E FY16E FY17E Net interest income / Assets 11.3 10.9 12.3 12.9 12.8 Non-interest income / Assets 0.3 0.6 0.3 0.3 0.3 Operating expenses / Assets 4.3 4.4 5.1 5.2 5.2 Provisions / Assets 2.6 2.3 2.7 2.6 2.5 Taxes / Assets 1.5 1.6 1.6 1.8 1.8 ROA 3.1 3.2 3.2 3.6 3.7 Equity / Assets 6.4 5.7 4.2 4.2 4.2 ROAE 22.5 20.2 16.1 16.3 16.6

BUY TP: INR 2,300.00 21.9%
Shriram City Union SCUF IN
Company Initiation INDIA NBFC
25 March 2015 Page 74 of 82
Income Statement Y/E 31 Mar (INR mln) FY13A FY14A FY15E FY16E FY17E Interest income 30,431 31,355 34,985 40,961 47,467 Interest expense (14,105) (13,507) (13,480) (14,787) (17,007) Net interest income 16,326 17,848 21,505 26,175 30,460 Non-interest income 399 1,031 515 608 730 Net revenue 16,725 18,879 22,021 26,783 31,190 Operating expenses (6,229) (7,239) (8,873) (10,458) (12,334) Pre-provisioning profits 10,497 11,641 13,148 16,325 18,856 Provisions & contingencies (3,840) (3,842) (4,665) (5,345) (5,851) PBT 6,657 7,799 8,483 10,980 13,006 Extraordinaries - - - - - Income tax (2,160) (2,587) (2,799) (3,623) (4,292) Reported PAT 4,496 5,211 5,684 7,356 8,714 Adj. net profit 4,496 5,211 5,684 7,356 8,714
Balance Sheet Y/E 31 Mar (INR mln) FY13A FY14A FY15E FY16E FY17E Advances 1,35,241 1,28,535 1,58,561 1,80,793 2,09,249 Investments 730 6,276 6,903 7,593 8,353 Current assets 24,137 26,571 18,427 27,709 36,129 Net block (inc CWIP) 884 1,014 1,116 1,227 1,350 Goodwill Other assets 2,742 1,436 1,580 1,738 1,912 Total Assets 1,63,734 1,63,831 1,86,587 2,19,061 2,56,992 Share capital 554 593 659 659 659 Options/warrants/others - - - - - Reserves & surplus 21,974 28,390 41,133 47,719 55,662 Net worth 22,528 28,983 41,791 48,377 56,321 Total borrowings 1,27,287 1,20,491 1,26,849 1,48,251 1,72,630 Current liabilities 13,534 13,790 17,237 21,546 26,933 Provisions 385 568 710 887 1,109 Deferred tax liabilities - - - - - Other liabilities - - - - - Total Equity & Liabilities 1,63,734 1,63,831 1,86,587 2,19,061 2,56,992

We interacted with the top management as well as several regional/state heads at SREI to discuss the company’s construction equipment (CE) lending business. Given lacklustre manufacturing and infrastructure activities in India, SREI’s slippages/credit costs are likely to stay elevated while growth would remain sluggish in the near term. SREI is not facing pricing pressure and is incrementally focusing on retail customers to improve profitability. We do not have a rating on the stock. Market leader in CE financing: SREI started operations in 1989 and currently has a
50:50 JV with BNP Paribas for infrastructure equipment finance. The SREI-BNP JV is a market leader in equipment financing with 30% market share and a presence across the value chain of infrastructure equipment. The JV has interests in QUIPPO (India’s largest equipment rental company) and an 18% stake in VIOM networks (independent tower company with +40K towers). It also lends to infrastructure projects and has equity interest in eight road assets.
Credit costs likely to remain elevated in FY15/Q1FY16: Management stated that it has seen no improvement on the ground over the last one year, as industrial production (IIP), infrastructure spending (especially on roads) and mining activity remain lacklustre. Slippages are expected to remain elevated and credit cost high in the next 2-3 quarters. SREI is looking to improve its provision coverage ratio in coming quarters. Gross/net NPA on 90-DPD stood at 4.8%/3.6% as at end-Q3FY15.
Disbursement growth to remain sluggish: SREI’s experience over the last two decades suggests that recovery in the CE cycle always precedes growth. However, there are no clear signs of recovery and utilisation levels for equipment are still poor. Many of the company’s regional branches are achieving only a third of their peak capacity (FY08-FY10) disbursements. Therefore, a meaningful recovery in loan growth is still some time away. If there is a broad-based recovery in FY16, management expects 10-15% growth.
Strategically focusing on retail customers to improve profitability: SREI currently has ~60% of its portfolio concentrated with corporate clients. Yields are lower and risk of NPA is high as the equipment cannot be used for alternate purposes. The company plans to increase the share of retail loans in coming years, which will help improve profitability. Management is targeting an improvement in ROE band from 12-18% currently to 14-20% over the next 2-3 years.
No pricing pressure; cost of funds to ease going forward: Despite weak disbursement trends, management is not seeing any pressure on lending rates (yields). This is mainly because business is concentrated among a few large players (small/inexperienced players have exited in the last two years). Currently, the major source of funding is bank borrowings (working capital at 52% and term loan from banks at 20%), while debentures constitute 7% of total loans (up from 3% in Q2FY15). The company is exploring new avenues to reduce the cost of funds, including higher NCD issuances.
Visit Note INDIA NBFC
25 March 2015
REPORT AUTHORS
Parag Jariwala +91 22 6766 3442 [email protected]
PRICE CLOSE (24 Mar 15) INR 43.00 MARKET CAP INR 21.6 bln USD 348.9 mln
SHARES O/S 503.0 mln
FREE FLOAT
50.7%
3M AVG DAILY VOLUME/VALUE 0.1 mln / USD 1.1 mln
52 WK HIGH INR 57.55
52 WK LOW INR 24.9
SREI Infrastructure Finance CE lending industry still not out of the woods
14,400
19,400
24,400
29,400
80
180
280
380
480
580
(INR) Stock Price Index Price

SREI Infrastructure Finance CE lending industry still not out of the woods
Visit Note INDIA NBFC
25 March 2015 Page 76 of 82
Region and state-wise trends We met SREI’s CFO (Sanjeev Sancheti) and Investor Relations head (Amit Agarwal). In addition, we interacted with several regional and state heads at SREI to discuss the company’s construction equipment (CE) lending business. Our findings suggest that given weak manufacturing and infrastructure activity in India, SREI’s slippages and credit costs are likely to stay elevated while growth remains sluggish in the near term.
Slippages still high, disbursements sluggish
Western region – Rajasthan and Gujarat better off; mixed trends in Maharashtra Infrastructure activities in Rajasthan and Gujarat are driven mainly by their
respective state governments and the EPC model is used for most projects. Therefore, asset quality disturbances have been lower in these states in the last 1-1.5 years.
In terms of loan/disbursement growth as well, these two states have posted a better performance than the rest of India.
In Maharashtra, the corporate business has been sluggish for the last 2-3 years as fewer new projects have come up. Companies are hopeful that with the strong government in place in the state, infrastructure activities will pick up.
Disbursement and asset quality trends for the CV/CE segment in Maharashtra are not materially different from the rest of India. The sand mining ban in the Konkan region’s eco-sensitive zones has affected freight rates and demand for CVs. However, demand for sand mining is likely to improve as the ban was lifted by the new government in Dec’14.
Goa – slow, gradual recovery Goa had 70-80 working mines which were shut down in Sep’12 post a Supreme Court
(SC) order pertaining to allegations of illegal mining activity. The SC thereafter cleared 27 mines and the state government is likely to frame rules for operating these mines in the next 1-2 months.
Mining activities are likely to start in April or October next year (no mining during the monsoons). Companies believe that the SC will allow other mines to open up separately in a gradual manner (as it did with Karnataka).
Mining in Goa is concentrated with 5-6 large players – given substantial underutilised capacity with these miners, disbursements will take time to pick up. CV operators have been badly affected as their work is on contract basis and vehicles are lying idle. Resumption of mining loads will help these small CV operators.
Asset quality should improve gradually from Q1FY16 onwards while disbursements in the state may pick up from late FY16 only. We believe it will take 2-3 years to reach disbursement levels achieved in FY08/FY09.
Trends are better in Gujarat and Rajasthan due to higher spending by the state on infrastructure projects
Mining ban and economic slowdown have hit the region badly and improvement will be very slow

SREI Infrastructure Finance CE lending industry still not out of the woods
Visit Note INDIA NBFC
25 March 2015 Page 77 of 82
Southern India – disturbing trends Players have indicated that the southern market typically enjoys better growth and
asset quality trends than the rest of India. However, in this cycle, delinquencies have been higher in southern India even as disbursements remain poor.
Operators indicate that a lot of work done by public works departments (PWD) has stopped in Tamil Nadu and Kerala. The real estate sector has also slowed down considerably and this is exacting a toll on CV/CE players.
In Tamil Nadu, state government interest in the infrastructure/industrial sectors has dwindled and current disbursements by CV/CE lenders are only 25% of the FY08/FY09 numbers. Also, 90-DPD customers have increased to 20-22% of total loans compared to 6-8% in FY08 in some branches in Tamil Nadu.
In Andhra Pradesh, disbursement and asset quality have taken a severe hit due to political turbulence (the Telangana divide) over the last two years. Many large infrastructure companies are facing a financial crunch as government departments are not clearing their dues. Fleet operators are also defaulting on loans.
Players are hopeful that with a new government at the centre and state, infrastructure activities will pick up going forward. However, meaningful improvement is still a year away, in our view.
Eastern India – trends mimic rest of India CV/CE demand mainly comes from road, mining and urban development – all sectors
that remain largely under-developed in India’s eastern markets and hence this region contributes only ~20% of the industry loan book.
Roads and mining activities have been embroiled in environmental/legal hurdles for the last year and a half and disbursements are only 20-25% of FY08/FY09 levels. Coal India’s coal production was down 20-22% in the last year which affected CV/CE utilisation rates. In Orissa, due to the SC order, only 7-8 mines are operational (the others will start with a lag).
Many NBFCs and unorganised players have exited the market in the last one year and hence pricing has improved. Companies are getting better collaterals and loan disbursements are earning higher yields.
CV lenders indicate that forward-flow delinquencies have stabilised in the last 2-3 months and bucket movements (from say 30-DPD to 60-DPD, or 60-DPD to 90-DPD) for NPL accounts have ceased.
Improvement in mining activities (recent coal auctions) and revival in the road sector will drive growth going forward. We expect the pick-up to be slow in the next 2-3 quarters but thereafter momentum will improve led by new projects expected to be announced in Q1/Q2FY16.
Southern India showing highest asset quality deterioration as compared to other regions
Things are stabilising and mining activities are expected to improve from Q1/Q2FY16

SREI Infrastructure Finance CE lending industry still not out of the woods
Visit Note INDIA NBFC
25 March 2015 Page 78 of 82
SREI a market leader in CE financing SREI started operations in 1989 and currently has a 50:50 JV with BNP Paribas for infrastructure equipment finance. The SREI-BNP JV is a market leader in equipment financing with 30% market share and a presence across the value chain of infrastructure equipment. The JV has interests in QUIPPO (India’s largest equipment rental company) and an 18% stake in VIOM networks (independent tower company with +40K towers). It also lends to infrastructure projects and has equity interest in eight road assets. The JV has a network of 86 branches spread across India.
Fig 1 - Branch network across India Fig 2 - South and West India account for 60% of branches
Source: Company Source: Company
Disbursement growth to remain sluggish
SREI’s experience over the last two decades suggests that recovery in the CE cycle always precedes growth. However, there are no clear signs of recovery and utilisation levels for equipment are still poor. Many of the company’s regional branches are achieving only a third of their peak capacity (FY08-FY10) disbursements. Therefore, a meaningful recovery in loan growth is still some time away. If there is a broad-based recovery in FY16, management expects 10-15% growth.
Fig 3 - Considerable slowdown in disbursement
Source: Company
East23%
West28%
North17%
South32%
121.7
108.0
79.0
62.0
50
60
70
80
90
100
110
120
130
FY12 FY13 FY14 9MFY15
(Rs bn) Disbursements (Rs bn)
SREI-BNP JV holds 30% market share in equipment finance
Many branches achieving only a third of their peak capacity disbursement

SREI Infrastructure Finance CE lending industry still not out of the woods
Visit Note INDIA NBFC
25 March 2015 Page 79 of 82
Credit costs likely to remain elevated in FY15/Q1FY16
Management stated that it has seen no improvement on the ground over the last one year, as industrial production (IIP), infrastructure spending (especially on roads) and mining activity remain lacklustre. Slippages are expected to remain elevated and credit cost high in the next 2-3 quarters. SREI is looking to improve its provision coverage ratio in coming quarters. Gross/net NPA on 90-DPD stood at 4.8%/3.6% as at end-Q3FY15.
Fig 4 - NPA increased amid poor economic growth Fig 5 - Low coverage ratio to keep credit cost high
Source: Company Source: Company
No pricing pressure; cost of funds to ease going forward
Despite weak disbursement trends, management is not seeing any pressure on lending rate (yields) as the business is rather concentrated with only a few large players. Currently, the major source of funding is bank borrowings (working capital at 52% and term loan from banks at 20%), while debentures constitute 7% of total loans (up from 3% in Q2FY15). The company is exploring new avenues to reduce the cost of funds, including higher NCD issuances.
Fig 6 - NIM to remain in the range of 4.5-5% Fig 7 - Borrowing profile highly skewed towards banks (Q3FY15)
Source: Company Source: Company
2.9% 2.8% 2.8%
4.8% 4.8%
1.8% 2.0%2.2%
3.9%3.6%
1%
2%
3%
4%
5%
6%
FY11 FY12 FY13 FY14 9MFY15
(%) Gross NPA (%) Net NPA (%)37.5%
30.0%
23.9%
18.2%
24.7%
0%
5%
10%
15%
20%
25%
30%
35%
40%
FY11 FY12 FY13 FY14 9MFY15
(%) NPA coverage ratio
4.6%
4.4% 4.4%
4.6%
5.0%
4.1%
4.2%
4.3%
4.4%
4.5%
4.6%
4.7%
4.8%
4.9%
5.0%
FY11 FY12 FY13 FY14 9MFY15
(%)
Working capital55%
Domestic term loans
21%
Foreign currency
loans10%
Subordinate debt6%
Debenture8%
No improvement on the ground over the last one year
Exploring new avenues to reduce cost of funds, including higher NCD issuances

SREI Infrastructure Finance CE lending industry still not out of the woods
Visit Note INDIA NBFC
25 March 2015 Page 80 of 82
Fig 8 - SREI Infra – P&L statement Income Statement (Rs mn) FY11 FY12 FY13 FY14
Disbursement (Rs bn) 100 122 108 79
Income from finance activities 11,161 16,661 21,470 23,800
Finance charges (excl Forex Impact) 6,552 10,263 13,578 15,324
Net interest Income 4,610 6,398 7,892 8,477 Other Income 32 7 89 14
Total Income 4,641 6,405 7,981 8,491
Operating Expenditure 1,525 2,144 2,407 2,316
Operating Profits 3,116 4,262 5,574 6,175 NPA Provision & Write off 782 1,004 1,366 2,592
Provision on Standard Asset 200 36 86 2
Forex M2M 1 176 88 5
Profit before tax 2,133 3,046 4,035 3,576
Taxes 825 1,074 1,336 1,322
PAT 1,308 1,972 2,699 2,254
Source: Company
Fig 9 - SREI Infra – Key financial ratios (%) FY11 FY12 FY13 FY14
Yield on Avg. Funds 13.8 14.7 14.8 14.6
Cost of Funds 9.7 10.6 10.9 11.2
Interest Spreads 4.1 3.9 3.8 3.5
NIM 4.6 4.4 4.4 4.6
Gross NPA 2.9 2.8 2.8 4.8
Net NPA 1.8 2.0 2.2 3.9
Return on Avg. Net Worth 12.6 15.3 16.5 11.3
Return on Avg. Assets on Books 1.6 1.7 1.8 1.3
Return on Avg. Capital Empl. 12.0 12.0 12.0 12.0
Leverage 7.0 7.4 7.2 6.2
CAR 15.8 16.9 16.2 17.1
Source: Company

25 March 2015 Page 81 of 82
RESEARCH TEAM
ANALYST SECTOR EMAIL TELEPHONE
Mihir Jhaveri Auto, Auto Ancillaries, Cement, Logistics [email protected] +91 22 6766 3459
Prateek Kumar Auto, Auto Ancillaries, Cement, Logistics [email protected] +91 22 6766 3435
Misal Singh Capital Goods, Infrastructure, Utilities [email protected] +91 22 6766 3466
Gaurang Kakkad Consumer [email protected] +91 22 6766 3470
Premal Kamdar Consumer [email protected] +91 22 6766 3469
Nitin Tiwari Energy [email protected] +91 22 6766 3437
Parag Jariwala Financials [email protected] +91 22 6766 3442
Rumit Dugar IT, Telecom, Media [email protected] +91 22 6766 3444
Karan Taurani IT, Telecom, Media [email protected] +91 22 6766 3445
Pritesh Jani Metals [email protected] +91 22 6766 3467
Arun Baid Mid-caps [email protected] +91 22 6766 3446
Praful Bohra Pharmaceuticals [email protected] +91 22 6766 3463
Arun Aggarwal Real Estate [email protected] +91 22 6766 3440
Pawan Parakh Utilities [email protected] +91 22 6766 3438
Prerna Singhvi Strategy & Economics [email protected] +91 22 6766 3413

25 March 2015 Page 82 of 82
RESEARCH DISCLAIMER
Important Disclosures This report was prepared, approved, published and distributed by a Religare Capital Markets (“RCM”) group company located outside of the United States (a “non-US Group Company”). This report is distributed in the U.S. by Enclave Capital LLC (“Enclave Capital”), a U.S. registered broker dealer, on behalf of RCM only to major U.S. institutional investors (as defined in Rule 15a-6 under the U.S. Securities Exchange Act of 1934 (the “Exchange Act”)) pursuant to the exemption in Rule 15a-6 and any transaction effected by a U.S. customer in the securities described in this report must be effected through Enclave Capital. Neither the report nor any analyst who prepared or approved the report is subject to U.S. legal requirements or the Financial Industry Regulatory Authority, Inc. (“FINRA”) or other regulatory requirements pertaining to research reports or research analysts. No non-US Group Company is registered as a broker-dealer under the Exchange Act or is a member of the Financial Industry Regulatory Authority, Inc. or any other U.S. self-regulatory organization. Subject to any applicable laws and regulations at any given time, non-US Group Companies, their affiliates or companies or individuals connected with RCM (together, “Connected Companies”) may make investment decisions that are inconsistent with the recommendations or views expressed in this report and may have long or short positions in, may from time to time purchase or sell (as principal or agent) or have a material interest in any of the securities mentioned or related securities or may have or have had a business or financial relationship with, or may provide or have provided investment banking, capital markets and/or other services to, the entities referred to herein, their advisors and/or any other connected parties. Any particular arrangements or relationships are disclosed below. As a result, recipients of this report should be aware that Connected Companies may have a conflict of interest that could affect the objectivity of this report. See “Special Disclosures” for certain additional disclosure statements, if applicable. This report is only for distribution to investment professionals and institutional investors. Analyst Certification Each of the analysts identified in this report certifies, with respect to the companies or securities that the individual analyses, that (1) the views expressed in this report reflect his or her personal views about all of the subject companies and securities and (2) no part of his or her compensation was, is or will be directly or indirectly dependent on the specific recommendations or views expressed in this report. Analysts and strategists are paid in part by reference to the profitability of RCM. Stock Ratings are defined as follows Recommendation Interpretation (Recommendation structure changed with effect from March 1, 2009)
Recommendation Expected absolute returns (%) over 12 months Buy More than 15% Hold Between 15% and –5% Sell Less than –5%
Expected absolute returns are based on the share price at market close unless otherwise stated. Stock recommendations are based on absolute upside (downside) and have a 12-month horizon. Our target price represents the fair value of the stock based upon the analyst’s discretion. We note that future price fluctuations could lead to a temporary mismatch between upside/downside for a stock and our recommendation. Stock Ratings Distribution As of 1 March 2015, out of 190 rated stocks in the RCM coverage universe, 106 have BUY ratings (including 5 that have been investment banking clients in the last 12 months), 61 are rated HOLD and 23 are rated SELL. Research Conflict Management Policy RCM research has been published in accordance with our conflict management policy, which is available here. Disclaimers This report is not directed to, or intended for distribution to or use by, any person or entity who is a citizen or resident of or located in any locality, state, country or other jurisdiction where such distribution, publication, availability or use would be contrary to law or regulation or which would subject RCM to any registration or licensing requirement within such jurisdiction(s). This report is strictly confidential and is being furnished to you solely for your information. All material presented in this report, unless specifically indicated otherwise, is under copyright to RCM. None of the material, its content, or any copy of such material or content, may be altered in any way, transmitted, copied or reproduced (in whole or in part) or redistributed in any form to any other party, without the prior express written permission of RCM. All trademarks, service marks and logos used in this report are trademarks or service marks or registered trademarks or service marks of RCM or its affiliates, unless specifically mentioned otherwise. The information, tools and material presented in this report are provided to you for information purposes only and are not to be used or considered as an offer or the solicitation of an offer to sell or to buy or subscribe for securities or other financial instruments. RCM has not taken any steps to ensure that the securities referred to in this report are suitable for any particular investor. RCM will
not treat recipients as its customers by virtue of their receiving the report. The investments or services contained or referred to in this report may not be suitable for you and it is recommended that you consult an independent investment advisor if you are in doubt about such investments or investment services. In addition, nothing in this report constitutes investment, legal, accounting or tax advice or a representation that any investment or strategy is suitable or appropriate to your individual circumstances or otherwise constitutes a personal recommendation to you. Information and opinions presented in this report were obtained or derived from sources that RCM believes to be reliable, but RCM makes no representations or warranty, express or implied, as to their accuracy or completeness or correctness. RCM accepts no liability for loss arising from the use of the material presented in this report, except that this exclusion of liability does not apply to the extent that liability arises under specific statutes or regulations applicable to RCM. This report is not to be relied upon in substitution for the exercise of independent judgment. RCM may have issued, and may in the future issue, a trading call regarding this security. Trading calls are short term trading opportunities based on market events and catalysts, while stock ratings reflect investment recommendations based on expected absolute return over a 12-month period as defined in the disclosure section. Because trading calls and stock ratings reflect different assumptions and analytical methods, trading calls may differ directionally from the stock rating. Past performance should not be taken as an indication or guarantee of future performance, and no representation or warranty, express or implied, is made regarding future performance. Information, opinions and estimates contained in this report reflect a judgment of its original date of publication by RCM and are subject to change without notice. The price, value of and income from any of the securities or financial instruments mentioned in this report can fall as well as rise. The value of securities and financial instruments is subject to exchange rate fluctuation that may have a positive or adverse effect on the price or income of such securities or financial instruments. Investors in securities such as ADR’s, the values of which are influenced by currency volatility, effectively assume this risk. This report is distributed in India by Religare Capital Markets Limited, which is a registered intermediary regulated by the Securities and Exchange Board of India. In Dubai, it is being distributed by Religare Capital Markets (Hong Kong) Limited (Dubai Branch) which is licensed and regulated by the Dubai Financial Services Authority. In Singapore, it is being distributed (i) by Religare Capital Markets (Singapore) Pte. Limited (“RCMS”) (Co. Reg. No. 200902065N) which is a holder of a capital markets services licence and an exempt financial adviser in Singapore and (ii) solely to persons who qualify as ““institutional investors” or “accredited investors” as defined in section 4A(1) of the Securities and Futures Act, Chapter 289 of Singapore (the “SFA”). Pursuant to regulations 33, 34, 35 and 36 of the Financial Advisers Regulations (the “FAR”), sections 25, 27 and 36 of the Financial Advisers Act, Chapter 110 of Singapore shall not apply to RCMS when providing any financial advisory service to an accredited investor, or “overseas investor” (as defined in regulation 36 of the FAR). Persons in Singapore should contact RCMS in respect of any matters arising from, or in connection with this publication/communication. In Hong Kong, it is being distributed by Religare Capital Markets (Hong Kong) Limited (“RCM HK”), which is licensed and regulated by the Securities and Futures Commission, Hong Kong. In Australia, it is being distributed by RCMHK which is approved under ASIC Class Orders. In Sri Lanka, it is being distributed by Bartleet Mallory Stockbrokers, which is licensed under Securities and Exchange Commission of Sri Lanka. If you wish to enter into a transaction please contact the RCM entity in your home jurisdiction unless governing law provides otherwise. In jurisdictions where RCM is not registered or licensed to trade in securities, transactions will only be effected in accordance with applicable securities legislation which may vary from one jurisdiction to another and may require that the trade be made in accordance with applicable exemptions from registration or licensing requirements. Religare Capital Markets does and seeks to do business with companies covered in our research report. As a result, investors should be aware that the firm may have a conflict of interest that could affect the objectivity of research produced by Religare Capital Markets. Investors should consider our research as only a single factor in making their investment decision. Any reference to a third party research material or any other report contained in this report represents the respective research organization's estimates and views and does not represent the views of RCM and RCM, its officers, employees do not accept any liability or responsibility whatsoever with respect to its accuracy or correctness and RCM has included such reports or made reference to such reports in good faith. This report may provide the addresses of, or contain hyperlinks to websites. Except to the extent to which the report refers to material on RCM’s own website, RCM takes no responsibility whatsoever for the contents therein. Such addresses or hyperlinks (including addresses or hyperlinks to RCM’s own website material) is provided solely for your convenience and information and the content of the linked site does not in any way form part of this report. Accessing such website or following such link through this report or RCM’s website shall be at your own risk. Special Disclosures (if applicable) Not Applicable