indian labour journal -...
TRANSCRIPT

ISSN 0019-5723
INDIAN LABOUR JOURNAL (A MONTHLY PUBLICATION)
Volume 55 January 2014 No. 1
GOVERNMENT OF INDIA
MINISTRY OF LABOUR AND EMPLOYMENT
LABOUR BUREAU
SHIMLA/CHANDIGARH
EDITORIAL COMMITTEE
Chairman Daljeet Singh
Editor I.S.Negi
Associate Editor R.C.Jarial
Staff Writers
Laxmi Kant
Ravinder Kumar
NOTE TO CONTRIBUTORS
Non-controversial articles on labour matters of topical interest (e.g. labour and
wage policy; industrial relations; industrial management; trade union movement; labour
welfare; workers‘ participation in management; employment/ unemployment; labour
research of empirical value and of general interest etc.) are accepted for publication in
the Journal. The articles generally not exceeding ten thousand words may be sent in a
floppy diskette of 3.5‖ or C.D in Microsoft Word only with a print out in double space
on one side foolscap paper, addressed to the Director General, Labour Bureau,
‗Cleremont‘, Shimla -171 004 alongwith a declaration by the author that the article has
neither been published nor submitted for publication elsewhere. All references and
footnotes, may be given only at the end of the articles.
Authors are solely responsible for the factual accuracy and the opinion
expressed in their signed articles. The Labour Bureau, however, reserves the right to
edit, amend and delete any portion of the article with a view to make it more
presentable and to reject any article, if not found suitable. The articles which are
rejected will not be returned and no correspondence will be entertained on the articles
which are rejected by the Editorial Committee.
A copy of the Journal, in which the article appears, is supplied to the author.
An honorarium up to Rs. 1,000 is also payable as per rules for each article published.
Our address: The Director General, Labour Bureau ‘Cleremont’, Shimla 171 004
Fax No: 0177-2655253 Website: http://labourbureau.nic.in E-mail [email protected], [email protected]

PREFACE
―The Indian Labour Journal‖ earlier known as ―Indian Labour Gazette‖ is a monthly publication being brought out since July, 1943. This publication is the only official publication of its kind in the country disseminating latest labour statistics and research in the field of labour which has immense utility for diverse stakeholders such as Employers‘ and Employees‘ Organizations, Research Scholars, Central and State Governments, Autonomous Bodies, Courts, Universities etc.
The Journal normally contains matters of interest on labour such as Labour Activities, News about Indian & Foreign Labour, Labour Decisions, Labour Literature and Labour Statistics. But, at times, non controversial articles on labour matters of topical interest and the gist of the Reports, Enquiries & Studies conducted by Labour Bureau are also published.
Suggestions for further improvement of the publication are welcome.
DALJEET SINGH
DIRECTOR GENERAL
LABOUR BUREAU,
SHIMLA-171004

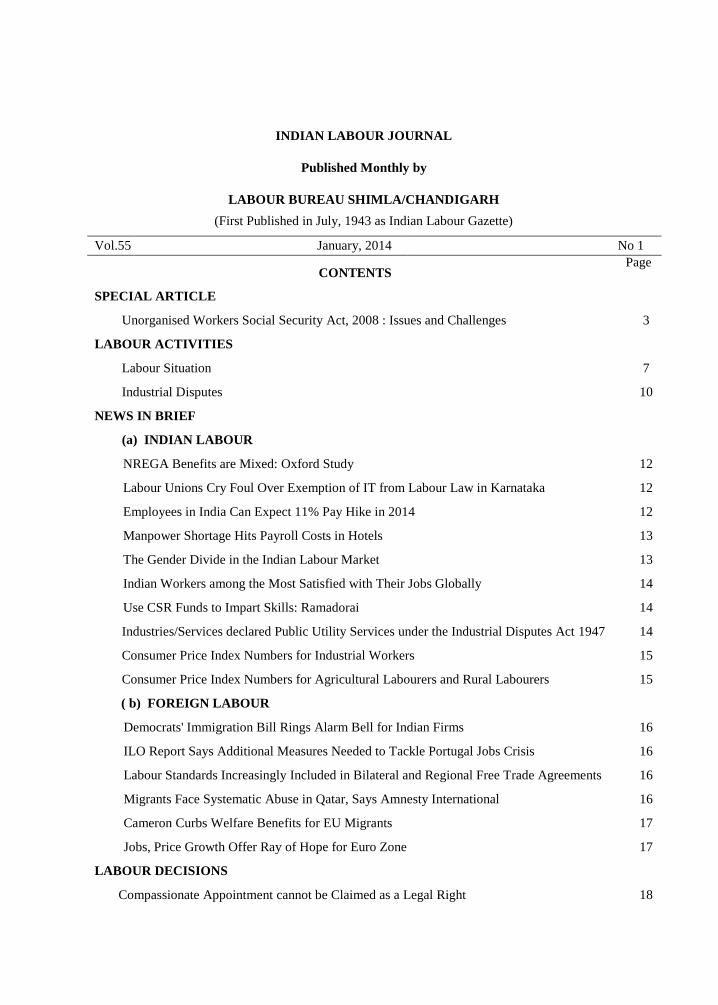
INDIAN LABOUR JOURNAL
Published Monthly by
LABOUR BUREAU SHIMLA/CHANDIGARH
(First Published in July, 1943 as Indian Labour Gazette)
Vol.55 January, 2014 No 1
CONTENTS Page
SPECIAL ARTICLE
Unorganised Workers Social Security Act, 2008 : Issues and Challenges 3
LABOUR ACTIVITIES
Labour Situation 7
Industrial Disputes 10
NEWS IN BRIEF
(a) INDIAN LABOUR
NREGA Benefits are Mixed: Oxford Study 12
Labour Unions Cry Foul Over Exemption of IT from Labour Law in Karnataka 12
Employees in India Can Expect 11% Pay Hike in 2014 12
Manpower Shortage Hits Payroll Costs in Hotels 13
The Gender Divide in the Indian Labour Market 13
Indian Workers among the Most Satisfied with Their Jobs Globally 14
Use CSR Funds to Impart Skills: Ramadorai 14
Industries/Services declared Public Utility Services under the Industrial Disputes Act 1947 14
Consumer Price Index Numbers for Industrial Workers 15
Consumer Price Index Numbers for Agricultural Labourers and Rural Labourers 15
( b) FOREIGN LABOUR
Democrats' Immigration Bill Rings Alarm Bell for Indian Firms 16
ILO Report Says Additional Measures Needed to Tackle Portugal Jobs Crisis 16
Labour Standards Increasingly Included in Bilateral and Regional Free Trade Agreements 16
Migrants Face Systematic Abuse in Qatar, Says Amnesty International 16
Cameron Curbs Welfare Benefits for EU Migrants 17
Jobs, Price Growth Offer Ray of Hope for Euro Zone 17
LABOUR DECISIONS
Compassionate Appointment cannot be Claimed as a Legal Right 18

Indian Labour Journal, January 2014
2
LABOUR LITERATURE
Important Articles of Labour Interest Published in the Periodicals Received in the Labour
Bureau
19
STATISTICS
Section A- Monthly Statistics 23
Section B- Serial Statistics 65
List of Labour Bureau Publications Brought Out during the year 2013
Index to the Indian Labour Journal, Volume 54, January to December 2013
94
95
ANY REPRODUCTION FROM THE JOURNAL SHOULD BE SUITABLY ACKNOWLEDGED
Subscription and complaints, if any, regarding the distribution of the Indian
Labour Journal should be sent only to
THE CONTROLLER OF PUBLICATIONS, CIVIL LINES, DELHI 110054
Pre-payable subscription rates for the Indian Labour Journal
Annual Rate of Subscription Rs.960.00
Sale per copy Rs. 80.00

Indian Labour Journal, January 2014
3
SPECIAL ARTICLE
Unorganised Workers Social Security Act, 2008 : Issues and Challenges
Shivali, NUSRL1
Unorganised or informal sector constitutes a pivotal part of the Indian economy. More than 90 per cent of workforce and about 50 per cent of the national product are accounted for by the informal economy. The high level of growth of the Indian economy during the past two decades is accompanied by increasing informalisation. There are indications of growing interlinkages between informal and formal economic activities. There has been new dynamism of the informal economy in terms of output, employment and earnings. Faster and inclusive growth needs special attention to informal economy. Sustaining high levels of growth are also intertwined with improving domestic demand of those engaged in informal economy, and addressing the needs of the sector in terms of credit, skills, technology, marketing and infrastructure.
2
As a high proportion of socially and economically underprivileged sections of society are concentrated in the informal economic activities, their protection in terms of wages, working condition and social security is of utmost importance for the development of any economy. Realising the same, the provision of social protection has also been enshrined in Articles 38 (securing a social order for the promotion of welfare of the people), 39 (certain principles of policy), 41 (right to work, education and public assistance in certain cases), 42 (just and human conditions of work and maternity relief) and 43 (living wage etc.) of the Constitution of India as a part of the Directive Principles of State Policy.
There are different segment in the labour market which can be divided into unorganised, organised, wage earners, self employed, skilled, semi skilled, unskilled and so on. Though there are different laws and regulations to facilitate them in achieving various welfare objectives many segments still need such regulations which could protect decency, regulate working conditions and provide social security. The meaning of social security however keep changing throughout the life of a worker as the perception also keep changing with the age of the person.
3
The labour laws can be enacted by both the Central and the State Governments as labour is the subject in the concurrent list under the Indian constitution. The Ministry of Labour and Employment
4 consisting of eight divisions; social security, emigration, industrial relations,
child and women labour, labour welfare, economics and statistics, international labour affairs, and labour conference, is mainly responsible for protecting and safeguarding the interests of workers through enactment and implementation of various labour laws. Each state government also has a labour department that may implement labour laws within its jurisdiction. Consequently, there is large number of labour related laws enacted by the Central Governments and also by the State Governments. Besides, important social security, poverty alleviation and social welfare measures are also being implemented by various Ministries/Departments of State Governments and by civil society organisations.
In April 2000, USDOL5 signed a Memorandum of Understanding with the Indian
Ministry of Labour to provide technical assistance in five areas: the elimination of child labour, prevention of HIV/AIDS in the workplace, improvement in mines safety, provision of decent employment for women, and labour market information systems.
Despite all the efforts stated above, there is deficit in the coverage of unorganized sector workers in the matter of labour welfare and social security measures.
1 2
nd Year Student of B.A.(H), L.L.B. (H) at National University of Study and Research in Law,
Ranchi.
Indian Labour Journal, January 2014
4
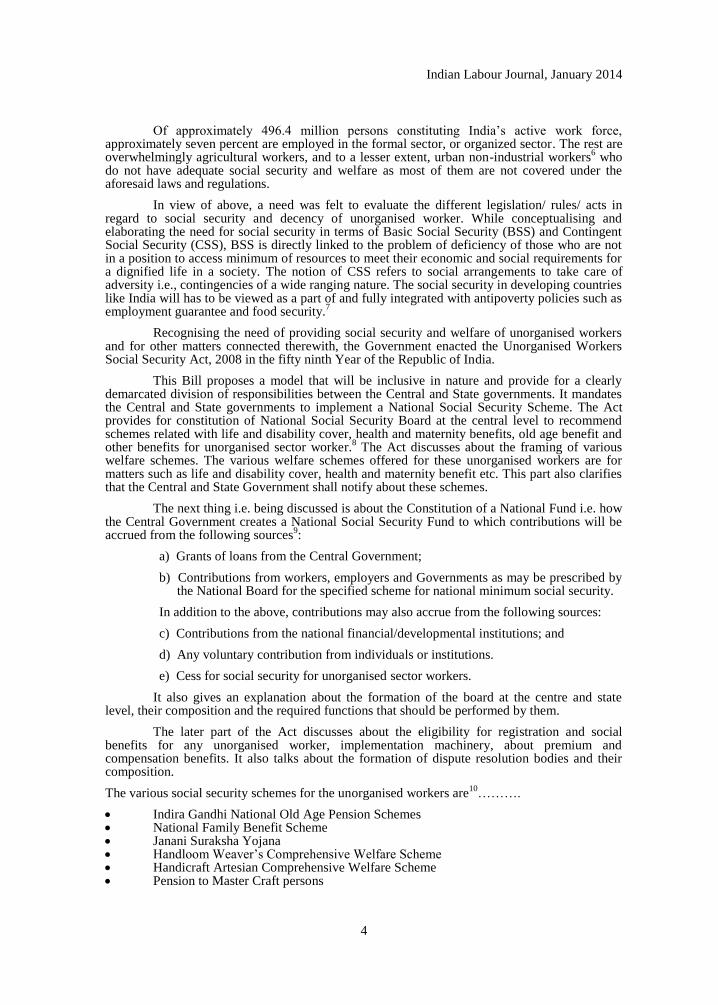
Of approximately 496.4 million persons constituting India‘s active work force, approximately seven percent are employed in the formal sector, or organized sector. The rest are overwhelmingly agricultural workers, and to a lesser extent, urban non-industrial workers
6 who
do not have adequate social security and welfare as most of them are not covered under the aforesaid laws and regulations.
In view of above, a need was felt to evaluate the different legislation/ rules/ acts in regard to social security and decency of unorganised worker. While conceptualising and elaborating the need for social security in terms of Basic Social Security (BSS) and Contingent Social Security (CSS), BSS is directly linked to the problem of deficiency of those who are not in a position to access minimum of resources to meet their economic and social requirements for a dignified life in a society. The notion of CSS refers to social arrangements to take care of adversity i.e., contingencies of a wide ranging nature. The social security in developing countries like India will has to be viewed as a part of and fully integrated with antipoverty policies such as employment guarantee and food security.
7
Recognising the need of providing social security and welfare of unorganised workers and for other matters connected therewith, the Government enacted the Unorganised Workers Social Security Act, 2008 in the fifty ninth Year of the Republic of India.
This Bill proposes a model that will be inclusive in nature and provide for a clearly demarcated division of responsibilities between the Central and State governments. It mandates the Central and State governments to implement a National Social Security Scheme. The Act provides for constitution of National Social Security Board at the central level to recommend schemes related with life and disability cover, health and maternity benefits, old age benefit and other benefits for unorganised sector worker.
8 The Act discusses about the framing of various
welfare schemes. The various welfare schemes offered for these unorganised workers are for matters such as life and disability cover, health and maternity benefit etc. This part also clarifies that the Central and State Government shall notify about these schemes.
The next thing i.e. being discussed is about the Constitution of a National Fund i.e. how the Central Government creates a National Social Security Fund to which contributions will be accrued from the following sources
9:
a) Grants of loans from the Central Government;
b) Contributions from workers, employers and Governments as may be prescribed by the National Board for the specified scheme for national minimum social security.
In addition to the above, contributions may also accrue from the following sources:
c) Contributions from the national financial/developmental institutions; and
d) Any voluntary contribution from individuals or institutions.
e) Cess for social security for unorganised sector workers.
It also gives an explanation about the formation of the board at the centre and state level, their composition and the required functions that should be performed by them.
The later part of the Act discusses about the eligibility for registration and social benefits for any unorganised worker, implementation machinery, about premium and compensation benefits. It also talks about the formation of dispute resolution bodies and their composition.
The various social security schemes for the unorganised workers are10
……….
Indira Gandhi National Old Age Pension Schemes National Family Benefit Scheme Janani Suraksha Yojana Handloom Weaver‘s Comprehensive Welfare Scheme Handicraft Artesian Comprehensive Welfare Scheme Pension to Master Craft persons

Indian Labour Journal, January 2014
5
National Scheme for Welfare of Fishermen and Training and Extension. Janshree Bima Yojana Aam Admi Bima Yojana Rashtriya Swathya Bima Yojana
According to the commitments of the Government of India, right of workers to social security has been recognised as inalienable and, therefore, must accrue to every worker under any system of labour law or labour policy.
However, even after making such act the reality remains the same. The workers of these unorganised sectors don‘t have access to these social security benefits. Though the Unorganised Worker Social Security Act was passed in 2008, there has been dismal progress. The Act has been criticized on several grounds such as for not defining a minimum social security floor that is enforceable by law and for not providing institutional power to ensure effective implementation. Even the National Social Security Board for Unorganised Worker which was constituted in August, 2009 is limited to an advisory role and doesn‘t have sufficient power to implement, monitor or enforce social security.
The effectiveness of the Act and related issues and challenges can be examined on the basis of five essential characteristics namely coverage, benefits, financing, delivery and administration.
The Act is premised on a clear distinction between ‗organised‘ and ‗unorganised‘ sectors, despite the contrary argument that such firm distinctions cannot be drawn and these form a continuum with clear inter linkage.
11 The term unorganised worker should be as inclusive
as possible since the impact of exclusion error is far higher than the inclusion error. This point also has support of the statement of Standing committee that any class of workers, who otherwise entitled for social security coverage, should be not left out merely because his class of worker have not been included in the definition.
As in India 92% 12
of the working population belongs to Unorganised Sector therefore it is prudent to define and declare some clear and wide definition of unorganised worker. NAC defined unorganised worker as “everyone excluding those already registered with and covered by the existing PF and ESIC schemes, are self employed but well off or are income tax payer.”
Migrant workers, women workers and disadvantaged groups should be explicitly mentioned in the initial coverage of workers. The definition exclude workers dependent on livelihood systems- like forest workers and fishermen, who could not be brought within the ambit of ‗home based worker‘, ‗self employed worker‘ and ‗wage worker‘. Essential working condition needs of these workers such as security and physical safety should be considered and covered by this Act. The Act does not give any clarity on what State means by ‗social security‘. Social Security not only means rights but should also contain the principles and rules present in the constitution.
The next important point under this is that the access to social security should be universal across all unorganised workers irrespective of the financial status of the workers or position in respect of their position in the poverty list.
The Act should have a clear definition of social security as measures by the government in collaboration with employer, worker or otherwise, designed to meet the contingencies in life of a worker including old age pension, unemployment benefits, maternity, livelihood loss compensation, accident and medical care and child care support.
The Act should have an additional chapter to include the Right to Working Conditions as an essential right of the worker.
The Act should have a separate section that defines the existence and nature of the National Social Security Fund and appropriate mechanisms at the state level to ensure that there‘s clear financing support to address the social security needs of the workers. It is also important to define an enforceable timeline realize the fund both at the national and state level.
In the Act there is no specified way to address the issues to any Grievance Redressal (with penalties) and dispute settlement forum. The grievance redressal should be based on the tri

Indian Labour Journal, January 2014
6
party model of employers, worker representatives and the government. Such a grievance redressal mechanism should not only be limited to the district level but also extend to the block level so that it is accessible to the workers.
There should also be emphasis on the role of Worker Facilitation Centres and defined modalities on how WFCs can be run collaboratively by the Government and local community organisation. All the essential schemes that comprise the social security cover will be brought under the ambit of the Ministry of Labour so that there‘s clear and one point accountability for delivery.
In the Act there is no mention of any Livelihood rights and it is also not mentioned in the list of schemes under Section 3(1). The Act should also give required attention to those individuals and groups, who have traditionally faced difficulties in exercising rights. There is no provision for penalties in the Act to punish those employers who violate it.
To conclude it can be said that the Unorganised Worker Social Security Act 2008 is a collection of piece meal schemes without any logic leaving behind vast numbers of vulnerable workers to fend for themselves. There is need to create a social floor consisting of a national minimum social security, minimum conditions of work and a national minimum wage so that no one is allowed to fall below this floor.
The new legislation can, however, be taken as a beginning – an opportunity to raise working class struggles to newer heights by involving crore of unorganized workers. The 2008 Act appears to have excluded vast sections of unorganized workers like agricultural labourers, the unorganized labourers in the organised sector including contract labourers and the informal labourers in the formal sector, the anganwadi workers, para workers like ASHAs and para teachers, and those in the cooperative sector.
So by analysing the flaws and benefits of this Act anyone can easily say that it is a beginning for bigger struggles of those unorganised workers rather than getting a solution to their problems.
Notes and References 2 Report of the Committee on Unorganised Sector Statistics by National Statistical Commission Government of India February 2012 (http://mospi.nic.in/mospi_new/upload/nsc_report_un_sec_14mar12.pdf?status=1&menu_id=199) accessed on 1.06.2013 3 Paper WORKER‘S LIFE, WORK AND DECENCY : NEEDED REGULATORY MEASURES IN INDIA by DR. BALWINDER SINGH for ILO seminar from 8-10 July, 2009 at Geneva, Switzerland. 4 http://labour.nic.in/ accessed on 1/06/2013 5 United Nation Department of Labour http://www.dol.gov/ accessed on 1/06/2013 6 http://www.dol.gov/ilab/media/reports/flt/2006India.pdf accessed on 2/06/2013 7 The paper THE LONG ROAD TO SOCIAL SECURITY by K.P. Kannan and Jan Breman http://www.sasnet.lu.se/sites/default/files/content/ht2012/kannan__breman_flyer.pdf 8 Statement of Object and Reason of the Act 9 Chapter III of the Act 10 SCHEDULE 1 Unorganised Workers Social Security Act, 2008 11 Suggested Amendments to the Unorganised Worker‘s Social Security Act, 2008 12 National Commission for Enterprises in Unorganised Sector Report 2007 and 2008

Indian Labour Journal, January 2014
7
LABOUR ACTIVITIES
LABOUR SITUATION
Information relating to Closures, Retrenchments and Lay-offs in respect of various
States/Union Territories in the country for the month of January to October 2013 (Provisional)
received in the Bureau upto 29th
November, 2013 is presented in the following Tables:-
Table-I
State-wise Number of Permanent Closures and Workers Affected during January to October, 2013 (P)
States/Union Territories No. of Units No. of Workers Affected
1. Goa 3 151
2. Karnataka 1 36
3. Tripura
17
148
Total :State Sphere
Central Sphere
Grand Total
21
(-)
21
335
(-)
335
Table-II
Industry-wise Number of Permanent Closures and Workers Affected during January to October, 2013 (P)
Section
NIC-2008
Description No. of Units
No. of Workers
Affected
A Agriculture, Forestry and fishing
1 7
C Manufacturing 13 261
F Construction 1 36
G Wholesale and retail trade, Repair of motor vehicles and motorcycles
5 27
I Accommodation and Food Service activities
1 4
Total : State Sphere
Central Sphere
Grand Total
21
(-)
21
335
(-)
335
(P): Provisional
- : Nil.
Note: Information within brackets relate to Central Sphere.
Indian Labour Journal, January 2014
8
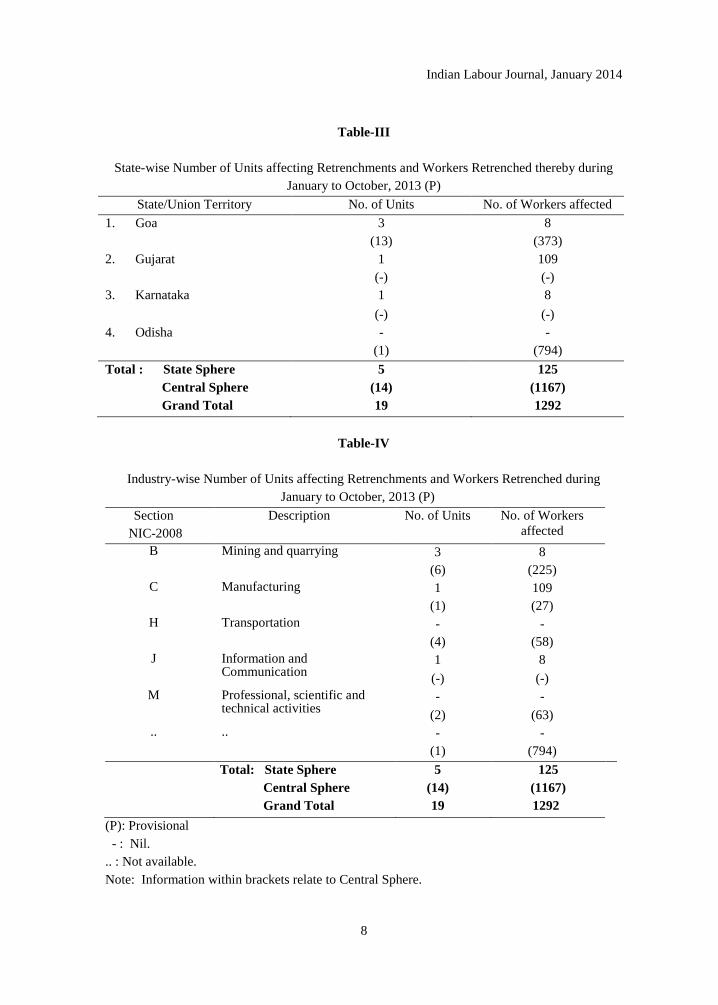
Table-III
State-wise Number of Units affecting Retrenchments and Workers Retrenched thereby during
January to October, 2013 (P)
State/Union Territory No. of Units No. of Workers affected
1. Goa 3 8
(13) (373)
2. Gujarat 1 109
(-) (-)
3. Karnataka 1 8
(-) (-)
4. Odisha - -
(1) (794)
Total : State Sphere 5 125
Central Sphere (14) (1167)
Grand Total 19 1292
Table-IV
Industry-wise Number of Units affecting Retrenchments and Workers Retrenched during
January to October, 2013 (P)
Section
NIC-2008
Description No. of Units No. of Workers
affected
B Mining and quarrying 3 8
(6) (225)
C Manufacturing 1 109
(1) (27)
H Transportation - -
(4) (58)
J Information and Communication
1 8
(-) (-)
M Professional, scientific and technical activities
- -
(2) (63)
.. .. - -
(1) (794)
Total: State Sphere 5 125
Central Sphere (14) (1167)
Grand Total 19 1292
(P): Provisional
- : Nil.
.. : Not available.
Note: Information within brackets relate to Central Sphere.
Indian Labour Journal, January 2014
9
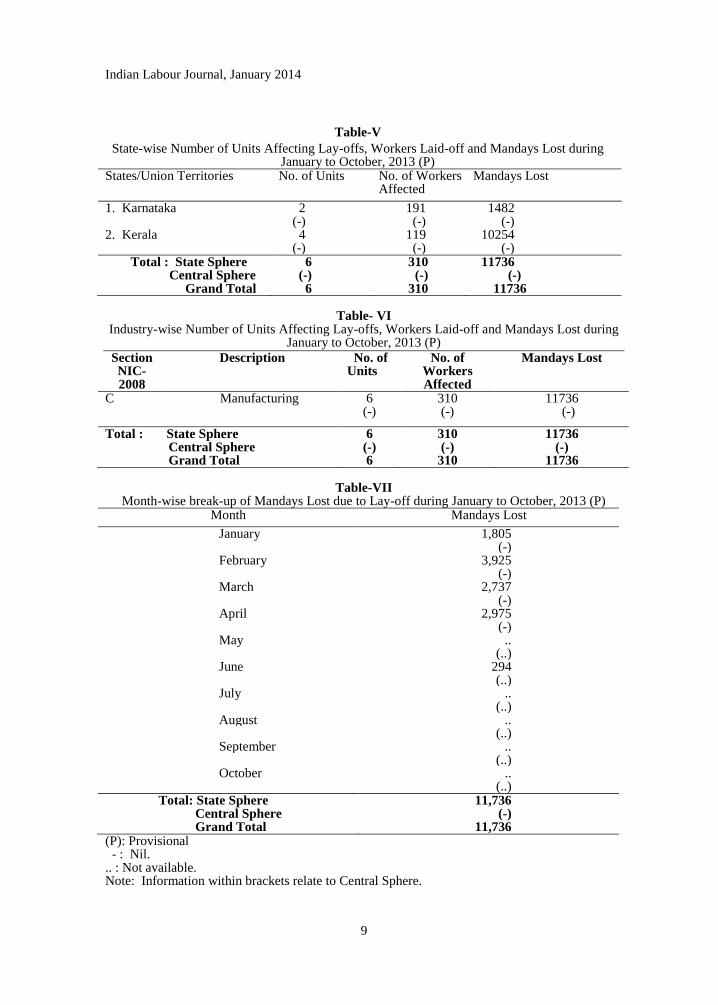
Table-V
State-wise Number of Units Affecting Lay-offs, Workers Laid-off and Mandays Lost during January to October, 2013 (P)
States/Union Territories No. of Units No. of Workers Affected
Mandays Lost
1. Karnataka 2 (-)
191 (-)
1482 (-)
2. Kerala 4 (-)
119 (-)
10254 (-)
Total : State Sphere Central Sphere
Grand Total
6 (-) 6
310 (-) 310
11736 (-) 11736
Table- VI
Industry-wise Number of Units Affecting Lay-offs, Workers Laid-off and Mandays Lost during January to October, 2013 (P)
Section NIC-2008
Description No. of Units
No. of Workers Affected
Mandays Lost
C Manufacturing 6 (-)
310 (-)
11736 (-)
Total : State Sphere Central Sphere Grand Total
6 (-) 6
310 (-)
310
11736 (-)
11736
Table-VII Month-wise break-up of Mandays Lost due to Lay-off during January to October, 2013 (P)
Month Mandays Lost
January 1,805 (-)
February 3,925 (-)
March 2,737 (-)
April 2,975 (-)
May .. (..) June 294 (..) July .. (..) August .. (..) September .. (..) October .. (..)
Total: State Sphere Central Sphere Grand Total
11,736 (-)
11,736 (P): Provisional - : Nil. .. : Not available. Note: Information within brackets relate to Central Sphere.

Indian Labour Journal, January 2014
10
Industrial Disputes during January to October, 2013 (Provisional)
The statistics of work-stoppages due to Industrial Disputes during January to October
2013 based on the returns received from different State Labour Departments / Regional Labour
Commissioners (Central) are presented in the following tables:
As per available information 146 Industrial Disputes resulting in work-stoppages were
reported during January to October, 2013 in which 718465 workers were involved and 2619830
mandays lost were reported. Besides, there were 12 disputes which occurred due to reasons
other than Industrial Disputes also. In the said disputes 6497 workers were involved and
1401628 mandays were lost.
Table VIII
Number of Mandays Lost on Account of Work-stoppages during January to October,
2012 and 2013
Number of Mandays Lost on Account of
Month Industrial Disputes Reasons Other Than Industrial Disputes
2012 (P) 2013 (P) 2012 (P) 2013 (P)
1 2 3 4 5
January 955165 183112 699286 148100
February 1326852 1244298 686937 143127
March 775455 165365 726032 147595
April 1119591 301501 699142 148605
May 1062006 174168 722845 141180
June 979933 240359 724445 162239
July 928402 109008 724813 168062
August 1599532 102824 699172 168600
September 972328 57576 709664 168140
October 1095409 41619 657780 5980
Total 10814673 2619830 7050116 1401628
(P) = Provisional and based on the returns /clarifications received in the Bureau till 29th
November, 2013.
- = Nil
N.B:- Figures for 2013 are not comparable with those for 2012 due to non-receipt of data from
various States / Union Territories.

Indian Labour Journal, January 2014
11
Table IX
State-wise Major* Industrial Disputes in India including Industrial Disputes
Due to Reasons other than Industrial Disputes till October, 2013 (P)
Name of the State /
Union Territory /
Sphere / Sector /
Number of
Establishments affected
Strike/
Lockout
Cause No. of
Workers
involved
No. of
Mandays
lost
(in 000‘s)
Wages
lost
(Rs. In
Lakhs)
Production
loss
(Rs. in
Lakhs)
1 2 3 4 5 6 7
CENTRAL SPHERE NIL
STATE SPHERE
Bihar
One Unit
(Private Sector)
Lockout Charter of Demands
227 419.5 .. ..
Two Units
(Private Sector)
Lockout Financial Stringency
230 476.0 .. ..
Tamil Nadu
One Unit
(Private Sector)
Strike Personnel 480 50.4 .. ..
(P) = Provisional and based on the returns /clarifications received in the Bureau till 29th
November, 2013
.. = Not reported
* = All disputes in which there was a time loss of 50,000 or more mandays during the period
under review or beginning of the disputes are classified as Major disputes
Life does not have to be perfect to be wonderful.
-Annette Funicello

Indian Labour Journal, January 2014
12
NEWS IN BRIEF
(a) INDIAN LABOUR The news items reported below have been gleaned from various official and unofficial
sources. Hence, the Labour Bureau is not in a position to vouchsafe the authenticity of the unofficial news items. NREGA Benefits are Mixed: Oxford Study - UPA‘s flagship Mahatma Gandhi National Rural Employment Guarantee scheme (NREGA) reduces child malnutrition, but only in the short term, says University of Oxford study. The first effort to analyse the effect of NREGA on child nutrition, the study was carried out on infants in 528 households in Dungarpur district of Rajasthan. During the study period, 53% of the households received payment under NREGA. ―Participation in NREGA reduced acute malnutrition, but not chronic malnutrition among infants,‖ says Manisha Nair, Weidenfield scholar at the Nuffield department of population health at the university. While NREGA wages helped families avoid starvation when agricultural jobs dried up, many mothers complained wages were paid late or not in full. This meant NREGA‘s intended benefits weren‘t delivered in full, researchers said. It appeared from focus-group discussions that drawbacks in implementation like low wages, delayed payments and corruption prevented sustainable long-term benefits, important to address chronic child malnutrition, Nair said. Ensuring timely payment could improve food security and improve NREGA‘s impact, Nair says, adding that similar studies were needed to gauge the scheme‘s impact on child nutrition in different social, economic and geographical settings.
(Hindustan Times, 03.11.2013)
Labour Unions Cry Foul Over Exemption of IT from Labour Law in Karnataka - Employee rights activists in software services industry have come out against the Karnataka government‘s recent decision to exempt the information technology sector from an onerous labour law – the Industrial Employment (Standing Orders) Act, 1946 - for another five years. Industry representatives in India's technology capital had welcomed the decision to extend the exemption from the Industrial Employment Act. According to them, the Act was archaic and not relevant to a modern, services industry such as theirs. Labour union leaders said the move will increase 'unfair practices' by IT sector employers and make them less accountable for their action. "It is yet another decision that will protect companies, whose actions are not being monitored," said Karthik Shekhar, general secretary of UNITES Professionals, a union for software industry professionals. The technology services sector contributes nearly a quarter of the state's GDP. According to the union, software companies in Bangalore often pay lower wages to female employees and women who are allowed to work-from-home are made to work for longer hours. "The legislation would have brought in some much needed monitoring in the IT sector," Shekhar said. In the absence of exemption, IT firms would have had to define wages, number of contract employees, average work hours and other conditions of employment and display it prominently near the main entrance. For over a decade, software companies in Bangalore enjoyed exemption from the law, but last year the government decided to bring this sector under the legislation. Software industry heads have been campaigning against it calling it a retrograde step as the law was initially designed for the manufacturing sector.
(The Economic Times, 07.11.2013)
Employees in India Can Expect 11% Pay Hike in 2014 - Employees at Indian companies can expect an average 11 per cent pay hike in 2014, according to a survey conducted by professional services company Towers Watson. However, after factoring in inflation, the rise would be just 2 per cent. Taking inflation into account, Japan at 0.5 per cent and India at 2 per cent are among countries offering the smallest rises, while China and Vietnam lead the way with 4.9 per cent. ―Indian companies have traditionally offered high salary increases as compared to the rest of the region, but face a paradox today. They continue to offer double digit salary increases as they deal with the challenge of attracting and retaining critical talent, but high levels of inflation end

Indian Labour Journal, January 2014
13
up eroding much of this hike,‖ said Subeer Bakshi, Director, Talent & Rewards, Towers Watson India. According to the survey, companies in Asia Pacific, including India, are finding it hard to both find and retain suitably skilled staff. One outcome of this is that more than 80 per cent of the companies surveyed in India say a larger portion of their salary budget increase allocation would go to high performers in 2014, the survey noted. The retail industry in India stands out with all respondents in the survey planning to allocate their budget to reward high performers. Reflecting the continued challenges faced by the automotive industry in India, the survey found that 10 per cent of the companies anticipate a pay freeze in 2014, compared with the overall average of 1 per cent. Also, 11 per cent plan to allocate their entire salary budget increase only to high performers, in a bid to retain top talent. Around 56 per cent respondents in the fast-moving consumer goods sector said a large portion of their budget towards salary increases would go to high performers, while 44 per cent said all employees would record the same increase in salary. The survey was conducted in July and August 2013, with around 2,700 sets of responses from companies across 20 countries in the Asia Pacific region.
(The Hindu Business Line, 13.11.2013)
Manpower Shortage Hits Payroll Costs in Hotels - The hotel industry in India is faced with a shortage of quality professionals and a sharp rise in payroll costs, and the crisis will deepen with the number of hotel rooms set to more than double in five years. "There is a lot of pressure on hotel bottom lines," says Natwar Nagar, managing director of HVS Executive Search that helps hotels recruit staff. Hoteliers say their payroll costs have almost doubled in the last three years due to higher demand for manpower. Dilip Puri, managing director at Starwood Hotels and Resorts, says that today, typically the industry payroll costs range anywhere between 20% and 30% of a company's average revenue, up from 15-17% three years ago. Companies blame this on high attrition rates across the industry, over-hiring and growing sizes of food and beverage outlets. Perhaps the biggest reason for the manpower crisis in hotel industry is that a majority of fresh hotel management graduates prefer to join allied industries. "We have seen that students from hotel management institutes move to other areas like banking sector, travel and tour operators, smaller restaurants, etc," S Kacker, principal of Institute of Hotel Management at Dadar in Mumbai, says. He says that only around 30% of the students join hotel industry, while rest move to other industries or pursue higher studies. "The main reason why students choose other sectors is due to better pay packages, working hours and conditions than hotels," Kacker says. With hotel room supply in the country estimated to increase 111% over the next five years, the manpower crisis may get a lot worse for the industry. Ashwin Shirali, regional director of human resources at Accor Hotels India, says payroll costs can go as high as 35-40% of annual revenue for a new hotel property.
(The Economic Times, 16.11.2013)
The Gender Divide in the Indian Labour Market - One of the biggest shifts in the Indian labour market has been the dramatic withdrawal of women workers in the past few years. India‘s female labour force participation rate, or the proportion of women who opt for work, fell nearly seven percentage points to 22.5% between 2004-05 and 2011-12. Low female labour participation rates have been a structural problem in India for long but the recent decline means the country has among the lowest proportions of working women. India ranks 10th from the bottom among countries ranked according to their female labour force participation rate, World Bank data show. The greatest withdrawal of women from the labour force occurred in rural areas, and was largely in agriculture. The withdrawal is all the more surprising as it has occurred during a period of sharp rise in wages that women earn. The gender gap in wages of casual labourers declined nearly six percentage points between 2004-05 and 2011-12 to 31%. There are possibly three key factors driving women out of the rural labour force. First, there seems to be an income effect that has raised average rural incomes and allowed many women to quit demanding farm jobs. Secondly, there seems to be an education effect that is putting increasing numbers of rural women out of farms and into schools and colleges, which is reflected in the growing rural enrolment rates. Finally, there seems to be a dearth of attractive non-farm work opportunities for rural women as most non-farm jobs have been generated in the construction sector. The underlying factor that drives women out of the labour force once the family income crosses a certain threshold is the force of patriarchy. It is the key reason why empirical evidence from

Indian Labour Journal, January 2014
14
developing countries including India points to a ―U‖ curve for female labour participation rates, which drops after the family income crosses a minimum income threshold. This rises later at much higher levels of affluence. A look at the inter-state variations in female labour force participation rates seems to confirm the role of patriarchy as an important driver of gender gaps in labour participation rates.
(live mint, 18.11.2013)
Indian Workers among the Most Satisfied with Their Jobs Globally - Indian workers are among the most satisfied with their jobs globally, and nearly one in five Indians like their jobs so much that they would even work for free, says a survey. According to a survey by online career and recruitment solutions provider Monster Worldwide, and Gfk, an independent global market research company, over half of Indian workers (55 per cent) love or like their jobs a lot, placing India at third position in international happiness ranking, behind Canada (64 per cent) and the Netherlands (57 per cent). Among the seven countries surveyed, the United States was ranked fourth with 53 per cent saying they either love or like their jobs, followed by the United Kingdom (46 per cent, 5th), France (43 per cent, 6th) and Germany (35 per cent, 7th). The international survey that polled more than 8,000 workers in Canada, France, Germany, India, the Netherlands, the U.K. and the U.S., said nearly one in five (18 per cent) Indians love their jobs so much that they would work for free. Moreover, only five per cent of Indian workers admit they actively dislike their jobs and no Indian worker said they hate their jobs — the lowest percentage of all countries surveyed. ―The research findings are a reflection of prevailing business scenario and employee/worker mindset where they want to be safe and not take any risks,‖ Monster.com (India/Middle East South East Asia) Managing Director Sanjay Modi said. The survey further said that money does not buy happiness as those with medium level pay packets are happier than those with huge salaries. Three in five (60 per cent) of those with middle incomes say they like or love their job as compared to just over half (52 per cent) of high earners. Lowest earners are the least content with less than half (47 per cent) saying they are happy at work. ―There are many variables to job satisfaction — and the size of your pay check is only one aspect,‖ Mr. Modi added.
(The Hindu, 20.11.2013)
Use CSR Funds to Impart Skills: Ramadorai - With the demand-supply mismatch in skilled manpower posing a threat to the economy‘s growth, the industry must use a part of the funds set aside for corporate social responsibility (CSR) for imparting skills to workers and aim at job-led growth, prime minister's advisor S Ramadorai said. Although two years of economic slowdown have slowed hiring, the main problem that India Inc confronts today is a severe shortage of skilled labour. Hardly a tenth of fresh management graduates and a fifth of engineers are employable in the industry, says a survey report prepared by CII in collaboration with PeopleStrong and Wheebox. ―Even as we think of skills, we must match them with jobs,‖ Ramadorai, the former TCS chief, who now heads National Skills Development Corporation and National Skill Development Agency, said at a CII conference. He urged private companies to allow their employees to volunteer to train people in various skills as well as devote some part of their CSR funds towards skill development. ―In a country with over 600 million people in the working age group, the need of the hour is ‗job-led growth‘. We need to focus efforts on things that generate employment, such as cultivating entrepreneurs and promoting SMEs. Whether it is the services or the manufacturing sector, our mantra should be — ‗more with more for more‘. By this I mean generate more output with more people in a manner to impact and benefit more people,‖ he said. While pointing out that the current educational system was not adequate, Ramadorai said there was a need to adopt Massive Online Open Courses to provide high quality education to a much larger cross-section of people. The National IT Backbone could be leveraged for this purpose.
(The Financial Express, 20.11.2013)
Industries/Services Declared/Granted Extension as Public Utility Services under the
Industrial Disputes Act, 1947–No case of Public Utility Services has been received in the
Bureau, during November, 2013.

Indian Labour Journal, January 2014
15
Consumer Price Index Numbers for Industrial Workers (CPI-IW) on base 2001=100 and Agricultural and Rural Labourers on base 1986-87=100 for the month November, 2013
Consumer Price Index Numbers for Industrial Workers- The All-India CPI-IW
for November, 2013 rose by 2 points and pegged at 243 (two hundred and forty three). On 1-
month percentage change, it increased by 0.83 per cent between October and November
compared with 0.46 per cent between the same two months a year ago. The largest upward
pressure to the change in current index came from Food group contributing 2.23 percentage
points to the total change. At item level, Rice, Wheat, Wheat Atta, Milk, Pure Ghee, Garlic,
Potato, Tomato and other Vegetable items, Tea Readymade etc. are responsible for the rise in
index. However, this was compensated to some extent by Groundnut Oil, Fish Fresh, Poultry,
Onion, Ginger, Electric Charges, Medicine (Allopathic), Petrol, putting downward pressure on
the index. The year-on-year inflation measured by monthly CPI-IW stood at 11.47 per cent for
November, 2013, as compared to 11.06 per cent for the previous month and 9.55 per cent during
the corresponding month of the previous year. Similarly, the Food inflation stood at 16.17 per
cent against 15.02 per cent of the previous month and 10.85 per cent during the corresponding
month of the previous year. At centre level, Bokaro recorded the highest increase of 11 points
followed by Giridih, Kodarma and Angul-Talcher (9 points each), Munger-Jamalpur (8 points)
and Rourkela, Sholapur and Raniganj (7 points each). Among others, 6 points rise was registered
in 5 centres, 5 points in 5 centres, 4 points in 8 centres, 3 points in 15 centres, 2 points in 14
centres and 1 point in 12 centres. On the contrary, Surat centre reported a decline of 6 points
followed by Amritsar, Bhavnagar and Vadodara (4 points each), Coonoor and Nagpur (2 points
each) and Ahmedabad centre 1 point. Rest of the 4 centres‘ indices remained stationary. The
indices of 40 centres are above All-India Index and other 38 centres‘ indices are below national
average.
(Labour Bureau)
Consumer Price Index Numbers for Agricultural Labourers and Rural Labourers
The All-India Consumer Price Index Numbers for Agricultural Labourers and Rural Labourers
(Base: 1986-87=100) for November, 2013 increased by 11 points each to stand at 777 ( Seven
hundred and seventy seven) points. The rise in index varied from State to State. In case of
Agricultural Labourers, it recorded an increase which varied between 1 to 21 points. Haryana
with 860 points topped the index table whereas Himachal Pradesh with the index level of 631
points stood at the bottom. In case of Rural Labourers, it recorded an increase between 2 to 22
points in 19 States and remained stationary in 1 State. Haryana with 854 points topped the index
table whereas Himachal Pradesh State with the index level of 666 points stood at the bottom.
Agricultural Labourers index for Bihar State registered the maximum increase of 21 points
while Rural Labourers index for Assam State registered the maximum increase of 22 points
mainly due to increase in the prices of wheat atta, maize, milk, vegetables & fruits, firewood,
saree cotton mill and doctor‘s fee. Point to point rate of inflation based on the CPI-AL and CPI-
RL increased from 12.65% and 12.48% in October, 2013 to 13.43% and 13.27% in November,
2013. Inflation based on food index of CPI-AL and CPI-RL are 14.73% and 14.54% respectively
during November, 2013.
(Labour Bureau)
Indian Labour Journal, January 2014
16
(b) FOREIGN LABOUR Democrats' Immigration Bill Rings Alarm Bell for Indian Firms - A Democratic Party bill, aimed at overhauling the immigration system introduced in House of Representatives this month, has sent alarm bells ringing among Indian IT firms as it includes provisions that would be detrimental to the businesses of such companies. The bill (HR 15) introduced in the House by the Democratic Leader, Nancy Pelosi, and co-sponsored by several members of the Congressional India Caucus, carries the same killer provisions as the one passed by the Senate. The killer provisions are in particular related to the much-sought after H-1B and L-1 visas. Given that the Democrats in the House are in a minority, Congressional aides said that the chances of this bill being passed with the Republican support is unlikely and it was introduced by Pelosi early this month as part of the larger political game plan to put pressure on the Republicans to bring a reform bill to the floor.
(The Financial Express, 01.11.2013)
ILO Report Says Additional Measures Needed to Tackle Portugal Jobs Crisis - One in seven jobs has been lost in Portugal since the start of the global crisis in 2008, says a new report, "Tackling the jobs crisis in Portugal", by the International Labour Organization (ILO. A large part of this deterioration has occurred since the start of the financial assistance programme in 2011, with young workers and families with small children disproportionately affected. The report describes the socio-economic situation in the country as ―critical,‖ marked by unprecedented levels of unemployment, a drastic decline of productive investment and an economic recovery that is likely to be too weak to make a significant dent in the jobless figures. ―Much of the policy action so far has focused on reducing fiscal deficits and boosting competitiveness,‖ says Raymond Torres, head of the ILO‘s Research Department. According to the report, new policies are needed to tackle the negative trends. ―Cuts in wages and welfare programmes, combined with tax increases, have eroded family incomes and domestic demand. Small- and medium-sized enterprises struggle to find credit, which means lost opportunities for job creation,‖ Torres explains. The report shows that it is possible to reduce fiscal deficits and curb unemployment at the same time, instead of favouring one target at the expense of the other.
(ILO News, 04.11.2013)
Labour Standards Increasingly Included in Bilateral and Regional Free Trade Agreements - The number of trade agreements that include labour provisions has increased significantly over the past two decades, according to a new report by the International Labour Organization (ILO). The report on the Social Dimensions of Free Trade Agreements says that there has been a substantial growth in the number of trade agreements featuring labour-related measures since the mid-1990s, including more ‗South-South agreements‘ between developing countries. In total, there were 58 agreements with labour provisions in June 2013 – almost a quarter of the total 248 trade agreements currently in force. These have included provisions on minimum working conditions, enforcement of national labour laws, as well as monitoring and enforcing labour standards. ―The increasing number of trade agreements which include provisions with respect to labour standards is a reflection of the growing awareness that trade liberalization, important as it is, should go hand-in-hand with progress on the employment and social front,‖ said Raymond Torres, Director, in charge of the ILO Research Department. In some cases, the improvement of labour standards has been made a condition for the entry-into-force of agreements between countries. In the last six of seven US trade agreements, some improvements in labour standards were made prior to their coming into force. In almost 60 per cent of cases, the agreements promote compliance with labour standards, without direct commercial or financial consequences attached to them. This often involves cooperation between partner countries to improve working conditions and commitments to maintain labour standards.
(ILO News, 07.11.2013)
Migrants Face Systematic Abuse in Qatar, Says Amnesty International - Qatar‘s feverish preparations for hosting the FIFA world cup in 2022 has triggered systematic abuse of migrant workers, mostly from South and South-east Asia, who are arriving in the wealthy Emirate in droves. The rights group, Amnesty International, has put the spotlight on the ―routine abuse of

Indian Labour Journal, January 2014
17
migrant workers — in some cases amounting to forced labour.‖ The report, ―The Dark Side of Migration: Spotlight on Qatar‘s construction sector ahead of the World Cup,‖ has unravelled in considerable detail the various dimensions and mechanisms used for systematically abusing migrants, who are arriving at the rate of 20 workers per hour, in the hope of benefiting from an unprecedented construction boom in the tiny Gulf Emirate. The report, compiled after extensive interviews with expat workers, as well as meetings with company and government officials, points to the existence of ―complex contractual chains‖ that often display inhuman disregard for workers‘ rights. A variety of mechanisms are deployed to deprive migrant workers of their basic human rights, including non-payment of wages, harsh and dangerous working conditions, and ―shocking standards‖ of accommodation. The report points to appalling safety standards, by quoting a representative of Doha‘s main hospital, who said earlier this year more than 1,000 people, falling from heights, while at work, had been admitted to the trauma unit in 2012. Ten per cent of these were disabled, and the resulting mortality rate was ―significant.‖ Companies frequently withheld passports, to be used as instruments of blackmail. The rights group has consequently called for an overhaul of the ‗sponsorship‘ system, which is a root cause of the inability of migrant workers to leave the country or change jobs without their employers‘ consent.
(The Hindu, 19.11.2013)
Cameron Curbs Welfare Benefits for EU Migrants - Britain‘s Prime Minister David Cameron promised to make it harder for migrants from the European Union to access UK‘s welfare system and pledged to try to restrict the freedom of movement of people from poorer EU states in time. His plan, an attempt to address public fears about an influx of Romanians and Bulgarians when EU restrictions on those two countries expire next year, drew a rebuke from the European Commission which said his intervention was ―an unfortunate over-reaction‖. But Cameron, whose Conservative party risks seeing its vote split at European elections next year and at a national election in 2015 by the anti-immigration UK Independence Party, is under pressure to act at a time when he is trailing in polls. He has said he will try to renegotiate Britain‘s membership of the EU to give it more of a say over its own affairs and has promised to hold an in/out referendum if re-elected in 2015 amid public scepticism about the benefits of belonging to the bloc. ―The EU of today is very different from the EU of 30 years ago,‖ Cameron said in an article in the Financial Times. ―We need to face the fact that free movement has become a trigger for vast population movements caused by huge disparities in income. That is extracting talent out of countries that need to retain their best people and placing pressure on communities.‖ Cameron said he planned to change British law so that new EU migrants would have to wait three months before they could access unemployment benefits, saying he shared deep public concerns about a possible influx of new migrants. He said he planned to try to renegotiate the way EU freedom of movement rules are applied to make it harder for people from poorer EU countries to relocate to richer countries. That, he said, could involve capping the number of EU migrants or withholding full freedom of movement rights.
(The Financial Express, 28.11.2013) Jobs, Price Growth Offer Ray of Hope for Euro Zone - The first fall in euro zone unemployment in almost three years coupled with rising prices gave fresh momentum to an economic recovery, but a growing rift between the bloc‘s haves and have-nots continued to widen. The improvement is a welcome sign that the euro zone‘s rebound is picking up steam, more than five years after a financial crisis erupted that forced five countries, from Cyprus to Spain, to seek emergency aid from their neighbours. The jobless rate in October fell to 12.1%, the first fall since February 2011, the European Union‘s statistics office Eurostat said. That was better than economists had forecast but it belies a wide disparity across the 17 countries using the currency. While just 5% of Austrians are unemployed, 27% of Greeks and Spaniards are without a job. In total, an unprecedented 19 million people are out of work. The sharp differences between the countries in the euro zone, both in price rises and unemployment, present the European Central Bank with a conundrum. But its power to remedy this widening rift between prosperous countries such as Germany and struggling states including Portugal is limited.
(The Financial Express, 30.11.2013)

Indian Labour Journal, January 2014
18
LABOUR DECISIONS
Compassionate Appointment cannot be Claimed as a Legal Right - In this case, the
respondent applied for compassionate appointment as his father who was working as a Class III
employee with the appellant Bank died while in harness. The claim of compassionate
appointment was however denied as during the pendency of the application filed by the
respondent, a new scheme came into force which has a provision for granting ex-gratia payment
to the family instead of compassionate appointment. Consequently, a writ petition was preferred
by the respondent before the High Court wherein the learned Single Judge took the view that as
the cause of action had arisen prior to the commencement of the new scheme, therefore, the case
was to be considered as per the then existing scheme which provided for compassionate
appointment and not for grant of ex-gratia payment. The Court directed the appellant not only to
consider the case of appointment of the respondent on compassionate grounds but rather directed
the appellant to appoint him. The appellant challenged the said order by filing the Special
Appeal which has been dismissed. Hence this appeal. The apex Court heard learned counsel for
the parties and opined that every appointment to public office must be made by strictly adhering
to the mandatory requirements of Articles 14 and 16 of the Constitution. An exception by
providing employment on compassionate grounds has been carved out in order to remove the
financial constraints on the bereaved family, which has lost its bread-earner. Mere death of a
Government employee in harness does not entitle the family to claim compassionate
employment. The Competent Authority has to examine the financial condition of the family of
the deceased employee and it is only if it is satisfied that without providing employment, the
family will not be able to meet the crisis, that a job is to be offered to the eligible member of the
family. More so, the person claiming such appointment must possess required eligibility for the
post. It was further opined that the Court should not stretch the provision by liberal interpretation
beyond permissible limits on humanitarian grounds. The Apex Court considered various aspects
of service jurisprudence and came to the conclusion that as the appointment on compassionate
ground may not be claimed as a matter of right nor an applicant becomes entitled automatically
for appointment, rather it depends on various other circumstances i.e. eligibility and financial
conditions of the family, etc., the application has to be considered in accordance with the
scheme. In case the Scheme does not create any legal right, a candidate cannot claim that his
case is to be considered as per the Scheme existing on the date the cause of action had arisen i.e.
death of the incumbent on the post. In view of the above position, the appeal was allowed and
the impugned judgments of the High Court were set aside.
(MGB Gramin Bank vs Chakrawarti Singh; Current Labour Reports, October, 2013, pp.295-
298)
People tend to forget their duties but remember their rights.
-Indira Gandhi
Indian Labour Journal, January 2014
19
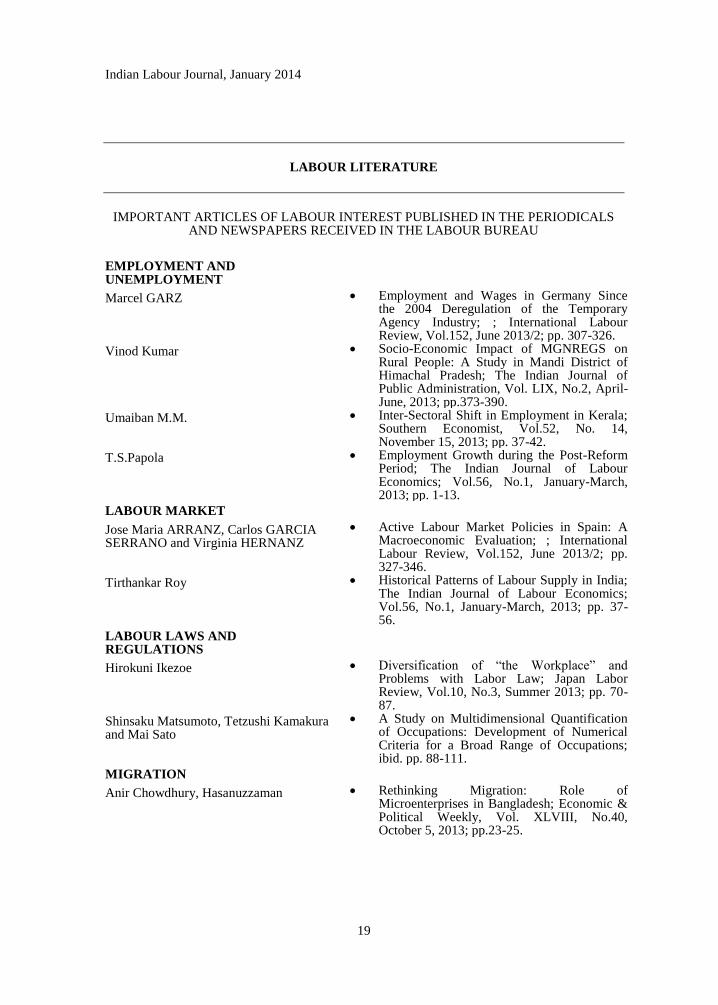
LABOUR LITERATURE
IMPORTANT ARTICLES OF LABOUR INTEREST PUBLISHED IN THE PERIODICALS AND NEWSPAPERS RECEIVED IN THE LABOUR BUREAU
EMPLOYMENT AND UNEMPLOYMENT
Marcel GARZ Employment and Wages in Germany Since the 2004 Deregulation of the Temporary Agency Industry; ; International Labour Review, Vol.152, June 2013/2; pp. 307-326.
Vinod Kumar Socio-Economic Impact of MGNREGS on Rural People: A Study in Mandi District of Himachal Pradesh; The Indian Journal of Public Administration, Vol. LIX, No.2, April-June, 2013; pp.373-390.
Umaiban M.M. Inter-Sectoral Shift in Employment in Kerala; Southern Economist, Vol.52, No. 14, November 15, 2013; pp. 37-42.
T.S.Papola Employment Growth during the Post-Reform Period; The Indian Journal of Labour Economics; Vol.56, No.1, January-March, 2013; pp. 1-13.
LABOUR MARKET
Jose Maria ARRANZ, Carlos GARCIA SERRANO and Virginia HERNANZ
Active Labour Market Policies in Spain: A Macroeconomic Evaluation; ; International Labour Review, Vol.152, June 2013/2; pp. 327-346.
Tirthankar Roy Historical Patterns of Labour Supply in India; The Indian Journal of Labour Economics; Vol.56, No.1, January-March, 2013; pp. 37-56.
LABOUR LAWS AND REGULATIONS
Hirokuni Ikezoe Diversification of ―the Workplace‖ and Problems with Labor Law; Japan Labor Review, Vol.10, No.3, Summer 2013; pp. 70-87.
Shinsaku Matsumoto, Tetzushi Kamakura and Mai Sato
A Study on Multidimensional Quantification of Occupations: Development of Numerical Criteria for a Broad Range of Occupations; ibid. pp. 88-111.
MIGRATION
Anir Chowdhury, Hasanuzzaman Rethinking Migration: Role of Microenterprises in Bangladesh; Economic & Political Weekly, Vol. XLVIII, No.40, October 5, 2013; pp.23-25.

Indian Labour Journal, January 2014
20
RECESSION
Karl BRENKE, Ulf RINNE and Klaus F. ZIMMERMANN
Short-time Work: The German Answer to the Great Recession; International Labour Review, Vol.152, June 2013/2; pp. 287-305.
WAGES
Anil Kaushik Wages & Salary Structure Current Labour Reports, Vol.29, Part-10, October, 2013; pp. 32-33.
MISCELLANEOUS
Anagha Sarpotdar Sexual Harassment of Women: Reflections on the Private Sector; Economic & Political Weekly, Vol. XLVIII, No.40, October 5, 2013; pp. 18-19.
I.M.Mohan and H.E.Savithri Small Scale Industries in India during Five Year Plans; Southern Economist, Vol.52, No. 14, November 15, 2013; pp. 5-7.
Sangheon Lee and Megan Gerecke Inequality and Economic Growth: Revisiting Kuznetsian Political Economic of Inequality; The Indian Journal of Labour Economics; Vol.56, No.1, January-March, 2013; pp. 15-35.
Dr. Rajen Mehrotra Right to Organize and Bargain Collectively – Negotiating Settlements; Current Labour Reports, Vol.29, Part-10, October, 2013; pp. 25-31.
Bishwanath Goldar, Basanta K. Pradhan and Akhilesh K. Sharma
Elasticity of Substitution between Capital and Labour Inputs in Manufacturing Industries of the Indian Economy; The Journal of Industrial Statistics, Vol.2, No.2, September 2013; pp. 169-194.
The greatest good you can do for another is not just share your
riches, but to reveal to him his own.
-Benjamin Disraeli

Indian Labour Journal, January 2014
21
STATISTICS
Section A
MONTHLY STATISTICS
Pages
Notes 23
1. Prices and Price Indices
1.1. Industrial Workers’ Consumer Price Index
Table A.1.1.1. Labour Bureau‘s Series of All-India Consumer Price Index Numbers
for Industrial Workers (Base : 2001=100)
25
Table A.1.1.2. Labour Bureau‘s Series of Consumer Price Index Numbers for
Industrial Workers in respect of 78 constituent centres (Base:
2001=100)
26
Table A.1.1.3. Average Monthly Consumer Prices of Selected Articles for
Industrial Workers
34
1.2. Consumer Price Index Numbers for Agricultural and Rural
Labourers
Table A.1.2.1-
(a) and (b)
Labour Bureau‘s Series of All-India Average Consumer Price Index
Numbers for Agricultural and Rural Labourers (Base : 1986-
87=100) Group- wise and General
44
Table A.1.2.2-
(a) and (b)
Average Monthly Consumer Prices of Selected Articles for
Agricultural and Rural Labourers (Base : 1986-87 =100)
48
2. Wages and Earnings
Table A 2.1.-
(a) and (b)
Average Daily Wage Rates for Agricultural & Non-Agricultural
Occupations in Rural India
55
3. Industrial Disputes
Table A 3.1.- Sector/Sphere-wise Number of Disputes, Workers Involved and
Mandays Lost due to Industrial Disputes
63
Table A 3.2.- State-wise Industrial Disputes (All Strikes and Lockouts) 64
Indian Labour Journal, January 2014
22
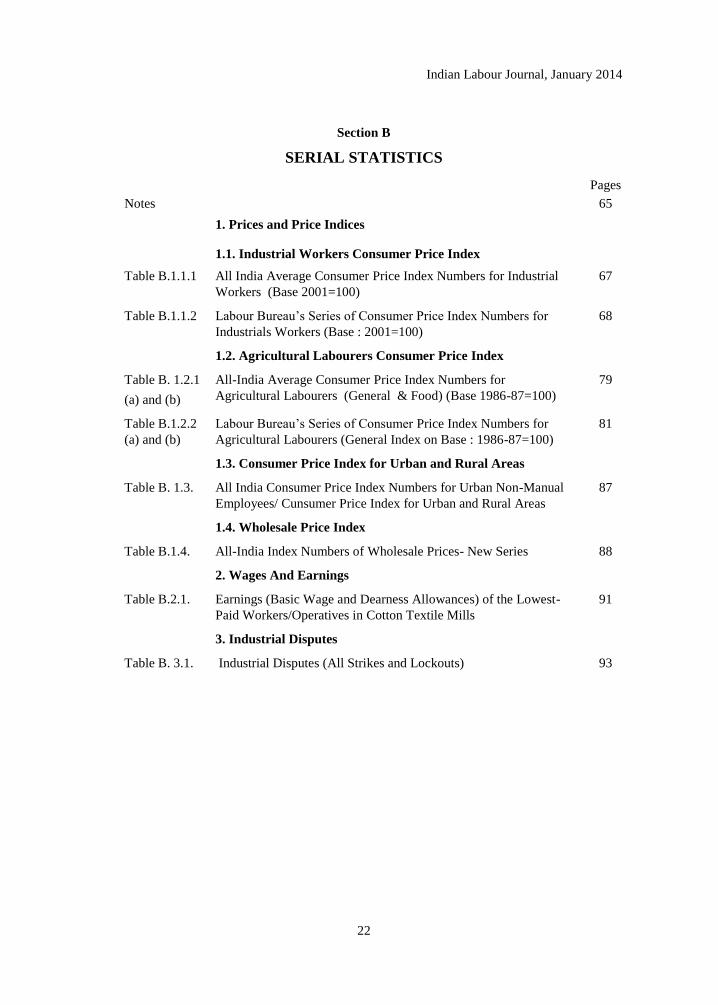
Section B
SERIAL STATISTICS
Pages
Notes 65
1. Prices and Price Indices
1.1. Industrial Workers Consumer Price Index
Table B.1.1.1 All India Average Consumer Price Index Numbers for Industrial
Workers (Base 2001=100)
67
Table B.1.1.2 Labour Bureau‘s Series of Consumer Price Index Numbers for
Industrials Workers (Base : 2001=100)
68
1.2. Agricultural Labourers Consumer Price Index
Table B. 1.2.1
(a) and (b)
All-India Average Consumer Price Index Numbers for
Agricultural Labourers (General & Food) (Base 1986-87=100)
79
Table B.1.2.2
(a) and (b)
Labour Bureau‘s Series of Consumer Price Index Numbers for
Agricultural Labourers (General Index on Base : 1986-87=100)
81
1.3. Consumer Price Index for Urban and Rural Areas
Table B. 1.3. All India Consumer Price Index Numbers for Urban Non-Manual
Employees/ Cunsumer Price Index for Urban and Rural Areas
87
1.4. Wholesale Price Index
Table B.1.4. All-India Index Numbers of Wholesale Prices- New Series 88
2. Wages And Earnings
Table B.2.1. Earnings (Basic Wage and Dearness Allowances) of the Lowest-
Paid Workers/Operatives in Cotton Textile Mills
91
3. Industrial Disputes
Table B. 3.1. Industrial Disputes (All Strikes and Lockouts) 93
Indian Labour Journal, January 2014
23
SECTION A
MONTHLY STATISTICS
N o t e s
1. Prices and Price Indices
1. 1. Industrial Workers Consumer Price Index
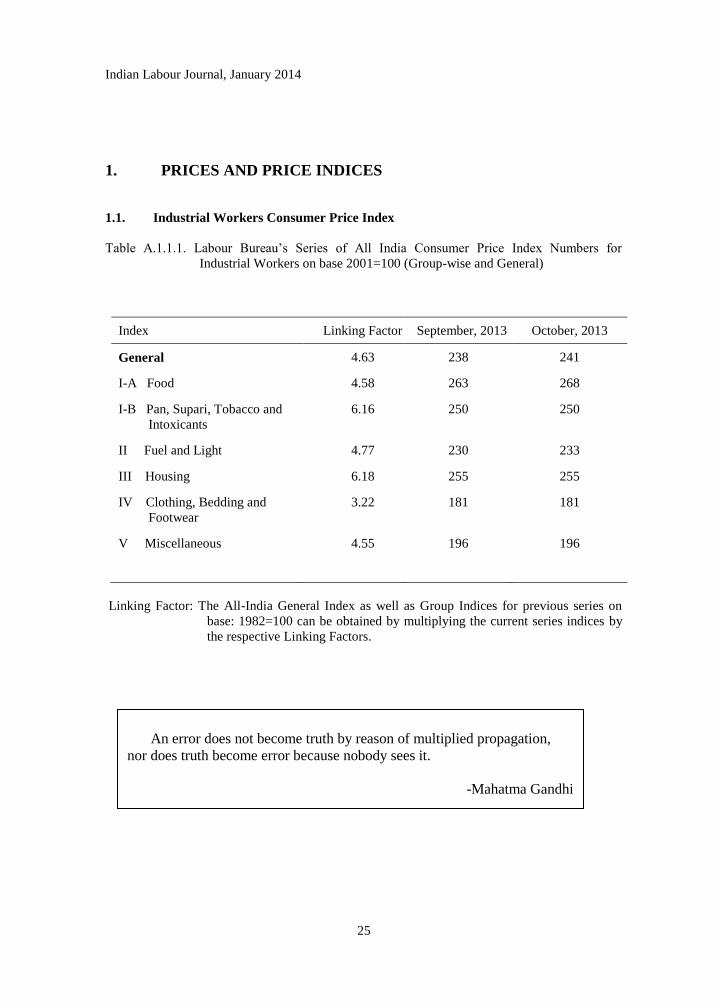
A.1.1.1. Labour Bureau’s Series of All India Consumer Price Index Numbers for Industrial Workers (Base: 2001=100) – The All-India Consumer Price Index Numbers for Industrial Workers on Base : 2001=100 General and Group-wise along with Linking Factors with previous base: 1982=100 are presented in Table A.1.1.1. The All India Index is a weighted average of 78 constituent centre Indices compiled by the Labour Bureau. The current series of the Index Numbers has been introduced with effect from January, 2006 index replacing the series on base: 1982=100. The All India General Index as well as Group Indices for previous series on base:1982=100 can be obtained by multiplying the current series indices by the respective Linking Factors. A note on the scope and methods of construction of these index numbers was published in April 2006 issue of the ―Indian Labour Journal‖. The All India Consumer Price Index Number for the month of October, 2013 increased by 3 point and stood at 241.
A.1.1.2. Labour Bureau’s Series of Consumer Price Index Numbers for Industrial Workers in respect of 78 constituent centres on Base: 2001=100 – The Consumer Price Index Numbers for industrial workers on Base: 2001=100 for 78 centres compiled by the Labour Bureau are presented group wise in Table A.1.1.2 for the months of September, 2013 and, Ocotober, 2013.
The Index Numbers measure the extent to which the overall levels of retail prices of goods and services consumed by Industrial Workers has changed when compared with the base period viz., 2001=100. As compared to the previous month the magnitude of rise/fall in the General Index varies from centre to centre. During October, 2013, the index recorded an increase of 9 points in Bhavnagar followed by Ahmedabad, Labac Silchar and Kodarma (8 points each) and Vadodara and Surat (7 Points each). Among others, 8 centres have recorded rise of 6 points followed by 5 points in 10 centres, 4 points in 8 centres, 3 points in 9 centres, 2 points in 10 centres and 1 point in 11 centres. Belgaum and Chhindwara centres reported a decline of (3 points each), 2 points in Mercara, and 1 point in 3 centres. The remaining 10 centres‘ indices remained stationary.
A 1.1.3. Average Monthly Consumer Prices of Selected Articles for Industrial Workers – The average monthly consumer prices of selected articles based on individual quotations obtained from the selected outlets which are utilised in the compilation of Consumer Price Index Numbers (Base: 2001=100) for Industrial Workers for 78 centres for the month of October, 2013 are set out in Table A.1.1.3. The prices reported in the table are averages of open markets prices of specified varieties of an item prevailing in the selected outlets in the selected market(s) in a given centre during the month in case of non-rationed items. So far as rationed items are concerned, the prices for the centres covered under informal rationing are the weighted average prices, the weights being the proportion of the quantity available through Public Distribution System and quantity procured from the open market in different centres in relation to base year requirements of an average family. In case of centres covered under Statutory Rationing the prices are average of the fair prices of variety (ies) of an item distributed through Fair Price Shops. 1.2 Consumer Price Index Numbers for Agricultural and Rural Labourers:
A.1.2.1 (a) and (b) Labour Bureau’s Series of Consumer Price Index Numbers for Agricultural
and Rural Labourers on Base: 1986-87=100 - All-India Consumer Price Index Numbers for
Agricultural and Rural Labourers on Base: 1986-87=100 replacing the earlier series on base
1960-61=100 were released with effect from November, 1995. The all-India index is a weighted
average of 20 constituent State indices compiled by the Labour Bureau for Agricultural and
Rural Labourers separately. A detailed note on the scope and method of construction of these
indices was published in February, 1996 issue of the Indian Labour Journal.

Indian Labour Journal, January 2014
24
The Consumer Price Index Numbers (Base: 1986-87=100) for Agricultural and Rural
Labourers for 20 States and All-India are presented group-wise in Tables A.1.2.1 (a) and (b) for
the months of September, 2013and October, 2013. These index numbers measure the extent of
change in the retail prices of goods and services consumed by Agricultural and Rural Labourers
as compared with the base period viz., 1986-87. The All-India Consumer Price Index Numbers
for Agricultural Labourers and Rural Labourers on base 1986-87=100 for October, 2013
increased by 7 points each to stand at 766 (Seven hundred and sixty six) points for both the
series.
A.1.2.2 (a) and (b) Monthly Consumer Prices of Selected Articles for Agricultural and
Rural Labourers – The monthly consumer prices of selected articles of index basket of
agricultural and rural labourers utilised in the compilation of Consumer Price Index Numbers
(Base: 1986-87=100) for 20 States separately for Agricultural and Rural Labourers for the month
of October, 2013 are given in Tables A.1.2.2. (a) and (b). Though the spatial coverage and the
individual sample village price quotations in both the series relating to the Agricultural and
Rural Labourers are the same, the weighted prices of items at the State level will be slightly
different from each other due to difference in the regional weights in each of the series. 2 Wages and Earnings
A.2.1 (a) and (b) Average Daily Wage Rates for Agricultural and Non-agricultural Occupations -
As a part of Rural Labour Enquiry, daily wage rates in respect of eighteen agricultural and non-
agricultural occupations from a fixed set of 600 sample villages spread over 66 N.S.S. regions in
20 States are being collected alongwith rural retail price data in Schedule 3.01 (R) by the Field
Operations Division of the National Sample Survey Organisation since 1986-87. On the
recommendations of the Governing Council of the National Sample Survey Organisation in its 61st
meeting, Labour Bureau started the compilation and analysis of Wage Rate Data w.e.f. April,
1998. State-wise and all-India average daily wage rates by occupation and sex for the month of
October,2013 have been presented in Table A.2.1 (a) for agricultural occupations and Table A.2.1
(b) for non- agricultural occupations.
The average wage rates at all-India level are derived by dividing the sum total of wages of
all the 20 States by the number of quotations. State-wise averages have been restricted only to
those occupations where the number of quotations are five or more in order to avoid inconsistency
in wages paid to different categories of workers on account of difference in number of quotations.
However, for working out all-India averages all the quotations have been taken into account to
arrive at total number of quotations at all-India level. At all-India level also, the number of
quotations for working out occupation-wise averages have been restricted to five or more.
3 Industrial Dispute
A.3.1. Sector / Sphere-wise Number of Disputes, Workers Involved and Mandays Lost due to
Industrial Disputes during January to October, 2013 – These statistics are received in the
Bureau from the State Labour Departments and Regional Labour Commissioners (Central) in the
prescribed format in the shape of monthly voluntary returns covering State and Central Spheres
separately. Information on Strikes and Lockouts is collected by the concerned authorities and
sent to the Bureau every month. Consolidated information for the year 2013 (As on 29-11-2013)
is presented in Table A.3.1.
A.3.2. Industrial Disputes (All Strikes and Lockouts) during January to October, 2013- State-wise scenario of Industrial Disputes during January to October, 2013 is presented in Table A.3.
2NOTES -1. Labour Bureau takes every care to ensure correctness of the information presented in Sections A and B of the Journal. However, any error, if noticed, may kindly be brought to the notice of the Labour Bureau.
2. The indices given in Sections A and B measure the relative change in Consumer Prices over time at each Centre and as such these cannot be used for comparison of costliness among the different Centres.
Indian Labour Journal, January 2014
25
1. PRICES AND PRICE INDICES
1.1. Industrial Workers Consumer Price Index
Table A.1.1.1. Labour Bureau‘s Series of All India Consumer Price Index Numbers for
Industrial Workers on base 2001=100 (Group-wise and General)
Index Linking Factor September, 2013 October, 2013
General 4.63 238 241
I-A Food 4.58 263 268
I-B Pan, Supari, Tobacco and
Intoxicants
6.16 250 250
II Fuel and Light 4.77 230 233
III Housing 6.18 255 255
IV Clothing, Bedding and
Footwear
3.22 181 181
V Miscellaneous 4.55 196 196
Linking Factor: The All-India General Index as well as Group Indices for previous series on
base: 1982=100 can be obtained by multiplying the current series indices by
the respective Linking Factors.
An error does not become truth by reason of multiplied propagation,
nor does truth become error because nobody sees it.
-Mahatma Gandhi

Indian Labour Journal, January 2014
26
Table A.1.1.2 – Labour Bureau‘s Series of Consumer Price Index Numbers for Industrial
Sl.
No
State/Union
Territory/ Centre
Linking factor for
General Index with
previous base
1982=100
General Index Food Index
Sept.,
2013
Oct.,
2013
Sept.,
2013
Oct.,
2013
1 2 3 4 5 6 7
ANDHRA PRADESH
1 Godavarikhani N 243 247 261 266
2 Guntur 4.57 243 244 273 274
3 Hyderabad 4.79 211 212 257 257
4 Vijayawada N 239 242 278 281
5 Visakhapatnam 4.64 247 247 288 288
6 Warrangal 4.75 252 253 296 298
ASSAM
7 Doom-Dooma
Tinsukia
4.04 200 204 208 213
8 Guwahati 4.80 204 207 220 226
9 Labac-Silchar 3.65 225 233 244 255
10 Mariani-Jorhat 4.01 197 202 200 206
11 Rangapara-Tezpur 4.17 190 195 213 221
BIHAR
12 Monghyr-Jamalpur 4.30 244 249 257 264
CHANDIGARH
13 Chandigarh 5.26 239 240 265 265
CHHATTISGARH
14 Bhilai 4.20 272 275 274 276
DELHI
15 Delhi 5.60 216 218 245 248
GOA
16 Goa 5.59 247 247 285 285
GUJARAT
17 Ahmedabad 4.62 237 245 276 292
18 Bhavnagar 4.76 223 232 231 251
19 Rajkot 4.38 231 235 251 261
20 Surat 4.54 224 231 267 282
21 Vadodra 4.39 226 233 255 273

Indian Labour Journal, January 2014
27
Workers (Group-wise & General 2001=100)
Pan. Supari,
Tobacco and
Intoxicants Index
Fuel & Light
Index
Housing Index Clothing, Bedding
& Footwear Index
Misc. Index
Sept.,
2013
Oct.,
2013
Sept.,
2013
Oct.,
2013
Sept.,
2013
Oct.,
2013
Sept.,
2013
Oct.,
2013
Sept.,
2013
Oct.,
2013
8 9 10 11 12 13 14 15 16 17
191 192 169 180 370 370 186 193 183 186
305 305 261 261 185 185 180 180 191 192
256 257 157 158 184 184 147 147 181 183
290 290 157 169 214 214 220 211 192 197
231 231 166 166 320 320 223 222 185 187
225 225 158 159 260 260 170 168 211 211
209 208 165 165 184 184 177 177 198 200
208 206 190 190 187 187 198 198 194 194
218 221 182 182 176 176 183 183 199 199
220 220 249 247 125 125 164 166 216 218
146 147 154 154 101 101 239 239 193 194
255 255 265 264 285 285 186 186 213 217
237 244 209 209 297 297 199 201 160 165
270 275 203 203 510 510 157 162 194 201
225 225 223 223 192 192 190 188 188 188
195 192 186 185 245 245 210 213 211 210
365 349 163 161 203 203 171 173 215 220
189 189 154 153 250 250 194 194 200 199
260 260 158 157 248 248 158 158 200 199
317 317 149 149 202 202 154 154 196 195
294 296 166 165 227 227 134 134 207 206

Indian Labour Journal, January 2014
28
Table A.1.1.2. Contd.
Sl.
No
State/Union Territory /
Centre
Linking factor for
General Index with
previous base
1982=100
General Index Food Index
Sept.,
2013
Oct.,
2013
Sept.,
2013
Oct.,
2013
1 2 3 4 5 6 7
HARYANA
22 Faridabad 4.79 218 221 260 266
23 Yamunanagar 4.34 231 233 267 271
HIMACHAL PRADESH
24 Himachal Pradesh 4.53 215 217 235 236
JAMMU & KASHMIR
25 Srinagar 5.62 208 208 218 219
JHARKHAND
26 Bokaro N 232 238 229 241
27 Giridih N 293 299 272 281
28 Jamshedpur 4.23 260 264 252 261
29 Jharia 3.72 269 274 257 266
30 Kodarma 3.89 270 278 258 271
31 Ranchi-Hatia 4.20 275 281 259 270
KARNATAKA
32 Bangalore 4.51 243 246 281 286
33 Belgaum 5.02 249 246 284 278
34 Hubli-Dharwar 4.71 255 254 270 266
35 Mercara 4.47 247 245 274 270
36 Mysore N 252 253 289 293
KERALA
37 Ernakulam 4.52 229 231 271 275
38 Mundakayam 4.37 255 256 281 283
39 Quilon 4.61 242 247 262 272

Indian Labour Journal, January 2014
29
Pan, Supari,
Tobacco and
Intoxicants Index
Fuel & Light
Index
Housing Index Clothing, Bedding
& Footwear Index
Misc. Index
Sept.,
2013
Oct.,
2013
Sept.,
2013
Oct.,
2013
Sept.,
2013
Oct.,
2013
Sept.,
2013
Oct.,
2013
Sept.,
2013
Oct.,
2013
8 9 10 11 12 13 14 15 16 17
267 278 192 192 230 230 168 168 140 141
288 291 191 191 246 246 188 191 170 169
264 266 217 218 193 193 212 212 182 188
318 318 255 256 169 169 238 238 185 185
199 205 341 351 321 321 211 209 187 187
163 163 737 746 367 367 240 237 204 209
241 242 256 253 436 436 183 179 182 182
269 269 354 354 482 482 233 231 212 214
227 227 447 448 354 354 204 209 210 210
229 229 254 258 486 486 199 209 214 215
239 239 177 180 215 215 144 150 240 239
241 245 199 199 228 228 163 160 216 216
242 245 202 202 322 322 151 147 223 228
217 217 352 350 102 102 171 171 235 237
271 271 195 196 254 254 159 162 209 205
229 229 161 161 199 199 179 182 216 216
285 283 401 404 124 124 195 195 210 210
274 273 247 248 227 227 169 176 210 210

Indian Labour Journal, January 2014
30
Table A.1.1.2. Contd.
Sl.
No
State/Union Territory/
Centre Linking factor for
General Index
with previous
base 1982=100
General Index Food Index
Sept.,
2013
Oct.,
2013
Sept.,
2013
Oct.,
2013
1 2 3 4 5 6 7
MADHYA PRADESH
40 Bhopal 4.83 245 248 268 274
41 Chhindwara 4.03 251 248 287 281
42 Indore 4.73 227 229 261 267
43 Jabalpur 4.53 237 239 272 276
MAHARASHTRA
44 Mumbai 5.18 244 248 262 270
45 Nagpur 4.68 274 276 291 296
46 Nasik 4.94 247 247 262 261
47 Pune 4.96 242 243 282 282
48 Solapur 4.73 245 245 259 258
ORISSA
49 Angul-Talcher N 245 248 246 252
50 Rourkela 4.03 254 255 275 276
PUDUCHERRY
51 Pondicherry 4.88 243 242 305 302
PUNJAB
52 Amritsar 4.09 246 251 270 282
53 Jalandhar N 230 231 261 264
54 Ludhiana 4.12 228 233 269 277
RAJASTHAN
55 Ajmer 4.78 238 238 276 278
56 Bhilwara 4.62 246 247 289 291
57 Jaipur 4.25 232 237 255 265
TAMIL NADU
58 Chennai 4.95 221 223 256 261
59 Coimbatore 4.49 220 220 256 258
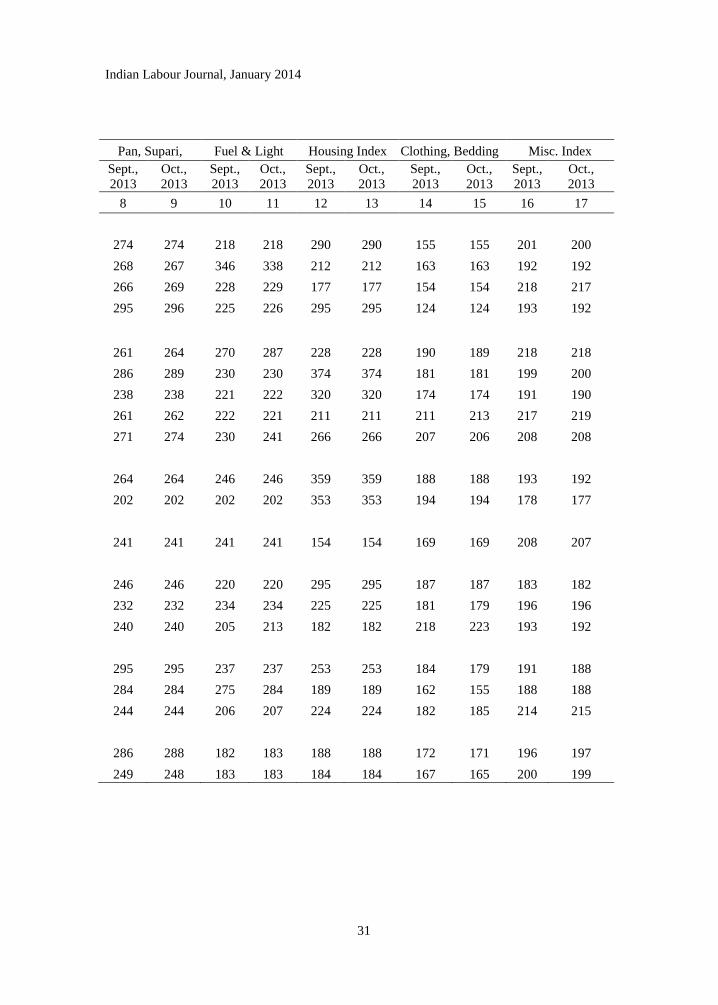
Indian Labour Journal, January 2014
31
Pan, Supari,
Tobacco and
Intoxicants Index
Fuel & Light
Index
Housing Index Clothing, Bedding
& Footwear Index
Misc. Index
Sept.,
2013
Oct.,
2013
Sept.,
2013
Oct.,
2013
Sept.,
2013
Oct.,
2013
Sept.,
2013
Oct.,
2013
Sept.,
2013
Oct.,
2013
8 9 10 11 12 13 14 15 16 17
274 274 218 218 290 290 155 155 201 200
268 267 346 338 212 212 163 163 192 192
266 269 228 229 177 177 154 154 218 217
295 296 225 226 295 295 124 124 193 192
261 264 270 287 228 228 190 189 218 218
286 289 230 230 374 374 181 181 199 200
238 238 221 222 320 320 174 174 191 190
261 262 222 221 211 211 211 213 217 219
271 274 230 241 266 266 207 206 208 208
264 264 246 246 359 359 188 188 193 192
202 202 202 202 353 353 194 194 178 177
241 241 241 241 154 154 169 169 208 207
246 246 220 220 295 295 187 187 183 182
232 232 234 234 225 225 181 179 196 196
240 240 205 213 182 182 218 223 193 192
295 295 237 237 253 253 184 179 191 188
284 284 275 284 189 189 162 155 188 188
244 244 206 207 224 224 182 185 214 215
286 288 182 183 188 188 172 171 196 197
249 248 183 183 184 184 167 165 200 199

Indian Labour Journal, January 2014
32
Table A.1.1.2. Concld.
Sl.
No
State/Union Territory
Centre
Linking factor for
General Index
with previous
base 1982=100
General Index Food Index
Sept.,
2013
Oct.,
2013
Sept.,
2013
Oct.,
2013
1 2 3 4 5 6 7
60 Coonoor 4.58 228 230 245 249
61 Madurai 4.51 220 226 260 272
62 Salem 4.45 223 222 249 248
63 Tiruchirapally 5.01 236 236 273 274
TRIPURA
64 Tripura 4.17 203 209 216 224
UTTAR PRADESH
65 Agra 4.36 247 249 255 261
66 Ghaziabad 4.78 241 244 270 278
67 Kanpur 4.50 246 247 274 275
68 Lucknow N 233 233 265 264
69 Varanasi 4.96 242 245 280 286
WEST BENGAL
70 Asansol 4.37 265 269 262 269
71 Darjeeling 3.80 222 227 243 250
72 Durgapur 5.13 273 277 249 257
73 Haldia 5.64 236 236 242 244
74 Howrah 5.42 219 224 249 259
75 Jalpaiguri 3.96 230 236 248 256
76 Kolkata 5.12 230 236 263 272
77 Raniganj 4.02 220 224 246 255
78 Siliguri N 225 231 260 270
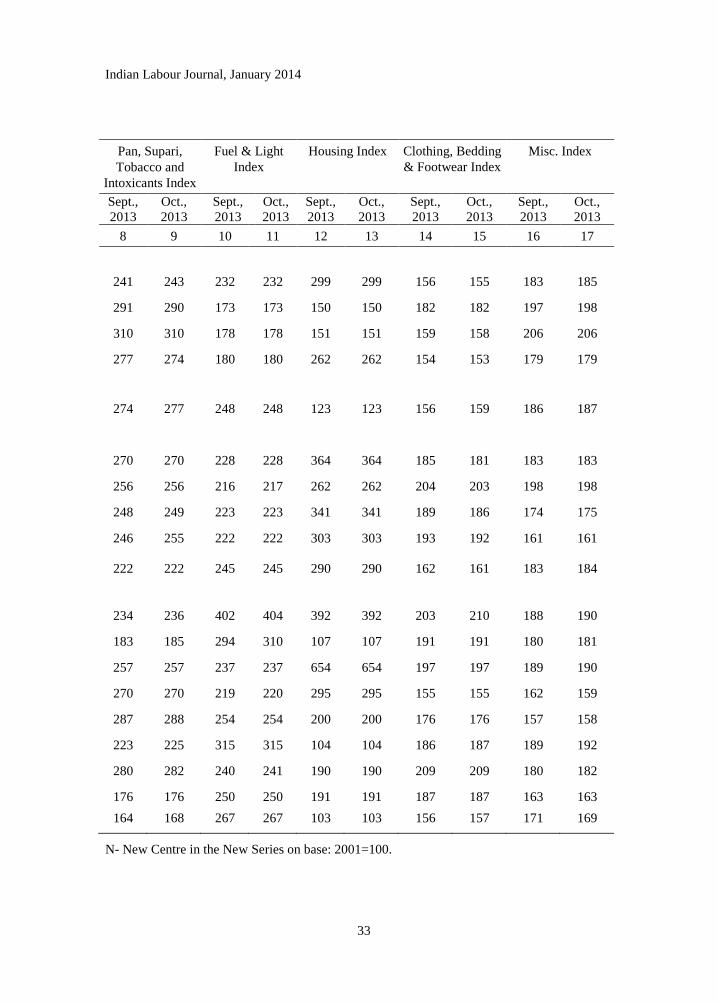
Indian Labour Journal, January 2014
33
Pan, Supari,
Tobacco and
Intoxicants Index
Fuel & Light
Index
Housing Index Clothing, Bedding
& Footwear Index
Misc. Index
Sept.,
2013
Oct.,
2013
Sept.,
2013
Oct.,
2013
Sept.,
2013
Oct.,
2013
Sept.,
2013
Oct.,
2013
Sept.,
2013
Oct.,
2013
8 9 10 11 12 13 14 15 16 17
241 243 232 232 299 299 156 155 183 185
291 290 173 173 150 150 182 182 197 198
310 310 178 178 151 151 159 158 206 206
277 274 180 180 262 262 154 153 179 179
274 277 248 248 123 123 156 159 186 187
270 270 228 228 364 364 185 181 183 183
256 256 216 217 262 262 204 203 198 198
248 249 223 223 341 341 189 186 174 175
246 255 222 222 303 303 193 192 161 161
222 222 245 245 290 290 162 161 183 184
234 236 402 404 392 392 203 210 188 190
183 185 294 310 107 107 191 191 180 181
257 257 237 237 654 654 197 197 189 190
270 270 219 220 295 295 155 155 162 159
287 288 254 254 200 200 176 176 157 158
223 225 315 315 104 104 186 187 189 192
280 282 240 241 190 190 209 209 180 182
176 176 250 250 191 191 187 187 163 163
164 168 267 267 103 103 156 157 171 169
N- New Centre in the New Series on base: 2001=100.

Indian Labour Journal, January 2014
34
Table A.1.1.3-Average Monthly Consumer Prices of Selected Articles for Industrial Workers,
October, 2013
Sl.
No
Article Unit Godavri
khani
Guntur Hydera
bad
Vijayawada Vishakha
patnam
Warran
gal
1 2 3 4 5 6 7 8 9
1 Rice Kg. 25.61 42.29 29.46 37.79 39.31 30.39
2 Wheat:
a. Wheat Whole Kg. 26.33 - 29.83 - 27.76 27.75
b. Wheat Atta Kg. 26.75 41.25 24.00 30.75 43.57 40.50
3 Jowar Kg. - - 28.83 - - -
4 Arhar Dal Kg. 78.13 69.50 71.54 70.75 81.13 76.50
5 Moong Dal Kg. 81.00 - 79.93 78.75 91.75 80.00
6 Masur Dal Kg. 62.00 - 65.50 - - 61.50
7 Groundnut oil Litre 96.63 90.88 93.92 81.29 126.70 88.24
8 Mustard Oil Litre - - - - - -
9 Vanaspati Litre - - - - 68.75 -
10 Goat Meat/Mutton Kg. 340.00 440.00 395.11 440.00 440.00 410.00
11 Fish Fresh Kg. 100.00 145.00 123.50 135.00 104.38 -
12 Milk Litre 30.00 44.00 50.18 41.00 39.25 40.00
13 Dairy Milk Litre - 36.00 34.00 34.46 36.00 -
14 Pure Ghee Litre - 330.00 373.33 291.79 200.20 -
15 Onion Kg. 42.50 55.50 49.85 53.50 57.50 53.75
16 Chillies Dry 100 gms. 7.81 8.05 8.12 15.38 10.63 9.36
17 Sugar Kg. 37.24 35.84 34.19 36.16 39.21 35.21
18 Gur Kg. - - 44.67 49.38 47.50 -
19 Tea Leaf 100gms 31.50 41.50 31.50 43.00 43.00 42.25
20 Fire Wood 40 Kg. 200.00 300.00 220.00 420.00 272.52 200.00
21 Soft Coke 40 Kg. - - - - - -
22 Kerosene Oil Litre 15.00 15.00 15.00 15.00 15.00 15.00
23 Toilet Soap 75gms. 15.94 15.38 15.88 12.90 16.50 12.45
24 Washing Soap 225 gms.. 9.31 18.00 12.99 13.95 14.06 13.50

Indian Labour Journal, January 2014
35
Doom
Dooma
Tinsukia
Guwa
hati
Labac
Silchar
Mariani
Jorhat
Rangapara
Tezpur
Monghyr
Jamalpur Chandigarh
Bhilai
10 11 12 13 14 15 16 17
14.65 24.29 14.01 13.46 13.84 27.90 30.00 20.93
0.00
- - - - - 16.97 - 20.94
5.05 27.58 5.08 4.65 4.31 20.00 22.00 21.50
- - - - - - - -
70.00 78.00 67.00 76.00 - 74.00 77.33 69.00
90.00 78.50 87.00 84.00 75.00 80.00 80.00 76.00
68.00 56.00 80.00 73.50 72.00 60.00 69.00 56.00
- - - - - - - 134.34
105.00 107.00 107.00 105.00 110.00 84.18 90.50 88.01
98.00 100.00 - 98.50 - 75.00 72.00 70.00
293.33 300.00 350.00 280.00 290.00 345.00 320.00 300.00
151.67 158.75 190.00 225.00 180.00 117.50 110.00 200.00
33.33 42.50 41.50 36.00 36.50 35.00 35.00 38.50
- - - - - - 36.00 -
- - - - - 325.00 325.00 310.00
70.83 71.25 76.50 70.00 70.00 65.00 75.00 60.00
12.00 15.00 17.00 12.00 13.00 25.00 26.67 15.50
40.00 38.00 41.25 40.00 40.00 34.00 35.33 31.15
60.00 - 62.50 - 50.00 40.00 44.67 43.75
16.00 22.00 23.00 21.00 30.00 33.20 34.00 32.40
113.34 160.00 150.00 150.00 120.00 360.00 - 260.00
- - - - - 480.00 - -
16.00 15.00 15.00 15.00 16.00 16.43 14.75 14.95
12.60 11.54 12.60 12.60 12.60 16.50 16.50 15.38
25.20 24.37 12.50 13.23 13.23 12.50 8.33 10.47
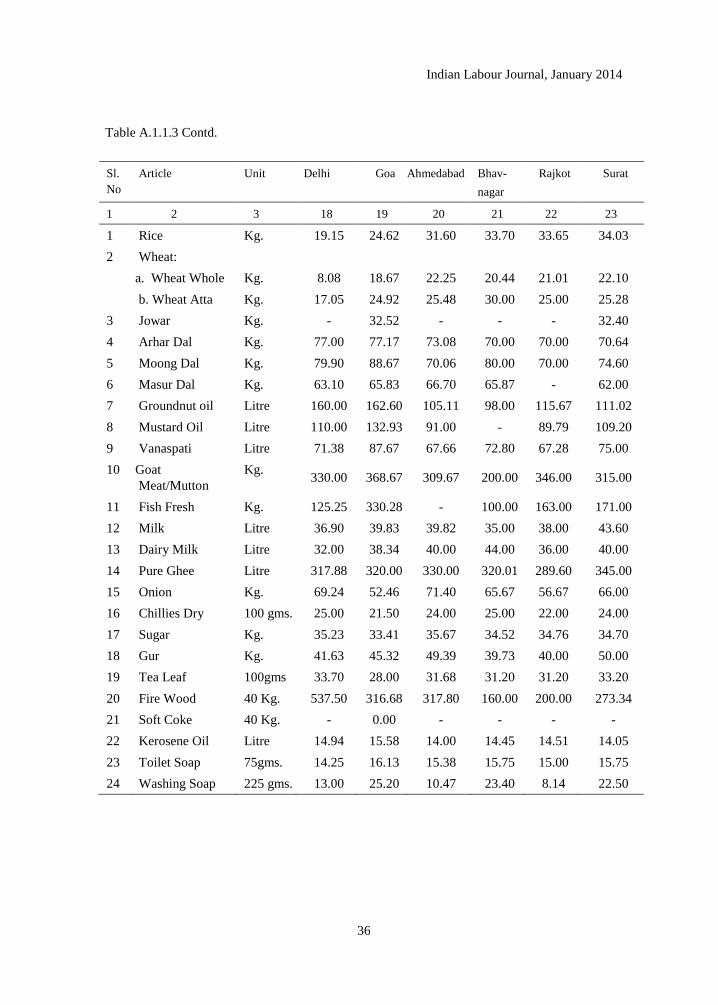
Indian Labour Journal, January 2014
36
Table A.1.1.3 Contd.
Sl.
No
Article Unit Delhi Goa Ahmedabad Bhav-
nagar
Rajkot Surat
1 2 3 18 19 20 21 22 23
1 Rice Kg. 19.15 24.62 31.60 33.70 33.65 34.03
2 Wheat:
a. Wheat Whole Kg. 8.08 18.67 22.25 20.44 21.01 22.10
b. Wheat Atta Kg. 17.05 24.92 25.48 30.00 25.00 25.28
3 Jowar Kg. - 32.52 - - - 32.40
4 Arhar Dal Kg. 77.00 77.17 73.08 70.00 70.00 70.64
5 Moong Dal Kg. 79.90 88.67 70.06 80.00 70.00 74.60
6 Masur Dal Kg. 63.10 65.83 66.70 65.87 - 62.00
7 Groundnut oil Litre 160.00 162.60 105.11 98.00 115.67 111.02
8 Mustard Oil Litre 110.00 132.93 91.00 - 89.79 109.20
9 Vanaspati Litre 71.38 87.67 67.66 72.80 67.28 75.00
10 Goat
Meat/Mutton
Kg. 330.00 368.67 309.67 200.00 346.00 315.00
11 Fish Fresh Kg. 125.25 330.28 - 100.00 163.00 171.00
12 Milk Litre 36.90 39.83 39.82 35.00 38.00 43.60
13 Dairy Milk Litre 32.00 38.34 40.00 44.00 36.00 40.00
14 Pure Ghee Litre 317.88 320.00 330.00 320.01 289.60 345.00
15 Onion Kg. 69.24 52.46 71.40 65.67 56.67 66.00
16 Chillies Dry 100 gms. 25.00 21.50 24.00 25.00 22.00 24.00
17 Sugar Kg. 35.23 33.41 35.67 34.52 34.76 34.70
18 Gur Kg. 41.63 45.32 49.39 39.73 40.00 50.00
19 Tea Leaf 100gms 33.70 28.00 31.68 31.20 31.20 33.20
20 Fire Wood 40 Kg. 537.50 316.68 317.80 160.00 200.00 273.34
21 Soft Coke 40 Kg. - 0.00 - - - -
22 Kerosene Oil Litre 14.94 15.58 14.00 14.45 14.51 14.05
23 Toilet Soap 75gms. 14.25 16.13 15.38 15.75 15.00 15.75
24 Washing Soap 225 gms. 13.00 25.20 10.47 23.40 8.14 22.50
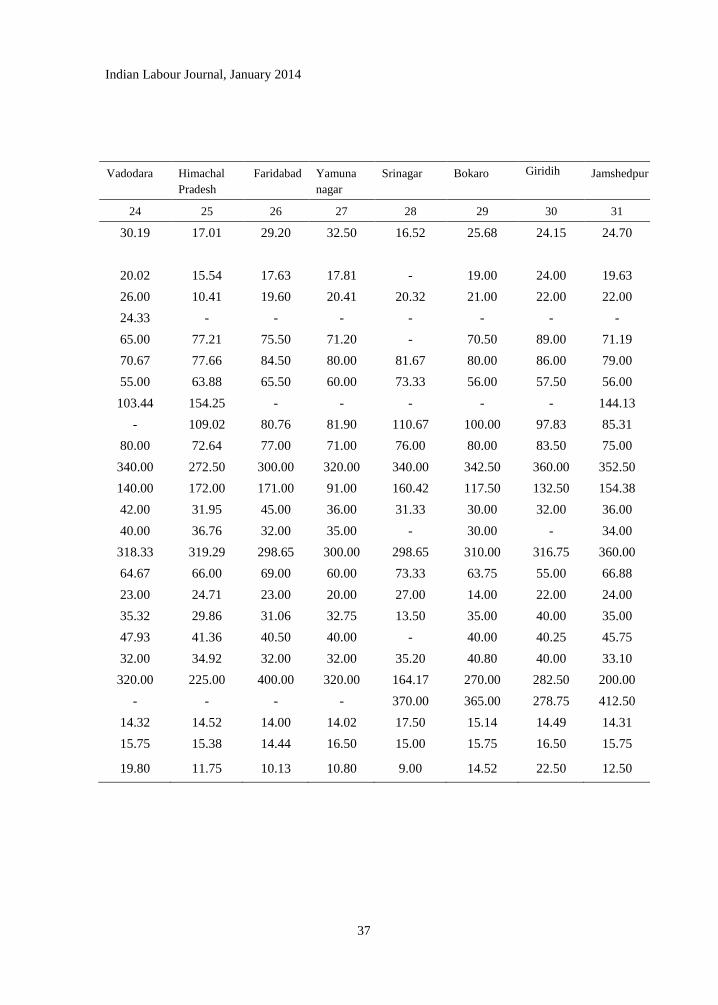
Indian Labour Journal, January 2014
37
Vadodara Himachal
Pradesh
Faridabad Yamuna
nagar
Srinagar Bokaro Giridih Jamshedpur
24 25 26 27 28 29 30 31
30.19 17.01 29.20 32.50 16.52 25.68 24.15 24.70
20.02 15.54 17.63 17.81 - 19.00 24.00 19.63
26.00 10.41 19.60 20.41 20.32 21.00 22.00 22.00
24.33 - - - - - - -
65.00 77.21 75.50 71.20 - 70.50 89.00 71.19
70.67 77.66 84.50 80.00 81.67 80.00 86.00 79.00
55.00 63.88 65.50 60.00 73.33 56.00 57.50 56.00
103.44 154.25 - - - - - 144.13
- 109.02 80.76 81.90 110.67 100.00 97.83 85.31
80.00 72.64 77.00 71.00 76.00 80.00 83.50 75.00
340.00 272.50 300.00 320.00 340.00 342.50 360.00 352.50
140.00 172.00 171.00 91.00 160.42 117.50 132.50 154.38
42.00 31.95 45.00 36.00 31.33 30.00 32.00 36.00
40.00 36.76 32.00 35.00 - 30.00 - 34.00
318.33 319.29 298.65 300.00 298.65 310.00 316.75 360.00
64.67 66.00 69.00 60.00 73.33 63.75 55.00 66.88
23.00 24.71 23.00 20.00 27.00 14.00 22.00 24.00
35.32 29.86 31.06 32.75 13.50 35.00 40.00 35.00
47.93 41.36 40.50 40.00 - 40.00 40.25 45.75
32.00 34.92 32.00 32.00 35.20 40.80 40.00 33.10
320.00 225.00 400.00 320.00 164.17 270.00 282.50 200.00
- - - - 370.00 365.00 278.75 412.50
14.32 14.52 14.00 14.02 17.50 15.14 14.49 14.31
15.75 15.38 14.44 16.50 15.00 15.75 16.50 15.75
19.80 11.75 10.13 10.80 9.00 14.52 22.50 12.50

Indian Labour Journal, January 2014
38
Table A.1.1.3 Contd.
Sl.
No
Article Unit Jharia Kodar-
ma
Ranchi
Hatia
Bangalore Belgaum Hubli
Dharwar
Mercara
1 2 3 32 33 34 35 36 37 38
1 Rice Kg. 25.90 19.98 23.13 38.70 29.96 32.62 28.04
2 Wheat:
a. Wheat Whole Kg. 19.30 16.75 26.02 26.86 24.02 27.45 28.81
b. Wheat Atta Kg. 20.35 20.75 22.67 24.89 - - 41.25
3 Jowar Kg. - - - - 26.00 23.25 -
4 Arhar Dal Kg. 71.40 70.00 74.96 74.73 69.50 73.95 82.25
5 Moong Dal Kg. 80.35 75.00 84.67 83.08 69.00 70.25 87.38
6 Masur Dal Kg. 59.60 55.00 62.00 .- 62.25 60.00 -
7 Groundnut oil Litre - - - 83.71 91.63 81.22 109.00
8 Mustard Oil Litre 79.03 83.04 95.00 - - - -
9 Vanaspati Litre 70.60 76.50 75.00 69.38 79.69 73.01 86.25
10 Goat Meat/ Mutton Kg. 352.50 322.50 334.00 385.00 340.00 331.25 327.50
11 Fish Fresh Kg. 128.50 132.50 150.00 140.00 100.00 80.00 170.00
12 Milk Litre 34.00 38.00 34.73 29.08 42.00 45.00 28.75
13 Dairy Milk Litre - - 30.00 30.00 30.00 30.76 -
14 Pure Ghee Litre 334.85 325.00 310.00 334.00 334.00 334.00 -
15 Onion Kg. 64.10 59.38 56.50 47.90 42.50 48.93 40.63
16 Chillies Dry 100 gms. 27.00 16.00 25.00 13.33 14.00 20.00 8.64
17 Sugar Kg. 35.15 35.50 38.00 33.73 32.37 32.64 36.42
18 Gur Kg. 43.40 41.75 48.00 55.07 39.25 41.60 44.00
19 Tea Leaf 100gms 34.32 27.60 40.00 33.00 32.00 25.00 32.00
20 Fire Wood 40 Kg. 200.00 261.25 350.00 230.00 248.00 280.00 160.00
21 Soft Coke 40 Kg. 200.00 383.13 360.00 - - - -
22 Kerosene Oil Litre 14.27 15.00 14.75 16.20 16.20 16.20 16.58
23 Toilet Soap 75gm 16.50 12.60 16.50 16.50 16.50 15.75 15.75
24 Washing Soap 225 gms. 22.50 22.50 8.04 14.40 14.40 7.97 14.40

Indian Labour Journal, January 2014
39
Mysore Erna-
kulam
Munda-
kayam
Quilon Bhopal Chhind-
wara
Indore Jabalpur Mumbai
39 40 41 42 43 44 45 46 47
41.81 27.09 32.60 27.56 32.75 25.01 25.47 22.20 37.20
30.57 7.36 14.34 6.36 18.31 17.52 24.33 19.48 21.86
32.00 34.00 32.03 25.00 20.00 22.00 20.25 20.00 -
- - - - - - - - 34.18
80.00 79.38 77.58 50.75 70.00 70.00 73.20 68.30 80.49
80.50 76.69 82.90 73.50 76.00 80.00 80.80 81.60 84.62
62.25 65.08 58.00 53.00 61.40 57.00 65.51
109.00 116.00 145.00 168.50 102.38 152.00 136.28
- - - - 110.00 92.50 81.90 100.00 96.54
95.50 - - 67.00 78.00 69.70 70.00 101.63
340.00 400.00 410.00 440.00 340.00 280.00 354.33 292.00 368.50
80.00 123.75 118.83 117.50 206.67 100.00 178.67 142.50 585.94
32.00 35.00 34.33 36.00 45.00 41.00 35.60 44.80 53.11
30.00 35.00 35.00 39.34 32.00 40.00 36.00 32.00
334.00 365.00 333.33 307.70 340.00 322.18 334.84
62.50 68.07 64.17 67.88 70.00 54.50 58.00 61.50 61.88
10.00 9.20 10.48 10.50 15.00 15.00 15.75 15.00 21.70
35.06 33.75 34.03 34.75 32.68 34.74 31.24 34.56 37.45
53.25 50.00 48.16 50.50 45.00 34.40 41.45 39.50 58.33
31.00 29.00 22.33 27.00 35.20 32.80 34.40 32.80 39.39
220.00 80.00 216.00 176.00 300.00 232.00 240.00 182.00 -
- - - - - - - - -
16.20 16.00 16.00 15.50 15.51 16.56 15.19 15.30 15.11
16.13 17.81 12.80 18.00 16.50 15.75 15.00 15.75 17.50
16.20 13.95 16.90 14.06 24.30 9.00 23.40 25.20 23.18

Indian Labour Journal, January 2014
40
Table A.1.1.3 Contd.
Sl.
No
Article Unit Nagpur Nasik Pune Sholapur Angul-
Talcher
Rourkela Puducherry
1 2 3 48 49 50 51 52 53 54
1 Rice Kg. 33.31 24.41 34.33 26.26 23.77 27.81 42.71
2 Wheat:
a. Wheat
Whole
Kg. 22.33 18.93 22.90 15.64 7.51 - 1.15
b. Wheat Atta Kg. 24.17 24.00 - 25.00 19.19 19.07 40.50
3 Jowar Kg. - 25.00 31.57 27.20 - - -
4 Arhar Dal Kg. 71.58 71.60 76.08 70.00 71.00 78.00 77.50
5 Moong Dal Kg. 82.93 80.00 84.40 76.80 80.00 86.00 80.00
6 Masur Dal Kg. 62.50 62.00 63.17 60.00 70.00 64.50 -
7 Groundnut oil Litre 96.87 109.20 132.17 94.64 120.00 - 83.49
8 Mustard Oil Litre 120.00 134.00 - - 90.00 87.13 -
9 Vanaspati Litre 86.37 64.58 81.86 90.00 80.00 90.00 76.00
10 Goat
Meat/Mutton
Kg. 380.00 350.00 365.33 340.00 375.00 320.00 420.00
11 Fish Fresh Kg. 203.33 600.00 641.67 150.00 160.00 155.00 650.00
12 Milk Litre 40.00 46.93 44.00 40.00 28.00 30.00 28.00
13 Dairy Milk Litre 32.00 34.00 30.00 32.00 - 26.00 26.00
14 Pure Ghee Litre 325.00 325.00 390.00 0.00 321.28 - 309.40
15 Onion Kg. 54.50 65.00 66.00 45.20 55.63 57.50 39.00
16 Chillies Dry 100 gms. 16.00 38.89 21.50 24.50 15.00 15.50 9.75
17 Sugar Kg. 33.80 33.89 31.67 30.61 38.69 37.00 33.40
18 Gur Kg. 49.23 48.00 49.93 40.00 42.00 - 52.50
19 Tea Leaf 100gms 38.78 36.00 28.25 22.23 44.80 30.00 40.38
20 Fire Wood 40 Kg. 300.00 240.00 293.32 320.00 240.00 240.00 240.00
21 Soft Coke 40 Kg. - - - - 200.00 - -
22 Kerosene Oil Litre 15.31 14.88 15.25 16.00 14.08 13.82 14.25
23 Toilet Soap 75gms 18.33 15.75 16.50 15.75 15.75 16.50 16.88
24 Washing Soap 225 gms. 22.50 18.00 7.50 25.20 22.50 18.00 13.73

Indian Labour Journal, January 2014
41
Amritsar Jalandhar Ludhiana Ajmer Bhilwara Jaipur Chennai Coimba-
tore
Coonoor Madurai
55 56 57 58 59 60 61 62 63 64
22.88 26.00 25.00 35.00 35.25 38.50 25.59 21.89 14.18 25.32
- 10.21 - 20.20 17.91 19.90 17.14 23.08 11.33 20.72
20.00 19.48 20.00 22.25 24.50 22.00 39.92 42.00 43.00 40.40
- - - - - - - - - -
75.40 70.00 70.40 77.50 78.75 74.13 77.73 82.55 73.50 83.65
80.00 80.00 80.00 78.00 76.13 77.20 81.58 81.30 77.75 85.85
70.00 70.00 72.00 59.00 58.75 60.00 - - 62.75 -
- - - 150.00 147.50 157.67 99.17 117.75 117.74 100.46
101.12 105.00 104.25 110.00 120.00 110.00 - - -
70.00 70.00 73.00 70.00 - 68.00 74.77 - - 75.20
300.00 310.00 320.00 320.00 290.00 319.33 440.00 410.00 392.00 400.00
200.00 150.00 160.00 250.00 195.00 - 461.42 600.00 158.00 134.00
35.00 36.00 38.00 40.00 36.50 40.00 - 28.00 31.00 30.00
- 36.00 35.00 32.00 31.00 32.00 27.00 32.00 36.00 30.00
330.00 340.00 335.00 305.00 310.00 350.00 290.00 340.50 300.30 327.60
75.60 65.00 72.00 63.75 68.75 81.34 51.68 58.95 66.00 70.00
25.00 25.00 26.00 22.50 21.75 20.00 16.62 11.25 11.00 7.60
35.00 35.00 34.30 35.00 36.00 35.21 20.41 26.54 28.76 28.05
- - - 42.00 40.00 40.00 54.43 59.65 - 53.80
32.00 34.80 34.80 34.00 30.00 34.69 42.75 42.75 43.00 41.50
380.00 280.00 320.00 290.00 232.50 320.00 333.76 300.00 280.00 200.00
- - - - - - - - - -
14.64 14.90 14.31 17.25 17.25 17.25 13.70 13.90 14.10 14.00
13.50 14.25 15.75 16.50 16.50 16.50 16.94 16.97 17.44 16.88
11.25 11.25 13.50 12.15 10.29 10.80 13.95 22.50 14.07 24.08

Indian Labour Journal, January 2014
42
Table A.1.1.3 Concld.
Sl.
No
Article Unit Salem Tiruchira
pally
Tripura Agra Ghaziabad Kanpur Lucknow
1 2 3 65 66 67 68 69 70 71
1 Rice Kg. 28.77 19.29 18.82 25.81 30.00 37.02 29.97
2 Wheat:
a. Wheat Whole Kg. 19.01 19.78 - 15.49 6.60 11.53 16.26
b. Wheat Atta Kg. 36.50 39.00 12.27 20.00 20.92 20.00 22.00
3 Jowar Kg. - - - - - - -
4 Arhar Dal Kg. 71.25 72.00 - 72.00 73.00 70.58 72.50
5 Moong Dal Kg. 80.10 78.60 79.00 80.00 75.00 82.83 80.00
6 Masur Dal Kg. - 66.50 78.98 60.00 70.00 60.08 60.00
7 Groundnut oil Litre 85.98 90.50 - - - - -
8 Mustard Oil Litre - - 94.63 72.07 90.00 80.61 90.00
9 Vanaspati Litre - - - 69.50 65.00 67.92 70.00
10 Goat
Meat/Mutton
Kg. 380.00 430.00 405.75 312.00 350.00 322.50 360.00
11 Fish Fresh Kg. 480.00 80.00 197.50 120.00 120.00 136.04 170.00
12 Milk Litre 30.00 35.00 36.60 37.00 42.00 40.08 40.00
13 Dairy Milk Litre 27.00 36.00 - 35.00 38.40 31.66 37.68
14 Pure Ghee Litre - 360.00 - 320.00 320.00 310.00 324.00
15 Onion Kg. 56.25 56.00 72.78 58.00 58.00 69.38 63.00
16 Chillies Dry 100
gms 9.71 8.98 22.23 25.00 24.00 16.00 26.00
17 Sugar Kg. 15.57 23.45 14.81 34.91 34.00 35.28 35.88
18 Gur Kg. - 59.80 54.35 40.00 38.60 40.54 45.05
19 Tea Leaf 100gms 42.00 42.50 20.00 34.80 34.00 32.40 34.80
20 Fire Wood 40 Kg. 144.00 160.00 121.00 280.00 320.00 380.00 320.00
21 Soft Coke 40 Kg. - - - - - 520.00 -
22 Kerosene Oil Litre 14.00 13.90 15.06 15.28 15.95 15.73 15.53
23 Toilet Soap 75gms 16.50 16.88 12.60 15.00 15.00 15.25 16.50
24 Washing Soap 225gms 14.18 13.95 12.50 25.20 11.25 10.13 25.20
- = Items do not feature in index basket of respective centres.
Notes 1. ―The prices are average prices based on individual quotations obtained from
selected outlets in a given centre and are not comparable between centres as they
relate to different varieties of varying specifications‖.
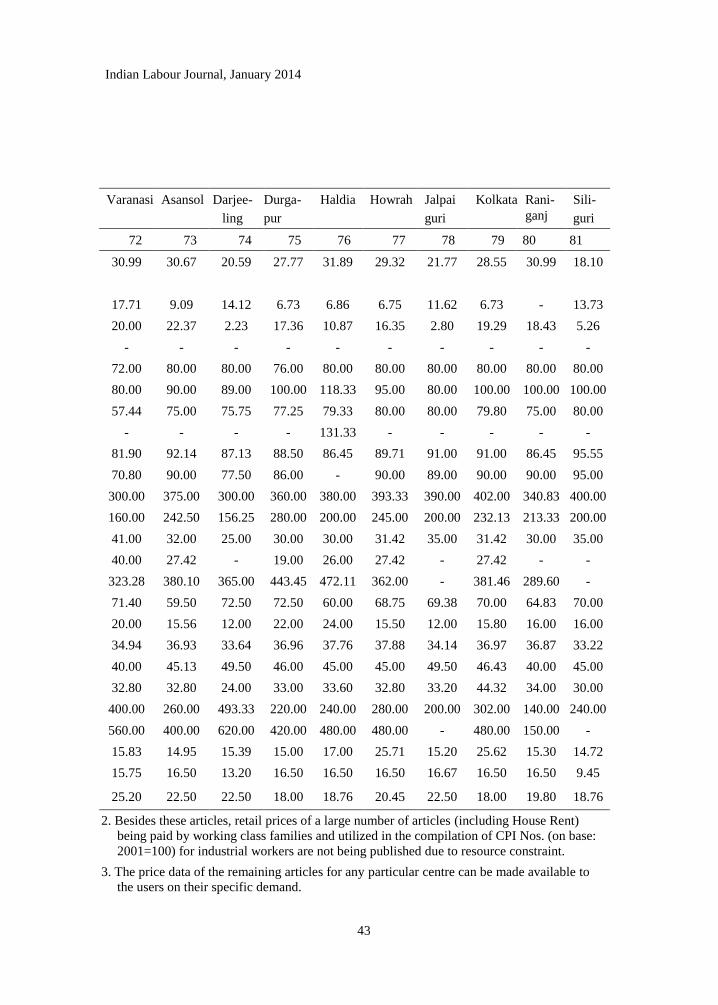
Indian Labour Journal, January 2014
43
Varanasi Asansol Darjee-
ling
Durga-
pur
Haldia Howrah Jalpai
guri
Kolkata Rani-
ganj
Sili-
guri
72 73 74 75 76 77 78 79 80 81
30.99 30.67 20.59 27.77 31.89 29.32 21.77 28.55 30.99 18.10
17.71 9.09 14.12 6.73 6.86 6.75 11.62 6.73 - 13.73
20.00 22.37 2.23 17.36 10.87 16.35 2.80 19.29 18.43 5.26
- - - - - - - - - -
72.00 80.00 80.00 76.00 80.00 80.00 80.00 80.00 80.00 80.00
80.00 90.00 89.00 100.00 118.33 95.00 80.00 100.00 100.00 100.00
57.44 75.00 75.75 77.25 79.33 80.00 80.00 79.80 75.00 80.00
- - - - 131.33 - - - - -
81.90 92.14 87.13 88.50 86.45 89.71 91.00 91.00 86.45 95.55
70.80 90.00 77.50 86.00 - 90.00 89.00 90.00 90.00 95.00
300.00 375.00 300.00 360.00 380.00 393.33 390.00 402.00 340.83 400.00
160.00 242.50 156.25 280.00 200.00 245.00 200.00 232.13 213.33 200.00
41.00 32.00 25.00 30.00 30.00 31.42 35.00 31.42 30.00 35.00
40.00 27.42 - 19.00 26.00 27.42 - 27.42 - -
323.28 380.10 365.00 443.45 472.11 362.00 - 381.46 289.60 -
71.40 59.50 72.50 72.50 60.00 68.75 69.38 70.00 64.83 70.00
20.00 15.56 12.00 22.00 24.00 15.50 12.00 15.80 16.00 16.00
34.94 36.93 33.64 36.96 37.76 37.88 34.14 36.97 36.87 33.22
40.00 45.13 49.50 46.00 45.00 45.00 49.50 46.43 40.00 45.00
32.80 32.80 24.00 33.00 33.60 32.80 33.20 44.32 34.00 30.00
400.00 260.00 493.33 220.00 240.00 280.00 200.00 302.00 140.00 240.00
560.00 400.00 620.00 420.00 480.00 480.00 - 480.00 150.00 -
15.83 14.95 15.39 15.00 17.00 25.71 15.20 25.62 15.30 14.72
15.75 16.50 13.20 16.50 16.50 16.50 16.67 16.50 16.50 9.45
25.20 22.50 22.50 18.00 18.76 20.45 22.50 18.00 19.80 18.76
2. Besides these articles, retail prices of a large number of articles (including House Rent)
being paid by working class families and utilized in the compilation of CPI Nos. (on base:
2001=100) for industrial workers are not being published due to resource constraint.
3. The price data of the remaining articles for any particular centre can be made available to
the users on their specific demand.

Indian Labour Journal, January 2014
44
1.2.Consumer Price Index Numbers for Agricultural and Rural Labourers
Table A.1.2.1 (a) – Labour Bureau‘s Series of Consumer Price Index Numbers for Agricultural
Sl.
No.
State
Linking factor
for General
Index a
General Index Food Index
Sept.,
2013
Oct.,
2013
Sept.,
2013
Oct.,
2013
1 2 3 4 5 6 7
1 Andhra Pradesh 4.84 819 821 838 840
2 Assam b 723 727 724 730
3 Bihar 6.22 671 686 629 648
4 Gujarat 5.34 778 794 806 828
5 Haryana * 836 846 883 891
6 Himachal Pradesh * 608 616 633 636
7 Jammu & Kashmir 5.98 721 737 749 771
8 Karnataka 5.81 832 831 865 859
9 Kerala 6.56 754 767 758 772
10 Madhya Pradesh 6.04 733 738 720 723
11 Maharashtra 5.85 809 805 843 837
12 Manipur * 697 711 611 629
13 Meghalaya * 752 755 755 758
14 Orissa 6.05 701 717 667 685
15 Punjab c 826 832 873 879
16 Rajasthan 6.15 814 819 806 803
17 Tamil Nadu 5.67 764 768 706 704
18 Tripura * 647 664 656 674
19 Uttar Pradesh 6.60 721 729 738 747
20 West Bengal 5.73 722 732 681 692
All-India 5.89 759 766 751 759
a = The indices for a given month of old base (1960-61) can be obtained by multiplying the
index number of new base (1986-87) of that month by the relevant linking factors which
are applicable to Agricultural Labourers only.

Indian Labour Journal, January 2014
45
Labourers (Group-wise and General) (Base: 1986-87=100)
Pan, Supari, Tobacco
& Intoxicants Index
Fuel & Light Index Clothing, Bedding &
Footwear Index
Miscellaneous Index
Sept.,
2013
Oct.,
2013
Sept.,
2013
Oct.,
2013
Sept.,
2013
Oct.,
2013
Sept.,
2013
Oct.,
2013
8 9 10 11 12 13 14 15
1017 1012 815 815 764 769 709 714
911 914 713 710 711 702 582 583
813 815 926 944 823 828 672 663
1109 1109 633 634 624 633 709 710
813 830 1042 1083 748 754 590 592
1002 1002 364 365 539 548 657 700
1170 1177 499 499 675 675 718 715
1089 1106 609 614 721 728 801 808
1203 1202 700 749 699 698 661 664
1017 1016 856 860 696 706 652 667
947 962 863 838 638 642 678 681
1012 1000 1477 1499 712 718 604 603
817 828 720 720 764 764 689 689
920 945 966 957 804 815 607 628
956 959 1126 1126 605 616 619 620
1177 1188 1063 1137 672 678 726 728
1256 1284 876 909 700 708 866 873
900 915 456 473 667 667 603 632
858 861 782 788 694 699 581 587
786 792 903 906 1026 1037 762 765
1004 1011 837 844 728 734 696 700
b & c = To obtain linking factors for Assam and Punjab, please consult article in February, 1996
issue of the Indian Labour Journal.
* = Indices compiled and published for the first time w.e.f. November, 1995.
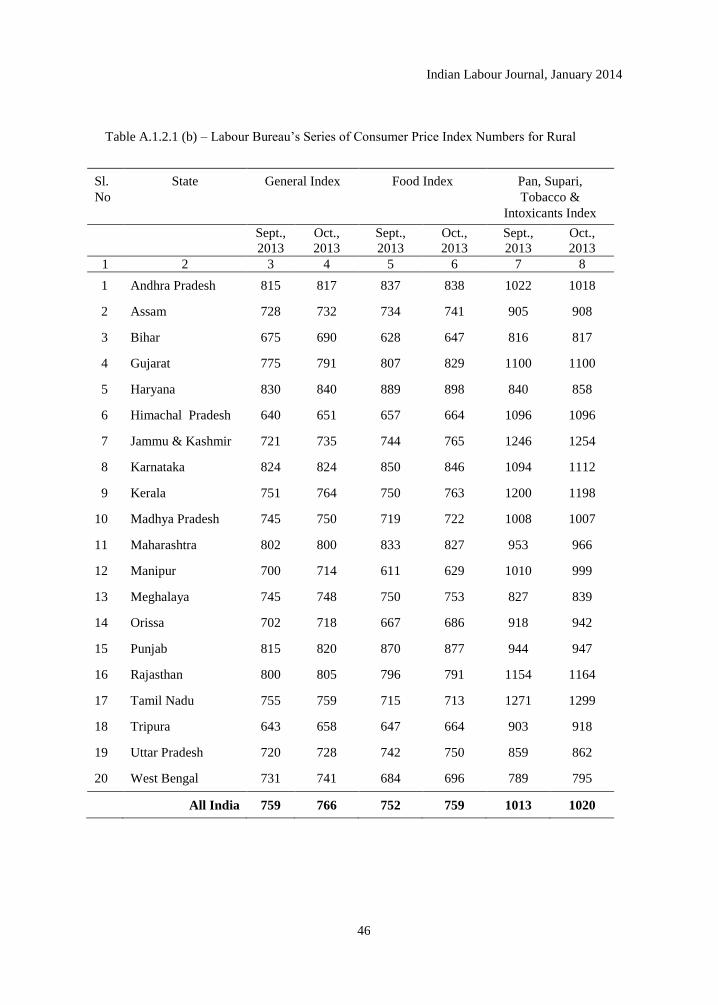
Indian Labour Journal, January 2014
46
Table A.1.2.1 (b) – Labour Bureau‘s Series of Consumer Price Index Numbers for Rural
Sl.
No
State General Index Food Index Pan, Supari,
Tobacco &
Intoxicants Index
Sept.,
2013
Oct.,
2013
Sept.,
2013
Oct.,
2013
Sept.,
2013
Oct.,
2013
1 2 3 4 5 6 7 8
1 Andhra Pradesh 815 817 837 838 1022 1018
2 Assam 728 732 734 741 905 908
3 Bihar 675 690 628 647 816 817
4 Gujarat 775 791 807 829 1100 1100
5 Haryana 830 840 889 898 840 858
6 Himachal Pradesh 640 651 657 664 1096 1096
7 Jammu & Kashmir 721 735 744 765 1246 1254
8 Karnataka 824 824 850 846 1094 1112
9 Kerala 751 764 750 763 1200 1198
10 Madhya Pradesh 745 750 719 722 1008 1007
11 Maharashtra 802 800 833 827 953 966
12 Manipur 700 714 611 629 1010 999
13 Meghalaya 745 748 750 753 827 839
14 Orissa 702 718 667 686 918 942
15 Punjab 815 820 870 877 944 947
16 Rajasthan 800 805 796 791 1154 1164
17 Tamil Nadu 755 759 715 713 1271 1299
18 Tripura 643 658 647 664 903 918
19 Uttar Pradesh 720 728 742 750 859 862
20 West Bengal 731 741 684 696 789 795
All India 759 766 752 759 1013 1020

Indian Labour Journal, January 2014
47
Labourers (Group wise and General) (Base: 1986-87=100)
Fuel & Light Index Clothing, Bedding &
Footwear Index
Miscellaneous Index
Sept.,
2013
Oct.,
2013
Sept.,
2013
Oct.,
2013
Sept.,
2013
Oct.,
2013
9 10 11 12 13 14
809 809 750 755 711 715
709 704 722 714 574 576
928 946 829 831 678 670
634 635 631 647 708 709
1043 1083 713 718 588 590
374 375 631 642 657 705
499 499 678 677 703 701
611 616 699 704 841 847
698 747 710 711 679 683
854 858 801 806 668 684
854 833 694 705 674 684
1481 1502 723 730 594 592
719 719 670 670 690 690
963 954 801 811 607 628
1115 1115 666 673 617 619
1066 1149 695 699 696 699
869 902 655 663 781 788
453 471 665 666 597 610
784 791 719 723 548 555
933 936 992 1000 782 785
834 843 737 744 691 697

Indian Labour Journal, January 2014
48
Table A.1.2.2 (a) - State-wise monthly consumer prices of selected articles of Agricultural
Sl.
No.
Item Unit Andhra Pradesh Assam Bihar Gujarat
1 2 3 4 5 6 7
1. Rice Kg. 16.35 20.51 15.83 18.24
2. Wheat:
(a) Wheat whole Kg. - - 12.94 5.16
(b) Wheat Atta Kg. 23.26 18.07 21.87
3. Jowar Kg. 24.54 - - -
4. Bajra:
(a) Bajra whole Kg. 18.75 - - 15.71
(b) Bajra Atta Kg. - - - 18.97
5. Maize:
(a) Maize whole Kg. - - 13.25 15.65
(b) Maize Atta Kg. - - - 19.35
6. Ragi Kg. 26.67 - - -
7. Arhar Dal Kg. 66.95 70.85 70.61 65.58
8. Groundnut Oil Litre 94.35 - - 114.59
9. Mustard Oil Litre - 109.41 91.20
10. Goat Meat/Mutton Kg. 372.44 291.63 312.06 300.65
11. Fish Fresh Kg. 139.31 246.37 139.46 88.23
12. Milk Litre 34.64 40.21 29.65 38.95
13. Onion Kg. 42.32 67.69 63.13 39.51
14. Chillies Dry 100Gms 10.25 16.97 10.51 12.72
15. Potato Kg. 20.80 18.75 14.25 20.92
16. Sugar Kg. 18.99 22.72 35.69 29.35
17. Gur Kg. 45.88 50.17 39.08 42.70
18. Tea Leaf 100Gms 38.58 20.33 27.19 22.61
19. Firewood 40 Kg. 144.38 123.69 215.11 70.52
20. Kerosene Oil Litre 15.00 16.31 16.84 14.47

Indian Labour Journal, January 2014
49
Labourers for the month October, 2013 (Base: 1986-87=100)
Haryana Himachal
Pradesh
Jammu &
Kashmir
Karnataka Kerala Madhya Pradesh
8 9 10 11 12 13
25.14 18.69 22.00 9.08 22.70 17.61
- - - - 4.01 8.35
18.37 8.33 19.92 25.87 31.58 18.59
- - - 20.87 - 16.63
15.21 - - - - -
19.33 - 15.91 - - 14.87
- 15.00 - - - -
- - - 21.77 - -
74.00 75.43 71.09 69.08 69.73
- - - 99.08 - 127.14
76.63 106.36 106.12 - - 82.14
301.72 255.56 297.03 328.47 411.55 286.30
95.00 144.00 176.67 201.81 77.45 122.41
38.02 31.56 27.80 27.86 34.09 29.83
61.86 63.44 63.15 40.93 69.86 56.23
13.33 14.67 20.27 11.06 9.38 10.59
17.79 20.11 21.84 20.21 23.92 16.31
29.41 13.50 17.05 22.89 29.37 14.58
38.54 40.11 42.53 42.46 51.04 36.93
21.43 29.22 33.45 30.90 24.76 20.18
250.34 N.A. 174.41 93.70 161.00 153.50
14.16 14.75 14.46 16.30 16.01 15.97
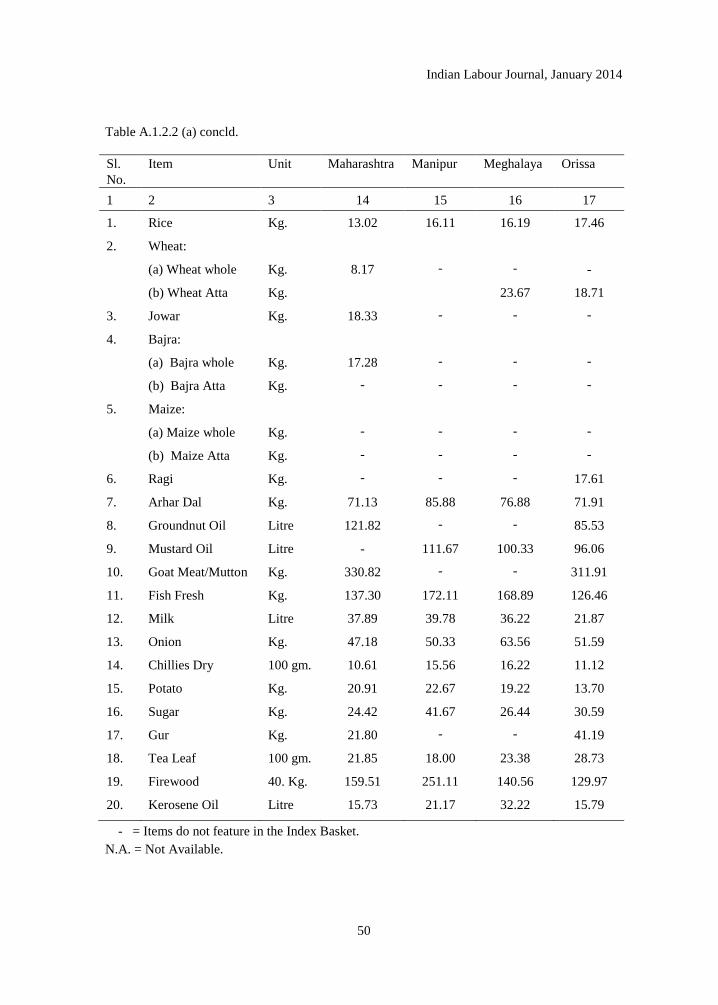
Indian Labour Journal, January 2014
50
Table A.1.2.2 (a) concld.
Sl.
No.
Item Unit Maharashtra Manipur Meghalaya Orissa
1 2 3 14 15 16 17
1. Rice Kg. 13.02 16.11 16.19 17.46
2. Wheat:
(a) Wheat whole Kg. 8.17 - - -
(b) Wheat Atta Kg. 23.67 18.71
3. Jowar Kg. 18.33 - - -
4. Bajra:
(a) Bajra whole Kg. 17.28 - - -
(b) Bajra Atta Kg. - - - -
5. Maize:
(a) Maize whole Kg. - - - -
(b) Maize Atta Kg. - - - -
6. Ragi Kg. - - - 17.61
7. Arhar Dal Kg. 71.13 85.88 76.88 71.91
8. Groundnut Oil Litre 121.82 - - 85.53
9. Mustard Oil Litre - 111.67 100.33 96.06
10. Goat Meat/Mutton Kg. 330.82 - - 311.91
11. Fish Fresh Kg. 137.30 172.11 168.89 126.46
12. Milk Litre 37.89 39.78 36.22 21.87
13. Onion Kg. 47.18 50.33 63.56 51.59
14. Chillies Dry 100 gm. 10.61 15.56 16.22 11.12
15. Potato Kg. 20.91 22.67 19.22 13.70
16. Sugar Kg. 24.42 41.67 26.44 30.59
17. Gur Kg. 21.80 - - 41.19
18. Tea Leaf 100 gm. 21.85 18.00 23.38 28.73
19. Firewood 40. Kg. 159.51 251.11 140.56 129.97
20. Kerosene Oil Litre 15.73 21.17 32.22 15.79
- = Items do not feature in the Index Basket.
N.A. = Not Available.

Indian Labour Journal, January 2014
51
Punjab Rajasthan Tamil
Nadu
Tripura Uttar
Pradesh
West Bengal
18 19 20 21 22 23
27.69 29.24 6.34 17.90 15.52 22.57
14.26 6.96 - - 7.28 -
18.14 19.25 35.02 24.89 16.71 10.21
- 21.75 21.79 - 19.87 -
- 13.56 21.36 - 13.21 -
- 14.44 - - 13.94 -
21.63 - - - - -
- - 25.49 - - -
- 71.86 73.34 - 70.90 71.83
- 119.77 103.49 - - -
95.49 83.02 - 109.44 82.20 88.81
299.08 297.60 394.61 396.67 297.00 363.98
- - 130.38 187.78 114.42 152.76
34.71 33.48 25.77 33.89 32.64 26.30
62.49 62.40 59.26 76.11 61.84 61.03
14.66 11.45 9.56 18.56 12.18 13.02
15.01 16.54 24.64 19.67 14.66 12.47
35.14 19.18 13.50 13.50 19.68 35.88
40.22 39.61 50.93 49.22 38.33 39.60
21.06 20.48 41.36 16.11 28.33 19.56
242.99 187.60 174.77 134.00 224.11 182.20
15.26 15.75 14.01 15.47 15.60 15.00
Note:- The prices are average prices based on individual quotations obtained from the selected
outlets of the sample villages of a given State and are not comparable with each other due
to their varying specifications. Besides, the prices of all the items utilised in compilation
of C.P.I. Numbers for Agricultural Labourers are not being published due to resource
constraints.
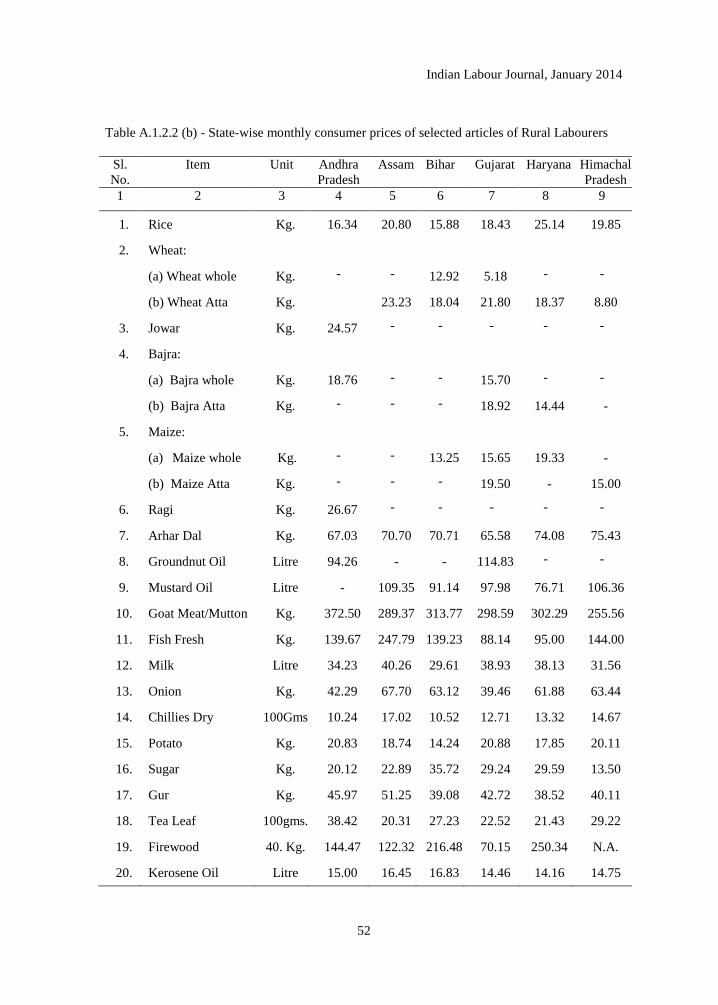
Indian Labour Journal, January 2014
52
Table A.1.2.2 (b) - State-wise monthly consumer prices of selected articles of Rural Labourers
Sl.
No.
Item Unit Andhra
Pradesh
Assam Bihar Gujarat Haryana Himachal
Pradesh
1 2 3 4 5 6 7 8 9
1. Rice Kg. 16.34 20.80 15.88 18.43 25.14 19.85
2. Wheat:
(a) Wheat whole Kg. - - 12.92 5.18 - -
(b) Wheat Atta Kg. 23.23 18.04 21.80 18.37 8.80
3. Jowar Kg. 24.57 - - - - -
4. Bajra:
(a) Bajra whole Kg. 18.76 - - 15.70 - -
(b) Bajra Atta Kg. - - - 18.92 14.44 -
5. Maize:
(a) Maize whole Kg. - - 13.25 15.65 19.33 -
(b) Maize Atta Kg. - - - 19.50 - 15.00
6. Ragi Kg. 26.67 - - - - -
7. Arhar Dal Kg. 67.03 70.70 70.71 65.58 74.08 75.43
8. Groundnut Oil Litre 94.26 - - 114.83 - -
9. Mustard Oil Litre - 109.35 91.14 97.98 76.71 106.36
10. Goat Meat/Mutton Kg. 372.50 289.37 313.77 298.59 302.29 255.56
11. Fish Fresh Kg. 139.67 247.79 139.23 88.14 95.00 144.00
12. Milk Litre 34.23 40.26 29.61 38.93 38.13 31.56
13. Onion Kg. 42.29 67.70 63.12 39.46 61.88 63.44
14. Chillies Dry 100Gms 10.24 17.02 10.52 12.71 13.32 14.67
15. Potato Kg. 20.83 18.74 14.24 20.88 17.85 20.11
16. Sugar Kg. 20.12 22.89 35.72 29.24 29.59 13.50
17. Gur Kg. 45.97 51.25 39.08 42.72 38.52 40.11
18. Tea Leaf 100gms. 38.42 20.31 27.23 22.52 21.43 29.22
19. Firewood 40. Kg. 144.47 122.32 216.48 70.15 250.34 N.A.
20. Kerosene Oil Litre 15.00 16.45 16.83 14.46 14.16 14.75

Indian Labour Journal, January 2014
53
for the month of October, 2013 (Base: 1986-87=100)
Jammu &
Kashmir
Karnataka Kerala Madhya
Pradesh
Maha-
rashtra
Manipur Megha-
laya
Orissa Punjab
10 11 12 13 14 15 16 17 18
20.48 9.17 22.69 17.35 13.61 16.09 16.33 17.47 27.69
- - 3.98 8.55 8.60 - - - 14.25
19.85 25.92 31.41 18.59 - - 23.67 18.74 18.14
- 20.86 - 16.60 18.17 - - - -
- - - - 17.41 - - - -
15.61 - - 14.83 - - - - -
- - - - - - - - 21.56
- 21.67 - - - - - 17.60 -
- 71.11 69.47 69.48 71.32 85.88 76.88 72.12 -
- 99.06 - 127.45 121.58 - - 85.46 -
105.90 - - 82.42 - 111.67 100.33 96.26 95.35
297.85 329.56 409.27 285.51 332.11 - - 314.34 299.78
176.67 202.91 77.59 122.56 135.08 172.11 168.89 126.46
27.69 27.85 34.11 29.91 38.59 39.78 36.22 21.87 34.58
63.47 40.97 69.92 56.06 47.10 50.33 63.56 51.62 62.54
19.83 11.07 9.38 10.57 10.52 15.56 16.22 11.12 14.66
21.77 20.22 23.86 16.32 20.88 22.67 19.22 13.74 15.01
17.38 23.51 29.68 14.91 25.20 41.67 26.44 30.47 35.14
42.30 42.45 51.05 36.89 21.92 - - 41.20 40.28
32.16 30.87 24.91 20.27 21.88 18.00 23.38 28.72 21.06
173.66 93.85 160.94 153.31 159.54 251.11 140.56 130.48 244.06
14.90 16.29 16.01 15.97 15.51 21.17 32.22 15.77 15.25
- = Items do not feature in the Index Basket.
N.A.= Not available

Indian Labour Journal, January 2014
54
Table A.1.2.2 (b)-Concld.
Sl.
No.
Item Unit Rajasthan Tamil
Nadu
Tripura Uttar
Pradesh
West
Bengal
1 2 3 19 20 21 22 23
1. Rice Kg. 29.57 6.94 17.70 15.56 22.58
2. Wheat:
(a) Wheat whole Kg. 8.01 - - 7.63 -
(b) Wheat Atta Kg. 19.23 35.14 24.89 16.61 10.52
3. Jowar Kg. 21.76 21.42 - 19.63 -
4. Bajra:
(a) Bajra whole Kg. 14.06 21.35 - 13.21 -
(b) Bajra Atta Kg. - - - - -
5. Maize:
( a ) Maize whole Kg. 14.38 - - 13.92 -
(b) Maize Atta Kg. - - - - -
6. Ragi Kg. - 25.47 - - -
7. Arhar Dal Kg. 72.32 73.25 - 70.87 72.80
8. Groundnut Oil Litre 119.70 103.93 - - -
9. Mustard Oil Litre 83.70 - 109.44 82.20 88.78
10. Goat Meat/Mutton Kg. 296.57 395.90 396.67 296.74 364.24
11. Fish Fresh Kg. - 130.76 187.78 113.72 151.22
12. Milk Litre 33.51 25.77 33.89 32.87 26.39
13. Onion Kg. 62.35 59.69 76.11 62.05 61.03
14. Chillies Dry 100gm. 11.46 9.52 18.56 12.14 13.03
15. Potato Kg. 16.38 24.94 19.67 14.86 12.45
16. Sugar Kg. 20.96 13.62 13.50 18.72 35.84
17. Gur Kg. 39.25 51.35 49.22 38.32 39.63
18. Tea Leaf 100 gm. 20.52 41.29 16.11 28.02 19.59
19. Firewood 40. Kg. 188.02 174.65 134.00 225.28 183.25
20. Kerosene Oil Litre 15.76 14.01 15.47 15.56 15.00
Note:-The prices are average prices based on individual quotations obtained from the selected outlets of the
sample villages of a given State and are not comparable with each other due to their varying
specifications. Besides, the prices of all the items utilized in compilation of C.P.I. Numbers. for
Rural Labourers are not being published due to resource constraints.
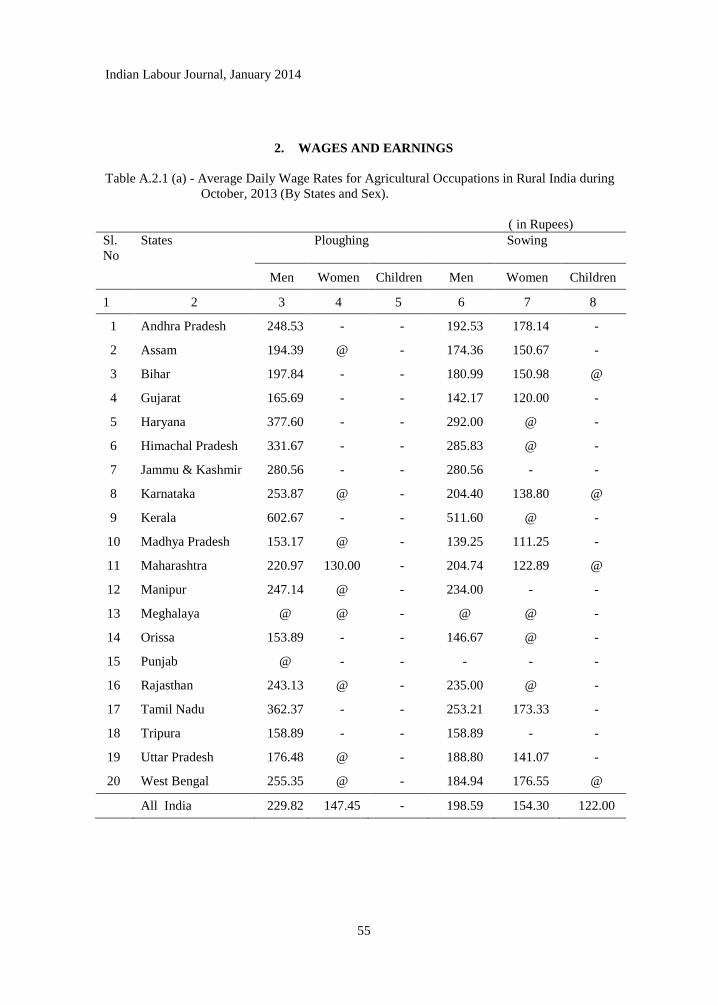
Indian Labour Journal, January 2014
55
2. WAGES AND EARNINGS
Table A.2.1 (a) - Average Daily Wage Rates for Agricultural Occupations in Rural India during
October, 2013 (By States and Sex).
( in Rupees)
Sl.
No
States Ploughing Sowing
Men Women Children Men Women Children
1 2 3 4 5 6 7 8
1 Andhra Pradesh 248.53 - - 192.53 178.14 -
2 Assam 194.39 @ - 174.36 150.67 -
3 Bihar 197.84 - - 180.99 150.98 @
4 Gujarat 165.69 - - 142.17 120.00 -
5 Haryana 377.60 - - 292.00 @ -
6 Himachal Pradesh 331.67 - - 285.83 @ -
7 Jammu & Kashmir 280.56 - - 280.56 - -
8 Karnataka 253.87 @ - 204.40 138.80 @
9 Kerala 602.67 - - 511.60 @ -
10 Madhya Pradesh 153.17 @ - 139.25 111.25 -
11 Maharashtra 220.97 130.00 - 204.74 122.89 @
12 Manipur 247.14 @ - 234.00 - -
13 Meghalaya @ @ - @ @ -
14 Orissa 153.89 - - 146.67 @ -
15 Punjab @ - - - - -
16 Rajasthan 243.13 @ - 235.00 @ -
17 Tamil Nadu 362.37 - - 253.21 173.33 -
18 Tripura 158.89 - - 158.89 - -
19 Uttar Pradesh 176.48 @ - 188.80 141.07 -
20 West Bengal 255.35 @ - 184.94 176.55 @
All India 229.82 147.45 - 198.59 154.30 122.00

Indian Labour Journal, January 2014
56
Table A.2.1 (a) Contd.
Sl. No States Weeding Transplantng
Men Women Children Men Women Children
1 2 9 10 11 12 13 14
1 Andhra Pradesh 202.85 151.33 @ @ 159.84 -
2 Assam 167.92 @ - 167.55 165.56 -
3 Bihar 160.21 142.99 @ 169.40 146.16 @
4 Gujarat 128.75 122.12 - 122.00 117.00 -
5 Haryana 295.00 @ - 288.29 293.33 -
6 Himachal Pradesh @ @ - - - -
7 Jammu & Kashmir 318.00 - - 281.88 - -
8 Karnataka 196.74 136.64 @ 204.21 135.75 -
9 Kerala @ 343.96 - @ 316.75 -
10 Madhya Pradesh 129.56 115.43 - 149.09 132.22 -
11 Maharashtra 178.00 125.15 @ 186.36 119.09 -
12 Manipur 230.00 @ - 236.67 @ -
13 Meghalaya 175.00 118.75 @ @ @ -
14 Orissa 163.73 144.76 - 152.22 118.57 -
15 Punjab - - - - - -
16 Rajasthan 176.88 180.83 - @ @ -
17 Tamil Nadu @ 154.28 @ 307.33 164.03 @
18 Tripura 158.89 - - 158.89 - -
19 Uttar Pradesh 181.32 158.60 @ 175.53 154.71 @
20 West Bengal 182.57 175.13 @ 182.63 174.01 @
All India 178.31 155.33 115.36 186.36 164.51 126.50

Indian Labour Journal, January 2014
57
Harvesting Winnowing Threshing
Men Women Children Men Women Children Men Women Children
15 16 17 18 19 20 21 22 23
203.89 141.53 - @ @ - @ @ -
170.00 142.00 - @ - - @ @ -
168.14 154.07 @ 153.96 130.77 - 134.44 123.13 -
135.38 126.67 - 130.29 128.33 - 139.29 157.00 -
306.00 305.71 - @ @ - 321.67 @ -
275.00 @ - - - - - - -
286.50 - - @ - - @ - -
203.96 135.43 @ 205.00 148.57 - 188.57 138.57 -
348.00 318.57 - - @ - @ @ -
148.80 134.77 @ 134.29 94.00 - 186.47 160.00 -
205.13 142.22 - 233.00 170.00 - 227.78 119.44 -
238.33 @ - 226.00 @ - @ @ -
@ @ - - - - - - -
162.08 @ - @ @ - @ @ -
282.50 @ - - - - @ - -
260.31 245.33 - - - - @ - -
251.70 152.66 @ 210.37 140.63 - 150.56 116.00 -
158.89 - - 158.89 - - - - -
176.77 150.66 109.29 174.29 167.00 - @ @ -
191.68 177.76 @ 178.63 163.54 - 191.31 172.60 -
198.71 162.87 114.29 180.56 150.02 - 198.77 162.06 -
- = Indicates that the particular category of workers, i.e. men/women/children were not engaged
in that operation either because of their non-availability; or the activity connected with the
occupation was not undertaken in the State; or the activity was out of season in the State, etc.
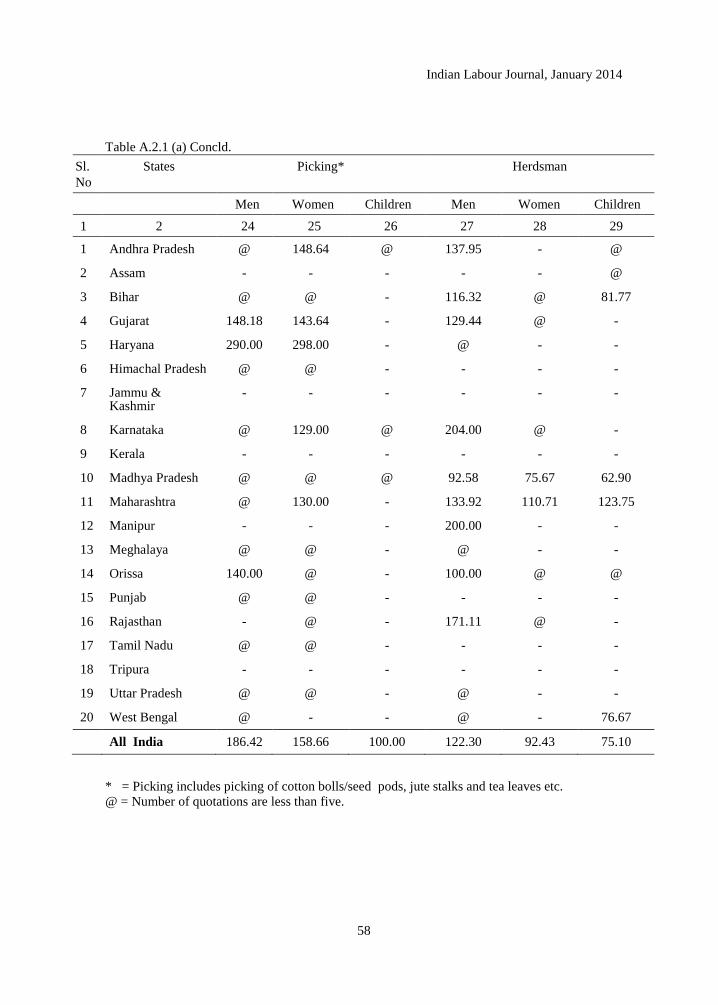
Indian Labour Journal, January 2014
58
Table A.2.1 (a) Concld.
Sl.
No
States Picking* Herdsman
Men Women Children Men Women Children
1 2 24 25 26 27 28 29
1 Andhra Pradesh @ 148.64 @ 137.95 - @
2 Assam - - - - - @
3 Bihar @ @ - 116.32 @ 81.77
4 Gujarat 148.18 143.64 - 129.44 @ -
5 Haryana 290.00 298.00 - @ - -
6 Himachal Pradesh @ @ - - - -
7 Jammu & Kashmir
- - - - - -
8 Karnataka @ 129.00 @ 204.00 @ -
9 Kerala - - - - - -
10 Madhya Pradesh @ @ @ 92.58 75.67 62.90
11 Maharashtra @ 130.00 - 133.92 110.71 123.75
12 Manipur - - - 200.00 - -
13 Meghalaya @ @ - @ - -
14 Orissa 140.00 @ - 100.00 @ @
15 Punjab @ @ - - - -
16 Rajasthan - @ - 171.11 @ -
17 Tamil Nadu @ @ - - - -
18 Tripura - - - - - -
19 Uttar Pradesh @ @ - @ - -
20 West Bengal @ - - @ - 76.67
All India 186.42 158.66 100.00 122.30 92.43 75.10
* = Picking includes picking of cotton bolls/seed pods, jute stalks and tea leaves etc.
@ = Number of quotations are less than five.
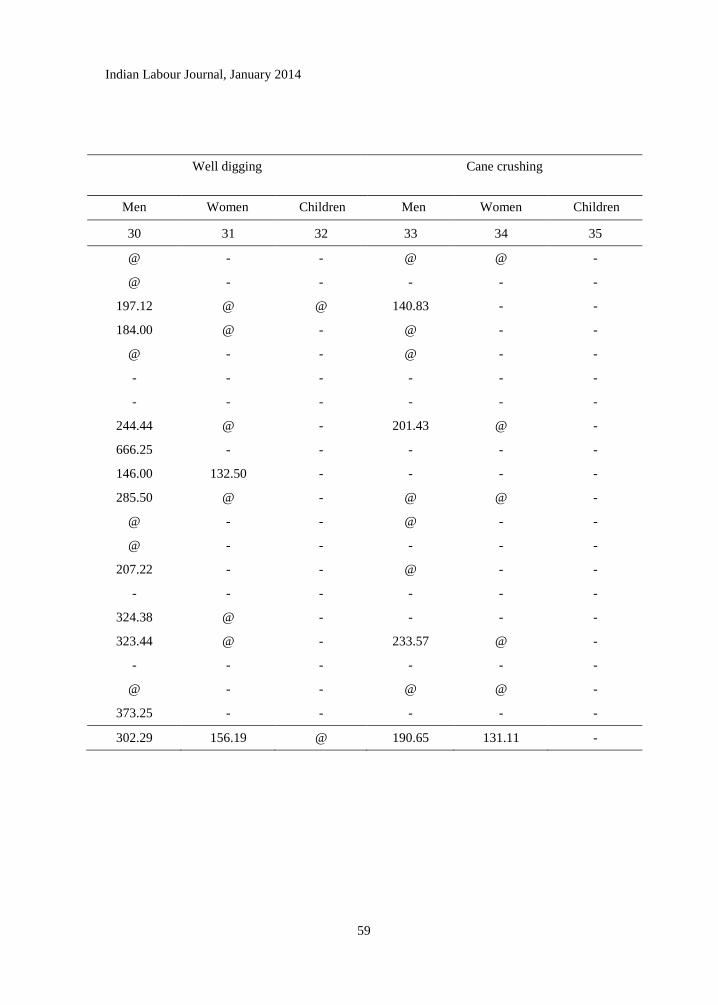
Indian Labour Journal, January 2014
59
Well digging
Cane crushing
Men Women Children Men Women Children
30 31 32 33 34 35
@ - - @ @ -
@ - - - - -
197.12 @ @ 140.83 - -
184.00 @ - @ - -
@ - - @ - -
- - - - - -
- - - - - -
244.44 @ - 201.43 @ -
666.25 - - - - -
146.00 132.50 - - - -
285.50 @ - @ @ -
@ - - @ - -
@ - - - - -
207.22 - - @ - -
- - - - - -
324.38 @ - - - -
323.44 @ - 233.57 @ -
- - - - - -
@ - - @ @ -
373.25 - - - - -
302.29 156.19 @ 190.65 131.11 -
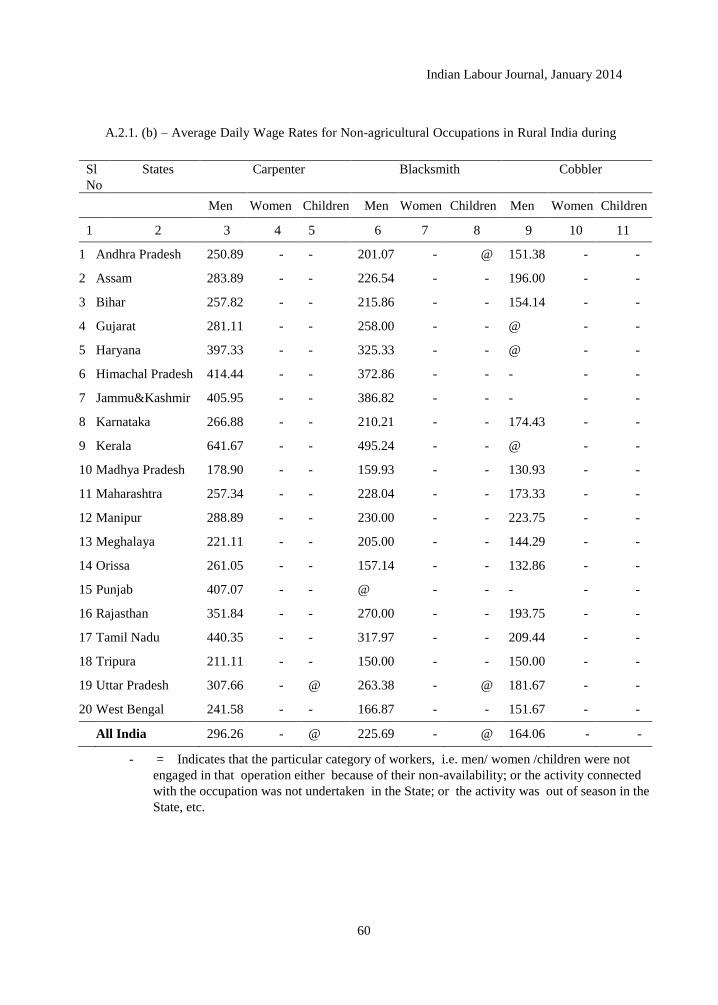
Indian Labour Journal, January 2014
60
A.2.1. (b) – Average Daily Wage Rates for Non-agricultural Occupations in Rural India during
Sl
No
States Carpenter Blacksmith Cobbler
Men Women Children Men Women Children Men Women Children
1 2 3 4 5 6 7 8 9 10 11
1 Andhra Pradesh 250.89 - - 201.07 - @ 151.38 - -
2 Assam 283.89 - - 226.54 - - 196.00 - -
3 Bihar 257.82 - - 215.86 - - 154.14 - -
4 Gujarat 281.11 - - 258.00 - - @ - -
5 Haryana 397.33 - - 325.33 - - @ - -
6 Himachal Pradesh 414.44 - - 372.86 - - - - -
7 Jammu&Kashmir 405.95 - - 386.82 - - - - -
8 Karnataka 266.88 - - 210.21 - - 174.43 - -
9 Kerala 641.67 - - 495.24 - - @ - -
10 Madhya Pradesh 178.90 - - 159.93 - - 130.93 - -
11 Maharashtra 257.34 - - 228.04 - - 173.33 - -
12 Manipur 288.89 - - 230.00 - - 223.75 - -
13 Meghalaya 221.11 - - 205.00 - - 144.29 - -
14 Orissa 261.05 - - 157.14 - - 132.86 - -
15 Punjab 407.07 - - @ - - - - -
16 Rajasthan 351.84 - - 270.00 - - 193.75 - -
17 Tamil Nadu 440.35 - - 317.97 - - 209.44 - -
18 Tripura 211.11 - - 150.00 - - 150.00 - -
19 Uttar Pradesh 307.66 - @ 263.38 - @ 181.67 - -
20 West Bengal 241.58 - - 166.87 - - 151.67 - -
All India 296.26 - @ 225.69 - @ 164.06 - -
- = Indicates that the particular category of workers, i.e. men/ women /children were not
engaged in that operation either because of their non-availability; or the activity connected
with the occupation was not undertaken in the State; or the activity was out of season in the
State, etc.

Indian Labour Journal, January 2014
61
October, 2013 (By States and Sex)
( in Rupees)
Mason Tractor driver
Men Women Children Men Women Children
12 13 14 15 16 17
303.27 @ - 246.04 - -
293.15 - - 288.00 - -
294.34 - - 188.72 - -
345.40 - - 167.19 - -
419.83 - - 344.83 - -
414.44 - - @ - -
409.05 - - - - -
292.67 - - 218.13 - -
637.50 - - 579.17 - -
226.87 - - 185.08 - -
318.63 - - 251.78 - -
308.75 - - 336.67 - -
237.78 - - - - -
283.44 - - 215.43 - -
417.07 - - 334.17 - -
430.71 - - 303.82 - -
473.02 - - 366.82 - -
221.14 - - 221.14 - -
348.57 - - 216.60 - -
274.27 - - 251.72 - -
329.76 @ - 241.45 - -
@ = Number of quotations are less than five.
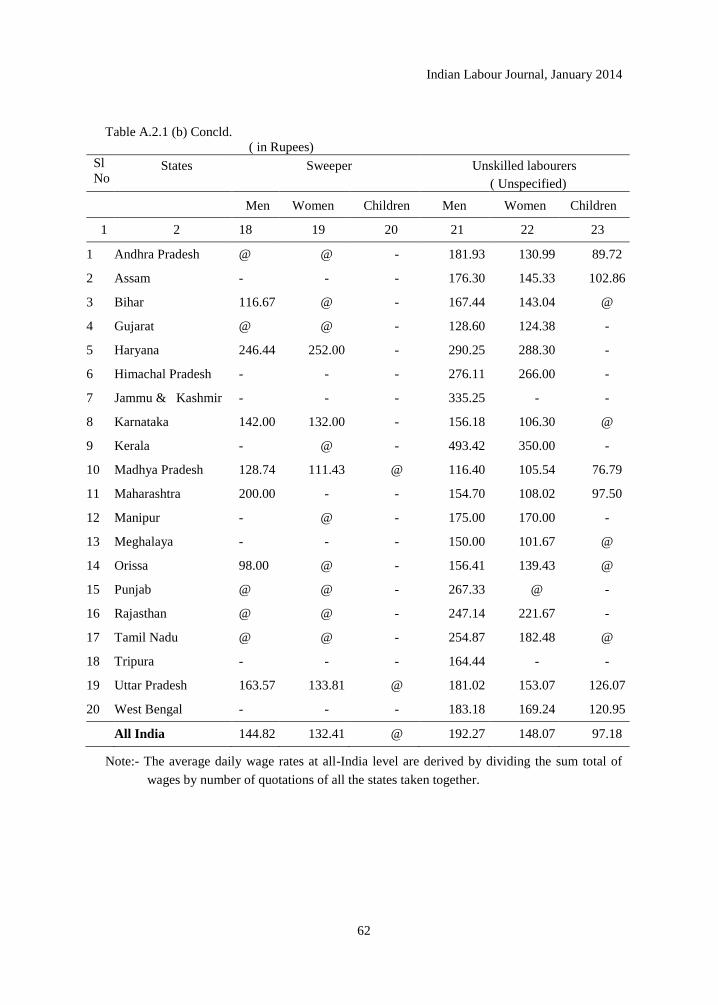
Indian Labour Journal, January 2014
62
Table A.2.1 (b) Concld.
( in Rupees)
Sl
No States Sweeper Unskilled labourers
( Unspecified)
Men Women Children Men Women Children
1 2 18 19 20 21 22 23
1 Andhra Pradesh @ @ - 181.93 130.99 89.72
2 Assam - - - 176.30 145.33 102.86
3 Bihar 116.67 @ - 167.44 143.04 @
4 Gujarat @ @ - 128.60 124.38 -
5 Haryana 246.44 252.00 - 290.25 288.30 -
6 Himachal Pradesh - - - 276.11 266.00 -
7 Jammu & Kashmir - - - 335.25 - -
8 Karnataka 142.00 132.00 - 156.18 106.30 @
9 Kerala - @ - 493.42 350.00 -
10 Madhya Pradesh 128.74 111.43 @ 116.40 105.54 76.79
11 Maharashtra 200.00 - - 154.70 108.02 97.50
12 Manipur - @ - 175.00 170.00 -
13 Meghalaya - - - 150.00 101.67 @
14 Orissa 98.00 @ - 156.41 139.43 @
15 Punjab @ @ - 267.33 @ -
16 Rajasthan @ @ - 247.14 221.67 -
17 Tamil Nadu @ @ - 254.87 182.48 @
18 Tripura - - - 164.44 - -
19 Uttar Pradesh 163.57 133.81 @ 181.02 153.07 126.07
20 West Bengal - - - 183.18 169.24 120.95
All India 144.82 132.41 @ 192.27 148.07 97.18
Note:- The average daily wage rates at all-India level are derived by dividing the sum total of
wages by number of quotations of all the states taken together.
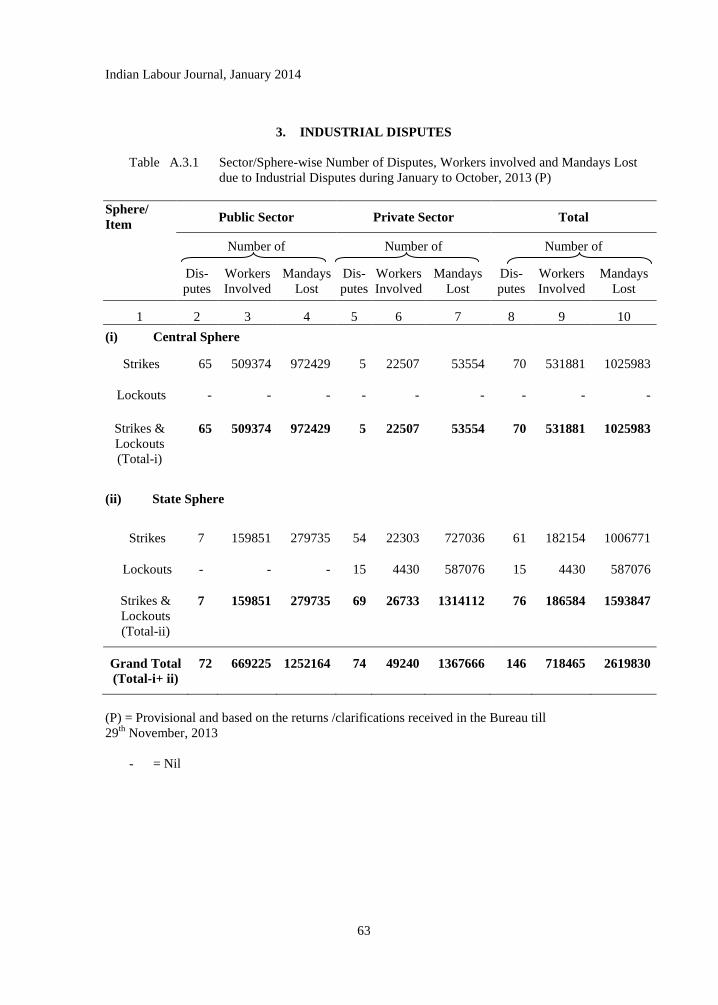
Indian Labour Journal, January 2014
63
3. INDUSTRIAL DISPUTES
Table A.3.1 Sector/Sphere-wise Number of Disputes, Workers involved and Mandays Lost
due to Industrial Disputes during January to October, 2013 (P)
Sphere/
Item Public Sector Private Sector Total
Number of Number of Number of
Dis-
putes
Workers
Involved
Mandays
Lost
Dis-
putes
Workers
Involved
Mandays
Lost
Dis-
putes
Workers
Involved
Mandays
Lost
1 2 3 4 5 6 7 8 9 10
(i) Central Sphere
Strikes 65 509374 972429 5 22507 53554 70 531881 1025983
Lockouts - - - - - - - - -
Strikes &
Lockouts
(Total-i)
65 509374 972429 5 22507 53554 70 531881 1025983
(ii) State Sphere
Strikes 7 159851 279735 54 22303 727036 61 182154 1006771
Lockouts - - - 15 4430 587076 15 4430 587076
Strikes &
Lockouts
(Total-ii)
7 159851 279735 69 26733 1314112 76 186584 1593847
Grand Total
(Total-i+ ii)
72 669225 1252164 74 49240 1367666 146 718465 2619830
(P) = Provisional and based on the returns /clarifications received in the Bureau till
29th
November, 2013
- = Nil
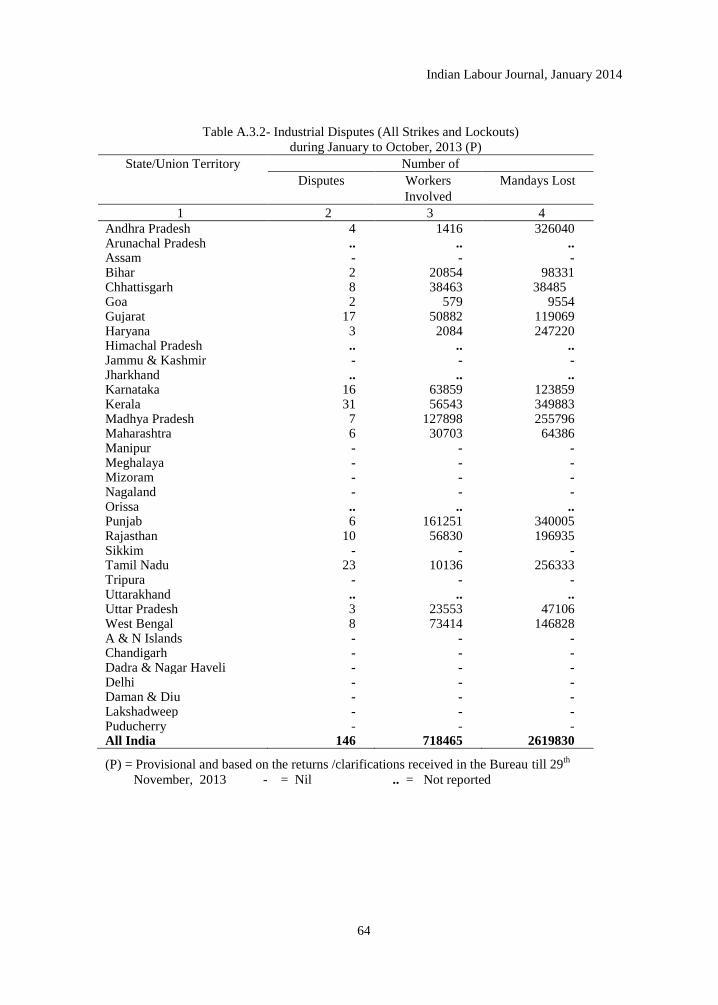
Indian Labour Journal, January 2014
64
Table A.3.2- Industrial Disputes (All Strikes and Lockouts)
during January to October, 2013 (P)
State/Union Territory Number of
Disputes Workers
Involved
Mandays Lost
1 2 3 4
Andhra Pradesh 4 1416 326040 Arunachal Pradesh .. .. .. Assam - - - Bihar 2 20854 98331 Chhattisgarh 8 38463 38485 Goa 2 579 9554 Gujarat 17 50882 119069 Haryana 3 2084 247220 Himachal Pradesh .. .. .. Jammu & Kashmir - - - Jharkhand .. .. .. Karnataka 16 63859 123859 Kerala 31 56543 349883 Madhya Pradesh 7 127898 255796 Maharashtra 6 30703 64386 Manipur - - - Meghalaya - - - Mizoram - - - Nagaland - - - Orissa .. .. .. Punjab 6 161251 340005 Rajasthan 10 56830 196935 Sikkim - - - Tamil Nadu 23 10136 256333 Tripura - - - Uttarakhand .. .. .. Uttar Pradesh 3 23553 47106 West Bengal 8 73414 146828 A & N Islands - - - Chandigarh - - - Dadra & Nagar Haveli - - - Delhi - - - Daman & Diu - - - Lakshadweep - - - Puducherry - - - All India 146 718465 2619830
(P) = Provisional and based on the returns /clarifications received in the Bureau till 29th
November, 2013 - = Nil .. = Not reported
Indian Labour Journal, January 2014
65
SECTION B
SERIAL STATISTICS
N O T E
1 Prices and Price Indices
1.1. Industrial Worker’s Consumer Price Index
B.1.1.1. All-India Consumer Price Index Numbers for Industrial Workers – The All India
Consumer Price Index Numbers (General and Food) on base 1982=100 were being published
since their first release with effect from October, 1988 index replacing the old series on base:
1960=100. The Labour Bureau has released the new series of Consumer Price Index Numbers
for Industrial Workers on base: 2001=100 with the index of January, 2006 which has replaced
the previous series on base: 1982=100. The indices for the old base (1960=100) series can be
derived by multiplying the 1982 series indices by the Linking Factors, which are 4.93 for the
general index and 4.98 for the food index. Similarly, the indices for 1982 series can be derived
by multiplying the 2001 series indices by the Linking factors, which are 4.63 and 4.58 for
General and Food group respectively. The Annual Average (Calendar year 1990 to 2011 as well
as Financial year 1990-91 to 2010-2011) and monthly All India Index Numbers (General&
Food) from October, 2012 to October, 2013 have been presented in Table B.1.1.1.
B.1.1.2. Labour Bureau’s Series of Consumer Price Index Numbers for Industrial Workers – Serial Statistics in respect of Consumer Price Index Numbers for Industrial Workers on base 1982=100 and new series on base: 2001=100 (General Index only) for 78 centres are set out in Table B.1.1.2.
1.2 Consumer Price Index Numbers for Agricultural Labourers B.1.2.1 (a) and (b). All-India Consumer Price Index Numbers for Agricultural and Rural
Labourers (Base: 1986-87=100) – Serial statistics relating to the All-India Consumer Price
Index Numbers (General and Food) for Agricultural and Rural Labourers on base 1986-87=100
separately for Agricultural Years from 1995-96 to 2010-11, Financial Years from 1995-96 to
2011-12 and Calendar Years from 1995 to 2011, alongwith month-wise indices and 12-monthly
moving averages from October, 2012 to October, 2013 are presented in Tables B.1.2.1 (a) and
(b) respectively
B.1.2.2 (a) and (b) Labour Bureau’s Series of Consumer Price Index Numbers for
Agricultural Labourers and Rural Labourers on Base: 1986-87=100 – Serial statistics
in respect of Consumer Price Index Numbers (General Index) for Agricultural
Labourers and Rural Labourers (Base: 1986-87=100) for 20 States are given in Tables
B.1.2.2 (a) and (b) respectively

Indian Labour Journal, January 2014
66
1.3. Urban Non-Manual Employees Consumer Price Index / Consumer Price Index for Urban and Rural Areas
B.1.3. Consumer Price Index Numbers for Urban Non-Manual Employees (Base:1984-85=100) and Consumer Price Index for Urban and Rural Areas on base: 2010=100
Consumer Price Index for Urban Non-Manual Employees on base: 1984-85=100 were compiled and published by the Central Statistical Organisation (CSO), New Delhi. The Price collection for CPI (UNME) was discontinued with effect from April, 2008. As decided by the National Statistical Commission, linked all-India CPI (UNME) numbers for the year 2008 to 2010 are given in Serial Statistics.
The Central Statistics Office (CSO) releases Consumer Price Indices (CPI) on base 2010=100 for all-India and States/UTs separately for rural, urban and combined every month with effect from January, 2011. Consumer Price Index for Urban and Rural areas for the period October, 2012 to October, 2013 have been presented in Table B.1.3.
1.4. Wholesale Price Index
B.1.4. All India Index Numbers of Wholesale prices (Base: 2004-05=100) – The current series of Index Numbers of Wholesale Prices in India on base 2004-05=100 was released w.e.f. September, 2010 by replacing the earlier series. These Index Numbers are compiled and published by the Office of the Economic Adviser, Ministry of Commerce & Industry, Govt. of India, New Delhi. The indices for the period 1991 to 2011 (Annual Averages) and October, 2012 to October, 2013 (Monthly Figures) are set out in Table B.1.4.
2. Wages and Earnings
B.2.1. Earnings(Basic Wage and Dearness Allowance) of the Lowest-paid Workers/Operatives in Cotton Textile Mills – The information concerning earnings of cotton producing Centres/States received from the State Governments, Employers‘ Associations and Individual Units is presented in Table B.2.1. The earnings of workers include minimum basic wage and dearness Allowance by whatever name called. The dearness allowance is linked to the Working Class Consumer Price Index Numbers of different Centres and varies from month to month according to the variation in the index.
3. Industrial Disputes
B.3.1. Industrial Disputes (All Strikes and Lockouts) – Industrial Disputes Statistics for the Years 2006 to 2013 are presented in Table B.3.1
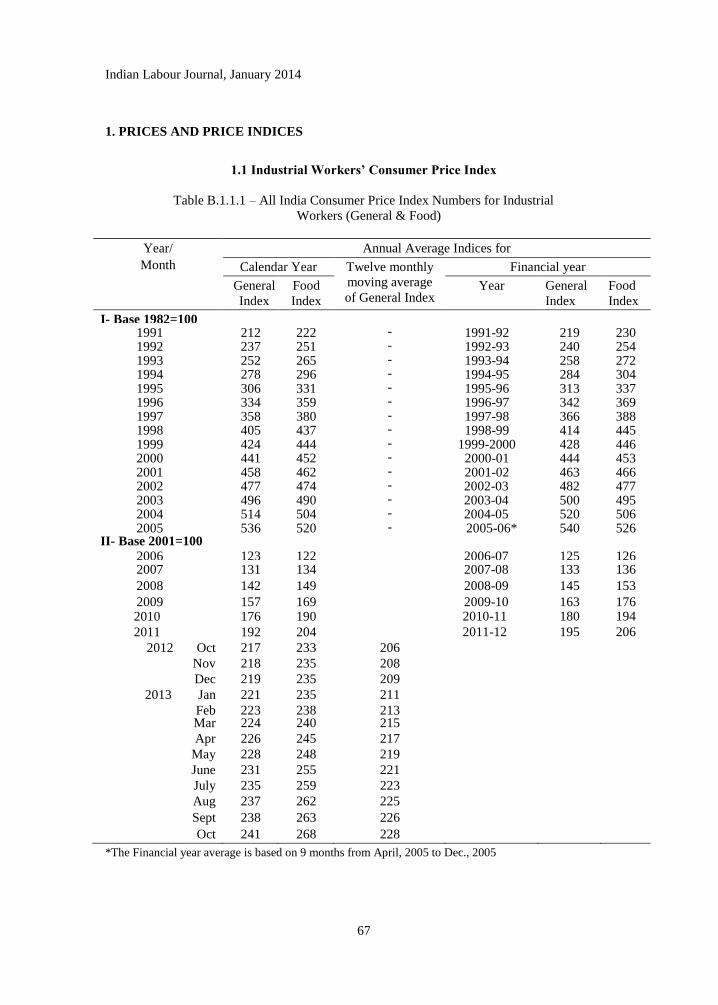
Indian Labour Journal, January 2014
67
1. PRICES AND PRICE INDICES
1.1 Industrial Workers’ Consumer Price Index
Table B.1.1.1 – All India Consumer Price Index Numbers for Industrial
Workers (General & Food)
Year/
Month
Annual Average Indices for
Calendar Year Twelve monthly
moving average
of General Index
Financial year
General
Index
Food
Index
Year General
Index
Food
Index
I- Base 1982=100 1991 212 222 - 1991-92 219 230 1992 237 251 - 1992-93 240 254 1993 252 265 - 1993-94 258 272 1994 278 296 - 1994-95 284 304 1995 306 331 - 1995-96 313 337 1996 334 359 - 1996-97 342 369 1997 358 380 - 1997-98 366 388 1998 405 437 - 1998-99 414 445 1999 424 444 - 1999-2000 428 446 2000 441 452 - 2000-01 444 453 2001 458 462 - 2001-02 463 466 2002 477 474 - 2002-03 482 477 2003 496 490 - 2003-04 500 495 2004 514 504 - 2004-05 520 506 2005
536 520 - 2005-06* 540 526 II- Base 2001=100
2006 123 122 2006-07 125 126 2007 131 134 2007-08 133 136
2008 142 149 2008-09 145 153
2009 157 169 2009-10 163 176 2010 176 190 2010-11 180 194
2011 192 204 2011-12 195 206
2012 Oct 217 233 206
Nov 218 235 208
Dec 219 235 209
2013 Jan 221 235 211
Feb 223 238 213 Mar 224 240 215
Apr 226 245 217
May 228 248 219
June 231 255 221
July 235 259 223
Aug 237 262 225
Sept 238 263 226
Oct 241 268 228
*The Financial year average is based on 9 months from April, 2005 to Dec., 2005
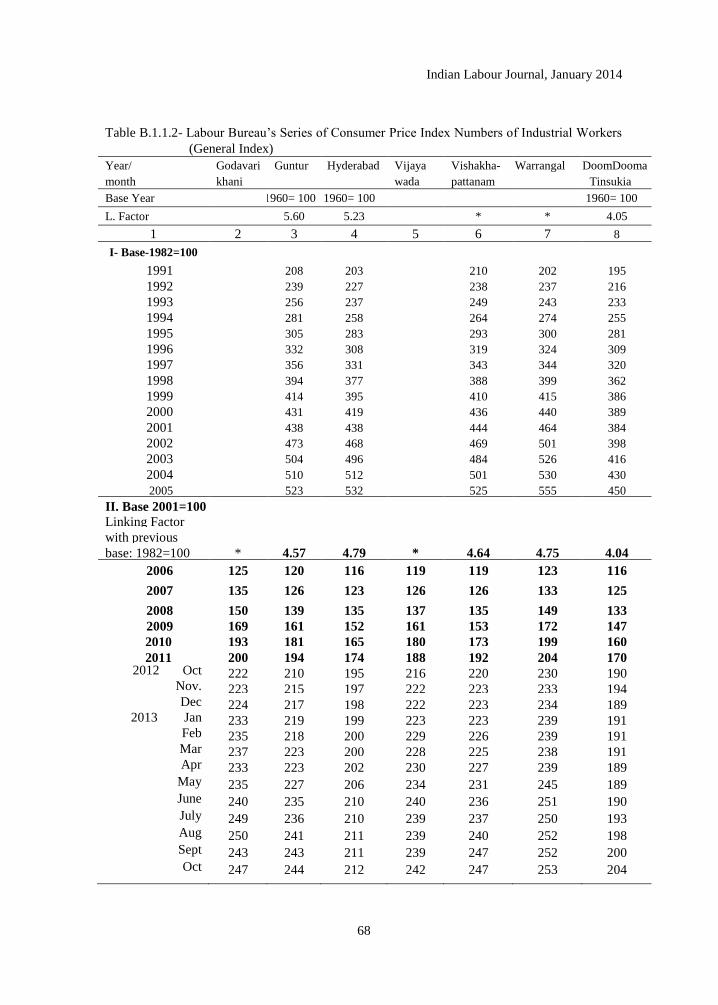
Indian Labour Journal, January 2014
68
Table B.1.1.2- Labour Bureau‘s Series of Consumer Price Index Numbers of Industrial Workers
(General Index)
Year/
month
Godavari
khani
Guntur Hyderabad Vijaya
wada
Vishakha-
pattanam
Warrangal DoomDooma
Tinsukia
Base Year 1960= 100 1960= 100 1960= 100
L. Factor 5.60 5.23 * * 4.05
1 2 3 4 5 6 7 8
I- Base-1982=100
1991 208 203 210 202 195
1992 239 227 238 237 216
1993 256 237 249 243 233
1994 281 258 264 274 255
1995 305 283 293 300 281
1996 332 308 319 324 309
1997 356 331 343 344 320
1998 394 377 388 399 362
1999 414 395 410 415 386
2000 431 419 436 440 389
2001 438 438 444 464 384
2002 473 468 469 501 398
2003 504 496 484 526 416
2004 510 512 501 530 430
2005 523 532 525 555 450
II. Base 2001=100
Linking Factor
with previous
base: 1982=100 * 4.57 4.79 * 4.64 4.75 4.04
2006 125 120 116 119 119 123 116
2007 135 126 123 126 126 133 125
2008 150 139 135 137 135 149 133
2009 169 161 152 161 153 172 147
2010 193 181 165 180 173 199 160
2011 200 194 174 188 192 204 170 2012 Oct 222 210 195 216 220 230 190
Nov. 223 215 197 222 223 233 194 Dec 224 217 198 222 223 234 189
2013 Jan 233 219 199 223 223 239 191 Feb 235 218 200 229 226 239 191 Mar 237 223 200 228 225 238 191 Apr 233 223 202 230 227 239 189
May 235 227 206 234 231 245 189 June 240 235 210 240 236 251 190 July 249 236 210 239 237 250 193 Aug 250 241 211 239 240 252 198 Sept 243 243 211 239 247 252 200 Oct 247 244 212 242 247 253 204
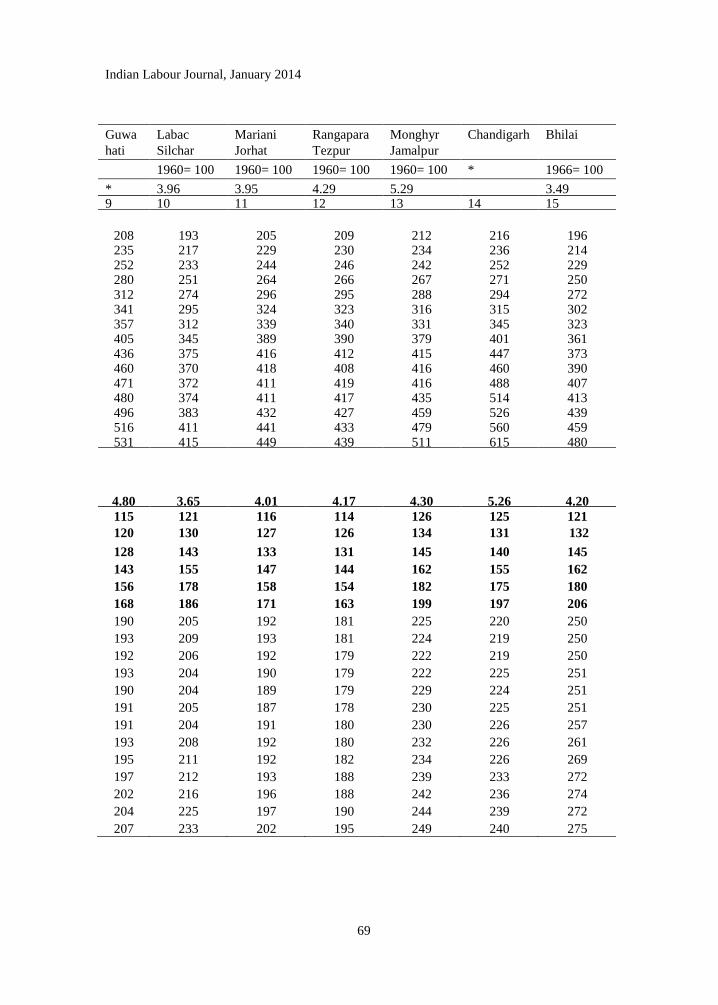
Indian Labour Journal, January 2014
69
Guwa
hati
Labac
Silchar
Mariani
Jorhat
Rangapara
Tezpur
Monghyr
Jamalpur
Chandigarh Bhilai
1960= 100 1960= 100 1960= 100 1960= 100 * 1966= 100
* 3.96 3.95 4.29 5.29 3.49 9 10 11 12 13 14 15
208 193 205 209 212 216 196 235 217 229 230 234 236 214 252 233 244 246 242 252 229 280 251 264 266 267 271 250 312 274 296 295 288 294 272 341 295 324 323 316 315 302 357 312 339 340 331 345 323 405 345 389 390 379 401 361 436 375 416 412 415 447 373 460 370 418 408 416 460 390 471 372 411 419 416 488 407 480 374 411 417 435 514 413 496 383 432 427 459 526 439 516 411 441 433 479 560 459 531 415 449 439 511 615 480
4.80 3.65 4.01 4.17 4.30 5.26 4.20
115 121 116 114 126 125 121
120 130 127 126 134 131 132
128 143 133 131 145 140 145
143 155 147 144 162 155 162
156 178 158 154 182 175 180
168 186 171 163 199 197 206
190 205 192 181 225 220 250
193 209 193 181 224 219 250
192 206 192 179 222 219 250
193 204 190 179 222 225 251
190 204 189 179 229 224 251
191 205 187 178 230 225 251
191 204 191 180 230 226 257
193 208 192 180 232 226 261
195 211 192 182 234 226 269
197 212 193 188 239 233 272
202 216 196 188 242 236 274
204 225 197 190 244 239 272
207 233 202 195 249 240 275
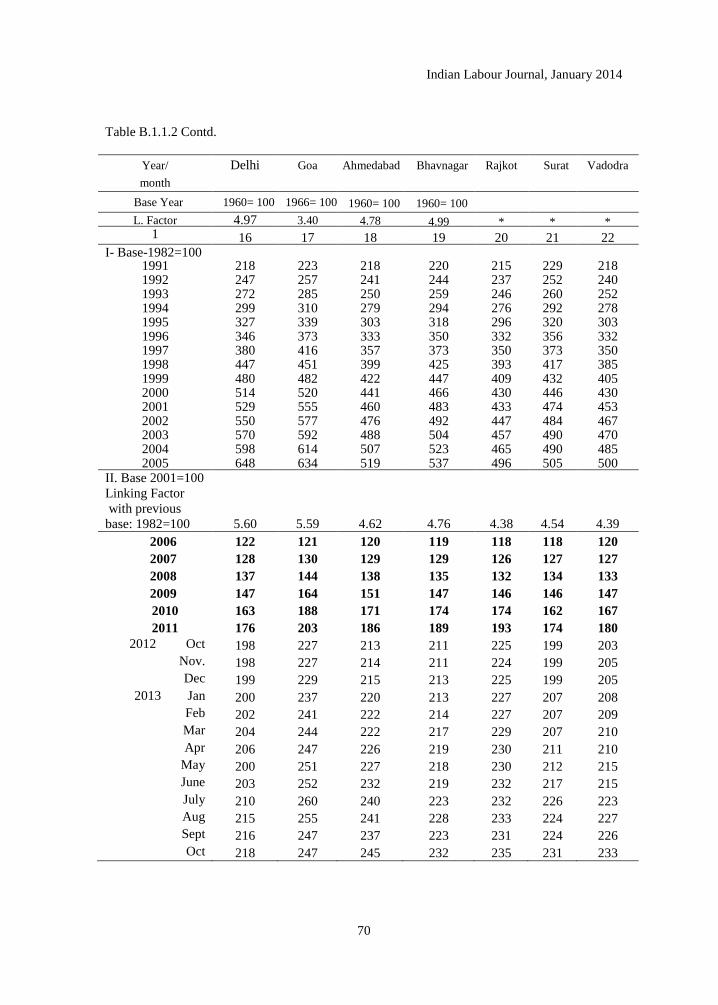
Indian Labour Journal, January 2014
70
Table B.1.1.2 Contd.
Year/
month
Delhi Goa Ahmedabad
Bhavnagar Rajkot Surat Vadodra
Base Year 1960= 100 1966= 100 1960= 100 1960= 100
L. Factor 4.97 3.40 4.78 4.99 * * * 1 16 17 18 19 20 21 22
I- Base-1982=100 1991 218 223 218 220 215 229 218 1992 247 257 241 244 237 252 240 1993 272 285 250 259 246 260 252 1994 299 310 279 294 276 292 278 1995 327 339 303 318 296 320 303 1996 346 373 333 350 332 356 332 1997 380 416 357 373 350 373 350 1998 447 451 399 425 393 417 385 1999 480 482 422 447 409 432 405 2000 514 520 441 466 430 446 430 2001 529 555 460 483 433 474 453 2002 550 577 476 492 447 484 467 2003 570 592 488 504 457 490 470 2004 598 614 507 523 465 490 485 2005 648 634 519 537 496 505 500
II. Base 2001=100
Linking Factor
with previous
base: 1982=100 5.60 5.59 4.62 4.76 4.38 4.54 4.39
2006 122 121 120 119 118 118 120
2007 128 130 129 129 126 127 127
2008 137 144 138 135 132 134 133
2009 147 164 151 147 146 146 147
2010 163 188 171 174 174 162 167
2011 176 203 186 189 193 174 180
2012 Oct 198 227 213 211 225 199 203
Nov. 198 227 214 211 224 199 205
Dec 199 229 215 213 225 199 205
2013 Jan 200 237 220 213 227 207 208
Feb 202 241 222 214 227 207 209
Mar 204 244 222 217 229 207 210
Apr 206 247 226 219 230 211 210
May 200 251 227 218 230 212 215
June 203 252 232 219 232 217 215
July 210 260 240 223 232 226 223
Aug 215 255 241 228 233 224 227
Sept 216 247 237 223 231 224 226
Oct 218 247 245 232 235 231 233

Indian Labour Journal, January 2014
71
Faridabad Yamuna-nagar
Himachal
Pradesh
Srinagar Bokaro Giridih Jamshedpur
1960= 100 1965= 100 1960= 100 1960= 100
* 5.53 3.75 5.47 4.68
23 24 25 26 27 28 29
201 201 205 202 204
224 218 226 231 226 244 235 244 252 239
268 259 268 271 260 295 292 292 303 280
326 315 314 321 321 359 335 340 347 340
426 378 386 414 385
435 392 407 471 397 443 412 430 480 405
469 428 447 520 419 480 443 454 547 431
499 462 466 574 456
532 486 488 599 479 550 521 510 632 508
4.79 4.34 4.53 5.62 * * 4.23
122 127 120 118 121 134 126
130 133 126 125 130 146 132
145 145 135 134 142 156 142
160 162 147 155 158 177 157
182 183 161 159 168 204 182
194 197 172 172 192 232 213
213 222 195 195 217 259 239
214 225 196 196 217 260 239 210 224 196 194 217 262 237
212 225 198 194 217 262 239 216 226 199 198 219 263 241
218 228 199 197 219 264 242
219 230 201 199 220 272 243
219 227 205 195 219 272 246
221 228 208 199 226 273 251
215 228 213 206 232 289 255
217 230 214 205 232 292 255
218 231 215 208 232 293 260
221 233 217 208 238 299 264
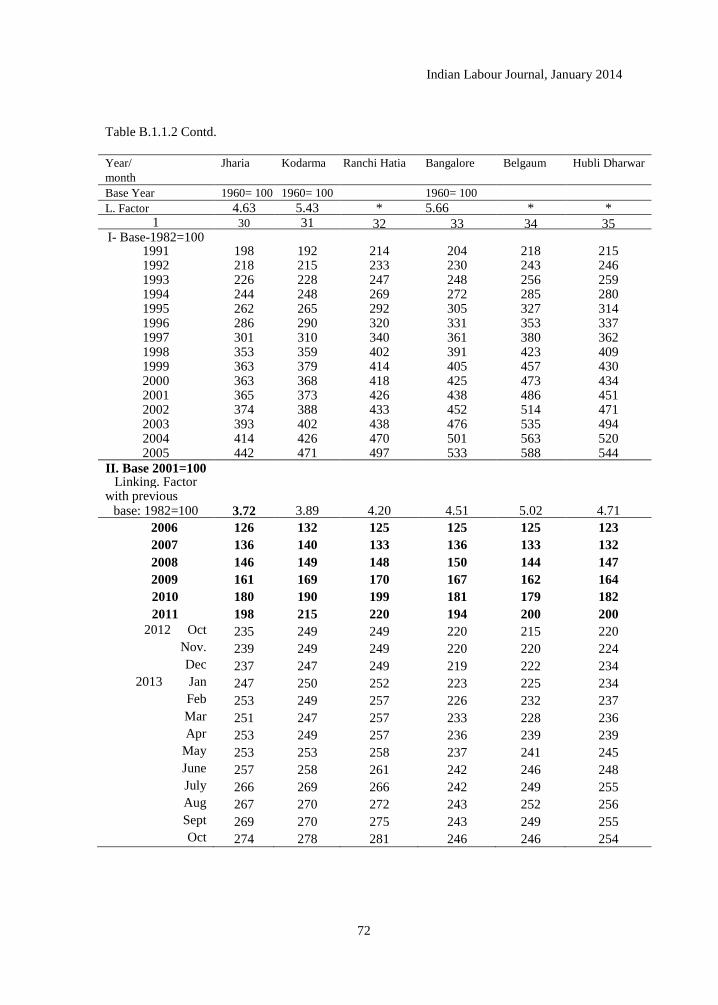
Indian Labour Journal, January 2014
72
Table B.1.1.2 Contd.
Year/
month
Jharia Kodarma Ranchi Hatia Bangalore Belgaum Hubli Dharwar
Base Year 1960= 100 1960= 100 1960= 100
L. Factor 4.63 5.43 * 5.66 * * 1 30 31 32 33 34 35
I- Base-1982=100 1991 198 192 214 204 218 215 1992 218 215 233 230 243 246 1993 226 228 247 248 256 259 1994 244 248 269 272 285 280 1995 262 265 292 305 327 314 1996 286 290 320 331 353 337 1997 301 310 340 361 380 362 1998 353 359 402 391 423 409 1999 363 379 414 405 457 430 2000 363 368 418 425 473 434 2001 365 373 426 438 486 451 2002 374 388 433 452 514 471 2003 393 402 438 476 535 494 2004 414 426 470 501 563 520 2005 442 471 497 533 588 544
II. Base 2001=100 Linking. Factor
with previous base: 1982=100 3.72 3.89 4.20 4.51 5.02 4.71
2006 126 132 125 125 125 123
2007 136 140 133 136 133 132
2008 146 149 148 150 144 147
2009 161 169 170 167 162 164
2010 180 190 199 181 179 182
2011 198 215 220 194 200 200
2012 Oct 235 249 249 220 215 220
Nov. 239 249 249 220 220 224
Dec 237 247 249 219 222 234
2013 Jan 247 250 252 223 225 234
Feb 253 249 257 226 232 237
Mar 251 247 257 233 228 236
Apr 253 249 257 236 239 239
May 253 253 258 237 241 245
June 257 258 261 242 246 248
July 266 269 266 242 249 255
Aug 267 270 272 243 252 256
Sept 269 270 275 243 249 255
Oct 274 278 281 246 246 254
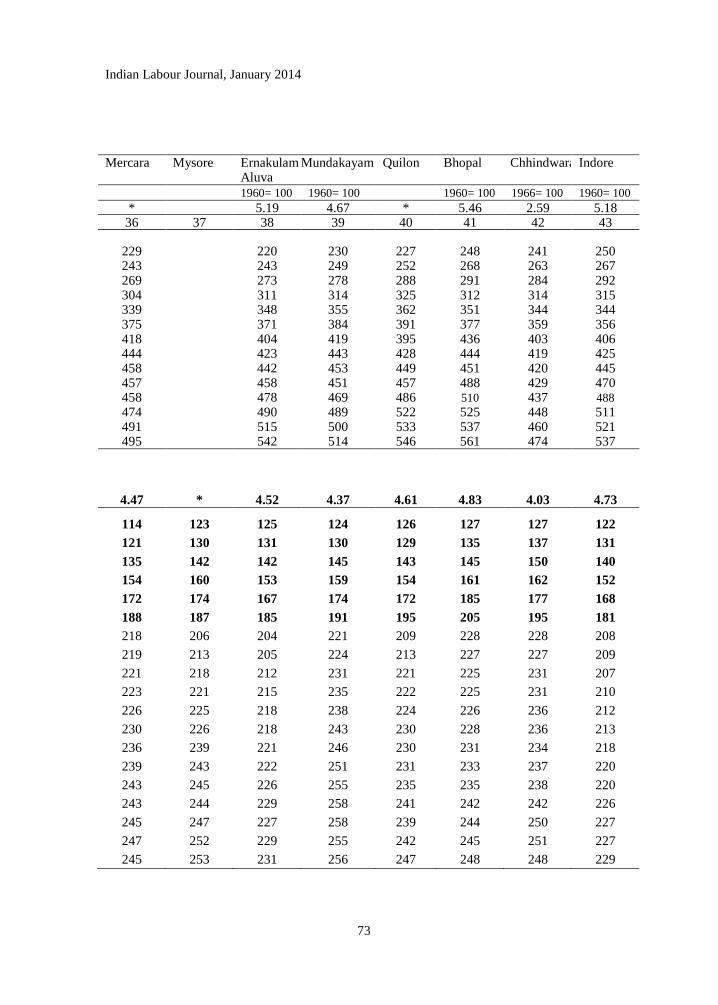
Indian Labour Journal, January 2014
73
Mercara Mysore ErnakulamAluva
Mundakayam Quilon Bhopal
Chhindwara Indore
1960= 100 1960= 100 1960= 100 1966= 100 1960= 100
* 5.19 4.67 * 5.46 2.59 5.18 36 37 38 39 40 41 42 43
229 220 230 227 248 241 250 243 243 249 252 268 263 267 269 273 278 288 291 284 292 304 311 314 325 312 314 315 339 348 355 362 351 344 344 375 371 384 391 377 359 356 418 404 419 395 436 403 406 444 423 443 428 444 419 425 458 442 453 449 451 420 445 457 458 451 457 488 429 470 458 478 469 486 510 437 488
474 490 489 522 525 448 511 491 515 500 533 537 460 521 495 542 514 546 561 474 537
4.47 * 4.52 4.37 4.61 4.83 4.03 4.73
114 123 125 124 126 127 127 122
121 130 131 130 129 135 137 131
135 142 142 145 143 145 150 140
154 160 153 159 154 161 162 152
172 174 167 174 172 185 177 168
188 187 185 191 195 205 195 181
218 206 204 221 209 228 228 208
219 213 205 224 213 227 227 209
221 218 212 231 221 225 231 207
223 221 215 235 222 225 231 210
226 225 218 238 224 226 236 212
230 226 218 243 230 228 236 213
236 239 221 246 230 231 234 218
239 243 222 251 231 233 237 220
243 245 226 255 235 235 238 220
243 244 229 258 241 242 242 226
245 247 227 258 239 244 250 227
247 252 229 255 242 245 251 227
245 253 231 256 247 248 248 229
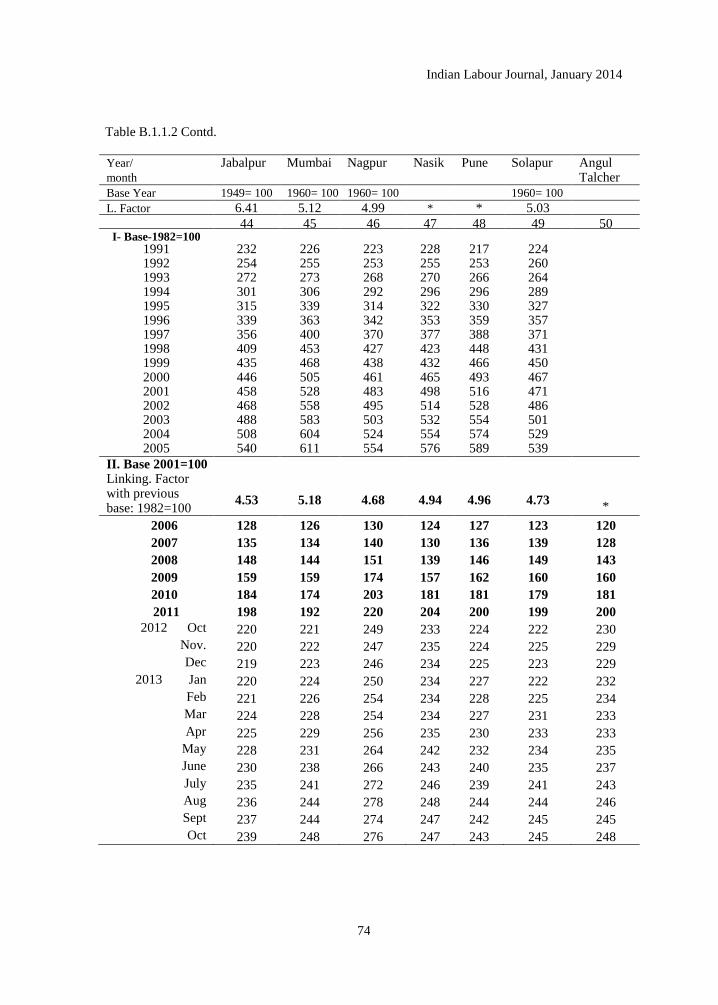
Indian Labour Journal, January 2014
74
Table B.1.1.2 Contd.
Year/
month
Jabalpur Mumbai Nagpur Nasik Pune Solapur Angul Talcher
Base Year 1949= 100 1960= 100 1960= 100 1960= 100
L. Factor 6.41 5.12 4.99 * * 5.03 44 45 46 47 48 49 50 I- Base-1982=100
1991 232 226 223 228 217 224 1992 254 255 253 255 253 260 1993 272 273 268 270 266 264 1994 301 306 292 296 296 289 1995 315 339 314 322 330 327 1996 339 363 342 353 359 357 1997 356 400 370 377 388 371 1998 409 453 427 423 448 431 1999 435 468 438 432 466 450 2000 446 505 461 465 493 467 2001 458 528 483 498 516 471 2002 468 558 495 514 528 486 2003 488 583 503 532 554 501 2004 508 604 524 554 574 529 2005 540 611 554 576 589 539
II. Base 2001=100 Linking. Factor with previous base: 1982=100
4.53 5.18 4.68 4.94 4.96 4.73 *
2006 128 126 130 124 127 123 120
2007 135 134 140 130 136 139 128
2008 148 144 151 139 146 149 143
2009 159 159 174 157 162 160 160
2010 184 174 203 181 181 179 181
2011 198 192 220 204 200 199 200
2012 Oct 220 221 249 233 224 222 230
Nov. 220 222 247 235 224 225 229
Dec 219 223 246 234 225 223 229
2013 Jan 220 224 250 234 227 222 232
Feb 221 226 254 234 228 225 234
Mar 224 228 254 234 227 231 233
Apr 225 229 256 235 230 233 233
May 228 231 264 242 232 234 235
June 230 238 266 243 240 235 237
July 235 241 272 246 239 241 243
Aug 236 244 278 248 244 244 246
Sept 237 244 274 247 242 245 245
Oct 239 248 276 247 243 245 248

Indian Labour Journal, January 2014
75
Table B.1.1.2 contd.
Rourkela Pondicherry Amritsar Jalandhar Ludhiana Ajmer Bhilwara Jaipur
1966= 100 1960= 100 1960= 100 1966=100 1960= 100
3.59 * 5.19 * 5.01 3.20 5.17
51 52 53 54 55 56 57 58
194 229 204 207 217 215 210 216 256 220 219 243 240 228 232 279 238 237 253 253 245 254 313 261 262 280 290 269 275 344 278 285 305 310 291 303 387 298 301 332 333 321 341 428 314 320 357 350 346 390 464 369 374 392 393 387 396 467 379 381 411 420 390 406 477 388 396 433 439 403 407 482 403 413 452 460 423 416 510 418 431 472 474 442 432 543 431 441 487 488 452 453 556 452 469 510 505 467 473 580 492 504 537 532 495
4.03 4.88 4.09 * 4.12 4.78 4.62 4.25
124 123 130 126 129 122 125 127
137 130 139 131 134 129 133 134
149 146 149 141 146 138 144 145
166 163 163 155 160 152 158 159
186 173 190 174 175 175 176 179
204 184 208 190 188 191 192 192
232 216 235 211 214 221 221 222
233 218 235 211 213 222 221 221
230 220 232 213 212 221 222 222
229 220 234 212 215 224 224 226
233 225 233 217 216 224 224 227
233 226 235 218 216 227 228 227
237 234 238 222 217 230 231 225
241 237 236 219 216 229 230 224
242 239 235 221 216 232 231 224
248 242 243 227 223 236 236 232
251 243 244 229 227 238 240 233
254 243 246 230 228 238 246 232
255 242 251 231 233 238 247 237
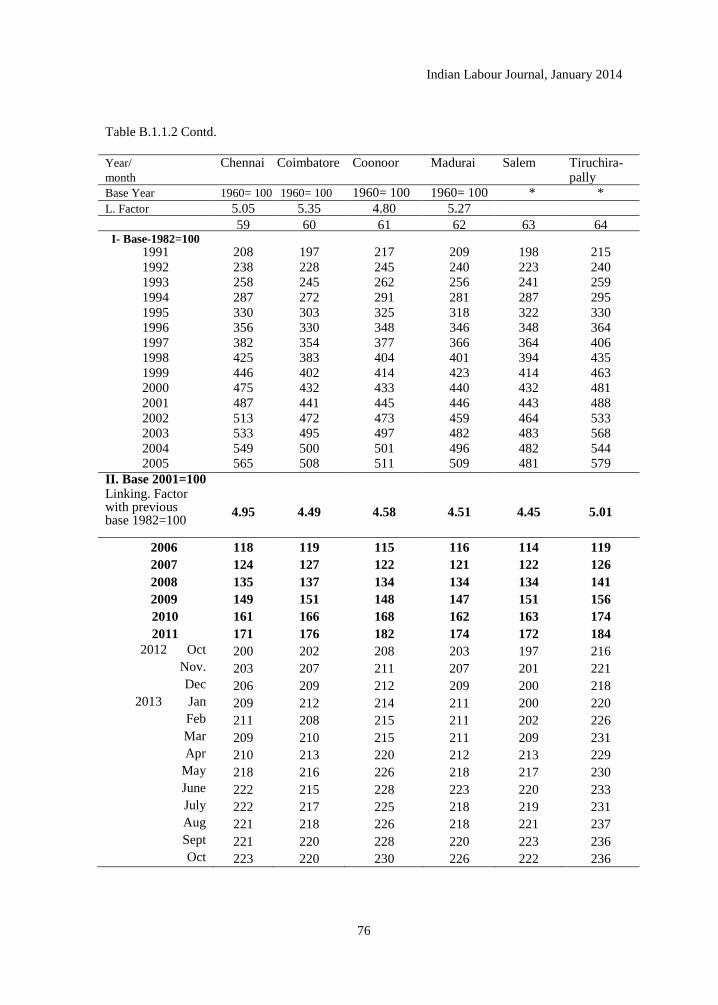
Indian Labour Journal, January 2014
76
Table B.1.1.2 Contd.
Year/
month
Chennai
Coimbatore Coonoor
Madurai Salem Tiruchira-pally
Base Year 1960= 100 1960= 100 1960= 100 1960= 100 * *
L. Factor 5.05 5.35 4.80 5.27 59 60 61 62 63 64
I- Base-1982=100 1991 208 197 217 209 198 215
1992 238 228 245 240 223 240 1993 258 245 262 256 241 259
1994 287 272 291 281 287 295
1995 330 303 325 318 322 330 1996 356 330 348 346 348 364
1997 382 354 377 366 364 406 1998 425 383 404 401 394 435
1999 446 402 414 423 414 463 2000 475 432 433 440 432 481
2001 487 441 445 446 443 488
2002 513 472 473 459 464 533 2003 533 495 497 482 483 568
2004 549 500 501 496 482 544 2005 565 508 511 509 481 579
II. Base 2001=100 Linking. Factor with previous base 1982=100
4.95 4.49 4.58 4.51 4.45 5.01
2006 118 119 115 116 114 119
2007 124 127 122 121 122 126
2008 135 137 134 134 134 141
2009 149 151 148 147 151 156
2010 161 166 168 162 163 174
2011 171 176 182 174 172 184
2012 Oct 200 202 208 203 197 216
Nov. 203 207 211 207 201 221
Dec 206 209 212 209 200 218
2013 Jan 209 212 214 211 200 220
Feb 211 208 215 211 202 226
Mar 209 210 215 211 209 231
Apr 210 213 220 212 213 229
May 218 216 226 218 217 230
June 222 215 228 223 220 233
July 222 217 225 218 219 231
Aug 221 218 226 218 221 237
Sept 221 220 228 220 223 236
Oct 223 220 230 226 222 236
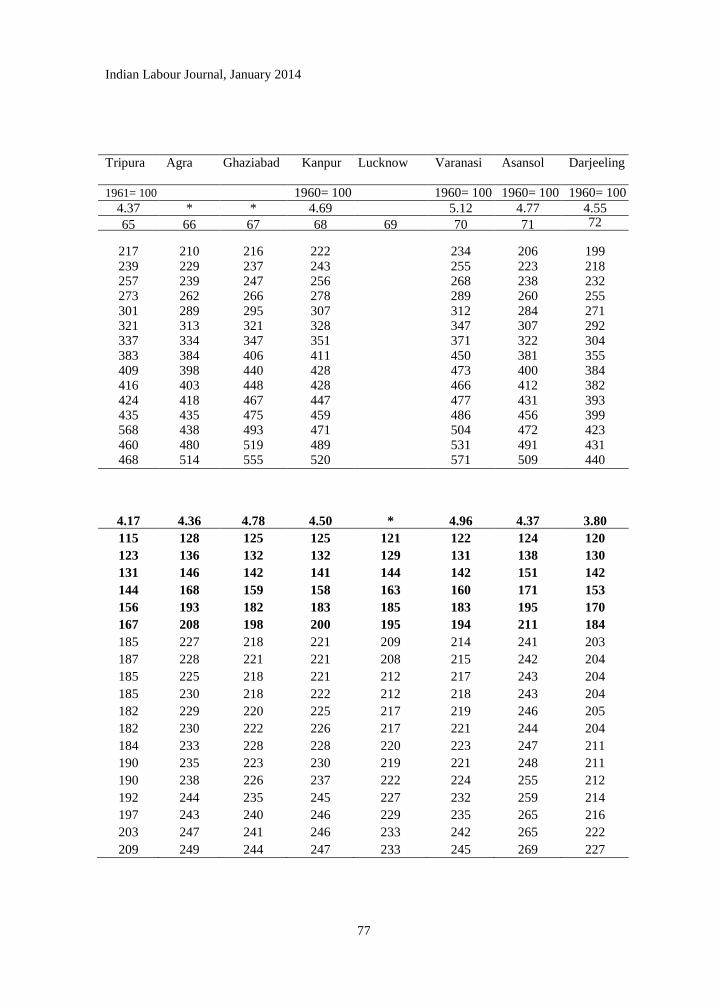
Indian Labour Journal, January 2014
77
Tripura Agra Ghaziabad Kanpur Lucknow Varanasi Asansol
Darjeeling
1961= 100 1960= 100 1960= 100 1960= 100 1960= 100
4.37 * * 4.69 5.12 4.77 4.55
65 66 67 68 69 70 71 72
217 210 216 222 234 206 199 239 229 237 243 255 223 218 257 239 247 256 268 238 232 273 262 266 278 289 260 255 301 289 295 307 312 284 271 321 313 321 328 347 307 292 337 334 347 351 371 322 304 383 384 406 411 450 381 355 409 398 440 428 473 400 384 416 403 448 428 466 412 382 424 418 467 447 477 431 393 435 435 475 459 486 456 399 568 438 493 471 504 472 423 460 480 519 489 531 491 431 468 514 555 520 571 509 440
4.17 4.36 4.78 4.50 * 4.96 4.37 3.80
115 128 125 125 121 122 124 120
123 136 132 132 129 131 138 130
131 146 142 141 144 142 151 142
144 168 159 158 163 160 171 153
156 193 182 183 185 183 195 170
167 208 198 200 195 194 211 184
185 227 218 221 209 214 241 203
187 228 221 221 208 215 242 204
185 225 218 221 212 217 243 204
185 230 218 222 212 218 243 204
182 229 220 225 217 219 246 205
182 230 222 226 217 221 244 204
184 233 228 228 220 223 247 211
190 235 223 230 219 221 248 211
190 238 226 237 222 224 255 212
192 244 235 245 227 232 259 214
197 243 240 246 229 235 265 216
203 247 241 246 233 242 265 222
209 249 244 247 233 245 269 227

Indian Labour Journal, January 2014
78
Table B.1.1.2 Concld.
Year/
month
Durgapur
Haldia Howrah Jalpaiguri Kolkata Raniganj Siliguri Base Year 1960= 100 1960= 100 1960= 100 1960=
100
L. Factor * * 4.12 4.16 4.74 4.40 73 74 75 76 77 78 79
I- Base-1982=100 1991 221 228 230 199 218 201 1992 242 248 253 221 238 218 1993 262 268 271 232 257 229 1994 286 288 293 252 280 249 1995 312 328 323 280 312 274 1996 346 359 346 299 340 298 1997 368 385 364 312 359 314 1998 430 433 439 379 416 357 1999 443 464 482 399 437 373 2000 472 481 499 400 451 380 2001 509 533 519 407 492 399 2002 553 582 542 417 530 416 2003 564 590 556 421 541 426 2004 581 608 587 440 565 450 2005 592 624 620 452 587 471
II. Base 2001=100
Linking. Factor with previous
base 1982=100 5.13 5.64 5.42 3.96 5.12 4.02 *
2006 121 116 121 117 121 124 124
2007 130 124 130 125 132 132 135
2008 140 131 139 136 142 140 144
2009 155 144 154 150 156 156 156
2010 178 161 171 167 172 169 173
2011 193 185 183 179 185 180 187
2012 Oct 228 219 207 204 207 203 207
Nov. 230 219 207 205 210 204 208
Dec 230 219 205 201 209 203 207
2013 Jan 248 223 205 205 208 203 207
Feb 247 223 207 205 209 203 203
Mar 252 224 206 206 210 204 207
Apr 255 226 212 212 214 207 208
May 256 228 213 212 218 211 208
June 257 230 214 219 220 212 215
July 267 231 214 223 222 216 217
Aug 268 233 218 230 228 217 224
Sept 273 236 219 230 230 220 225
Oct 277 236 224 236 236 224 231
* No Linking Factor as these centres were not covered in any of the earlier series Linking Factor - Figures on previous base : 1982=100 and 1960=100 (General Index) can be obtained by multiplying the index numbers of new base: 2001=100 by the respective linking factors given against each centre and rounding off the result to the nearest whole number.
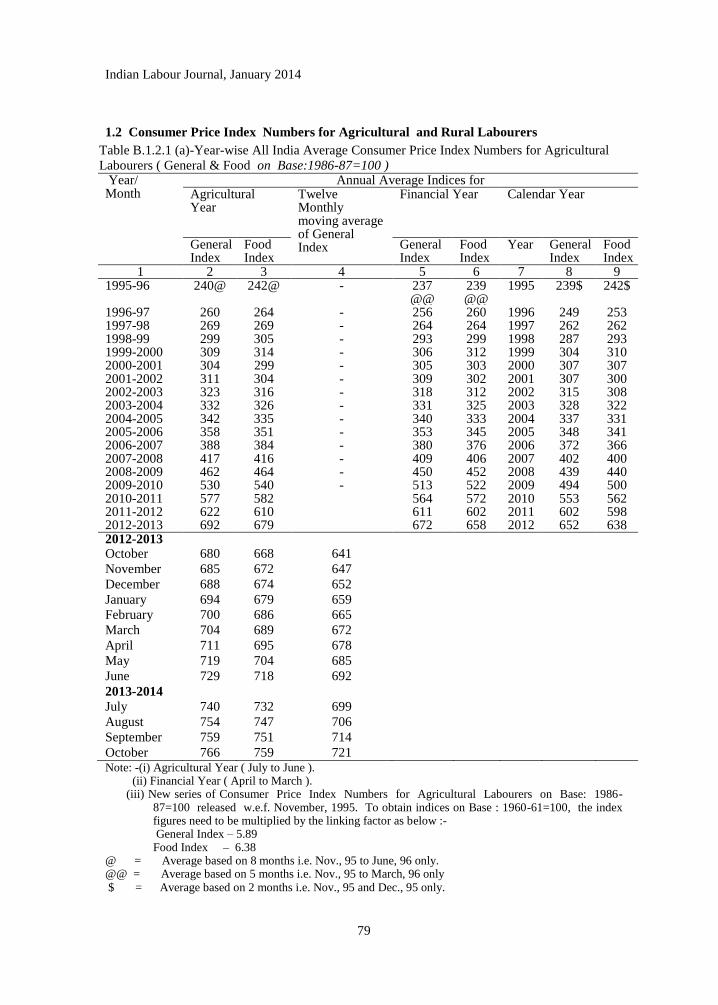
Indian Labour Journal, January 2014
79
1.2 Consumer Price Index Numbers for Agricultural and Rural Labourers
Table B.1.2.1 (a)-Year-wise All India Average Consumer Price Index Numbers for Agricultural
Labourers ( General & Food on Base:1986-87=100 ) Year/ Month
Annual Average Indices for Agricultural Year
Twelve Monthly moving average of General Index
Financial Year Calendar Year
General Index
Food Index
General Index
Food Index
Year General Index
Food Index
1 2 3 4 5 6 7 8 9 1995-96 240@ 242@ - 237
@@ 239 @@
1995 239$ 242$
1996-97 260 264 - 256 260 1996 249 253 1997-98 269 269 - 264 264 1997 262 262 1998-99 299 305 - 293 299 1998 287 293 1999-2000 309 314 - 306 312 1999 304 310 2000-2001 304 299 - 305 303 2000 307 307 2001-2002 311 304 - 309 302 2001 307 300 2002-2003 2003-2004
323 332
316 326
- -
318 331
312 325
2002 2003
315 328
308 322
2004-2005 342 335 - 340 333 2004 337 331 2005-2006 358 351 - 353 345 2005 348 341 2006-2007 388 384 - 380 376 2006 372 366 2007-2008 2008-2009
417 462
416 464
- -
409 450
406 452
2007 2008
402 439
400 440
2009-2010 530 540 - 513 522 2009 494 500 2010-2011 577 582 564 572 2010 553 562 2011-2012 622 610 611 602 2011 602 598 2012-2013 692 679 672 658 2012 652 638 2012-2013 October 680 668 641
November 685 672 647
December 688 674 652
January 694 679 659
February 700 686 665
March 704 689 672
April 711 695 678
May 719 704 685
June
2013-2014
729
718 692
July 740 732 699
August 754 747 706
September 759 751 714
October 766 759 721
Note: -(i) Agricultural Year ( July to June ). (ii) Financial Year ( April to March ). (iii) New series of Consumer Price Index Numbers for Agricultural Labourers on Base: 1986-
87=100 released w.e.f. November, 1995. To obtain indices on Base : 1960-61=100, the index figures need to be multiplied by the linking factor as below :-
General Index – 5.89 Food Index – 6.38 @ = Average based on 8 months i.e. Nov., 95 to June, 96 only. @@ = Average based on 5 months i.e. Nov., 95 to March, 96 only $ = Average based on 2 months i.e. Nov., 95 and Dec., 95 only.

Indian Labour Journal, January 2014
80
Table B.1.2.1 ( b)-Year-wise All India Average Consumer Price Index Numbers or Rural Labourers ( General & Food on Base:1986-87=100 )
Year/
Month
Annual Average Indices for
Agricultural
Year
Twelve
Monthly
moving average
of General
Index
Financial Year Calendar Year
General
Index
Food
Index
General
Index
Food
Index
Year General
Index
Food
Index
1 2 3 4 5 6 7 8 9
1995-96 240@ 242@ - 238
@@
240
@@
1995 239$ 242$
1996-97 260 264 - 256 260 1996 250 253
1997-98 270 270 - 266 265 1997 263 263
1998-99 299 305 - 294 300 1998 288 293
1999-2000 310 313 - 307 311 1999 305 310
2000-2001 306 300 - 307 303 2000 308 307
2001-2002 313 305 - 311 303 2001 309 302
2002-2003 325 317 - 321 312 2002 318 309
2003-2004 335 327 - 333 326 2003 331 323
2004-2005 344 335 - 342 333 2004 340 332
2005-2006 360 352 - 355 346 2005 351 341
2006-2007
2007-2008
2008-2009
2009-2010
2010-2011
2011-2012
2012-2013
389
418
462
529
577
623
693
384
416
463
541
582
611
681
-
-
-
-
382
409
451
513
564
611
673
376
406
452
523
573
603
660
2006
2007
2008
2009
2010
2011
2012
373
403
440
494
552
602
654
366
399
440
500
563
599
640 2012-2013 October 681 671 643
November 686 674 648
December 689 677 654
January 695 681 660
February 701 687 667
March 705 691 673
April 711 697 680
May 720 706 686
June
2012-2013
730 720 693
July 741 734 700
August 753 748 707
September 759 752 714
October 766 759 721
Note: -(i) Agricultural Year ( July to June ). (ii) Financial Year (April to March).
(iii) New series of Consumer Price Index Numbers for Rural Labourers on Base: 1986-
87=100 was introduced for the first time w.e.f. November, 1995.
@ = Average based on 8 months i.e. Nov., 95 to June, 96 only.
@@ = Average based on 5 months i.e. Nov., 95 to March, 96 only
$ = Average based on 2 months i.e. Nov., 95 and Dec., 95 only.

Indian Labour Journal, January 2014
81
Table B.1.2.2.(a)-State-wsie Labour Bureau‘s Series of Consumer Price Index Numbers for
Agricultural Labourers ( General Index on Base: 1986-87=100 )
Agricultural
Year/Month
Andhra
Pradesh
Assam Bihar Gujarat Haryana Himachal
Pradesh
Jammu &
Kashmir
Karnataka
Linking factor 4.84 b 6.22 5.34 * * 5.98 5.81
1 2 3 4 5 6 7 8 9
1995-96 @ 243 244 223 241 235 220 226 251
1996-97 268 259 250 254 265 240 252 266
1997-98 282 281 252 270 278 256 269 276
1998-99 309 311 285 297 306 283 303 306
1999-2000 318 323 300 310 312 294 323 316
2000-2001 317 322 282 314 313 292 326 302
2001-2002 328 320 290 320 322 298 331 309
2002-2003 342 330 299 332 329 308 344 325
2003-2004
2004-2005
347
357
343
347
311
324
339
350
341
359
321
325
345
348
341
340
2005-2006 371 362 347 369 376 343 359 341
2006-2007 401 388 384 403 403 367 392 367
2007-2008 430 417 411 424 447 376 413 406
2008-2009 484 451 446 459 498 406 453 458
2009-2010 552 520 500 538 588 455 524 535
2010-2011 603 580 532 583 642 484 568 595
2011-2012 668 622 552 627 690 513 608 665
2012-2013 733 682 617 694 765 555 671 750
2012-2013
October 710 681 609 677 756 556 660 725
November 718 682 611 683 759 559 665 739
December 725 681 610 683 763 556 669 746
January 734 688 619 691 765 554 676 758
February 749 691 627 698 773 556 682 765
March 752 688 634 707 775 555 688 767
April 758 686 640 718 784 557 689 775
May 771 692 629 726 788 560 694 792
June
2013-2014
789 691 636 735 792 566 695 808
July 793 702 649 749 802 583 701 822
August 812 710 661 769 817 591 708 838
September 819 723 671 778 836 608 721 832
October 821 727 686 794 846 616 737 831

Indian Labour Journal, January 2014
82
Table B.1.2.2.(a)-Concld.
Agricultural
Year/Month
Kerala Madhya
Pradesh
Maharashtra Manipur Meghalaya Orissa
Linking factor 6.56 6.04 5.85 * * 6.05
1 10 11 12 13 14 15
1995-96 @ 259 237 248 244 252 236
1996-97 281 261 256 252 264 254
1997-98 292 273 266 268 282 262
1998-99 305 300 291 292 321 289
1999-2000 312 313 304 312 338 316
2000-2001 321 310 303 316 346 304
2001-2002 321 310 306 304 351 300
2002-2003 330 318 321 300 343 298
2003-2004
2004-2005
342
351
318
330
335
350
308
310
350
360
314
320
2005-2006 356 352 368 328 382 334
2006-2007 374 388 402 337 410 365
2007-2008 403 412 432 367 439 400
2008-2009 454 459 475 407 484 438
2009-2010 496 525 562 455 540 495
2010-2011 562 569 619 527 576 538
2011-2012 601 615 691 594 633 562
2012-2013 665 679 760 639 706 631
2012-2013
October 640 675 756 631 704 620
November 652 673 763 633 708 625
December 661 676 768 632 709 626
January 670 679 759 634 711 632
February 676 684 761 642 713 636
March 686 688 763 644 715 638
April 698 691 764 650 713 645
May 708 699 773 658 725 657
June
2013-2014
721 702 784 667 721 667
July 732 713 793 677 725 685
August 745 730 808 687 740 699
September 754 733 809 697 752 701
October 767 738 805 711 755 717
Note:- Agricultural Year ( July to June )
@ = Average based on 8 months i.e. from November, 1995 to June, 1996 only.

Indian Labour Journal, January 2014
83
Punjab Rajasthan Tamil Nadu Tripura Uttar Pradesh West Bengal
c 6.15 5.67 * 6.60 5.73
16 17 18 19 20 21
244 238 246 220 232 230
263 261 261 240 264 247
278 268 264 263 268 259
306 290 291 312 298 308
314 310 302 331 307 303
316 311 299 324 301 292
326 309 311 322 312 303
331 325 344 325 323 305
343
355
323
346
349
347
326
337
331
343
321
333
380 377 355 351 371 342
417 413 371 383 408 365
448 439 403 407 433 395
501 490 455 433 469 432
586 573 514 466 535 504
624 608 565 514 566 561
685 668 605 548 595 592
756 749 686 587 672 655
749 734 662 590 674 647
752 739 666 589 671 651
749 746 681 588 667 652
755 758 686 587 671 660
760 765 696 583 676 658
765 768 709 591 677 658
772 773 722 592 681 663
775 776 733 597 684 682
785
780 765 601 699 690
793 788 751 619 714 703
814 807 758 629 719 715
826 814 764 647 721 722
832 819 768 664 729 732
* = Indices for the State compiled and published for the first time w.e.f. November, 1995.
b & c = To obtain linking factors for Assam and Punjab on Base 1986-87=100, please consult
article published in February, 1996 issue of the Indian Labour Journal.
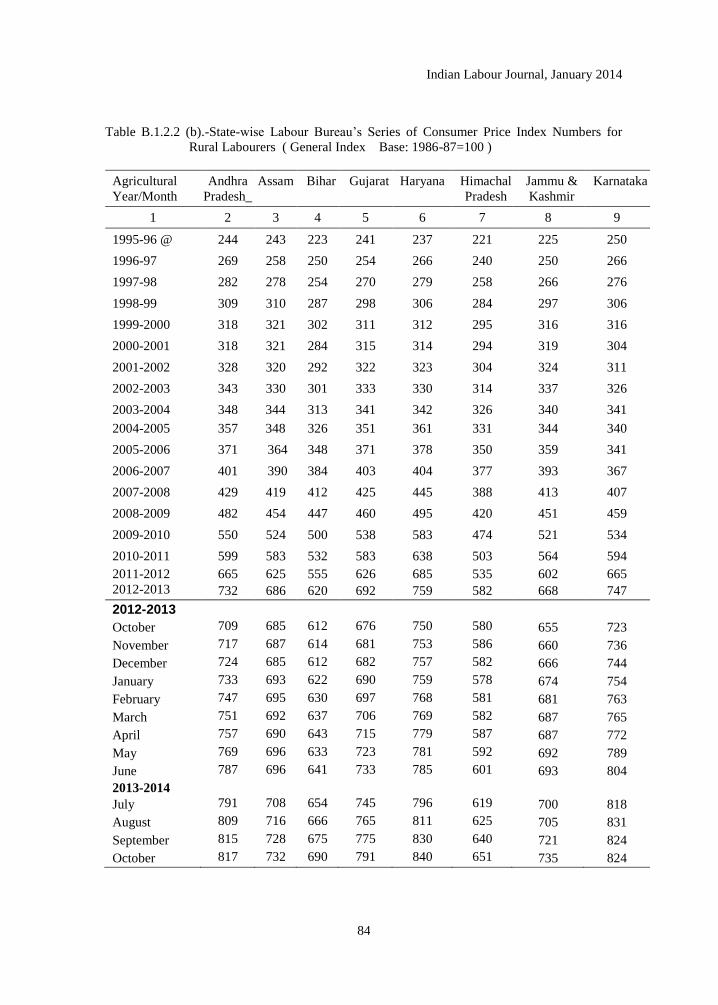
Indian Labour Journal, January 2014
84
Table B.1.2.2 (b).-State-wise Labour Bureau‘s Series of Consumer Price Index Numbers for
Rural Labourers ( General Index Base: 1986-87=100 )
Agricultural
Year/Month
Andhra
Pradesh_
Assam Bihar Gujarat Haryana Himachal
Pradesh
Jammu &
Kashmir
Karnataka
1 2 3 4 5 6 7 8 9
1995-96 @ 244 243 223 241 237 221 225 250
1996-97 269 258 250 254 266 240 250 266
1997-98 282 278 254 270 279 258 266 276
1998-99 309 310 287 298 306 284 297 306
1999-2000 318 321 302 311 312 295 316 316
2000-2001 318 321 284 315 314 294 319 304
2001-2002 328 320 292 322 323 304 324 311
2002-2003 343 330 301 333 330 314 337 326
2003-2004
2004-2005
348
357
344
348
313
326
341
351
342
361
326
331
340
344
341
340
2005-2006 371 364 348 371 378 350 359 341
2006-2007 401 390 384 403 404 377 393 367
2007-2008 429 419 412 425 445 388 413 407
2008-2009 482 454 447 460 495 420 451 459
2009-2010 550 524 500 538 583 474 521 534
2010-2011 599 583 532 583 638 503 564 594
2011-2012 665 625 555 626 685 535 602 665
2012-2013 732 686 620 692 759 582 668 747
2012-2013
October 709 685 612 676 750 580 655 723
November 717 687 614 681 753 586 660 736
December 724 685 612 682 757 582 666 744
January 733 693 622 690 759 578 674 754
February 747 695 630 697 768 581 681 763
March 751 692 637 706 769 582 687 765
April 757 690 643 715 779 587 687 772
May 769 696 633 723 781 592 692 789
June
2013-2014
787 696 641 733 785 601 693 804
July 791 708 654 745 796 619 700 818
August 809 716 666 765 811 625 705 831
September 815 728 675 775 830 640 721 824
October 817 732 690 791 840 651 735 824
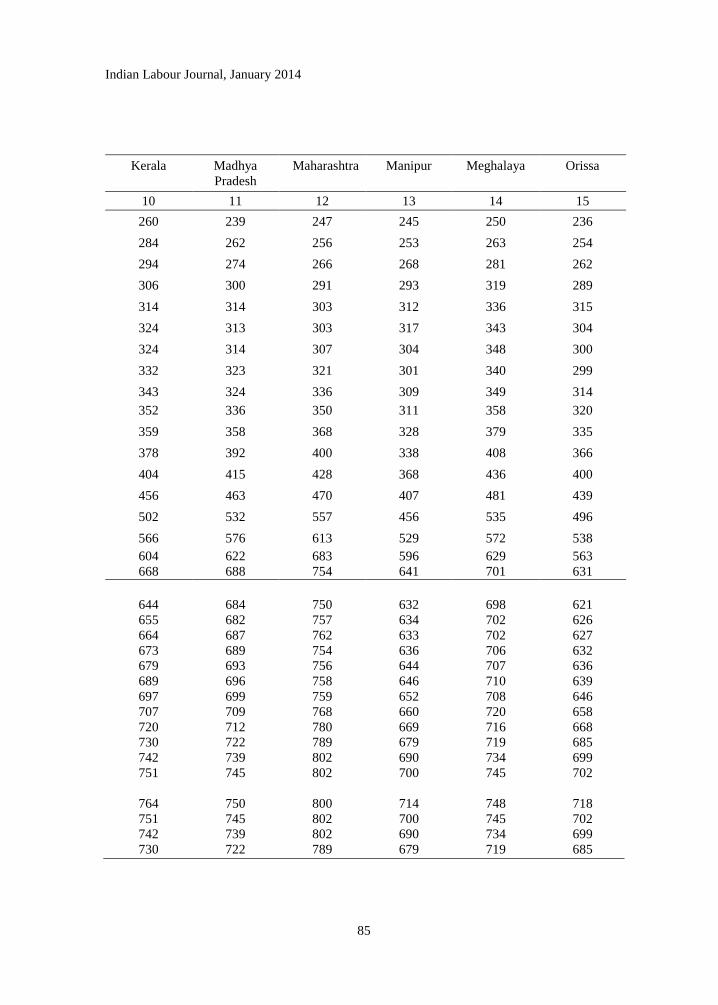
Indian Labour Journal, January 2014
85
Kerala Madhya
Pradesh
Maharashtra Manipur Meghalaya Orissa
10 11 12 13 14 15
260 239 247 245 250 236
284 262 256 253 263 254
294 274 266 268 281 262
306 300 291 293 319 289
314 314 303 312 336 315
324 313 303 317 343 304
324 314 307 304 348 300
332 323 321 301 340 299
343
352
324
336
336
350
309
311
349
358
314
320
359 358 368 328 379 335
378 392 400 338 408 366
404 415 428 368 436 400
456 463 470 407 481 439
502 532 557 456 535 496
566 576 613 529 572 538
604 622 683 596 629 563
668 688 754 641 701 631
644 684 750 632 698 621
655 682 757 634 702 626
664 687 762 633 702 627
673 689 754 636 706 632
679 693 756 644 707 636
689 696 758 646 710 639
697 699 759 652 708 646
707 709 768 660 720 658
720 712 780 669 716 668
730 722 789 679 719 685
742 739 802 690 734 699
751 745 802 700 745 702
764 750 800 714 748 718
751 745 802 700 745 702
742 739 802 690 734 699
730 722 789 679 719 685
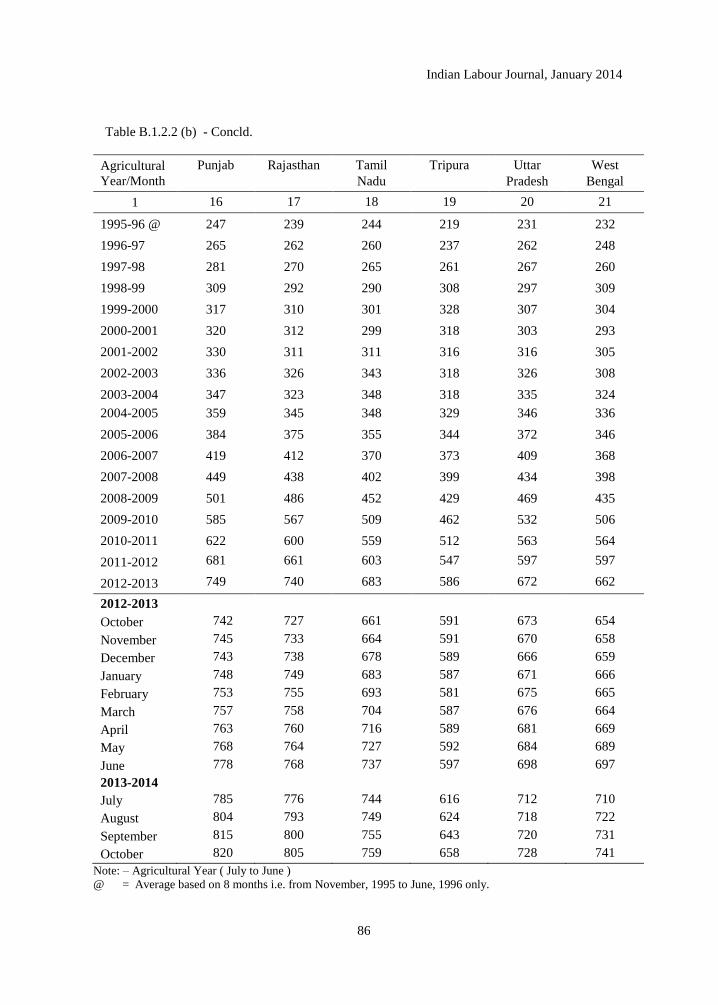
Indian Labour Journal, January 2014
86
Table B.1.2.2 (b) - Concld.
Agricultural
Year/Month
Punjab Rajasthan Tamil
Nadu
Tripura Uttar
Pradesh
West
Bengal
1 16 17 18 19 20 21
1995-96 @ 247 239 244 219 231 232
1996-97 265 262 260 237 262 248
1997-98 281 270 265 261 267 260
1998-99 309 292 290 308 297 309
1999-2000 317 310 301 328 307 304
2000-2001 320 312 299 318 303 293
2001-2002 330 311 311 316 316 305
2002-2003 336 326 343 318 326 308
2003-2004
2004-2005
347
359
323
345
348
348
318
329
335
346
324
336
2005-2006 384 375 355 344 372 346
2006-2007 419 412 370 373 409 368
2007-2008 449 438 402 399 434 398
2008-2009 501 486 452 429 469 435
2009-2010 585 567 509 462 532 506
2010-2011 622 600 559 512 563 564
2011-2012 681 661 603 547 597 597
2012-2013 749 740 683 586 672 662
2012-2013
October 742 727 661 591 673 654
November 745 733 664 591 670 658
December 743 738 678 589 666 659
January 748 749 683 587 671 666
February 753 755 693 581 675 665
March 757 758 704 587 676 664
April 763 760 716 589 681 669
May 768 764 727 592 684 689
June
2013-2014
778
768 737 597 698 697
July 785 776 744 616 712 710
August 804 793 749 624 718 722
September 815 800 755 643 720 731
October 820 805 759 658 728 741
Note: – Agricultural Year ( July to June )
@ = Average based on 8 months i.e. from November, 1995 to June, 1996 only.

Indian Labour Journal, January 2014
87
1.3. Urban Non-Manual Employees’ Consumer Price Index
Table B.1.3. All India Consumer Price Index Numbers for Urban Non-Manual Employees
(Base: 1984-85=100)
Year/Month General Index
1 2
1990 156
1991 177
1992 199
1993 212
1994 231
1995 254
1996 276
1997 297
1998 330
1999 348
2000 366
2001 386
2002 402
2003 416
2004 432
2005 451
2006 478
2007 509
2008 548
2009 612
2010 687
Consumer Price Index for Rural and Urban Areas on base: 2010=100*
Year/Month Rural Urban
General Index General Index
2012 October 126.6 122.6
November 126.9 123.4
December 126.8 124
2013 January 127.3 124.9
February 128.1 125.8
March 128.3 126.5
April 128.7 127.4
May 129.8 128.4
June 132.1 130.5
July 133.8 132.1
August 135.4 133.6
September 137.8 134.0
October 139.5 135.1
* New series of CPI has been introduced w.e.f. Jan., 2011 in place of UNME.
Source: Central Statistical Organisation, New Delhi.
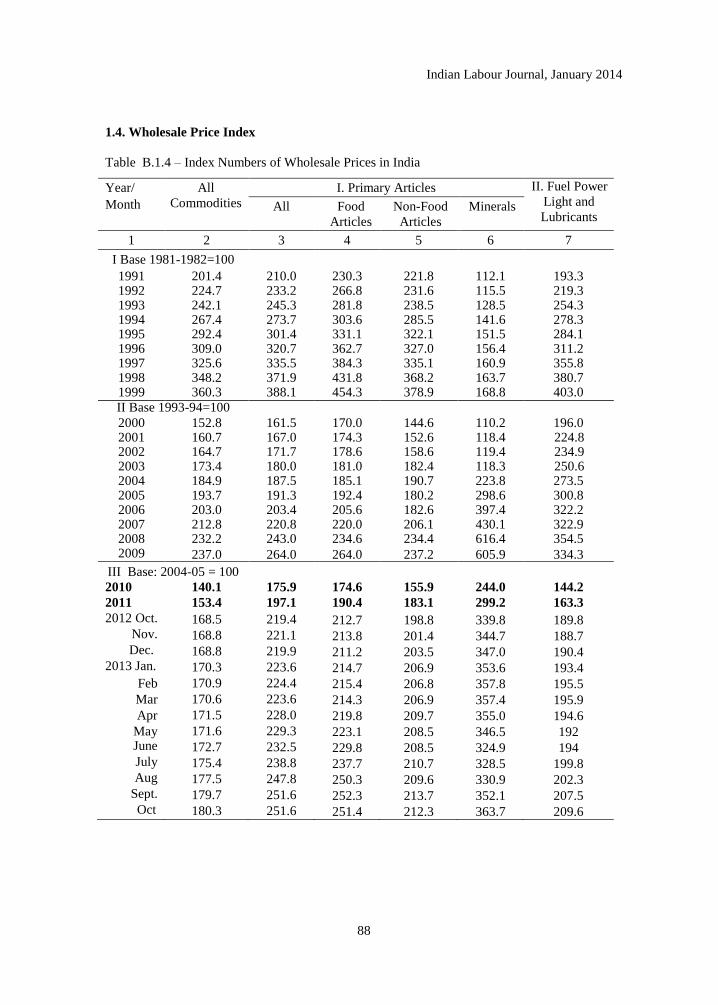
Indian Labour Journal, January 2014
88
1.4. Wholesale Price Index
Table B.1.4 – Index Numbers of Wholesale Prices in India
Year/
Month
All
Commodities
I. Primary Articles II. Fuel Power
Light and
Lubricants All Food
Articles
Non-Food
Articles
Minerals
1 2 3 4 5 6 7
I Base 1981-1982=100
1991 201.4 210.0 230.3 221.8 112.1 193.3 1992 224.7 233.2 266.8 231.6 115.5 219.3 1993 242.1 245.3 281.8 238.5 128.5 254.3 1994 267.4 273.7 303.6 285.5 141.6 278.3 1995 292.4 301.4 331.1 322.1 151.5 284.1 1996 309.0 320.7 362.7 327.0 156.4 311.2 1997 325.6 335.5 384.3 335.1 160.9 355.8 1998 348.2 371.9 431.8 368.2 163.7 380.7 1999 360.3 388.1 454.3 378.9 168.8 403.0
II Base 1993-94=100
2000 152.8 161.5 170.0 144.6 110.2 196.0 2001 160.7 167.0 174.3 152.6 118.4 224.8 2002 164.7 171.7 178.6 158.6 119.4 234.9 2003 173.4 180.0 181.0 182.4 118.3 250.6 2004 184.9 187.5 185.1 190.7 223.8 273.5 2005 193.7 191.3 192.4 180.2 298.6 300.8 2006 203.0 203.4 205.6 182.6 397.4 322.2 2007 212.8 220.8 220.0 206.1 430.1 322.9 2008 232.2 243.0 234.6 234.4 616.4 354.5 2009 237.0 264.0 264.0 237.2 605.9 334.3
III Base: 2004-05 = 100
2010 140.1 175.9 174.6 155.9 244.0 144.2
2011 153.4 197.1 190.4 183.1 299.2 163.3
2012 Oct. 168.5 219.4 212.7 198.8 339.8 189.8 Nov. 168.8 221.1 213.8 201.4 344.7 188.7
Dec. 168.8 219.9 211.2 203.5 347.0 190.4 2013 Jan. 170.3 223.6 214.7 206.9 353.6 193.4
Feb 170.9 224.4 215.4 206.8 357.8 195.5
Mar 170.6 223.6 214.3 206.9 357.4 195.9
Apr 171.5 228.0 219.8 209.7 355.0 194.6
May 171.6 229.3 223.1 208.5 346.5 192 June 172.7 232.5 229.8 208.5 324.9 194 July 175.4 238.8 237.7 210.7 328.5 199.8 Aug 177.5 247.8 250.3 209.6 330.9 202.3
Sept. 179.7 251.6 252.3 213.7 352.1 207.5 Oct 180.3 251.6 251.4 212.3 363.7 209.6

Indian Labour Journal, January 2014
89
III Manufactured Products
All Food
Products
Beverages
Tobacco &
Tobacco
Products
Textiles Wood &
Wood
Products
Paper &
Paper
Products
Leather &
leather
Products
Rubber
& Plastic
Products
8 9 10 11 12 13 14 15
198.1 201.1 258.1 183.4 159.5 251.1 234.9 167.9
220.8 221.1 288.7 198.4 273.8 301.0 227.4 183.3
238.0 240.1 302.4 212.7 366.3 324.5 240.1 189.2
261.7 264.4 332.4 246.9 414.6 330.8 256.7 195.3
288.8 278.4 367.9 287.9 438.3 362.3 274.7 228.3
301.9 289.5 387.3 303.0 445.5 377.4 280.6 242.5
314.2 316.4 430.7 307.8 474.8 371.6 287.1 245.5
328.7 340.0 471.5 318.6 598.2 382.7 296.8 247.4
336.6 344.8 501.4 321.2 622.3 395.1 312.2 245.5
140.2 147.2 177.1 118.6 185.1 159.5 151.8 125.3 144.2 144.9 190.7 120.5 172.5 174.1 144.0 125.8 146.6 150.8 202.7 120.0 178.8 172.9 131.0 130.6
154.0 163.0 205.0 128.3 179.2 173.8 142.3 134.4 164.3 173.5 212.8 137.5 179.5 173.7 152.4 135.1 170.6 176.2 223.8 129.7 187.5 177.1 166.0 137.4 176.3 180.7 238.6 131.6 204.7 188.0 162.0 145.4 185.5 186.9 262.9 132.2 215.5 193.6 166.2 156.0 201.2 205.2 287.5 135.8 229.3 200.3 167.2 165.4 205.9 233.6 305.5 143.3 236.8 204.3 166.7 168.6
128.1 140.9 143.1 115.3 147.5 123.1 127.6 123.2
137.5 149.1 159.4 128.8 157.7 130.8 128.3 132.9
147.9 166.7 177.2 131.8 171.2 136.5 134.3 137.7
148.0 166.6 176.9 132.2 172.9 137.0 133.1 137.8
148.0 166.7 177.1 132.5 173.5 137.7 135.1 138.6
148.5 166.6 178.4 132.2 173.9 139.4 134.5 139.2
148.6 166.7 178.5 132.8 173.4 139.4 134.1 139.3
148.4 164.9 178.1 132.7 173.5 140.0 134.3 139.4
148.7 165.8 181.2 133.6 174.0 140.0 135.1 139.5
149.1 167.1 181.9 135.0 174.3 140.7 136.1 139.7
149.3 167.7 181.4 135.3 175.3 140.5 138.1 142.4
150.2 168.9 181.8 136.4 175.8 140.5 142.5 144.4
150 167.7 181.6 137.3 177.2 140.3 142.3 144.4
151 170 181.2 138.3 178.4 140.8 145.1 145.8
151.6 169.8 182.9 139.7 178.4 142.3 143.8 146.6

Indian Labour Journal, January 2014
90
Table B.1.4 Concld.
Year/ Month III Manufactured Products
Chemicals &
Chemical
Products
Non-metallic
Mineral
Products
Basic Metals
Alloys & Metal
Products
Machinery &
Machine tools
Transport
Equipment and
parts
1 16 17 18 19 20
I Base 1981-82=100
1991 162.4 208.7 231.8 200.4 197.1
1992 186.7 229.4 250.9 226.8 215.5
1993 204.8 248.3 270.8 235.8 222.1
1994 225.1 270.9 293.1 254.6 234.4
1995 246.7 305.4 324.4 280.2 250.5
1996 257.3 331.0 337.4 292.0 263.4
1997 267.3 341.3 346.6 299.4 272.7
1998 277.1 351.0 352.4 303.0 283.1
1999 289.9 369.0 357.6 307.6 295.4
II Base 1993-94=100
2000 161.9 128.4 139.1 120.2 141.1
2001 168.4 145.6 140.9 128.5 146.5
2002 172.0 142.6 143.2 130.0 147.9
2003 176.9 146.7 160.1 132.0 147.0
2004 180.1 154.9 195.5 137.7 152.1
2005 186.9 167.1 218.8 146.1 159.0
2006 192.5 186.4 225.0 152.7 161.8
2007 201.3 204.8 244.6 164.9 164.9
2008 218.2 215.5 285.5 173.4 174.4
2009 224.9 221.9 257.4 172.7 175.6
III Base: 2004-05 = 100 2010 122.1 143.6 137.3 120.3 119.4 2011 132.1 150.3 152.3 124.2 123.6
2012 Oct. 144.2 164.0 166.6 128.6 130.3 Nov 144.1 163.1 166.5 128.8 130.8 Dec. 144.5 162.4 165.4 128.9 131.2
2013 Jan. 145.6 164.8 165.3 129.3 131.4 Feb 145.8 165.6 165.1 129.3 132.0
Mar 145.5 167.7 164.8 129.5 132.3
Apr 145.8 166.6 164.3 129.6 132.4
May 146.1 164.8 163.8 130.1 132.1
June 146 166.6 163 130.4 132.7
July 147.6 166.4 162.3 131.5 133.2
Aug 147.6 164.3 162.7 130.8 133.7 Sept. 148.7 164.7 163.1 131.1 134.1
Oct 148.9 164.7 164.1 131.6 135.7
Note : Linking factor for deriving the General Indices on base: 1981-82=100 to Base 1993-94 is
2.478 and from base 1993-94=100 to base 2004-05 is for All commodities = 1.873, Primary
article =1.881, Fuel & Power = 2.802, Manufactured products = 1.663
Source: Office of the Economic Adviser, Ministry of Commerce and Industry, New Delhi.
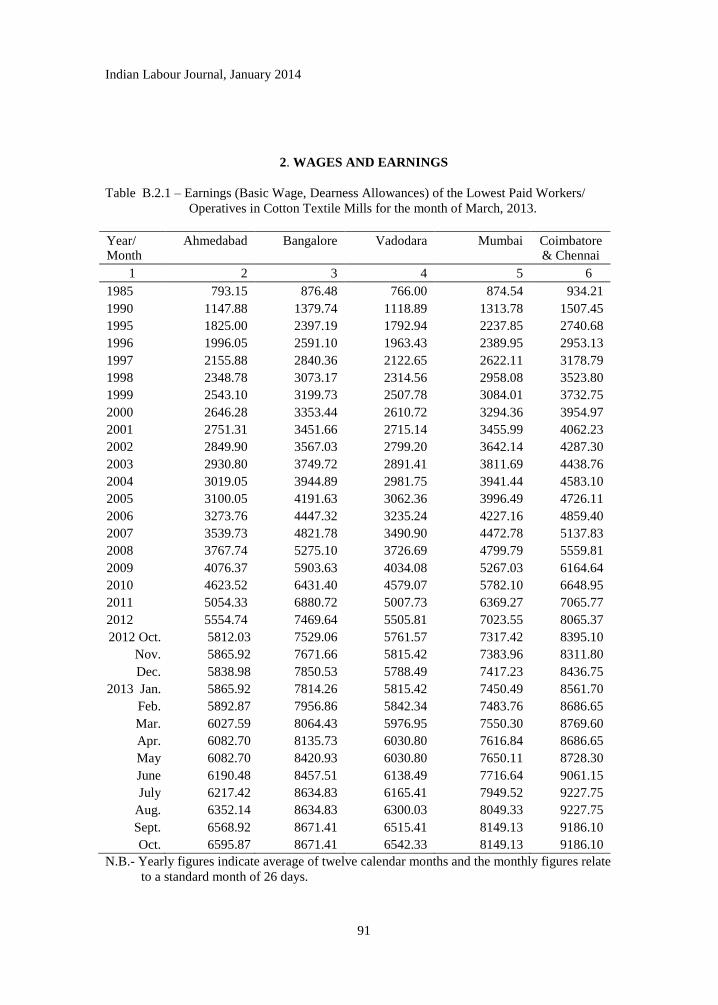
Indian Labour Journal, January 2014
91
2. WAGES AND EARNINGS
Table B.2.1 – Earnings (Basic Wage, Dearness Allowances) of the Lowest Paid Workers/
Operatives in Cotton Textile Mills for the month of March, 2013.
Year/ Month
Ahmedabad Bangalore Vadodara Mumbai Coimbatore & Chennai
1 2 3 4 5 6
1985 793.15 876.48 766.00 874.54 934.21
1990 1147.88 1379.74 1118.89 1313.78 1507.45
1995 1825.00 2397.19 1792.94 2237.85 2740.68
1996 1996.05 2591.10 1963.43 2389.95 2953.13
1997 2155.88 2840.36 2122.65 2622.11 3178.79
1998 2348.78 3073.17 2314.56 2958.08 3523.80
1999 2543.10 3199.73 2507.78 3084.01 3732.75
2000 2646.28 3353.44 2610.72 3294.36 3954.97
2001 2751.31 3451.66 2715.14 3455.99 4062.23
2002 2849.90 3567.03 2799.20 3642.14 4287.30
2003 2930.80 3749.72 2891.41 3811.69 4438.76
2004 3019.05 3944.89 2981.75 3941.44 4583.10
2005 3100.05 4191.63 3062.36 3996.49 4726.11
2006 3273.76 4447.32 3235.24 4227.16 4859.40
2007 3539.73 4821.78 3490.90 4472.78 5137.83
2008 3767.74 5275.10 3726.69 4799.79 5559.81
2009 4076.37 5903.63 4034.08 5267.03 6164.64
2010 4623.52 6431.40 4579.07 5782.10 6648.95
2011 5054.33 6880.72 5007.73 6369.27 7065.77
2012 5554.74 7469.64 5505.81 7023.55 8065.37
2012 Oct. 5812.03 7529.06 5761.57 7317.42 8395.10
Nov. 5865.92 7671.66 5815.42 7383.96 8311.80
Dec. 5838.98 7850.53 5788.49 7417.23 8436.75
2013 Jan. 5865.92 7814.26 5815.42 7450.49 8561.70
Feb. 5892.87 7956.86 5842.34 7483.76 8686.65
Mar. 6027.59 8064.43 5976.95 7550.30 8769.60
Apr. 6082.70 8135.73 6030.80 7616.84 8686.65
May 6082.70 8420.93 6030.80 7650.11 8728.30
June 6190.48 8457.51 6138.49 7716.64 9061.15
July 6217.42 8634.83 6165.41 7949.52 9227.75
Aug. 6352.14 8634.83 6300.03 8049.33 9227.75
Sept. 6568.92 8671.41 6515.41 8149.13 9186.10
Oct. 6595.87 8671.41 6542.33 8149.13 9186.10
N.B.- Yearly figures indicate average of twelve calendar months and the monthly figures relate
to a standard month of 26 days.

Indian Labour Journal, January 2014
92
Table B.2.1 concld.
Year/ Month
Delhi Indore Kanpur Nagpur Solapur Kolkata
1 7 8 9 10 11 12
1985 734.12 755.14 824.70 658.96 723.32 814.33
1990 1070.33 1143.01 1232.60 956.25 1045.37 1195.16
1995 1739.63 1810.43 1949.70 1520.00 1744.67 1887.30
1996 1831.84 1970.78 2078.29 1638.04 1889.84 2099.53
1997 2013.39 2061.69 2243.55 1794.01 1981.08 2229.42
1998 2307.43 2256.09 2553.60 1988.73 2249.74 2452.04
1999 2524.99 2466.82 2743.61 2140.61 2399.14 2728.51
2000 2693.26 2540.94 2750.02 2195.02 2474.53 2796.11
2001 2775.73 2675.21 2839.01 2322.34 2489.57 2964.03
2002 2881.49 2792.85 2931.94 2383.55 2572.85 3292.82
2003 2981.47 2912.04 2995.84 2422.82 2636.12 3347.73
2004 3113.99 2986.63 3112.39 2496.74 2789.17 3478.77
2005 3350.68 3057.48 3279.56 2637.64 2841.65 3599.75
2006 3544.08 3255.16 3592.54 2338.85 2239.55 3797.02
2007 * 3474.05 3833.84 3097.41 * 4097.84
2008 * 3676.41 4062.10 3318.05 * 4420.66
2009 * 3939.07 4487.57 3726.56 * 4775.49
2010 * 4418.29 5238.85 4391.43 * 5362.25
2011 * 4748.82 5731.94 4800.80 * 5755.50
2012 * 5189.95 6104.54 5212.98 * 6134.40
2012 Oct. * 5458.79 6403.56 5404.78 * 6286.02
Nov. * 5458.79 6431.91 5476.91 * 6454.29
Dec. * 5458.79 6403.56 5513.44 * 6454.29
2013 Jan. * 5546.99 6403.56 5513.44 * 6454.29
Feb. * 5546.99 6403.56 5491.90 * 6633.07
Mar. * 5546.99 6431.91 5499.39 * 6633.07
Apr. * 5644.02 6518.31 5549.98 * 6633.07
May * 5644.02 6546.66 5608.99 * 6643.58
June * 5644.02 6603.36 5652.09 * 6643.58
July * 5846.89 6660.06 5725.15 * 6643.58
Aug. * 5846.89 6859.86 5813.21 * 6906.46
Sept. * 5846.89 7088.01 5929.37 * 6906.49
Oct. * 6040.94 7116.36 6031.48 * 6906.49
New series on Consumer Price Index Numbers for Industrial Workers on base 2001=100 has been
introduced w.e.f. the index of January 2006.
Centre linking factor on base 2001=100 is: Ahmedabad (4.62), Bangalore (4.51), Vadodara (4.39), Mumbai
(5.18), Coimbatore / Chennai (4.95), Delhi(5.60), Indore(4.73),Kanpur(4.50), Nagpur (4.68), Sholapur
(4.73) and Kolkata (5.12)
* Earning of Delhi and Sholapur Centres have been discontinued due to closure of Textile Mills.
Source: Monthly returns received from the selected centres.
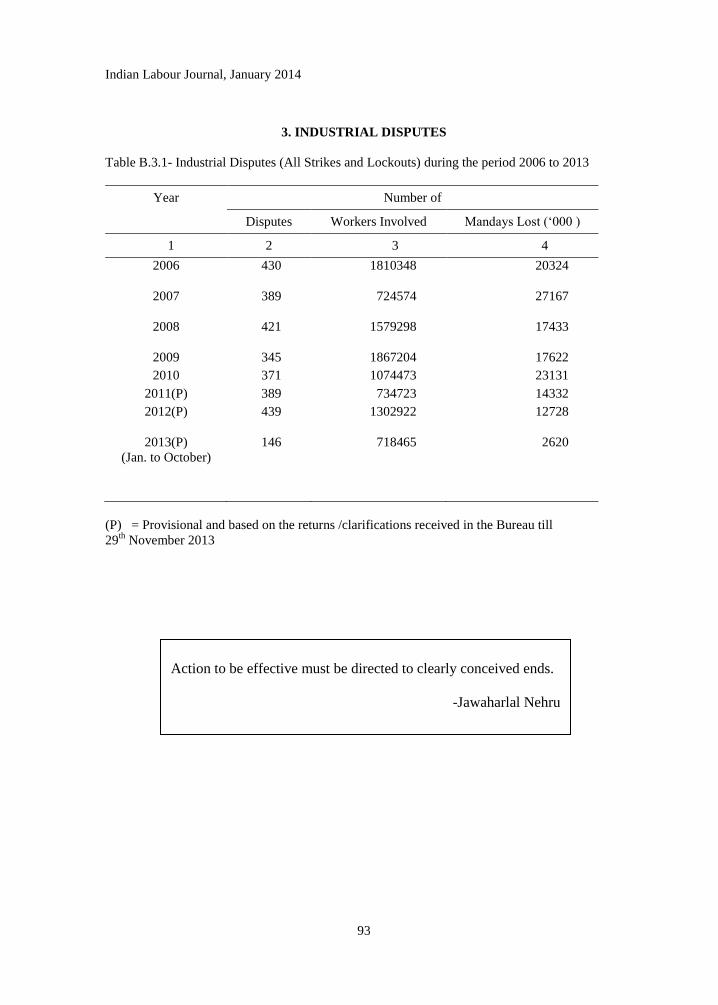
Indian Labour Journal, January 2014
93
3. INDUSTRIAL DISPUTES
Table B.3.1- Industrial Disputes (All Strikes and Lockouts) during the period 2006 to 2013
Year Number of
Disputes Workers Involved Mandays Lost (‗000 )
1 2 3 4
2006
430 1810348 20324
2007
389 724574 27167
2008
421 1579298 17433
2009 345 1867204 17622
2010 371 1074473 23131
2011(P) 389 734723 14332
2012(P)
439 1302922 12728
2013(P)
(Jan. to October)
146 718465 2620
(P) = Provisional and based on the returns /clarifications received in the Bureau till
29th
November 2013
Action to be effective must be directed to clearly conceived ends.
-Jawaharlal Nehru

Indian Labour Journal, January 2014
94
List of Labour Bureau Publications Brought Out during the year 2013
Symbol Title of the Publication Price (Rs.)
1 2 3
1 PDL- 560
150-2012(DSK-II)
Consumer Price Index Numbers for Agricultural and Rural Labourers (Base: 1986-87=100) Annual Report 2011-12
90.00
2 PDL- 561 300-2013(DSK-II)
Consumer Price Index Numbers for Industrial Workers (Base 2001=100) Annual Report 2012
190.00
3 PDLB- 660 200-2012(DSK-II)
Wage Rates in Rural India (2011-12)
90.00
4 PDLB 30.2011 (Billingua1) 175-2012 (DSK-III)
Indian Labour Statistics 115.00
5 BP1/2013 100
Statistics of Factories 2010 -
6 PDLB.662 100-2013(DSK-III)
Trade Unions in India 2010 94.00
7 PDLB.16-2011 90-2012(DSK-II)
Report on the Working of the Minimum Wages Act. 1948 for the Year 2011
198.00
8 PDLB.654(Part-11) 120-2011(DSK-II)
Report on Report on Absenteeism, Labour Turnover Employment & Labour Cost
105
9 - Report on Employment-Unemployment Survey 2012-12 (Volume-I and Volume-II)
-
10 - Report on Employment-Unemployment Survey 2012-12 (Youth)
-
11 - Half yearly Report on Changes in Employment in Selected Sectors (July to December, 2012
-
12 - Quarterly Report on Changes in Employment in Selected Sectors (January, 2013 to March, 2013)
-
13. - Quarterly Report on Changes in Employment in Selected Sectors (April, 2013 to June, 2013)
-
14. - Indian Labour Journal (Monthly) 75.00
For detailed and upto date list log on to www labourbureau.nic.in.
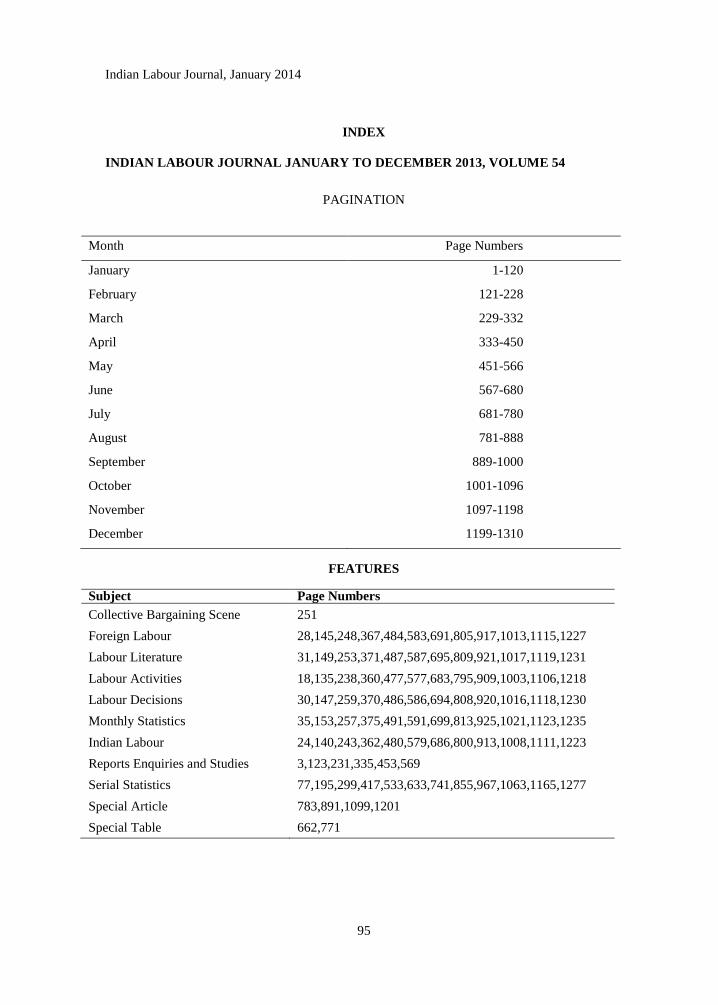
Indian Labour Journal, January 2014
95
INDEX
INDIAN LABOUR JOURNAL JANUARY TO DECEMBER 2013, VOLUME 54
PAGINATION
Month Page Numbers
January 1-120
February 121-228
March 229-332
April 333-450
May 451-566
June 567-680
July 681-780
August 781-888
September 889-1000
October 1001-1096
November 1097-1198
December 1199-1310
FEATURES
Subject Page Numbers
Collective Bargaining Scene 251
Foreign Labour 28,145,248,367,484,583,691,805,917,1013,1115,1227
Labour Literature 31,149,253,371,487,587,695,809,921,1017,1119,1231
Labour Activities 18,135,238,360,477,577,683,795,909,1003,1106,1218
Labour Decisions 30,147,259,370,486,586,694,808,920,1016,1118,1230
Monthly Statistics 35,153,257,375,491,591,699,813,925,1021,1123,1235
Indian Labour 24,140,243,362,480,579,686,800,913,1008,1111,1223
Reports Enquiries and Studies 3,123,231,335,453,569
Serial Statistics 77,195,299,417,533,633,741,855,967,1063,1165,1277
Special Article 783,891,1099,1201
Special Table 662,771
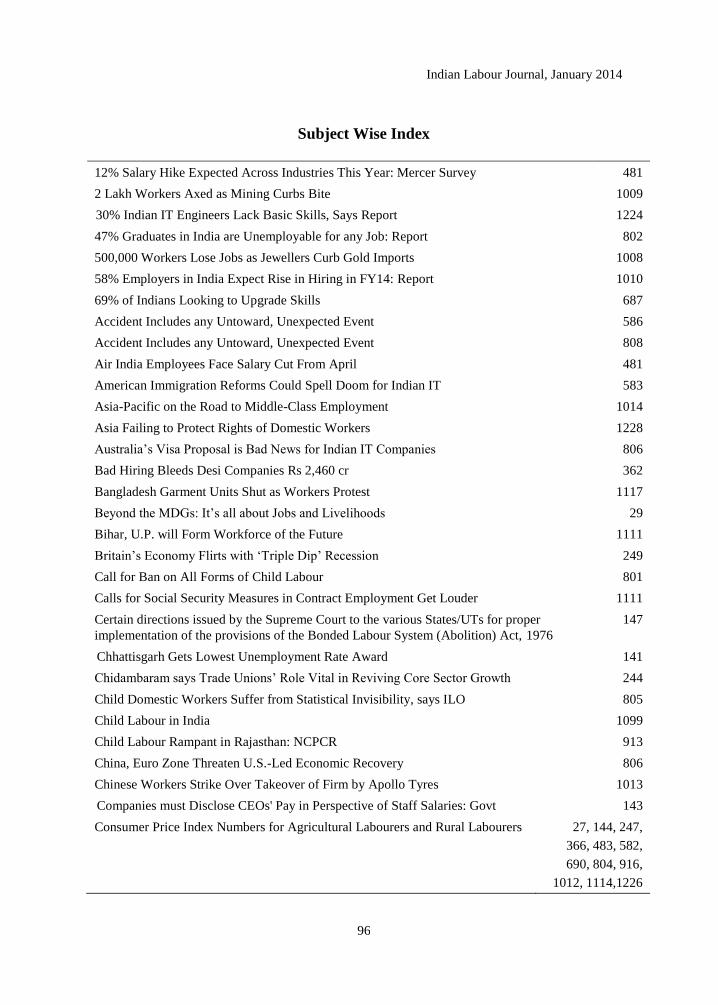
Indian Labour Journal, January 2014
96
Subject Wise Index
12% Salary Hike Expected Across Industries This Year: Mercer Survey 481
2 Lakh Workers Axed as Mining Curbs Bite 1009
30% Indian IT Engineers Lack Basic Skills, Says Report 1224
47% Graduates in India are Unemployable for any Job: Report 802
500,000 Workers Lose Jobs as Jewellers Curb Gold Imports 1008
58% Employers in India Expect Rise in Hiring in FY14: Report 1010
69% of Indians Looking to Upgrade Skills 687
Accident Includes any Untoward, Unexpected Event 586
Accident Includes any Untoward, Unexpected Event 808
Air India Employees Face Salary Cut From April 481
American Immigration Reforms Could Spell Doom for Indian IT 583
Asia-Pacific on the Road to Middle-Class Employment 1014
Asia Failing to Protect Rights of Domestic Workers 1228
Australia‘s Visa Proposal is Bad News for Indian IT Companies 806
Bad Hiring Bleeds Desi Companies Rs 2,460 cr 362
Bangladesh Garment Units Shut as Workers Protest 1117
Beyond the MDGs: It‘s all about Jobs and Livelihoods 29
Bihar, U.P. will Form Workforce of the Future 1111
Britain‘s Economy Flirts with ‗Triple Dip‘ Recession 249
Call for Ban on All Forms of Child Labour 801
Calls for Social Security Measures in Contract Employment Get Louder 1111
Certain directions issued by the Supreme Court to the various States/UTs for proper
implementation of the provisions of the Bonded Labour System (Abolition) Act, 1976
147
Chhattisgarh Gets Lowest Unemployment Rate Award 141
Chidambaram says Trade Unions‘ Role Vital in Reviving Core Sector Growth 244
Child Domestic Workers Suffer from Statistical Invisibility, says ILO 805
Child Labour in India 1099
Child Labour Rampant in Rajasthan: NCPCR 913
China, Euro Zone Threaten U.S.-Led Economic Recovery 806
Chinese Workers Strike Over Takeover of Firm by Apollo Tyres 1013
Companies must Disclose CEOs' Pay in Perspective of Staff Salaries: Govt 143
Consumer Price Index Numbers for Agricultural Labourers and Rural Labourers 27, 144, 247,
366, 483, 582,
690, 804, 916,
1012, 1114,1226
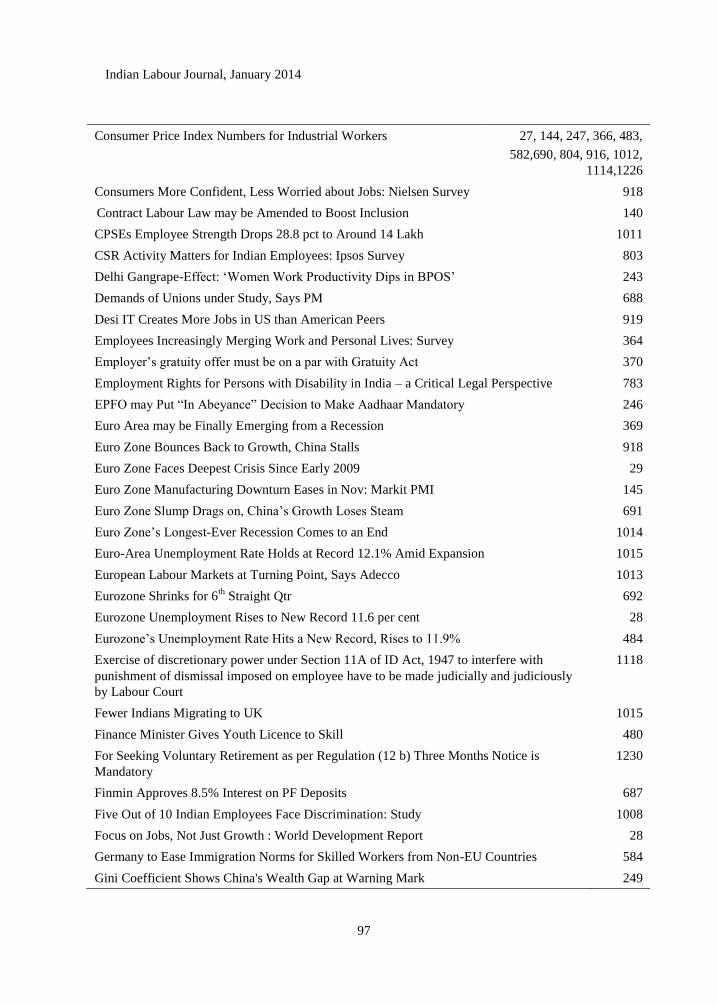
Indian Labour Journal, January 2014
97
Consumer Price Index Numbers for Industrial Workers 27, 144, 247, 366, 483,
582,690, 804, 916, 1012,
1114,1226
Consumers More Confident, Less Worried about Jobs: Nielsen Survey 918
Contract Labour Law may be Amended to Boost Inclusion 140
CPSEs Employee Strength Drops 28.8 pct to Around 14 Lakh 1011
CSR Activity Matters for Indian Employees: Ipsos Survey 803
Delhi Gangrape-Effect: ‗Women Work Productivity Dips in BPOS‘ 243
Demands of Unions under Study, Says PM 688
Desi IT Creates More Jobs in US than American Peers 919
Employees Increasingly Merging Work and Personal Lives: Survey 364
Employer‘s gratuity offer must be on a par with Gratuity Act 370
Employment Rights for Persons with Disability in India – a Critical Legal Perspective 783
EPFO may Put ―In Abeyance‖ Decision to Make Aadhaar Mandatory 246
Euro Area may be Finally Emerging from a Recession 369
Euro Zone Bounces Back to Growth, China Stalls 918
Euro Zone Faces Deepest Crisis Since Early 2009 29
Euro Zone Manufacturing Downturn Eases in Nov: Markit PMI 145
Euro Zone Slump Drags on, China‘s Growth Loses Steam 691
Euro Zone‘s Longest-Ever Recession Comes to an End 1014
Euro-Area Unemployment Rate Holds at Record 12.1% Amid Expansion 1015
European Labour Markets at Turning Point, Says Adecco 1013
Eurozone Shrinks for 6th
Straight Qtr 692
Eurozone Unemployment Rises to New Record 11.6 per cent 28
Eurozone‘s Unemployment Rate Hits a New Record, Rises to 11.9% 484
Exercise of discretionary power under Section 11A of ID Act, 1947 to interfere with
punishment of dismissal imposed on employee have to be made judicially and judiciously
by Labour Court
1118
Fewer Indians Migrating to UK 1015
Finance Minister Gives Youth Licence to Skill 480
For Seeking Voluntary Retirement as per Regulation (12 b) Three Months Notice is
Mandatory
1230
Finmin Approves 8.5% Interest on PF Deposits 687
Five Out of 10 Indian Employees Face Discrimination: Study 1008
Focus on Jobs, Not Just Growth : World Development Report 28
Germany to Ease Immigration Norms for Skilled Workers from Non-EU Countries 584
Gini Coefficient Shows China's Wealth Gap at Warning Mark 249

Indian Labour Journal, January 2014
98
Government Announces Seventh Central Pay Commission 1113
Govt Announces Sops for Manufacturing Zone Units 482
Govt Draws Up Penalties for Workplace Harassment 914
Gratuity does not bar pension 486
Greek Public Sector Workers Strike as Lenders Check Reform Progress 1117
Growth Must Generate Jobs in Sectors Women can Access: ILO Regional Director 363
High Costs, Stiff Labour Laws Drive Textile Mills to B‘desh 245
Hire Qualified People for Govt's Welfare Schemes: National Advisory Council 1010
Hiring Outlook: US Scores, India Slips 805
Hope Floats in Sinking Job Market 1111
HP Directs Chinese Suppliers to Limit Student Labour 368
ICICI Bank Trains Women Staff in Self-Defence, Ensures Safe Travel 913
If employee had not exercised the option to avail of benefit of Family Pension Scheme,
1971, raising dispute subsequently for claiming family pension would be untenable
30
If there is a violation of Section 25-F of the ID Act, workman should be compensated
instead of reinstatement
1016
ILO Calls for Bold Steps by G20 to Cut Unemployment 917
ILO Names Five Countries for Serious Violations of Freedom of Association 28
ILO Says Global Number of Child Labourers Down by A Third Since 2000 1116
ILO Director-General Calls on Countries to Boost Efforts to Fight Child Labour 1227
ILO: Tougher Measures Needed to Curb Forced Labour 367
Immigration Reform will attract Skilled Entrepreneurs 691
Important Articles of Labour Interest Published in the Periodicals
Received in the Labour Bureau
31, 149, 253, 371, 487, 587,
695, 809, 921, 1017,
1119,1231
Index to the Indian Labour Journal, Volume 53, January, 2012 to December 2012 107
India in the Eye of an Employee Turnover Storm: Survey 800
India Inc Gives Approval for Youth‘s On-the-job Training 800
India Inc to Give 11 pc Salary Hike to Employees in FY13: Experts 140
India Needs to Make Labour Laws Flexible for Jobs: Kaushik Basu 24
India to Ink Workers‘ Safety Pact with Saudi 1116
India, Sweden Sign Social Security Accord for Workers 25
Indian Techies Creating Jobs in US, Says Study 691
Indian Trade Unions are Getting Bigger, Coinciding with Slowdown 580
Indian Women Work 94 Mins More Than Men Every Day: Survey 142
Indians in S Arabia Told to Get Final Exit Visa Immediately 917
India's Unemployment Increased 2% in FY12 as Slowdown Hits Hiring 802
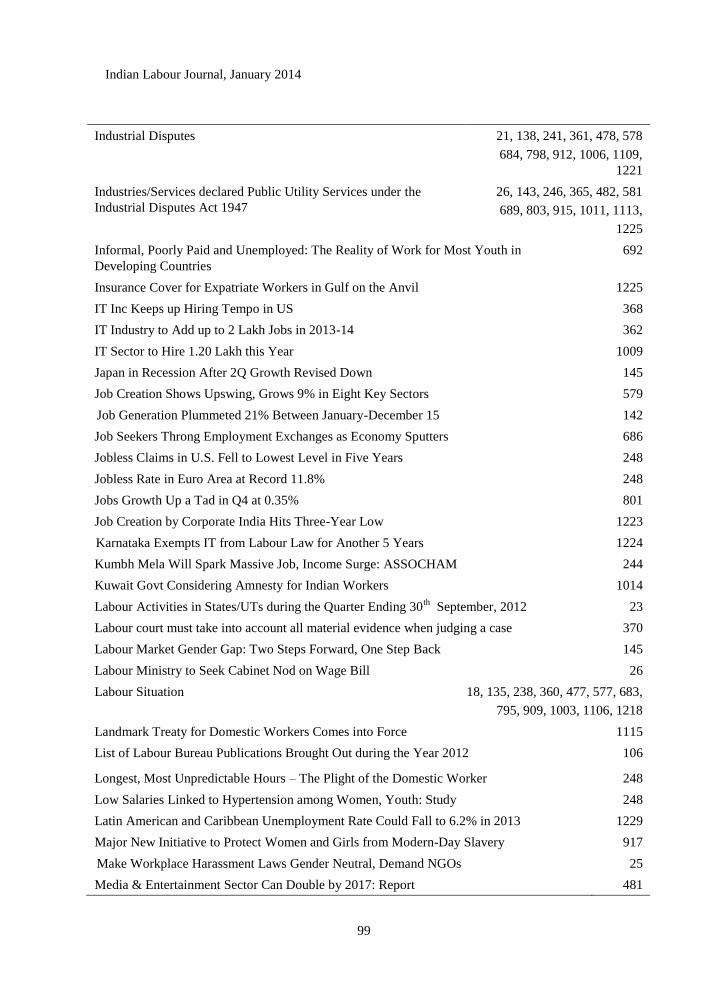
Indian Labour Journal, January 2014
99
Industrial Disputes 21, 138, 241, 361, 478, 578
684, 798, 912, 1006, 1109,
1221
Industries/Services declared Public Utility Services under the
Industrial Disputes Act 1947
26, 143, 246, 365, 482, 581
689, 803, 915, 1011, 1113,
1225
Informal, Poorly Paid and Unemployed: The Reality of Work for Most Youth in
Developing Countries
692
Insurance Cover for Expatriate Workers in Gulf on the Anvil 1225
IT Inc Keeps up Hiring Tempo in US 368
IT Industry to Add up to 2 Lakh Jobs in 2013-14 362
IT Sector to Hire 1.20 Lakh this Year 1009
Japan in Recession After 2Q Growth Revised Down 145
Job Creation Shows Upswing, Grows 9% in Eight Key Sectors 579
Job Generation Plummeted 21% Between January-December 15 142
Job Seekers Throng Employment Exchanges as Economy Sputters 686
Jobless Claims in U.S. Fell to Lowest Level in Five Years 248
Jobless Rate in Euro Area at Record 11.8% 248
Jobs Growth Up a Tad in Q4 at 0.35% 801
Job Creation by Corporate India Hits Three-Year Low 1223
Karnataka Exempts IT from Labour Law for Another 5 Years 1224
Kumbh Mela Will Spark Massive Job, Income Surge: ASSOCHAM 244
Kuwait Govt Considering Amnesty for Indian Workers 1014
Labour Activities in States/UTs during the Quarter Ending 30th
September, 2012 23
Labour court must take into account all material evidence when judging a case 370
Labour Market Gender Gap: Two Steps Forward, One Step Back 145
Labour Ministry to Seek Cabinet Nod on Wage Bill 26
Labour Situation 18, 135, 238, 360, 477, 577, 683,
795, 909, 1003, 1106, 1218
Landmark Treaty for Domestic Workers Comes into Force 1115
List of Labour Bureau Publications Brought Out during the Year 2012 106
Longest, Most Unpredictable Hours – The Plight of the Domestic Worker 248
Low Salaries Linked to Hypertension among Women, Youth: Study 248
Latin American and Caribbean Unemployment Rate Could Fall to 6.2% in 2013 1229
Major New Initiative to Protect Women and Girls from Modern-Day Slavery 917
Make Workplace Harassment Laws Gender Neutral, Demand NGOs 25
Media & Entertainment Sector Can Double by 2017: Report 481
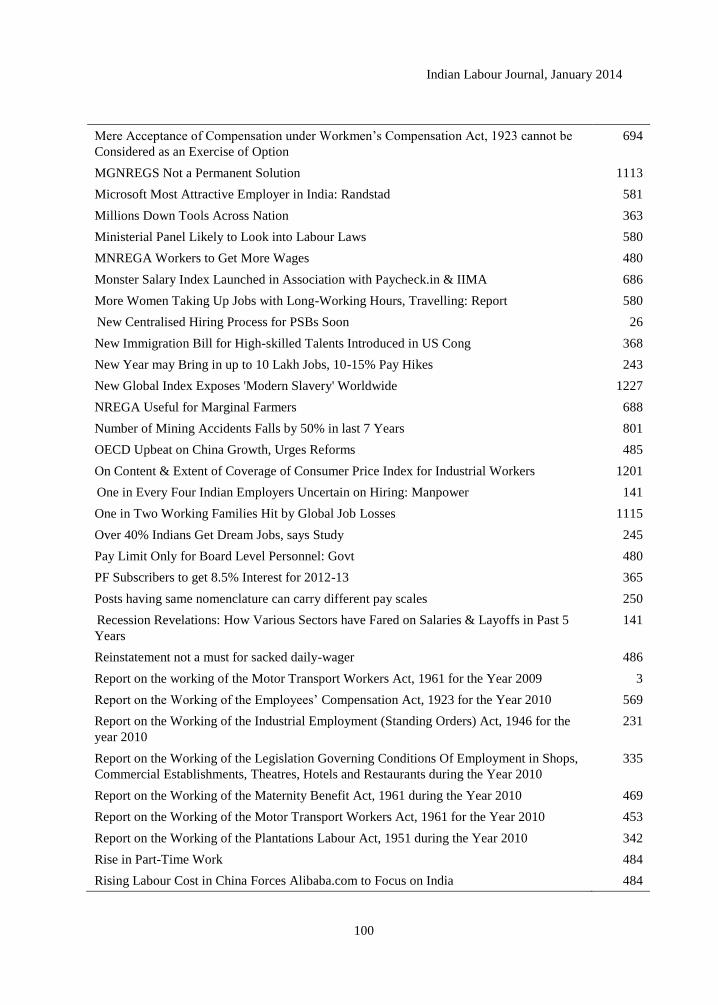
Indian Labour Journal, January 2014
100
Mere Acceptance of Compensation under Workmen‘s Compensation Act, 1923 cannot be
Considered as an Exercise of Option
694
MGNREGS Not a Permanent Solution 1113
Microsoft Most Attractive Employer in India: Randstad 581
Millions Down Tools Across Nation 363
Ministerial Panel Likely to Look into Labour Laws 580
MNREGA Workers to Get More Wages 480
Monster Salary Index Launched in Association with Paycheck.in & IIMA 686
More Women Taking Up Jobs with Long-Working Hours, Travelling: Report 580
New Centralised Hiring Process for PSBs Soon 26
New Immigration Bill for High-skilled Talents Introduced in US Cong 368
New Year may Bring in up to 10 Lakh Jobs, 10-15% Pay Hikes 243
New Global Index Exposes 'Modern Slavery' Worldwide 1227
NREGA Useful for Marginal Farmers 688
Number of Mining Accidents Falls by 50% in last 7 Years 801
OECD Upbeat on China Growth, Urges Reforms 485
On Content & Extent of Coverage of Consumer Price Index for Industrial Workers 1201
One in Every Four Indian Employers Uncertain on Hiring: Manpower 141
One in Two Working Families Hit by Global Job Losses 1115
Over 40% Indians Get Dream Jobs, says Study 245
Pay Limit Only for Board Level Personnel: Govt 480
PF Subscribers to get 8.5% Interest for 2012-13 365
Posts having same nomenclature can carry different pay scales 250
Recession Revelations: How Various Sectors have Fared on Salaries & Layoffs in Past 5
Years
141
Reinstatement not a must for sacked daily-wager 486
Report on the working of the Motor Transport Workers Act, 1961 for the Year 2009 3
Report on the Working of the Employees‘ Compensation Act, 1923 for the Year 2010 569
Report on the Working of the Industrial Employment (Standing Orders) Act, 1946 for the
year 2010
231
Report on the Working of the Legislation Governing Conditions Of Employment in Shops,
Commercial Establishments, Theatres, Hotels and Restaurants during the Year 2010
335
Report on the Working of the Maternity Benefit Act, 1961 during the Year 2010 469
Report on the Working of the Motor Transport Workers Act, 1961 for the Year 2010 453
Report on the Working of the Plantations Labour Act, 1951 during the Year 2010 342
Rise in Part-Time Work 484
Rising Labour Cost in China Forces Alibaba.com to Focus on India 484
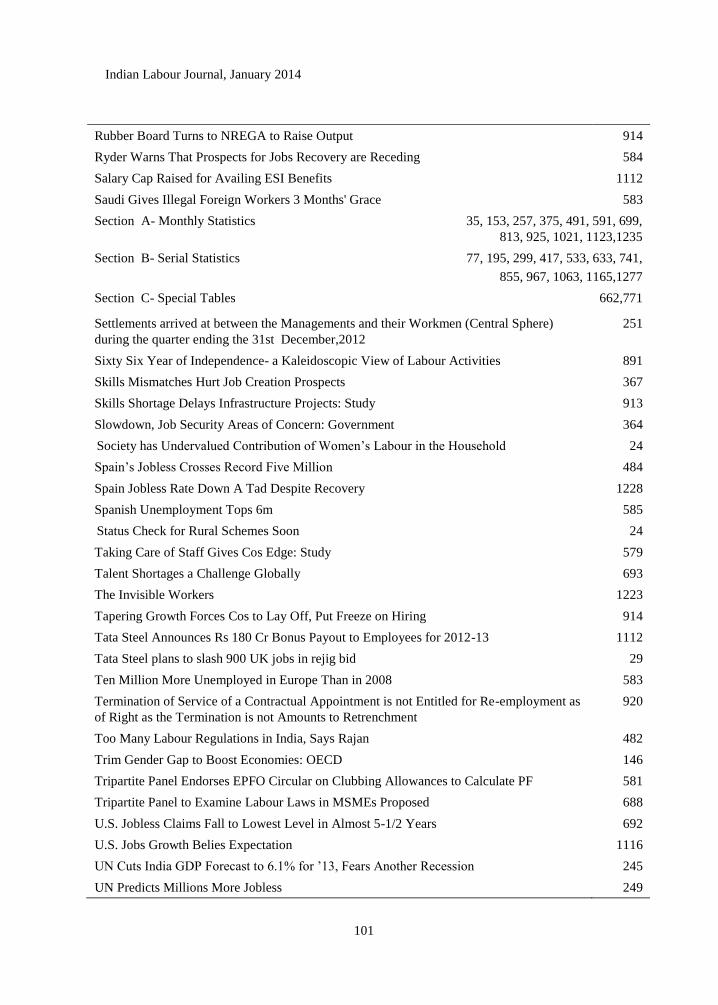
Indian Labour Journal, January 2014
101
Rubber Board Turns to NREGA to Raise Output 914
Ryder Warns That Prospects for Jobs Recovery are Receding 584
Salary Cap Raised for Availing ESI Benefits 1112
Saudi Gives Illegal Foreign Workers 3 Months' Grace 583
Section A- Monthly Statistics 35, 153, 257, 375, 491, 591, 699,
813, 925, 1021, 1123,1235
Section B- Serial Statistics 77, 195, 299, 417, 533, 633, 741,
855, 967, 1063, 1165,1277
Section C- Special Tables 662,771
Settlements arrived at between the Managements and their Workmen (Central Sphere)
during the quarter ending the 31st December,2012
251
Sixty Six Year of Independence- a Kaleidoscopic View of Labour Activities 891
Skills Mismatches Hurt Job Creation Prospects 367
Skills Shortage Delays Infrastructure Projects: Study 913
Slowdown, Job Security Areas of Concern: Government 364
Society has Undervalued Contribution of Women‘s Labour in the Household 24
Spain‘s Jobless Crosses Record Five Million 484
Spain Jobless Rate Down A Tad Despite Recovery 1228
Spanish Unemployment Tops 6m 585
Status Check for Rural Schemes Soon 24
Taking Care of Staff Gives Cos Edge: Study 579
Talent Shortages a Challenge Globally 693
The Invisible Workers 1223
Tapering Growth Forces Cos to Lay Off, Put Freeze on Hiring 914
Tata Steel Announces Rs 180 Cr Bonus Payout to Employees for 2012-13 1112
Tata Steel plans to slash 900 UK jobs in rejig bid 29
Ten Million More Unemployed in Europe Than in 2008 583
Termination of Service of a Contractual Appointment is not Entitled for Re-employment as
of Right as the Termination is not Amounts to Retrenchment
920
Too Many Labour Regulations in India, Says Rajan 482
Trim Gender Gap to Boost Economies: OECD 146
Tripartite Panel Endorses EPFO Circular on Clubbing Allowances to Calculate PF 581
Tripartite Panel to Examine Labour Laws in MSMEs Proposed 688
U.S. Jobless Claims Fall to Lowest Level in Almost 5-1/2 Years 692
U.S. Jobs Growth Belies Expectation 1116
UN Cuts India GDP Forecast to 6.1% for ‘13, Fears Another Recession 245
UN Predicts Millions More Jobless 249
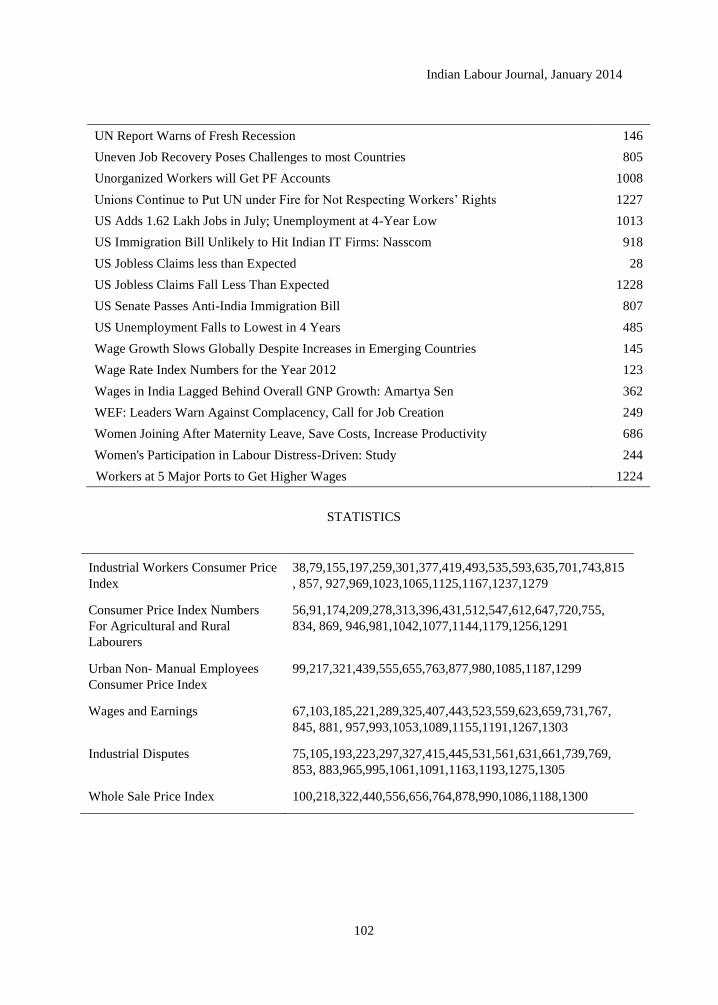
Indian Labour Journal, January 2014
102
UN Report Warns of Fresh Recession 146
Uneven Job Recovery Poses Challenges to most Countries 805
Unorganized Workers will Get PF Accounts 1008
Unions Continue to Put UN under Fire for Not Respecting Workers‘ Rights 1227
US Adds 1.62 Lakh Jobs in July; Unemployment at 4-Year Low 1013
US Immigration Bill Unlikely to Hit Indian IT Firms: Nasscom 918
US Jobless Claims less than Expected 28
US Jobless Claims Fall Less Than Expected 1228
US Senate Passes Anti-India Immigration Bill 807
US Unemployment Falls to Lowest in 4 Years 485
Wage Growth Slows Globally Despite Increases in Emerging Countries 145
Wage Rate Index Numbers for the Year 2012 123
Wages in India Lagged Behind Overall GNP Growth: Amartya Sen 362
WEF: Leaders Warn Against Complacency, Call for Job Creation 249
Women Joining After Maternity Leave, Save Costs, Increase Productivity 686
Women's Participation in Labour Distress-Driven: Study 244
Workers at 5 Major Ports to Get Higher Wages 1224
STATISTICS
Industrial Workers Consumer Price
Index
38,79,155,197,259,301,377,419,493,535,593,635,701,743,815
, 857, 927,969,1023,1065,1125,1167,1237,1279
Consumer Price Index Numbers
For Agricultural and Rural
Labourers
56,91,174,209,278,313,396,431,512,547,612,647,720,755,
834, 869, 946,981,1042,1077,1144,1179,1256,1291
Urban Non- Manual Employees
Consumer Price Index
99,217,321,439,555,655,763,877,980,1085,1187,1299
Wages and Earnings 67,103,185,221,289,325,407,443,523,559,623,659,731,767,
845, 881, 957,993,1053,1089,1155,1191,1267,1303
Industrial Disputes 75,105,193,223,297,327,415,445,531,561,631,661,739,769,
853, 883,965,995,1061,1091,1163,1193,1275,1305
Whole Sale Price Index 100,218,322,440,556,656,764,878,990,1086,1188,1300
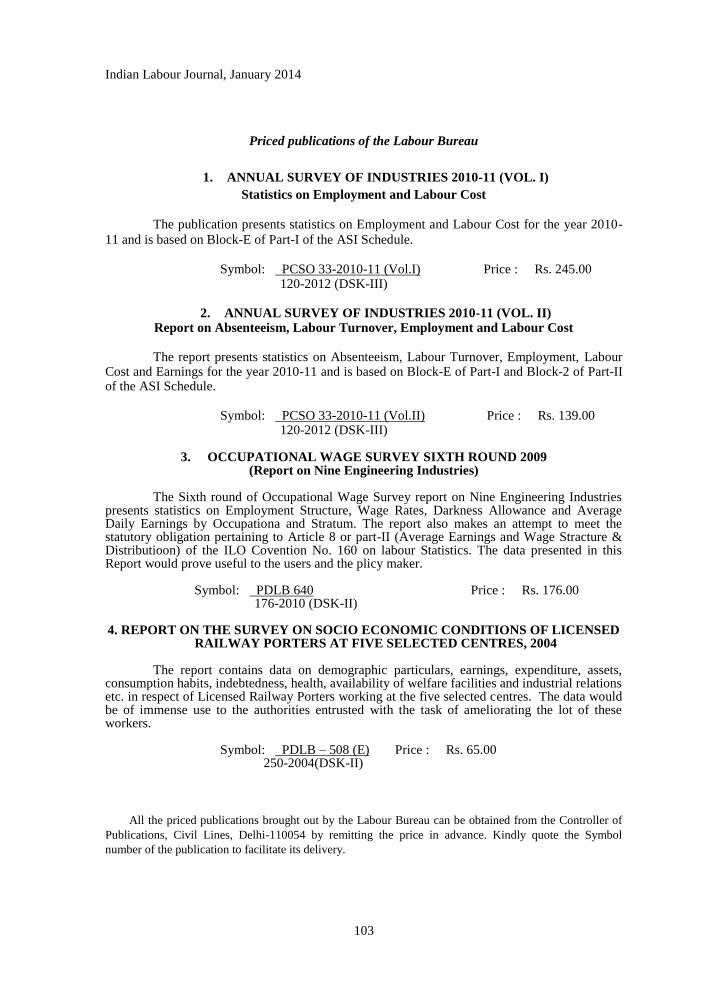
Indian Labour Journal, January 2014
103
Priced publications of the Labour Bureau
1. ANNUAL SURVEY OF INDUSTRIES 2010-11 (VOL. I)
Statistics on Employment and Labour Cost
The publication presents statistics on Employment and Labour Cost for the year 2010-
11 and is based on Block-E of Part-I of the ASI Schedule.
Symbol: PCSO 33-2010-11 (Vol.I) 120-2012 (DSK-III)
Price : Rs. 245.00
2. ANNUAL SURVEY OF INDUSTRIES 2010-11 (VOL. II)
Report on Absenteeism, Labour Turnover, Employment and Labour Cost
The report presents statistics on Absenteeism, Labour Turnover, Employment, Labour Cost and Earnings for the year 2010-11 and is based on Block-E of Part-I and Block-2 of Part-II of the ASI Schedule.
Symbol: PCSO 33-2010-11 (Vol.II) 120-2012 (DSK-III)
Price : Rs. 139.00
3. OCCUPATIONAL WAGE SURVEY SIXTH ROUND 2009
(Report on Nine Engineering Industries)
The Sixth round of Occupational Wage Survey report on Nine Engineering Industries presents statistics on Employment Structure, Wage Rates, Darkness Allowance and Average Daily Earnings by Occupationa and Stratum. The report also makes an attempt to meet the statutory obligation pertaining to Article 8 or part-II (Average Earnings and Wage Stracture & Distributioon) of the ILO Covention No. 160 on labour Statistics. The data presented in this Report would prove useful to the users and the plicy maker.
Symbol: PDLB 640 176-2010 (DSK-II)
Price : Rs. 176.00
4. REPORT ON THE SURVEY ON SOCIO ECONOMIC CONDITIONS OF LICENSED RAILWAY PORTERS AT FIVE SELECTED CENTRES, 2004
The report contains data on demographic particulars, earnings, expenditure, assets, consumption habits, indebtedness, health, availability of welfare facilities and industrial relations etc. in respect of Licensed Railway Porters working at the five selected centres. The data would be of immense use to the authorities entrusted with the task of ameliorating the lot of these workers.
Symbol: PDLB – 508 (E) 250-2004(DSK-II)
Price : Rs. 65.00
All the priced publications brought out by the Labour Bureau can be obtained from the Controller of
Publications, Civil Lines, Delhi-110054 by remitting the price in advance. Kindly quote the Symbol
number of the publication to facilitate its delivery.
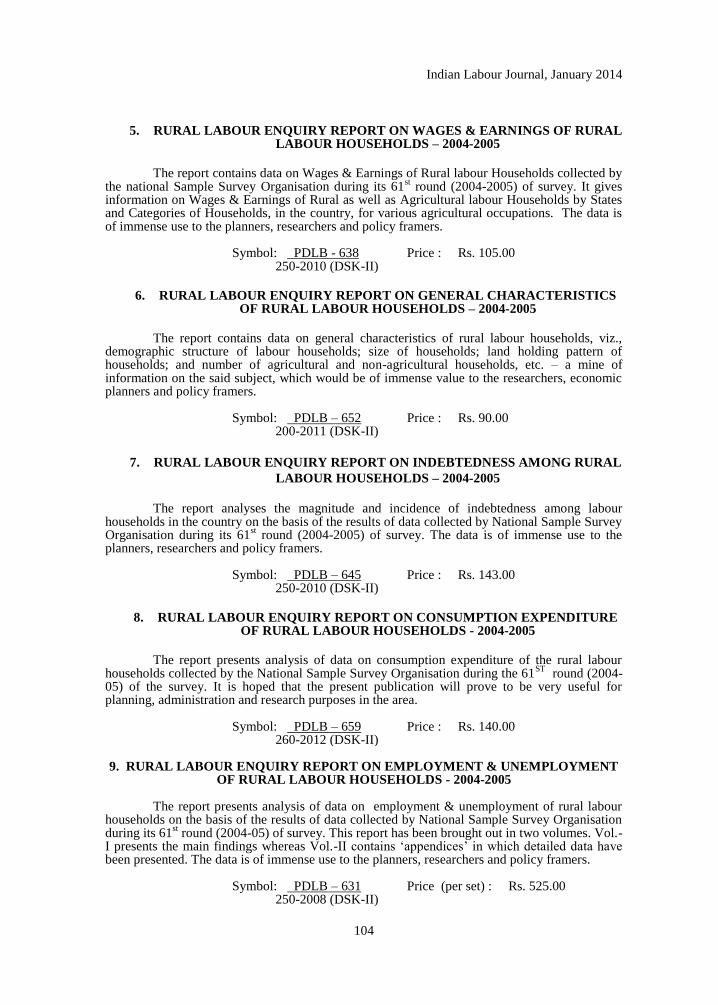
Indian Labour Journal, January 2014
104
5. RURAL LABOUR ENQUIRY REPORT ON WAGES & EARNINGS OF RURAL LABOUR HOUSEHOLDS – 2004-2005
The report contains data on Wages & Earnings of Rural labour Households collected by
the national Sample Survey Organisation during its 61st round (2004-2005) of survey. It gives
information on Wages & Earnings of Rural as well as Agricultural labour Households by States and Categories of Households, in the country, for various agricultural occupations. The data is of immense use to the planners, researchers and policy framers.
Symbol: PDLB - 638 250-2010 (DSK-II)
Price : Rs. 105.00
6. RURAL LABOUR ENQUIRY REPORT ON GENERAL CHARACTERISTICS OF RURAL LABOUR HOUSEHOLDS – 2004-2005
The report contains data on general characteristics of rural labour households, viz.,
demographic structure of labour households; size of households; land holding pattern of households; and number of agricultural and non-agricultural households, etc. – a mine of information on the said subject, which would be of immense value to the researchers, economic planners and policy framers.
Symbol: PDLB – 652 200-2011 (DSK-II)
Price : Rs. 90.00
7. RURAL LABOUR ENQUIRY REPORT ON INDEBTEDNESS AMONG RURAL
LABOUR HOUSEHOLDS – 2004-2005
The report analyses the magnitude and incidence of indebtedness among labour
households in the country on the basis of the results of data collected by National Sample Survey Organisation during its 61
st round (2004-2005) of survey. The data is of immense use to the
planners, researchers and policy framers.
Symbol: PDLB – 645 250-2010 (DSK-II)
Price : Rs. 143.00
8. RURAL LABOUR ENQUIRY REPORT ON CONSUMPTION EXPENDITURE OF RURAL LABOUR HOUSEHOLDS - 2004-2005
The report presents analysis of data on consumption expenditure of the rural labour
households collected by the National Sample Survey Organisation during the 61ST
round (2004-05) of the survey. It is hoped that the present publication will prove to be very useful for planning, administration and research purposes in the area.
Symbol: PDLB – 659 260-2012 (DSK-II)
Price : Rs. 140.00
9. RURAL LABOUR ENQUIRY REPORT ON EMPLOYMENT & UNEMPLOYMENT
OF RURAL LABOUR HOUSEHOLDS - 2004-2005
The report presents analysis of data on employment & unemployment of rural labour households on the basis of the results of data collected by National Sample Survey Organisation during its 61
st round (2004-05) of survey. This report has been brought out in two volumes. Vol.-
I presents the main findings whereas Vol.-II contains ‗appendices‘ in which detailed data have been presented. The data is of immense use to the planners, researchers and policy framers.
Symbol: PDLB – 631 250-2008 (DSK-II)
Price (per set) : Rs. 525.00

Indian Labour Journal, January 2014
105
10. CONSUMER PRICE INDEX NUMBERS FOR AGRICULTURAL AND RURAL
LABOURERS 1986-87=100) Annual Report- 2011-12 ( Agricultural Year)
This publication, 15th
in the series, contains detailed information on Consumer price Index Numbers for Agricultural and Rural Labourers ( Base: 1986-87=100) for the period July, 2011 to June, 2012. These index numbers, and especially the CPI (AL), play an important role in fixing/revising the minimum wages of agricultural workers.
Symbol: PDL – 560 150-2012 (DSK-II)
Price: Rs. 90.00
11. CONSUMER PRICE INDEX NUMBERS
( For Industrial Workers) 2001=100 Annual Report- 2012
The publication presents serial statistics on Consumer Price Index Number for Industrial Workers with Base: 2001=100 for 78 industrial centres and also for all India. It also contains major group-wise (food, pan, supari, tobacco and intoxicants, fuel and light, housing, clothing, bedding and footwear and miscellaneous) and subgroups wise indices alongwith Linking Factors for conversion of the index to old base (1982=100).
Symbol: PDL – 561 300-2013 (DSK-II)
Price: Rs. 190.00
12. WAGE RATES IN RURAL INDIA
2011-2012 (Agricultural Year)
The publication, 15th
in the series, contains daily wage rate data in respect of 11 Agricultural and 7 Non-Agricultural Occupations for the period July, 2011 to June, 2012. The data on wage rates play an important role in the calculation of State/National Income, drawing up and implementation of wage policy as well as in fixation/revision of support prices of agricultural crops.
Symbol: PDLB – 660 200-2012 (DSK-II)
Price: Rs.90.00
13. NINTH DIGEST OF INDIAN LABOUR RESEARCH 2010
The publication present an annotated bibliography of research studies undertaken by
various Universities, Government Departmentsn (Central/State), Social Research Institutes, Employers‘ and Workers‘‘ organizations and individual researchers in the field of labour and labour related issues.
Symbol: PDLB – 644 100-2010 (DSK-II)
Price : Rs. 109.00
14. TRADE UNION IN INDIA 2010
Trade Unions in India is abiennial publication. It presents information in respect of Workers
and Employers Unions, on Resigtered Trade Unions submitting returns by their sex-wise embership. Besides, it also present data of income and expenditure of Workers as well as Employers Unions.
Symbol: PDLB -662 100-2013(DSK-II)

Indian Labour Journal, January 2014
106
15. STATISTICAL PROFILE ON WOMEN LABOUR 2009-2011
The publication provides comprehensive and recent most statistics on important aspects of Women Labour in India at one place and helps the researchers to study the gender variations in the population, employment, employment services and training, wages/earnings, participation in trade union movement, slcial sectrity.
Symbol: PDLB -661 150-2012 (DSK-II)
16. REPORT ON THE WORKING OF MINIMUM WAGES ACT, 1948 FOR THE YEAR 2011
The report covers informationon employment added, employments in which the
Minimum Wages were fixed for the first time, the Minimum Wages in different scheduled employments prevalent during the year, the range of Minimum Wages, comparative Minimum Wage Rates prevailing in scheduled employments and number of Inspections. Etc.
Symbol: PDLB .16-2011 90-2012 (DSK-II)
Price : Rs. 198.00
17. INDIAN LABOUR YEAR BOOK 2009 and 2010
The Indian Labour Year Book provides , in a compact volume, a general description of
various topics, alongwith the latest available data in the field of labour such as Employment, Wages, Levels of Living and Consumer Price Index Numbers, Industrial Relation, Welfare, Housing, Health, Labour Legislation, Labour Administration etc., alongwith relevant supporting statistics and synopsis of Labour Bureau Publications.
Symbol: PDLB .19.2009-2010 (combined) 400-2011 (DSK-III)
Price : Rs. 175.00
18. INDIAN LABOUR STATISTICS 2011 (Bilingual)
A bilingual publication containing serial statistics relating to labour. It presents data on
employment in Factories, Mines, Plantation, Railways, Employment Service and Training, Wages and Earnings, Price Indices, Trade Unions, Industrial Injuries, Absenteeism and Labour Turnover, Social Security, Industrial Disputes and International statistics pertaining to Labour
Symbol: PDLB – 30-2011 (bilingual) 175-2012 (DSK-III)
Price: Rs. 115.00
19. POCKET BOOK OF LABOUR STATISTICS 2010-11 (Bilingual)
Pocket Book of Labour Statistics presents in a concise form serial statistical data in
respect of various important aspects of Labour. These statistics cover Employment and Training, Wages Earning, Prices, Industrial Disputes, Accidents, Absenteeism, Social Security, etc. Key indicators for India and other countries have also been presented.
Symbol: PDLB – 163-2010-2011 (Bilingual) 250-2012 (DSK-III)
Price: Rs.80.00

Indian Labour Journal, January 2014
107
INDIAN BOOK EXCHANGE
Registration No. ―G 3/DL(N)-04/0008/2003-05‖
Printed by the Printing Unit of Labour Bureau, Shimla
Editor I.S.Negi, Labour Bureau, Shimla and published by
Controller of Publications, Government of India,
Civil Lines, Delhi-110054