puzzles and contradictions of the indian labour market
TRANSCRIPT
ASARC WORKING PAPER 2017/02
1
The puzzles and contradictions of the Indian labour market:
What will the future of work look like?
Sher Singh Verick1
ASARC, International Labour Organization (ILO) and IZA
Abstract: Analysing the Indian labour market poses inherent challenges given the country’s size and
diversity. Rather than a case of “jobless growth”, India has experienced concentrated employment
growth, mainly in urban areas and for men. Women’s participation in the labour force has declined.
Some outcomes partly reflect India’s overall level of economic development. At the same time,
structural transformation in other countries, including those in the region, has led to greater
absorption of workers, particularly women, in manufacturing. Looking at the future of work, the
current situation is likely to prevail in the near future, unless policy interventions inject a structural
shift in trends. This means that workers will continue to leave agriculture and seek employment in
urban areas. But the ability of the manufacturing sector to engage workers will be constrained by the
capital and skill intensity of production, which will be further impacted by technological change. More
wage employment will be created but the challenge is to ensure these workers have access to social
security and other benefits. As women become better educated, their participation in the labour force
is likely to increase but many constraints keep them out of paid employment.
Keywords: Jobless growth, Female labour force participation, Informal sector, Manufacturing sector
employment
JEL Classification Code: J21, J22 J46, J48
1 The views of the author do not necessarily represent those of the International Labour Organization (ILO).
ASARC WORKING PAPER 2017/02
2
1. Introduction
In the 2000s, India regularly achieved an annual growth rate of 8 per cent or more and proved to be
relatively resilient to the global financial crisis. By 2015, with China slowing down, India confirmed its
place as the fastest growing large economy, reaching a GDP growth rate of 7.6 per cent.
However, despite strong growth sustained over many years, it has been widely argued that the Indian
labour market has lagged economic performance. After the release of the 2009‐10 National Sample
Survey (NSS) data, the figures suggested a net increase in employment of just 1.1 million from 2004‐5
to 2009‐10. Many commentators were quick (and still claim) that this was clear evidence of “jobless
growth”. How could an economy growing at around 8 per cent per year create just over a million jobs
in 5 years in a country with a total workforce of over 450 million?
If taken at face value, labour market figures from the second half of the 2000s would indeed suggest
jobless growth. However, digging deeper, beyond aggregate labour market statistics, reveals a far
more complex story, which suggests both positive and negative trends. Disaggregating total
employment by location, gender and sectoral trends shows that, despite the overall stagnation of
aggregate employment, jobs were being created. In fact, much of the slow growth in employment can
be attributed to the withdrawal of workers (mostly the self‐employed) from agriculture, especially
women. During the 2000s, male employment grew by 1.9 per cent per annum from 1999‐2000 to
2011‐12, while female employment increased by only 0.3 per cent on an annual basis. Urban areas
accounted for 57.2 per cent of the growth in employment, though just over 30 per cent of the
population live in urban areas (as per the 2011 Population Census).
Analysing the Indian labour market poses inherent challenges given the country’s size and diversity:
in a large country, such as India, jobs are continually being created and destroyed. Moreover,
employment in India is often temporary, seasonal or ad‐hoc. Half of workers are self‐employed, while
the majority of casual workers do not have a clearly defined employment relationship. In such a
context, aggregate figures can be misleading and, at times, outright puzzling. For this reason,
economic and employment trends are routinely questioned, while hardened positions can be formed
on the basis of an aggregate analysis that masks more nuanced developments in the labour market.
As argued in this paper, rather than focusing on quantitative numbers based on net changes in total
employment or the labour force, it is more insightful to take a more disaggregated view of India’s
ASARC WORKING PAPER 2017/02
3
labour market, which yields a better picture of the quality of employment in India. Three key
dimensions are important: 1) low and declining female labour force participation; 2) informality; and
3) sectoral nature of employment trends.
Firstly, one of the biggest puzzles to emerge during the 2000s was the fall in female labour force
participation in India, which was most pronounced in rural areas due to the withdrawal of women
from agriculture. At less than 30 per cent, India has one of lowest levels of female labour force
participation in the world, which is the result of a complex set of demand and supply‐side factors,
including social norms and the lack of appropriate job opportunities in the vicinity of where women
live. The long‐term challenge in India, like much of South Asia, is to increase opportunities for women
to work outside the home in decent and productive employment.
Secondly, the majority of workers in India are informal due to the nature of the workplace and the
employment conditions provided by employers. Behind the apparent persistence of informality in the
Indian labour market, there are actually two underlying, but diverging, trends. Firstly, the share of
workers in the unorganized sector (enterprises with fewer than 10 workers, including own‐account
workers) fell from 86.3 per cent in 2004‐05 to 84.3 per cent in 2009‐10, and further to 82.2 per cent
in 2011‐12. At the same time, the share of informal workers in the organized sector (i.e. workers
without access to social security in larger enterprises) increased significantly through the greater
utilization of contract and other forms of casual labour. Due to these two countervailing trends, the
percentage of workers in informal employment in India has stayed stagnant at around 92 per cent.
Finally, linked to these employment issues is the sectoral pattern of employment growth in India. In
particular, there has been widespread academic and policy discourse on the apparent failure of India’s
manufacturing sector to be the driver of economic growth and job creation. The share of
manufacturing in total employment has stood around just 12 per cent in India, while it has accounted
for a slightly higher share of GDP. The expectation that this sector can absorb more workers is
challenged by the increasing capital and skill‐intensity of manufacturing, which will be further
impacted by technological change.
These three characteristics of the labour market will shape the future of work in India, which, due to
having the largest youth population in the world, will also be a major determinant of the future of
work globally. In this respect, the nature of work in India in the coming decades will depend on
whether and how women work, whether more formal jobs are created and which sector will be the
ASARC WORKING PAPER 2017/02
4
main generator of jobs for youth. If the world is to achieve the targets under Goal 8 of the Sustainable
Development Goals by 2030 it will depend on India’s success in creating more inclusive growth and
decent work, overcoming the challenges inherent in these three employment dimensions.
Around the world, many commentators are expressing their concerns of job losses resulting from
technological change associated with automation through robotics and artificial intelligence. This
“automation angst” may be a real challenge in advanced economies. However, empirical evidence
confirms that, while technology is being adopted faster and faster in developing countries (a decrease
in the adoption lag), new technologies are used less intensely in poorer economies. Thus, rather than
expecting rapid change in a developing country like India, the risk is that segments of the labour
market will miss out on accessing more productive technologies. Therefore, the larger challenge is
inequality driven by the slow pace of technology diffusion in developing countries and its implications
for labour demand by skill level (and hence, wages).
Though this paper doesn’t delve into the relationship between technology and employment, it does
focus on the implications of current labour market trends in India for the future of work, which will be
further impacted by technological change. What will happen to women in the Indian workforce,
particularly those in rural areas? Will workers be able to make the transition to formal employment?
Will the manufacturing sector create employment for large numbers of workers, including the
unskilled?
The remainder of this paper takes on the task of analysing the answers to these questions and
highlighting a number of key dimensions of the Indian labour market. Section 2 explores the macro
trends in employment, addressing the claim of “jobless” growth, while sections 3 to 5 analyse in depth
three defining dimensions of the Indian labour market: the low and declining level of female labour
force participation; the persistence of informality; and the apparent failure of manufacturing to absorb
more jobs. Section 6 concludes and summarizes the implications of the issues explored in this paper
for the future of work in India.
2. Did India experience jobless growth in the 2000s?
The acceleration in India’s growth rate in the 1990s and 2000s is well‐known; however, a major
challenge for India has been sustaining a growth rate above 8 percent, which China managed over
ASARC WORKING PAPER 2017/02
5
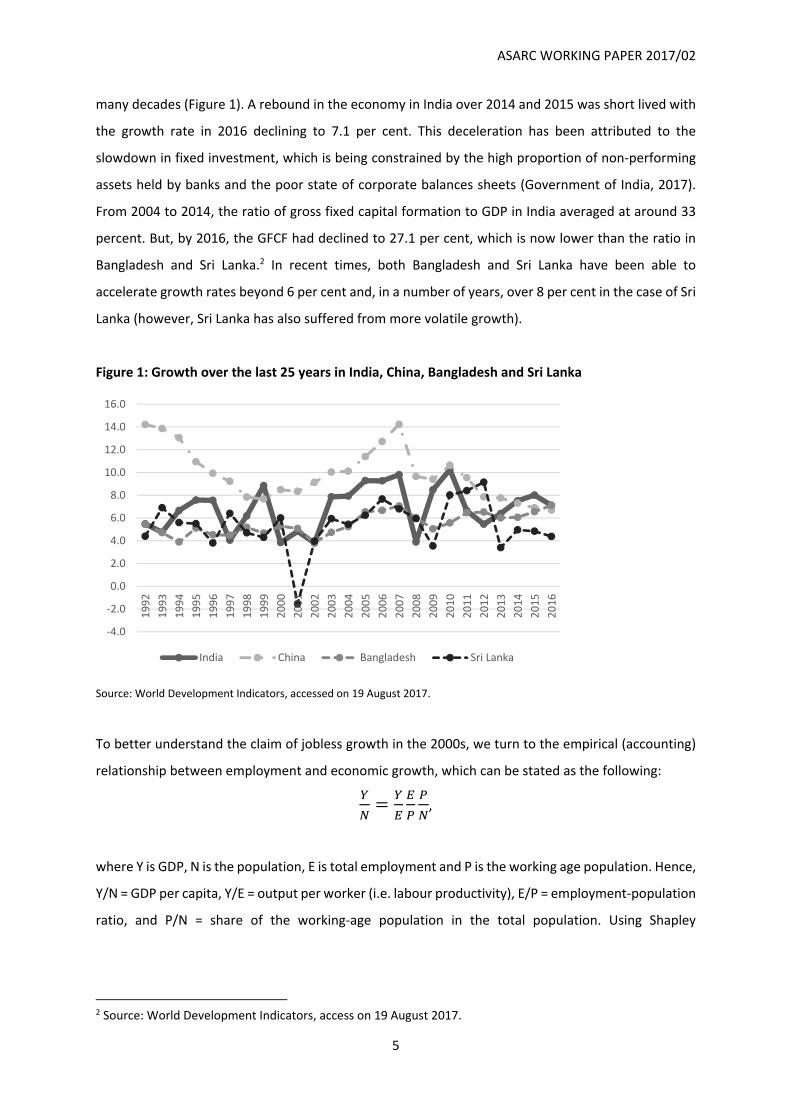
many decades (Figure 1). A rebound in the economy in India over 2014 and 2015 was short lived with
the growth rate in 2016 declining to 7.1 per cent. This deceleration has been attributed to the
slowdown in fixed investment, which is being constrained by the high proportion of non‐performing
assets held by banks and the poor state of corporate balances sheets (Government of India, 2017).
From 2004 to 2014, the ratio of gross fixed capital formation to GDP in India averaged at around 33
percent. But, by 2016, the GFCF had declined to 27.1 per cent, which is now lower than the ratio in
Bangladesh and Sri Lanka.2 In recent times, both Bangladesh and Sri Lanka have been able to
accelerate growth rates beyond 6 per cent and, in a number of years, over 8 per cent in the case of Sri
Lanka (however, Sri Lanka has also suffered from more volatile growth).
Figure 1: Growth over the last 25 years in India, China, Bangladesh and Sri Lanka
Source: World Development Indicators, accessed on 19 August 2017.
To better understand the claim of jobless growth in the 2000s, we turn to the empirical (accounting)
relationship between employment and economic growth, which can be stated as the following:
,
where Y is GDP, N is the population, E is total employment and P is the working age population. Hence,
Y/N = GDP per capita, Y/E = output per worker (i.e. labour productivity), E/P = employment‐population
ratio, and P/N = share of the working‐age population in the total population. Using Shapley
2 Source: World Development Indicators, access on 19 August 2017.
‐4.0
‐2.0
0.0
2.0
4.0
6.0
8.0
10.0
12.0
14.0
16.0
1992
1993
1994
1995
1996
1997
1998
1999
2000
2001
2002
2003
2004
2005
2006
2007
2008
2009
2010
2011
2012
2013
2014
2015
2016
India China Bangladesh Sri Lanka
ASARC WORKING PAPER 2017/02
6
decompositions, per capita GDP growth can, therefore, be decomposed into growth associated with
changes in: 1) output per worker; 2) employment rate; and 3) the size of the working age population.3
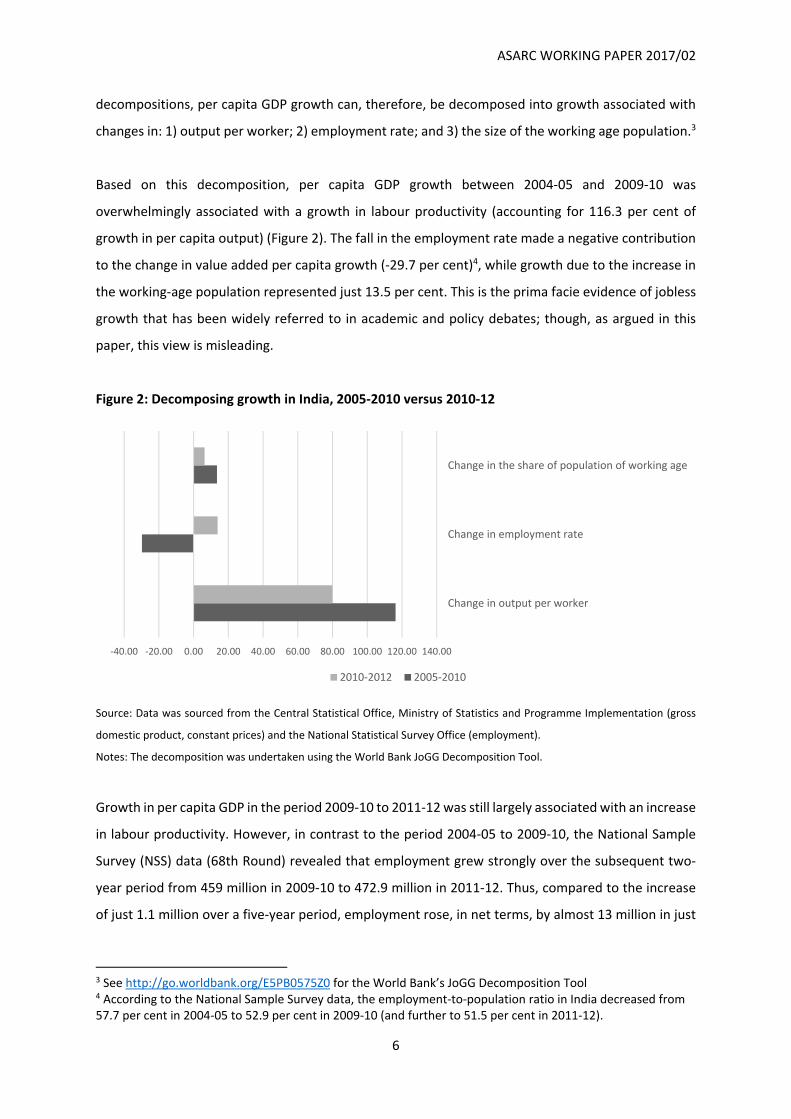
Based on this decomposition, per capita GDP growth between 2004‐05 and 2009‐10 was
overwhelmingly associated with a growth in labour productivity (accounting for 116.3 per cent of
growth in per capita output) (Figure 2). The fall in the employment rate made a negative contribution
to the change in value added per capita growth (‐29.7 per cent)4, while growth due to the increase in
the working‐age population represented just 13.5 per cent. This is the prima facie evidence of jobless
growth that has been widely referred to in academic and policy debates; though, as argued in this
paper, this view is misleading.
Figure 2: Decomposing growth in India, 2005‐2010 versus 2010‐12
Source: Data was sourced from the Central Statistical Office, Ministry of Statistics and Programme Implementation (gross
domestic product, constant prices) and the National Statistical Survey Office (employment).
Notes: The decomposition was undertaken using the World Bank JoGG Decomposition Tool.
Growth in per capita GDP in the period 2009‐10 to 2011‐12 was still largely associated with an increase
in labour productivity. However, in contrast to the period 2004‐05 to 2009‐10, the National Sample
Survey (NSS) data (68th Round) revealed that employment grew strongly over the subsequent two‐
year period from 459 million in 2009‐10 to 472.9 million in 2011‐12. Thus, compared to the increase
of just 1.1 million over a five‐year period, employment rose, in net terms, by almost 13 million in just
3 See http://go.worldbank.org/E5PB0575Z0 for the World Bank’s JoGG Decomposition Tool 4 According to the National Sample Survey data, the employment‐to‐population ratio in India decreased from 57.7 per cent in 2004‐05 to 52.9 per cent in 2009‐10 (and further to 51.5 per cent in 2011‐12).
‐40.00 ‐20.00 0.00 20.00 40.00 60.00 80.00 100.00 120.00 140.00
Change in output per worker
Change in employment rate
Change in the share of population of working age
2010‐2012 2005‐2010
ASARC WORKING PAPER 2017/02
7
two years. Again, taking a simplistic view of the relationship between growth and employment, there
is clearly a shift in the contribution of the change in the employment rate to the growth in per capita
value added, which is now positive (Figure 2). Nonetheless, the contribution of the growth in labour
productivity over 2009‐10 to 2011‐12 is still much larger (79.9 per cent versus 13.8 per cent), while
the contribution of the change in the working‐age population has fallen to 6.3 per cent. It appears that
this growth in productivity has benefited workers in terms of wages, at least on average. From 2004‐
05 to 2011‐12, the wages of regular workers grew by 3.98 per cent per annum, while it grew by 6.15
per cent for casual workers.
In large developing countries, true “jobless growth” is unlikely, apart from economies relying on the
extractive sector for growth. In order to grow fast, it is essential that inputs are used more productively
than before; it is not possible to grow at 10 per cent (for a sustained period) by simply increasing the
number of workers employed by 10 per cent. Such a situation, only possible in a planned economy,
would imply that productivity is not rising and, therefore, there would be insufficient gains in living
standards. In contrast, an economy growing at 10 per cent due to 10 per cent growth in labour
productivity implies that unemployment/joblessness would be increasing (if the labour force was
rising).
In a large, diverse country like India, jobs are being created and destroyed on a continuous basis; on
the other hand, most workers are not employed in a job but are self‐employed (around 51 per cent of
all workers), while employment in India is often temporary or seasonal. The more important issue is
where jobs are created and who is accessing them, particularly the better quality jobs.
In this context, trends from the 2000s show that employment grew in urban areas, while it declined
in rural areas, especially among women. Countervailing shifts are also evident in the sectoral trends:
the share of agricultural employment has declined to 48.5 per cent in 2011‐12, the first time it had
dropped below 50 per cent. At the same time, the share of workers grew fastest in construction, which
rose from just 4.3 per cent in 1999‐00 to 10.6 per cent in 2011‐12. The share of workers in
manufacturing, which is addressed in more detail below, increased only marginally from 11.7 per cent
in 1999‐00 to 12.6 per cent in 2011‐12. A third trend that is misleading because of different underlying
trends is the apparent persistence in informal employment. Despite this perception, the share of
workers in the unorganized sector has been consistently falling during this period, while the share of
informal workers in the organized sector has risen.
ASARC WORKING PAPER 2017/02
8
These three illustrations reveal how important it is, in the Indian context, to look beyond changes in
aggregate employment, which is simply misleading. The next sections delve deeper into a better
understanding of these critical labour market dimensions.
What does this bode for the future of work? The relationship between growth and employment in the
future will depend on a number of factors such as demographics, sectoral trends and labour force
participation. The impact of demographics on India’s economic growth (the P/N component) will
remain positive for some decades to come: the share of the working‐age population (aged 15 to 64)
will continue to rise until it reaches a maximum of 52.9 per cent in 2040.5
According to ILO projections, the labour force in India will grow by approximately 9 million per year
over the next five years.6 However, it should be noted that the labour force growth will decline over
time, in line with the decline in the population growth rate. In this context, much is said about the
inflow of young people into the labour force. At the same time, if Indian women are working in greater
numbers, an issue explored in greater detail below, the employment‐population ratio would rise (the
E/P component), pushing up economic growth permanently.
Between 2007 and 2013, labour productivity (the Y/E component) grew in India on average by an
unprecedented 7.3 per cent per annum. However, it declined over recent years to 4.8 per cent in
2016.7 Future growth rates of labour productivity will depend on changes in investment, technology
and human capital, which, in turn, will impact the living standards of workers in the coming decades.
3. Low and declining female labour force participation
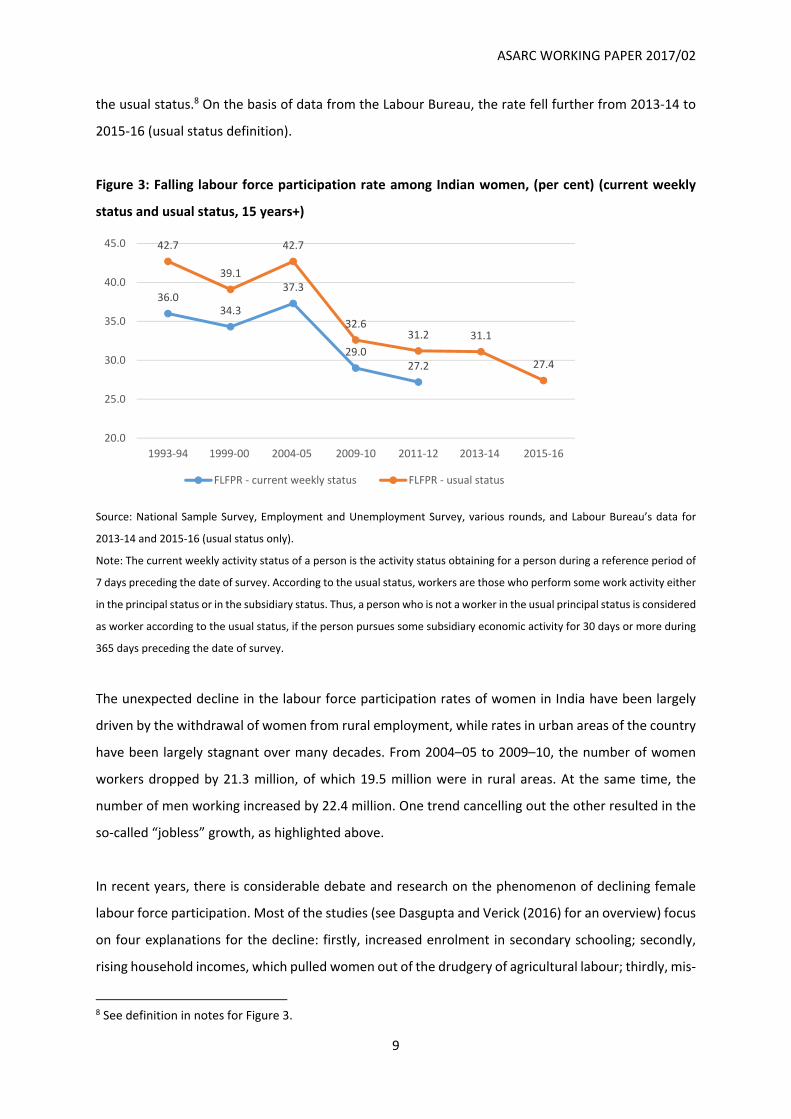
The decline in the female labour force participation rate in India has been one of the more puzzling
trends for policymakers and academics a like (Figure 3). Most surprising was the decline in the 2000s,
which was a period of strong economic growth, as noted above. Based on the current weekly status
definition, the labour force participation rate for women aged 15 and above in India decline from 37.3
per cent in 2004‐05 to 27.2 per cent in 2011‐12. A similar 10‐percentage point decline is evident using
5 Source: UN World Population Prospects, the 2015 Revision, https://esa.un.org/unpd/wpp/ 6 Source: ILO’s ILOSTAT database, www.ilo.org/ilostat 7 Source: The Conference Board Total Economy Database™ (Adjusted version), November 2016, https://www.conference‐board.org/retrievefile.cfm?filename=TED_SummaryTablesCharts_nov2016.pdf&type=subsite
ASARC WORKING PAPER 2017/02
9
the usual status.8 On the basis of data from the Labour Bureau, the rate fell further from 2013‐14 to
2015‐16 (usual status definition).
Figure 3: Falling labour force participation rate among Indian women, (per cent) (current weekly
status and usual status, 15 years+)
Source: National Sample Survey, Employment and Unemployment Survey, various rounds, and Labour Bureau’s data for
2013‐14 and 2015‐16 (usual status only).
Note: The current weekly activity status of a person is the activity status obtaining for a person during a reference period of
7 days preceding the date of survey. According to the usual status, workers are those who perform some work activity either
in the principal status or in the subsidiary status. Thus, a person who is not a worker in the usual principal status is considered
as worker according to the usual status, if the person pursues some subsidiary economic activity for 30 days or more during
365 days preceding the date of survey.
The unexpected decline in the labour force participation rates of women in India have been largely
driven by the withdrawal of women from rural employment, while rates in urban areas of the country
have been largely stagnant over many decades. From 2004–05 to 2009–10, the number of women
workers dropped by 21.3 million, of which 19.5 million were in rural areas. At the same time, the
number of men working increased by 22.4 million. One trend cancelling out the other resulted in the
so‐called “jobless” growth, as highlighted above.
In recent years, there is considerable debate and research on the phenomenon of declining female
labour force participation. Most of the studies (see Dasgupta and Verick (2016) for an overview) focus
on four explanations for the decline: firstly, increased enrolment in secondary schooling; secondly,
rising household incomes, which pulled women out of the drudgery of agricultural labour; thirdly, mis‐
8 See definition in notes for Figure 3.
36.034.3
37.3
29.027.2
42.7
39.1
42.7
32.631.2 31.1
27.4
20.0
25.0
30.0
35.0
40.0
45.0
1993‐94 1999‐00 2004‐05 2009‐10 2011‐12 2013‐14 2015‐16
FLFPR ‐ current weekly status FLFPR ‐ usual status
ASARC WORKING PAPER 2017/02
10
measurement of women’s participation in the labour force; and finally, the lack of employment
opportunities for women in the non‐farm sector. The last dimension receives the most emphasis in
Dasgupta and Verick (2016) and other recent studies such as Chatterjee et al. (2015). Based on primary
surveys, there is also some preliminary evidence that the mechanization of agriculture has contributed
to the decline in demand for agricultural labour.
In terms of educational enrolment, there are two effects: firstly, higher educational attainment will
automatically translate to a smaller labour force (since education is classified as out‐of‐the‐labour
force); and secondly, the level of education (and skills) is both a key driver of labour force participation
for women who have exited full‐time education and a determinant of the quality of employment
women will be able to access. In the case of the first effect, increased enrolment in education meant
that more young women were staying out of the labour force. From 2005 to 2013, the gross enrolment
ratio in secondary school in India increased from 48.7 to 69.2 per cent for girls.9 The ratio increased at
a slower rate for boys, from 59.2 to 68.6 per cent. Consequently, the ratio for girls now exceeds that
for boys. The gross enrolment ratio in tertiary education for women has grown strongly from just 8.8
per cent in 2005 to 23.1 per cent in 2013. During the same period, the gross tertiary enrolment ratio
for men rose from 12.5 to 24.6 per cent. However, the increase in educational enrolment rates does
not explain why the labour force participation rate of prime‐age women also fell during the 2000s.
Another argument is that women’s work is underreported: women are engaged in certain activities
but these are not correctly captured as being economically active. However, Kapsos et al. (2014) and
other studies have shown that this explanation cannot explain the bulk of the fall in women’s
participation in the Indian context. Mis‐measurement is more likely to take place in the context of
work in the household; that is, whether a women is classified as being primarily engaged in domestic
duties (NSS codes 92 or 93) or as self‐employed, including unpaid family labour. Thus, underreporting
is likely to happen in the context of home‐based work, but not because women are “hidden” in wage
and salaried employment outside the home in offices and factories.
The third driver of falling participation in India considered in the literature is rising household incomes.
The hypothesis here is that, since spousal income has increased (e.g. as a result of the construction
boom), poor women, particularly those in rural areas, have withdrawn from the drudgery of
9 Source: UNESCO Institute of Statistics (UIS) country profiles, http://www.uis.unesco.org/DataCentre/Pages/country‐profile.aspx?regioncode=40535&code=IND
ASARC WORKING PAPER 2017/02
11
agricultural labour and menial jobs. Evidence from the NSS survey rounds does reveal that the
participation rates of women in poor, rural households have decreased the fastest during the 2000s.
Clearly, there a many forces at play in the Indian context, especially in rural areas. These forces interact
to determine final labour market outcomes. A crucial dimension is the demand‐side of the labour
market: if jobs are not being created in locations and sectors, which women can access, increased
employability and changed social norms will not impact labour market outcomes for women.
Dasgupta and Verick (2016), Chatterjee et al. (2015) and others highlight this aspect as a critical
dimension.
A related issue to job availability is whether the decision of women to be engaged in domestic duties
is entirely voluntary. The data from the National Sample Survey tells us that in 2011‐12, 34 per cent
of women engaged in domestic duties in rural areas and about 28 per cent in urban areas reported
their willingness to accept work if the work was made available at their household premises. Tailoring
was the most preferred work in both rural and urban areas. Among the women who were willing to
accept work at their household premises, about 95 per cent in both rural and urban areas preferred
work on a regular basis. About 74 per cent in rural areas and about 70 per cent in urban areas preferred
“part‐time” work on a regular basis, while 21 per cent in rural areas and 25 per cent in urban areas
wanted regular “full‐time” work. Part‐time work in India is relatively uncommon and not readily
available for women in both urban and rural areas (Sudarshan, 2014).
Recent trends in the mechanization of agriculture and its impact on women’s employment is far less
researched. Mechanization has taken place rapidly in India since the start of the Green Revolution,
though its pace has varied across the country. The agricultural sector in India has a higher density of
four‐wheel tractors than other similar countries; as a result, India is also one of the largest
manufacturers of tractors in the world (Sarkar, 2013). The sale of tractors in the domestic market
increased from 2003‐4 to 2009‐10 at a compound annual rate of growth of 10.5 per cent.10 The
challenge remains to link this growth in mechanization and commercialization of agriculture (not only
of tractors, but also harvesters and the use of chemical pesticides and herbicides) and its impact on
women’s employment in agriculture. This remains an area for further research.
10 Annual Report, Department of Agriculture and Cooperation, Ministry of Agriculture, Government of India, various years.
ASARC WORKING PAPER 2017/02
12
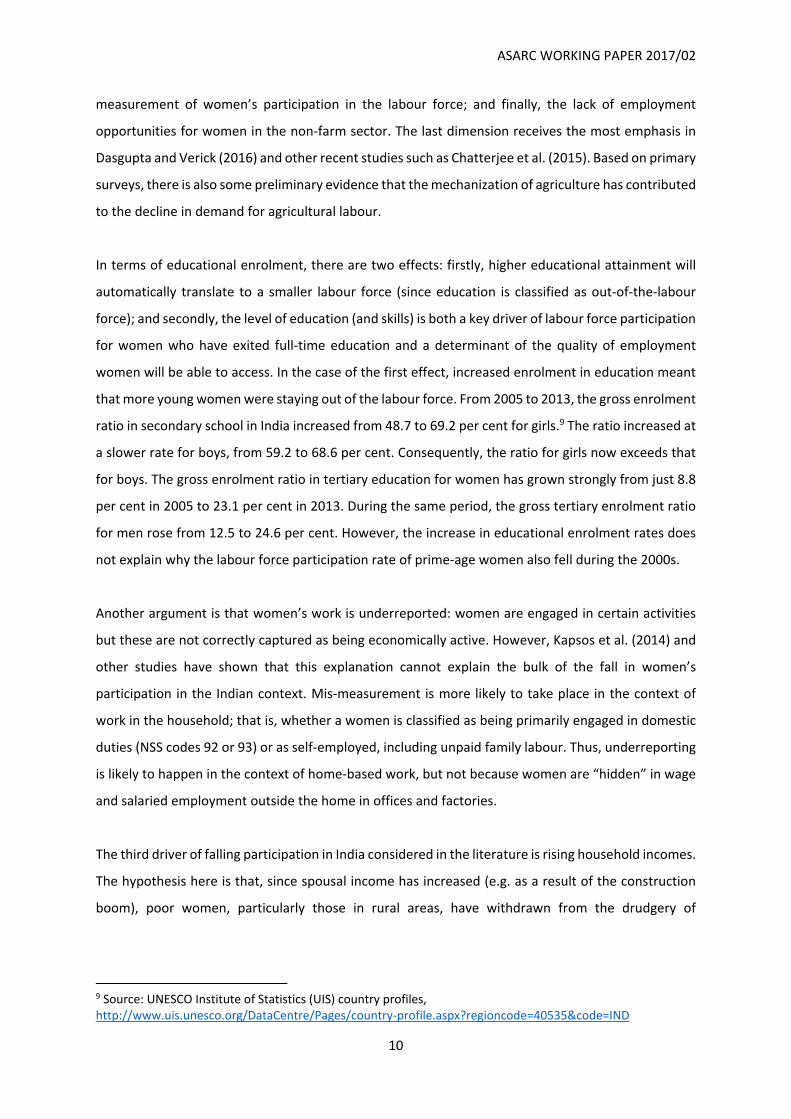
Looking across the region shows how puzzling the trend in female labour force participation in India
appears compared to other countries (Figure 4). Apart from Nepal and the Maldives, Bangladesh now
has the highest rate in the region (Dasgupta and Verick, 2016). The economy of Bangladesh has
witnessed an acceleration of economic growth since the early 1990s, with the average annual GDP
growth exceeding 6 per cent since 2004. The incidence of absolute poverty declined from 59 per cent
in 1991–92 to 31.5 per cent in 2010 (Rahman and Islam, 2013). From 1996 to 2010, female
employment in Bangladesh expanded strongly, which has been driven by rapid growth of the ready‐
made garment sector (the majority of workers are women) and increased participation in poultry and
livestock and a variety of rural non‐farm activities, mainly on account of the spread of microcredit.
The performance on the employment front has been less impressive in the sense that large
proportions of the employed labour force remain in vulnerable employment, and are still found in
sectors and activities which are characterized by low productivity and returns (Rahman et al., 2011).
In Bangladesh, women’s informal employment as a percentage of their non‐agricultural employment
is as high as 91.3 per cent.
Figure 4: Trends in female labour force participation across South Asia, 1999‐00 to 2013‐14
Source: National labour force surveys; author’s calculations.
Notes: Age group: Bangladesh, India – 15+; Pakistan – 15+, for 10+ since 2012‐13; Sri Lanka – 10+, 15+ since 2005‐06,
excluding North and Eastern provinces.
Even more puzzling than India is Sri Lanka: labour force participation rates of women have remained
relatively stagnant over a long period stand at around 35 per cent, in contrast to the male participation
rate of 75 per cent (Gunatilaka, 2013). These low rates are surprising given the level of human
development, which is the highest in the region, and better rates of economic growth in recent years.
0
5
10
15
20
25
30
35
40
45
Bangladesh India Pakistan Sri Lanka
ASARC WORKING PAPER 2017/02
13
However, finding employment is difficult even for those women who want to work because job
opportunities for women are scarce and are limited to only a few sectors, whereas males have a wider
range to choose from. Women are over‐represented in agriculture and export manufacturing
(Gunatilaka, 2013). Rapidly growing sectors such as construction, trade and transport are largely male
dominated. Social attitudes and issues of personal safety, transport and housing appear to be
constraining women from taking up certain types of jobs. Secondly, large gender wage gaps act as a
disincentive for women to participate.
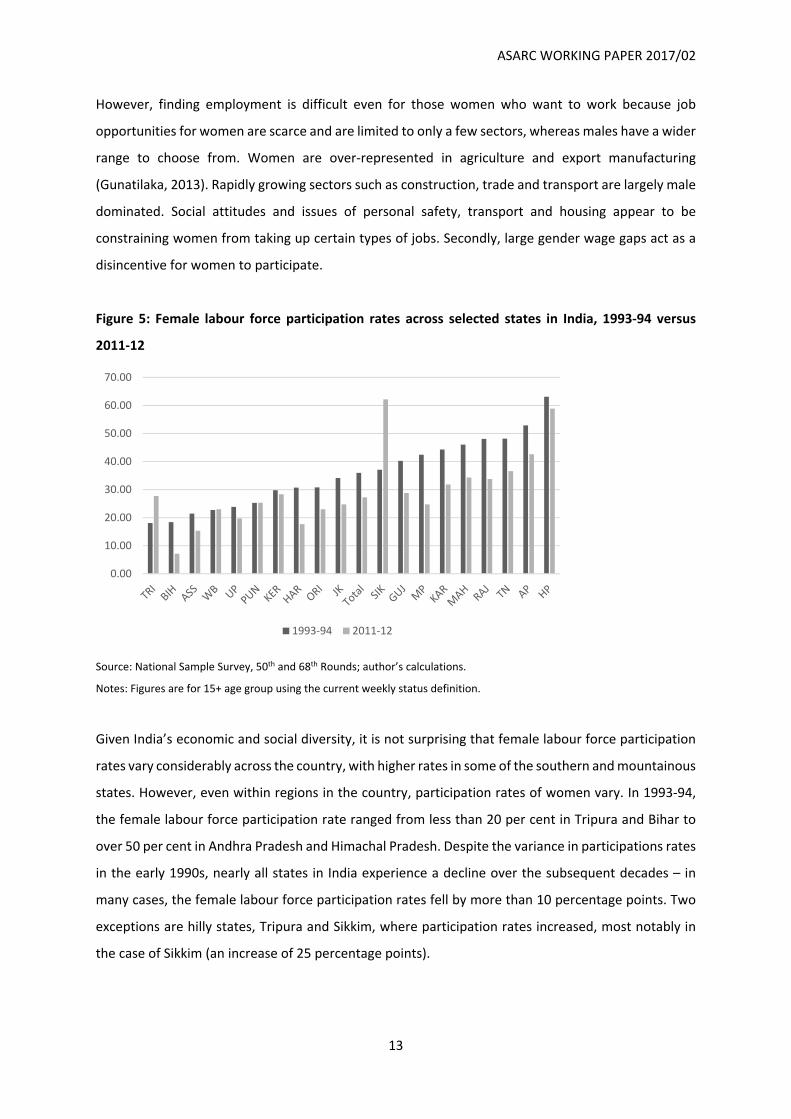
Figure 5: Female labour force participation rates across selected states in India, 1993‐94 versus
2011‐12
Source: National Sample Survey, 50th and 68th Rounds; author’s calculations.
Notes: Figures are for 15+ age group using the current weekly status definition.
Given India’s economic and social diversity, it is not surprising that female labour force participation
rates vary considerably across the country, with higher rates in some of the southern and mountainous
states. However, even within regions in the country, participation rates of women vary. In 1993‐94,
the female labour force participation rate ranged from less than 20 per cent in Tripura and Bihar to
over 50 per cent in Andhra Pradesh and Himachal Pradesh. Despite the variance in participations rates
in the early 1990s, nearly all states in India experience a decline over the subsequent decades – in
many cases, the female labour force participation rates fell by more than 10 percentage points. Two
exceptions are hilly states, Tripura and Sikkim, where participation rates increased, most notably in
the case of Sikkim (an increase of 25 percentage points).
0.00
10.00
20.00
30.00
40.00
50.00
60.00
70.00
1993‐94 2011‐12
ASARC WORKING PAPER 2017/02
14
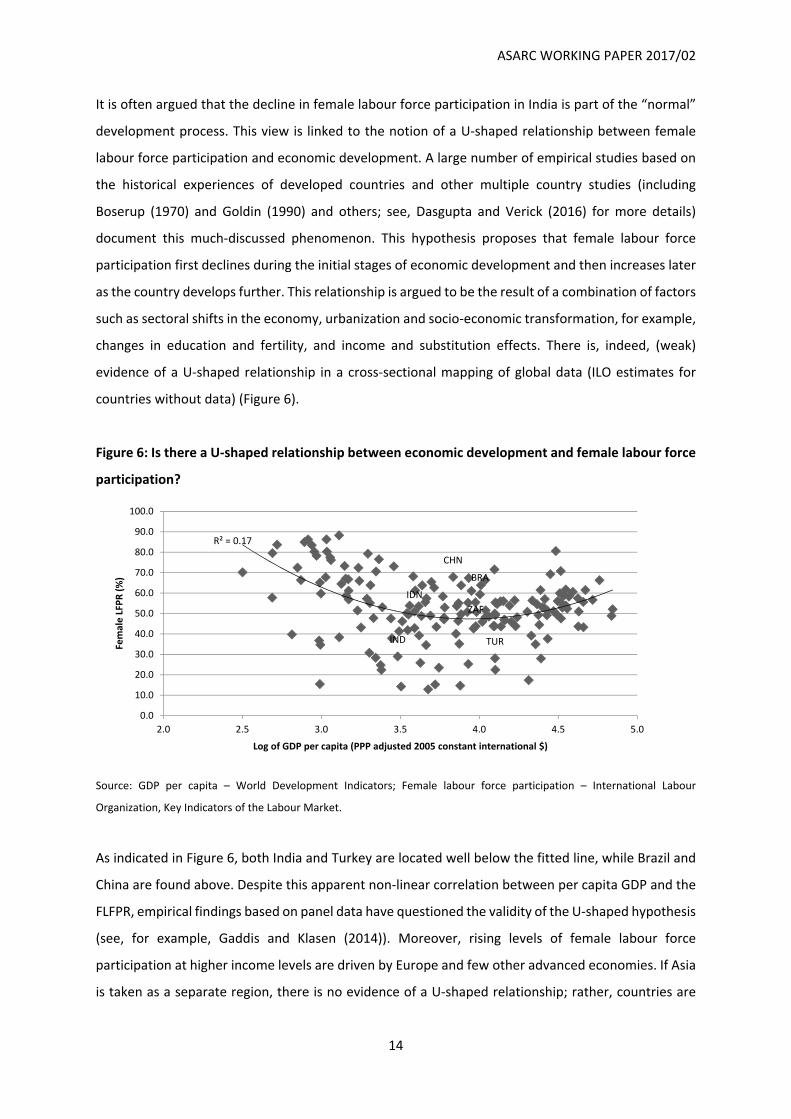
It is often argued that the decline in female labour force participation in India is part of the “normal”
development process. This view is linked to the notion of a U‐shaped relationship between female
labour force participation and economic development. A large number of empirical studies based on
the historical experiences of developed countries and other multiple country studies (including
Boserup (1970) and Goldin (1990) and others; see, Dasgupta and Verick (2016) for more details)
document this much‐discussed phenomenon. This hypothesis proposes that female labour force
participation first declines during the initial stages of economic development and then increases later
as the country develops further. This relationship is argued to be the result of a combination of factors
such as sectoral shifts in the economy, urbanization and socio‐economic transformation, for example,
changes in education and fertility, and income and substitution effects. There is, indeed, (weak)
evidence of a U‐shaped relationship in a cross‐sectional mapping of global data (ILO estimates for
countries without data) (Figure 6).
Figure 6: Is there a U‐shaped relationship between economic development and female labour force
participation?
Source: GDP per capita – World Development Indicators; Female labour force participation – International Labour
Organization, Key Indicators of the Labour Market.
As indicated in Figure 6, both India and Turkey are located well below the fitted line, while Brazil and
China are found above. Despite this apparent non‐linear correlation between per capita GDP and the
FLFPR, empirical findings based on panel data have questioned the validity of the U‐shaped hypothesis
(see, for example, Gaddis and Klasen (2014)). Moreover, rising levels of female labour force
participation at higher income levels are driven by Europe and few other advanced economies. If Asia
is taken as a separate region, there is no evidence of a U‐shaped relationship; rather, countries are
BRA
CHN
IND
IDN
ZAF
TUR
R² = 0.17
0.0
10.0
20.0
30.0
40.0
50.0
60.0
70.0
80.0
90.0
100.0
2.0 2.5 3.0 3.5 4.0 4.5 5.0
Female LFPR (%)
Log of GDP per capita (PPP adjusted 2005 constant international $)
ASARC WORKING PAPER 2017/02
15
most likely to coverage at a level, which still represents a considerable gender gap even at the highest
income levels (such as witnessed in Korea and Japan). As argued in Dasgupta and Verick (2016), a U‐
shaped relationship is not borne out by the data and should not be assumed as a standard process of
development.
What are the likely projections for female labour force participation in India? Labour force projections
by the ILO indicate that the female labour force will grow by just 35.5 million from 2016 to 2030,
compared to an increase of 86.6 million for men over the same period.11 As a results of this trend, the
female labour force participation rate is projected to rise from 26.9 per cent in 2016 (estimate) to 28.3
per cent in 2030. This reveals that, unless policy causes a structural break in this trend, which leads to
higher female labour participation, overall labour force participation rates and, hence, India’s
economic growth potential, will remain below par.
4. Persistence in informality masks different trends in segments of the labour market
Informality is one of the defining features of the Indian labour market, but it is far from homogenous.
There are different aspects of informality depending on whether you look at the place of work (linked
to the definition of the informal sector) or the nature of employment (which leads you to the broader
definition of informal employment). The discourse on informality in India portrays the labour market
has being segmented by a binary definition of the unorganized sector – an enterprise is unorganized
if it has less than 10 workers (which stems from the definition embedded in the Factories Act, 1948).
However, the labour market is far more complex and segmentation is found along many different
dimensions (Papola, 2013).
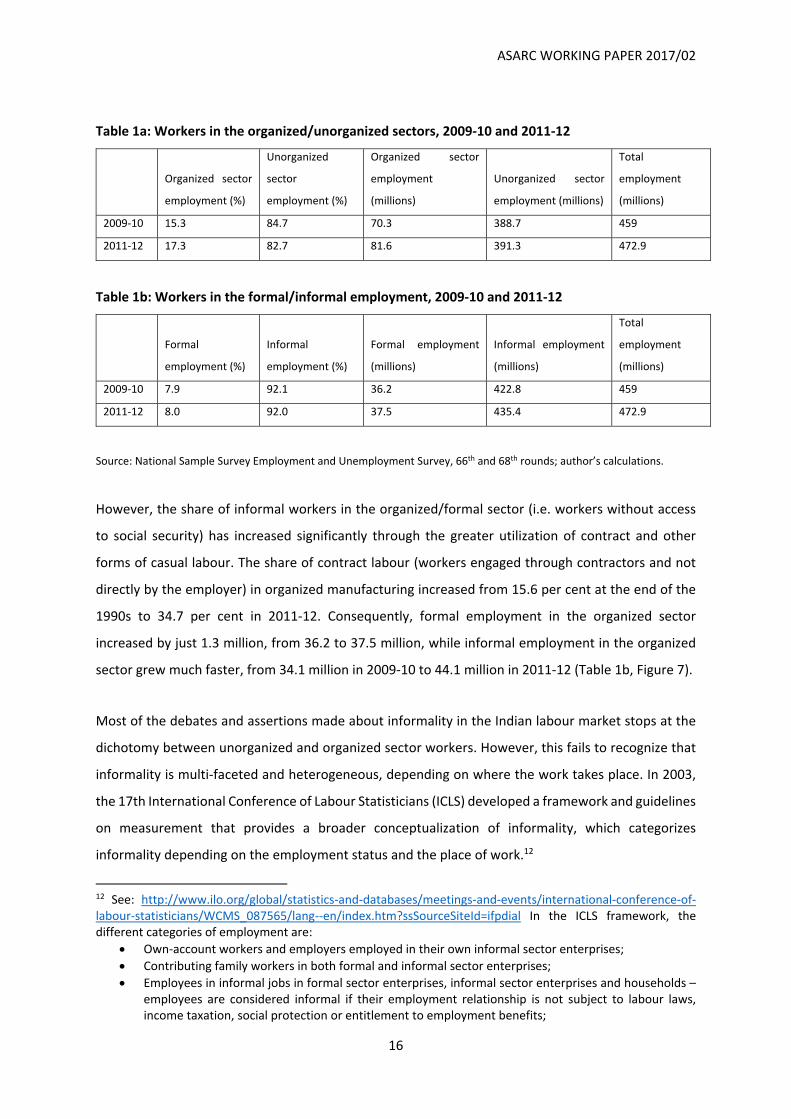
In 2011‐12, informal employment, which includes both workers in the informal sector and informal
workers in the formal sector, represented approximately 92 per cent of all employment. Looking at
differences between the sectoral and employment definitions of informality reveal two diverging
trends behind the aggregate figure of 92 per cent informal employment. Firstly, the share of workers
in the unorganized sector fell from 86.3 per cent in 2004‐05 to 84.7 per cent in 2009‐10, and further
to 82.7 per cent in 2011‐12 (Table 1a). From 2009‐10 to 2011‐12, organized sector employment
increased from 70.3 to 81.6 million.
11 See ILO’s ILOSTAT database, www.ilo.org/ilostat
ASARC WORKING PAPER 2017/02
16
Table 1a: Workers in the organized/unorganized sectors, 2009‐10 and 2011‐12
Organized sector
employment (%)
Unorganized
sector
employment (%)
Organized sector
employment
(millions)
Unorganized sector
employment (millions)
Total
employment
(millions)
2009‐10 15.3 84.7 70.3 388.7 459
2011‐12 17.3 82.7 81.6 391.3 472.9
Table 1b: Workers in the formal/informal employment, 2009‐10 and 2011‐12
Formal
employment (%)
Informal
employment (%)
Formal employment
(millions)
Informal employment
(millions)
Total
employment
(millions)
2009‐10 7.9 92.1 36.2 422.8 459
2011‐12 8.0 92.0 37.5 435.4 472.9
Source: National Sample Survey Employment and Unemployment Survey, 66th and 68th rounds; author’s calculations.
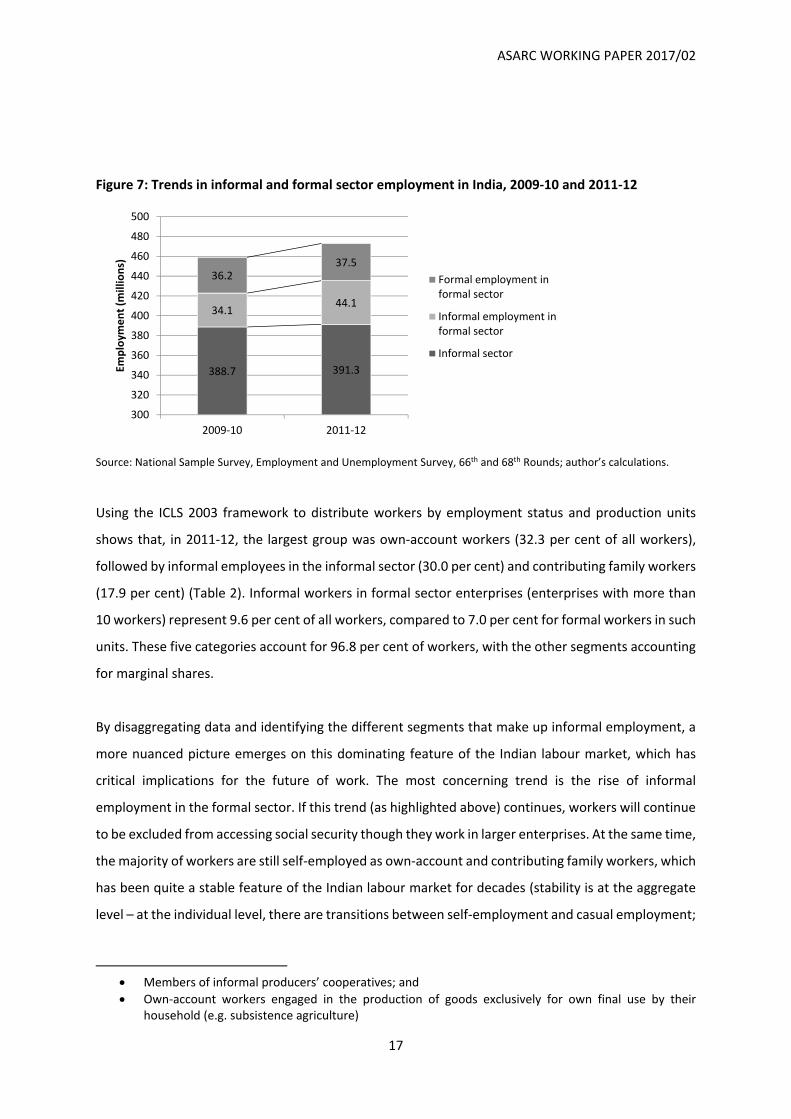
However, the share of informal workers in the organized/formal sector (i.e. workers without access
to social security) has increased significantly through the greater utilization of contract and other
forms of casual labour. The share of contract labour (workers engaged through contractors and not
directly by the employer) in organized manufacturing increased from 15.6 per cent at the end of the
1990s to 34.7 per cent in 2011‐12. Consequently, formal employment in the organized sector
increased by just 1.3 million, from 36.2 to 37.5 million, while informal employment in the organized
sector grew much faster, from 34.1 million in 2009‐10 to 44.1 million in 2011‐12 (Table 1b, Figure 7).
Most of the debates and assertions made about informality in the Indian labour market stops at the
dichotomy between unorganized and organized sector workers. However, this fails to recognize that
informality is multi‐faceted and heterogeneous, depending on where the work takes place. In 2003,
the 17th International Conference of Labour Statisticians (ICLS) developed a framework and guidelines
on measurement that provides a broader conceptualization of informality, which categorizes
informality depending on the employment status and the place of work.12
12 See: http://www.ilo.org/global/statistics‐and‐databases/meetings‐and‐events/international‐conference‐of‐labour‐statisticians/WCMS_087565/lang‐‐en/index.htm?ssSourceSiteId=ifpdial In the ICLS framework, the different categories of employment are:
Own‐account workers and employers employed in their own informal sector enterprises;
Contributing family workers in both formal and informal sector enterprises;
Employees in informal jobs in formal sector enterprises, informal sector enterprises and households – employees are considered informal if their employment relationship is not subject to labour laws, income taxation, social protection or entitlement to employment benefits;
ASARC WORKING PAPER 2017/02
17
Figure 7: Trends in informal and formal sector employment in India, 2009‐10 and 2011‐12
Source: National Sample Survey, Employment and Unemployment Survey, 66th and 68th Rounds; author’s calculations.
Using the ICLS 2003 framework to distribute workers by employment status and production units
shows that, in 2011‐12, the largest group was own‐account workers (32.3 per cent of all workers),
followed by informal employees in the informal sector (30.0 per cent) and contributing family workers
(17.9 per cent) (Table 2). Informal workers in formal sector enterprises (enterprises with more than
10 workers) represent 9.6 per cent of all workers, compared to 7.0 per cent for formal workers in such
units. These five categories account for 96.8 per cent of workers, with the other segments accounting
for marginal shares.
By disaggregating data and identifying the different segments that make up informal employment, a
more nuanced picture emerges on this dominating feature of the Indian labour market, which has
critical implications for the future of work. The most concerning trend is the rise of informal
employment in the formal sector. If this trend (as highlighted above) continues, workers will continue
to be excluded from accessing social security though they work in larger enterprises. At the same time,
the majority of workers are still self‐employed as own‐account and contributing family workers, which
has been quite a stable feature of the Indian labour market for decades (stability is at the aggregate
level – at the individual level, there are transitions between self‐employment and casual employment;
Members of informal producers’ cooperatives; and
Own‐account workers engaged in the production of goods exclusively for own final use by their household (e.g. subsistence agriculture)
388.7 391.3
34.144.1
36.237.5
300
320
340
360
380
400
420
440
460
480
500
2009‐10 2011‐12
Employm
ent (m
illions)
Formal employment informal sector
Informal employment informal sector
Informal sector
ASARC WORKING PAPER 2017/02
18
see, for example, Karan and Selvaraj (2008)). Overall, there is considerable uncertainty in India around
the emergence of more regular forms of wage and salaried employment, particularly jobs that provide
access to social security and other employment benefits.
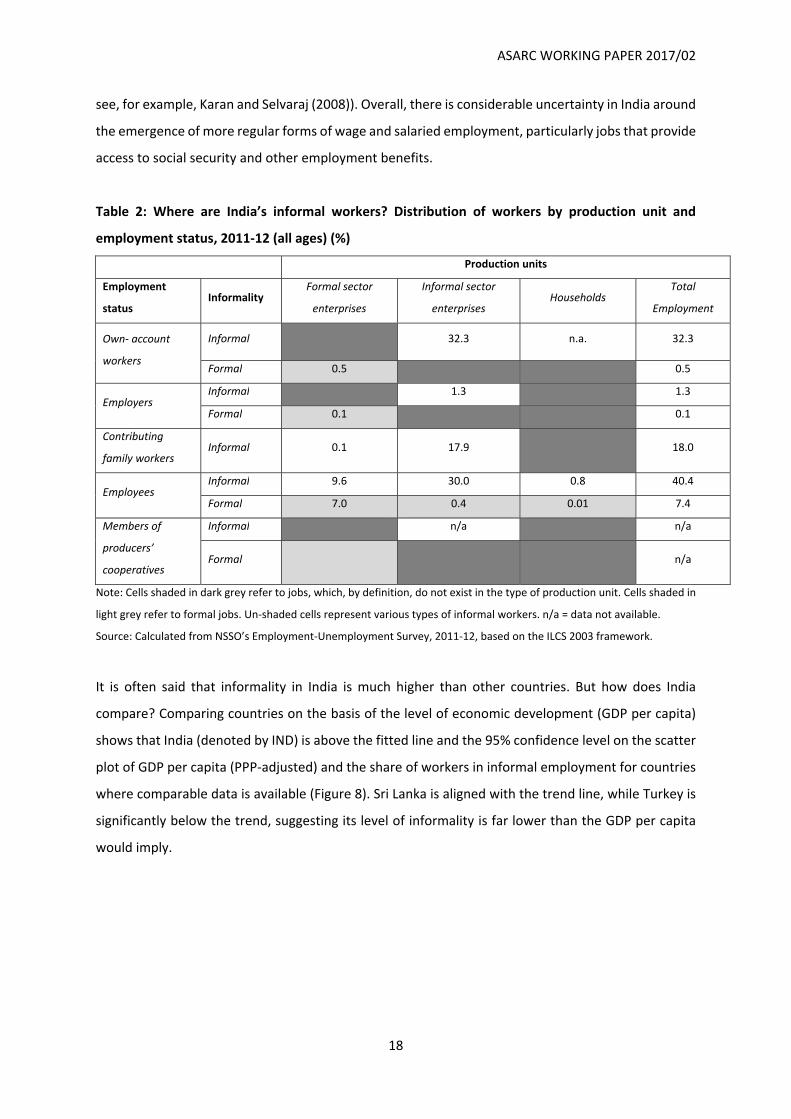
Table 2: Where are India’s informal workers? Distribution of workers by production unit and
employment status, 2011‐12 (all ages) (%)
Production units
Employment
status Informality
Formal sector
enterprises
Informal sector
enterprises Households
Total
Employment
Own‐ account
workers
Informal 32.3 n.a. 32.3
Formal 0.5 0.5
Employers Informal 1.3 1.3
Formal 0.1 0.1
Contributing
family workers Informal 0.1 17.9 18.0
Employees Informal 9.6 30.0 0.8 40.4
Formal 7.0 0.4 0.01 7.4
Members of
producers’
cooperatives
Informal n/a n/a
Formal n/a
Note: Cells shaded in dark grey refer to jobs, which, by definition, do not exist in the type of production unit. Cells shaded in
light grey refer to formal jobs. Un‐shaded cells represent various types of informal workers. n/a = data not available.
Source: Calculated from NSSO’s Employment‐Unemployment Survey, 2011‐12, based on the ILCS 2003 framework.
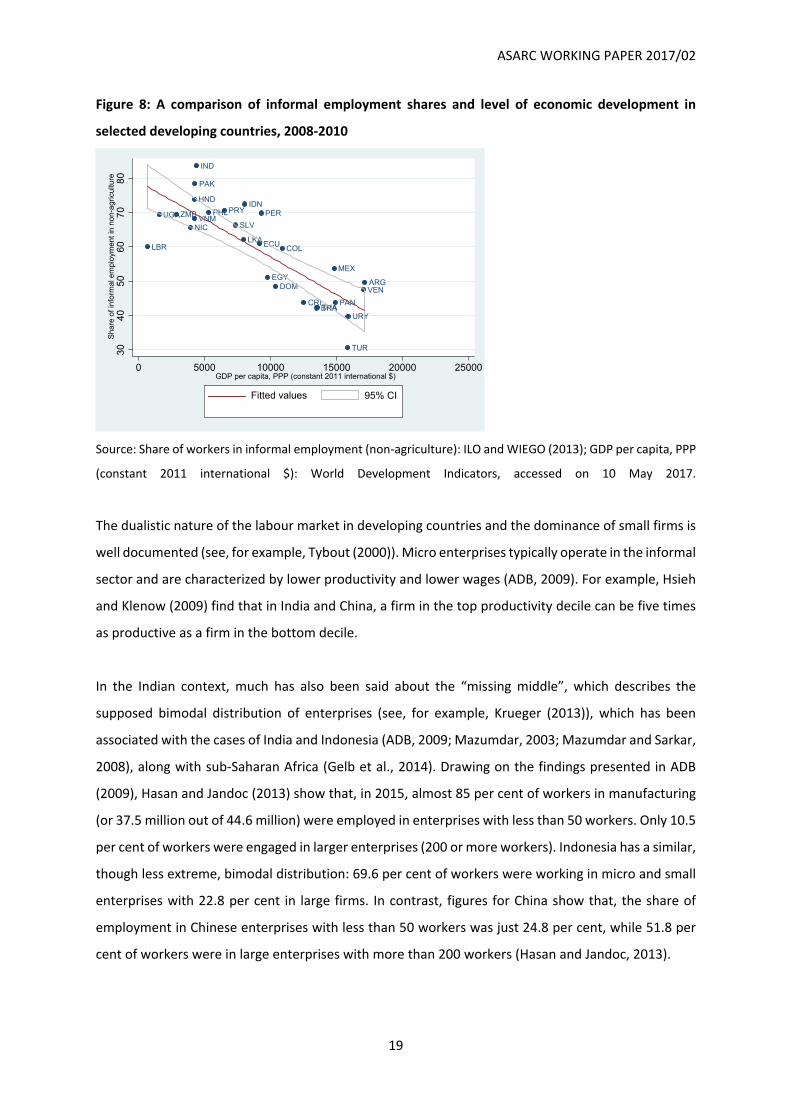
It is often said that informality in India is much higher than other countries. But how does India
compare? Comparing countries on the basis of the level of economic development (GDP per capita)
shows that India (denoted by IND) is above the fitted line and the 95% confidence level on the scatter
plot of GDP per capita (PPP‐adjusted) and the share of workers in informal employment for countries
where comparable data is available (Figure 8). Sri Lanka is aligned with the trend line, while Turkey is
significantly below the trend, suggesting its level of informality is far lower than the GDP per capita
would imply.
ASARC WORKING PAPER 2017/02
19
Figure 8: A comparison of informal employment shares and level of economic development in
selected developing countries, 2008‐2010
Source: Share of workers in informal employment (non‐agriculture): ILO and WIEGO (2013); GDP per capita, PPP
(constant 2011 international $): World Development Indicators, accessed on 10 May 2017.
The dualistic nature of the labour market in developing countries and the dominance of small firms is
well documented (see, for example, Tybout (2000)). Micro enterprises typically operate in the informal
sector and are characterized by lower productivity and lower wages (ADB, 2009). For example, Hsieh
and Klenow (2009) find that in India and China, a firm in the top productivity decile can be five times
as productive as a firm in the bottom decile.
In the Indian context, much has also been said about the “missing middle”, which describes the
supposed bimodal distribution of enterprises (see, for example, Krueger (2013)), which has been
associated with the cases of India and Indonesia (ADB, 2009; Mazumdar, 2003; Mazumdar and Sarkar,
2008), along with sub‐Saharan Africa (Gelb et al., 2014). Drawing on the findings presented in ADB
(2009), Hasan and Jandoc (2013) show that, in 2015, almost 85 per cent of workers in manufacturing
(or 37.5 million out of 44.6 million) were employed in enterprises with less than 50 workers. Only 10.5
per cent of workers were engaged in larger enterprises (200 or more workers). Indonesia has a similar,
though less extreme, bimodal distribution: 69.6 per cent of workers were working in micro and small
enterprises with 22.8 per cent in large firms. In contrast, figures for China show that, the share of
employment in Chinese enterprises with less than 50 workers was just 24.8 per cent, while 51.8 per
cent of workers were in large enterprises with more than 200 workers (Hasan and Jandoc, 2013).
PHLZMB
ARG
BRACRI
DOM
ECU
EGY
SLV
HNDIDN
MEX
NIC
PAN
PRY PER
LKA
TUR
URY
VEN
VNM
COL
IND
LBR
PAK
THA
UGA
3040
5060
7080
Sha
re o
f inf
orm
al e
mpl
oym
ent i
n no
n-ag
ricul
ture
0 5000 10000 15000 20000 25000GDP per capita, PPP (constant 2011 international $)
95% CIFitted values
ASARC WORKING PAPER 2017/02
20
Many authors have sought to link this phenomenon to the labour laws, which are discussed below in
more detail. However, is there really a missing middle? According to Hsieh and Olken (2014), there is
little evidence of a missing middle in India, Indonesia or Mexico once more detailed data is used. These
markets are, indeed, dominated by small enterprises but both middle and large enterprise are missing.
Once more disaggregated bins are used in a histogram, there is no longer evidence of any
discontinuities in the distribution of firms in these countries, which could be linked to the thresholds
imposed by labour laws.
One key dimension of informalization in India today is the growing prevalence of contract labour,
which, as noted above, has grown significantly in recent years. According to the Annual Survey of
Industries, the share of contract workers in organized manufacturing in India has risen from 20.4 per
cent in 2000‐01 to 34.58 per cent in 2011‐12, which was a period of rapid economic growth. However,
the use of contract labour varies considerably across different segments: in 2011‐12, the share of
contract workers ranged from 13.4 per cent in spinning, weaving and finishing of textiles to 65.5 per
cent in tobacco products (Hoda and Rai, 2015). Overall, contract labour is more prevalent in capital‐
intensive industries. The main challenge, particularly from an industrial relations perspective, is the
disparity in wages between direct employment and contract workers. In 2011‐12, contract workers
were earning a wage that represented just 70.8 per cent of that earned by directly employment
workers (Hoda and Rai, 2015). A common thesis is that the use of contract labour is linked to the
regulations: employers rely on such third‐party workers to avoid the impositions of labour laws.
Due to the differences in productivity, there is an imbalance between output and employment in the
Indian economy. In manufacturing: the organized sector accounts for over 80 per cent of
manufacturing output, while the unorganized sector engages 80 per cent of employment and
represents 99 per cent of all establishments (Ghani et al., 2015). However, there is some good news:
Goldar and Sadhukhan (2015) find that, from 2004‐05 to 2011‐12, employment in organized
manufacturing grew by 6.97 per cent per annum, a notable acceleration in comparison to the previous
period. In contrast, employment in unorganized manufacturing increased by just 0.13 per cent. These
authors argue unorganized manufacturing is shifting away from self‐employment to establishments.
Overall, informality represents one of the key challenges when considering the future of work. In
particular, a critical question is whether the manufacturing sector in India can take on the role of job
generator as witnessed in other parts of Asia in the second half of the 20th Century and in advanced
economies during the Industrial Revolution. But more jobs will not make a dent in the overwhelming
ASARC WORKING PAPER 2017/02
21
informal nature of employment in India if these jobs do not provide an access to social security and
employment benefits such as paid leave.
5. Can Indian manufacturing be the engine of economic growth and jobs?
The classic development path has been characterized by the movement of resources and workers out
of agriculture into manufacturing (i.e. the Lewis or Kuznet’s model). However, this process of
development hasn’t been witnessed uniformly across countries. In fact, many economies, such as
those in South Asia, have not replicated the same pattern of industrialization as witnessed in East Asia
in the second half the 20th century. Industrialization in India and elsewhere in the region has failed to
propel output and employment in the manufacturing sector to the heights witnessed earlier in more
advanced economies. Moreover, the peak in the share of manufacturing in either output or
employment is being reached earlier and earlier over time. Many low and middle‐income countries,
including India, are service‐led, both from an economic growth and jobs perspective. This experience
has been denoted “premature deindustrialization” (Dasgupta and Singh, 2006; Rodrik, 2015),
reflecting that a decline in the share of manufacturing in output and employment should only take
place once an economy has moved into high‐income status.
In this context, much has been said about India’s lack lustre industrialization process (see Verick (2016)
for a more in‐depth analysis). In 1950, the share of manufacturing in gross value added (GVA) was just
10 per cent in India, while the share was only slightly higher in China at 14 per cent (Szirmai, 2012). By
1980, the share of GVA in manufacturing in China had reached 40 per cent, while in India it was just
17 per cent. Moreover, the share of manufacturing in GDP continued to fall in India in recent years,
from 16.1 per cent in 2007‐08 to 14.9 per cent in 2013‐14. The new GDP series, rebased to 2011‐12
prices, reveals a larger share of manufacturing in gross value added. Provisional estimates for 2016‐
17 indicate a GVA share for manufacturing in value added at 18.1 per cent, compared to 53.7 per cent
for services and 15.2 per cent for agriculture, forestry and fisheries.13
Turning to employment, the manufacturing sector in India represented only 12.6 per cent of total
employment in 2011‐12, which is slightly higher than the longer‐term average evident from earlier
data points. However, it should be noted that, after manufacturing employment declined from 2004‐
05 to 2009‐10, it rose quite substantially, by 9 million from 2009‐10 to 2011‐12 (in net terms).
13 Source: Ministry of Statistics and Programme Implementation, http://www.mospi.gov.in/sites/default/files/press_release/PRESS_NOTE_PE_2016‐17.pdf
ASARC WORKING PAPER 2017/02
22
According to the World Trade Organization (2014), the highest annual growth in exports of textiles
and clothing from 2012 to 2013 were achieved in India (23 per cent). Reflecting, in part, this growth
in exports, employment in textiles and wearing apparel grew by 3.1 million from 2009‐10 to 2011‐12
(out of a total of 9.1 million increase). By 2011‐12, the share of employed women in manufacturing
reached 13.4 per cent, up from 9.3 per cent in 1993‐94. This positive development suggests a boom
in manufacturing employment, especially benefiting women, though this trend would have most likely
been derailed by the economic downturn that followed over 2012 and 2013.14
Employment in manufacturing in China has not been as impressive as imagined (though data
limitations constrain such a conclusion). According to Naudé et al. (2013), the share of workers in this
sector in China stood at 18.5 per cent in 2008. Looking back at the 20th Century, advanced countries
had far greater shares of workers in manufacturing, compared to both China and India. As reported in
Rodrik (2015), the share of workers in Korea peaked at almost 30 per cent in 1989. The share of
workers in manufacturing in the industrialized nations of Europe reached above 30 per cent in the
1960s.
In India, the transition out of agriculture has been dominated by the construction sector, which was
propelled by the urban construction boom that took off in the 2000s. Low‐skilled workers in rural
areas swapped their jobs and livelihoods in agriculture for higher paid employment, but still far from
any notion of decent work, in construction. By 2011‐12, the construction sector accounted for 10.6
per cent of all workers, up from just 3.1 per cent in 1993‐94. Over a decade period, the numbers of
workers in construction rapidly increased by over 26 million, from 17.5 million in 1999‐00 to 44.1
million in 2009‐10. During the same period, the numbers of workers in manufacturing rose by just 6.6
million, from 44.1 million in 1999‐00 to 50.7 million in 2009‐10, while in services the number of
workers increased by 22.1 million (from 94.2 to 116.3 million).
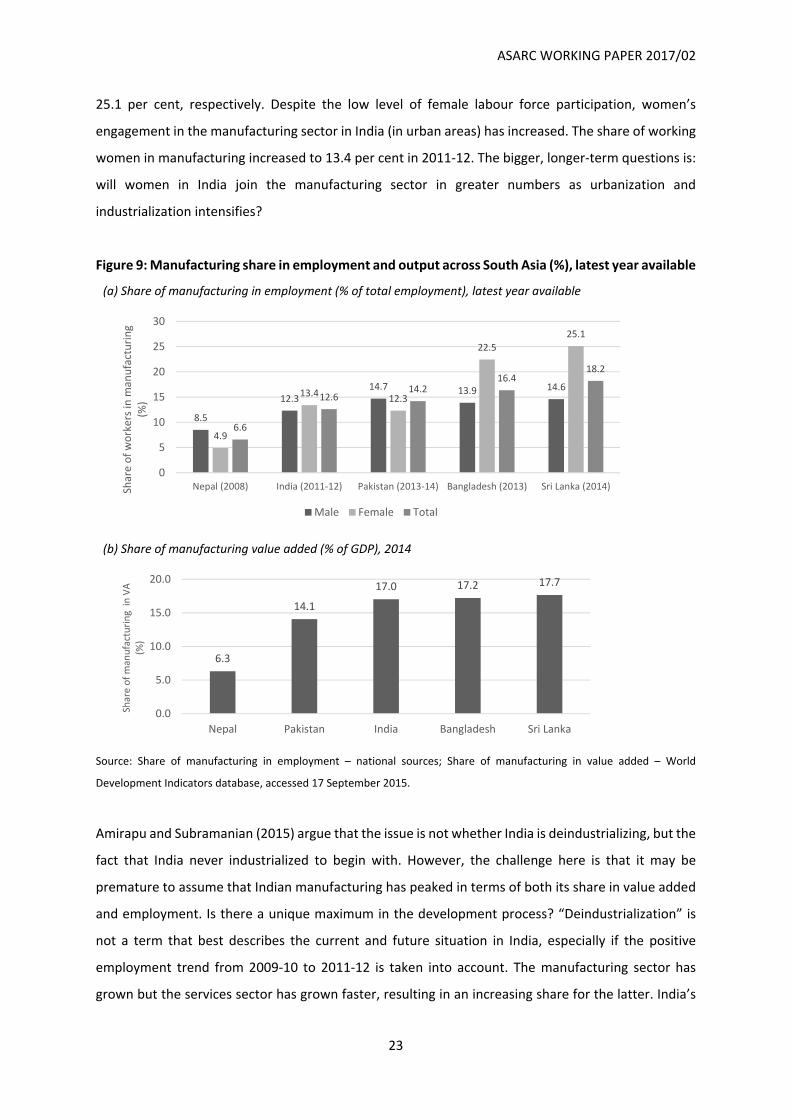
It is striking that employment in manufacturing represents a lower share in India than all other major
South Asian economies apart from the poorest country in the region, Nepal (Figure 9). The share of
workers in manufacturing is the highest in Sri Lanka (18.2 per cent) and Bangladesh (16.4 per cent),
which have had some success in recent years in building a more vibrant manufacturing sector.
Interestingly, women have higher shares than men in Sri Lanka, Bangladesh and India. In the cases of
Bangladesh and Sri Lanka, the manufacturing employment share for women amounted to 22.1 and
14 National Sample Survey data is not available after 2011‐12; Labour Bureau data is available but methodological issues renders a statistical comparison difficult.
ASARC WORKING PAPER 2017/02
23
25.1 per cent, respectively. Despite the low level of female labour force participation, women’s
engagement in the manufacturing sector in India (in urban areas) has increased. The share of working
women in manufacturing increased to 13.4 per cent in 2011‐12. The bigger, longer‐term questions is:
will women in India join the manufacturing sector in greater numbers as urbanization and
industrialization intensifies?
Figure 9: Manufacturing share in employment and output across South Asia (%), latest year available
(a) Share of manufacturing in employment (% of total employment), latest year available
(b) Share of manufacturing value added (% of GDP), 2014
Source: Share of manufacturing in employment – national sources; Share of manufacturing in value added – World
Development Indicators database, accessed 17 September 2015.
Amirapu and Subramanian (2015) argue that the issue is not whether India is deindustrializing, but the
fact that India never industrialized to begin with. However, the challenge here is that it may be
premature to assume that Indian manufacturing has peaked in terms of both its share in value added
and employment. Is there a unique maximum in the development process? “Deindustrialization” is
not a term that best describes the current and future situation in India, especially if the positive
employment trend from 2009‐10 to 2011‐12 is taken into account. The manufacturing sector has
grown but the services sector has grown faster, resulting in an increasing share for the latter. India’s
8.5
12.314.7 13.9 14.6
4.9
13.412.3
22.5
25.1
6.6
12.614.2
16.418.2
0
5
10
15
20
25
30
Nepal (2008) India (2011‐12) Pakistan (2013‐14) Bangladesh (2013) Sri Lanka (2014)Share of workers in m
anufacturing
(%)
Male Female Total
6.3
14.1
17.0 17.2 17.7
0.0
5.0
10.0
15.0
20.0
Nepal Pakistan India Bangladesh Sri Lanka
Share of manufacturing in
VA
(%)
ASARC WORKING PAPER 2017/02
24
services sector represents the largest share of output but a relatively low share of employment. In
general, comparing shares can be misleading: even if both sectors are growing, any differential will
ensure that the shares move in opposing directions. For this reason, growth rates should also be
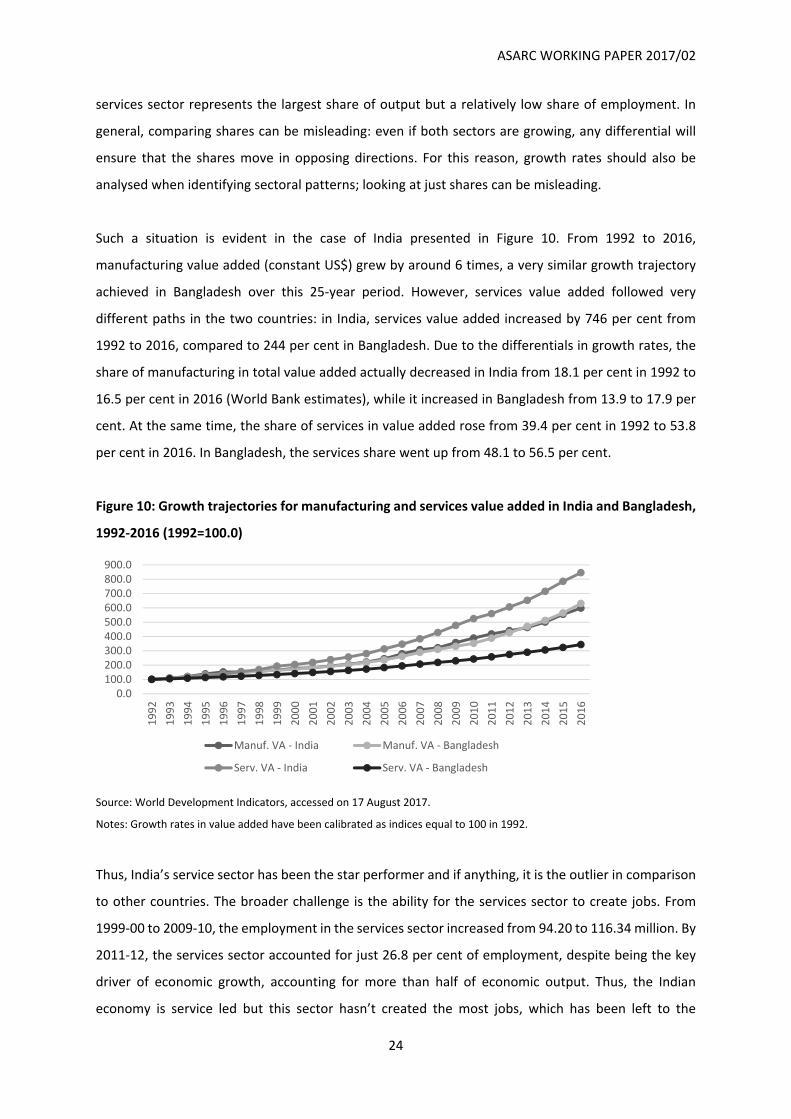
analysed when identifying sectoral patterns; looking at just shares can be misleading.
Such a situation is evident in the case of India presented in Figure 10. From 1992 to 2016,
manufacturing value added (constant US$) grew by around 6 times, a very similar growth trajectory
achieved in Bangladesh over this 25‐year period. However, services value added followed very
different paths in the two countries: in India, services value added increased by 746 per cent from
1992 to 2016, compared to 244 per cent in Bangladesh. Due to the differentials in growth rates, the
share of manufacturing in total value added actually decreased in India from 18.1 per cent in 1992 to
16.5 per cent in 2016 (World Bank estimates), while it increased in Bangladesh from 13.9 to 17.9 per
cent. At the same time, the share of services in value added rose from 39.4 per cent in 1992 to 53.8
per cent in 2016. In Bangladesh, the services share went up from 48.1 to 56.5 per cent.
Figure 10: Growth trajectories for manufacturing and services value added in India and Bangladesh,
1992‐2016 (1992=100.0)
Source: World Development Indicators, accessed on 17 August 2017.
Notes: Growth rates in value added have been calibrated as indices equal to 100 in 1992.
Thus, India’s service sector has been the star performer and if anything, it is the outlier in comparison
to other countries. The broader challenge is the ability for the services sector to create jobs. From
1999‐00 to 2009‐10, the employment in the services sector increased from 94.20 to 116.34 million. By
2011‐12, the services sector accounted for just 26.8 per cent of employment, despite being the key
driver of economic growth, accounting for more than half of economic output. Thus, the Indian
economy is service led but this sector hasn’t created the most jobs, which has been left to the
0.0100.0200.0300.0400.0500.0600.0700.0800.0900.0
1992
1993
1994
1995
1996
1997
1998
1999
2000
2001
2002
2003
2004
2005
2006
2007
2008
2009
2010
2011
2012
2013
2014
2015
2016
Manuf. VA ‐ India Manuf. VA ‐ Bangladesh
Serv. VA ‐ India Serv. VA ‐ Bangladesh
ASARC WORKING PAPER 2017/02
25
construction sector, while manufacturing in India has been relatively capital (and skill) intensive
(Hasan et al. (2013), Kochhar et al. (2006), Sen and Das (2014)). As computerization and automation
increasingly impacts production choices, the labour intensity of manufacturing in middle‐income
countries, such as India, is likely to further decrease, along with an increased demand for semi and
skilled workers.
India’s labour laws have often been blamed for the lack lustre performance of the manufacturing
sector. Labour laws in India are notoriously complex: the 44 central laws and myriad of state laws date
back, in some cases, to the colonial period. The approach was, therefore, highly influenced by a statist
model of regulating the labour market and industrial relations. Indian labour law maintained this
command‐and‐control approach to regulation rather than promoting collective bargaining and
agreements without excessive state intervention (Deakin et al., 2014). The laws were highly
prescriptive, outlining specific duties and provisions. Well‐known examples include the provisions of
the Factories Act, 1948, which require enterprises to have a spittoon and have a pail of sand in case
of a fire. However, it is the Industrial Disputes Act 1947 that has received most of the attention and
the blame. In particular, the provisions of the IDA that require an enterprise with more than 100
workers to seek approval for the dismissal of even one worker (Chapter Vb) is deemed as the main
hindrance to job creation.
The threshold for the applicability of this provision of the IDA has been viewed as the main factor
behind India’s “missing middle”. That is, enterprises are reluctant to grow beyond the threshold of 99
workers or they resort to other strategies, such as splitting up the enterprise and utilizing contract
labour, to avoid the impact of the requirement to seek permission. In the case of Indian labour law,
thresholds determine coverage and applicability of regulations. Such thresholds are also evident in
the region (e.g. Termination of Employed Workers Act in Sri Lanka) and in high‐income countries (e.g.
dismissals laws in Germany and Italy).
Most empirical studies have utilized the amendments to the IDA to identify the impact of the law on
employment and other outcomes. The IDA was amended in 1976 so that layoff, retrenchment and
closure was deemed illegal except with the previous permission of the appropriate government for all
firms with more than 300 workers. This coverage was subsequently extended in 1982 to all firms with
more than 100 employees. Most of the empirical literature investigating the impact of this dismissal
legislation has used these amendments and state variation in the application of the law. Given the
concurrent status of labour laws, Indian states and union territories have the constitutional right to
ASARC WORKING PAPER 2017/02
26
amend laws or enact their own so long as that they do not contradict laws enacted by the central
government (known as “repugnancy” in the language of the Constitution of India) and receive the
assent of the President of India as required by the Constitution.
Empirical studies have utilized these amendments to identify the impact of the IDA. Fallon and Lucas
(1993) find that the 1976 amendment to the IDA, which increased the procedures for layoffs and
retrenchments, resulted in a decline in formal employment in manufacturing. Besley and Burgess
(2004), which coded states on the basis of changes in the legislation, identified states as either “pro‐
employer” or “pro‐worker”. Using this state variation, the authors estimate a negative impact of the
IDA on output and employment, especially in the organized manufacturing sector. But the coding of
states was criticized by Bhattacharjea (2006). However, after correcting for the coding errors pointed
out by Bhattacharjea (2006), Ahsan and Pages (2009) still identify the same adverse effects of the
legislation on organized sector employment and output, particularly in labour‐intensive industries
(e.g. textiles).
Dougherty et al. (2013) takes a much more comprehensive approach based on establishment‐level
data and a country‐specific labour regulation index constructed by the OECD, which covers
amendments to seven areas of the employment protection legislation (including not only the ID Act
but also the Factories Act, Shops Act, Contract Labour Act, etc.). This study finds that plants in labour‐
intensive industries in states that have reformed their laws to be more pro‐employer have total factor
productivity residuals that were over 25 per cent higher than that found for establishments in similar
industries in states, which have carried out fewer reforms to the legislation.
Linking regulations to the distribution of enterprises, Hasan and Jandoc (2013) find that, in states with
more flexible regulations, the share of employment in larger manufacturing enterprises is greater.
Taking advantage of establishment‐level panel data and classification of states on the basis of labour
law reforms, Ramaswamy (2015) finds that the intensity of contract workers is higher in enterprises
with between 50 and 99 workers, implying that these workers are used to avoid the application of
laws. Moreover, the contract worker‐intensity is higher in labour‐intensive industries in states
classified as inflexible. In contrast to these studies, Ghani et al. (2015) do not find any evidence of a
correlation between labour market regulations and the growth of small informal firms in the tradable
manufacturing sector based on more than two decades of data from 1989 to 2010.
ASARC WORKING PAPER 2017/02
27
An overarching challenge in identifying the impact of labour laws is causality, i.e. is it possible to
attribute any changes in labour market outcomes to the provisions of the laws themselves and not to
the myriad of other regulatory and economic factors that impact decision‐making in the enterprise?
A further issue is whether the amendments to laws are, in fact, endogenous to the situation in the
labour market in itself. In this regard, there is evidence that Indian labour laws have been responsive
to the broader economic situation rather than a determinant of them (Deakin and Sarkar, 2011).
It is usually said that India has some of the strictest labour laws of any country. But how do Indian
labour laws compare to other countries? The OECD’s methodology to rank countries on the basis of
their respective employment protection legislation compares differences in provisions relating to
dismissal (notification, severance pay, etc.) along with regulation of regular and temporary
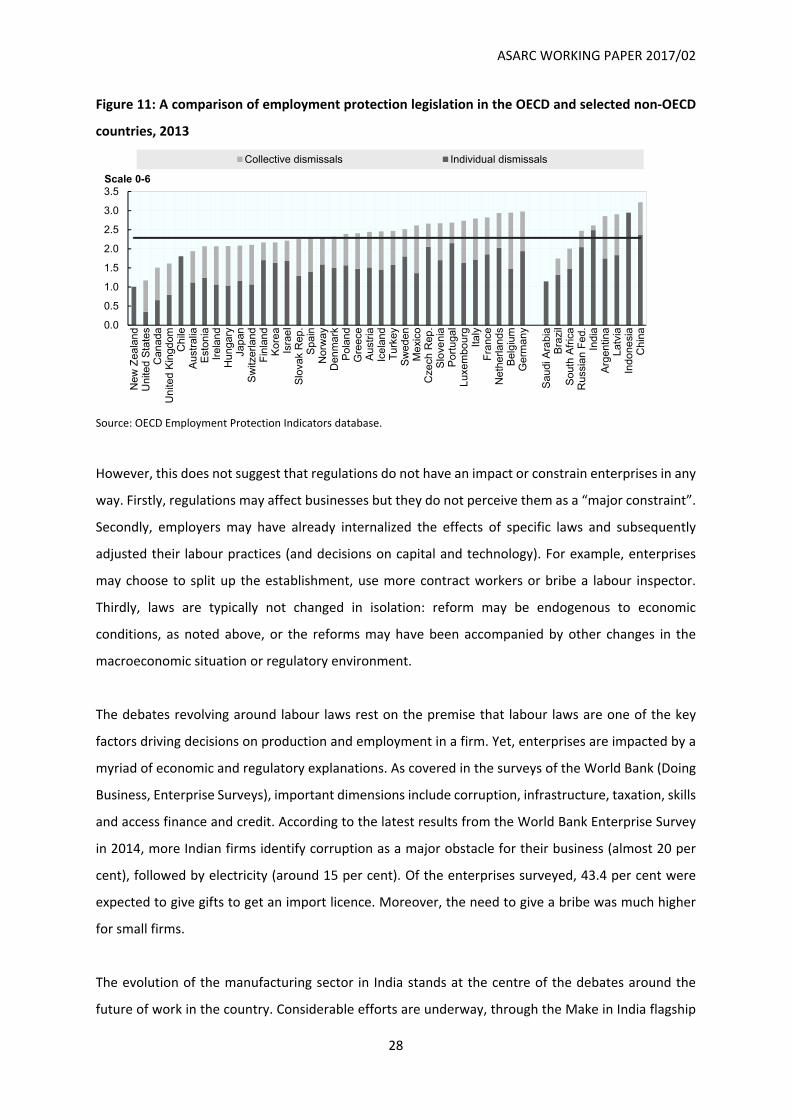
employment. As illustrated in Figure 11, there is considerable variation in the strictness of EPL across
OECD countries and emerging economies. In terms of individual and collective dismissal procedures,
the most lightly regulated are Anglo‐Saxon countries, while China and Indonesia are ranked above
India. In India’s case, the ranking is driven by the notification requirements for individual dismissals as
required by the IDA for enterprises with more than 100 workers (apart from those states with a
different threshold such as Rajasthan, which raised it to 300 workers). Like Indonesia, there are no
further requirements for collective dismissals. In Indonesia, the ranking is due to the high level of
severance pay.
Going beyond the measured differences in the de jure strictness of regulations, the World Bank
Enterprise Survey provides information on different dimensions of doing business along with
perceptions of constraints. In terms of the perceptions, enterprises in countries with strict legislation
often don’t report labour market regulations as a major constraint to business. The share of
respondents citing regulations as a major constraints is just around 10 per cent in India, while it is
almost non‐existent in China. In contrast, the proportion is very high in Latin America: in Brazil, 63.2
per cent of enterprises report labour regulations as a major constraint, which reflects poor industrial
relations rather than the de jure effect of the regulations.
ASARC WORKING PAPER 2017/02
28
Figure 11: A comparison of employment protection legislation in the OECD and selected non‐OECD
countries, 2013
Source: OECD Employment Protection Indicators database.
However, this does not suggest that regulations do not have an impact or constrain enterprises in any
way. Firstly, regulations may affect businesses but they do not perceive them as a “major constraint”.
Secondly, employers may have already internalized the effects of specific laws and subsequently
adjusted their labour practices (and decisions on capital and technology). For example, enterprises
may choose to split up the establishment, use more contract workers or bribe a labour inspector.
Thirdly, laws are typically not changed in isolation: reform may be endogenous to economic
conditions, as noted above, or the reforms may have been accompanied by other changes in the
macroeconomic situation or regulatory environment.
The debates revolving around labour laws rest on the premise that labour laws are one of the key
factors driving decisions on production and employment in a firm. Yet, enterprises are impacted by a
myriad of economic and regulatory explanations. As covered in the surveys of the World Bank (Doing
Business, Enterprise Surveys), important dimensions include corruption, infrastructure, taxation, skills
and access finance and credit. According to the latest results from the World Bank Enterprise Survey
in 2014, more Indian firms identify corruption as a major obstacle for their business (almost 20 per
cent), followed by electricity (around 15 per cent). Of the enterprises surveyed, 43.4 per cent were
expected to give gifts to get an import licence. Moreover, the need to give a bribe was much higher
for small firms.
The evolution of the manufacturing sector in India stands at the centre of the debates around the
future of work in the country. Considerable efforts are underway, through the Make in India flagship
0.0
0.5
1.0
1.5
2.0
2.5
3.0
3.5
New
Zea
land
Uni
ted
Sta
tes
Can
ada
Uni
ted
Kin
gdom
Chi
leA
ust
ralia
Est
onia
Irel
and
Hun
gary
Japa
nS
witz
erla
ndF
inla
ndK
orea
Isra
el
Slo
vak
Rep
.S
pain
Nor
way
Den
mar
kP
olan
dG
ree
ceA
ustr
iaIc
elan
dT
urk
eyS
wed
enM
exi
coC
zech
Rep
.S
love
nia
Por
tuga
lLu
xem
bour
gIt
aly
Fra
nce
Net
herla
nds
Bel
giu
mG
erm
an
y
Sau
di A
rabi
aB
razi
lS
outh
Afr
ica
Ru
ssia
n F
ed
.In
dia
Arg
entin
aLa
tvia
Indo
nesi
aC
hina
Scale 0-6
Collective dismissals Individual dismissals
ASARC WORKING PAPER 2017/02
29
programme, Skill India and other schemes, to push the economy and workers into this sector. Clearly,
there is considerable scope for this to happen. However, two caveats: first, this will not happen
uniformly across the country; second, the ability of the manufacturing sector to absorb workers may
be limited, particularly as manufacturing has become relatively capital and skill intensive. Nonetheless,
it is an important for India to increase the share of workers in manufacturing even to the levels
witnessed in China in recent times (18.5 per cent). If that had been achieved in 2011‐12,
manufacturing employment would have been 27.9 million greater than it was in that year (59.6
million).
6. Conclusion: what are the key features of the future of work in India?
India’s labour market is complex and the trends of recent decades suggests a far more nuanced set of
outcomes than captured by the view that India has experienced “jobless growth”. Overall, the last
decade and a half has been characterized by stronger employment growth in urban areas and for men.
This period witnessed, therefore, an unprecedented withdrawal of women from agriculture.
Consequently, female labour force participation in India, which is low by international standards, fell
further in the 2000s. Though a number of interrelated and complex factors are driving the decline,
including increased educational enrolment and rising incomes, the lack of employment opportunities
appears to be a major constraint.
Another much proclaimed feature of employment in India is informality; it is often stated that more
than 90 per cent of workers are informal. However, this figure masks two underlying but
countervailing trends: the fall in the share of workers in the unorganized sector, while the share of
informal workers in the organized sector (i.e. contract labour) has increased. Further disaggregating
informality by employment status and place of work reveal that the majority of people in informal
employment are own‐account workers, followed by informal employees in the informal sector and
contributing family workers.
The third dimension explored in this paper is the apparent failure of Indian manufacturing to absorb
workers during the structural transformation process. Compared to other countries, India’s
manufacturing sector represents a smaller share of both output and employment. However, other
emerging economies, notably China, have not been able to reach a much greater share in terms of
workers. A longer‐term challenge is the fact that manufacturing has become relatively capital and skill
intensive, which poses uncertainty about the extent to which the sector can absorb more workers.
ASARC WORKING PAPER 2017/02
30
Over the next decade or so, leading up to 2030, the target date for the Sustainable Development Goals
(SDGs), a number of likely trends for the future of work in India can be identified. But it is important
to be careful in these predictions: the lack of a sufficient time‐series for employment data renders it
is very difficult to provide projections with statistical models. Rather, the following generalized
developments can be hypothesized based on the past trends discussed above:
i. Employment will continue to increase in urban centres but by 2030, only around half of
the population will be urbanized, implying a persistent challenge of job creation in rural
areas.
ii. The labour force will grow at around 9 million per year (i.e. approximately 90 million over
the next 10 years), though the growth rate will decline due to a slowing population growth
rate. This trend would be countered if women join the labour force in greater numbers.
iii. However, female labour force participation is projected to increase slowly with a
persistent, sizable gender gap, which will constrain not only aggregate labour force
participation, but also economic growth.
iv. The organized sector will absorb more workers, but the majority of these are unlikely to
have access to social security or employment benefits; thus, formal workers will continue
to represent a minor share of total employment, while self‐employment will still account
for a large proportion of all workers.
v. The exit from agriculture will continue. In this context, the share of workers in
manufacturing will edge up slowly, but the absorption capacity of this sector will be
constrained by the capital and skill‐intensity of production and the impact of further
technological change. But the majority of workers exiting from rural areas are likely to find
employment in construction, spurred on by the continuing investment in infrastructure,
in both rural and urban areas.
vi. With persistent differentials in wages and ongoing process of urbanization, migration of
workers within India and to other countries will continue to act as an important “safety
valve” in the labour market.
Due to the ongoing uncertainty around the process of structural transformation in India, policies to
support workers and their families will remain important (e.g. MGNREGA, social security for all). At
the same time, policy interventions are in place to precipitate structural shifts in these trends and
accelerate a transformation of the labour market. Recent programmes and schemes have, therefore,
the potential to increase formal employment through the growth of the manufacturing and other

ASARC WORKING PAPER 2017/02
31
sectors, which would lead to more jobs that women can access. These efforts will have to be sustained
over the coming years, particularly at the state‐level in India, to ensure that more people can access
decent and productive employment, which will go a long way towards achieving the SDGs and the goal
of inclusive growth, not only in India but also globally.
ASARC WORKING PAPER 2017/02
32
References
Ahsan, A. and C. Pages (2009), “Are All Labor Regulations Equal? Evidence from Indian Manufacturing”, Journal of Comparative Economics, Vol. 37, No. 1, pp. 62–75. Amirapu, A. and A. Subramanian (2015), “Manufacturing or Services? An Indian Illustration of a Development Dilemma”, Centre for Global Development Working Paper, No. 409. Asian Development Bank (2009), Key Indicators 2009: Enterprises in Asia: Fostering Dynamism in SMEs. Asian Development Bank, Manila. Besley, T. and R. Burgess (2004), “Can Labour Regulation Hinder Economic Performance? Evidence from India”, Quarterly Journal of Economics, Vol. 119, No. 1, pp. 91–134. Bhattacharjea, A. (2006), “Labour Market Regulation and Industrial Performance in India”, Indian Journal of Labour Economics, Vol. 49, No. 2, pp. 211–232. Boserup, E. (1970), Women’s Role in Economic Development. St Martin’s Press, New York. Chatterjee, U., R. Murgai, and R. Martin (2015), “Job Opportunities along the Rural‐Urban Gradation and Female Labor Force Participation in India”, Policy Research Working Paper, No. 7412 (New Delhi, World Bank). Chaudhary, R. and S. Verick (2014), “Female labour force participation in India and beyond”, ILO Asia‐Pacific Working Paper, ILO, New Delhi. Dasgupta, S. and A. Singh (2006), “Manufacturing, Services and Premature Deindustrialization in Developing Countries: A Kaldorian Analysis”, United Nations University Research Paper No. 2006/49, UNU‐WIDER, Helsinki. Dasgupta, S. and S. Verick (eds) (2016) Women at Work in Asia: An Unfinished Development Agenda. ILO/SAGE India, Geneva/New Delhi. Deakin, S., C. Fenwick and P. Sarkar (2014), “Labour Law and Inclusive Development: The Economic Effects of Industrial Relations Laws in Middle‐Income Countries”, University of Cambridge Legal Studies Research Paper Series, No. 13/2014. Deakin, S. and P. Sarkar (2011), “Indian Labour Law and Its Impact on Unemployment, 1970–2006: A Leximetric Study”, Centre for Business Research, University of Cambridge, Working Paper No. 428. Dougherty, S., V. Frisancho Robles and K. Krishna (2013), “State‐Level Labour Reform and Firm‐Level Productivity in India”, India Policy Forum 2013. Gaddis, I. and S. Klasen (2014), “Economic development, structural change, and women’s labor force participation”, Journal of Population Economics, Vol. 27, Issue 3, pp. 639–681. Ghani, E., W.R. Kerr and A. Segura (2015), “Informal Tradables and the Employment Growth of Indian Manufacturing”, World Bank Policy Research Working Paper No. 7206. Goldar, B., and A. Sadhukhan (2015), “Employment and wages in Indian manufacturing: post‐reform performance”, ILO Employment Working Paper No. 185, International Labour Organization, Geneva.
ASARC WORKING PAPER 2017/02
33
Goldin, C. (1990), Understanding the gender gap and economic history of American women. Oxford University Press, New York. Government of India (2017), Economic Survey 2016‐17, Vol. 1. Government of India, New Delhi. Gunatilaka, R. (2013), “To work or not to work? Factors holding women back from market work in Sri Lanka”, ILO Asia‐Pacific Working Paper Series, ILO, New Delhi. Hasan, R. and K. Jandoc (2013), “Labour Regulations and the Firm Size Distribution in Indian Manufacturing” in J. Bhagwati and A. Panagariya, eds. Reforms and Economic Transformation in India, Delhi: Oxford University Press. Hasan, R., D. Mitra and A. Sundaram (2013), “What Explains the High Capital Intensity of Indian Manufacturing?”, Indian Growth and Development Review, Vol. 62, No. 2, pp. 212–41. Hoda, A. and D.K. Rai (2015), “Labour Regulations and Growth of Manufacturing and Employment in India: Balancing Protection and Flexibility”, ICRIER Working Paper No. 298. Hsieh, C‐T. and P.J. Klenow (2014), “The Life Cycle of Plants in India and Mexico”, Quarterly Journal of Economics, Vol. 129, No. 3, pp. 1035–1084. Hsieh, C‐T. and B. Olken (2014), “The Missing ‘Missing Middle’”, Journal of Economic Perspectives, Vol. 28, No. 3, pp. 89–108. International Labour Office (ILO) and WIEGO (2013), Women and men in the informal economy: a statistical picture (second edition). ILO, Geneva. Kapsos, S., Silberman, A. and E. Bourmpoula (2014), “Why is female labour force participation declining so sharply in India?”, ILO Research Paper, No. 10, ILO, Geneva. Karan, A. K. and S. Selvaraj (2008), “Trends in wages and earnings in India: Increasing wage differentials in a segmented labour market”, ILO Asia‐Pacific Working Paper Series, May 2008, ILO, New Delhi. Kochhar, K., U. Kumar, R. Rajan, A. Subramanian, and I. Tokatlidis (2006), “India’s Pattern of Development: What Happened, What Follows?”, IMF Working Paper, No. WP/06/22. Krueger, A. O. (2013), “The Missing Middle”, in N. C. Hope, A. Kochar, R. Noll and T. N. Srinivasan (eds.), Economic Reform in India: Challenges, Prospects, and Lessons. Cambridge University Press, Cambridge, Chapter 9. Mazumdar, D. (2003), “Small and Medium Enterprise Development in Equitable Growth and Poverty Alleviation”, in C.M. Edmonds (ed.), Reducing Poverty in Asia; Emerging Issues in Growth, Targeting and Measurement. Edward Elgar for the Asian Development Bank, Cheltenham, UK. Mazumdar, D. and S. Sarkar (2008), Globalization, Labor Markets and Inequality in India. Routledge, London and New York. Mehrotra, S., J. Parida, S. Sinha and A. Gandhi (2014), “Explaining employment trends in the Indian economy: 1993–94 to 2011–12”, Economic & Political Weekly, Vol. XLIX, No. 32, pp. 49 – 57.
ASARC WORKING PAPER 2017/02
34
Naudé, W., A. Szirmai and A. Lavopa (2013), “Industrialization Lessons from BRICS: A Comparative Analysis”, IZA Discussion Paper, No. 7543. Papola, T.S. (2013), “Role of labour regulation and reforms in India: Country case study on labour market segmentation”, ILO Employment Working Paper No. 147, ILO, Geneva. Rahman, R. I. And R. Islam (2013), “Female labour force participation in Bangladesh: trends, drivers and barriers”, ILO Asia‐Pacific Working Paper Series, ILO, New Delhi. Rahman, R.I., Mondal, A.H. and Z. Iqbal (2011), Employment and the labour market: Recent changes and policy options for Bangladesh, Paper prepared for the Planning Commission, Government of Bangladesh, Dhaka. Ramaswamy, K.V. (2014), “Employment Protection Legislation and Threshold Effects”, in Ramaswamy, K.V. (ed.), Labour, Employment and Economic Growth in India, Cambridge University Press, Delhi, Chapter 9. Rodrik, D. (2015), “Premature industrialization”, NBER Working Paper, No. 20935. Sarkar, A. (2013), “Tractor production and sales in India, 1989‐2009”, Review of Agrarian Studies, Vol. 3, No. 1, pp. 55‐72. Sen, K. and D.K. Das (2014), “Where Have the Workers Gone? The Puzzle of Declining Labour Intensity in Organised Indian Manufacturing”, DEPP Working Paper No. 36, IDPM, University of Manchester. Sudarshan, R. M. (2014), “Enabling women’s work”, ILO Asia‐Pacific Working Paper Series, New Delhi, ILO. Szirmai, A. (2012), “Industrialisation as an Engine of Growth in Developing Countries, 1950–2005”, Structural Change and Economic Dynamics, Vol. 23, No. 4, pp. 406–420. Tybout, J.R. (2000), “Manufacturing Firms in Developing Countries: How Well Do They Do and Why?”, Journal of Economic Literature, Vol. XXXVIII (March 2000), pp. 11–44. Verick, S. (2016), “Manufacturing and jobs: is India different?”, The Indian Journal of Labour Economics, Vol. 59, No. 1, 57‐84.