india’s experience of plant variety protection: trends,...
TRANSCRIPT
India’s Experience of Plant Variety Protection: Trends, Determinants and Impact
P. Venkatesh, V. Sangeetha, and Suresh Pal
Selected Paper prepared for presentation at the 2015 AAEA & WAEA Joint Annual Meeting, San
Francisco, California, 26-28 July 2015
Copyright 2015 by [P. Venkatesh, V. Sangeetha, and Suresh Pal]. All rights reserved. Readers may make verbatim copies of this document for non-commercial purposes by any means, provided that this
copyright notice appears on all such copies.

1
India’s Experience of Plant Variety Protection: Trends, Determinants and Impact
P.Venkatesh
1,V.Sangeetha
2 and Suresh Pal
1
1Division of Agricultural Economics, Indian Agricultural Research Institute, New Delhi-110012, India. 1Division of Agricultural Extension, Indian Agricultural Research Institute, New Delhi-110012, India.
Plant variety protection (PVP) is a recent development in the developing countries, and there is not
adequate evidence on the response of the seed industry to this policy change. This paper examines the
trends in PVP in India, protection behaviour and early impact on seed industry. The results showed a
significant growth in PVP attracting participation of both the public and private sectors. However,
there is some degree of crop segmentation with private sector mostly concentrated on vegetables and
cotton, while public sector on foodgrains. Furthermore, 55 per cent of the applications from private
sector were for the new varieties, whereas 85 per cent of the public sector applications were for the
extant varieties. The results of logit model revealed that yield, adaptability, institute origin and
variety traits were the major factors which influenced the PVP decisions of breeders. The hedonic
pricing model indicated a price premium of 11-15 per cent for seeds of the protected varieties. The
trends in exchange of germplasm, number of varieties released, breeder and quality seeds produced,
seed replacement rate and number of public-private partnerships, indicate the growth of the Indian
seed industry and its confidence in the PVP mechanism. The study concluded that initial impact of
PVP on seed industry and farmers’ accessibility to quality seeds is positive.
Key words: Plant variety protection, protection behaviour, hedonic pricing, impact of PVP, India.
JEL Classification: O31, O34, Q18
Introduction
Breeding of new plant varieties and supply of seeds were mainly in public domain until the 1970s
when organised seed sector was taking shape in India (Spielman et al., 2011). The diversification
process of the seed industry started with the expansion of seed market, which further got steam with
implementation of the New Policy on Seed Development in 1988 (Pray et al., 2001). The
diversification process was noticed across the different stages of the seed system, viz., development of
plant varieties and multiplication and distribution of seeds (Morris et al., 1998) Now large number of
private seed companies (500 in 2011) are active in India and most of them are having their own R&D
and investing about 5-20 per cent of their sales revenue in R&D (Dravid, 2011). However, private
seed companies have shown interest in developing low-volume and high-value seed, such as those of
vegetables, cotton, sunflower, maize or other hybrid dominated crops (Anonymous, 2012). Since most
of these companies were using public material, protection was not a major issue and wherever needed
biological protection provided by hybrids was adequate. But now it is quite likely that biological
protection of hybrids may not be adequate, especially for single-cross hybrids, and some form of legal

2
protection will be needed to protect the interest of private plant breeding. Besides, India as a signatory
country of Trade Related Intellectual Property Rights (TRIPs) agreement under World Trade
Organisation (WTO), it is bound to provide patent or protection or combination thereof for plant
varieties. Therefore, India has adopted the protection of plant varieties in 2001.
The literature suggests that the impact of IPRs is not uniform across the countries and also there is
no consensus among the economists. Proponents argued that IPRs provide incentives to innovators to
invest in R&D which result in development of new varieties and increases availability of improved
varieties to farmers (Kanwar and Evenson, 2003; Kolady and Lesser, 2009). Further, it facilitates the
flow of genetic material and new varieties across the countries as licensing and royalty agreements are
widespread world over (Wijk, 1996). However, opponents contented that IPRs have not played any
role in stimulating R&D investment and development of new varieties (Leger, 2005; Drew, 2010);
and the stronger protection may even cut the global rate of innovation (Grossman and Helpman,
1991). In particular, IPRs in developing countries has not provided the expected results, especially in
the transfer of technologies from developed countries, because weak R&D infrastructure in
developing countries hinders adoption of new technologies (Correa, 2001). In this context, the case of
India is somewhat different, in the sense that it has a well-developed scientific infrastructure and a
diversified seed industry. The question now arises how public and private breeding programmes are
responding to this policy change. In particular, which organisations, public or private are seeking
protection, and which crops are witnessing more protection activities. Has there been an increase in
the development of plant varieties and their delivery to farmers after the new IPRs regime? This paper
addresses these questions. It specifically provides evidence on the trends in plant variety development
and their protection behaviour, and price premium of the protected varieties and impacts by analysing
trends in the development and protection, exchange of germplasm and changes in the commercial
seed market.
Indian Plant Variety Protection
The main objective of the Protection of Plant Varieties and Farmers’ Rights (PPV&FR) Act,
2001 is the development of seed industry by protecting interest of the breeders, seed agencies and

3
farmers by providing an effective mechanism for protection of plant varieties and rights of the
farmers. Three types of rights are provided under the Act. First, breeders’ rights which give exclusive
rights to produce, sell, market, distribute, import or export the seeds of the protected variety. Second,
researcher’s rights which allow a researcher to use a protected variety for conducting experiment or
research and use the variety as initial source for the purpose of development of another variety.
Third, farmers’ rights which is unique in the Indian system in the sense that these recognize the rights
of farmers as breeders (who has bred or developed a new variety), as conservator (who is engaged in
the conservation of genetic resources of land races and wild relatives of economic plants) and as
users (who can save, use, sow, re-sow, exchange and share or sell his farm produce including seed
(unbranded) of a protected variety). In India, besides protection the new and essentially derived
varieties (EDV) like in other countries, extant variety (EV) and farmers’ variety (FV) can also be
protected (http://plantauthority.gov.in).
Data and Methodology
The detailed information on the PVP applications and registration of varieties in India was
collected from published and unpublished reports of the PPV&FR Authority. Trends in these
varieties for different crops were analysed in this paper using simple tabular analysis. Few studies
have focussed on the determinants (the factors which are considered by breeders) of PVP. Larger
market size and stronger IPRs regimes were found to be associated with PVP grants across the
countries (Srinivasan,et al., 2002). In China, institute origin of the variety, quality characteristics,
adaptability of the variety and age of the varieties were major determinants of PVP applications (Hu
et al, 2006). Most of the studies applied logit model for analysing the adoption behaviour (Adeogun
et al., 2008; Farid et al, 2010). Following a similar approach, we applied the logit model to study the
determinants of PVP behaviour of the industry with following explanatory variables.
Y= f (X1, X2, D1,D2,D3,D4,D5, D6,D7,D8,D9)
where: Y= 1 for protected variety, 0 for otherwise; X1= Yield of a variety (kg/ha); X2=
Number of years after release of a variety; D1= 1 for public sector variety, 0 for otherwise; D2= 1 for
hybrid, 0 for otherwise; D3= 1 for short duration variety, 0 for otherwise; D4= 1 for state variety, 0 for

4
otherwise; D5= 1 for regional variety, 0 for otherwise; D6= 1 for variety is resistant to pest or disease
or both, 0 for otherwise; D7= 1 for maize variety, 0 otherwise; D8= 1 for cotton variety, 0 for
otherwise and D9= 1 for mean fibre length of the cotton more than 23 mm, 0 for otherwise.
A strong economic logic exists for higher probability of protection for a high yielding variety as
compared to a low yielding variety of the same crop. The Indian Council of Agricultural Research-
IPR (ICAR-IPR) guidelines suggests that all the extant varieties of ICAR which have not completed
15 years from the date of notification can be taken up for protection under the PPV&FRA as a priority
activity (ICAR, 2006). Obviously, the varieties which are in demand are likely to be protected in this
category. The private sector varieties are guided by profit motive in opting for the protection. A
marked difference in the protection status can thus arise depending on whether the variety was
developed by the public institution or private sector. It was also expected that parent lines of hybrids
having higher seed sale and probability are likely to be protected. Further, as cost of R&D involved in
bringing out a hybrid is higher in comparison to open pollinated variety, it is expected that the
probability of protection of hybrids is high.
For the purpose of analysis, a distinction was made between varieties based on the extent of
geographical area where the variety can be cultivated. A variety recommended for more than five
states is classified as a national variety, two to five states as a regional variety and one state as a state
variety. The national variety can have a higher market share and profit compared to the regional and
state varieties is expected to reflect in their protection status. Similarly, varieties with additional
features like pest and disease resistance, abiotic stress resistance, quality traits etc are more likely to
be protected. Since the model contains dichotomous dependent variable, the maximum likelihood
estimation method was used to estimate the logit model. Three crops, namely rice, maize and cotton
varieties were selected for the analysis based on their commercial importance and protection coverage
of varieties. In each crop, based on availability and accessibility of complete required information,
sample size was fixed as 30 for protected varieties. And equal number of unprotected varieties was
also randomly selected from the varieties which are recently released and eligible for protection. In
total, 180 varieties (60 varieties from each crop) were selected for analysis out of which 111 varieties

5
were from public sector and 69 were from private sector. Data regarding the information about the
varieties was compiled from published government reports ( Rani et al., 2011; Kaul and Kumar, 2011;
Shanmugam and Gunasekaran, 2007) and private seed companies’ products catalogue and website.
Economic benefits of protected varieties such as premium price, better bargaining power and
market share are likely to stimulate the investment in plant breeding and therefore promote the growth
of seed industry. Availability and accessibility of the data limits the measurement of these benefits,
however, the economic value of plant variety rights (premium price) was effectively measured
through hedonic pricing models in the past studies. The hedonic pricing model is mainly developed
for explaining the relationship between price and quality characteristics of the commodity. Some
studies have established the relationship between seed price of a plant variety and its quality
characteristics by using hedonic pricing model and estimated the economic value of each
characteristic of a variety (Dalton,2004; Lambert and Wilson, 2003; Lesser,1994; Drew, 2010). By
adopting Lesser’s approach, premium price for protected plant varieties were estimated. The hedonic
pricing model was applied to three major crops (rice, maize and cotton) and estimated the equation for
three crops by fitting the model separately. A pooled model for all the three crops was also estimated
to assess consistency of the results. It is hypothesised that farmers pay certain amount for desirable
characters of the variety, and the price of a variety will be sum of marginal value of different
characteristics of the variety. Regressing seed prices of the varieties on characteristics gives an
estimate of the contributions of the variety characteristics to the price, that is, the implicit price of the
attributes. Retail seed price of selected crop varieties collected through survey was used as dependent
variable. The semi-log linear form of the hedonic pricing model with following variables was
estimated.
ln Y= f (X1, D1,D2,D3,D4,D5, D6,D7,D8)
where; lnY= Natural log of seed price of a variety (Rs/kg); X1= Yield of a variety (kg/ha);
D1= 1 for protected variety, 0 for otherwise; D2= 1 for public sector variety, 0 for otherwise; D3= 1 for
variety is resistant to pest and/ or disease, 0 for otherwise; D4= 1 for maize variety, 0 for rice; D5= 1

6
for cotton variety, 0 for rice; D6= 1 for mean fibre length of the cotton more than 23 mm, 0 for
otherwise.
Quantifying the impact of PVP on the Indian seed industry is a challenging task. This study has
examined the initial impact by assessing the changes that occurred in the seed industry based on four
quantitative indicators. First, the export and import of germplasm were estimated to capture the
international flow of new varieties. Second, the decadal growth in the number of varieties was worked
out to reckon the availability of improved varieties in the market. Third, the trend in breeder seed
production and distribution of quality seeds was measured to assess the availability of quality seeds to
farmers. Further changes in public and private shares in quality seed distribution and improvement in
seed replacement rate (SRR) of selected crops were also studied. Fourth, the number of public-private
partnerships (PPP) was studied to analyse the changes in marketing channel in dissemination of new
technology and revenue generation by the public sector through PPP. The export and import of seed
germplasm information was compiled from various annual reports of National Bureau of Plant
Genetic Resources (NBPGR). Details of notified varieties were compiled from the website of
Ministry of Agriculture (Seednet, 2012), breeder seed production was compiled from the annual
reports of the AICRP-National Seed Project (NSP) and the data on PPP in commercialisation of new
varieties or new seed technologies were compiled from National Seed Association of India (NSAI,
2011).
Results and Discussion
Trend in PVP Application and Certification
Since 2006, the PPV&FR authority started regular functioning, and initially the Authority invited
applications for only 12 genera and species of the major food crops under the Act. Gradually, it had
expanded its coverage in other crops and in total 54 genera and species in 2011, which include cereals
(8), pulses (7), oil seeds (11) vegetables (7), spices (5), fibre crops (6), flower crops (6), medicinal
plants (4) and other crops (3). The PVP applications started to be received by PPV&FRA from 2007
onwards. It is evident from Table 1 that within 6 years, number of applications increased about three
times, i.e. from 432 in 2007 to 1361 in 2011. In total, 4268 applications have been filed till 2012, out
7
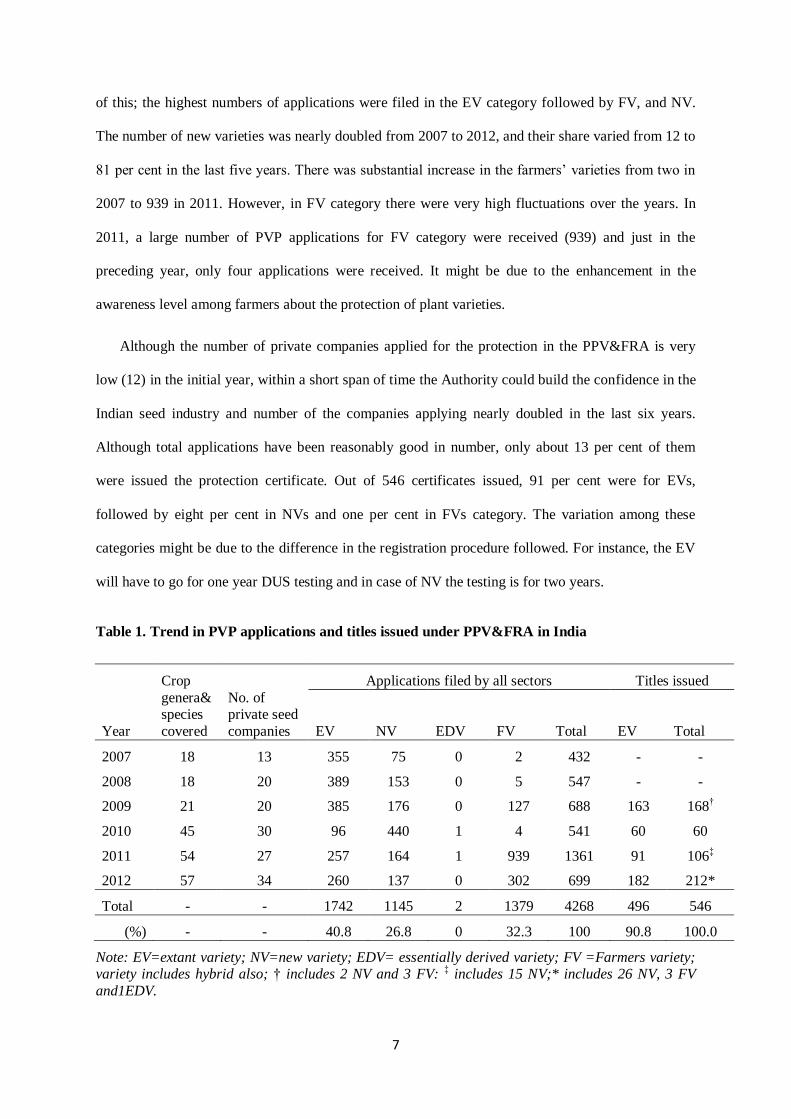
of this; the highest numbers of applications were filed in the EV category followed by FV, and NV.
The number of new varieties was nearly doubled from 2007 to 2012, and their share varied from 12 to
81 per cent in the last five years. There was substantial increase in the farmers’ varieties from two in
2007 to 939 in 2011. However, in FV category there were very high fluctuations over the years. In
2011, a large number of PVP applications for FV category were received (939) and just in the
preceding year, only four applications were received. It might be due to the enhancement in the
awareness level among farmers about the protection of plant varieties.
Although the number of private companies applied for the protection in the PPV&FRA is very
low (12) in the initial year, within a short span of time the Authority could build the confidence in the
Indian seed industry and number of the companies applying nearly doubled in the last six years.
Although total applications have been reasonably good in number, only about 13 per cent of them
were issued the protection certificate. Out of 546 certificates issued, 91 per cent were for EVs,
followed by eight per cent in NVs and one per cent in FVs category. The variation among these
categories might be due to the difference in the registration procedure followed. For instance, the EV
will have to go for one year DUS testing and in case of NV the testing is for two years.
Table 1. Trend in PVP applications and titles issued under PPV&FRA in India
Year
Crop
genera& species
covered
No. of private seed
companies
Applications filed by all sectors Titles issued
EV NV EDV FV Total EV Total
2007 18 13 355 75 0 2 432 - -
2008 18 20 389 153 0 5 547 - -
2009 21 20 385 176 0 127 688 163 168†
2010 45 30 96 440 1 4 541 60 60
2011 54 27 257 164 1 939 1361 91 106‡
2012 57 34 260 137 0 302 699 182 212*
Total - - 1742 1145 2 1379 4268 496 546
(%) - - 40.8 26.8 0 32.3 100 90.8 100.0
Note: EV=extant variety; NV=new variety; EDV= essentially derived variety; FV =Farmers variety; variety includes hybrid also; † includes 2 NV and 3 FV:
‡ includes 15 NV;* includes 26 NV, 3 FV
and1EDV.

8
Institutions and Crop Focus of PVP Applications
The composition of varieties filed by different institutions show that about 55 per cent of the total
applications filed by private sector were in NV category, which indicated their preference for
protection of new varieties over the older varieties. The concentration of applications was the highest
in cotton, followed by cereals, vegetables, and relatively low in oilseeds and least in pulse crops
(Table 2). It revealed that private companies focussed on the major crops, which have the high
market demand. In farmers’ variety, almost 100 per cent applications were filed for cereal crops,
particularly rice and negligible applications were for pulses and oilseeds. Interestingly, four
applications had been filed under the NV category by farmers.
Table 2. Composition of varieties filed by different sectors (2007-2012)
Crop Private sector Farmer Public sector Total
EV NV Total FV EV NV Total EV NV FV Total
Cereals 252 358 610 1352‡ 478 110 588 730 472 1348 2550
(%) 41.3 58.7 100 - 81.3 18.7 100 28.6 18.5 52.9 100
Pulses 5 19 24 22 187 30 217 192 49 22 263
(%) 20.8 79.2 100 73.3 86.2 13.8 100 73.0 18.6 8.4 100
Oilseeds 41 51 92 3 53 3 56 94 54 3 151
(%) 44.6 55.4 100 - 94.6 5.4 100 62.3 35.8 2.0 100
Vegetables 161 215 376 1 44 1 45 205 216 1 422
(%) 42.8 57.2 100 - 97.8 2.2 100 48.6 51.2 0.2 100
Fibres 349† 329 678 0 112 18 130 461 347 0 808
(%) 51.5 48.5 100 - 86.2 13.8 100 57.1 42.9 0.0 100
Others 2 0 2 5 60 7 67 62 7 5 74
(%) 100.0 0.0 100 - 89.6 10.4 100 83.8 9.5 6.8 100
Total 810 972 1782 1383 934 169 1103 1744 1145 1379 4268
(%) 45.5 54.5 100 - 84.7 15.3 100 40.9 26.8 32.3 100
† includes one essentially derived variety; ‡includes 4 new varieties from farmers.
The public sector had mostly filed under the EV category, i.e. more than 84 per cent of the
applications across the groups. These public varieties were dominated by cereals and pulses and to
some extent to fibre crops. When compared to public sector, except pulses and spices, private sector
dominated all other groups. Similar types of findings were reported by Hu et al (2006) for China.
Public sector was protecting their the extant varieties, perhaps to see in opportunity of benefit sharing
in case these are used in breeding programs of private sector. It is also observed that private sector has

9
given less attention to the crops, where public sector R&D is high. This finding is in line with other
study conducted for UPOV-member countries where it was found that concentration of PVP
certificates is less in the case of crops where public sector or co-operative institutions have played
substantial role in plant breeding (Srinivasan, 2003).
Determinants of PVP
The results of the estimation of the logit model are presented in Table 3. The high value of R2
shows that the determinant model fits the data reasonably well. The pooled regression estimates also
conform to the results of individual crop equation estimates. A positive coefficient for explanatory
variables increases the probability of success. Most of the variables are significant and have expected
signs. Yield, as assumed, has a positive influence on the protection. Odds ratio indicated that for one
quintal increase in the yield, there is almost equal chance for a variety being protected or unprotected.
It might be due to the fact that companies will protect all the varieties beyond a particular yield level.
Institute origin of the variety has revealed mixed result. If a variety belongs to public sector, odds
ratio in favour of protection was high for rice and maize. It implied that compared to the private
varieties, public varieties are more likely to be protected. In case of cotton, the picture was just
reverse. If a variety belongs to public sector, it had a lesser chance for protection as compared to
private sector varieties. It might be due to the fact that private sector played a major role in cotton
research and varietal development, especially after introduction of Bt cotton in the country, and the
PVP application analysis also confirmed the private sector domination in cotton. Interestingly, age,
type and duration of the variety are non-significant and did not influence the protection behaviour. It
shows that industry does not differentiate the characteristics such as variety and hybrid, long duration
and short duration and age of variety while making decisions regarding protection. During the survey,
private companies’ personnel also mentioned that they were forced to apply for protection in order to
prevent illegal claim of ownership or copying the variety by the competitors. As expected,
adaptability of a variety was positive and significant in determining the protection behaviour of the
industry and the varieties with the national coverage were more likely to be protected.

10
Table 3. Determinants of PVP behaviour of seed industry
Parameters
Rice (N=60) Maize (N=60) Cotton (N=60) Pooled (N=180)
Coeff. SE Exp(B) Coeff. SE Exp(B) Coeff. SE Exp(B) Coeff. SE Exp(B)
Response variable: Protection status of a variety (1= PVP; 0=otherwise)
Intercept 3.21 2.57 24.68 5.39 3.28 218.14 5.70 2.24 299.49 5.52 1.38 249.27
X1 (Yield) -0.001*** 0.00 0.99 0.001*** 0.00 0.99 0.001* 0.00 0.99 -0.001*** 0.00 0.99
X2 (Age) 0.22 0.15 1.25 -0.15 0.14 0.86 -0.06 0.11 0.94 -0.07 0.05 0.93
D1 (Origin) 2.30** 0.99 9.94 2.98*** 1.02 19.61 -2.57* 1.38 0.08 1.07** 0.47 2.92
D2 (Type) 1.28 1.16 3.59 1.27 1.58 3.55 0.03 0.92 1.03 0.45 0.52 1.57
D3 (Short duration) 0.11 1.10 1.11 -0.22 1.23 0.80 0.70 0.88 2.02 0.04 .048 1.04
D4 (State variety) -2.01* 1.08 0.13 -2.91** 1.32 0.05 -3.29** 1.40 0.04 -2.19*** 0.54 0.12
D5 (Regional variety) -0.23 1.15 0.79 -0.74* 1.43 0.48 -3.13** 1.60 0.04 -0.94* 0.58 0.39
D6 (Resistant variety) 1.39* 0.80 4.03 2.42*** 1.08 11.27 1.66** 0.86 5.27 1.725*** 0.42 5.61
D7 (Maize variety) - - - - - - - - - 0.006 0.58 1.01
D8 (Cotton variety) - - - - - - - - - -2.92*** 0.93 0.05
D9 (Long-staple cotton variety) - - - - - - 2.35** 1.11 10.44 - - -
-2Loglikelihood 48.46 34.14 46.68 166.17
Cox & Snell R2 0.44 0.56 0.46 0.37
Nagelkerke R2 0.59 0.74 0.61 0.49
Note: ***, ** and * indicate significance at 1%, 5% and 10% respectively.

11
Pest and disease resistance traits also have expected influence and high odds ratio for varietal
protection. The odds ratio for resistant variety for maize was the highest (11.27) followed by cotton
(5.27) and rice (4.03). The odds ratio for resistant variety for maize was the highest (11.27) followed
by cotton (5.27) and rice (4.03). It indicates a resistant variety would have 11 times higher chance for
protection than a non-resistant variety. Similarly, quality parameters also favourably influenced the
protection decision in case of cotton varieties. It implied that varieties with better product quality are
more likely to be protected (10 times higher) than other varieties.
Valuation of Plant Variety Protection
The hedonic model explains more than 73 per cent of the variation in the seed prices for all the
three crops (Table 4). As expected, protection status of the variety influenced the price positively and
significantly. Protected varieties had a premium price of 11 to 15 percent over the unprotected
varieties. This is considerably higher than that reported by Lesser (1994) for soybean in USA (2.3
percent), but lower than that of ornamental crops (23 percent) reported by Drew (2010). The pooled
regression estimate in our case shows very high premium price (39 percent) for the protected
varieties, it may be possible due to wide price differences among the crop varieties ranging from Rs
22 to 100 /kg for rice and Rs 320 to 1300/ packet for cotton in 2011-12. It is worthy to note that
premium price should be within the range of farmers’ affordability, otherwise small and marginal
farmers will be deprived from access to new and improved varieties. Yield, pest and disease resistance
and quality variables significantly and positively influenced the seed price. There was an increase in
price about 2 per cent for both rice and maize and 10 per cent for cotton for a unit increase in yield
and those varieties, which possessed resistance characteristics priced higher. Institute origin of the
variety negatively influenced the price. It indicated that the price of private varieties was on an
average 10 per cent higher than public sector varieties.

12
Table 4 . Valuation of premium price for protected varieties through hedonic pricing model
Variable
Rice (N=60) Maize (N=60) Cotton (N=60) Pooled (N=180)
Coeff. SE Coeff. SE Coeff. SE Coeff. SE
Response variable: ln price of varieties
Intercept 2.75 0.06 3.11 0.12 5.64 0.09 3.19*** 0.16
X1 (Yield) 0.002*** 0.00 0.002*** 0.00 0.001*** 0.00 0.001*** 0.00
D1 (Protected variety) 0.11** 0.02 0.16* 0.07 0.13* 0.05 0.39*** 0.07
D2 (Origin) -0.11* 0.06 -0.12** 0.06 -0.09** 0.05 -0.08 0.07
D3 (Resistant variety) 0.09 0.01 0.11** 0.06 0.10** 0.04 0.21*** 0.07
D4 (Maize variety) - - - - - - 0.56*** 0.12
D5 (Cotton variety) - - - - - - 3.25*** 0.16
D6(Long-staple cotton variety) - - - - 0.09* 0.05 - 0.09
R2 0.81 0.73 0.87 0.94
Note: ***, ** and * are significance level at 1%, 5% and 10% respectively
Early Impact of PVP on Indian Seed Industry
Promotion of varietal development and improving accessibility of quality seed to farmers were
the major objectives of the PPV&FR Act. Therefore, data on exchange of planting materials, release
of notified varieties, seed production, seed replacement rate and public-private partnerships (PPP) are
examined to ascertain the early impact of PVP on Indian seed industry. Export and import of seed
germplasm were assumed as a proxy for the actual material exchange. It shows that import of annual
germplasm accessions increased manifold from a mere 7,816 per year in 1995 to 37,018 in 2012
(Figure 1). A notable change witnessed in the later half of 2000s and import indent was mostly from
private companies which indicate increase in private plant breeding intensity in India. The changes
occurred in the flow of new plant materials and research activities could be attributed to new IPRs
regime. Table 5 presents the decadal growth in the number of notified varieties and shows a
significant increase in the varietal releases of major crops during the recent decade (2000-2010) as
compared to in the previous two decades (1980-2000). It should be noted that the negative growth was
observed in release of notified varieties in pre-PVP decade (1990-2000) for all crop groups, except
vegetables.

13
Figure 1. Exchange of germplasm: 1995-2012
Table 5. Crop-wise decadal growth in the number of notified varieties: 1980-2010
Crop
1981-
1990
1991-
2000
2001-
2010 Crop
1981-
1990
1991-
2000
2001-
2010
Cereals Oilseeds
Paddy 206 197 282 Groundnut 42 39 60
Wheat 75 68 103 Mustard 9 6 53
Maize 46 61 111 Soybean 26 24 32
Sorghum 61 50 46 Sesame 24 15 26
Pearl millet 41 42 48 Sunflower 10 20 28
Sub-total 429 418 (-3) 590 (41) Linseed 19 7 20
Castor 11 14 12
Sub-total 141 125(-11) 231 (85)
Pulses Vegetables
Chick pea 42 37 62 Bhendi 6 7 13
Green gram 37 32 44 Brinjal 20 25 22
Pigeon pea 38 27 30 Cauliflower 3 6 9
Black gram 18 27 26 Onion 7 4 10
Field pea 15 17 25 Potato 3 8 13
Lentil 10 13 19 Tomato 15 13 28
French bean 6 5 9 Sub-total 54 63 (17) 95(51)
Sub-total 166 158 (-5) 215 (36) Cotton 76 81 (7) 85 (5)
Source: Compiled by authors from http://seednet.gov.in
Note: Figures in parentheses indicate percentage change over previous decade
In the case of cereals, major cereals (rice, wheat and maize) recorded a higher growth in the
recent decade; however, a sluggish growth was observed in pearl millet and a declining trend in
sorghum. It shows that commercially important crops like maize received more attention. The varietal
0
5000
10000
15000
20000
25000
30000
35000
40000
Num
ber
of
acce
ssio
ns
Import Export

14
growth in pulses was also higher during the recent decade as compared to in the previous decades,
except for pigeon pea and black gram and the oilseed sector has also witnessed as same trend, except
castor. Mustard crop has recorded an impressive growth in the recent decade, more than five-time
increase in the release of notified varieties as compared to that in the previous decades. A gradual and
steady trend has been found in the case of vegetables, whereas in cotton, it is almost stagnant. It could
be due to the fact that cotton and vegetables are mostly dominated by the private sector and all their
varieties might not have been notified under the Seed Act.
Overall, a higher decadal growth in the number of varieties for the majority of crops was
recorded in the post-PPVFRA period. There could be many reasons for this significant growth in
varietal development like availability of improved breeding tools, advances in Science &Technology
such as better identification methods, increased availability of genetic materials (germplasm, inbred
lines). Besides, strengthening of plant breeding capacity in public sector through varietal development
programmes like All India Co‐ordinated Research Project (AICRP) for various crops (ICAR, 2008)
increased breeding intensity of private seed companies, but one cannot rule out the possibility of
breeders’ response to the incentives offered by PVP. This finding is in consonance with the study of
Naseem et al. (2005), who have reported that PVP has led to the development of more varieties of
cotton in the USA. Similar findings were reported by Diez (2002) and Srinivasan (2004). They have
argued that plant breeders’ rights in the Europe have increased the incentives for private firms to
develop new crop varieties. Kolady and Lesser (2009) have also found that implementation of PVP
attracted private investment in wheat in the USA and provided high-yielding varieties of these crops
in higher numbers from both public and private sectors.
Production of Breeder and Quality Seeds
In India, the breeder seeds are produced by different ICAR institutes and state agricultural
universities (SAUs). The seed indents are submitted by the public sector institutes and private seed
companies across the country, and each breeding centre is allocated the production targets. It is
assumed that the changes in breeder seed production may indicate the response of seed industry to the
policy changes in the country. The production of breeder seeds has consistently increased for all the

15
crops, except cotton (Table 6). The trend analysis has also indicated that there was a tremendous
increase in seed production of cereals and oilseeds after 2002. Surprisingly, the breeder seed
production in cotton declined after 2003. It may be due to the introduction of Bt cotton in the country
during this period. After the introduction of Bt cotton, the cotton seed sector is mainly dominated by
the private seed companies. The pattern of distribution of quality seeds has also shown a considerable
change. During 1995-96 to 2011-12, it has increased by about two-times for cereals and by about
four-times for pulses and oilseeds. In the pulses seed distribution hovered around 5 lakh quintals
during 1995-2001, but after that it got momentum and reached a maximum of about 21 lakh quintals
in 2010-11. The study has also found that there was no impact on the fibre crops (cotton) and seed
production remained stagnated at around 2.5 lakh quintals throughout this period. It could be because
it reached a high seed replacement rate (SRR) in as early as 2000. It may be mentioned here that the
ICAR had launched a seed project in 2005-06 with a financial outlay of about Rs 20 million, covering
86 centres throughout the country, which increased the capacity for quality seed production of crops
and played a major role in changing the seed production scenario in the country (Prasad et al., 2011)
Table 6. Trends in breeder seed production and quality seed distribution in India: 1995-2011
Year
Breeder seed production
(in tonnes)
Quality seed distribution
(in '000 quintals)
Cereals Pulses Oilseeds Fibres Cereals Pulses Oilseeds Fibres
1995-96 2645 339 992 19 4400 360 1260 260
1998-99 1874 416 595 25 5730 410 1380 290
2001-02 2154 579 1234 39 6560 470 1210 290
2004-05 3189 870 1927 33 8140 740 2340 280
2008-09 4833 1505 2676 20 14740 1450 3990 260
2009-10 5959 1995 3511 22 16520 1970 5070 270
2010-11 6167 1562 3729 80 18260 2080 5060 260
2011-12 6282 1428 3871 51 18450 1920 5840 340
Source: Compiled by authors from annual reports of AICRP-NSP (Crops) for different years and from www.indiastat.com
Seed Replacement Rate
The trend in seed replacement rate indicates the reach of quality seeds in the farmers’ field
and changes could indicate a better accessibility of quality seeds by the farmers. The Government of
India while preparing the National Seed Plan has specified the desirable seed replacement rate (SRR)
to achieve the higher productivity based on pollination type of crops, viz. 25 per cent for self-

16
pollinated crops, 35 per cent for OPVs of cross pollinated crops and 100 percent for hybrids. The
trend in SRR shows that during early 2000s, SRR was in the range of 10-20 per cent for majority of
crops, except pearl millet and rapeseed and mustard, which has increased to 20-40 per cent in 2011-12
(Table 7). The increase in SRR was higher in the last five years (2006-12). The SRR is much higher
than the desirable rate in paddy (40 percent) and wheat (33 percent), but it is quite low for pulses and
groundnut. The hybrid dominated crops like pearl millet, cotton and maize recorded higher SRR
because hybrid seed is replaced every year. Therefore, one can say that diversification of the seed
industry has increased availability of quality seed to farmers. Of course, there have been concentrated
efforts by the state line departments to promote new varieties and seed under various schemes like
Rashtriya Krishi Vikas Yojana and National Food Security Mission.
Table 7. Seed replacement rate for major crops in India
Crop 2001-02 2006-07 2011-12
Wheat 13 22 33
Paddy 19 22 40
Maize 21 44 57 Sorghum 18 19 24
Pear millet 46 55 60
Bengal gram 4 9 19 Red gram 9 12 22
Groundnut 5 10 23
Rapeseed and Mustard 38 61 79
Soybean 12 28 53 Cotton 21 20 33/100*
Note: * indicates SRR for hybrids
Public-Private Partnerships
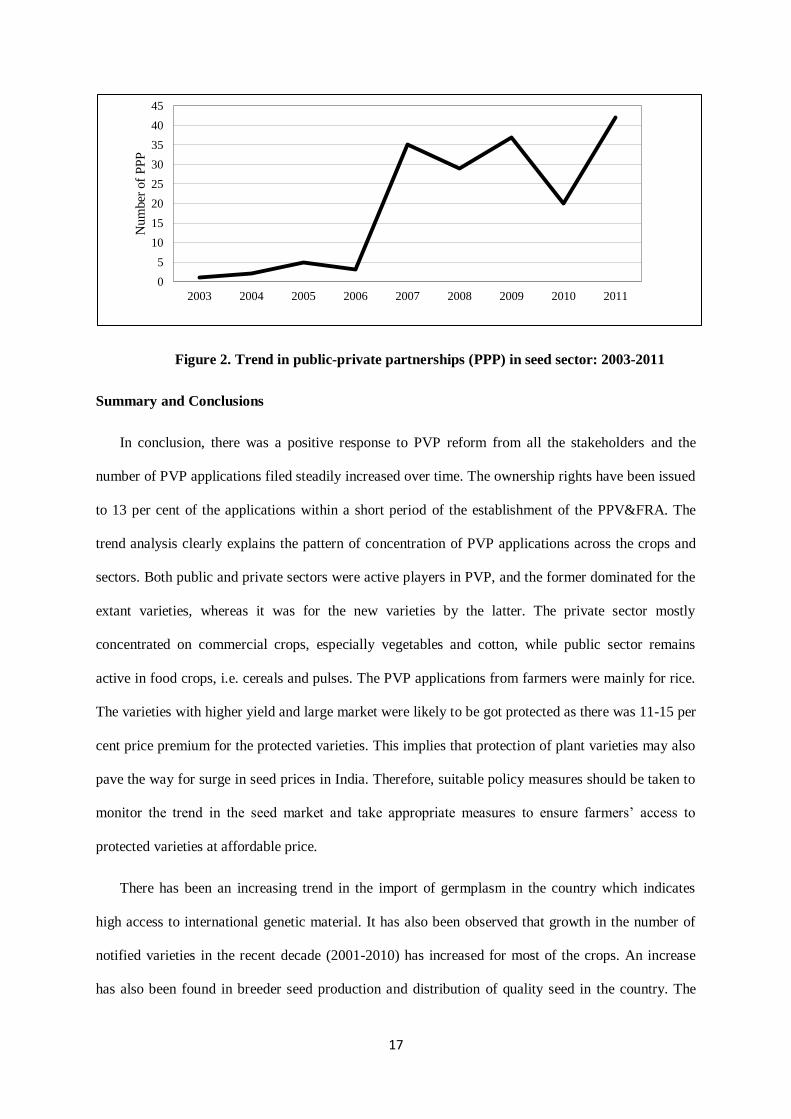
It is evident from Figure 2 that a noticeable change in PPPs occurred after 2006. The number of
PPPs was around 5 per year till 2005 and it increased to about 30 per year and the highest of (42 per
year) was noticed in 2011. A total of 174 Memoranda of Agreement (MoAs) were signed between the
public institutes and private companies during 2003-2011, which involved 75 private companies, 28
public institutes (ICAR and SAUs) and 4 institutes of Consultative Group on International
Agricultural Research (CGIAR). This trend clearly indicates the positive impact of PVP on public-
private partnerships.
17
Figure 2. Trend in public-private partnerships (PPP) in seed sector: 2003-2011
Summary and Conclusions
In conclusion, there was a positive response to PVP reform from all the stakeholders and the
number of PVP applications filed steadily increased over time. The ownership rights have been issued
to 13 per cent of the applications within a short period of the establishment of the PPV&FRA. The
trend analysis clearly explains the pattern of concentration of PVP applications across the crops and
sectors. Both public and private sectors were active players in PVP, and the former dominated for the
extant varieties, whereas it was for the new varieties by the latter. The private sector mostly
concentrated on commercial crops, especially vegetables and cotton, while public sector remains
active in food crops, i.e. cereals and pulses. The PVP applications from farmers were mainly for rice.
The varieties with higher yield and large market were likely to be got protected as there was 11-15 per
cent price premium for the protected varieties. This implies that protection of plant varieties may also
pave the way for surge in seed prices in India. Therefore, suitable policy measures should be taken to
monitor the trend in the seed market and take appropriate measures to ensure farmers’ access to
protected varieties at affordable price.
There has been an increasing trend in the import of germplasm in the country which indicates
high access to international genetic material. It has also been observed that growth in the number of
notified varieties in the recent decade (2001-2010) has increased for most of the crops. An increase
has also been found in breeder seed production and distribution of quality seed in the country. The
0
5
10
15
20
25
30
35
40
45
2003 2004 2005 2006 2007 2008 2009 2010 2011
Num
ber
of
PP
P

18
SRR has increased about three-times for the major crops in recent years. A discernible increase in
public-private partnerships has been recorded after 2006. Therefore, the available evidence suggests
that initial response of the industry to PVP is optimistic. However, there is a need for monitoring these
trends in the seed industry, and as more data accumulate over the years, a better understanding of the
impact of PVP on the seed industry can be established.
References
Adeogun, O.A., Ajana, A.M., Ayinla, O. A , Yarhere, M.T and Adeogun, M. O. (2008). Application
of logit model in adoption decision: a study of hybrid clarias in Lagos state, Nigeria, American-
Eurasian Journal of Agriculture and Environment Science, 4(4): 468-472.
Anonymous (2012) Future Thrust, Directorate of Seed Research, Mau U.P.
http://www.dsr.org.in/page .asp?id=190.
Correa, C.M. (2001). Review of the TRIPS Agreement: Fostering the Transfer of Technology to
Developing Countries. Third World Network, 131 Jalan Macalister 10400 Penang, Malaysia.
Dalton,T. J. (2004). A household hedonic model of rice traits: economic values from farmers in West
Africa, Agricultural Economics, 31: 149-159.
Diez, M.C.F. (2002). The impact of plant varieties rights on research: The case of Spain. Food Policy,
27(2) : 171-183.
Dravid, P.S. (2011). Indian seed industry status, challenges and opportunities in field crops. In
Souvenir of the Indian Seed Congress, 22-23, February, Hyderabad, India. 27-32.
Drew, J. (2010). An Economic Evaluation of the Roots and Fruits of Intellectual Property Rights for
U.S. Horticultural Plants. Ph.D. dissertation, University of
Minnesota.(http://purl.umn.edu/92005).
Farid, H., Silong, A.D. and Sarkar, S.K. (2010). Application of logit model in innovation adoption: a
study on biotechnology academic researchers in Malaysia, American-Eurasian Journal of
Agriculture and Environment Science, 9(3) :282-287.
Grossman, G.M. and Helpman, E. (1991). Innovation and Growth in the Global Economy, MIT Press,
Cambridge.
Hu,R., Huang, J., Pray,C. and Huang, J. (2006). The Determinants of plant variety protection
applications in China, Journal of Intellectual Property Rights, 11: 260-268.

19
ICAR (2008). Research Achievements of AICRPS on Crop Sciences (2002-07), Indian Council of
Agricultural Research. (http://www.icar.org.in/files/aicrp-report-2002-07/AICRPs
CropScience.pdf.)
ICAR (2006).Guidelines for Intellectual Property Management and Technology
Transfer/Commercialization. (Indian Council of Agricultural Research, New Delhi) 2006.
www.icar.org.in/files/reports/other-reports/icar-ipmttcguide.pdf.
Kanwar, S. and Evenson, R.E. (2003). Does intellectual property protection spur technological
change? Oxford Economic Papers, 55(2): 235-264.
Kaul, J. and Kumar,R.S., (2011). Maize Hybrid and composite varieties released in India,
Directorate of Maize Research, New Delhi,.
Kolady, D.E. and Lesser, W. (2009). Does plant variety protection contribute to crop productivity?
Lessons for developing countries from US wheat breeding. The Journal of World Intellectual
Property, 12 (2):137–152.
Lambert, D.K.and Wilson,W.W.(2003). Valuing varieties with imperfect output quality measurement,
American Journal of Agricultural Economics, 85(1): 95–107.
Leger, A. (2005). Intellectual property rights in Mexico: Do they play a role?. World Development, 33
(11):1865-1879.
Lesser,W. (1994). Valuation of plant variety protection certificates, Review of Agricultural
Economics, 16 (2): 231-238.
Morris, M. L., Singh R. P. and Pal, S. (1998). India’s maize seed industry in transition: changing roles
for the public and private sectors, Food Policy, 23 (1): 55–71.
Naseem, A., Oehmke, J.F. and Schimmelpfennig, D.E. (2005). Does plant variety intellectual property
protection improve farm productivity? Evidence from cotton varieties. AgBioForum, 8(2&3):
100-107.
NSAI (2011). NSAI Magazine, National seed association of India, New Delhi, April-June, 2011.
Prasad S.R., Somasundaram, G., Vijayakumar, H.P. and Natarajan, S. (2011). Seed production in
agricultural crops. In: Proceedings of Sixth Annual Review Meeting of ICAR Seed Project, held
at IARI, New Delhi.
Pray, C. E., Ramaswami, B. and Kelley, T. (2001).The impact of economic reforms on R&D by the
Indian seed industry, Food Policy, 26: 587–598
Rani, N.S , Varaprasad, G. S. , Rao, L.V.S., Sudharshan, I. , Hariprasad,A.S., Prasad,A.S.R., Ram,T.,
Babu,V.R., Padamavathi,G., Vijaipal,B., Suneetha,K. and Viraktamath,B.S. (2011). High
Yielding Rice Varieties of India, Directorate of Rice Research, Hyderabad, India .

20
Seednet (2012). Seed variety management system, http://seedvariety.dacnet.nic.in/ (13 February
2012).
Shanmugam,C. and Gunasekaran,M.(2007). National catalogue for notified varieties, Ministry of
Agriculture, Govt. of India, New Delhi.
Spielman, D. J., Kolady. D., Cavalieri. A. and Rao, N.C. (2011). The seed and agricultural
biotechnology industries in India: An analysis of industry structure, competition, and policy
options. IFPRI Discussion Paper 01103. Environment and Production Technology Division,
IFPRI, Washington, DC.
Srinivasan, C.S. (2004). Plant variety protection, innovation, and transferability: Some empirical
evidence. Review of Agricultural Economics, 26 (4): 445-471.
Srinivasan,C.S. (2003) Concentration in ownership of plant variety rights: some implications for
developing countries, Food Policy, 28: 519–546.
Srinivasan,C.S., Shankar, B. and Holloway, G. (2002). An empirical analysis of the effects of plant
variety protection legislation on innovation and transferability, paper presented at the Xth
International Congress (European Association of Agricultural Economists Zaragoza, Spain)
28-31 August 2002.
Wijk, J.V. (1996). How does stronger protection of intellectual property rights affect seed supply?
Early evidence of impact. Natural Resources Perspectives, Number 13, Overseas Development
Institute. Available at: http://www.odi.org.uk/resources/specialist/natural-resource-perspectives
/13-intellectualproperty- rights-seed-supply.pdfi