india’s transport sector - world...
TRANSCRIPT

India’s Transport SectorA View From World Bank Operations
Media Workshop on the Transport SectorAhmedabad, July 15, 2006
George TharakanLead Transport Specialist, India, The World Bank

Some Questions for This Session
Important that the media has an appreciation of the Transport Sector
• Why is transport important to the Nation?• What has been achieved so far?• Where do we need to go?• What is the bank doing?• What do we struggle with?• Who are the key players - accountability?
Transport is central to the very fabric of society and civil society engagement is critical – media plays a major role in presenting choices, educating the public and creating accountability.

Scope of Transport Sector and Workshop Agenda
Transport covers a range of sub-topics:• Aviation and airports• Highways – National and State• Inland Waterways• Ports and shipping• Railways• Road Safety• Rural Roads• Urban Transport
We will concentrate on Highways, Ports, Road Safety and Urban transport as these are of particular interest to the Gujarat media.

Why is Transport Important?

Comprehending Transport• Sometimes difficult to fully comprehend the significance
of transport to the economy• When there are problems in the power or water sectors
its immediately visible• Lights go off or taps run dry – the public immediately
knows – medical analogy is a heart attack• Transport sector grinds to a halt slowly – like lung
disease – slowly crippling the body• Public comes to accept poor transport as a way of life –
the economy runs slow, quality of life bad, people die in accidents – media must enlighten, focus attention

Urban Transport – Hamburger Index
• Hamburger Index used by economists to roughly assess the real exchange rate
• An Index for Transport– Number of meetings possible to schedule in a day– Cities rated on a scale of one to five meetings in a
day for visiting businessmen– City like Singapore would rate a 5 on the index– Most US cities may rate a 3 or 4– Indian Metros would rate a 2 for a reliable schedule– Post-war Beirut rated a 1, Bangkok was 1, Cairo a 2

Rural Transport – Diversifying Agriculture
Study of Indian Horticulture Sector Found:
• Farm gate price only 12-15% of retail, the rest is transport, loss in transit and distribution margins
• High logistical tax for exports – ton of grapes from India or Chile to Netherlands costs 3 times more to transport from India ($790), though Chile half the distance
• Poor internal logistics – apple prices in Chennai 2.5 times of Delhi
• Transport costs not the only factor – Chennai difference in wholesale price 6 times transport and handling costs – also important are damage, reliability, i.e the quality of transport
Transport will be critical to agriculture, rural poverty, export growth

Rural Roads Impact on Poverty Alleviation in India
Studies conducted by the International Food Policy Research Institute in India show rural roads among most effective investments to reduce rural poverty:
• Rs 10 lacs spent on rural roads lifts 163 people out of poverty – PMGSY Rs 120,000 Cr would lift about 100 million rural poor out of poverty
• Improved access increases farm-gate prices, and can double or triple agricultural incomes.
• Better connected villages literacy rates about 20% higher, and female literacy about 30% higher.

What’s Been Achieved and What’s Needed?

What’s Been Achieved?
• India’s road network – at 3.32 million km – is one of the largest in the world. China’s is only 1.7 mil km but their highway network is bigger.
• India’s rail network of 63,000 route km is less than China’s 71,000 route km, but network density per million pop. or square km. is higher
• India’s ports now handle three times the traffic before liberalization - about 165 (1991) vs 520 (2004) million tons

MAP OF NHDP Phases I & II
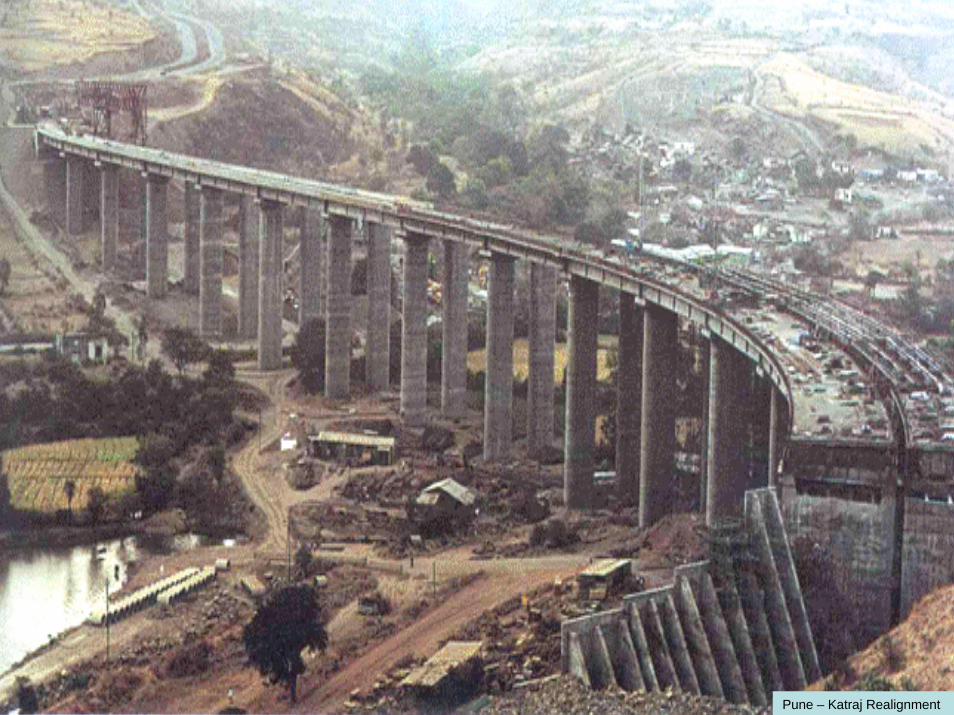
Pune – Katraj Realignment

IR Capacity Enhancement PotentialIndia-China Comparison
(2002 Data)India China
Route-km 63,000 72,000
Ton-km per year(billion)
336 1551
Average Freight Tariff(US cents/ton-km)
1.6 0.96
Traffic Density(million TU/route-km)
13.1 27.4

Port Traffic & Trade Projections• Port traffic is expected to double from present levels of
over 500 million tons by 2015.• Container traffic from about 50 to 220 million tons, dry
bulk traffic from 197 to 390 million tons over the next ten years. Catering to this growth presents a major challenge.
164
368
522
782
1130
0
200
400
600
800
1000
1200
1990-91 2000-01 2004-05 2009-10 2014-15

Indian Railways Development Plan 2007-12
• Rs. 5,00,000 crores ($ 100 bn) outlay proposed for railway upgradation– Capacity upgradation– Rolling stock– Equipment upgradation etc.
• Given the quantum of funding involved, PPP expected to be a major contributor (about 60%) to the planned investments
• This is a scale of Railway PPPs unprecedented among railways around the world.

What is the World Bank Doing?

World Bank Programs in TransportLoan Portfolio > $5000b
Rural Roads Rural Roads Project- PMGSY $400 mUrban Transport Mumbai Urban Transport Project $542 m
Third National Highway Project $516 mGrand Trunk Road Impr. Project $589 mAllahabad Bypass Project $240 mLucknow – Muzaffarpur NH $620 mGujarat State Highway Project $350 mKarnataka Highways Project $360 mKerala State Transport Project $255 mMizoram Roads Project $60 mUP State Roads Project $488 mTamil Nadu Road Sector Project $348 m
State Roads Projects
National Highway Development Program

Areas We Wish to Emphasize More
• Poverty targetting – public transport, pedestrians and non-motorized transport, rural transport
• Road Safety – insurance industry reform, driver education and licensing, emergency roadside services, traffic enforcement
• Environmental - Increased rail freight capacity, reduced fuel consumption and emissions
• Transport Services – quality of trucking services, cross border delays, through movement of cargo

What are We Struggling With?

Issues Confronting Transport Sector
• Construction Capacity• Contract Management• Land Acquisition and R&R• Mobilizing Private Financing

Expanding Construction Capacity
• China constructing 5000 km of highways a year compared to our 1000 km a year
• 11th Five Year Plan requires 4.5 times as much road construction as 10th FYP
• Construction industry capacity already overstretched – quality, price affected
• Mobilizing domestic and foreign sources of capacity – skilled manpower, technology

Improving Contract Management
• On average publicly financed road construction contracts suffering 35% cost over-runs
• Problems appear to be:– Poor quality of designs and site investigations– Land acquisition and R&R, pennywise un-pragmatic
policies of Government agencies– Delays in site handing over, poor coordination with
local authorities e.g. utilities, forestry– Contractor financing and cash management– Dispute resolution mechanisms dysfunctional

Statewise Distribution of the Cost of Road Construction
2005-06 Average Contract Cost Per Km(in Rs. Crs.)
8.4
7.2
6.56.1 6.1
5.5
5.0
4.54.1
3.8
7.6
3.7
0.0
1.0
2.0
3.0
4.0
5.0
6.0
7.0
8.0
9.0
Bihar
Assam
Wes
t Ben
gal
Punjab
Uttar P
rades
hRaja
sthan
Tamil N
adu
Punjab
/HP
J&K MP
Mahara
shtra
Gujarat
Average Contract Cost Per Km in 2005-2006 (in Rs. Crs.)

A Sampling of Land Acquisition Delays
Agreed Time Frame vs Actual Time taken
0
5
10
15
20
25
30
35
40
45
50
55
60
65
IA IB IC II-A II-B II-C IIIC IV-A IV-C IV-D VA* VB* VC* ABP I & II ABP III ADB
Agreed Time frame Actual Time taken
Contract Packages

Mobilizing Private FinancingCapacity Building for PPPs
• National Highways Development Program– NHDP I&II (5-10% on PPP);– NHDP III onwards (100% PPP)– Remaining program costs in excess of Rs 175,000 Cr
• National Maritime Development Program– NMDP Rs. 58,000 Cr (60% through PPP)
• Railways Rs 240,000 Cr program (60% through PPP)• No country has achieved this level of PPP. While targets
ambitious India positioned to do better than others

Who are the Key Players –Accountability/Transparency

Key Players in TransportTransport sector involves a diversity of govt. agencies• At the centre Plan Com, Ministries of Aviation, MoSRTH,
Rural Dev, Commerce, Railways, Environment• Airports Auth, National Highways Auth, National Rural
Roads Dev. Agency, Port Trusts, Inland Waterway Auth• State Departments of Transport, Public Works, Rural
Works, Maritime Boards, State Transport Undertakings• Municipal level – Municipal Corporations, Traffic Police,
Health Services, Metro Rail Corporations• Panchayat level – Panchayati Raj InstitutionsEach must play its role to deliver efficient transport
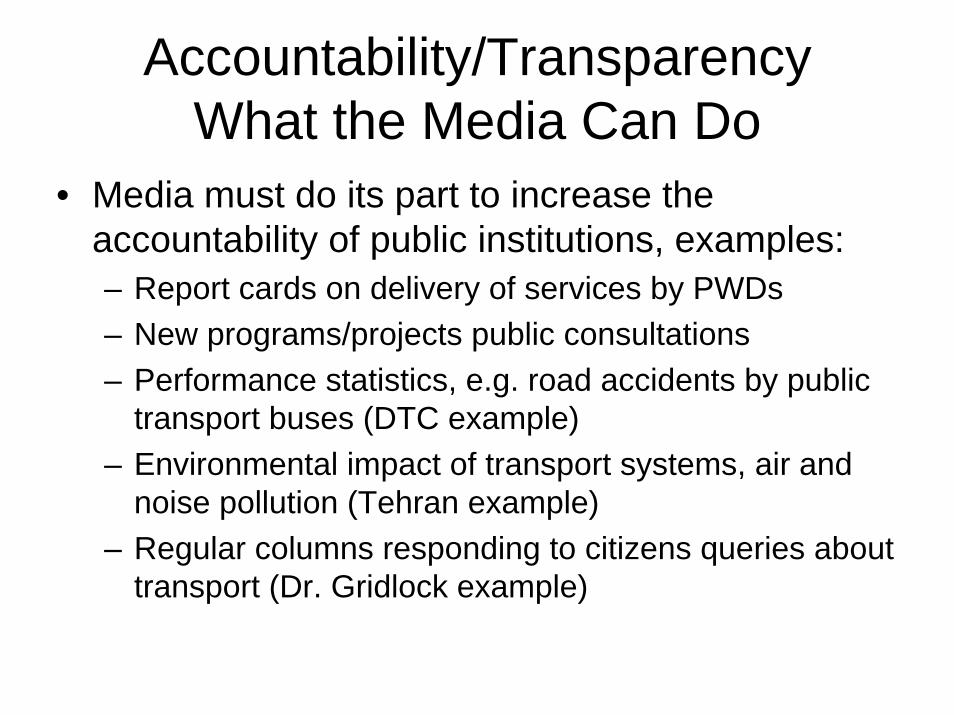
Accountability/TransparencyWhat the Media Can Do
• Media must do its part to increase the accountability of public institutions, examples:– Report cards on delivery of services by PWDs– New programs/projects public consultations– Performance statistics, e.g. road accidents by public
transport buses (DTC example)– Environmental impact of transport systems, air and
noise pollution (Tehran example)– Regular columns responding to citizens queries about
transport (Dr. Gridlock example)

Thank You! World Bank India Transport Website
www.worldbank.org/sartransport