indicator c3 - oecd c3 (eng).pdf · indicator c3 how many students ... • entry rates into...
TRANSCRIPT
2014
Education at a Glance 2014OECD inDiCatOrs
Education at a Glance 2014: OECD IndicatorsFor more information on Education at a Glance 2014 and to access
the full set of Indicators, visit www.oecd.org/edu/eag.htm.
This work is published on the responsibility of the Secretary-General of the OECD. The opinions expressed and arguments employed herein do not necessarily reflect the official views of the Organisation or of the governments of its member countries.
This document and any map included herein are without prejudice to the status of or sovereignty over any territory, to the delimitation of international frontiers and boundaries and to the name of any territory, city or area.
You can copy, download or print OECD content for your own use, and you can include excerpts from OECD publications, databases and multimedia products in your own documents, presentations, blogs, websites and teaching materials, provided that suitable acknowledgement of OECD as source and copyright owner is given. All requests for public or commercial use and translation rights should be submitted to [email protected]. Requests for permission to photocopy portions of this material for public or commercial use shall be addressed directly to the Copyright Clearance Center (CCC) at [email protected] or the Centre français d’exploitation du droit de copie (CFC) at [email protected].
Indicator C3How many students are expected
to enter tertiary education?
Please cite this Indicator as:
OECD (2014), “Indicator C3: How many students are expected to enter tertiary education?”, in Education at a Glance 2014: OECD Indicators, OECD Publishing.http://dx.doi.org/10.1787/888933118485

IndIcator C3
Education at a Glance 2014: OECD Indicators © OECD 2014330
How many students are expected to enter tertiary education?
• While some 58% of young adults in OECD countries are expected to enter tertiary-type A (largely theory-based) programmes over their lifetime, less than 3% are expected to enter advanced research programmes.
• The most popular fields of education chosen by new entrants into tertiary programmes are social sciences, business and law in all OECD countries except Finland (engineering, manufacturing and construction), Korea (humanities, arts and education) and Saudi Arabia (humanities, arts and education).
• Entry rates into tertiary-type A programmes are still higher for women (65%) than for men (52%), on average across OECD countries. But the higher the level of education, the narrower the gender gap; in advanced research programmes, the gap almost disappears.
Chart C3.1. Entry rates into tertiary-type A education (2012)
100
80
60
40
20
0
%
Aus
tral
iaLa
tvia
1
Icel
and1
Pola
ndN
ew Z
eala
ndN
orw
aySl
oven
iaD
enm
ark
Uni
ted
Stat
es1,
2
Russ
ian
Fede
ratio
n1, 3
Kor
ea1
Uni
ted
Kin
gdom
Finl
and1
Net
herl
ands
Port
ugal
Slov
ak R
epub
licSw
eden
Isra
el1
Czec
h R
epub
licA
rgen
tina
1, 4
Saud
i Ara
bia
OEC
D a
vera
geIr
elan
dH
unga
ry1
Ger
man
yA
ustr
iaSp
ain
Japa
n1, 3
Chi
leIt
aly1
Swit
zerl
and
Esto
nia1
Fran
ce1
Turk
ey1
Gre
ece1
Mex
ico1
Belg
ium
1
Luxe
mbo
urg1
Indo
nesi
a1
Chi
na1,
3
Aus
tral
iaLa
tvia
1
Icel
and1
Pola
ndN
ew Z
eala
ndN
orw
aySl
oven
iaD
enm
ark
Uni
ted
Stat
es1,
2
Kor
ea1
Uni
ted
Kin
gdom
Finl
and1
Net
herl
ands
Port
ugal
Slov
ak R
epub
licSw
eden
Isra
el1
Czec
h R
epub
licA
rgen
tina
1, 4
OEC
D a
vera
geIr
elan
dH
unga
ry1
Ger
man
yA
ustr
iaSp
ain
Chi
leIt
aly1
Swit
zerl
and
Esto
nia1
Fran
ce1
Turk
ey1
Gre
ece1
Mex
ico1
Belg
ium
1
Luxe
mbo
urg1
Indo
nesi
a1
1. New entrants data for international students are missing.2. �e entry rates for tertiary-type A programmes include the entry rates for tertiary-type B programmes.3. New entrants data by age are missing. 4. Year of reference 2011.Countries are ranked in descending order of entry rates for tertiary-type A programmes in 2012.Source: OECD. Tables C3.1a and C3.1b. See Annex 3 for notes (www.oecd.org/edu/eag.htm).
All students Excluding international students
Students below age 25 Students below age 25, excluding international students 100
80
60
40
20
0
%
1 2 http://dx.doi.org/10.1787/888933118580
contextEntry rates estimate the proportion of people who are expected to enter a specific type of tertiary education programme during their lifetime. They also provide some indication of the accessibility of tertiary education, the perceived value of attending tertiary programmes, and the degree to which a population is acquiring the high-level skills and knowledge that can create and fuel knowledge-based economies. High entry and enrolment rates in tertiary education imply that a highly educated labour force is being developed and maintained.
IndIcator C3
Education at a Glance 2014: OECD Indicators © OECD 2014 331
In OECD countries, the belief that skills acquired through higher education are valued more than those held by people with lower educational attainment stems from the perception, both real and feared, that “routine” jobs can be performed instead in low-wage countries or mechanised, and from the growing understanding that knowledge and innovation are key to sustaining economic growth. Tertiary institutions not only have to meet growing demand by expanding the number of places they offer, they also have to adapt programmes and teaching methods to match the diverse needs of a new generation of students.
other findings• While one in 20 students is expected to enter an advanced research programme over their
lifetime in Germany and Switzerland, only one in 100 students is expected to do so in Japan, and even fewer in Argentina, Chile, Indonesia, Luxembourg and Mexico.
• Based on current patterns, it is estimated that an average of 18% of today’s young adults (20% of women and 17% of men) will enter tertiary-type B (shorter and largely vocational) programmes over their lifetime.
• When international students are excluded from the calculation, Poland and Slovenia are the only two countries (out of 17 countries with available data) where around seven out of 10 young adults are expected to enter tertiary-type A education before they are 25 years old.
• Lifelong learning is not yet a reality in all OECD countries. At one extreme, in Australia, Chile, Finland, Iceland, Israel, New Zealand and Sweden, more than 1 in 4 new entrants will enter tertiary-type A programmes after the age of 25. At the other end of the spectrum, fewer than 1 in 20 new entrants in Belgium and France will be older than 25.
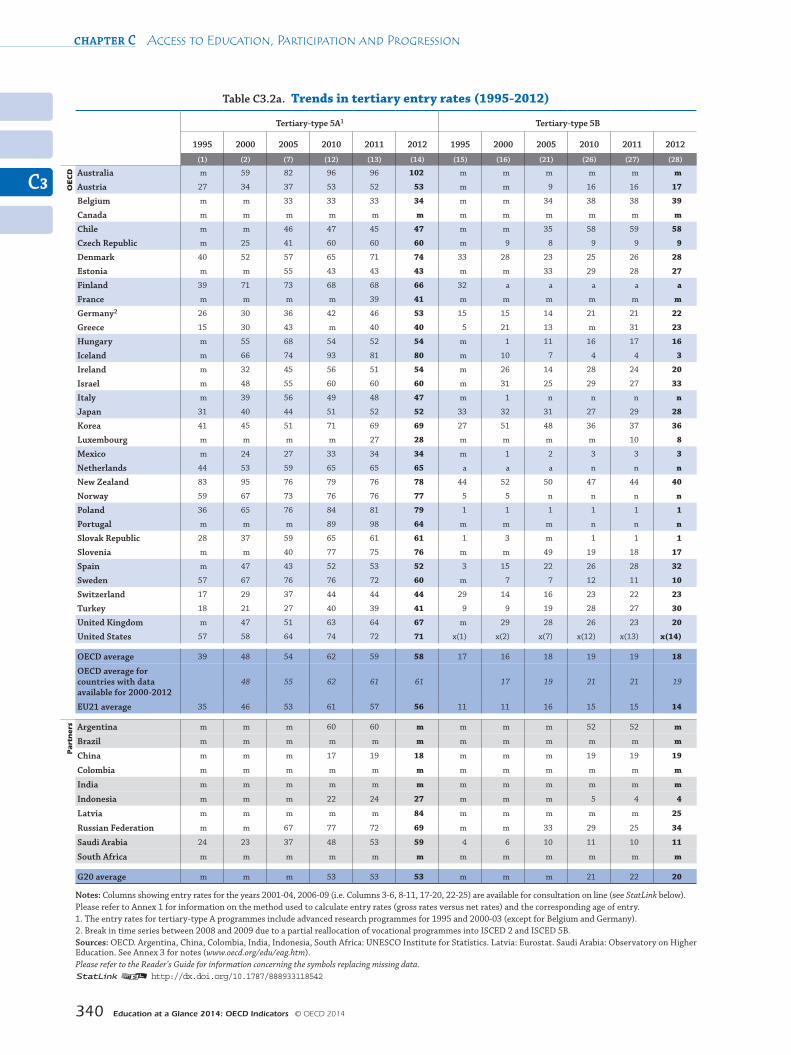
trendsBetween 1995 and 2012, entry rates into tertiary-type A programmes increased by almost 20 percentage points, on average across OECD countries, although this year, new data reveal a marked decrease of 4 percentage points since 2010, probably caused by the financial crisis. Nonetheless, the large prior increase was the result of the greater accessibility of tertiary education in many countries, and because of structural changes in the education systems of some countries, such as the creation of new programmes (to meet labour-market needs) or shorter programmes (a results of the implementation of the Bologna Process). Entry rates for tertiary programmes have also increased because the source of applicants has expanded to include many more international (see Indicator C4) and older students.
Meanwhile, entry rates into tertiary-type B programmes remained stable between 1995 and 2012, with no significant variation over the past three years in relation to the financial crisis.
noteEntry rates represent the percentage of an age cohort that is expected to enter a tertiary programme over a lifetime. This estimate is based on the number of new entrants in 2012 and the age distribution of this group. Therefore, the entry rates are based on a “synthetic cohort” assumption, according to which the current pattern of entry constitutes the best estimate of the behaviour of today’s young adults over their lifetime. Entry rates are sensitive to changes in the education system, such as the introduction of new programmes (as with the implementation of the Bologna Process) or a variation in the number of international students. Entry rates can be very high, and even greater than 100% (thus clearly indicating that the synthetic cohort assumption is implausible), during a period when there are unexpected entries. In Australia, for example, the entry rate into tertiary-type A programmes is reduced by more than 25 percentage points when international students are excluded. In Portugal, a large number of women over 25 decided to pursue a university education, so entry rates among women increased by 40 percentage points from 2007 to 2011.
chapter C Access to Education, Participation and Progression
C3
Education at a Glance 2014: OECD Indicators © OECD 2014332
analysis
Overall access to tertiary education
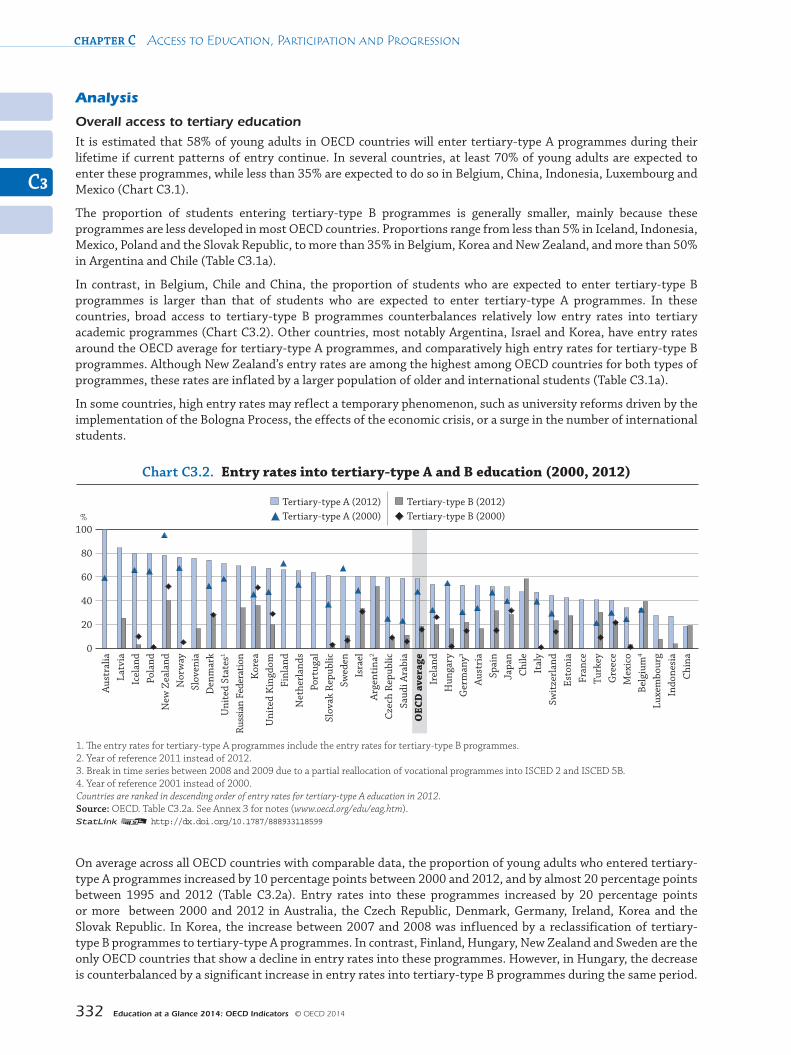
It is estimated that 58% of young adults in OECD countries will enter tertiary-type A programmes during their lifetime if current patterns of entry continue. In several countries, at least 70% of young adults are expected to enter these programmes, while less than 35% are expected to do so in Belgium, China, Indonesia, Luxembourg and Mexico (Chart C3.1).
The proportion of students entering tertiary-type B programmes is generally smaller, mainly because these programmes are less developed in most OECD countries. Proportions range from less than 5% in Iceland, Indonesia, Mexico, Poland and the Slovak Republic, to more than 35% in Belgium, Korea and New Zealand, and more than 50% in Argentina and Chile (Table C3.1a).
In contrast, in Belgium, Chile and China, the proportion of students who are expected to enter tertiary-type B programmes is larger than that of students who are expected to enter tertiary-type A programmes. In these countries, broad access to tertiary-type B programmes counterbalances relatively low entry rates into tertiary academic programmes (Chart C3.2). Other countries, most notably Argentina, Israel and Korea, have entry rates around the OECD average for tertiary-type A programmes, and comparatively high entry rates for tertiary-type B programmes. Although New Zealand’s entry rates are among the highest among OECD countries for both types of programmes, these rates are inflated by a larger population of older and international students (Table C3.1a).
In some countries, high entry rates may reflect a temporary phenomenon, such as university reforms driven by the implementation of the Bologna Process, the effects of the economic crisis, or a surge in the number of international students.
Chart C3.2. Entry rates into tertiary-type A and B education (2000, 2012)
1 2 http://dx.doi.org/10.1787/888933118599
100
80
60
40
20
0
%
Aus
tral
iaLa
tvia
Icel
and
Pola
ndN
ew Z
eala
ndN
orw
aySl
oven
iaD
enm
ark
Uni
ted
Stat
es1
Russ
ian
Fede
ratio
nK
orea
Uni
ted
Kin
gdom
Finl
and
Net
herl
ands
Port
ugal
Slov
ak R
epub
licSw
eden
Isra
elA
rgen
tina
2
Czec
h R
epub
licSa
udi A
rabi
aO
ECD
ave
rage
Irel
and
Hun
gary
Ger
man
y3
Aus
tria
Spai
nJa
pan
Chi
leIt
aly
Swit
zerl
and
Esto
nia
Fran
ceTu
rkey
Gre
ece
Mex
ico
Belg
ium
4
Luxe
mbo
urg
Indo
nesi
aC
hina
1. �e entry rates for tertiary-type A programmes include the entry rates for tertiary-type B programmes.2. Year of reference 2011 instead of 2012.3. Break in time series between 2008 and 2009 due to a partial reallocation of vocational programmes into ISCED 2 and ISCED 5B.4. Year of reference 2001 instead of 2000.Countries are ranked in descending order of entry rates for tertiary-type A education in 2012.Source: OECD. Table C3.2a. See Annex 3 for notes (www.oecd.org/edu/eag.htm).
Tertiary-type A (2012) Tertiary-type B (2012)Tertiary-type B (2000)Tertiary-type A (2000)
On average across all OECD countries with comparable data, the proportion of young adults who entered tertiary-type A programmes increased by 10 percentage points between 2000 and 2012, and by almost 20 percentage points between 1995 and 2012 (Table C3.2a). Entry rates into these programmes increased by 20 percentage points or more between 2000 and 2012 in Australia, the Czech Republic, Denmark, Germany, Ireland, Korea and the Slovak Republic. In Korea, the increase between 2007 and 2008 was influenced by a reclassification of tertiary-type B programmes to tertiary-type A programmes. In contrast, Finland, Hungary, New Zealand and Sweden are the only OECD countries that show a decline in entry rates into these programmes. However, in Hungary, the decrease is counterbalanced by a significant increase in entry rates into tertiary-type B programmes during the same period.
C3
How many students are expected to enter tertiary education? – IndICator C3 chapter C
Education at a Glance 2014: OECD Indicators © OECD 2014 333
In New Zealand, the rise and fall of entry rates between 2000 and 2012 mirrored the numbers of international students over the same period (Chart C3.2).
Among OECD countries, overall net entry rates into tertiary-type B programmes between 2000 and 2012 have remained relatively stable except in Hungary, Spain and Turkey, where they have increased by more than 10 percentage points, and in Korea and New Zealand, where they have decreased by more than 10 percentage points (Chart C3.2).
Roughly 3% of today’s young adults in OECD countries are expected to enter advanced research programmes during their lifetime, if current patterns of entry remain stable. Among countries with available data, the proportions range from 1% or less in Argentina, Chile, Indonesia, Japan, Luxembourg and Mexico, to around 5% in Germany and Switzerland (Table C3.1a).
Age of new entrants into tertiary education
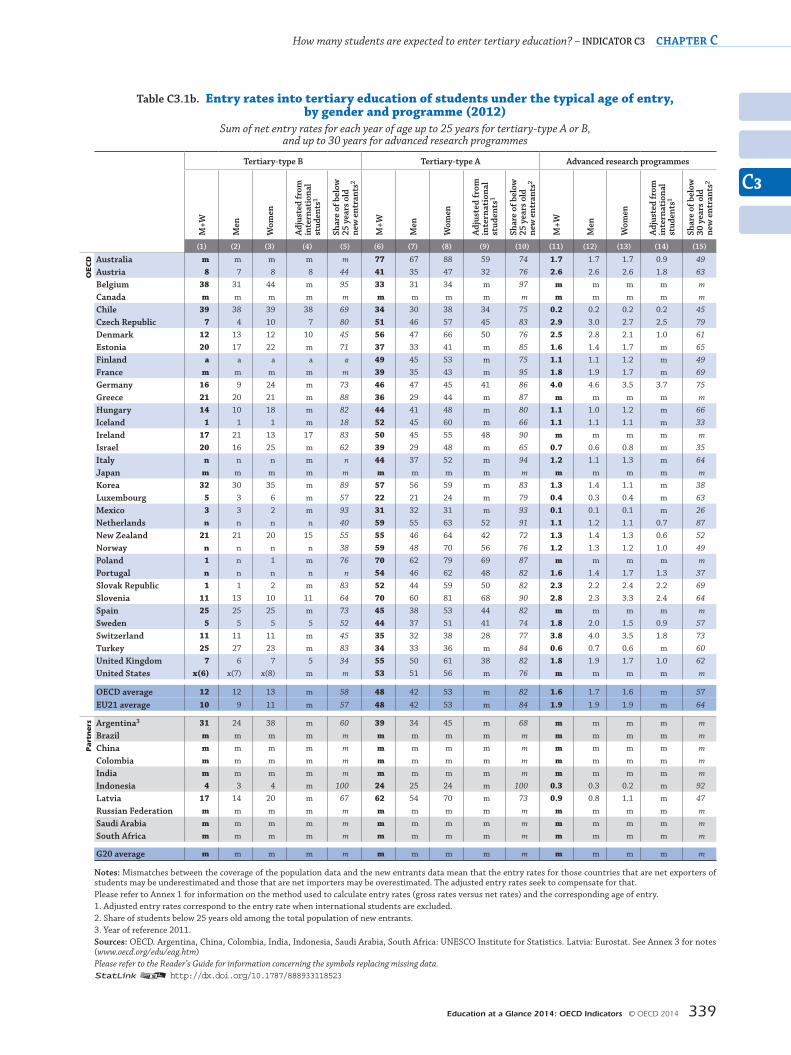
On average across OECD countries, 82% of all first-time entrants into tertiary-type A programmes and 58% of first-time entrants into tertiary-type B programmes in 2012 were under 25 years of age. In addition, 57% of students who entered advanced research programmes in 2012 were under 30 (Table C3.1b).
The age of new entrants into tertiary education varies among OECD countries because of differences in the typical age at which students graduate from upper secondary education (see Tables X1.1a and X1.1b), the intake capacity of institutions (admissions with numerus clausus, one of many methods used to limit the number of students who may study at a tertiary institution), the opportunity cost of entering the labour market before enrolling in tertiary education, and cultural expectations.
During the recent economic crisis, some young people postponed entry into the labour market and remained in education. Some governments have also developed second-chance programmes, aimed at people who left school early, to raise the level of skills available in the workforce and increase opportunities for people to acquire practical education and competencies. Nevertheless, entering tertiary education at a later stage is more costly from both public and personal perspectives. It means that for a period of time, the productive potential of individuals is untapped. As a result, tax revenues are lower and public expenditures may be higher. Older students may face more difficulties combining work and study and thus may be unable to complete the programmes on time. Understanding that delays in completing education increase the cost of providing it, governments are introducing measures to foster timely completion. However, a later start to tertiary education may also indicate that students are more sure about what they want to study and are more motivated.
Traditionally, students enter tertiary programmes immediately after having completed upper secondary education, and this remains true in many countries. For example, in Belgium, France and Indonesia, 95% or more of all first-time entrants into tertiary-type A or B programmes are under 25. In other OECD countries, the transition from upper secondary to tertiary education may occur at a later age because of time spent in the labour force or the military. For instance, in Israel only two-thirds of all first-time entrants into tertiary-type A programmes are under 25. In these cases, first-time entrants into tertiary-type A or B programmes represent a much wider age range (Table C3.1b).
The proportion of older first-time entrants into tertiary-type A and B programmes may reflect the flexibility of the programmes and their suitability to students outside the typical age group. It may also reflect the value placed on work experience before entering higher education, which is characteristic of the Nordic countries and is also common in Australia, Austria, Chile, Hungary, New Zealand and the United States, where sizeable proportions of new entrants are much older than the typical age at entry. It can also reflect a response to policies aimed at expanding lifelong learning and more flexible access to tertiary education. The reasons differ substantially from one country to another. For instance, in Australia, taking a gap year before entering tertiary education has become a trend: in 2009-10 almost one in four students took a gap year, and 51% of them declared “work” as their main reason for taking the year off from education (Lumsden and Stanwick, 2012). Some countries require young people to serve in the military, which postpones entry into tertiary education. This is the case of Israel, which has mandatory military service for 18-21 year-old men and 18-20 year-old women.
Impact of international students on entry rates into tertiary-type A programmes
By definition, all international students enrolling for the first time in a country are counted as new entrants, regardless of their previous education in other countries. To highlight the impact of international students on entry rates into tertiary-type A programmes, both unadjusted and adjusted entry rates (i.e. the entry rate when international students are excluded from consideration) are presented in Tables C3.1a and b.
chapter C Access to Education, Participation and Progression
C3
Education at a Glance 2014: OECD Indicators © OECD 2014334
In Australia, the difference between the unadjusted and adjusted entry rates is 26 percentage points – the largest among all countries with comparable data. It is also very high in the United Kingdom, with a 24 percentage points difference. In Austria, Iceland, New Zealand and Switzerland, the presence of international students also affects entry rates greatly, with differences from 11 to 17 percentage points (Table C3.1a).
The percentage of expected new entrants into tertiary-type A education changes dramatically when older and international students are not considered. These two groups are important components of the student population in countries, but they can artificially inflate the expected proportion of today’s young adults who will enter a tertiary programme. When international and older students are not counted, Poland and Slovenia become the two countries with the largest proportion of people who are expected to enter tertiary-type A education under the age of 25. The large proportion in Poland is related to the greater number of students who graduated from upper secondary programmes as a result of the 1999 education reforms in that country. Those reforms aimed to improve the quality of the country’s secondary and higher education systems and offer equitable education opportunities. Poland and Slovenia are also two of the six countries with the highest percentage of 25-34 year-olds that has attained at least an upper secondary education (see Indicator A1).
Pathways between academic and vocational programmes In some countries, tertiary-type A and B programmes are provided by different types of institutions. However, it is increasingly common for universities or other institutions to offer both types of programmes. The two types of programmes are also gradually becoming more similar in terms of curriculum, orientation and learning outcomes.
In some countries, graduates from tertiary-type B programmes can gain entry into tertiary-type A programmes, usually in the second or third year, or even into a master’s programme. Adding together entry rates into these two types of programmes to obtain overall tertiary-level entry rates would result in over-counting. Entry is typically subject to certain conditions, such as passing a special examination, prior personal or professional achievements, and/or completion of a “bridging” programme, depending on the country or programme. In some cases, students who leave an academic programme before graduating can be successfully re-oriented towards vocational programmes.
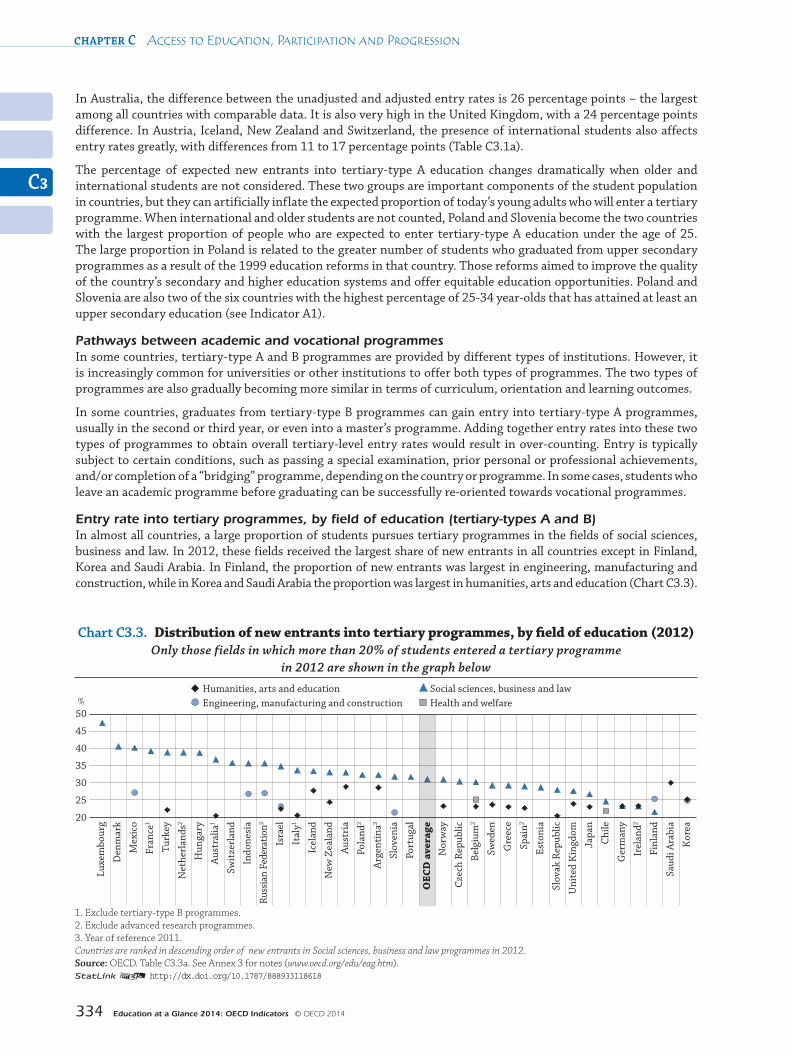
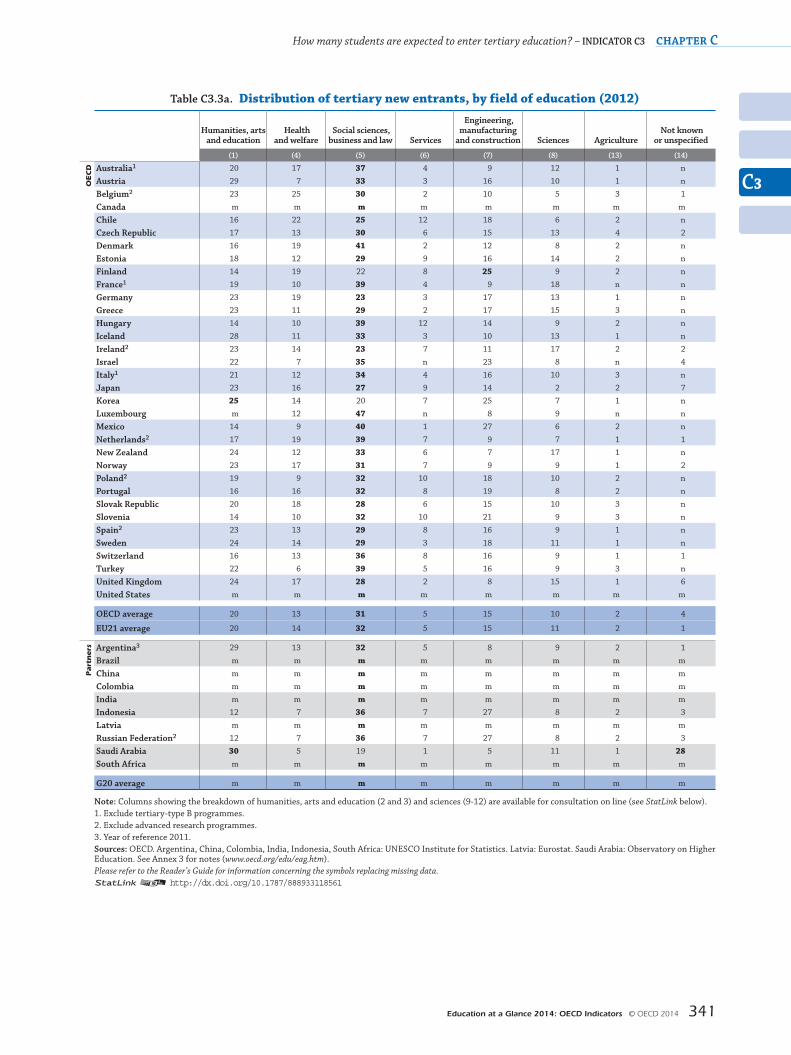
Entry rate into tertiary programmes, by field of education (tertiary-types A and B)In almost all countries, a large proportion of students pursues tertiary programmes in the fields of social sciences, business and law. In 2012, these fields received the largest share of new entrants in all countries except in Finland, Korea and Saudi Arabia. In Finland, the proportion of new entrants was largest in engineering, manufacturing and construction, while in Korea and Saudi Arabia the proportion was largest in humanities, arts and education (Chart C3.3).
Chart C3.3. Distribution of new entrants into tertiary programmes, by field of education (2012) Only those fields in which more than 20% of students entered a tertiary programme
in 2012 are shown in the graph below
1 2 http://dx.doi.org/10.1787/888933118618
50
45
40
35
30
25
20
%
Luxe
mbo
urg
Den
mar
k
Mex
ico
Fran
ce1
Turk
ey
Net
herl
ands
2
Hun
gary
Aus
tral
ia1
Swit
zerl
and
Indo
nesi
a
Russ
ian
Fede
ratio
n2
Isra
el
Ital
y1
Icel
and
New
Zea
land
Aus
tria
Pola
nd2
Arg
enti
na3
Slov
enia
Port
ugal
OEC
D a
vera
geN
orw
ay
Czec
h R
epub
lic
Belg
ium
2
Swed
en
Gre
ece
Spai
n2
Esto
nia
Slov
ak R
epub
lic
Uni
ted
Kin
gdom
Japa
n
Chi
le
Ger
man
y
Irel
and2
Finl
and
Saud
i Ara
bia
Kor
ea
1. Exclude tertiary-type B programmes.2. Exclude advanced research programmes. 3. Year of reference 2011.Countries are ranked in descending order of new entrants in Social sciences, business and law programmes in 2012.Source: OECD. Table C3.3a. See Annex 3 for notes (www.oecd.org/edu/eag.htm).
Health and welfareHumanities, arts and education Social sciences, business and law Engineering, manufacturing and construction
C3
How many students are expected to enter tertiary education? – IndICator C3 chapter C
Education at a Glance 2014: OECD Indicators © OECD 2014 335
Science-related fields, which include science and engineering, manufacturing and construction, are less popular. On average, only a quarter of all students enters these fields (Table C3.3a). This low level of participation is partly due to the under-representation of women: on average in 2012, only 14% of female new entrants into tertiary education chose these fields, compared with 39% of male new entrants. Among the new-entrant population, the proportion of women who chose science-related fields ranged from 5-6% in Belgium, Japan and the Netherlands to 19-20% in Greece, Italy, Mexico and the Russian Federation, while among men, the proportion in these fields ranged from 17% in Argentina to 58% in Finland (Table C3.3b, available on line).
The distribution of entrants into advanced research programmes by field of education shows a different pattern from that of tertiary education as a whole. Although social sciences, business and law were the most popular fields of education among tertiary students in 2012, doctoral students favoured science-related fields slightly more than social science, business and law. Almost one in four new doctoral students undertook studies in sciences (24%) – more than double the proportion of new tertiary entrants who chose this field (10%). In France, Israel and Luxembourg, more than 35% of advanced research students chose science.
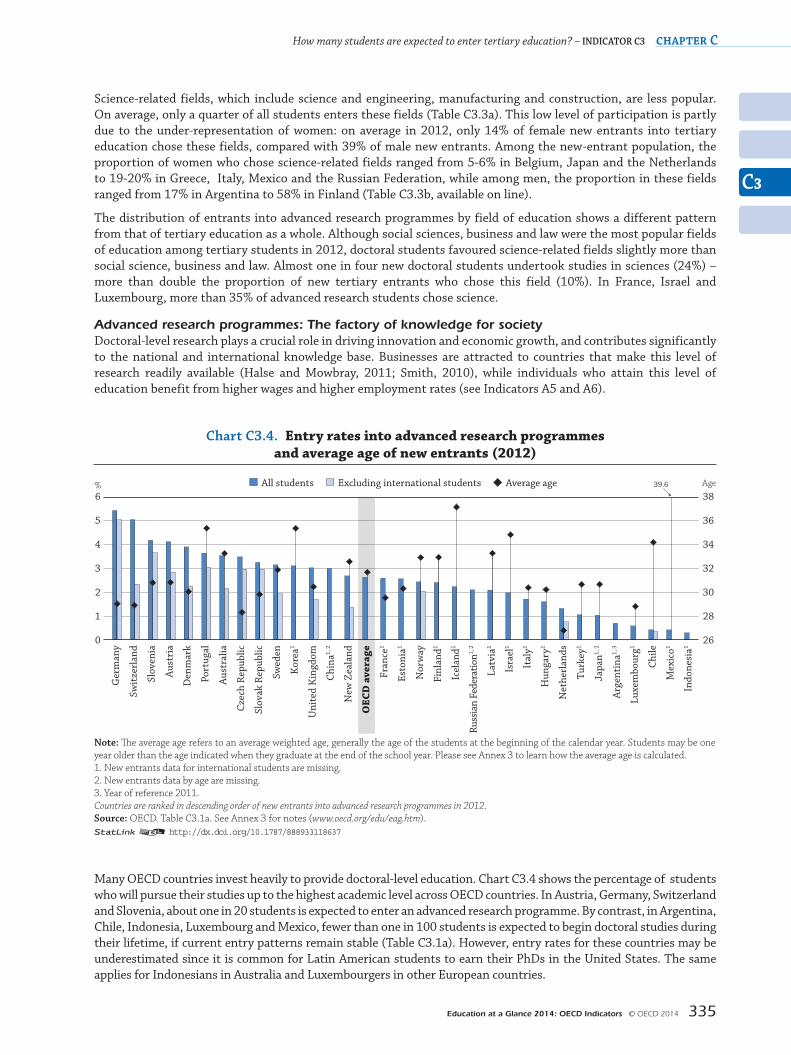
Advanced research programmes: The factory of knowledge for society Doctoral-level research plays a crucial role in driving innovation and economic growth, and contributes significantly to the national and international knowledge base. Businesses are attracted to countries that make this level of research readily available (Halse and Mowbray, 2011; Smith, 2010), while individuals who attain this level of education benefit from higher wages and higher employment rates (see Indicators A5 and A6).
Chart C3.4. Entry rates into advanced research programmes and average age of new entrants (2012)
1 2 http://dx.doi.org/10.1787/888933118637
6
5
4
3
2
1
0
%38
36
34
32
30
28
26
Age
Ger
man
y
Swit
zerl
and
Slov
enia
Aus
tria
Den
mar
k
Port
ugal
Aus
tral
ia
Czec
h R
epub
lic
Slov
ak R
epub
lic
Swed
en
Kor
ea1
Uni
ted
Kin
gdom
Chi
na1,
2
New
Zea
land
OEC
D a
vera
ge
Fran
ce1
Esto
nia1
Nor
way
Finl
and1
Icel
and1
Russ
ian
Fede
ratio
n1, 2
Latv
ia1
Isra
el1
Ital
y1
Hun
gary
1
Net
herl
ands
Turk
ey1
Japa
n1, 2
Arg
enti
na1,
3
Luxe
mbo
urg1
Chi
le
Mex
ico1
Indo
nesi
a1
Note: �e average age refers to an average weighted age, generally the age of the students at the beginning of the calendar year. Students may be one year older than the age indicated when they graduate at the end of the school year. Please see Annex 3 to learn how the average age is calculated.1. New entrants data for international students are missing.2. New entrants data by age are missing.3. Year of reference 2011.Countries are ranked in descending order of new entrants into advanced research programmes in 2012.Source: OECD. Table C3.1a. See Annex 3 for notes (www.oecd.org/edu/eag.htm).
Excluding international studentsAll students Average age 39.6
Many OECD countries invest heavily to provide doctoral-level education. Chart C3.4 shows the percentage of students who will pursue their studies up to the highest academic level across OECD countries. In Austria, Germany, Switzerland and Slovenia, about one in 20 students is expected to enter an advanced research programme. By contrast, in Argentina, Chile, Indonesia, Luxembourg and Mexico, fewer than one in 100 students is expected to begin doctoral studies during their lifetime, if current entry patterns remain stable (Table C3.1a). However, entry rates for these countries may be underestimated since it is common for Latin American students to earn their PhDs in the United States. The same applies for Indonesians in Australia and Luxembourgers in other European countries.

chapter C Access to Education, Participation and Progression
C3
Education at a Glance 2014: OECD Indicators © OECD 2014336
Several countries are developing doctoral programmes or changing the funding policy to attract international students, that is, students who move from their country of origin to study elsewhere. Attracting the best students from around the world helps to ensure that a country plays a leading role in research and innovation (Smith, 2010). For example, more than one in two new entrants into doctoral programmes in Switzerland are international students (Chart C3.4). In addition, as Indicator C4 shows, in 2012, large proportions of students enrolled in doctoral programmes in New Zealand (41%), Switzerland (51%) and the United Kingdom (41%) were international students, that is, they were citizens of a different country than the one in which the data were collected.
Although almost 60% of new students in advanced research programmes in OECD countries entered before the age of 30, there are quite significant differences among countries. In the Czech Republic, Germany, Indonesia and the Netherlands more than 75% of students are younger than 30 when they enter this level of education, while in Iceland, Israel, Korea, Mexico and Portugal, the average age at entry is 35 or older (Tables C3.1a and b).
These differences may be due to several factors. They could reflect lower dropout rates and greater emphasis on acquiring specialised skills with a first degree in tertiary education. Some countries offer incentives, such as grants, scholarships, international mobility programmes, part-time jobs and distance learning, to encourage students to pursue advanced studies straight after completion of their first degree in tertiary education. By contrast, late entry into doctoral programmes could be related to differences in tuition fees, availability of scholarships, and/or cultural expectations, such as being expected to enter the labour force by a certain age or to gain professional experience prior to entering a PhD programme.
The doctoral level of education is the only level with near gender parity. While there are proportionally more women than men at all other levels of education, this is the only level of education at which the proportion of entrants (and consequently the proportion of graduates) is slightly larger among men than women. On average across OECD countries, 2.7% of men and 2.6% of women enter a doctoral programme (Table C3.1a).
definitionsInternational students are those students who left their country of origin and moved to another country for the purpose of study. International students enrolling for the first time in a programme are considered first-time entrants.
New entrants are students who enrol at the relevant level of education for the first time.
Tertiary-level entry rate is an estimated probability, based on current entry patterns, that a young adult will enter tertiary education during his or her lifetime.
methodologyData refer to the academic year 2011/12 and are based on the UOE data collection on education statistics administered by the OECD in 2013 (for details, see Annex 3 at www.oecd.org/edu/eag.htm). The fields of education used in the UOE data collection instruments follow the revised ISCED 97 classification by field of education. The same classification is used for all levels of education.
Data on trends in entry rates (Table C3.2a) for the years 1995, 2000, 2001, 2002, 2003 and 2004 are based on a special survey carried out in OECD countries in January 2007.
Data on the impact of international students on tertiary entry rates are based on a special survey carried out by the OECD in December 2013.
Tables C3.1a and b, and C.3.2a and b show the sum of net entry rates for all ages.
The net entry rate for a specific age is obtained by dividing the number of first-time entrants of that age for each type of tertiary education by the total population in the corresponding age group. The sum of net entry rates is calculated by adding the rates for each year of age. The result represents an estimate of the probability that a young person will enter tertiary education in his/her lifetime if current age-specific entry rates continue.
The average weighted age of entry is calculated by assigning higher weight to those ages at which the number of students entering a new level is higher. This variable gives the reader an accurate idea of the average age of entry. Please refer to Annex 3 to learn more about it.
Not all countries differentiate between students entering a tertiary programme for the first time and those transferring between different levels of tertiary education or repeating or re-entering a level after an absence. Thus, first-time entry rates for tertiary-type A or tertiary-type B programmes cannot be added to form a total tertiary-level entrance rate because it would result in counting some entrants twice.
C3
How many students are expected to enter tertiary education? – IndICator C3 chapter C
Education at a Glance 2014: OECD Indicators © OECD 2014 337
Note regarding data from Israel
The statistical data for Israel are supplied by and are under the responsibility of the relevant Israeli authorities. The use of such data by the OECD is without prejudice to the status of the Golan Heights, East Jerusalem and Israeli settlements in the West Bank under the terms of international law.
ReferencesHalse C. and S. Mowbray (2011), “The impact of the doctorate”, Studies in Higher Education, Vol. 5, No. 36, pp. 513-525, www.tandfonline.com/doi/abs/10.1080/03075079.2011.594590.
Lumsden, M. and J. Stanwick (2012), “Who takes a gap year and why?”, Longitudinal Surveys Of Australian Youth, Briefing Paper 28, National Centre for Vocational Education Research (NCVER), Adelaide.
OECD (2013), Education at a Glance 2013: OECD Indicators, OECD Publishing, Paris, http://dx.doi.org/10.1787/eag-2013-en.
Smith, A. (2010), “One step beyond: making the most of postgraduate education”, Report for UK Department for Business, Innovation and Skills.
tables of indicator c31 2 http://dx.doi.org/10.1787/888933118485
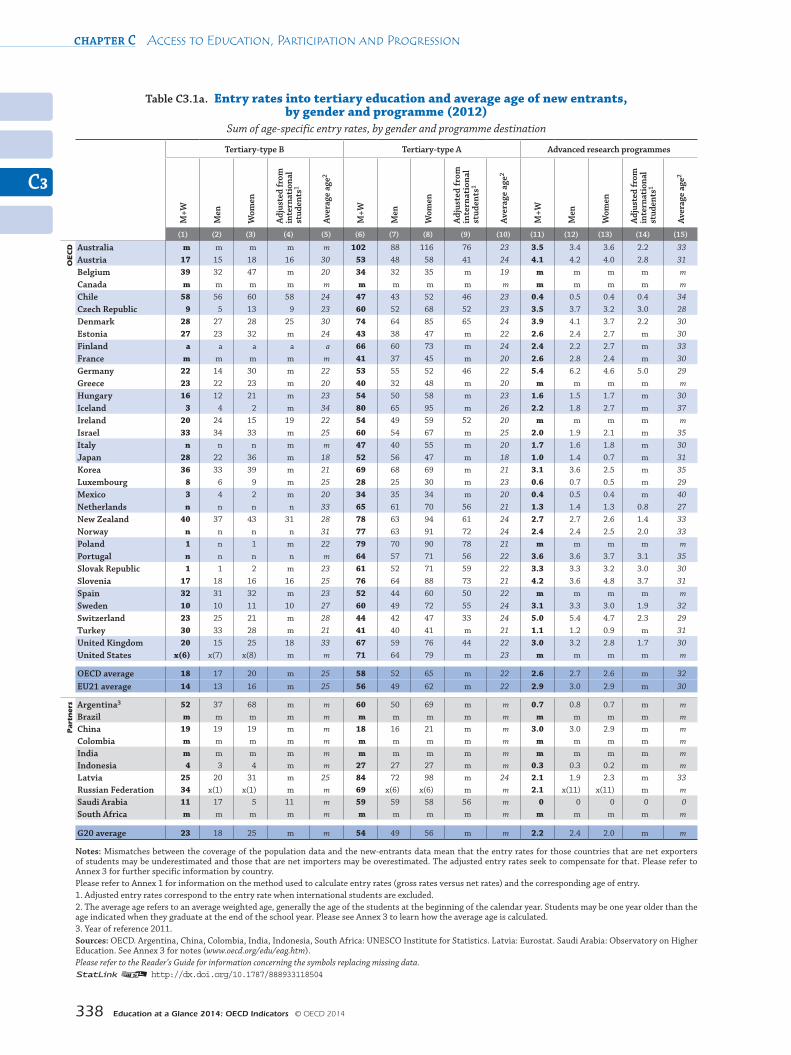
Table C3.1a Entry rates into tertiary education and average age of new entrants, by gender and programme (2012)
Table C3.1b Entry rates into tertiary education of students under the typical age of entry, by gender and programme (2012)
Table C3.2a Trends in tertiary entry rates (1995-2012)
Web Table C3.2b Trends in tertiary entry rates, by gender (2005-2012)
Table C3.3a Distribution of tertiary new entrants, by field of education (2012)
Web Table C3.3b Distribution of tertiary new entrants, by field of education and gender (2012)
Web Table C3.3c Distribution of new entrants into advanced research programmes, by field of education (2012)
chapter C Access to Education, Participation and Progression
C3
Education at a Glance 2014: OECD Indicators © OECD 2014338
Table C3.1a. Entry rates into tertiary education and average age of new entrants, by gender and programme (2012)
Sum of age-specific entry rates, by gender and programme destination
Tertiary-type B Tertiary-type A Advanced research programmes
M+W
Men
Wom
en
Adj
uste
d fr
om
inte
rnat
iona
l st
uden
ts1
Aver
age
age2
M+W
Men
Wom
en
Adj
uste
d fr
om
inte
rnat
iona
l st
uden
ts1
Aver
age
age2
M+W
Men
Wom
en
Adj
uste
d fr
om
inte
rnat
iona
l st
uden
ts1
Aver
age
age2
(1) (2) (3) (4) (5) (6) (7) (8) (9) (10) (11) (12) (13) (14) (15)
oecd Australia m m m m m 102 88 116 76 23 3.5 3.4 3.6 2.2 33
Austria 17 15 18 16 30 53 48 58 41 24 4.1 4.2 4.0 2.8 31 Belgium 39 32 47 m 20 34 32 35 m 19 m m m m m Canada m m m m m m m m m m m m m m m Chile 58 56 60 58 24 47 43 52 46 23 0.4 0.5 0.4 0.4 34 Czech Republic 9 5 13 9 23 60 52 68 52 23 3.5 3.7 3.2 3.0 28 Denmark 28 27 28 25 30 74 64 85 65 24 3.9 4.1 3.7 2.2 30 Estonia 27 23 32 m 24 43 38 47 m 22 2.6 2.4 2.7 m 30 Finland a a a a a 66 60 73 m 24 2.4 2.2 2.7 m 33 France m m m m m 41 37 45 m 20 2.6 2.8 2.4 m 30 Germany 22 14 30 m 22 53 55 52 46 22 5.4 6.2 4.6 5.0 29 Greece 23 22 23 m 20 40 32 48 m 20 m m m m m Hungary 16 12 21 m 23 54 50 58 m 23 1.6 1.5 1.7 m 30 Iceland 3 4 2 m 34 80 65 95 m 26 2.2 1.8 2.7 m 37 Ireland 20 24 15 19 22 54 49 59 52 20 m m m m m Israel 33 34 33 m 25 60 54 67 m 25 2.0 1.9 2.1 m 35 Italy n n n m m 47 40 55 m 20 1.7 1.6 1.8 m 30 Japan 28 22 36 m 18 52 56 47 m 18 1.0 1.4 0.7 m 31 Korea 36 33 39 m 21 69 68 69 m 21 3.1 3.6 2.5 m 35 Luxembourg 8 6 9 m 25 28 25 30 m 23 0.6 0.7 0.5 m 29 Mexico 3 4 2 m 20 34 35 34 m 20 0.4 0.5 0.4 m 40 Netherlands n n n n 33 65 61 70 56 21 1.3 1.4 1.3 0.8 27 New Zealand 40 37 43 31 28 78 63 94 61 24 2.7 2.7 2.6 1.4 33 Norway n n n n 31 77 63 91 72 24 2.4 2.4 2.5 2.0 33 Poland 1 n 1 m 22 79 70 90 78 21 m m m m m Portugal n n n n m 64 57 71 56 22 3.6 3.6 3.7 3.1 35 Slovak Republic 1 1 2 m 23 61 52 71 59 22 3.3 3.3 3.2 3.0 30 Slovenia 17 18 16 16 25 76 64 88 73 21 4.2 3.6 4.8 3.7 31 Spain 32 31 32 m 23 52 44 60 50 22 m m m m m Sweden 10 10 11 10 27 60 49 72 55 24 3.1 3.3 3.0 1.9 32 Switzerland 23 25 21 m 28 44 42 47 33 24 5.0 5.4 4.7 2.3 29 Turkey 30 33 28 m 21 41 40 41 m 21 1.1 1.2 0.9 m 31 United Kingdom 20 15 25 18 33 67 59 76 44 22 3.0 3.2 2.8 1.7 30 United States x(6) x(7) x(8) m m 71 64 79 m 23 m m m m m
OECD average 18 17 20 m 25 58 52 65 m 22 2.6 2.7 2.6 m 32
EU21 average 14 13 16 m 25 56 49 62 m 22 2.9 3.0 2.9 m 30
part
ners Argentina3 52 37 68 m m 60 50 69 m m 0.7 0.8 0.7 m m
Brazil m m m m m m m m m m m m m m m China 19 19 19 m m 18 16 21 m m 3.0 3.0 2.9 m m Colombia m m m m m m m m m m m m m m m India m m m m m m m m m m m m m m m Indonesia 4 3 4 m m 27 27 27 m m 0.3 0.3 0.2 m m Latvia 25 20 31 m 25 84 72 98 m 24 2.1 1.9 2.3 m 33 Russian Federation 34 x(1) x(1) m m 69 x(6) x(6) m m 2.1 x(11) x(11) m m Saudi Arabia 11 17 5 11 m 59 59 58 56 m 0 0 0 0 0South Africa m m m m m m m m m m m m m m m
G20 average 23 18 25 m m 54 49 56 m m 2.2 2.4 2.0 m m
Notes: Mismatches between the coverage of the population data and the new-entrants data mean that the entry rates for those countries that are net exporters of students may be underestimated and those that are net importers may be overestimated. The adjusted entry rates seek to compensate for that. Please refer to Annex 3 for further specific information by country. Please refer to Annex 1 for information on the method used to calculate entry rates (gross rates versus net rates) and the corresponding age of entry. 1. Adjusted entry rates correspond to the entry rate when international students are excluded.2. The average age refers to an average weighted age, generally the age of the students at the beginning of the calendar year. Students may be one year older than the age indicated when they graduate at the end of the school year. Please see Annex 3 to learn how the average age is calculated.3. Year of reference 2011.Sources: OECD. Argentina, China, Colombia, India, Indonesia, South Africa: UNESCO Institute for Statistics. Latvia: Eurostat. Saudi Arabia: Observatory on Higher Education. See Annex 3 for notes (www.oecd.org/edu/eag.htm).Please refer to the Reader’s Guide for information concerning the symbols replacing missing data.1 2 http://dx.doi.org/10.1787/888933118504
C3
How many students are expected to enter tertiary education? – IndICator C3 chapter C
Education at a Glance 2014: OECD Indicators © OECD 2014 339
Table C3.1b. Entry rates into tertiary education of students under the typical age of entry, by gender and programme (2012)
Sum of net entry rates for each year of age up to 25 years for tertiary-type A or B, and up to 30 years for advanced research programmes
Tertiary-type B Tertiary-type A Advanced research programmes
M+W
Men
Wom
en
Adj
uste
d fr
om
inte
rnat
iona
l st
uden
ts1
Shar
e of
bel
ow
25 y
ears
old
ne
w e
ntra
nts2
M+W
Men
Wom
en
Adj
uste
d fr
om
inte
rnat
iona
l st
uden
ts1
Shar
e of
bel
ow
25 y
ears
old
ne
w e
ntra
nts2
M+W
Men
Wom
en
Adj
uste
d fr
om
inte
rnat
iona
l st
uden
ts1
Shar
e of
bel
ow
30 y
ears
old
ne
w e
ntra
nts2
(1) (2) (3) (4) (5) (6) (7) (8) (9) (10) (11) (12) (13) (14) (15)
oecd Australia m m m m m 77 67 88 59 74 1.7 1.7 1.7 0.9 49
Austria 8 7 8 8 44 41 35 47 32 76 2.6 2.6 2.6 1.8 63 Belgium 38 31 44 m 95 33 31 34 m 97 m m m m m Canada m m m m m m m m m m m m m m m Chile 39 38 39 38 69 34 30 38 34 75 0.2 0.2 0.2 0.2 45 Czech Republic 7 4 10 7 80 51 46 57 45 83 2.9 3.0 2.7 2.5 79 Denmark 12 13 12 10 45 56 47 66 50 76 2.5 2.8 2.1 1.0 61 Estonia 20 17 22 m 71 37 33 41 m 85 1.6 1.4 1.7 m 65 Finland a a a a a 49 45 53 m 75 1.1 1.1 1.2 m 49 France m m m m m 39 35 43 m 95 1.8 1.9 1.7 m 69 Germany 16 9 24 m 73 46 47 45 41 86 4.0 4.6 3.5 3.7 75 Greece 21 20 21 m 88 36 29 44 m 87 m m m m m Hungary 14 10 18 m 82 44 41 48 m 80 1.1 1.0 1.2 m 66 Iceland 1 1 1 m 18 52 45 60 m 66 1.1 1.1 1.1 m 33 Ireland 17 21 13 17 83 50 45 55 48 90 m m m m m Israel 20 16 25 m 62 39 29 48 m 65 0.7 0.6 0.8 m 35 Italy n n n m n 44 37 52 m 94 1.2 1.1 1.3 m 64 Japan m m m m m m m m m m m m m m m Korea 32 30 35 m 89 57 56 59 m 83 1.3 1.4 1.1 m 38 Luxembourg 5 3 6 m 57 22 21 24 m 79 0.4 0.3 0.4 m 63 Mexico 3 3 2 m 93 31 32 31 m 93 0.1 0.1 0.1 m 26 Netherlands n n n n 40 59 55 63 52 91 1.1 1.2 1.1 0.7 87 New Zealand 21 21 20 15 55 55 46 64 42 72 1.3 1.4 1.3 0.6 52 Norway n n n n 38 59 48 70 56 76 1.2 1.3 1.2 1.0 49 Poland 1 n 1 m 76 70 62 79 69 87 m m m m m Portugal n n n n n 54 46 62 48 82 1.6 1.4 1.7 1.3 37 Slovak Republic 1 1 2 m 83 52 44 59 50 82 2.3 2.2 2.4 2.2 69 Slovenia 11 13 10 11 64 70 60 81 68 90 2.8 2.3 3.3 2.4 64 Spain 25 25 25 m 73 45 38 53 44 82 m m m m m Sweden 5 5 5 5 52 44 37 51 41 74 1.8 2.0 1.5 0.9 57 Switzerland 11 11 11 m 45 35 32 38 28 77 3.8 4.0 3.5 1.8 73 Turkey 25 27 23 m 83 34 33 36 m 84 0.6 0.7 0.6 m 60 United Kingdom 7 6 7 5 34 55 50 61 38 82 1.8 1.9 1.7 1.0 62 United States x(6) x(7) x(8) m m 53 51 56 m 76 m m m m m
OECD average 12 12 13 m 58 48 42 53 m 82 1.6 1.7 1.6 m 57
EU21 average 10 9 11 m 57 48 42 53 m 84 1.9 1.9 1.9 m 64
part
ners Argentina3 31 24 38 m 60 39 34 45 m 68 m m m m m
Brazil m m m m m m m m m m m m m m m China m m m m m m m m m m m m m m m Colombia m m m m m m m m m m m m m m m India m m m m m m m m m m m m m m m Indonesia 4 3 4 m 100 24 25 24 m 100 0.3 0.3 0.2 m 92 Latvia 17 14 20 m 67 62 54 70 m 73 0.9 0.8 1.1 m 47 Russian Federation m m m m m m m m m m m m m m m Saudi Arabia m m m m m m m m m m m m m m m South Africa m m m m m m m m m m m m m m m
G20 average m m m m m m m m m m m m m m m
Notes: Mismatches between the coverage of the population data and the new entrants data mean that the entry rates for those countries that are net exporters of students may be underestimated and those that are net importers may be overestimated. The adjusted entry rates seek to compensate for that.Please refer to Annex 1 for information on the method used to calculate entry rates (gross rates versus net rates) and the corresponding age of entry. 1. Adjusted entry rates correspond to the entry rate when international students are excluded.2. Share of students below 25 years old among the total population of new entrants.3. Year of reference 2011.Sources: OECD. Argentina, China, Colombia, India, Indonesia, Saudi Arabia, South Africa: UNESCO Institute for Statistics. Latvia: Eurostat. See Annex 3 for notes (www.oecd.org/edu/eag.htm)Please refer to the Reader’s Guide for information concerning the symbols replacing missing data.1 2 http://dx.doi.org/10.1787/888933118523
chapter C Access to Education, Participation and Progression
C3
Education at a Glance 2014: OECD Indicators © OECD 2014340
Table C3.2a. Trends in tertiary entry rates (1995-2012)
Tertiary-type 5A1 Tertiary-type 5B
1995 2000 2005 2010 2011 2012 1995 2000 2005 2010 2011 2012
(1) (2) (7) (12) (13) (14) (15) (16) (21) (26) (27) (28)
oecd Australia m 59 82 96 96 102 m m m m m m
Austria 27 34 37 53 52 53 m m 9 16 16 17
Belgium m m 33 33 33 34 m m 34 38 38 39
Canada m m m m m m m m m m m m
Chile m m 46 47 45 47 m m 35 58 59 58
Czech Republic m 25 41 60 60 60 m 9 8 9 9 9
Denmark 40 52 57 65 71 74 33 28 23 25 26 28
Estonia m m 55 43 43 43 m m 33 29 28 27
Finland 39 71 73 68 68 66 32 a a a a a
France m m m m 39 41 m m m m m m
Germany2 26 30 36 42 46 53 15 15 14 21 21 22
Greece 15 30 43 m 40 40 5 21 13 m 31 23
Hungary m 55 68 54 52 54 m 1 11 16 17 16
Iceland m 66 74 93 81 80 m 10 7 4 4 3
Ireland m 32 45 56 51 54 m 26 14 28 24 20
Israel m 48 55 60 60 60 m 31 25 29 27 33
Italy m 39 56 49 48 47 m 1 n n n n
Japan 31 40 44 51 52 52 33 32 31 27 29 28
Korea 41 45 51 71 69 69 27 51 48 36 37 36
Luxembourg m m m m 27 28 m m m m 10 8
Mexico m 24 27 33 34 34 m 1 2 3 3 3
Netherlands 44 53 59 65 65 65 a a a n n n
New Zealand 83 95 76 79 76 78 44 52 50 47 44 40
Norway 59 67 73 76 76 77 5 5 n n n n
Poland 36 65 76 84 81 79 1 1 1 1 1 1
Portugal m m m 89 98 64 m m m n n n
Slovak Republic 28 37 59 65 61 61 1 3 m 1 1 1
Slovenia m m 40 77 75 76 m m 49 19 18 17
Spain m 47 43 52 53 52 3 15 22 26 28 32
Sweden 57 67 76 76 72 60 m 7 7 12 11 10
Switzerland 17 29 37 44 44 44 29 14 16 23 22 23
Turkey 18 21 27 40 39 41 9 9 19 28 27 30
United Kingdom m 47 51 63 64 67 m 29 28 26 23 20
United States 57 58 64 74 72 71 x(1) x(2) x(7) x(12) x(13) x(14)
OECD average 39 48 54 62 59 58 17 16 18 19 19 18
OECD average for countries with data available for 2000-2012
48 55 62 61 61 17 19 21 21 19
EU21 average 35 46 53 61 57 56 11 11 16 15 15 14
part
ners Argentina m m m 60 60 m m m m 52 52 m
Brazil m m m m m m m m m m m m
China m m m 17 19 18 m m m 19 19 19
Colombia m m m m m m m m m m m m
India m m m m m m m m m m m m
Indonesia m m m 22 24 27 m m m 5 4 4
Latvia m m m m m 84 m m m m m 25
Russian Federation m m 67 77 72 69 m m 33 29 25 34
Saudi Arabia 24 23 37 48 53 59 4 6 10 11 10 11
South Africa m m m m m m m m m m m m
G20 average m m m 53 53 53 m m m 21 22 20
Notes: Columns showing entry rates for the years 2001-04, 2006-09 (i.e. Columns 3-6, 8-11, 17-20, 22-25) are available for consultation on line (see StatLink below).Please refer to Annex 1 for information on the method used to calculate entry rates (gross rates versus net rates) and the corresponding age of entry.1. The entry rates for tertiary-type A programmes include advanced research programmes for 1995 and 2000-03 (except for Belgium and Germany).2. Break in time series between 2008 and 2009 due to a partial reallocation of vocational programmes into ISCED 2 and ISCED 5B.Sources: OECD. Argentina, China, Colombia, India, Indonesia, South Africa: UNESCO Institute for Statistics. Latvia: Eurostat. Saudi Arabia: Observatory on Higher Education. See Annex 3 for notes (www.oecd.org/edu/eag.htm).Please refer to the Reader’s Guide for information concerning the symbols replacing missing data.1 2 http://dx.doi.org/10.1787/888933118542
C3
How many students are expected to enter tertiary education? – IndICator C3 chapter C
Education at a Glance 2014: OECD Indicators © OECD 2014 341
Table C3.3a. Distribution of tertiary new entrants, by field of education (2012)
Humanities, arts and education
Health and welfare
Social sciences, business and law Services
Engineering, manufacturing
and construction Sciences Agriculture Not known
or unspecified
(1) (4) (5) (6) (7) (8) (13) (14)
oecd Australia1 20 17 37 4 9 12 1 n
Austria 29 7 33 3 16 10 1 n
Belgium2 23 25 30 2 10 5 3 1
Canada m m m m m m m m
Chile 16 22 25 12 18 6 2 n
Czech Republic 17 13 30 6 15 13 4 2
Denmark 16 19 41 2 12 8 2 n
Estonia 18 12 29 9 16 14 2 n
Finland 14 19 22 8 25 9 2 n
France1 19 10 39 4 9 18 n n
Germany 23 19 23 3 17 13 1 n
Greece 23 11 29 2 17 15 3 n
Hungary 14 10 39 12 14 9 2 n
Iceland 28 11 33 3 10 13 1 n
Ireland2 23 14 23 7 11 17 2 2
Israel 22 7 35 n 23 8 n 4
Italy1 21 12 34 4 16 10 3 n
Japan 23 16 27 9 14 2 2 7
Korea 25 14 20 7 25 7 1 n
Luxembourg m 12 47 n 8 9 n n
Mexico 14 9 40 1 27 6 2 n
Netherlands2 17 19 39 7 9 7 1 1
New Zealand 24 12 33 6 7 17 1 n
Norway 23 17 31 7 9 9 1 2
Poland2 19 9 32 10 18 10 2 n
Portugal 16 16 32 8 19 8 2 n
Slovak Republic 20 18 28 6 15 10 3 n
Slovenia 14 10 32 10 21 9 3 n
Spain2 23 13 29 8 16 9 1 n
Sweden 24 14 29 3 18 11 1 n
Switzerland 16 13 36 8 16 9 1 1
Turkey 22 6 39 5 16 9 3 n
United Kingdom 24 17 28 2 8 15 1 6
United States m m m m m m m m
OECD average 20 13 31 5 15 10 2 4
EU21 average 20 14 32 5 15 11 2 1
part
ners Argentina3 29 13 32 5 8 9 2 1
Brazil m m m m m m m m
China m m m m m m m m
Colombia m m m m m m m m
India m m m m m m m m
Indonesia 12 7 36 7 27 8 2 3
Latvia m m m m m m m m
Russian Federation2 12 7 36 7 27 8 2 3
Saudi Arabia 30 5 19 1 5 11 1 28South Africa m m m m m m m m
G20 average m m m m m m m m
Note: Columns showing the breakdown of humanities, arts and education (2 and 3) and sciences (9-12) are available for consultation on line (see StatLink below).1. Exclude tertiary-type B programmes.2. Exclude advanced research programmes. 3. Year of reference 2011.Sources: OECD. Argentina, China, Colombia, India, Indonesia, South Africa: UNESCO Institute for Statistics. Latvia: Eurostat. Saudi Arabia: Observatory on Higher Education. See Annex 3 for notes (www.oecd.org/edu/eag.htm).Please refer to the Reader’s Guide for information concerning the symbols replacing missing data.1 2 http://dx.doi.org/10.1787/888933118561