indicators of climate change in the uk melvin g r cannell
TRANSCRIPT
Indicators of Climate Change in the UK
Melvin G R Cannell
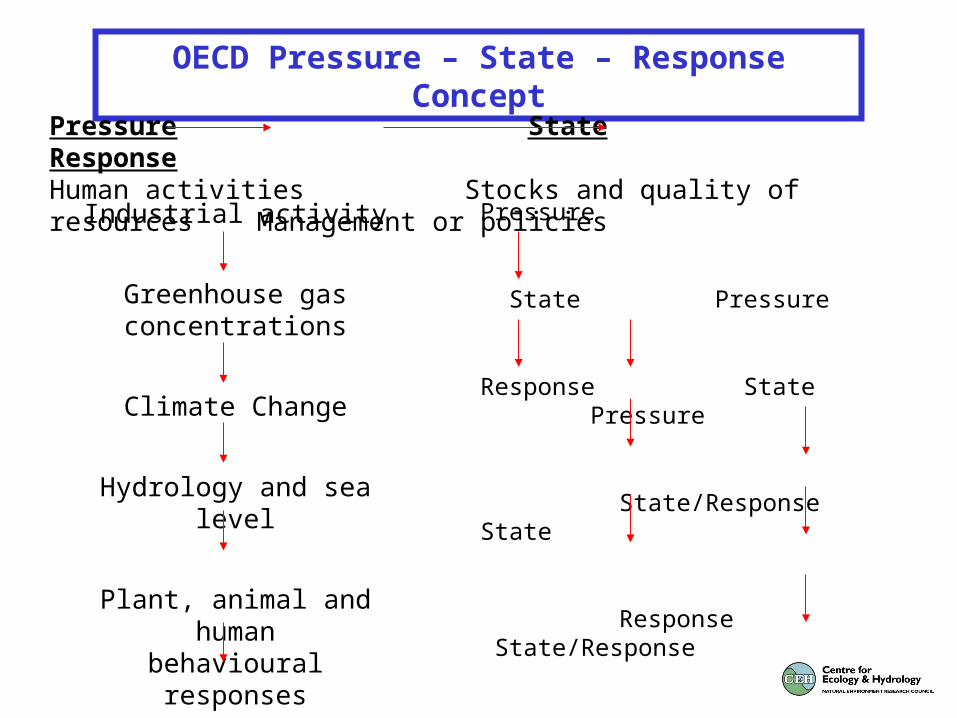
OECD Pressure – State – Response Concept
Pressure State ResponseHuman activities Stocks and quality of resources Management or policies
Industrial activity
Greenhouse gasconcentrations
Climate Change
Hydrology and sea level
Plant, animal and humanbehavioural responses
Policy responses
Pressure
State Pressure
Response State Pressure
State/Response State
Response State/Response
Response

Indicators of Climate Change in the UK
34 Indicators
Climate, hydrology, sea level and air pollution (11)Temperature. Precipitation. NAO. River flows. Groundwater.Sea level. Thames barrage. Ozone.
Insurance, energy, tourism and fire (5)Property claims. Gas use. Tourist trips. Skiing. Fires.
Health (2)Lyme disease. Seasonal mortality.
Agriculture and Forestry (8)Irrigation. Potato yield. Grapes and maize. Summer grass.Leaf emergence. Tree health.
Insects and Birds (5)Insect activity. Swallow arrival. Bird egg-laying and abundance.
Marine and Freshwaters (3)Marine plankton. Salmon behaviour. Lake ice.

Indicators of Climate Change in the UK
Criteria for selection of variables
1. State variables (climate, sea level, hydrology) as well as response variables (plants, animals, sector behaviour).
2. Response variables known to be sensitive to climate.
3. Should have long historic time series to- establish climate sensitivity- provide baseline
4. Quality records available at low cost into the future.
5. Readily understandable to the public.
Indicators of Climate Change in the UK
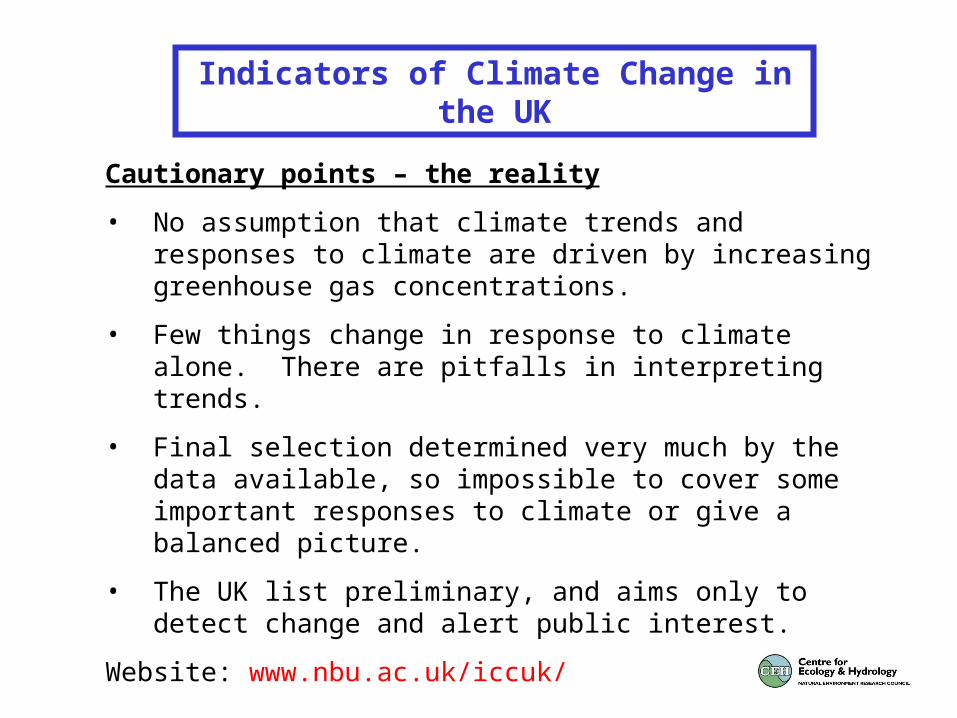
Cautionary points – the reality
• No assumption that climate trends and responses to climate are driven by increasing greenhouse gas concentrations.
• Few things change in response to climate alone. There are pitfalls in interpreting trends.
• Final selection determined very much by the data available, so impossible to cover some important responses to climate or give a balanced picture.
• The UK list preliminary, and aims only to detect change and alert public interest.
Website: www.nbu.ac.uk/iccuk/

Indicators of Climate Change in the UK
Trend over time
Sea levelThames barrier closuresSubsidence claimsOutdoor firesLyme disease casesUse of irrigation waterDate of tree leafingArrival of swallowEgg-laying dates of birds
No obvious time trend
Skiing in ScotlandGroundwater levels in chalk

Indicators of Climate Change in the UK
Hot, dry summers
More domestic tourismMore rural ozoneMore Lyme diseaseMore irrigationLess healthy beechMore insectsLate migration of salmon
Mild winters/springs
Poor skiingLower winter mortalityEarly tree leafingEarly insect appearanceEarly breeding of birds
Indicators of Climate Change in the UK
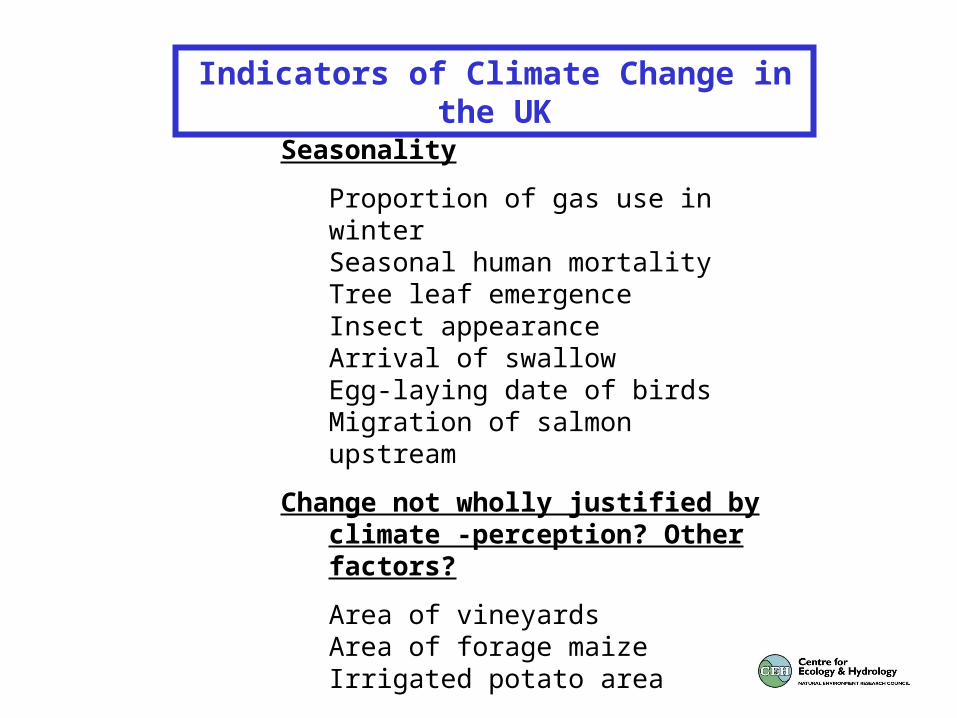
Seasonality
Proportion of gas use in winterSeasonal human mortalityTree leaf emergenceInsect appearanceArrival of swallowEgg-laying date of birdsMigration of salmon upstream
Change not wholly justified by climate -perception? Other factors?
Area of vineyardsArea of forage maizeIrrigated potato area

Air temperature in central England
No. days >20°C
No. days <0°C

Precipitation gradient across the UK
Scotland, winter
SE England, summer

Predominance of westerly weather in winter
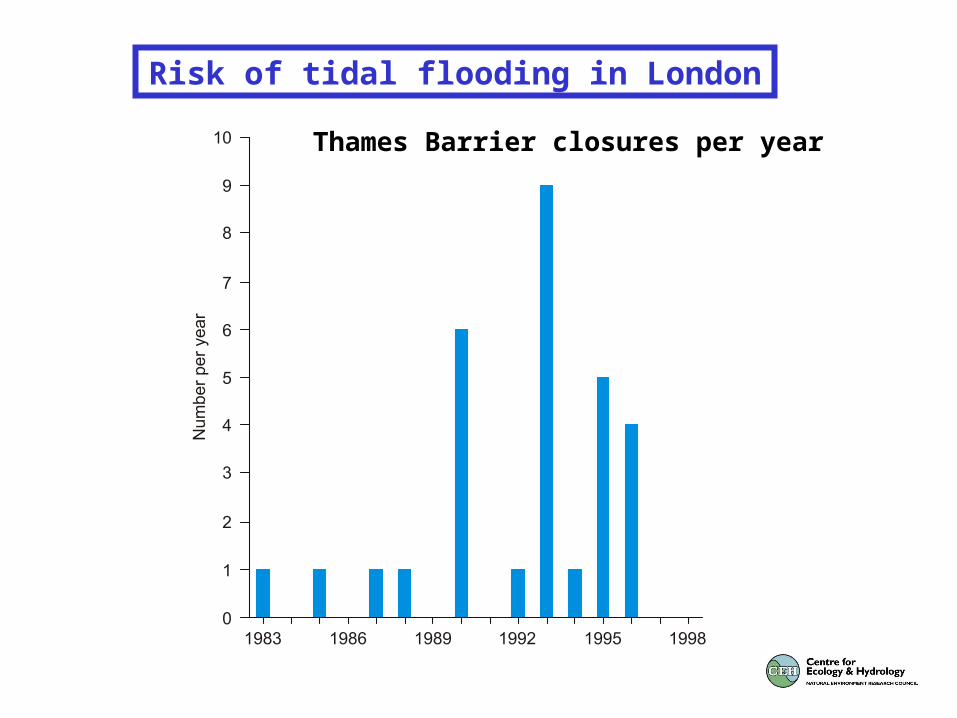
Risk of tidal flooding in London
Thames Barrier closures per year

Scottish skiing industry

Domestic holiday tourism
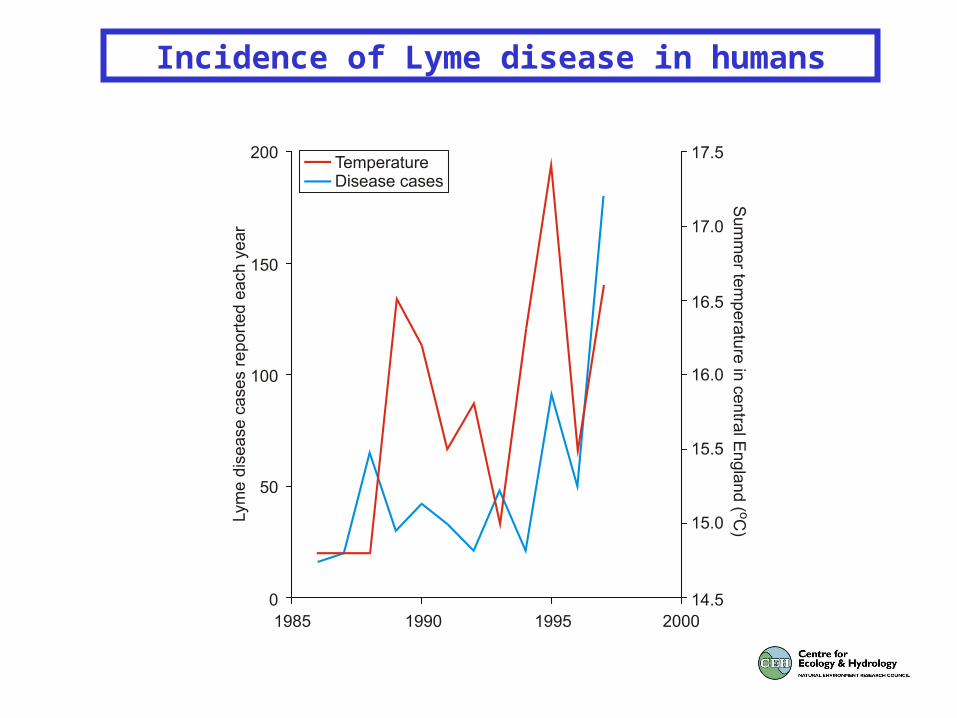
Incidence of Lyme disease in humans
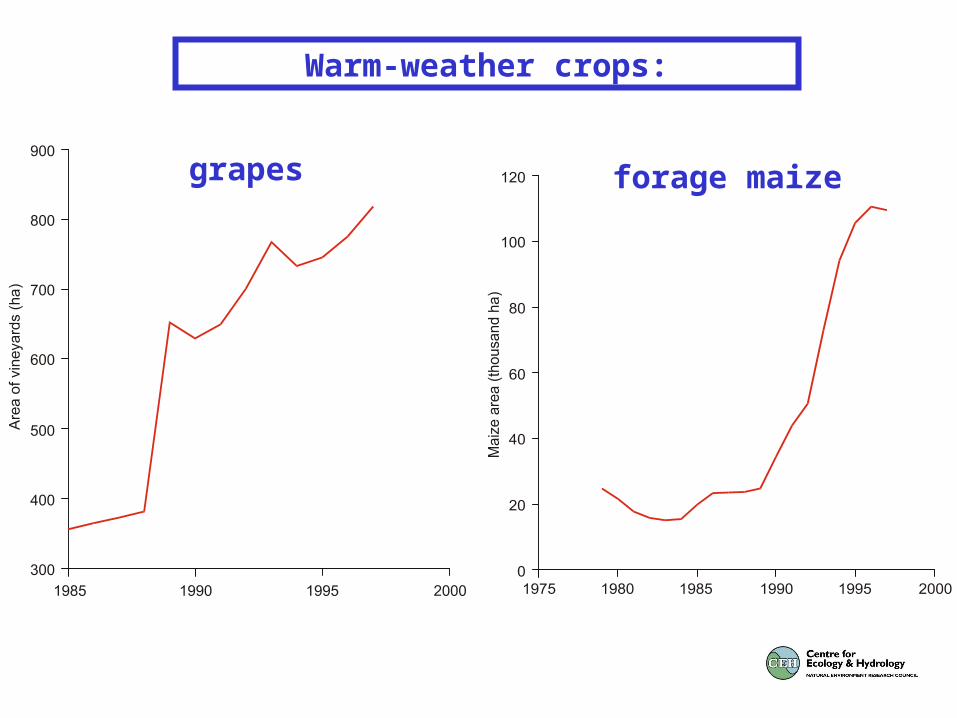
Warm-weather crops:
forage maizegrapes

Use of irrigation water for agriculture(England & Wales)

Proportion of potato crop that is irrigated(England and Wales)

Arrival date of the swallow

Insect abundance

Egg-laying dates of birds
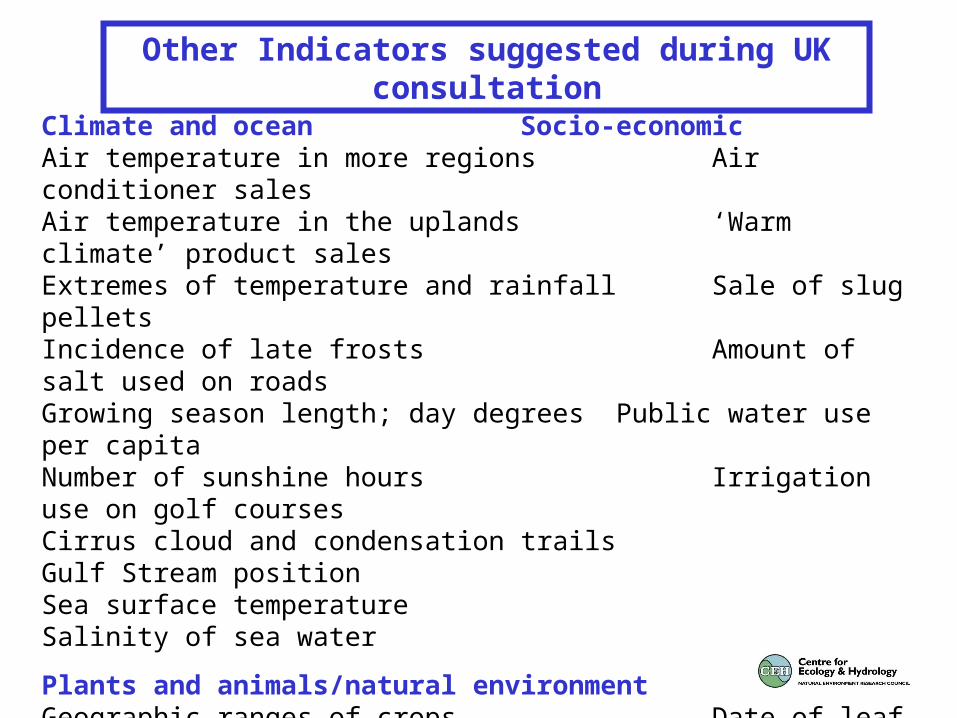
Other Indicators suggested during UK consultation
Climate and ocean Socio-economicAir temperature in more regions Air conditioner salesAir temperature in the uplands ‘Warm climate’ product salesExtremes of temperature and rainfall Sale of slug pelletsIncidence of late frosts Amount of salt used on roadsGrowing season length; day degrees Public water use per capitaNumber of sunshine hours Irrigation use on golf coursesCirrus cloud and condensation trailsGulf Stream positionSea surface temperatureSalinity of sea water
Plants and animals/natural environmentGeographic ranges of crops Date of leaf fallDates and levels of pollen in air Algal blooms on lakesFlowering times, eg. Hawthorn Smolt age of migrating salmonSpawning of natterjack toad Sea fish and marine plantsButterfly ranges, eg. Gatekeeper, comma, large skipperOverwintering birds, eg. Blackcap, chiffchaff, common sandpiper

Value of Indicators
• Quantitative simplification of complex changes.• Indicative change for policy and decision-makers.• Inform the general public; enable people to judge for themselves.• Things to watch relative to predictions.
But:
• Individually of limited value.• Rarely statistically sound, in that the percentage variation due to climate can
be calculated.• May not vary for the reason the indicator is chosen. Thus, can be misleading.• Do not explain why change is occurring.• Can be overloaded with confusing opposing trends and miss the key trends.• Media can highlight particular items and distort the picture.