indira management review...
TRANSCRIPT

Indira Management Review (IMR) (Bi-annual International Research and Academic Journal)
ISSN: 0974–3928 Volume: XI Issue: II December 2017
Editor-in-Chief Dr. Renu Bhargava
Executive Editor Dr. Suvarna Deshpande
Co-ordinating Editor Prof. Tanay Kurode
Indira School of Business Studies
Abhinavan, 89/2 A, New Pune–Mumbai Highway Tathawade, Pune–411033, India
E-mail: [email protected] Cell: 020-66759428

First Impression: December 2017
© Indira School of Business Studies, Pune
Indira Management Review (IMR)
Vol. XI • Issue: II • December 2017
ISSN: 0974–3928
No part of this publication may be reproduced or transmitted in any form by any means, electronic or mechanical, including photocopy, recording, or any information storage and retrieval system, without permission in writing from the copyright owners.
DISCLAIMER
The authors are solely responsible for the contents of the papers compiled in this volume. The publishers or editors do not take any responsibility for the same in any manner. Errors, if any, are purely unintentional and readers are requested to communicate such errors to the editors or publishers to avoid discrepancies in future.
Publishing Consultancy
EXCEL INDIA PUBLISHERS 91 A, Ground Floor Pratik Market, Munirka, New Delhi–110 067 Tel: +91-11-2671 1755/ 2755/ 3755/ 5755 Cell: 9899127755, 9999609755, 9910757755 Fax: +91-11-2671 6755 E-mail: [email protected] Web: www.groupexcelindia.com
Typeset by Excel Prepress Services, New Delhi–110 067 E-mail: [email protected] Printed by Excel Printing Universe, New Delhi–110 067 E-mail: [email protected]

Indira Management Review (IMR) (Bi-annual International Research and Academic Journal)
Advisory Board Dr. Tarita Shankar
Chairperson, Indira Group of Institutes, Pune
Prof. Chetan Wakalkar Group Director, Indira Group of Institutes, Pune
Dr. Ashok Joshi Director General
Indian Institute of Cost and Management Studies & Research (IndSearch), Pune Founder Dean–Faculty of Management, Pune
Former President, Association of Indian Management Schools President, Association of Management Development Institutions in South Asia
Dr. E.B. Khedkar Former Dean, Faculty of Management,
Savitribai Phule Pune University Vice Chancellor, Ajeenkya D.Y. Patil University, Pune
Director, Dr. D.Y. Patil School of Management, Lohegaon, Pune
Dr. G.K. Shirude Director
S.P. Mandali’s Naralkar Institute of Career Development and Research Pune
Dr. Vikas Inamdar Director, MES’s Institute of Management & Career Courses, Pune
Dr. N.M. Vechalekar Dean, Post Graduate Programme
Indian Institute of Cost and Management Studies & Research (IndSearch), Pune
Dr. P.K. Sinha Professor, Former Director in Charge,
Dr. D.Y. Patil Institute of Management & Research Pimpri, Pune
Mr. Roger La Salle Director, LaSalle Matrix Thinking, Melbourne, Australia
Editorial Board
Dr. Manivasagam Chief Technical Officer, Onward Technologies
Troy, Greater Detroit Area, USA
Mr. Himanshu Shah Vice President, Information Technology, Symantec, Pune
Dr. Ravindra Utgikar Vice President, PRAJ Industries Ltd. Pune
Mr. Anupam Parnaik Chartered Accountant
Principal (Investment Team), Hayfin Capital Management LLP, London, UK
Dr. Jayant Panse Director, Maharashtra Institute of Management,
Kalamb–Walchandnagar, Pune
Dr. Charushila Birajdar Principal
RSSP's Maharashtra College of Science and Commerce, Pune
Dr. Saroj Hiremath HOD (Marketing), Sir Parshurambhau College, Pune
Dr. Subhash Bhave Professor
Indian Institute of Cost and Management Studies & Research (IndSearch), Pune
Dr. Manoj Gadre Associate Professor,
SB Patil Institute of Management, Akurdi, Pune
Dr. Amod Sane Director, Green Pharmacy, Pune
Mr. Sanjay Ahire Owner Finite 4 LLC (USA) & Trileehiretech LLP (India)
Sr. Process Engineer, Ford Motor Company, Westland, Michigan, USA
Mr. Bhushan Khodpe Sr. Manager Business Development,
Geometric Europe GMBH Filial Sweden

Chief Editor’s Desk
Indira Management Review (IMR) is an international biannual peer reviewed journal published by Indira School of Business Studies (ISBS). Management education forms the hallmark of the business school and research is one of the pillars centring around the context which evolves management thinking on newer developments in India and the globe. IMR encourages new ideas and perspectives on existing research. Manuscripts that are suitable for publication in IMR cover domains such as business strategy and policy, IT sourcing, entrepreneurship, human resource management, financial management, organizational behaviour, organizational theory, marketing and research.
Some excerpts from the current publications are presented to you:
The dilemma of Indian power sector is displayed aptly in a paper, demonstrating the cross-roads where India finds itself. Ironically, the paper following this, discusses the relevance of circular SCM (Reverse Logistics) to promote green SCM and optimized logistics. Related to process optimization for sustainable solutions has been showcased in the next paper, featuring growing worldwide tourism industry and its potential impact on environment.
Impact of employee engagement on retention is brought out effectively in a paper, by relating the exit of prominent personalities like Cyrus Mistry and Vishal Sikka, which led to an erosion of crores of shareholders, wealth on a single day. Related to this aspect, another author has showcased Employer Branding for Attracting and retaining the most talented employees. Connected to this theme in another paper showing a step towards lean HR, to minimize inefficiency in business processes.
The canvas shifts to role of Indian millennials for online retailing and adds another perspective to Indian retailing story. Effects of Six Sigma Application in Healthcare Services have been conveyed effectively in another paper. Finally the financial performance analysis of selected banks has been portrayed very interestingly by an author using the CAMEL Approach.
Thus, in the current issue of IMR we hope to present to the readers a bouquet of articles emphasising the varied aspects which create a successful business.
Dr. R. Bhargava Director
Indira School of Business Studies, Pune

From the Desk of Executive Editor
Dear Readers,
Wishing you all a very happy & peaceful new year 2018!
It gives me immense pleasure in presenting to you the XIth issue Volume II of Indira Management review (IMR Dec 2017). The IMR Journal has been a platform for scholars, teachers and professionals & students to contribute and showcase their knowledge, research, experience, study results and findings in the relevant areas of technology, business and management. In the IMR Dec. 2017 issue, we have published articles on diverse topics such as power market, Green SCM, product recycling, employee engagement and retention, HR practices, Six sigma in logistics, and so on.
I thank all the contributors for their thought provoking articles. I also express my gratitude to the members of the Editorial Review Board and all our esteemed reviewers.
I welcome inputs from you, our readers and contributors to enhance the overall quality of the journal. Together with the erudite team of our editorial board I will work passionately to the take the journal to the next level. IMR welcomes your manuscripts, submission & witness pleasant experience while working with our editorial team.
I also seek the support of the Management fraternity in our efforts of making the IMR Journal global by contributing research papers that highlight global issues in business world.
I wish to express gratitude towards the management of Indira School of Business Studies for supporting me in embarking upon this new research assignment.
With best wishes for a very happy and successful year 2018.
We wish all happy reading!
Dr. Suvarna Deshpande Executive Editor
Indira Management Review Bi-annual, International Research & Academic Journal

IMR (Indira Management Review)
Volume XI, Issue II, December 2017
Contents
1. Impact of Employee Engagement on Retention of Employees: A Study of Some Selected Information Technology & Information Technology Enabled Services (IT & ITeS) Companies in Pune City Geeta Kalyankar Rao and Mohsin Shaikh 9
2. Financial Performance Analysis of Selected Banks using CAMEL Approach Vijay Hemant Sonaje and Shriram S. Nerlekar 17
3. Autonomous Vehicles: Is it Only a Dream? Sanjay Ahire 25
4. Determining the Effects of Six Sigma Application in Healthcare Services: A Theoretical Approach Prashant B. Ashturkar and Sandeep L. Sarkale 32
5. Assessing the Role of Instrumental Attributes in Employer Branding Swati M. Yeole 40
6. A Study of Customer Awareness of Sustainability Initiatives taken at Star Category Hotels in Hinjewadi Area of Pune Rajlaxmi Pramod Pujar and Suvarna Mohan Deshpande 51
7. A Study of E-retailing: Analysing the Factors and Perceptions of Indian Millennials for Online Retailers Yogesh D. Mahajan 59
8. Product Design Deliberations for Circular SCM to Promote Green SCM Satish Shrikrishna Chinchorkar and Sudeep Limaye 67
9. Examining Factors Influencing Customer Loyalty and Repurchase Intentions in Online Shopping: An Indian Perspective Sanjit Singh 76
10. Power Market in India and its Potential Subir Bhattacharya 88
11. Utility of Social Media for Competitive Intelligence Boon or Bane Saroj Hiremath 97
12. Lean HR: A Step Towards Success Satish S. Ubale and Anand D. Padle 103
13. Importance of Soft Skills for MBA Students: An Overview Ruchita Ramani 107
AUTHOR INDEX 111


IMR (Indira Management Review)
Volume XI, Issue II, December 2017
Impact of Employee Engagement on Retention of Employees: A Study of Some Selected Information Technology & Information Technology Enabled Services (IT & ITeS) Companies in Pune City
Geeta Kalyankar Rao1 and Dr. Mohsin Shaikh2 1Asst. Prof., Sinhgad Institute of Management, Pune
2HOD, Kashibai Navale College of Engineering, Pune
Abstract: While this study was in progress, two men at the top of India Inc., Cyrus Mistry and Vishal Sikka made abrupt exits leading to knee-jerk reactions in the corporate circles. Such was the impact of Vishal Sikka’s exit that it led to an erosion of around Rs. 22,000 crore of shareholders’ wealth on a single day. Uncertainty has not just crept at the top, thousands at the middle and lower level in the IT industry have been handed over the pink slip. This study tries to understand the phenomenon of such disruptions amidst high talks on employee engagement as a part of retention strategies of the HR. Instead of engaging in ‘rhetoric but theoretical’ investigation, this study attempts a ground level realistic assessment of employee engagement practices at select IT & ITES companies. Who should decide as to what engages an employee? Is it Mr. Narayan Murthy? Or is it Vishal Sikka? Will it be risky if the employees are engaged too much? Should the engagement be only reasonable? Such fundamental and realistic questioning is the framework of this study.
Keywords: Employee engagement, IT & ITES Companies, HR practices, Retention of employees
Introduction and Background Numbers speak for themselves. They are not at the mercy of language for their expression. Have a look at the recent highly expressive numbers of the top four IT companies.

10 Rao and Shaikh
IMR (Indira Management Review) Volume XI, Issue II, December 2017
Table 1
Year WIPRO TCS Cognizant HCL AR Profits AR Profits AR Profits AR Profits
2012–13 14% 66,696 11% 14076 11% 1,051 18% 732 2013–14 15% 78,405 11% 19332 15% 1,229 17% 1,037 2014–15 17% 87,059 15% 20060 15% 1,439 21% 1,164 2015–16 16% 89,567 16% 24338 19% 1,624 23% 840
2016– There are no sources in the current document.17
16% 85,143 11% 26357 16% 1,553 23% 1,262
Correlation 0.96 0.26 0.90 0.36
AR = Attrition rates. Profit figures are consistently expressed in the same currency, either Rs. or in USD.
All the companies have shown a consistent rise in the attrition rates and surprisingly, all the companies at the same time have shown a consistent rise in profits as well! We are not talking of number for a year or two. Neither are we talking of numbers for a company or two. Four companies over the last five years have shown a positive correlation (two of them as high as 90% or more) between attrition rates and profits!
So we have on one hand the theory—that is absolutely pleasing to the ears in terms of the nicely coined terms—100% employee engagement, employee engagement is a strategic initiative to check attrition and blah blah. Practice on the other hand is something drastically different. CEO of a company in the morning delivers a lecture to a full house HR conference gathering and sings marvelous songs spelling out the glory of the human capital, its immense value, the need for its meaningful engagement etc. In the afternoon, the same CEO approves of a job-cut in his organization that would render some thousands jobless. No, this is not a fictional story. Tanya Jain (2017) writing for Data Quest has given the following numbers: ‘Recently, in the sheath of thorough assessment and appraisal process, Wipro has churned out more than 500 employees. Officials have claimed it as a process to sack non-performers from the organization. Concurrently, Tech Mahindra due to its own share of challenges and business propels may sack around 1500–2000 of its employees. On this, Tech Mahindra spokesperson quoted the action as an annual process and stated this year to be no-different. Other major IT organizations including Infosys, Capegemini and Cognizant are also said to walk the same path like their fellow competitors. Cognizant Technology Solutions is said to bring down its employability graph by 5% i.e. a dash of thousands of employees this year. As reported earlier by Data Quest, the Aspiring Minds’ ‘Automata National Programming Report’ stated that two-thirds of the IT professionals cannot write codes and so, 95% engineers are not employable.’
Given this scenario, the situation demands that we study some unstudied dimensions of employee engagement. So far, researchers have primarily focused only on one aspect – WHAT engages an employee? Time has come to ask a few more questions – WHO should decide on employee engagement and HOW much should an employee be really engaged?
Objectives of the Full Study: To study the impact of Employee Engagement on Retention of the employees in Information Technology & Information Technology Enabled Services (IT & ITES) companies in Pune city.

Impact of Employee Engagement on Retention of Employees 11
Volume XI, Issue II, December 2017 IMR (Indira Management Review)
Before venturing into a detailed study, a pilot study was carried out with the following specifications, data and findings:
1. Sample Size: 50 employees and 10 HR Managers from select IT companies.
2. Method of Sampling: E-questionnaire was circulated at select IT companies. HR managers and employees were requested to fill-up the questionnaire. First 50 and 10 responses were chosen as the sample size for conducting pilot study. Neither the name of the respondent nor that of the company was recorded for ensuring confidentiality. In fact, it was only when the company and employees were assured of their confidentiality, they agreed to cooperate.
3. Instrument Used: A questionnaire was designed in MS Excel. It was divided into following parts:
a. Demographic profile
b. Who should decide what engages an employee?
c. How much an employee should be engaged?
d. What should really engage an employee?
e. What factors keep employees engaged?
f. Impact of employee engagement practices on retention?
The questionnaire had following features:
a. Responses were sought by way of a selection from a drop-down list
b. In seeking agreement or disagreement on a particular issue, the sequence of responses was designed as under:
0 – No option
1 – Somewhat agree
2 – Completely agree
3 – Somewhat disagree
4 – Completely disagree
c. ‘No option’ choice was deliberately kept as the 1st response in order to provide an early exit option to those who either didn’t know the answer or didn’t want to answer. The purpose of doing this was to ensure that respondents give answers about which they feel that they are confident instead of jumbling around with all the 3 options (no option, agree or disagree) for a while and then ending up in a confused answer. Researcher is hopeful that only genuine and confident responses have been extracted.
12 Rao and Shaikh
IMR (Indira Management Review) Volume XI, Issue II, December 2017
Reliability of Questionnaire
Reliability test of all the 5 parts of the questionnaire was done using Cronbach’s Alpha and other tests using a MS Excel Calculator. All the parts of the questionnaire yielded Cronbach’s Alpha scores in excess of 0.90.
Hypothesis Set
H01 There is no impact of retention strategies over the attrition rates
HA1 There is an impact of retention strategies over attrition rates.
H02 Attrition rates have no adverse impact on profitability.
HA2 Attrition rates do have an adverse impact on profitability.
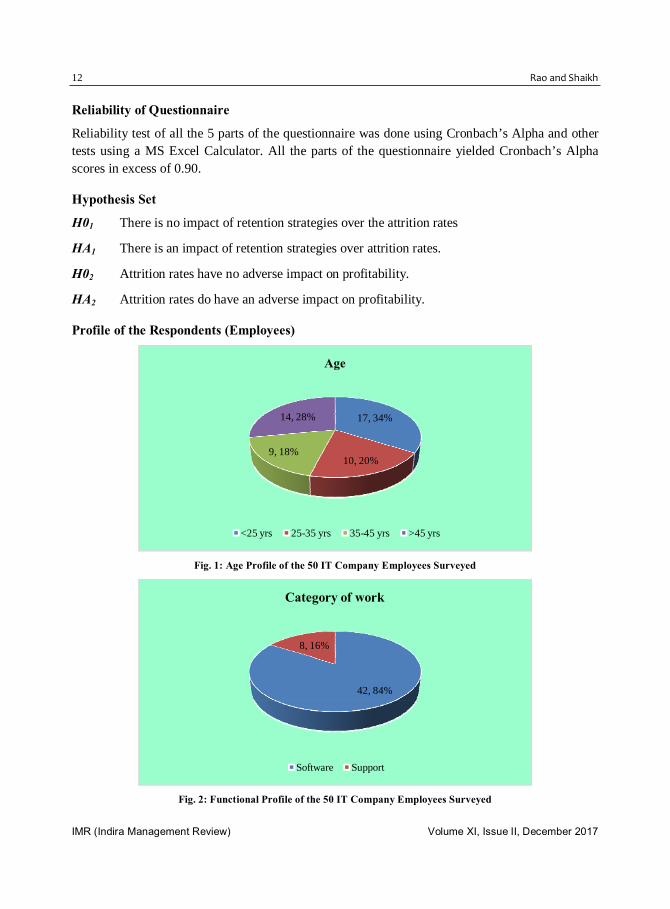
Profile of the Respondents (Employees)
Fig. 1: Age Profile of the 50 IT Company Employees Surveyed
Fig. 2: Functional Profile of the 50 IT Company Employees Surveyed
17, 34%
10, 20%9, 18%
14, 28%
Age
<25 yrs 25-35 yrs 35-45 yrs >45 yrs
42, 84%
8, 16%
Category of work
Software Support
Impact of Employee Engagement on Retention of Employees 13
Volume XI, Issue II, December 2017 IMR (Indira Management Review)
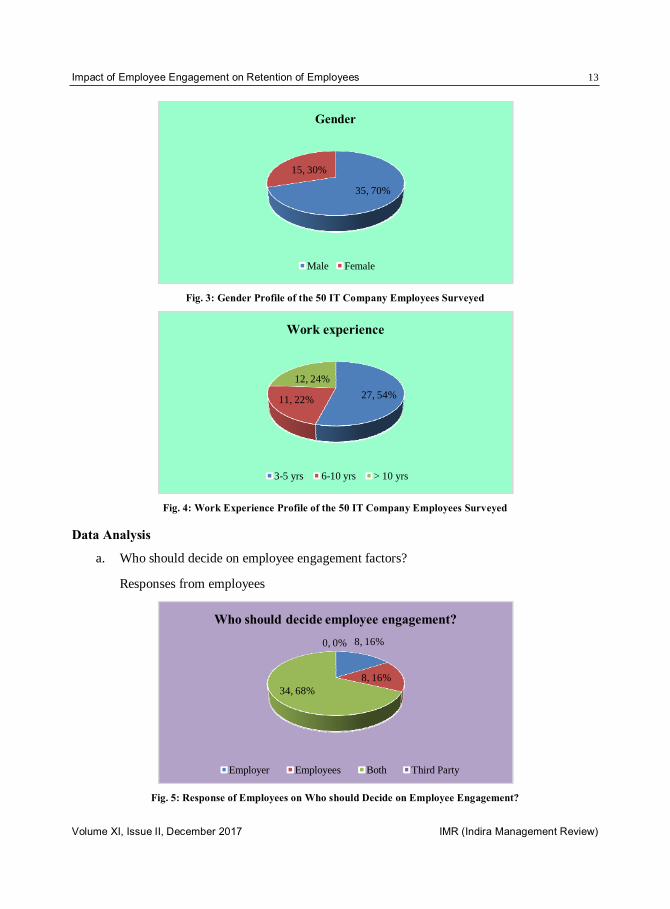
Fig. 3: Gender Profile of the 50 IT Company Employees Surveyed
Fig. 4: Work Experience Profile of the 50 IT Company Employees Surveyed
Data Analysis
a. Who should decide on employee engagement factors?
Responses from employees
Fig. 5: Response of Employees on Who should Decide on Employee Engagement?
35, 70%
15, 30%
Gender
Male Female
27, 54%11, 22%
12, 24%
Work experience
3-5 yrs 6-10 yrs > 10 yrs
8, 16%
8, 16%34, 68%
0, 0%
Who should decide employee engagement?
Employer Employees Both Third Party

14 Rao and Shaikh
IMR (Indira Management Review) Volume XI, Issue II, December 2017
Responses from HR Managers
Fig. 6: Response of HR Managers on who should Decide on Employee Engagement?
Sizable majority from both the groups felt that both the employer and employer should decide the employee engagement factors. – make it employer and employee
b. Employee engagement dimensions:
The questionnaire was divided into 5 parts as under:
Table 2: Grouping of the Questionnaire into 5 Groups
Code Aspect 1 Who should decide on employee engagement factors? 2 How much an employee should be engaged? 3 What should be the employee engagement factors? 4 What factors engages the employees? 5 Impact of employee engagement factors on retention
Weights assigned to responses: While aggregating the responses weights of 1.5 each were assigned to options 2 & 4 – completely agree and completely disagree.
c. Summarized responses –Employees
Table 3: Summary of Responses for the Set of Questions-Employees
1 2 3 4 5 Agree 289 293 297 714 294 Disagree 39 29 32 68 35 Agree % 88% 91% 90% 91% 89% Disagree % 12% 9% 10% 9% 11%
2, 20%
2, 20%6, 60%
0, 0%
Who should decide employee engagement?
Employer Employees Both Third Party

Impact of Employee Engagement on Retention of Employees 15
Volume XI, Issue II, December 2017 IMR (Indira Management Review)
Fig. 7: Summarize Responses to 5 Set of Questions-Employees
HR Managers Table 4: Summary of Responses for the Set of Questions–HR Managers
1 2 3 4 5 Agree 53 55 57 139 54 Disagree 5 5 3 13 5 Agree % 91% 92% 95% 91% 91% Disagree % 9% 8% 5% 9% 9%
Fig. 8: Summarized Responses to 5 set of Questions–HR Managers
Interpretation
There is an overwhelming agreement on all the 5 dimensions studied from both the groups. It means the following:
1. There is a strong agreement about being real and practical with employee engagement practices, its measurement, its significance etc.
2. There is also a strong agreement that employee engagement practices have a positive impact on employee retention.
0%
50%
100%
1 2 3 4 5
88% 91% 90% 91% 89%
12% 9% 10% 9% 11%
Summarized responses - Employees
Agree % Disagree %
0%
50%
100%
1 2 3 4 5
91% 92% 95% 91% 91%
9% 8% 5% 9% 9%
Summarized responses - HR Managers
Agree % Disagree %

16 Rao and Shaikh
IMR (Indira Management Review) Volume XI, Issue II, December 2017
Statistical Testing Table 5: Statistical Testing of Null Hypotheses
1 2 3 4 5 Agree 289 293 297 714 294 Disagree 39 29 32 68 35 Agree % 88% 91% 90% 91% 89% Disagree % 12% 9% 10% 9% 11% Step Parameter Score Score Score Score Score 1 X Bar (µ) 88% 91% 90% 91% 89% 2 n 50 50 50 50 50 3 STDEV(n) 0.72766 0.72681 0.72283 0.71133 0.71671 4 Ho 50% 50% 50% 50% 50% 5 H1 88% 91% 90% 91% 89% 6 to 3.71 3.99 3.95 4.11 3.90 7 p value 0.0003 0.0001 0.0001 0.0001 0.0001 8 (5% SL) 0.05 0.05 0.05 0.05 0.05 9 Is p-value< Yes Yes Yes Yes Yes 10 Accept / Reject Ho Reject Ho Reject Ho Reject Ho Reject Ho Reject Ho
All the 5 dimensions as discussed earlier were tested at 95% confidence level against a sample average of 50% agreement (meaning that it is assumed that 50% would agree.) In all the cases, the null hypotheses were rejected indicating that the scores from the responses are significant and not by chance.
Conclusion The study primarily focused on two issues: (a) the need for being realistic and rational when it comes to employee engagement (b)the impact of employee engagement on employee retention. Both the set of respondents, namely, the employees and HR managers overwhelmingly agreed that there is a need to address questions like who should engage, how much should be engaged, what should really engage in addition to what has been engaging the employees in the IT/ITES companies. At the same time, they also strongly agreed to the fact that employee engagement does impacts the attrition rates. The full study will investigate more ground level realities particularly in the light of the stunning developments that are taking place in the HR arena.
References [1] Annual Reports of IT Companies–WIPRO, TCS, Cognizant, HCL for the Years 2012/13 to 2016/17. [2] Jain, Tanya (2017), Indian IT Majors may Initiate Job-Cuts for Low and Mid-level Employees,
http://www.dqindia.com/indian-it-majors-may-initiate-job-cuts-for-low-and-mid-level-employees/

IMR (Indira Management Review)
Volume XI, Issue II, December 2017
Financial Performance Analysis of Selected Banks using CAMEL Approach
Vijay Hemant Sonaje1 and Dr. Shriram S. Nerlekar2 1Assistant Professor, MM’s IMERT, Pune
2Director, MM’s IMERT, Pune
Abstract: The paper has made a modest attempt to analyze the performance of eleven commercial banks in India during the period 2013 to 2017, using CAMEL approach. Based on the various ratios under CAMEL parameter, it is observed that Kotak Bank and HDFC Bank are the top performers while the public sector giant State Bank of India and Punjab National bank are at the bottom. This study also reveals the financial position and soundness among top eleven commercial banks.
Keywords: CAMEL Approach, Efficiency, Soundness, Financial Position
Introduction The banking sector is the backbone of the economy of a country and occupies the core position. Banks occupy the prime position in any financial system by virtue of the significant role they play in economic growth by undergoing transformations and supporting the critical payment systems. The specificity of banks, the volatility of financial markets, increased competition and diversification and initiated banks towards assessing risks and challenges. In the wake of recurring bank failures and consequent financial crisis over the last two decades, the authorities across the globe have tried to limit the impact of bank failures and provided safety nets in the form of deposit insurance and liquidity support by Central banks/ governments. This creates the need of effective supervisory system and a tool to ensure safety and soundness of the banks (RBI, 2012). The Indian banks in general and the Public Sector Banks (PSBs) in particular, are grappling with the huge stock of stressed assets that has piled up in the system over the years. This has led to the phenomenal build-up of Non-Performing Spelling corrections Assets-Aassets (NPAs). This stress on the assets has impacted as a sharp decline in net interest margin of the banks. In such view of things, measuring financial performance of the banks is a matter of serious interest for regulators, customers, investors and managers.
This paper is divided into five sections. Section II elaborates a review of literature on CAMEL approach and its utility over a period of time from 1999 to 2013. Section III is the research methodology in the study. Ratios and results are provided in section IV and section V concludes with suggestion for future research.
Review of Literature This section of the paper incorporates brief review of literature on performance and soundness measurement of banks using CAMEL approach. Sathye (2005) studied the financial performance of the Indian banking sector for the period of 1998 to 2002. The focus of the research was on
18 Sonaje and Nerlekar
IMR (Indira Management Review) Volume XI, Issue II, December 2017
traditional financial ratios to measure the performance of Indian banks in context of Indian strategy of privatization. B. Nimalathasan (2008) compared a financial performance of 48 banks in Bangladesh using CAMELS approach from financial year 1999–2006. This analysis divided Bangladesh banking sector into four categories to apply the CAMELS rating. Manoj P. K. (2010) in his paper makes a comparative analysis of the financial soundness of old private sector banks in India and also benchmarks Kerala based old private sector banks with national level banks using CAMEL rating model. This study focused on ten years’ period from FY 2000 to 2009. For the analysis, scores under every parameter under each group of CAMEL are averaged and then ranked accordingly. Further, individual rankings are averaged to identify group rankings which further averaged to reach the overall rankings. Apart from CAMEL model, for bench marking,‘t’ test is used. The author revealed that all Kerala based old private sector banks are lagging behind the best in class old private sector banks at nationalized level in financial soundness. Prasad K.V.N. and Ravinder G. (2012) evaluated the performance of the Indian banking sector by choosing 20 nationalized banks for the period of 2005–06 to 2009–10. The composite rank is achieved using average of ranks for individual parameters as well as group ranking. Mishra A.K. et al. (2012) analyzed the soundness in Indian banking by focusing on twelve banks which are traded on National Stock Exchange and are part of CNX Bank Index. The overall ranking of the banks is presented by analyzing the data over eleven year’s period of 2000 to 2011 using CAMEL approach. The findings of the study state that Public Sector Banks are lagging in comparison to Private Sector Banks on performance. Reddy K.S. (2012) computed the relative positions of public sector, domestic private sector and foreign banks by giving the ranks for the period 1999 to 2009 using CAMEL ratios. The author observed the significant improvement in performance of public sector banks. Gupta R. (2014) scrutinized the performance of public sector banks in India using CAMEL approach for a five year period from 2009 to 2013. Andhra Bank was found to be the best performer among public sector banks. Kaur P. (2015) analyzed the financial performance of five public sector banks and five private sector banks for the period 2009 to 2014 using CAMEL model. This study revealed that profit per employee, total advances to deposits and CAR is most impacting factor on performance of the banks.
Research Methodology Framework of CAMEL Approach
Regulators, analysts and investors have to periodically assess the financial condition of each bank. Banks are rated on various parameters, based on financial and non-financial performance. The popularly used assessment goes by the acronym CAMELS, where each letter refers to a specific category of performance. The components of the CAMELS rating system comprise of both objective and subjective parameters. The details are based on publicly available information published at Reserve Bank of India, Indian Banks Association, referred papers and a book.
C-Capital Adequacy: This indicates the bank’s capacity to maintain capital commensurate with the nature and extent of all types of risks, as also the ability of the bank’s managers to

Financial Performance Analysis of Selected Banks using CAMEL Approach 19
Volume XI, Issue II, December 2017 IMR (Indira Management Review)
identify, measure, monitor and control these risks. In accordance with this following ratios are considered: i. Capital Adequacy Ratio ii. Equity Capital to Total Assets iii. Advances to Total Assets Ratio iv. Government Securities to Total Investments
A-Asset Quality: This measure reflects the magnitude of credit risk prevailing in the bank due to its composition and quality of loans, advances, investments and off-balance sheet activities. Following ratios are considered for the purpose of analysis (i) Net NPAs to Net Advances (ii) Net NPAs to Total Assets (iii) Total Investments to Total Assets.
M-Management Quality: Signaling the ability of the board of directors and senior managers to identify, measure, monitor and control risks associated with banking. This qualitative measure uses risk management policies and processes as indicators of sound management. Following ratios are identified to indicate the quality perspective: (i) Business per employee (ii) Profit per employee (iii) Total advances to total deposits (iv) Return on Net Worth
E-Earnings: This indicator not only shows the amount of and the trend in earnings but also analyses the robustness of expected earnings growth in future. For better understanding of above dynamics, following ratios are considered: (i) Return on Assets (ROA), (ii) Net Interest Margin (NIM), (iii) Interest income to Total income, (iv) Cost to Income ratio
L-Liquidity: This measure takes into account the adequacy of the bank’s current and potential sources of liquidity, including the strength of its fund management practices. To measure this impact, following ratios are used. (i) Liquid Assets to Demand Deposits (ii) Liquid Assets to Total Deposits iii. Liquid Assets to Total Assets
S-Sensitivity to Market Risk: This is a recent addition to the ratings parameters and reflects the degree to which changes in interest rates, commodity prices and equity prices can affect earnings and hence, the bank’s capital. Because of lack of availability of data for this parameter, this group component is not considered in this paper.
The selection of the banks is based on the NIFTY Bank Index which comprises of most liquid and large Indian banking stocks. This Index has 12 stocks from the banking sector which trades on the National Stock Exchange of India Ltd. (NSE). This Index is computed using free float market capitalization method. Twelve banks considered for evaluation are ICICI Bank Ltd., Kotak Mahindra Bank Ltd., Indus Ind Bank Ltd., Federal Bank Ltd., Axis Bank Ltd., HDFC Bank Ltd., State Bank of India Ltd. (SBI), Canara Bank Ltd., Bank of Baroda Ltd., Yes Bank Ltd., Punjab National bank Ltd. and IDFC Bank Ltd. For the purpose of CAMEL ratio calculations, the data is obtained from ACE Equity software. This data is evaluated for a period of five years from financial year 2013 to 2017. IDFC Bank Ltd. is excluded from the data set as data for this bank is available only for FY 2016 and 2017.
The selected banks will be ranked after calculation of ratios for each parameter. The best ratio is ranked 1 while the worst is ranked 11. In case of tie, the rank will be average of the ranks.

20 Sonaje and Nerlekar
IMR (Indira Management Review) Volume XI, Issue II, December 2017
Results and Discussion For every parameter of acronym CAMEL, individual ratios are calculated for the period of FY 2013 to FY 2017. Each ratio is averaged further to reach the group ranking. Table 1 to Table 6 represent the average of individual ratios under each parameter of CAMEL from the year 2013 to 2017. The source of this data is ACE equity database by Accord Fintech.
Table 1: Capital Adequacy Individual Ratios Average (FY 2013–017)
ICIC
I
Kot
ak
Indu
s Ind
Fede
ral
Axi
s
HD
FC
SBI
Can
ara
BO
B
Yes
Ban
k
PNB
Capital Adequacy Ratio
17.188 17.278 14.183 14.230 15.350 15.735 12.668 11.283 12.573 15.875 11.668
Equity Capital to Total Assets
0.124 0.128 0.105 0.088 0.0970 0.0971 0.062 0.050 0.054 0.079 0.059
Advances to Total Assets
0.583 0.612 0.6210 0.615 0.607 0.6207 0.636 0.595 0.585 0.550 0.622
G. Sec. to Total Investments
0.624 0.766 0.779 0.745 0.671 0.780 0.775 0.874 0.837 0.644 0.802
Table 2: Asset Quality Individual Ratios Average FY 2013–2017
ICIC
I
Kot
ak
Indu
s Ind
Fede
ral
Axi
s
HD
FC
SBI
Can
ara
BO
B
Yes
Ban
k
PNB
Net NPA to Net Advances
2.352 0.992 0.340 1.074 0.822 0.266 2.862 3.912 2.894 0.256 5.136
Net NPA to Total Assets
0.014 0.006 0.0021 0.007 0.005 0.0017 0.018 0.023 0.017 0.0015 0.031
Total Invest to Total Assets
0.2587 0.277 0.233 0.276 0.269 0.2589 0.242 0.265 0.185 0.331 0.255
Table 3: Management Quality Individual Ratios Average (FY 2013–2017)
ICIC
I
Kot
ak
Indu
s Ind
Fede
ral
Axi
s
HD
FC
SBI
Can
ara
BO
B
Yes
Ban
k
PNB
Business per employee (Rs. in Cr.)
8.492 7.310 7.916 11.678 13.400 10.050 12.554 14.362 17.744 16.694 13.086
Profit per employee (Rs. in Cr.)
0.140 0.098 0.096 0.074 0.142 0.126 0.054 1.406 0.086 0.206 0.028
Total Advances to Total Deposits (CDR)
101.287 89.032 90.034 74.026 86.340 83.134 83.510 69.200 67.782 81.705 74.833
Return on Net Worth % 12.792 13.562 17.250 11.196 15.456 19.440 10.070 5.542 5.618 21.936 5.572

Financial Performance Analysis of Selected Banks using CAMEL Approach 21
Volume XI, Issue II, December 2017 IMR (Indira Management Review)
Table 4: Earnings Quality Individual Ratios Average FY (2013–2017)
ICIC
I
Kot
ak
Indu
s Ind
Fede
ral
Axi
s
HD
FC
SBI
Can
ara
BO
B
Yes
Ban
k
PNB
Return on Assets (ROA)
1.576 1.716 1.822 1.056 1.478 1.854 0.632 0.296 0.312 1.626 0.350
Net Interest Margin (NIM)
3.060 4.070 3.718 3.282 3.204 4.044 2.732 1.876 1.984 2.716 2.708
Interest Income to Total Income
0.790 0.852 0.800 0.901 0.805 0.843 0.864 0.895 0.894 0.840 0.886
Cost to Income Ratio 37.242 51.654 47.276 50.888 40.740 45.480 49.420 48.992 44.604 40.270 44.114
Table 5: Liquidity Individual Ratios Average FY (2013–2017)
ICIC
I
Kot
ak
Indu
s Ind
Fede
ral
Axi
s
HD
FC
SBI
Can
ara
BO
B
Yes
Ban
k
PNB
Liquid Assets to Demand Deposits
3.538 2.792 2.819 6.045 2.134 2.260 4.538 10.376 8.046 4.182 6.050
Liquid Assets to Total Deposits
0.482 0.453 0.458 0.338 0.393 0.383 0.369 0.442 0.599 0.429 0.424
Liquid Assets to Total Assets
0.278 0.310 0.316 0.281 0.277 0.286 0.280 0.380 0.517 0.289 0.353
Using Table 1 to Table 5, individual ranking for each ratio of all five parameters of CAMEL is given. This ranking is from 1 to 11, where rank 1 defines the best value of a particular ratio among all eleven banks while rank 11 defines the worst value of a particular ratio. This ranking is shown in Table 6 to Table 10. These ranks are further averaged to reach the group ranking of each parameter of CAMEL. All the calculations are based on MS Excel.
Table 6: Capital Adequacy Parameter Group Ranking
ICIC
I
Kot
ak
Indu
s Ind
Fede
ral
Axi
s
HD
FC
SBI
Can
ara
BO
B
Yes
Ban
k
PNB
Capital Adequacy Ratio 2.000 1.000 7.000 6.000 5.000 4.000 8.000 11.000 9.000 3.000 10.000 Equity Capital to Total Assets
2.000 1.000 3.000 4.000 6.000 5.000 8.000 11.000 10.000 7.000 9.000
Advances to Total Assets
10.000 6.000 3.000 5.000 7.000 4.000 1.000 8.000 9.000 11.000 2.000
Govt. Sec. to Total Investments
11.000 7.000 5.000 8.000 9.000 4.000 6.000 1.000 2.000 10.000 3.000
Avg. of Individual Rankings
6.250 3.750 4.500 5.750 6.750 4.250 5.750 7.750 7.500 7.750 6.000
Group Ranking 7.000 1.000 3.000 4.500 8.000 2.000 4.500 10.500 9.000 10.500 6.000

22 Sonaje and Nerlekar
IMR (Indira Management Review) Volume XI, Issue II, December 2017
Table 7: Asset Quality Parameter Group Ranking
ICIC
I
Kot
ak
Indu
s Ind
Fede
ral
Axi
s
HD
FC
SBI
Can
ara
BO
B
Yes
Ban
k
PNB
Net NPA to Net Advances
7.000 5.000 3.000 6.000 4.000 2.000 8.000 10.000 9.000 1.000 11.000
Net NPA to Total Assets
7.000 5.000 3.000 6.000 4.000 2.000 9.000 10.000 8.000 1.000 11.000
Total Invest. to Total Assets
7.000 2.000 10.000 3.000 4.000 6.000 9.000 5.000 11.000 1.000 8.000
Avg. of individual rankings
7.000 4.000 5.333 5.000 4.000 3.333 8.667 8.333 9.333 1.000 10.000
Group Ranking 7.000 3.500 6.000 5.000 3.500 2.000 9.000 8.000 10.000 1.000 11.000
Table 8: Management Quality Parameter Group Ranking
ICIC
I
Kot
ak
Indu
s Ind
Fede
ral
Axi
s
HD
FC
SBI
Can
ara
BO
B
Yes
Ban
k
PNB
Business per employee (Rs. In Cr.)
9.000 11.000 10.000 7.000 4.000 8.000 6.000 3.000 1.000 2.000 5.000
Profit per employee (Rs. In Cr.)
4.000 6.000 7.000 9.000 3.000 5.000 10.000 1.000 8.000 2.000 11.000
Total Advances to Total Deposits (CDR)
1.000 3.000 2.000 9.000 4.000 6.000 5.000 10.000 11.000 7.000 8.000
Return on Net Worth (RONW) %
6.000 5.000 3.000 7.000 4.000 2.000 8.000 11.000 9.000 1.000 10.000
Avg. of individual rankings
5.000 6.250 5.500 8.000 3.750 5.250 7.250 6.250 7.250 3.000 8.500
Group Ranking 3.000 6.500 5.000 10.000 2.000 4.000 8.500 6.500 8.500 1.000 11.000
Table 9: Earnings Quality Parameter Group Ranking
ICIC
I
Kot
ak
Indu
s In
d
Fede
ral
Axi
s
HD
FC
SBI
Can
ara
BO
B
Yes
Ban
k
PNB
Return on Assets (ROA)
5.000 3.000 2.000 7.000 6.000 1.000 8.000 11.000 10.000 4.000 9.000
Net Interest Margin Ratio (NIM)
6.000 1.000 3.000 4.000 5.000 2.000 7.000 11.000 10.000 8.000 9.000
Interest Income to Total Income
11.000 6.000 10.000 1.000 9.000 7.000 5.000 2.000 3.000 8.000 4.000
Cost to Income Ratio 1.000 11.000 7.000 10.000 3.000 6.000 9.000 8.000 5.000 2.000 4.000 Avg. of individual rankings
5.750 5.250 5.500 5.500 5.750 4.000 7.250 8.000 7.000 5.500 6.500
Group Ranking 6.500 2.000 4.000 4.000 6.500 1.000 10.000 11.000 9.000 4.000 8.000

Financial Performance Analysis of Selected Banks using CAMEL Approach 23
Volume XI, Issue II, December 2017 IMR (Indira Management Review)
Table 10: Liquidity Parameter Group Ranking
ICIC
I
Kot
ak
Indu
s Ind
Fede
ral
Axi
s
HD
FC
SBI
Can
ara
BO
B
Yes
Ban
k
PNB
Liquid Assets to Demand Deposits
7.000 9.000 8.000 4.000 11.000 10.000 5.000 1.000 2.000 6.000 3.000
Liquid Assets to Total Deposits
2.000 4.000 3.000 11.000 8.000 9.000 10.000 5.000 1.000 6.000 7.000
Liquid Assets to Total Assets
10.000 5.000 4.000 8.000 11.000 7.000 9.000 2.000 1.000 6.000 3.000
Avg. of individual rankings
6.333 6.000 5.000 7.667 10.000 8.667 8.000 2.667 1.333 6.000 4.333
Group Ranking 7.000 5.500 4.000 8.000 11.000 10.000 9.000 2.000 1.000 5.500 3.000
The overall ranking of all eleven banks considering all sub-criteria rankings under CAMEL analysis is shown in Table 11. The group rankings obtained in Table 6 to Table 10 are further averaged to reach the overall ranking for each parameter of acronym CAMEL for all eleven banks for the period of FY 2013 to 2017.
Table 11: Overall CAMEL Ranking FY 2013–2017
ICIC
I
Kot
ak
Indu
s Ind
Fede
ral
Axi
s
HD
FC
SBI
Can
ara
BO
B
Yes
Ban
k
PNB
C- Capital Adequacy 7.000 1.000 3.000 4.500 8.000 2.000 4.500 10.500 9.000 10.500 6.000 A- Asset Quality 7.000 3.500 6.000 5.000 3.500 2.000 9.000 8.000 10.000 1.000 11.000 M- Management Quality
3.000 6.500 5.000 10.000 2.000 4.000 8.500 6.500 8.500 1.000 11.000
E- Earnings Quality 6.500 2.000 4.000 4.000 6.500 1.000 10.000
11.000 9.000 4.000 8.000
L- Liquidity 7.000 5.500 4.000 8.000 11.000
10.000 9.000 2.000 1.000 5.500 3.000
Average of Group Rankings
6.100 3.700 4.400 6.300 6.200 3.800 8.200 7.600 7.500 4.400 7.800
Overall Ranking 5.000 1.000 3.500 7.000 6.000 2.000 11.000
9.000 8.000 3.500 10.000
The results obtained from CAMEL approach indicate, Kotak Mahindra Bank as the most efficient and sound bank in financial analysis for the period of FY 2013 to 2017. Even though HDFC Bank is at second position in overall ranking, the position is sounder in case of Earning quality and Management quality parameter than any other bank out of the selected eleven. By increasing liquid assets, the position of HDFC Bank will be better than Kotak Mahindra Bank. Yes Bank and Indus IndBank are at the same position. But in case of Yes Bank, variation in a rank of all five parameters is more as compared to Indus IndBank. The bottom position is with the biggest bank of India i.e. State Bank of India. The scale of the bank seems to be the reason for such a low efficiency among other peer banks. Non-performing assets proportion has scaled up in most of the banks. Impact of this is clearly seen on returns on assets as well as returns on net worth of these banks over a span of five years. Decreasing level of interest income as compared to total income, clearly indicate the growth in other income avenues of all selected eleven banks.

24 Sonaje and Nerlekar
IMR (Indira Management Review) Volume XI, Issue II, December 2017
Conclusion Financial performance analysis of an individual entity is easier as compared to the industry; specifically for banking, the traditional approach of ratio analysis under the CAMEL approach is preferred. The sample of banks in this article represents the top eleven banks in a country with respect to market capitalization. This study can be further extended for all public sector, private sector and foreign banks for better analysis of the banking industry. During this study, author has also observed a new tool for efficiency measurement, Data Envelopment Analysis (DEA). Further scope for the study is to use DEA model and benchmark the inefficient banks for improvement in the performance of the non efficient ones. This study is restricted to ranking of the banks based on CAMEL parameters and analyzing the performance of the banks based on these rankings. Further study can be extended to compare the performance of the banks based on management style. This study gives a brief idea about the position of the top banks in India. It also helps to understand the impact of various parameters on profitability of the banks. Risk profile, liquidity position, asset quality, earning approach and management quality can be estimated and further action can be taken for better performance of the banks. This study clearly shows that private sector banks have outperformed the public sector banks on all the parameters discussed above. Finally, the results and interpretations are subject to the secondary data obtained from annual reports and databases. Hence, the findings of the study are suggestive rather than conclusive and more investigation needed to address the issues identified.
References [1] Sathye, M. (2005), “Privatization Performance and Efficiency: A Study of Indian Banks”, Vikalpa: The Journal of
Decision Makers, Vol. 30(1), pp. 7–16. [2] Nimalathasan, B. (2008), “A Comparative Study of Financial Performance of Banking Sector in Bangladesh–An
Application of CAMELS Rating”, Annals of University of Bucharest, Economic and Administrative Series, Nr. 2, pp. 141–152.
[3] Manoj, P.K. (2010), “Financial Soundness of Old Private Sector Banks (OPBs) in India and Benchmarking the Kerala based OPBs: A CAMEL Approach”, American Journal of Scientific Research, Issue 11, pp. 132–149.
[4] Prasad, K.V.N. and Ravinder, G. (2012), “A CAMEL Model Analysis of Nationalized Banks in India”, International Journal of Trade and Commerce, Vol. 1(1), pp. 23–33.
[5] Mishra, A.K., Sri Harsha, G., Anand, S. and Dhruva, N.R. (2012), “Analyzing Soundness in Indian Banking: A CAMEL Approach”, Research Journal of Management Sciences, Vol. 1(3), pp. 9–14.
[6] Reddy, K.S. (2012), “Relative Performance of Commercial Banks in India using CAMEL Approach”, International Journal of Multidisciplinary Research, Vol. 2(3), pp. 38–58.
[7] Gupta, R. (2014), “An Analysis of Indian Public Sector Banks using CAMEL Approach”, IOSR Journal of Business and Management, Vol. 16(1), Ver. IV, pp. 94–102.
[8] Kaur, P. (2015), “A Financial Performance Analysis of the Indian Banking Sector using CAMEL Model”, The IUP Journal of Bank Management, Vol. 14(4), pp. 19–33.
[9] Padmalata, S. and Paul, J. (2015), Management of Banking and Financial Services. Delhi, Delhi: Pearson. [10] Vishwanathan, N.S. (2016, August), “Asset Quality of Indian Banks: Way Forward”, Speech at National Conference
of ASSOCHAM, New Delhi. Retrieved from https://www.rbi.org.in/Scripts/BS_SpeechesView.aspx?Id=1023 [11] RBI (2012, June), “Review of Supervisory Processes for Commercial Banks”, Report of the High Level Steering
Committee, RBI. [12] Gowri, M. and Ramya, G. (2013), “An Empirical Study on Banking Sector with the Use of CAMEL Model”, Sona
Global Management Review, Vol. 8(1), pp. 10–20. [13] Mittal, M. and Dhade, A. (2009), “Awareness and Perception of CAMEL Rating Across Banks: Some Survey
Evidence”, The Icfai University Journal of Bank Management, Vol. 8, No. 2, pp. 51–63. [14] Nandi, J.K. (2013), “Comparative Performance Analysis of Select Public and Private Sector Banks in India: An
Application of CAMEL Model”, The Journal of Institute of Public Enterprise, Vol. 36(3 & 4). [15] Singh, Y. (2016), “A Comparative Analysis of the Operating Efficiency of Indian Scheduled Commercial Banks”,
The IUP Journal of Bank Management, Vol. 15(2), pp. 38–49.

IMR (Indira Management Review)
Volume XI, Issue II, December 2017
Autonomous Vehicles: Is it Only a Dream?
Sanjay Ahire Sr. Process Engineer, Ford Motor Company, Westland, Michigan,
Owner Finite 4 LLC (USA) & Trileehiretech LLP, India
Abstract: Our civilization is at a juncture in the history where the latest engineering and the cutting edge technologies are pushing the development of the products and the allied services that a human being could only dream of, or saw it in the Sci-Fi movies. This paper looks at the viability, feasibility and the reality behind the tipping point in the transportation industry which is being touted as the major disruption or a game changer—named Autonomous Vehicles (AV) or driverless cars. Many experts have predicted the year 2025 as the key milestone year that will see the demand touching a trillion US dollars and with that market potential, there is a gold rush to grab that pie of the market. Another aspect that the paper explores is the allied and affiliated markets such as manufacturing in the automotive, transport or mobility services by the service providers and the freight transporters that goes with this. Going the high tech route, questions are being raised how real is the dream, if that is a dream at all. Are we, in fact, okay to delegate the activity of driving to a certain Artificial intelligence (AI), or, are we ready to repose that much faith in the hands of the machine and be safe? One thing is for sure, the race is ON.
Fig. 1: Image Credit: AlealL/ Getty Images
Introduction Per Elon Musk, the owner of Tesla, leading Electric vehicle manufacturer, within a span of a couple of years, people will be travelling, sleeping or working to their offices. He is a dreamer and has proved many pundits wrong in many of his previous predictions. However, this one needs careful evaluation and analysis. Experts are of the opinion that the AVs could be a practical case in point only in a span of about 10 years from now. See image below to underline the point.

26 Ahire
IMR (Indira Management Review) Volume XI, Issue II, December 2017
Fig. 2
As there are many other obstacles that are beyond the technological realities of today, to look at closely where we are:, prominently, cars of today need drivers to do most of the activities that are defined as driving, signals, steer, pedals and more. There are levels that have been designated as industry standards and it goes from 0 to 5 in ascending order of level of automation.
Fig. 4
Picture courtesy: The National Highway Traffic Safety Administration (NHTSA)

Autonomous Vehicles: Is it Only a Dream? 27
Volume XI, Issue II, December 2017 IMR (Indira Management Review)
Talking of the mishaps and accidents, it was thought that the AVs could be far safer bets in terms of decision-making resulting in making them less accident prone. However, the new report that is published reveals that the truth is farther than that. It is only a bit safer than what has been pictured and envisioned. What has been put forth is that it is better that we adapted to this vision. The data collected can be used for lessons learnt and to fix the technology gap and subsequently making it safer for the generations to come. If we were to be daring enough and forecast, roughly a million plus lives could be saved over a span of half century. Fact check states that we are not in the mood to wait and watch. The reality is, they are seen everywhere on the streets of Arizona, Manhattan, San Francisco, Boston, Paris, Beijing and Munich to name a few.
One of the other areas of concern that has raised its head on the topic is the privacy. Since these vehicles will know the frequent places that were visited by the user, the businesses could build around the profile and the data generated could be a vicious thing to control, if it is not already secured. The intelligent transport systems that is being tagged proudly, has been reviewed and a USD 50 million was bid to develop technology in an attempt to reduce traffic jams and the data security. Questions are being evaluated on the data ownership and the need to have federal regulations on the data openness and security. One of the major objectives of the bid mentioned above is to improve the movement of people and the goods and streamline the road traffic. Road accidents in a country like Australia cause a burden on the society which ranges to a tune of 30 billion dollars. If the AVs work reasonably well, one can imagine the cost savings and the life savings.
Data management has come to be discussed in the same breath due to the need to handle the generated data. Various categories of data, like non-sensitive data, traffic congestion, personal such are the whereabouts, and the secret or intellectual property data. Idea is to use the AI to collect important data to understand the trends and such other details. They call it as rolling data, for, say last minutes or so. Data analytics is being roped in to mine the data and make sense out of it.
Objectives The objective of this paper is to provide an encompassing review of overall trends and opinion son autonomous vehicles and its allied industries and introduction to the real life scenarios. A few of the overall objectives of writing this paper are as follows:
Understand the Motives of the Players: Perception of the users to find if the players such as Google, Amazon, BMW, or other players to add value in terms of minimizing accidents and saving human lives and add convenience, or it is just the garb.
Real Benefits and the Inclination: Are the users seeing the foreseeable benefits and how that may be real as per them? What are the inclinations of the users and how much do they buy in the vision they have been demonstrated aka promised.

28 Ahire
IMR (Indira Management Review) Volume XI, Issue II, December 2017
User Fears: Does the common driver or rider think this is a good idea to put your life in some machine’s hand everyday? Do they have inherent fears of getting off and taken for a ride?
Cost Saving: Does the user actually believe when they are told that the holistic approach taken by the vehicle mobility companies is to provide vehicles to the common public at a less cost without the hassle of owning it.
Privacy: Do the users accept the compromise on the data that will be shared? What’s the readiness to open up Pandora’s Box of private data to the world of big data?
Fig. 4
Method Methodology that was followed includes brief surveys and detailed interviews. We had various opportunities to interview participants, and sample selected from the peers from various offices and allied suppliers. Outside work, participants included people from friends, family, local garage owners, conferences attended on various manufacturing and automotive topics in the USA, India and other regions from Europe, namely England and Germany. A few in the areas of China and Australia were talked to. A total of more than 100 participants were interviewed either briefly or in details. A sample of around 60% were from the US, 25% were from the EU and the remaining from the Asia Pacific region. Later, the studies were combined to present as the findings and conclusion.
Other than the primary data, secondary data from various research journals were used to understand the trends. Also, various conferences, supplier meets and the user group meetings were also forms of inputs.

Autonomous Vehicles: Is it Only a Dream? 29
Volume XI, Issue II, December 2017 IMR (Indira Management Review)
The modus operandi for the interviews was either face-to-face, WebEx, Skype or audio only. The tool used was the descriptive questionnaire that was designed using samples created with the help of subject matter experts. The sheets of the questionnaire were improved and enhanced as we went along the research on the topic. The online surveys were created on the websites with the help of website developers. The results were ported out and a summary of the overall study was used to predict the findings and the conclusions.
Findings Following were some of the interesting findings during our study:
Happy Versus Unhappy Riders: There were group of people who think they can be happy riders. They were not worried that the robot like system will transport them door-to-door. They were of the opinion that they need not see all the technologies being deployed in the vehicle for them to believe. Actually it is the reverse. They imagine it could be distraction and worrying if all the details were allowed to them. There is another drastically other sets of riders who are extremely scared to venture in. So, the split we gathered was almost half-and-half. However, they see a tremendous economic benefits in the entire food chain.
Fig. 5
Steering Wheel: Most handled equipment in the moving vehicle it is. However, the survey shows that the participants wanted this to be completely taken out. They were thinking it as a major distraction to have the steering being moved around by some system and not being controlled by them. So, better to be out of sight. People who drank alcohol and the senior citizens preferred that the steering is least important to them. However, the level 4 with full autonomy and human control is the sweet spot of the vehicle independence.

30 Ahire
IMR (Indira Management Review) Volume XI, Issue II, December 2017
Help in Ascending and Descending: One of the concerns that was spoken to us was what happens for the car seats mounting for infants, boarding and on boarding of the senior citizens or handicap riders. They were thinking that the help of the driver is immense in these situations and needs to be answered.
It was the millennials (25–34 age group) those were more welcoming towards the AVs than the Gen-X(35–50 age group). It makes sense as the new crowd wants to be more hands on with phones, tabs and video games rather than driving. However, Gen X are less educated and are scared to jump into something unknown. On the contrary, the more experienced millennials in the age group 25–34 are ready to venture out being in their prime with dollars to spend.
Price Consciousness: Significant price for this technology would drive away the crowd from using it. The more viable it becomes financially, the better usage it will find to become more popular.
Yuppie Crowd and the Geeks: There is a whole new market for these categories irrespective of the age or other demographics. The study finds that this segment has more leaning to use the AVs as they are already using the more advanced features in the BMWs or the Tesla or the Ubers of the world they ride in.
Safety and Privacy: There was the dominant set of group of people who leaned towards the AVs when the topic of safety comes to the fore. The safety factor almost was at the close to the heart of the participants. What is clear is that the focus group has prominent opinion of the technology making sound decisions and keeping us safe. However, for that information sharing and connectivity becomes more important. In which case, it was thought that the balance between the appropriate information shared for the sake of safety without compromising the privacy was an important finding.
Software Hacking and Screw-ups: These issues of taking cars for a ride by the hackers are of significant importance to the prospective riders. There are questions on the backup software support if anything were to go awry makes them ponder if this is worth a ride. Are there jammers and such other gadgets that can be deployed and someone from the control room can help them defuse the situation is what respondents mentioned to the interviewers.
Readiness: Users who can jump into this venture in reality was almost 15% by the end of this decade. So, the remaining 85% still think that the concept is yet to be solidified and made more robust to risk their lives at the hands of the self-driving vehicles.
Discussions Users interviewed had maximum concern on the self-cars ride due to the cyber attacks and the intellectual property protection. The respondents were vary of the various news they saw or read

Autonomous Vehicles: Is it Only a Dream? 31
Volume XI, Issue II, December 2017 IMR (Indira Management Review)
on the social media and articles from the experts or conferences. The concern was if the state is ready with regard to the legislation and the possible safety that the governments can provide the users if the unthinkable happens. What happens if the vehicle is used for some anti-social activities? Identity theft and resulting spiraling effects also had many users interviewed squirm. They were also concerned about the insurance regulations for the cars and the personal injury. As they are no more the driver’s personal liability, compliance with the state and federal regulations and consumer data privacy were the points of interest. The negative responses range from ‘loss of control’, ‘does not feel safe’, ‘idea sounds dangerous’, other trivial points brought up were: they needed someone to talk to in the vehicle, if the driver goes away who they should be talking to? A few of them said we want to have a good visualization of what car is seeing of the roadmap ahead of them in real time. A few of them mentioned that completely automated cars would be better as they felt safe not seeing steering turn without driver in sight, almost like a spooky view. Take away the anxiety and make us more relax. Not only that, they asked if there could be different modes in the vehicle that will be: read mode, sleep mode or wake up mode. Many users mention of the idea of the automated driving to be cool. Affluent class obviously were looking for more: looking for adventure and classy rides which the AVs could be it.
Conclusion This cutting edge has a lot of benefits in making the mobility safe and convenient. Senior citizens are positioned to take advantage of such increased mobility as they can rely on this machine. Age, imagined utility, cost viability, social, lifestyle and overall factors that are the key drivers in accepting this were of prime importance to the respondents. This concept will have an earth shattering repercussions’ in the mankind of the future that was the verdict. As the experience of using the high tech increases, the chances of adapting the technology will improve. So familiarity will make it more normalized in usage. Various age groups has a marked behavioural patterns as discussed during the findings. Young guns would like to be the leaders in adapting. However, very young does not think it as viable due to the affordability and such. The findings point additional miles under the car tyres to be really confident in using this. Also, more research was required on the overall behaviour predictions on the generation difference in extrapolating with the experiences of the past, imagined advantages, technological experiences, and more technological trainings. That’s when the overall plan of the big players will be known and its grandness unraveled. Users always have the suspicion of the reality behind throwing all the big bucks in this upcoming disruption and the motives behind it. The study completely corroborated ulterior motive, if any, from the service providers.
In conclusion, almost 70% of the interviewed say that they believed that the AVs are a reality and that too pretty soon. The opinion however is diverse and widespread. The past cases of sharing the data illegally and the identity theft seem to be of the highest concern, making the users go away from the AVs. Cost becomes secondary if it can provide more security and comfort, especially, of not buying the AVs at all and let the service providers provide the ultimate experience of taking the users safely along point A to point B.

IMR (Indira Management Review)
Volume XI, Issue II, December 2017
Determining the Effects of Six Sigma Application in Healthcare Services: A Theoretical Approach
Dr. Prashant B. Ashturkar1 and Prof. Sandeep L. Sarkale2 1Research Guide, Dept. of Commerce & Management, KRM Mahila College, Nanded (MH)
2Assistant Professor, ASM’s Institute of Professional Studies, Pune (MH)
Abstract: Six-Sigma is a quality improvement strategy i.e. essential to generate nearly perfect products and services. Six Sigma is amongst the best alternative way to confront the weaknesses in Indian healthcare system. The Six Sigma methodology is helpful in reducing queuing time, waiting time, faulty medical records, diagnostic result turnaround times, accounting procedures, patient’s staying time, in-patient andout-patient departments, medication errors etc. Six Sigma, along with Lean thinking, can be an operational context for creating methodical efforts in healthcare. By implementing Six Sigma, the organizations can regulate healthcare cost, improve quality and be able to provide better healthcare services.
Keywords: Healthcare, Quality, Service, Patient
Introduction Healthcare is one of India’s largest service sectors. India’s flourishing economy is having average income levels, growing urbanization, creating an increasing middle class and responsiveness towards health services. Healthcare is a service industrythat has certain unique features. In healthcare organizations, patients may be considered as customers. The services which are provided by healthcare organizations are very important as it directly involves the human element;this is the reason why government is directly regulating this sector. Patient care meaningfully comprises human component as compared to machine elements, in which the unpredictability is restrained and very difficult to quantify. The challenges which healthcare faces are significant, from the need to decrease mortality rates, develop physical infrastructure, necessity to provide health services, certifying availability of skilled medical people etc. There are significant scarcities of hospital beds and competent medical personnel such as doctors and nurses. At the present time, healthcare organizations are composite systems that tend towards improving quality of care and meeting rigid guidelines. Therefore, re-examining the method of assessing the service performance is becoming more important.
The price of medical care is growing at a distressing and indefensible amount worldwide. Undoubtedly, a noteworthy proportion of these price increases can be credited to an aging population and technological developments. The Six Sigma approach improves service quality and customer satisfaction by decreasing the cost of process and increasing business revenue. Healthcare organizations started using this concept after it was fully developed, tested and implemented successfully in organizations such as Toyota and General Electric. The Six Sigma approach is useful in reducing queuing time, waiting time, faulty medical records, diagnostic result turnaround times, accounting procedures, patient’s staying time, in-patient andout-patient

Determining the Effects of Six Sigma Application in Healthcare Services: A Theoretical Approach 33
Volume XI, Issue II, December 2017 IMR (Indira Management Review)
departments, medication errors etc. It also helps the healthcare centre to accomplish continuous improvements in the healthcare service by ensuring accurate results in a well-organized manner. This methodology helps to diagnose and treat patients with a quality of care.
History of Six Sigma Six Sigma is presently a prevalent and extensively realistic program for quality advancement. It was originally developed to uplift Motorola’s in-house quality management practices in 1987, but has since extended its importance after acceptance and implementation by General Electric in the mid-1990s (Harry and Schroeder, 2000; Snee and Hoerl, 2003). Though this concept is the consequence of a series of developments in quality management that started in the early 1930s (Box and Bisgaard, 1987; Garvin, 1988; Snee, 2004), Lean Thinking and Six Sigma have gone through similar developments in recent years. Both the approaches are now widely used in administrative and service areas, although they were previously applied to the manufacturing practices (Snee & Hoerl, 2004).
Six Sigma is positioned by going through the enhancement and improvement projects. Project selection is typically constructed on a conversion of the company’s business strategy into operational goals and objectives (Pyzdek, 2004). The platform is categorized by its customer-driven approach, importance on decision making, centred on careful investigation of quantitative data, and a significant cost minimization (Bisgaard & Freiesleben, 2004). Typical Six Sigma projects include improving quality, reducing defectsand variations, and growing output but usually involve organised process innovation (Bisgaard & De Mast, 2005).
Objectives of Work 1. To determine the various effects of Six Sigma methodology on healthcare sector.
2. To find out the constituents which affects the service quality in healthcare sector.
3. To study the importance of Six Sigma methodology in healthcare sector.
Research Methodology This paper is solely based upon secondary data. As this is a theoretical approach, the data for this work is organized and collected from various research papers, journals, books, magazines etc.
Though it is impossible to classify the various approaches to discipline with rigid discriminations, so the researcher used a broad classification to streamline the things about six sigma methodology; having the terms such as a concept, overview, recombination, simplification, assumption, feasibility, application of theory. By this terms, one can check the applicability of Six Sigma can easily.

34 Ashturkar and Sarkale
IMR (Indira Management Review) Volume XI, Issue II, December 2017
What is Six Sigma? Six Sigma is the amount of quality which brings the excellence in all departmental practices in an organization. It is a technique or method of reducing defects using disciplined, data focused and driven methodology. In Six Sigma, all the procedures are led for six standard deviations between the mean and nearest measurement limit, in any progression related to various activities like manufacturing, services, health care. Six Sigma demonstrates the statistical representation of a process and its execution. To attain Six Sigma, a method or a process should not produce more than 3.4 defects per million opportunities. Anything which is exterior and not meeting the customer expectations is called as Six Sigma defect. Six Sigma defects can be reduced by implementing the standard and well organized practices.
Six Sigma in Healthcare By analysing patients’ needs and wants along with their expectations for quality, healthcare organizations may deliver better services to improve patient care. There are many scholars who say that Six Sigma is made known to meaningfully impact healthcare management, practices, and direct patient care, resulting in both cost reductions and quality improvement.
Although the need is to transfer patients more rapidly from one department to another, such as the emergency department to a hospital room, or improve turnaround times for laboratory procedures, Six Sigma can be helpful for healthcare organizations to maximize resource utilization, eliminate waste and get the benefits, like reducing costs and increasing patient satisfaction.
Wastage in Healthcare Sector according to Six Sigma Any activity which does not directly add value to customer is called as waste by Six Sigma:
Table 1
Waste Definition Example in Healthcare Over production Creating more than the customer needs Pills given early without disturbing staff
schedules, Transportation Movement of Goods, equipment or anything which
does not add value Moving samples, transferring patients for testing, treatment, etc.
Motion Movement of people that does not add value Searching for patients, physicians, documentation, supplies, equipment, etc.
Waiting Idle time produced when any material, information, personnel or equipment is not ready
Patients waiting for bed allotments, admission to emergency departments, testing and treatment, discharge, lab tests results
Over processing The process which does not add value from the customer’s viewpoint
Retesting, Unnecessary documentation, procedures
Inventory Goods, equipment parts, or products on hand thatthe customer wants
Bed allotments, Stock of pharmacy, supplies from laboratory, analysis of samples
Sumant Kulkarni, Pinkesh Kumar Attarwala, Dr. Suren N. Dwivedi

Determining the Effects of Six Sigma Application in Healthcare Services: A Theoretical Approach 35
Volume XI, Issue II, December 2017 IMR (Indira Management Review)
Six Sigma in Practice At its fundamental, the six sigma approach focusses on customer perspectives by refining procedures to eliminate waste and inefficiencies. The application of Six Sigma is based on the following five important principles:
1. Required Value: Explain the value from a customer’s standpoint.
2. Categorise Value Chain: Evaluate the procedural steps; eliminate any step that does not directly add value and leads to attaining a specific goal.
3. Movement without Disturbances: Each and every time possible, eliminate waste.
4. Customer “pulls” Services: Permit the consumer to receive or demand products or services whenever they need; if a customer is not ready to accept a product or service then one should not force them for the same.
5. Follow the Excellence: Adapt the changing environment and analyse the customer’s perspectives to fulfil the required product or service which have utmost prospective improved quality.
Success Ingredients of Lean Six Sigma For so many years, the success of Six Sigma is discussed and reviewed in literature world. However, the Six Sigma program to be nurtured by some assured success ingredients. From this intuition, the literature world has done a systematic review to bring into notice the essential critical success ingredients of Six Sigma. These success ingredients and methodologies of Six Sigma are listed below (Byrne et al., 2007; Delgado et al., 2010; Naslund, 2008; Nonthaleerak and Hendry, 2008; Snee, 2010):
Deployment Process of Six-Sigma Projects In practice, Six Sigma assignments are executed in five phases usually comprising of ‘Define–Measure–Analyse– Improve–Control (DMAIC)’, where DMAIC focuses on eliminating defects by reducing variability in operation.
Define: the customer, their quality problems/issues and project objectives.
Measure: the performance of steps and procedures involved
Analyse: the collected data and process map. Identify causes and effects, if anything goes wrong find solution to minimize it.
Improve: the process by scheming innovative solutions
Control: the processes by continue quality improvements practices

36 Ashturkar and Sarkale
IMR (Indira Management Review) Volume XI, Issue II, December 2017
DMAIC Methodology However, there are various tools and techniques which are used in different types of methodologies in a Six Sigma program. Thus, it seems that DMAIC approach adopted some of these tools and methods in order to be implemented effectively. For this reason, the basic tools in each stage are listed below:
1. D = Define: Pareto analysis, map program
2. M = Measure: Descriptive statistics, process capability analysis, Six Sigma metrics, MSA, FMEA, and QFD
3. A = Analyse: Detailed process map, fishbone diagram, test cases, correlation analysis and regression
4. I = Improve: Design of experiments, probability plot, and scatter diagram
5. C = Control: Statistical process control, check sheets, hypothesis tests
Other Six Sigma Tools and Techniques These are various practical methods and skills developed by Six Sigma project teams to cope up with quality related issues for getting performance improvement (Aboelmaged 2010). While Six Sigma tools always have particular roles which are often focussed, Six Sigma technique has a broader application and needsprecise skills, creativity and training (Antony, 2004). Six Sigma tools comprises of Pareto analysis, process mapping or process flow chart, Gantt chart, root cause analysis, affinity diagrams, histograms, run charts, quality function deployment (QFD), brainstorming, etc. Six Sigma techniques include statistical process control (SPC), suppliers-input-process-output-customer (SIPOC), process capability analysis, benchmarking, etc. Furthermore, a Six Sigma technique can employ numerous tools. For example, statistical process control (SPC) is a technique that employs different tools such as control charts, histograms, and root cause analysis, etc. (Antony &Desai, 2009):
Some Statistical Tools (Antony & Desai, 2009) Histogram
Run charts
Scatter Diagram
Measurement of system analysis
ANOVA
Design of experiments
Process capability analysis
Taguchi methods

Determining the Effects of Six Sigma Application in Healthcare Services: A Theoretical Approach 37
Volume XI, Issue II, December 2017 IMR (Indira Management Review)
Effects of Six Sigma on Healthcare Sector Services Decreasing the number of mistakes done by physicians, nurses and operators/technicians
Improving lab turnaround times
Reducing waiting times for appointments
Decreasing the steps in the value and supply chain
Increasing the speed of reimbursement and settlement of insurance claims
But Six Sigma initiatives in healthcare can also bring important organizational benefits for healthcare institutions, comprising the following benefits:
Better patient outcomes: Increase value aimed at patients by providing improved healthcare services that more precisely treat medical conditions and decrease the rates of recurrence.
Increased patient satisfaction: Patients who are satisfied, probably remain loyal with healthcare suppliers who provides quality services in an appropriate manner and are less likely to change healthcare suppliers.
Decreased operational costs: These initiatives characteristically lead to improved operating efficiencies that result into reduced staffing and facilities supplies. Personnel can be organised to perform additional value-added purposes and can be transformed to provide new or extended services.
Robust financial performance: By improving efficiency and decreasing expenses, healthcare organizations can accomplish stronger financial results.
Better employee engagement: Empowered personnel are more engaged, and are likely to display higher levels of job satisfaction. These efforts can result into improved employee retention and condensed turnover rates.
Implementation Challenges of Six Sigma in Health Care Six Sigmain healthcare sector can come across many challenges as health care sector work in a different way than other manufacturing sectors. Key challenges of this sector are discussed here. (Fawaz Abdullah, 2003)
Customer Satisfaction Six Sigma implementation needs different mindset from higher management and also from the employees of organization. Customer satisfaction is a very important criteria in healthcare sector as it includes focus on numerous customer supplies and the services delivered.

38 Ashturkar and Sarkale
IMR (Indira Management Review) Volume XI, Issue II, December 2017
Changing Customer Desires There are lots of variations in customer’s wants to obtain healthcare services. These desires are not predictive and incline to change according to condition.
Different Types of Services Healthcare sector often provides different types of services to customers and they vary from customer-to-customer. It becomes extremely challenging to maintain record and insufficiencies in these many service offerings.
Lack of Information Healthcare industry has diverse types of challenges. Most of these challenges come from:
1. Less consideration of quality
2. Ever changing and flexible customer desires
3. Improper data management system
4. Lack of personnel and other resources management practices
5. Unskilled middle level and lower level management
Conclusion Healthcare service industry is facing a lot of challenges and competition. Implementing Six Sigma is very significant to improve the quality practices of these services. Six Sigma can definitely be used to categorise and reduce many wastes and mistakes in patient carefulness and increase patient satisfaction.
Healthcare service providers are going through the transformation and the management of these organizations are pursued to create and implement advanced techniques to increase the quality of service and reduce costs. Traditionally applied in production and manufacturing, these practices are currently being implemented in non-manufacturing and production interrelated settings containing healthcare environments. Six Sigma provides substantial benefits over quality improvement simulations by improving efficiency and reducing waste while instantaneously refining quality of patient care. Six Sigma specifically focuses on increasing value and has the potential to provide balanced effect in healthcare, increase the job satisfaction of healthcare professionals, and essentially improve the health of our societies.
References [1] Aboelmaged, M.G. (2010), Six Sigma Quality: A Structured Review and Implications for Future Research”,
International Journal of Quality & Reliability Management, Vol. 27(3), pp. 268–317. [2] Antony, J. (2004), Some Pros and Cons of Six Sigma: An Academic Perspective”, The TQM Magazine, Vol. 16(4),
pp. 303–306.

Determining the Effects of Six Sigma Application in Healthcare Services: A Theoretical Approach 39
Volume XI, Issue II, December 2017 IMR (Indira Management Review)
[3] Antony, J. and Desai, D.A. (2009). “Assessing the Status of Six Sigma Implementation in the Indian Industry: Results from an Exploratory Empirical Study”, Management Research News, Vol. 32(5), p. 413.
[4] Antony, J., Kumar, M. and Madu, C.N. (2005), “Six Sigma in Small and Medium Sized UK Manufacturing Enterprises”, International Journal of Quality & Reliability Management, Vol. 22(8), pp. 860–74.
[5] Bisgaard, S. and Freiesleben, J. (2004), “Six Sigma and the Bottom Line”, Quality Progress, September, Vol. 37, pp. 57–62.
[6] Byrne, G., Lubowe, D. and Blitz, A. (2007), “Using a Lean Six Sigma approach to Drive Innovation”, Strategy & Leadership, Vol. 35(2), pp. 5–10.
[7] Abdullah, Fawaz (2003), “Lean Manufacturing Tools and Techniques in the Process Industry with a Focus on Steel”, PhD Thesis, University of Pittsburgh.
[8] Garvin, D.A. (1988), Managing Quality: The Strategic and Competitive Edge, New York: Free Press. [9] Harry, M.J. (1997), The Vision of Six Sigma, 5th ed., Tri Star, Phoenix, Arizona. [10] India’s Healthcare System–Overview and Quality Improvements, Reg. no. 2013/012 Swedish Agency for Growth
Policy Analysis Student Plan 3, SE-831 40 Östersund, Sweden. [11] Naslund, D. (2008), “Lean, Six Sigma and Lean Sigma: Fads or Real Process Improvement Methods”, Business
Process Management, Vol. 14(3), pp. 269–287. [12] Fursule, Nilesh V. and Bansod, Satish V. (2012), “Understanding the Benefits & Limitations of Six Sigma
Methodology”, International Journal of Scientific & Research Publications, Vol. 2, Issue 1, January 2012, ISSN: 2250-3153, pp. 1–8.
[13] Nonthaleerak, P. and Hendry, L. (2008), “Exploring the Six Sigma Phenomenon using Multiple Case Study Evidence”, International Journal of Operations and Production Management, Vol. 28(3), pp. 279–303.
[14] Pyzdek, T. (2004), “Strategy Deployment using Balanced Scorecards”, International Journal of Six Sigma and Competitive Advantage, Vol. 1(1), pp. 21–28.
[15] Snee, R.D. (2004), “Six Sigma: The Evolution of 100 Years of Business Improvement Methodology”, International Journalof Six Sigma and Competitive Advantage, Vol. 1(1), pp. 4–20.
[16] Snee, R.D. and Hoerl, R.W. (2004), Six Sigma Beyond the Factory Floor, Upper Saddle River, NJ: Pearson Education.
[17] Kulkarni Sumant, Attarwala, Pinkesh Kumar and Dwivedi, Suren N. (2011), “Application of Lean-Six Sigma to Improve Quality in Healthcare Industry”, p. 5.
[18] Desai, Tushar N. and Shrivastava, R.L. (2008), Six Sigma–A New Direction to Quality and Productivity Management, WCECS 2008, October 22-24, 2008, pp. 1047–1052.
[19] Final_Applying-Lean-Principles-to-Improve-Healthcare-Quality-and-Safety retrieved from https://library.ul.com/wpcontent/uploads/sites/40/2015/02/UL_WP_ _v11_HR.pdf
[20] six-sigma/six-sigma-improving-healthcare Retrieved from https://www.villanovau.com/resources/ /#.WfwT64-CwdU

IMR (Indira Management Review)
Volume XI, Issue II, December 2017
Assessing the Role of Instrumental Attributes in Employer Branding
Swati M. Yeole Associate Professor, ASM’s Institute of Business Management & Research, Pune
Abstract: Attracting and retaining the most talented employees is crucial for organizational success and survival. Organizations’ perceived image as an employer has been identified as one of the main determinants of job seekers’ attraction to organizations (Highhouse, Zickar, Thorsteinson, Stierwalt, and Slaughter, 1999). Employer image consists of individuals’ perceptions of what is distinctive, central, and enduring about the organization as a place to work (Highhouse, Brooks, and Gregarus, 2009). It has become a challenge for the organizations to create and change their employer image to attract the right employees, a process called employer branding (Edwards, 2010).
Further, the shortage in labour market has made it important for the organizations to stand aside or to be prominent from their competitors in the war for talent and to be seen as attractive employer for prospective applicants. So, the focus in this study is on instrumental image traits and its’ influence on young students.
Keywords: Branding, Employer Branding, Instrumental Attributes, Organizational Attractiveness, Intention to Apply
Introduction Today’s successful and esteemed organizations are known for their visionary business practices so that they are considered for their reputations and positions as employers of choice. These companies all share one common characteristic—astrong employment brand. Employment brand is an attitude that prospective candidates and existing employees consider.
As per NASSCOM, the employment generation estimated by IT-Sector in India in 2010-3.7 million,2011-4.0 million, 2012-4.4 million, 2013- 4.7 million, 2014-5.3 million, 2015, 5.8 million, 2016-6 million (IT and ITeS-January-2017.pdf).It makes the demand for organizations to seek to fill the jobs fast. On the other hand, the country educates 600,000 engineers per annum and reckonings about four million students in its engineering colleges but employability is a critical issue (Gautama Das, Business Today, 2013). Different surveys reveal that just one in four engineers in India can be led to a job, and that too after training. This situation pressurise the organizations to create a strategy that could pull together the best applicants.
The transition from the industrial era to the knowledge era has changed the situation and supply and demand for talent is preferred which is biased towards talented employees. To acquire the talent, companies change their employer brand efforts to moderate talent limitations. In this situation, organization brand and its workforce become the most important competitive advantage for the organizations in the new economy. So, employer brand can be a long term solution for an organization to attract, recruit and retain the personnel from the labour market.

Assessing the Role of Instrumental Attributes in Employer Branding 41
Volume XI, Issue II, December 2017 IMR (Indira Management Review)
The concept of brand image was first used by David Ogilvy in 1955.As per him, a brand image is the picture of a brand that people carry in their heads, and customer is ready to pay more for this brand identity as they prefer and consider this brand as superior. The concept is originally developed in marketing. It makes the organization clear about how they can differentiate themselves from competitors in the market as an employer of existing staff, and as a prospective employer to potential applicants and as a supplier or partner to customers.
The concept of brand to HRM was introduced by Ambler & Barrow in1966.They consider employer as brand and employees as customers. Employer branding plays an important role in information technology sector where skilled employees are always in demand. Employee is identity of these organizations as these organizations are into software services and solutions, where employee is the product of an organization and the only source of an organization to provide services and solutions to the client. In addition, the employment in this sector has raised enormously from3.7 million in 2010 to 6 million by 2016.
In addition, these (IT & ITES) organizations build a new one each time as depending on customer and they compete on terms of service they provide to the customer. Employee is the face of these organizations as ‘he’ (employee) represents the organization like a product in the market. Employee is the prime source of these organizations of employer branding, from all perspectives as a symbol in market, product to client, image in public and a profit entity. So, this human being—an employee—is very crucial for this software solutions and services industry.
Hence, it turns out to be more challenging for the organizations to invite the pool of applicants to select the critical resources for organizational success and to retain this resource for organizational progress.
Employer brand makes the organization in the market as a distinctive entity; it is the process of creation of an image in the thoughts of prospective applicants and once this image is fixed, it creates a continuous flow of applicants to an organization. So, a strong employer brand therefore not only increases considerations, but it is also a smart business investment (Sullivan, 1999).
Conversely, candidates have become ‘talentsumers’, who are increasingly selective when looking for an employer and choose an organization in much the same way a consumer chooses a product. As a result, a strong brand is vital if an organization is to remain attractive. It gets more acute when skills shortages in key roles such as IT and engineering arenas. As the economy improves and competition for talent increases, employer branding tells and shows job-seekers why they should choose your organization over all the others.
So, building a strong employer brand needs investment and will require serious time and effort if organizations are to get it right but the rewards are more than worthwhile. Attracting and keeping hold of the best people is the key to competitive advantage in the modern business world and without a compelling employer brand this is nigh-on impossible.

42 Yeole
IMR (Indira Management Review) Volume XI, Issue II, December 2017
Objectives of the Research To evaluate the influence of employer image instrumental traits on applicant’s
organizational attractiveness.
To evaluate the influence of employer image instrumental traits on applicant’s intention to apply.
(Dependant Variable-Intention to apply, organizational attractiveness)
(Independent Variable- instrumental image)
Literature Review Branding
A brand can be defined as a specific name, symbol, or design or more, usually some combination of these – which is used to distinguish a particular seller’s product. Brands are crucial for marketing and business strategy (Doyle). Marketing is about how consumers consider the company’s offer. If company’s offer is seeming as it is same to the competitors, then consumer will be unresponsive and will go for the economy and most available product. If companies contest through price, hardly does it make reasonable profits. So, marketing should drive to generate an inclination for the companies’ brand. If the customer considered a brand better as compared to others, then desires for it and is ready to pay more for his choice so, that this surplus value of the product is known as brand equity.
Brand Image
Brand image can be a perception about the brand by consumers. The target for brand image can be to make sure that consumers keep strong and favourable associations of the brand in their minds. The brand image typically consists of multiple concepts: perception, because the brand is perceived; cognition, because that brand is cognitively evaluated; and finally attitude, because consumers continuously after perceiving and evaluating what they perceive and form attitudes about the brand (Aaker and Joachimsthaler 2002, Keller 1993, 2003; Grunig, 1993). Brand image is the pivotal point of the consumer-based approach.
The employer brand establishes the identity of the firm as an employer. It encompasses the firm’s values, systems, policies, behaviour towards the objective of attracting, motivating and
retaining the organizations current and potential employees.’
Company’s Product Brand and Employer Brand
Organizations deal with brands like a product or company brand in the market and employer brand in the labour market. Both the brands are associated and equally important. A strong product brand can enhance the strength of employment brand; the employment brand can be instrumental to

Assessing the Role of Instrumental Attributes in Employer Branding 43
Volume XI, Issue II, December 2017 IMR (Indira Management Review)
organizational attractiveness for prospective candidates and create perception for intention to apply, or to accept a job offer for organization.
According to CIPD (2008), employer brand is a set of attributes and qualities often intangible, that makes an organization distinctive, promises a particular kind of employment experience and appeal to those people who will thrive and perform to their best in its culture.
Employer brand identifies an organization in the marketplace and makes it unique (Steve Gilliver, 2009). It displays to the existing about the organization as what it is and prospective everyone interested candidates in joining the organization, a clear image of what to expect.
Employer brand is a concept for an employer which makes him differentiated from the competitors. From HR point of view, an organization first makes some value proposition. It is about what the firm provides to the employees as an organization. The prime interest to branding is to attract the prospective candidate, whereas, within the organization, it aims at workforce commitment to the values and organizational goals.
Economic growth has increased the importance of recruitment in the competition for the technically skilled individuals necessary to fill knowledge based jobs (Munk, 1998) and for increasing the utility of selection systems (Boudreau & Rynes, 1985).
According to Dell & Ainspan (2001), organizations have found that effective employer branding leads to competitive advantage which helps employees internalize company values to assist in employee retention. Armstrong (2006) found that the aim of employer branding is to become an employer of choice, a place where people prefer to work. This means developing what Sears (2003) calls a value proposition which communicates what the organization can offer its employees as a great place to work.
Collins and Kanar, in their research paper ‘Employer Brand Equity and Recruitment Research’ have mentioned that there have been initial evidences that Brand Awareness, Associations (Surface and Complex) regarding the organization, as an employer, are related to intentions to apply, and decisions to apply or not to apply, to the company. The concept is gaining more and more importance as there is a competition for best employees as aggressive as customers.
Organizational Attractiveness This concept has been broadly discussed in the areas of vocational behaviour (Soutar & Clarke 1983), management (Gatewood et al. 1993), applied psychology (Jurgensen 1978; Collins & Stevens 2002), communication (Bergstrom et al., 2002) and marketing (Ambler & Barrow 1996; Gilly & Wolfinbarger 1998; Ambler 2000; Ewing et al. 2002).‘Employer attractiveness’ is the envisioned benefit that a potential employee sees in working for a specific organization. The construct may be thought of as an antecedent of the more general concept of employer brand equity. In other words, the more attractive an employer is perceived to be by potential employees, the stronger is that particular organization’s employer brand equity.

44 Yeole
IMR (Indira Management Review) Volume XI, Issue II, December 2017
Instrumental Attributes The employer brand is ‘the package of functional, economic, and psychological benefits provided by employment, and identified with the employing company.’ (Ambler and Barrow, 1996). The basic premise that people associate with both instrumental functions and psychological (symbolic) benefits with a brand is well supported in the marketing literature (Katz, 1960; Keller, 1993, 1998; Shavitt, 1990). Instrumental benefits correspond to product-related attributes. These describe the product in terms of its objective, physical, and tangible attributes linked instrumental attributes to people’s basic need to maximize benefits and minimize costs (Katz, 1960). For example, consumers want to buy a car because it provides them with instrumental functions such as transportation, protection, comfort, and safety. Applied to a recruitment context, instrumental attributes describe the job or organization in terms of the objective, concrete, and factual attributes inherent in a job or organization (Lievensand Highhouse, 2003).
Research Methodology The proposed study would make an attempt to find the impact instrumental attributes on organizational attractiveness.
Research Question What is the influence of instrumental employer image traitsin:
Organizational attractiveness?
Intention to apply?
Choice of Companies: For the research study, organizations will be selected from commonly referred companies in surveys like Best Place to Work, Business Today and Employer Branding Survey. These surveys were observed between the year, 2007 to year 2013. Maximum time referred by companies from IT sector are referred in this survey are selected for the study.
From these surveys, the following 25 organizations are into software services &solutions specifically.
Table 1
Sr. No. Company 1 Accenture 2 Acclaris Business Solution 3 Adea Technologies 4 Aditi Technologies 5 Adobe 6 Aztec Software 7 Brickred Technologies 8 Google 9 HCL 10 Hexaware 11 HSBC

Assessing the Role of Instrumental Attributes in Employer Branding 45
Volume XI, Issue II, December 2017 IMR (Indira Management Review)
12 IBM 13 iGate 14 Infosys 15 Intuit Technologies 16 MindTree 17 Patni 18 Perot Systems 19 Sapient 20 Satyam 21 Sierra Atlantic Software Services 22 Talentica Software 23 Tavant Technologies 24 TCS 25 Wipro
From these 25 companies, following 14 are having their offices in Pune. All these companies are with CMM level 5.
Table 2
1 Google 2 HCL 3 Hexaware 4 HSBC 5 IBM 6 iGate 7 Infosys 8 MindTree 9 Patni 10 Sapient 11 Satyam 12 TCS 13 Wipro 14 Accenture
These organizations build a new one each time as depending on customer and they compete on the parameter of service they provide to the customer. Employee is the face of these organizations as ‘he’ (employee) represents the organization like a product in the market. Employee is the prime source of these organizations of employer branding from all perspectives as a symbol in market, product to client, image in public and a profit entity. So, this human being—an employee—is very crucial for the software solutions and services industry.
Hence, it turns out to be more challenging for these organizations to invite the pool of applicants to select the critical resources for an organizational success and to retain this resource for organizational progress.
Hypothesis Instrumental image dimensions describe the organization in terms of pay, benefits, advancement and flexible working hours and opportunities. Job seekers are attracted to these instrumental attributes on the basis of their practical need to maximise beni ts.So, these traits make the

46 Yeole
IMR (Indira Management Review) Volume XI, Issue II, December 2017
applicants to be more attractive and intend to apply to these organizations with this instrumental image. So hypotheses are:
H.1. Instrumental image dimensions are positively related to:
employer attractiveness and
intention to apply.
Measures and Scale
Table 3
Construct Sources Instrumental Attributes Lievens,Highhouse,2003
Organizational Attractiveness Intention to Apply
Validity and Reliability Validity explains how well a test measures what it is supposed to measure. Reliability explains the degree to which an assessment tool produces stable and consistent results.
Cronbach’s measures reliability, or internal consistency. The value of Cronbacfrom 0 to 1. The questionnaire is generally regarded as reliable when the coefficient is 0.70. As per this guideline, the objects in Q1 of the questionnaire deals with instrumental values of employer brand whereas Q2 is about the organizational attractiveness and intention to apply. The coefficient of Q1 is 0.890. Q2 is 0.778 which placate the circumstances to be regarded as reliable.
Unit of Analysis It is individual.
Sampling Young students from UG and PG are considered for the study. Population of graduates is from engineering third year, fourth year students and who have completed engineering and have some work experience whereas post-graduates are final year MBA students who have completed their MBA and have some work experience. Simple random sampling method is used for the study. Students from Pune University affiliated colleges were aimed for the study. Apart from this, students who visit the job fair were another source for data collection for the study.
So, student sample of 1400 UG and PG students was taken for the study. Mean age was 23 years (SD = 1.17). Forty percent students are with work experience of around 2 years. Students, who are more keen towards the IT industry, were asked to fill the questionnaire.
Data Collection Data is collected from using a standard questionnaire. The sample is mixture of graduates and post-graduates for the study.

Assessing the Role of Instrumental Attributes in Employer Branding 47
Volume XI, Issue II, December 2017 IMR (Indira Management Review)
Major collection of student data is through job fairs. Job fairs under employment exchange and self-employment guidance centre are held where the crowd of applicants or jobseekers quite in a high number visit for employment. So, with respect to the sample, researchers make use of job fairs organized at the respective college. UG and PG students were randomly assigned and completed a 3-page questionnaire. Students’ contribution for the study was voluntary and secret. Apart of these students from randomly selected engineering and management colleges affiliated to Pune University were randomly assigned and completed a 3-page questionnaire. The data for 1400 students is collected through extensive efforts.
Questionnaire: The questionnaire is designed as per the scales and objectives of the research. Respondents were asked to rank their opinions on 1-7 Likert scale (‘strongly disagree’ to ‘strongly agree’). The projected time to answer the complete survey was projected around 10 minutes.
Table 4
Instrumental Attributes Salaries are high in this brand/organization Employees are frequently promoted/offers opportunities for career advancement People who work in this brand have a solid job When you work, it will always be busy This organization is close to where I live This brand has a good benefit package/offers opportunities to work abroad This brand has flexible work hours Organizational Attractiveness This brand is attractive for me as a place of employment For me, this brand would be great place to work A job at this brand is very appealing to me I am interested in learning more about this brand Intention to Apply I would accept a offer from this brand I intend to apply for a position at this brand I would very much like to work for this brand
Data Analysis and Interpretation Results
Table 5
Characteristics Example Item Instrumental Mean SD t-value
(Organizational Attractiveness)
t-value (Intention to
Apply) (pay) Salaries are high in this brand/organization 4.68 1.696 9.731 6.878 (advancement) Employees are frequently promoted/offers
opportunities for career advancement 5.01 1.470 2.452 2.723
(job security) People who work in this brand have a solid job 4.99 1.573 3.743 2.629 (task demands) When you work, it will always be busy 4.93 1.492 5.155 4.909 (location) This organization is close to where I live 4.70 1.699 1.120 1.003 (benefits) This brand has a good benefit package/offers
opportunities to work abroad 4.98 1.515 6.858 7.398
(flexible working hours)
This brand has flexible work hours 4.87 1.523 7.438 5.426

48 Yeole
IMR (Indira Management Review) Volume XI, Issue II, December 2017
The traits were evaluated on Likert, 7 point scale on 1 = strongly disagree and 7=strongly agree (dependent variable: organizational attractiveness, intention to apply)
Table 5 explains the mean, standard deviations, for organizational attractiveness and intention to apply in the sample of students. T-tests specify that four out of the seven traits were evaluated significantly higher for organizational attractiveness as an establishment. T-tests also indicate that three of the traits (pay, flexible working hours and benefits) were considered to be more significant instrumental attributes to organizational attractiveness. For intention to apply as an employer, t-tests indicate that four of the seven traits were evaluated significantly higher. T-test also indicate that three of the traits (benefits, pay, and flexible working hours) were considered to be more significant instrumental attributes to intention to apply.
Table 6: Means, Standard Deviations and co-relations
Mean Std. Deviation
1 2 3 4 5 6 7 Org Attractiveness
Pay 4.68 1.696 1 Advancement 5.01 1.470 .575** 1 Job Security 4.99 1.573 .579** .535** 1 Task Demands 4.93 1.492 .479** .441** .449** 1 Location 4.70 1.699 .448** .422** .470** .393** 1 Benefits 4.98 1.515 .537** .393** .507** .504** .421** 1 Flexible Working Hours
4.87 1.523 .440** .393** .394** .419** .403** .478** 1
Org. attractiveness
5.0659 1.16925 .593** .464** .505** .490** .405** .543** .494** 1
Table 6 evaluates the means, standard deviations, and intercorrelations among the variables. All variables were considerably associated to organizational attractiveness as an employer. Advancement (r=.46), job security (r =.50), task demands (r=.49), location (r =.40), and flexible working hours (r =.49) and pay (mean r =.59), benefits (r =.54), were most highly correlated with organizational attractiveness.
Table 7
Coefficientsa Model Unstandardized Coefficients Standardized Coefficients t Sig. Correlations
B Std. Error Beta Zero-order Partial Part 1 (Constant) 1.748 .101 17.367 .000
Pay .181 .019 .263 9.731 .000 .593 .249 .185 advancement .049 .020 .061 2.452 .014 .465 .065 .047 Jobsecurity .072 .019 .097 3.743 .000 .505 .098 .071 Taskdemands .096 .019 .123 5.155 .000 .490 .135 .098 Location .018 .016 .026 1.120 .263 .405 .030 .021 Benefits .134 .020 .173 6.858 .000 .543 .178 .130 Fwh .132 .018 .172 7.438 .000 .495 .193 .141
a. Dependent Variable: orgattractiveness

Assessing the Role of Instrumental Attributes in Employer Branding 49
Volume XI, Issue II, December 2017 IMR (Indira Management Review)
Table 8
Coefficientsa Model Unstandardized Coefficients Standardized Coefficients t Sig. Correlations
B Std. Error Beta Zero-order Partial Part 1 (Constant) 1.795 .115 15.628 .000
Pay .146 .021 .200 6.878 .000 .525 .179 .141 Advancement .062 .023 .073 2.723 .007 .427 .072 .056 Jobsecurity .058 .022 .073 2.629 .009 .453 .069 .054 Taskdemands .105 .021 .127 4.909 .000 .457 .129 .100 Location .018 .018 .025 1.003 .316 .369 .026 .021 Benefits .165 .022 .202 7.398 .000 .515 .192 .151 Fwh .110 .020 .136 5.426 .000 .443 .142 .111
a. Dependent Variable: intentiontoapply
To check the hypothesis, a hierarchical multiple regression analysis was done. As p value is less than 0.5 so all factors are significantly positively co-related with organizational attractiveness and intention to apply. The instrumental characteristics to organizational attractiveness explained pay (b =.18, p <.01), benefits (b =.13, p <.01), flexible working hours (b =.13, p <.01) were significant predictors. The instrumental characteristics to intention to apply explained pay (b =.14, p <.01), benefits (b =.16, p <.01), flexible working hours (b =.11, p <.01) were important predictors. These results are consistent with the hypothesis.
The relationship between respondent’s level for organizational attractiveness and intention to apply with instrumental image attributes is positive. Pay, benefits depicts a strong overall positive association.
Observations & Suggestions 1. The study is an extension for preceding research on instrumental image traits and their
influence on organizational attractiveness and intention to apply to organization as an employer.
2. Analysis emphasize that the instrumental traits really add incremental value in the likelihood of a company’s attractiveness and intention to apply to the firm.
3. Pay, benefits depicts a strong overall positive association as a place of employment.
4. The output enhances the embryonic field of causes that affect to the aspirant’sinitial thoughts or image of organizations.
5. Another important factor of the study highlight on a insight that the trait factors make organization stand out from their competitor’s.
6. These outcomes are well assumed in the process of early recruitment context.
7. In the initial recruitment phases prospective aspirants create many possible jobs and organizations for considerations but keep limited focus on the specific characteristic of the choices grouped.
Conclusion This study endorses the instrumental model for assessing the image as an employer. It can be a guide for competitors. Apart from this, it makes the company to stand aside from the competitors

50 Yeole
IMR (Indira Management Review) Volume XI, Issue II, December 2017
in the same sector. So, organizations can make employee imagery and employment imagery based on this prominent trait factors. Employee imagery can be testimonials and recommendations by employees to make image as a best place to work. Employment imagery can be through the mode of communication about jobs portrayal inpromotion, marketing, staffing material, on website or through social media. So, image-oriented publicity can focus on prominent instrumental attributes such aspay, benefits. Hence Best Employer’ status is something that more and more organizations are struggling to attract the pool of applicants for the best selection process. This organizational attractiveness provides employers competitive advantage as an employer who strives to attract job applicants with appropriate skills and knowledge as per organizational requirements. As appealing aspirants with requisite skills is crucial for organizational success. Organizational attractiveness impact on the perception of applicant’s decision for acceptance of job and intention lead him towards an action for making an application. Instrumental attributes can be one of the prominent factors for making candidates an actual application or accepting job offer.
References [1] Aaker, J.L. (1997), “Dimensions of Brand Personality”, Journal of Marketing Research, Vol. 34(3), pp. 347–356. [2] Barber, A.E. (1998), Recruiting Employees: Individual and Organizational Perspectives, Thousand Oaks, CA: Sage. [3] Cable, D.M. and Graham, M.E. (2000), “The Determinants of Job Seekers’ Reputation Perceptions”, Journal of
Organizational Behaviour, Vol. 21, pp. 929–947. [4] Cable, D.M. and Wban, D.B. (2001), “Establishing the Dimensions, Sources and Value of Job Seekers’ Employer
Knowledge during Recruitment”. [5] Thomas, K.M. and Wise, P.G. (1999), “Organizational Attractiveness and Individual Differences: Are Diverse
Applicants Attracted by Different Factors?”, Journal of Business and Psychology, Vol. 13, pp. 375–390. [6] Turban, D.B. (2001), “Organizational Attractiveness as an Employer on College Campuses: An Examination of the
Applicant Population”, Journal of Vocational Behavior, Vol. 58, pp. 293–312. [7] Turban, D.B. and Keon, T.L. (1993), “Organizational Attractiveness: An Integrationist Perspective”, Journal of
Applied Psychology, Vol. 78, pp. 184–193. Watson, D. (1989). [8] Irenafigurska and Ewamatuska, (2013), “Employer Branding as a Human Resources Management Strategy”, Human
Resources Management & Ergonomics, Vol. VII(2). [9] App, Stefanie, Merk, Janina and Büttgen, Marion (2012), “Employer Branding: Sustainable HRM as a Competitive
Advantage in the Market for High-Quality Employees”, Management Revue, Vol. 23(3). [10] Van, Greet Hoye and Alan, M. (2011), “The Instrumental-Symbolic Framework: Organisational Image and
Attractiveness of Potential Applicants and their Companions at a Job Fair”, Applied Psychology: An International Review, Vol. 60(2), pp. 311–335, doi: 10.1111/j.1464-0597.2010.00437.
[11] Jiang, TingTing and Iles, Paul (2011), “Employer-brand Equity, Organizational Attractiveness and Talent Management in the Zhejiang Private Sector, China”, Journal of Technology Management in China, Vol. 6, Issue 1, pp. 97–110.
[12] Lievens, Filip, Van, Greet Hoye and Schreurs, Bert (2005), “Examining the Relationship Between Employer Knowledge Dimensions and Organizational Attractiveness: An Application in a Military Context”, Journal of Occupational and Organizational Psychology, Vol. 78, pp. 553–572, The British Psychological Society.
[13] Van, Greet Hoye, Bas, Turker, Cromheecke, Saartje and Lievens, Filip (2013), “The Instrumental and Symbolic Dimensions of Organisations’ Image as an Employer: A Large-Scale Field Study on Employer Branding in Turkey”, Applied Psychology: An International Review, Vol. 62(4), pp. 543–557.
[14] Lievens, Filip (2007), “Employer Branding in the Belgian Army: The Importance of Instrumental and Symbolic Beliefs for Potential Applicants, Actual Applicants, and Military Employees”, Human Resource Management, Spring 2007.
[15] Kucherov, Dmitry and Zamulin, Andrey (2016), “Employer Branding Practices for Young Talents in IT Companies (Russian Experience)”, Human Resource Development International, Vol. 19(2), pp. 178–188, DOI: 10.1080/13678868.2016.1144425
[16] Lievens, Filip and Highhouse, Scott (2003), “The Relation of Instrumental and Symbolic Attributes to a Company's Attractiveness as an Employer”, Personnel Psychology, Vol. 56.

IMR (Indira Management Review) Volume XI, Issue II, December 2017 A Study of Customer Awareness of Sustainability Initiatives taken
at Star Category Hotels in Hinjewadi Area of Pune
Dr. Rajlaxmi Pramod Pujar1 and Dr. Suvarna Deshpande2 1Assistant Professor, Indira School of Business Studies, Pune 2Associate Professor, Indira School of Business Studies, Pune
E-mail: [email protected]
Abstract: Sustainability has become a critical business issue for all industries. The growing worldwide tourism industry and its potential impact on the environment has become a hot topic within the global hospitality industry. There has been an increase in the consciousness of sustainability issues over the last decades amongst hoteliers and investors. They have started to consider the impact on the environment and society of hotel development and operations and sustainability issues are now being considered in most aspects of the hotel industry. This study reviews sustainable initiatives undertaken by various international and Indian hotels. A primary research was conducted to understand the awareness of customers regarding various sustainable initiatives carried out at hotel properties of star category (Sayaji, Gateway, Raddison Blu, Holiday Inn and Courtyard), of Hinjewadi area in Pune and whether knowledge regarding the same will have any impact on their purchase decision.
Keywords: HVS-Hotel Valuations and Appraisals, O& M-Operations and Maintenance, LFC-Liquid Food Composter, LEED-Leadership in Energy and Environmental Design
Introduction Goldstein, of HVS said that green in hospitality boils down to the amount of utilities being consumed or waste being produced by a hospitality property each year, and how that can be reduced. Utility savings, lead to reductions in property O&M costs, and that, in turn, leads to operating profitability, which can lead to increases in property valuations. In today’s uncertain economic climate, hotel brands are looking to increase efficiency by using energy management systems to better integrate hotel systems. Cost savings, laws, pressure from the public, customer awareness or increased environmental awareness could all be reasons for hotels to incorporate more sustainable practices to decrease their negative impact on the environment and society. (Sloan et al., 2013). Hoteliers moving to use energy management will essentially save on heating and cooling when guests are not in the room, and reset extreme settings either too high or too low depending on the outside temperature. Individuals and organizations alike are each responsible for the footprint they leave on their neighbourhoods, communities, and world. Therefore, hotels should enhance their sustainable initiatives by increasing awareness and by active customer engagement for reducing the carbon footprint.
Various Initiatives by International Hotels Intercontinental Hotel Group
Some initiatives taken by hospitality majors like IHG’s in-house sustainability program, Green Engage, has been awarded Leadership in Energy and Environmental Design precertification. At

52 Pujar and Deshpande
IMR (Indira Management Review) Volume XI, Issue II, December 2017
the hotel level, green engagement includes electrical usages as well as gas and water. IHG says Green Engage delivers its hotels over $90,000 in annual energy savings and makes their hotels 15 to 20 percent more efficient. New builds are being designed with better sustainability in mind.
Starwood
Starwood’s 2020 initiative, which commits the company to reducing energy consumption by 30 percent and water consumption by 20 percent by the year 2020.Starwood sustainability efforts encompass trying to minimize the use of water and energy and the generation of waste and pollution, seeking to enhance indoor environmental quality and pushing to raise environmental awareness among associates, guests and communities. Data from 2015 found that Starwood Hotels & Resorts Worldwide, for example, reduced its energy use by 12.08 percent, carbon emissions by 16.07 percent and water use by 17.26 percent across all its properties between 2008 and 2014.
JW Marriott
The JW Marriott Marquis Miami continues its commitment to sustainability by investing in state-of-the-art technology with Power Knot’s Liquid Food Composter (LFC). The Liquid Food Composter digests food waste in a clean, sanitary and odourless manner. As a result, it reduces the hotel’s carbon footprint by eliminating the amount of waste sent to landfills and decreasing the amount of methane gases released into the environment. It digests all food within 24 hours and then converts it into nutrient-rich grey water that can be released down the drain or used for landscape maintenance. J W Marriot other green initiatives are water conservation through low-flow plumbing fixtures, linen reuse programs, the installation of energy star appliances and programmable thermostats, and the use of green cleaners and high-efficiency air filters throughout the hotel.
Indian Context
India is emerging as a major global tourism hub and green practices are being increasingly adopted by hotels. The hotels have adopted practices like LEED standards in the construction of hotels use of local products, wind energy devices, compact fluorescent lamps to reuse of linens and installation of green roofs, solar heaters. One of the direct benefits of environmental initiatives in a hotel is cost savings. In fact, there have been instances where energy consumptions have been brought down by 40% in certain hotels. The examples of sustainability in India hotels are as follows
The Park, Hyderabad is one of the first hotels in India to be LEED certified. This LEED Gold certified hotel continues to draw visitors from around the world. The 270 room flagship property of The Park Hotel’s chain of boutique hotels is considered one of the finest luxury hotels in the country.
The Orchid Hotel in Mumbai is Asia’s first certified Five Star Ecotel Hotel. The hotel management has various initiatives in the areas of, energy efficiency, water

A Study of Customer Awareness of Sustainability Initiatives taken at Star Category Hotels 53
Volume XI, Issue II, December 2017 IMR (Indira Management Review)
conservation, solid waste management, environmental commitment and employee environmental education and community. An vermiculture area has been set up in the premises to decompose and convert waste into organic manure. The hotel also uses energy efficient lighting such as LED and CFL. Solar panels have also been installed on the roof of the hotel. The specially designed aerators, taps and special flushes which reduce water consumption are another green feature incorporated in the design of this trendsetting hotel.
The Raintree hotels in Chennai are another good example of green hotels. The wood that has been used in the construction of the hotel includes medium density fiber, bamboo and
rubber wood. The management of the hotel has also ensured that they use cement containing a significant percent of fly ash in the construction of the hotel. Similarly, the hotel has installed a water device called the ‘George Fisher Concealed Cistern’ which uses only six liters of water per flush, as compared to 15-20 liters in the case of a conventional flush. The water that is recycled by the sewage treatment plant at the hotel is used in the air conditioners. The heat that is generated by the air conditioners in the hotel is used to warm the water in the bathrooms.
ITC Hotels, one of the topmost hotel chains in the country, has for instance has come out with its ‘Welcom Environ’ initiative, which has been started in order to propagate environmental causes in the cities where the company’s hotels are located. The guiding
principle behind the initiative is ‘Reduce, Reuse and Recycle’. Each one of the hotels under the initiative has its own programme, encompassing local participation, creating awareness among employees and internal conservation through energy saving gadgets and environment friendly material.
Taj Hotels Resorts and Palaces have implemented the Environmental Awareness and Renewal (EARTH) program, a project which began as a conscious effort to commit to energy conversation and other sustainability strategies.
Fern Hotels & Resorts. has a number of environmentally sensitive hotels spread throughout the country. Some of the top eco features that can be found in these hotels include Ayurvedic toiletries, eco-friendly baskets, water-friendly tap and flushes, cloth bags instead of plastic shopping bags, etc.
A Unique Fuel Alternative for Hotels Carbon Masters, a Bangalore based social enterprise, converts wet waste into biogas, which it then bottles and supplies to restaurants as Carbonlite brand. “Carbonlite cylinders are priced almost at par with LPG cylinders. But through using the former, there is a minimum savings of 15%, when you think of things like an efficient kitchen and a better cooking performance. Carbonlite burns

54 Pujar and Deshpande
IMR (Indira Management Review) Volume XI, Issue II, December 2017
stronger and for longer compared with LPG. They enable a constant run of gas throughout the cooking process. Being liquefied, LPG, on the other hand, decreases in its pressure with usage. Biogas burns better than LPG. The yearly savings are estimated to be ` 3.5 lakh. The
annual spending on LPG is usually ` 25 lakh.” Adopting bio gas as an alternate fuel will help hotels in cost savings.
Objectives of Primary Research 1. To know the awareness regarding sustainable practices carried at hotel property.
2. To understand the readiness of customers to support hotel in its sustainability initiatives.
3. To understand whether in future sustainability would be a criterion for hotel selection.
Research Design for the Study 1. Type of Research: Descriptive Research
2. Type of Sampling: Convenience Sampling
3. Sampling Size: 250
4. Sampling Unit: Customer of hotel
5. Data Type: Primary Data: Questionnaire
6. Analytical Tools Used: Pie Chart, Bar Chart
Data Analysis and Interpretation Q.1) What is the frequency of visit to the hotel?
Table No-1 Visit Frequency
No. of Responses Percentage % Once in a month 63 25.2 Twice in a month 70 28
Frequently 37 14.8 Rarely 80 32 Total 50 20
Fig No 1 Visit Frequency
Data Interpretation: Out of 250 customers 32% of them visit rarely and 28 % visit twice in a month.
0
10
20
30
40
50
60
70
80
Once in amonth
Twice in amonth
Frequently Rarely
63, 25.2%
70,28%
37,14.8%
80,32%

A Study of Customer Awareness of Sustainability Initiatives taken at Star Category Hotels 55
Volume XI, Issue II, December 2017 IMR (Indira Management Review)
Q.2) What is the purpose of visit to hotel?
Table No-2 Purpose of Visit
No. of Responses Percentage % Business 181 72.4% Leisure 69 27.6%
Fig No- 2 Purpose of Visit
Data Interpretation: 72% visit hotel as a part of business and 28% visit for leisure.
Q.3) What is the parameter you consider most while selecting the hotel?
Table No-3 Parameter for hotel selection
Responses % Quality of Service 95 38% Cleanliness 80 32% Room Furnishings 5 2% Ease of Booking 70 28% Others 0 0%
Fig No-3 Parameter for hotel selection
Data Interpretation: Out of 250 customers 38 % consider quality of service as important parameter for hotel selection and next important parameter is cleanliness32 % followed by ease of booking 28%
Q.4) Are you interested in knowing the sustainable practices in hotel?
Table No-4 Interest in Sustainable Practices No. of Responses Percentage %
Yes 203 81.2% No 27 10.8% Can’t say 20 8%
Fig No-4 Interest in Sustainable Practices
Data Interpretation: Out of 250 customers 81.2% are interested in sustainable practices while 8% are not interested.
Business181,
72.4%
Leisure69,
27.6%
Quality of Service, 95
Cleanliness, 80
Room Furnishings,
5Ease of
Booking, 70
Others, 00
20406080
100
Yes203, 81.2%
No27,10.8%
Can’t say20,8%

56 Pujar and Deshpande
IMR (Indira Management Review) Volume XI, Issue II, December 2017
Q.5) Would you support the hotel in its sustainable practices?
Table No5 – Readiness to support
No. of Responses Percentage % Yes 226 90.4% No 24 9.6%
Fig No-4 Readiness to support
Data Interpretation: 90% are ready to support hotel in its sustainable practices.
Q.6) Are you aware about energy conservation practices carried out in the hotel?
Table No-6 Awareness about energy conservation
No. of Responses Percentage % Yes 36 14% No 214 86%
Fig No-6 Awareness about energy conservation
Data Interpretation: 86% are not aware about energy conservation practices carried out in the hotel.
Q.7) Are you aware about waste management practices in hotel?
Table No-7 Awareness about waste management practices
No. of Responses Percentage % Yes 16 6% No 234 94%
Fig No -7 Awareness about waste management practices
Data Interpretation: 94 % are not aware about waste management practices in hotel.
Yes226, 90.4%
No24, 9.6%
Yes14%
No86%
Yes No
6%
94%
YesNo

A Study of Customer Awareness of Sustainability Initiatives taken at Star Category Hotels 57
Volume XI, Issue II, December 2017 IMR (Indira Management Review)
Q.8) Would you to like to save water and electricity?
Table No-8 Readiness to save water and electricity
No. of Responses Percentage % Yes 245 98% No 5 2%
Fig No-8 Readiness to save water and electricity
Data Interpretation: 98% are ready to save water and electricity.
Q.9) Would you agree to reuse linens?
Table No-9 Readiness to reuse linens
No. of Responses Percentage % Yes 130 52% No 120 48%
Fig No-9 Readiness to reuse linens
Data Interpretation: 52% are ready to reuse lines which would lead to water saving.
Q.10) In future will you prefer a hotel adopting sustainable practices over a hotel which does not follow?
Table No-10 Future Decision
No. of Responses Percentage % Yes 198 79% No 25 10% Can’t say 27 11%
Fig No-10 Future Decision
Data Interpretation: 79% would prefer a hotel adopting sustainable practices over a hotel which does not follow.
98% 2%2%
Yes No
100
120
140
YesNo
Yes, 130
No, 120

58 Pujar and Deshpande
IMR (Indira Management Review) Volume XI, Issue II, December 2017
Findings 1. Out of 250 customers 32% of them visit rarely and 28% visit twice in a month.
2. 72% visit hotel as a part of business and 28% visit for leisure.
3. Out of 250 customers 38% consider quality of service as important parameter for hotel selection and next important parameter is cleanliness 32% followed by ease of booking 28%.
4. 81.2% are interested in knowing sustainable practices of hotel.
5. 90% are ready to support hotel in its sustainable practices.
6. 86% are not aware about energy conservation practices carried out in the hotel.
7. 94% are not aware about waste management practices in hotel.
8. 98% are ready to save water and electricity.
9. In future 79% would prefer a hotel adopting sustainable practices.
Recommendations 1. All hotels should increase customer awareness of sustainable practices as most of them
are unaware about the same.
2. They can propagate about environmental issues and seek active participation of customers.
3. They can give complimentary or loyalty points to customers for participation in sustainability initiatives.
Conclusion A review of initiatives taken by various international hotels includes energy savings, minimizing water usage, minimizing generation of waste and pollution thereby reducing carbon footprints. It also includes use of liquid food composter which digests food waste in a clean, sanitary and odourless manner. The initiatives taken by Indian hotels include LEED certification, use of wood for construction, following concept reduce reuse and recycle. An alternate fuel to LPG made from biogas, Carbonlite burns stronger and for longer compared with LPG with minimum savings of 15%. The primary research findings reveal that most customers are currently not aware regarding energy conservation, water management and waste management practices of hotel properties. The customers are ready to support the hotels in their sustainability initiatives like reusing linens saving electricity and water. Infuture, they may consider sustainability as a criterion for hotel selection and support the noble cause of sustainability.
References [1] Sloan, P. Legrand, W. & Chen, J.S. (2013) Sustainability in the Hospitality Industry: Principles of Sustainable
Operations. 2nd edition. New York, Routledge [2] www.hvs.com [3] www.hotelmanagement.net [4] www.masterbuilder.co.in [5] www.outlookindia.com

IMR (Indira Management Review)
Volume XI, Issue I, July, 2017
A Study of E-retailing: Analysing the Factors and Perceptions of Indian Millennials for Online Retailers
Dr. Yogesh D Mahajan Associate Professor, Indira School of Business Studies, Pune
Abstract: Retail industry in India has emerged as one of the most dynamic and fast-paced industries due to the entry of several new players. It is over 10 per cent of the country’s Gross Domestic Product (GDP) and approx. 8 per cent of the employment. India is the fifth-largest global destination in the retail space in the world. India’s retail market is likely to grow at a Compound Annual Growth Rate (CAGR) of 10 per cent to US$ 1.6 trillion by 2026 from US$ 641 billion in 2016. Various online retailers like Amazon, Flipkart etc. are enticing customers through innovative marketing strategies and services. It is necessary to understand factors that drive Indian millennials to a particular online retailer in India and perceptions of millennials towards these online retailers. The paper studies the same in the Indian context. It is found that millennials are more or less satisfied with the services of selected online retailers. It was also found that four factors where statistically significant for millennials for selecting a particular online retailer.
Keywords: Retailing, Millennials, Service Quality, Perceptions
Introduction Retail industry in India has emerged as one of the most dynamic and fast-paced industries due to the entry of several new players. It is over 10 per cent of the country’s Gross Domestic Product (GDP) and approx. 8 per cent of the employment. India is the fifth-largest global destination in the retail space in the world. India’s retail market is likely to grow at a Compound Annual Growth Rate (CAGR) of 10 per cent to US$ 1.6 trillion by 2026 from US$ 641 billion in 2016. India has replaced China as the most promising markets for retail expansion, supported by expanding economy, coupled with booming consumption rates, urbanizing population and growing middle class. India is expected to become the world’s fastest growing e-commerce market, driven by robust investment in the sector and rapid increase in the number of internet users. Various agencies have high expectations about growth of Indian e-commerce markets. Indian e-commerce sales are expected to reach US$ 120 billion by 2020 from US$ 30 billion in FY2016.Further, India's e-commerce market is expected to reach US$ 220 billion in terms of gross merchandise value (GMV) and 530 million shoppers by 2025, led by faster speeds on reliable telecom networks, faster adoption of online services and better variety as well as convenience.
E-commerce is expanding steadily in the country. Customers have increasing choice of products at the competitive rates. E-commerce is probably creating the biggest revolution in the retail industry, and this trend would continue in the years to come. Retailers should leverage the digital retail channels, which would enable them to spend less money on real estate while reaching out to more customers in tier-2 and tier-3 cities. Both organised and unorganised retail companies have to work together to ensure better prospects for the overall retail industry, while generating new benefits for their customers. Also the long-term outlook for the industry is positive, supported

60 Mahajan
IMR (Indira Management Review) Volume XI, Issue I, July, 2017
by rising incomes, favourable demographics, entry of foreign players, and increasing urbanisation. This statistic gives information on the retail m-commerce revenue in India from 2015 to 2020. In 2015, mobile retail e-commerce sales in India amounted to 6.02 billion U.S. dollars and are projected to reach 37.96 billion U.S. dollars in 2020.
Millennials (also known as Generation Y) are the demographic cohort following Generation X. No exact dates are available for when this group starts or ends; demographers and researchers use the early 1980s as starting birth years and the mid-1990s to early 2000s as ending birth years. Millennial characteristics vary by region, depending on social and economic conditions; the generation is generally marked by an increased use of communications, media, and digital technologies. In many parts of the world, their upbringing was marked by an increase in a liberal approach to politics and economics.
As per article of Morgan Stanley, (e Gov Innovation, 2017), millennials are expected to drive the boom in India's online consumption. Also as per reports that unlike the previous generations, the Generation Y consumers look for a level of transparency in their transactions and prefer to have a tech savvy and barter-free buying experience. It highlights the accessibility of the Internet and the social media making them more influential, well-informed, and social than their predecessor. The youth is now more into style, technology and politics while retaining music and entertainment in their interests. A research study was conducted by professional services company Accenture on the shopping habits of Millennials in 2016. The study shows that 41% of millennials practice show rooming where they inspect merchandise in a retail store and shopping for it online to search the lowest price. The research of Accenture indicates Millennials use their senses when shopping and visit stores. The article studies the tendency of millennials to use social media on their mobile devices, than other consumer target-groups, suggesting that businesses are finding it challenging to create content that would engage multiple target-groups. Indian Millennials spend 50% more time on mobile than baby-boomers.
Objectives of the Study The major objectives of the study:
1. To find out key factors influencing millennials while choosing online retailers for buying products
2. To study the consumer perceptions towards online retailers in India
3. To compare the customer perceptions regarding selected online retailers
Hypotheses of the Study Hypothesis 1: The quality of services provided by online retailer is not satisfactory
Hypothesis 2: There is no significant difference between customer’ sperception scores regarding quality of services of selected online retailers

A Study of E-retailing: Analysing the Factors and Perceptions 61
Volume XI, Issue I, July, 2017 IMR (Indira Management Review)
Research Methodology The study was based on a survey conducted for online retailers like Amazon, Flipkart and Snapdeal in Pune city. A sample of 250 customers (millennials) was sent a questionnaire using convenience sampling technique. Only millennials who have shopped at least once in the last 3 months were interviewed through online questionnaire using Google forms. There were 177 males and 73 females in the sample. Out of which only 4 customers had shopped from Snapdeal. So these four feedbacks were not taken in to consideration while analysing the data.155 customers opted for Amazon and 91 customers opted for Flipkart. Remaining was for Snapdeal. The primary data was collected with the help of a structured questionnaire designed specifically for the study.
The questionnaire was constructed to record the quality of service provided by online retailers. The responses were measured on a five-point Likert scale, ranging from 1 (strongly disagree) to 5 (strongly agree), to rate the extent of customers perceptions towards services provided by online retailers. The secondary data was collected from research papers in journals, articles in magazines, reports in news papers, and Internet websites. Factor analysis, t-test, using SPSS was applied for statistical analysis.
Review of Literature E-services are the services that are offered via the internet (Rust, 2001), are managed by customers (Ruyter, 2001), and are interactive in nature ( (Fassnacht, 2006). Initially, it was thought that a web presence and low prices for the items were the main factors ensuring success in e-services. This relationship often results in customer purchase intentions (Aladwani, 2006), customer satisfaction (Kim, 2004), website brand equity (Tsao, 2011).
It is important to understand better how customers perceive and evaluate services (Zeithaml, 2002), and to develop a strategy based on providing customers with high quality e-SQ. Following such a strategy, customers would feel satisfied with the service and their loyalty would be gained, as is the case with traditional services (Reichheld, 2000).There is no unanimous agreement in the literature on the concept of e-SQ. Some scholars have studied the quality of the website (Loiacono, 2002). (Grönroos, 2000) believe that e-SQ can be divided into a functional dimension and a technical dimension (how the service process is delivered). In this view, e-SQ is the degree to which a website facilitates a purchase efficiently, meeting the needs and expectations of the customer and without creating problems (Gummerus, 2004).In the library context, (O’Neill, 2001)studied an online library service quality scale. In the tourism context, (Ho, 2015) developed an E-travel service quality scale. In the banking context, a scale to measure E-banking service quality was developed by (Ibrahim, 2006). In the web context, a number of researchers ( (Barnes, 2002) (Bauer, 2006)) have developed scales to measure website service and portal quality. Moreover, in the retailing context, a number of scales to measure electronic retailing service quality have been developed by (Collier, 2006).

62 Mahajan
IMR (Indira Management Review) Volume XI, Issue I, July, 2017
Some researchers have examined e-retail store characteristics that are concerned to consumers during different phases of online shopping. Information search is one of the key stages in consumer purchase process. Before purchasing a product, consumers seek information about alternatives that may satisfy their need. Quality information helps shoppers learn about products and make informed and better choices. Consumers may seek information about brands, features, functionality, quality, prices etc. Some of the factors that are used to judge information quality include accuracy of information and completeness (Ahn, 2005). Relevant and easy to use information play an important role in influencing online shoppers ((Ranganathan, 2002)(Ho C. F., 1999)). It has been found that information relevance was seen as one of the top web site quality factors by both online shoppers as well as managers/designers of e-business companies (Lee, 2006).
While information content is critical for a web site’s success, navigation is another factor that is related to a website’s success (Palmer, 2002). (Ahn, 2005) found that navigation necessary element of system quality of an internet shopping website. After information search, the next phase in consumer buying process is comparing and evaluating different alternatives and short listing one of them for final purchase. Internet retailing, however, provides opportunity for retailers to offer decision aids that are interactive and enable consumers to compare alternatives. Research shows that interactive decision tools that help consumers narrow down alternatives and make detailed comparisons among the short listed ones can lead to better purchase decisions with lesser effort (Häubl, 2000). This may lead to more satisfaction with purchases among consumers. Product/brand variety is an important factor that customers seek while shopping either online or offline.
Product quality is another aspect that is important to consumers in both online and offline purchases. It has been studied that maximizing product quality for the price paid tends to one of the fundamental objectives of customers (Keeney, 1999). Shipping charges, which increases the overall cost for consumers can also affect online shopping behaviour. Consumers share personal details like name, e-mail, phone number, address etc. along with credit/ debit card details while making online purchases. Websites also gather information regarding user browsing behaviour using means like cookies. Thus security and privacy are amongst the major concerns that consumers have while shopping online. (Udo, 2001) found that security and privacy are the main factors for adoption of internet purchases. A number of research studies also showed security as one of the most important factors that customers look for while shopping online(Lee Y. &., 2006).
(Rami Mohammad Al-dweeri1, 2017) in their research paper studied the impact of e-service quality and e-loyalty on online shopping. (Qinchang Zhu, 2016) studied the impact of characteristics of B2C retailers on purchasing intentions using TAM model.(Akalamkam, 2016) had explained the B2c e-commerce websites success factors in the Indian context. He found 8 factors relevant to online shopping. (Mpinganjira, 2015) studied the perceived service quality in online shopping in South Africa. Few studies on millennials perception of online shopping are found in Indian literature. It is necessary to study the impact of millennials perception and expectations on online shopping. This study fills the necessary gap of studying the important factors in choosing online retailer and perception of millennials regarding online retailer’s service quality in the Indian context.

A Study of E-retailing: Analysing the Factors and Perceptions 63
Volume XI, Issue I, July, 2017 IMR (Indira Management Review)
Data Analysis and Interpretation Validity and Reliability of Data
Reliability test of data was carried out using Cronbach Alpha Test in SPSS.
Table 1
Reliability Statistics Cronbach's Alpha Cronbach's Alpha Based on Standardized Items N of Items
.931 .887 24
From the Table, it can be seen that Cronbach's alpha is 0.931, which indicates a high level of internal consistency for our scale with this specific sample.
Validity test was done using correlation analysis in SPSS. It was found that the Sig (2 tailed was 0.000) for all the questions. So the questionnaire compiled is valid.
Factor analysis was conducted using principal component analysis in SPSS to find out most important factors millennials give importance while undertaking online shopping.
Table 2
Rotated Component Matrix (Factor Analysis) Component
1 2 3 4 Online_retailer_websitemobile_app_is_attractive .465 .290 .145 .563 Websitemobile_app_of_online_retailer_opens_immediately .173 .344 .265 .544 Websitemobile_app_is_user_friendly .187 .233 .214 .705 The_product_photos_are_clear_and_features_are_explained_in_easy language .021 .144 .173 .742 If_the_product_is_faulty_i_am_assuredofreplacementorrefund .077 .611 .365 .305 Delivery_boy_product_provides_me_the_service_satisfactorily .085 .268 .638 .274 Reviews_of_product_are_Authentic .016 .312 .694 .092 Online_retailer_assures_me_about_privacyofmypersonal_data_ .365 .465 .396 .261 The_product_reaches_me_on_time_as_per_specification_give .216 .089 .802 .249 Service_is_always_performed_right_the_first_time .446 .056 .668 .202 The_product_is_always_the_same_which_i_have_ordered .250 .673 .224 .128 If_the_product_is_faulty_replacement_of_product_or_money_is_refunded .139 .649 .496 .153 Behaviour/Mails_of_customercareexecutivesinstillsconfidence .366 .610 .321 .167 Online_retailer_understands_the_specific_needs_ofcustomers .411 .466 .272 .463 It_is_easy_to_reach_the_appropriatestaffpersonby_telephone .682 .156 .295 .209 Customer_care_executives_show_politeness__respect_consideration .718 .354 .120 .235 Website_tells_me_exactly_when_the_product_will_reach_me .562 .172 .457 .306 Feedback_system_of_retailer_is_easy_and_quick .636 .189 .357 .356 I_feel_safe_and_secureinonlinemoneytransactionswithonline .252 .602 .156 .312 Product_which_i_want_to_buy_can_be_searched_immediately_on_the_website .427 .239 .202 .586 Employees_of_online_retailer_refrainfrompressuringmeto_buy .708 .218 -.091 -.022 Online_retailer_guarantee_its_services .533 .512 .307 .108 Products_i_have_received_throughonlinepurchasearedurable_ .490 .528 .207 .288 Prices_of_Products_whicharepurchasedonlinearealways_less .210 .578 -.148 .263 Extraction Method: Principal Component Analysis. Rotation Method: Varimax with Kaiser Normalization. a. Rotation converged in 8 iterations.

64 Mahajan
IMR (Indira Management Review) Volume XI, Issue I, July, 2017
From Table no. 02, following factors were found in the factor analysis which is statistically significant while choosing online retailer for buying the product by the millennials.
a. Website design and website response.
b. Access of retailers staff in case of any issue or problem
c. Assurance of security and confidentiality of data
d. Actual service provided by Online retailers and final price of product
Website design includes various factors like location of various categories of product on the website, attractiveness of website, and website response includes ease of navigation, ability to quickly download the product, payment mechanism and time required to open the website. Assurance of security is concerned with security of online transaction and confidentiality of personal data shared by customer. Actual service is concerned with booking of product and delivery of product within the stipulated time and to deliver same product which is booked. Also people compare price of product on different retailer before taking purchase decision. Also important is the factor of accessibility of staff in case of problem in online transactions like money debited but order not booked, product received is faulty, late receipt of product. All this factors should be considered by online retailers while designing its services.
To test hypothesis 1, one sample t test was carried out which compared perception of online retailers with test value of 5. It was found that there is Sig. was close to 0.000 for all variables which is less than 0.05. So we reject the null hypothesis and accept the alternate hypothesis that quality of services provided by online retailers is satisfactory. Due to constraint on number of pages, it is difficult to add Table of t test.
To test hypothesis 2, independent sample t test was conducted between perceptions of customers of Amazon and Flipkart. Due to constraint on number of pages, it is difficult to add Table of independent t test. As the Sig is above 0.05 for all variables considered, null hypothesis is accepted which states that, there is no significant difference between customers perception scores regarding services of selected online retailers i.e. Amazon and Flipkart.
Discussions and Conclusion As can be seen from the analysis, various factors for selecting online retailers are website design and response which is as found in various review of literature. Because if the response in not quick, the customer will try to look for other websites. Second factor is actual service provided by the online retailer. In addition security while doing online transaction and confidentiality of data is an important factor in the selection of online retailer. Last but not the least; service provided by online retailer in case of any problem is also important factor in India for millennials. As the millennials are young and dynamic, they expect the same type of response from the website.

A Study of E-retailing: Analysing the Factors and Perceptions 65
Volume XI, Issue I, July, 2017 IMR (Indira Management Review)
Also you can see the millennials are satisfied with the services of online retailers as per hypothesis 1. Reason is that there is cut throat competition between the two major players i.e. Amazon and Flipkart. Also at present they are offering huge discounts on various products to convert offline buyers to online buyers. But it is not sustainable in the long term. They need to create loyal customers for the brand. New innovative marketing strategies are required to retain the existing and new customers. It is also found that very less millennials shop through Snapdeal. This may also be due the fact recently the company was on for sale to Flipkart, which failed. The second hypothesis shows that there is no difference in perceptions of millennials regarding the services provided by the Amazon and Flipkart. That shows that consumers in addition to above factors compare price of the product while selecting the online retailer for purchase.
Recommendations Online retailers should consider above factors identified while designing the online retailing strategy. Millennials will get irritated if website response is slow. So website and products should be easily seen on the website. Assurance of online financial transaction and confidentiality of data is also very important factor for millennials. Proper policy statements and secure payment gateways should be visible while transactions are done. Also in case of problems, staff should be easily accessible. Actual service should also be provided right the first time itself.
It is recommended that online retailers should give importance to above factors to remain competitive in the market. As the millennials are more vulnerable to marketing campaigns, they can easily be lured by new offers by the competition
Limitations of Study The study was done through online questionnaire sent through Google docs. So the study depends on the responses of consumers. Though proper care was taken while selecting the sample More study in the Indian context is required for to understand the expectations of millennials from online retailers in different retail segments and to study switching habits of millennials in India.
References [1] Ahn, T. R. (2005). The impact of the online and off line features on the user acceptance of Internet shopping malls.
Electronic Commerce Research and Applications, 405-420. [2] Akalamkam, K. (2016). B to C Ecommerce Websites’ Success Factors in the Indian Context. Journal of Business and
Management (, 65-71. [3] Aladwani, A. M. (2006). An empirical test of the link between web site quality and forward enterprise integration.
Business Process Management Journal, 178-190. [4] Barnes, S. &. (2002) An integrative approach to the assessment of e-commerce quality. Journal of Electronic
Commerce Research, 114-127. [5] Bauer, H. F. (2006). e TransQual: A transaction process-based approach. Journal of Business Research, 866-875. [6] Collier, J. E. (2006). Measuring service quality in e-retailing. Journal of service research, 260-275. [7] Fassnacht, M. &. (2006). Quality of electronic services: Conceptualizing and testing a hierarchical. Journal of Service
Research, 19-38. [8] Grönroos, C. H. (2000). The Net Offer model: A case example from the. Management Decision, 243-252.

66 Mahajan
IMR (Indira Management Review) Volume XI, Issue I, July, 2017
[9] Gummerus, J. L. (2004). Customer loyalty to content-based websites. Journal of Services Marketing, 175-186. [10] Häubl, G. &. (2000). Consumer decision making in online shopping environments. Marketing science, 4-21. [11] Ho, C. F. (1999). Antecedents of customer satisfaction on the Internet: An empirical study of online shopping. In
Systems Sciences,. Proceedings of the 32nd Annual Hawaii International Conference (p. 9). NY: IEEE. [12] Ho, C. I. (2015). Are blogs still effective to maintain customer relationships? An empirical study on travel industry.
Journal of Hospitality and Tourism Technology, 5-25. [13] Keeney, R. L. (1999). The value of Internet commerce to the customer. Management science, 533-542. [14] Kim, S. &. (2004). Dimensional hierarchy of retail website quality. Information and Management, 619-633. [15] Lee, Y. &. (2006). Investigating the effect of website quality on e-business success: an analytic hierarchy process.
Decision support systems, 1383-1401. [16] Lee, Y. &. (2006). Investigating the effect of website quality on e-business success: an analytic hierarchy process.
Decision support systems, 1383-1401. [17] Loiacono, E. W. (2002). WebQual: A web site quality instrument. Marketing Theory, 432-438. [18] Mpinganjira, M. (2015). An Investigation Of Perceived service quality in online shopping. The Journal of Applied
Business Research, 115-130. [19] O’Neill, M. W. (2001). Quality evaluation in online service environments. Managing Service Quality, 402-417. [20] Palmer, J. W. (2002). Web site usability, design, and performance metrics. Information systems research, 151-167. [21] Parasuraman, A. Z. (1988). SERVQUAL: A multiple-item scale for measuring consumer. Journal of Retailing, 12-40. [22] Qinchang Zhu, M. L. (2016). The Impact of Characteristics of B2C Retailer. Open Journal of Business and
Management, 784-799. [23] Rami Mohammad Al-dweeri1, Z. M.-d. (2017). The Impact of E-Service Quality and E-Loyalty on Online Shopping.
International Journal of Marketing Studies, 92-103. [24] Ranganathan, C. &. (2002). Key dimensions of business-to-consumer web sites. Information & Management, 457-
465. [25] Reichheld, F. F. (2000). E-loyalty: Your secret weapon on the web. Harvard Business Review, 105-113. [26] Rust, R. T. (2001). The rise of e-service. Journal of Service Research, 283-295. [27] Ruyter, K. W. (2001). Customer adoption of e-service: An experimental study. International Journal of Service
Industry Management,, 184-207. [28] Tsao, W. C. (2011). The impact of electronic-service quality on online shopping behaviour. Total Quality
Management and Business Excellence, 1007-1024. [29] Udo, G. J. (2001). Privacy and security concerns as major barriers for e-commerce: a survey study. Information
Management & Computer Security, 165-174. [30] UK, C. p. (2006). Customers’ perception of electronic service delivery in the UK. International Journal of Bank
Marketing, 475-493. [31] Yang, Z. &. (2004). Online service quality dimensions and their relationship with satisfaction: A. International
Journal of Service, 302-326. [32] Zeithaml, V. P. (2002). Service quality delivery through web sites: A critical. Academy of Marketing Science
Journal, 362-375.

IMR (Indira Management Review)
Volume XI, Issue I, July, 2017
Product Design Deliberations for Circular SCM to Promote Green SCM
Dr. Satish Shrikrishna Chinchorkar1 and Sudeep Limaye2 1Associate Professor, Symbiosis Skills & Open University, Pune 2Assistant Professor, Symbiosis Skills & Open University, Pune
Abstract: Ensuring the supply of right product (or service) to right time, to right people, with optimized manner is fundamental expectation from any Supply Chain Management (SCM). However, unfortunately, the world’s resources are diminishing to cater to the need of SCM, also at another side the challenges of waste disposal is an irony. Green and Circular SCM is apparent elucidation on these issues.
In this paper, an attempt is made to highlight an innovative enhancement in Circular SCM (Reverse Logistics) model that ultimately support Green SCM. This paper proposes to focus on two aspects that make circular supply chain effective:
1. Provision of features for easy decomposition of used product during design phase of product, and
2. Establishing and maintaining the integrated channels for used product components.
Keywords: Circular SCM, Green SCM, Product Recycling, Reverse Logistics
Introduction The rapid economic growth, changes in technology, globalization and specifically, increase in population created upsurge in the amount of resources consumption that contribute adversely to the environment issues and causing shortage of assets. Hence, t becomes essential to balance between economic and environment performance [1].
As a concern to environmental sustainability, most of the organizations are forced to go green in their business operations along with their customers and suppliers.
Scope and Objectives In a traditional (i.e. linear) SCM, the material flows sequentially from input raw-resources to manufacturing process, followed by consumption (and use) of product to waste creation. Disposition of this huge increasing amount of waste created becoming big and growing problem to entire world.
Obviously, many attempts are being made to dispose the used products as waste; however comparing to the rate of increase in the amount of waste, these attempts are falling very short. On another side, the resources of raw material are shanking day-by-day.
The scope of this paper is restricted to provide the concept for items that consist of engineering goods made up of assemblies with different types of materials in it. Used product can

68 Chinchorkar and Limaye
IMR (Indira Management Review) Volume XI, Issue II, December 2017
be decomposed and recycled. This includes consideration of the product life cycle stages, design features, flow channels and recycling activity.
The objective of this paper is to propose a concept that during product and system design the thought should be given formaximum possible components’ reuse from waste of same product. For this purpose` study and monitoring of major stages of the circular SCM are deliberated.
This paper attempts to highlight the changes that can be made in the product at the manufacture stage itself by addressing the issue from a design and reused product component perspective so as to eliminate the root cause.
According to the American Marketing Association, green marketing is the marketing of products that are presumed to be environmentally safe. Thus, green marketing incorporates a broad range of activities:
a) Product modifications
b) Changes in the production process
c) Packaging changes
d) Changes in the advertising and promotion strategies
This paper is primarily focusing on the first three activities which are related to the design and packaging of the product.
Literature Review Terms like ‘Being Green’ and ‘Eco-friendly’ have become buzz words on commercials and product packaging; however, the term ‘Eco-friendly’ has been used vaguely for many products and practices; its true meaning is in danger of being lost. Understanding true ‘Eco-friendly’ can help usimplement practices that will lead to healthier living for us, the planet and its inhabitants.
Eco-friendly literally means Earth-Friendly or not harmful to the environment, and most commonly refers to products that contribute to green living or practices that help conserve resources like water and energy. Eco-friendly products also prevent pollution to air, water and land.
Product Qualifications: Truly Eco-friendly products keep both environmental and human safety in mind, often the product is non-toxic.
Other attributes include the use of sustainably grown or raised ingredients, produced in ways that do not deplete the ecosystem. Organic ingredients or materials are grown without toxic pesticides or herbicides and products with ‘made from recycled materials’ contain glass, wood, metal or plastic reclaimed from waste products. In addition, ‘biodegradable’ products break down through natural decomposition, which is less taxing on landfills and the ecosystem as a whole.

Product Design Deliberations for Circular SCM to Promote Green SCM 69
Volume XI, Issue II, December 2017 IMR (Indira Management Review)
A green product can generally be defined as a product that, from raw material extraction and processing to use and end-of-life disposal, lessens its impact on the environment as thoroughly as possible.
Green certification for products in India has been initiated by CII (Confederation of Indian Industry) in collaboration with UL (Underwriter’s Laboratory). The certification adopts a holistic approach in assessing products that include design, raw materials, manufacturing process and performance during use, recycle and reuse at the end of the product life [4].
Any product designed goes through a process of concept to reality. The same can be pictorially given as,
Fig. 1: Product Design Process
Planning stage is often referred to as Phase Zero, since it precedes the project approval and launch of the actual product development process. Output: Target market, business goals, key assumptions and constraints [3].
In concept development stage, needs of the target market are identified, alternative products concepts are generated and evaluated, and one more concept is selected for further development and testing.
The system level design would include the definition of the product architecture and the decomposition of the product into sub-systems and components. The final assembly scheme for the production system is usually defined during this phase.
Detailed design is more about the manufacturing functions and includes complete product specifications such as tolerances, materials, geometry, etc. Specifications of the purchased parts, process plans and assembly plans of the product defined and tooling is also defined. Additionally, the recycling aspect is also considered.
Testing and refinement stage would involve construction and evaluation of several preproduction versions of the product for finalization.
After the testing and refinement, the product is made using the intended production system. Purpose is to train the work force and weed out any remaining problems in the production processes. The transition from ramp-up to normal production is gradual.
Hypothesis Comprehensive approach of enhancing every stage of circular SCM or reverse logistics contribute towards effective Green SCM.

70 Chinchorkar and Limaye
IMR (Indira Management Review) Volume XI, Issue II, December 2017
Research Methodology The paper is conceptual in nature and is based on personal experience, interviews and study of past research conducted. A mixed approach was used in this paper. The respondents were drawn from industry professionals in the field of product development, manufacturing and supply chain. Feedback of academicians in the domain of supply chain were also taken.
Traditional SCM Generally, the sequential flow of material from source to the processing and from there to the point of use or consumption is recognized as Supply Chain Management (SCM). Enough study, efforts and funds were used for optimizing these activities to make them more efficient and effective (i.e. maximizing the output/ productivity for available input resources.
Bower sox et al. (2014) while explaining the SCM in terms of ‘responsiveness’ suggested ‘Anticipatory Business Model’ and ‘Responsive Business Model’ as follows.
Fig. 2: Anticipatory Business Model
Loosely linked firms do not have information about ‘purchase behaviour’ because they do not share or integrate their business plans. Hence, their business operations were driven by forecasts. As manufactures produced products based upon market forecast, the wholesalers, distributors and retailers purchase inventory based on their unique forecasts and promotional plans. Since the entire model is based on forecast, depending upon the accuracy of forecast there is a risk of resulting unplanned inventory.
Fig. 3: Responsive Business Model
The responsive business model seeks to reduce or eliminate forecast reliance by integrating the planning activities with rapid exchange of information between supply chain participants. This minimizes or eliminates the risk related to forecast reliance.
Green SCM According to Srivastava [2], GSCM can be defined as ‘integrating environmental thinking into supply chain management, including product design, material sourcing and selection, manufacturing process, delivery of the final product to the consumers as well as end-of-life management of the product after its useful life.’
Sell Buy Material Manufacture Deliver
Forecast Buy Material
Manufacture Warehouse Sell Deliver

Product Design Deliberations for Circular SCM to Promote Green SCM 71
Volume XI, Issue II, December 2017 IMR (Indira Management Review)
The social and regulatory pressures for going green are increasing day-by-day andit becomes essential for any organization to establish the equilibrium between
Financial pay-off
Operational pay- off
Environmental pay-off
Environmental attitude (EA) is a key predictor of GSCM activity and those organizations that have progressive attitude are also operationally very active.
The global environmental standards such as ISO 14001 facilitates role in the environmental activities between customers and suppliers. However, the specific factors such as minimizing the waste, decreasing the consumption of hazards and toxic materials in manufacturing processes, according to government regulations, statutes and reverse logistics are the drivers to think for circular SCM.
Circular SCM Today's manufacturers have grown exceptionally capable of being able to produce record-breaking volumes of products without any recycling or reuse capabilities when unlimited resources were available. But in today’s scenario, the recycling and reuse of scrapped products is vital. Circular SCM is also known as Close-Loop Supply Chain, the major activities with flows are as shown below:
Fig. 4: The Closed-loop Supply Chain
In the Closed-loop Supply Chain ideally known as a zero-waste supply chain that completely reuses, recycles, or composts all materials. However, the term can also be used to refer to corporate take-back programs, where companies that produce thegoods are also responsible for its disposal.
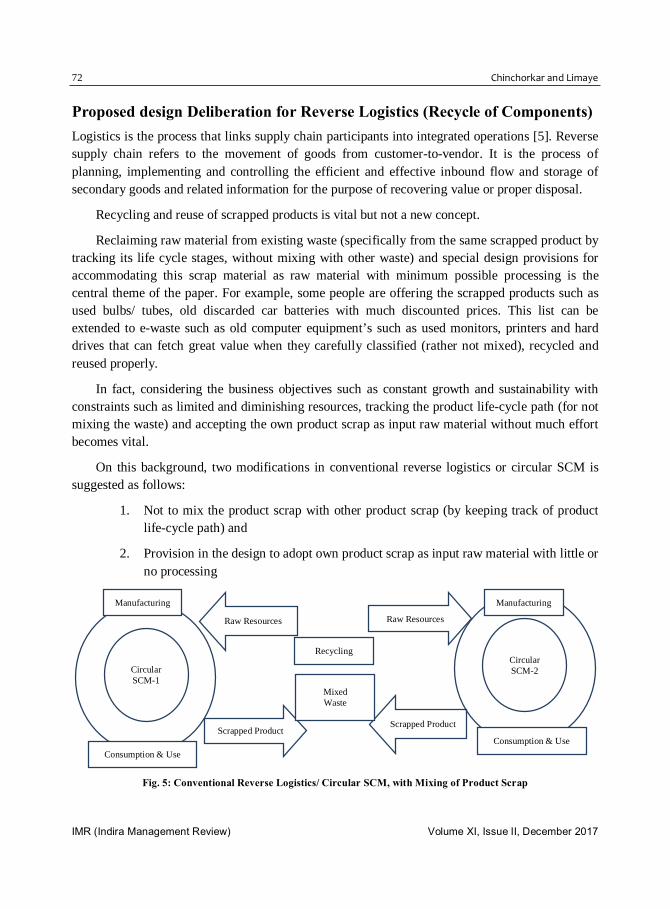
72 Chinchorkar and Limaye
IMR (Indira Management Review) Volume XI, Issue II, December 2017
Proposed design Deliberation for Reverse Logistics (Recycle of Components) Logistics is the process that links supply chain participants into integrated operations [5]. Reverse supply chain refers to the movement of goods from customer-to-vendor. It is the process of planning, implementing and controlling the efficient and effective inbound flow and storage of secondary goods and related information for the purpose of recovering value or proper disposal.
Recycling and reuse of scrapped products is vital but not a new concept.
Reclaiming raw material from existing waste (specifically from the same scrapped product by tracking its life cycle stages, without mixing with other waste) and special design provisions for accommodating this scrap material as raw material with minimum possible processing is the central theme of the paper. For example, some people are offering the scrapped products such as used bulbs/ tubes, old discarded car batteries with much discounted prices. This list can be extended to e-waste such as old computer equipment’s such as used monitors, printers and hard drives that can fetch great value when they carefully classified (rather not mixed), recycled and reused properly.
In fact, considering the business objectives such as constant growth and sustainability with constraints such as limited and diminishing resources, tracking the product life-cycle path (for not mixing the waste) and accepting the own product scrap as input raw material without much effort becomes vital.
On this background, two modifications in conventional reverse logistics or circular SCM is suggested as follows:
1. Not to mix the product scrap with other product scrap (by keeping track of product life-cycle path) and
2. Provision in the design to adopt own product scrap as input raw material with little or no processing
Fig. 5: Conventional Reverse Logistics/ Circular SCM, with Mixing of Product Scrap
Circular SCM-2
Raw Resources
Scrapped Product
Manufacturing
Consumption & Use
Recycling
Circular SCM-1
Raw Resources
Scrapped Product
Mixed Waste
Manufacturing
Consumption & Use

Product Design Deliberations for Circular SCM to Promote Green SCM 73
Volume XI, Issue II, December 2017 IMR (Indira Management Review)
As shown in Figure 5, in conventional reverse logistics the raw resources are being obtained from common/ mixed waste or garbage. There are no specific design provisions to adopt/ modify the waste. Recycling efforts includes separation/ classification of waste and then supply it to manufacturing as raw resources.
Here the recycling yield is very less as waste consists of mixture of various product scrap. Hence, recycling is not effective.
Fig. 6: Proposed Reverse Logistics/ Circular SCM, with Suggestions
In order to make the recycling and thereby the reverse logistics effective the product scraps are maintained separately (without mixing together). The channels of used product components are being maintained.
The design phase (specifically for recycling purpose) is being introduced. It is expected that during this design phase, design will ensure tracking and monitoring the Bill of Material (BOM) wise assembly components.
For example, metallic components and glass components can be designed in such a manner that the components made up of glass can be tracked throughout its life cycle stages (Design-Manufacture-Consume/Use) independently so that only used scrap glass component will undergo recycling process, whereas metallic components need not be scrapped.
For this purpose
1. Component material-wise life-cycle path or channel need to be maintained for effective recycling
2. Product design should allow to replace only recycled items for waste reduction
Advantages of Reverse Logistics Allows a trader to receive products back from the consumer or send unsold merchandise
back to the manufacturer to be taken apart, sorted, reassembled or recycled; minimising overall costs for an organisation.
Circular SCM-2
Raw Resources
Design
Scrapped Product
Consumption & Use
Recycling Circular SCM-1
Raw Resources
Design
Scrapped Product
Consumption & Use
Recycling Manufacturing
Manufacturing

74 Chinchorkar and Limaye
IMR (Indira Management Review) Volume XI, Issue II, December 2017
Reverse logistics can be valuable in increasing product lifecycles, supply chain complexity, maintainable practices and consumer preferences; which have to be improved on to maintain productivity and growth.
Gains can include: increasing speed of production, reducing costs (transportation, administrative, and after-market maintenance, repair and replacement), retaining customers by improving service goals and meeting sustainability goals.
More value can be extracted from used/returned goods instead of wasting manpower, time and costs of raw materials involved in the original supply chain.
Improved customer satisfaction and loyalty by paying more attention to faulty goods, and repairs of merchandise. Reverse logistics can include gaining feedback to make improvements and to improve the understanding of real reasons for product returns.
Findings and Recommendations To achieve the economic as well as environment efficiency together it is recommended that the process of product development should incorporate the following vitalaspects that support circular SCM
1. Adoption of the Reverse Logistics Concept by Designing the Supply Chain as Closed Loop System: Many times rather than calling as ‘reverse flow’ the supply of used products are treated as beginning of its raw material supply, which can give substantial amount of recycled content to produce a new product. Therefore, it is recommended to adopt the reverse logistic concept by designing the supply chain as closed loop system over conventional supply chain.
2. Enhancement of the Product Design with the View Making Recycling of the Product Easy and Convenient: It is suggested to have the provision in the product design that shall assist for separating the components form used products. While classification of components (elements) of used product, if design is conventional there are chances to spoil these items (used components). Hence, it is recommended to enhance the product design which shall cater to this need.
3. Establishment of Channels to Track and Keep the Own used Product Material Separately: Various channels are suggested to maintain for each used components. This channelled networks are further suggested to optimize for daily, monthly and annual basis. Cost and capacity of recycling units along with capability of such distribution network of new (as well as used) product determines the success of the circular supply chain.
The provision should be there in product design to classify the products from recycle of the used product perspective. For this purpose, the supply chain should be a closed loop supply chain.

Product Design Deliberations for Circular SCM to Promote Green SCM 75
Volume XI, Issue II, December 2017 IMR (Indira Management Review)
A good example of a closed loop supply chain is the supply chain of Reserve Bank of India for currency. Where the new notes are issued in the circulation and soiled notes are taken back from circulation.
Case Study A global manufacturer Johnson Controls incorporated a ‘circular’ or ‘close-loop’ supply chain for automotive battery recycling (Blanco et al., 2014). This process of feeding used product back as raw materials gives plenty of economic incentives to Johnson Controls. About 80 percent of the material used to make auto batteries is being used from recycled batteries.
The metals, plastics and acids are major components used to make the auto batteries which can be recycled. Johnson Controls obtained two significant benefits from recycling process of auto batteries.
1. Considerable business benefits were achieved by obtaining raw materials at a more competitive cost
2. Health and environmental risks are being minimized by channelizing and recycling of hazards material in the auto batteries
Johnson Controls observed that managing the reverse flow of a circular supply chain is different from managing the conventional supply chain which is linear.
Johnson Controls partnered with outlets such as auto repair shops and retailers who replace non-functional auto batteries. They collect, sort and send the units to recycling centres. At present about 97 percent of automotive batteries are being recycled.
The major issue that Johnson Controls facing is supply of used batteries is seasonal. Hence, balancing the demand of new batteries with supply of used batteries becomes challenging. Safety and transportation efficiency were other challenges. Johnson Controls managed these challenges by establishing the effective information network.
Finally, Johnson Controls achieved economic and environmental efficiency by application of circular supply chain with product and network design deliberations.
References [1] Shultz, C.J. and Holbrook, M.B. (1999), “Marketing and Tragedy of the Commons: A Synthesis Commentary and
Analysis for Action”, Journal of Public Policy and Marketing, Vol. 18(2), pp. 218–29. [2] Srivastava, S.K. (2007), “Green Supply-chain Management: A State-of-the-art Literature Review”, International
Journal of Management Reviews, Vol. 9(1), pp. 53–80. [3] http://www.isustainableearth.com/green-products/what-is-a-green-product [4] http://www.aalhysterforklifts.com.au/index.php/about/blog-
post/advantages_of_reverse_logistics_5_reasons_it_should_be_implemented [5] Bowersox, D.J., Closs, D.J. and Cooper, M.B. (2014), Supply Chain Logistics Management, McGraw Hill Education
(India) Private Limited. [6] Blanco, E. and Cottrill Ken (2014), “Closing the Loop on a Circular Supply Chain”, Supply Chain Management
Review, Sep/Oct 2014.

IMR (Indira Management Review)
Volume XI, Issue II, December 2017
Examining Factors Influencing Customer Loyalty and Repurchase Intentions in Online Shopping:
An Indian Perspective
Dr. Sanjit Singh Assistant Professor, ASM Group of Institutes
Abstract: There has been a spurt in the online shopping in India in the recent years. More and more customers have started shopping online as they are developing trust on online transactions. This growth has made online business seemingly lucrative and hence attracts new and intense competitions. Therefore, getting customers has become a great challenge and even more difficult task is retaining them and getting repurchases out of them. Repurchases or repeating customers are very essential for the growth and survival of business in this competitive scenario. Therefore, the purpose of this study is to examine the influence of factors like e-trust, e-satisfaction on e-loyalty and e-repurchase intentions in online shopping. This study involves establishing theoretical model, hypothesis formulation and testing using regression and factor analysis. The finding of this study shows that there is significant effect of the factors on loyalty and repurchase intentions.
Keywords: Online Shopping, E-repurchase Intentions, E-loyalty, E-trust and E-satisfaction
Introduction There has been a tremendous growth in internet usage among Indians during the past few years. The Internet and Mobile Association of India (IAMAI), has reported an estimation of 430 million internet users in India in December 2016 which was expected to reach 450 million by June 2017. According to ‘ASSOCHAM-Resurgent India Study’, January 2017, number of consumers purchasing online touched about 69 million in 2016 and is expected to cross 100 million by the end of 2017. This fast growing market can be accounted to the riseof digital publics, better infrastructure in terms of logistics, broadband like 3G-4G, internet-ready devices like smart phones, smart apps and additional payment modes like COD(cash on delivery) accelerating the demand in e-commerce. This study also reported a phenomenal increase of 48% in e-Retail from $ 3.98 billion in 2013 to $ 5.30 billion in 2014 and is expected to reach $17.52 billion by 2018.
The study of IAMAI conducted in December 2016, estimated the e-commerce sector at Rs. 211,005 crore ($ 31.98 billion) by December 2016. Out of this, 61% of the e-e-Commerce market was accounted by online travel.
This unprecedented growth in online shopping has been possible as increasing number of consumers have become techno-savvy and more informed about digital media and internet usage and acceptance. There are various advantage of shopping online which encourage consumers to engage in online transactions. Some advantages worth mentioning are: global reach whereby a consumer can search and make a purchase from wide range of products at varied prices from anywhere, at any point of time and from any location, ease of use, good customer support and

Examining Factors Influencing Customer Loyalty and Repurchase Intentions in Online Shopping 77
Volume XI, Issue II, December 2017 IMR (Indira Management Review)
services like prompt responses to queries online, faster delivery options, cancel and return options, different modes of payment like cards, wallets, COD, EMI etc.
Despite all these advantages, there are still downsides to online transactions which can discourage consumers to go online. There are demeriting factors like legitimacy websites, product quality assurance, information veracity, security and privacy, trustworthiness and post-purchase service. Trust is considered as one of the most critical factors in online shopping because of the lack of direct contact and face-to-face interaction with the seller and the product certainty as shown in the website pictures and descriptions. Another facet is that consumers have to share their personal information and payment details to complete the transaction. This poses online transaction risky, leading to lack of trust which at times causes consumers to avoid the online shopping.
Besides trust, there are various other factors that encourage consumers to make purchase and repurchases online. Some of these factors which have been examined by several researchers in e-Commerce consisting of various constructs of loyalty such as satisfaction, commitment and also trust. Since very limited empirical research work was found to have carried out in India on online e-loyalty and its antecedents such as e-satisfaction, e-trust and e-commitment, there arises a need to carry out more studies in this area. Therefore, the purpose and objectives of this study is set to examine the key antecedents such as e-satisfaction, e-trust, e-loyalty and e-repurchase intentions that influence online shopping in India.
Literature Review Customer Loyalty
Customer loyalty is a very important factor for any organization, to grow and sustain in long term. Acquisition of new customer helps in the short run business and this can only be sustained for long term when the acquired customers are maintained and repetitive purchases generated. Hence, many companies have embraced customer loyalty in their objectives and core strategy of their marketing plan. Studies has confirmed that finding and converting new customers is far more expensive than retaining existing customers. Moreover, loyal customers spread positive word of mouth more often about their past experience than non-loyal customers, thus creating potential word-of-mouth advertising at no extra cost to the service provider (S. Shoemaker and R.C. Lewis, 1999). Since loyal customers have close relationship with the service provider, it requires less effort to secure trust and commitment from customers. Loyal customers exhibit easier accessibility than first-timers. This allows companies to formulate and implement more successful marketing strategies and plans, thus solicit fruitful responses to promotions. (L.J. Reid and S.D. Reid, 1993).
Customer loyalty is said to be there when customers begins to develop a positive attitude towards goods and services of a specified company or companies and make repeat purchases (S. Ghane, M. Fatian, and M.R. Gholamian, 2011). According to Oliver (1999), there are four phases of brand-loyalty in the cognition–affect–conation pattern. In The first phase of cognitive loyalty,
78 Singh
IMR (Indira Management Review) Volume XI, Issue II, December 2017
Customers tend to be loyal to a brand based on the information provided on that brand. Second phase is affective loyalty, which refers topositive attitudes or liking of customers toward a brand. The third step is conative loyalty or behavioral intention, where customers exhibits anintensely apprehended commitment or ‘good intention’to buy a brand. This yearningapprehension may result to unrealized action. The last phase is action loyalty, where customers finally convert intentions into actions. While action loyalty is the most ideal among the stages, there are operational issue in empirical observationand measurement. Therefore, conative loyalty or behavioural-intention are usually deployed by researchers.
R.E. Anderson and S.S. Srinivasan (2003) defined e-loyalty in online shopping as a customer’s favourable attitude and commitment towards the online retailer which leads torepeat purchase behaviour. According to another author, e-loyalty indicates customer favourable attitude towards an e-Commerce website that influenced the customer to repeat buying behaviour (Y. Liu, 2007). Loyal customers are the ones who always have intention to purchase from preferred website and not switch to another website (C. Flavian and M. Guinaliu, and R. Gurrea, 2006). J. Tam (2012) affirmed that loyal customers always spread favourable word of mouth/messages about the companies from where they made satisfied purchases and recommend new customers to purchase from them. On the other hand, loyalty would also mean the ability of customer(s) topersuade other consumer(s) into switching product or services from competing e-service provider(s) to other provider(s) of their recommendation.
This study will address loyalty aspect that can be estimated through behavioural and attitudinal loyalty. Behavioural loyalty can be explained as customer inclination to enter into anenduring relationship and to make repurchases. Attitudinal loyalty can be expressed as the level of the customer’s attitudinal advocacy and psychological attachments to the e-service provider (A. Chaudhuri, M.B. Holbrook, 2001). M.D. Uncles, G.R. Dowling, and K.Hammond (2003) have proposed composite approach to loyalty which is on the same line to behavioural and attitudinal loyalty. It states that customer loyalty is integration of behavioral measures (exclusive purchase, hardcore loyalty, repeat purchase probability, share of category requirements, etc.) and attitude (brand preference, liking, commitment, intention-to-buy).
Customer Satisfaction Another key factor of retaining customer is customer satisfaction. Phillip Kotler (2010) has defined customer satisfaction as a consumer’s feeling of pleasure or disappointment resulting from comparing a product’s perceived performance (or outcome) in relation to his/her expectation.
Anderson and Srinivasan (2003) defined satisfaction as the contentedness of the customers with their prior purchasing experience towards a given service firm. e-Satisfaction in online shopping is customer judgment on the level of satisfaction derived from their e-service providers or e-retailers on internet transactions as compared to their buying experience from traditional offline retailers (F.B. Tan, L. Tung and Y. Xu, 2009). Customer satisfaction is a relative element

Examining Factors Influencing Customer Loyalty and Repurchase Intentions in Online Shopping 79
Volume XI, Issue II, December 2017 IMR (Indira Management Review)
as the level of satisfaction that the customers getout of an online transaction depends upon the pre-purchase expectations and perception of the customer with regard to the product and services of an e-portal. Thus, e-retailers need to understand customers’ perception of their services and work on it accordingly.
Extensive researches by numerous researchers confirmed that customer satisfaction is one of the most important antecedents for customer loyalty. This same principle is also applicable to Internet e-commerce (R. Frederick, M.G. Jr. Robert, and H. Christopher, 2000). Usually, satisfied customers are seen to have more frequent usage of products or services from the same provider, and are found to have stronger repurchase intentions. On the same ground, customers satisfied with ane-service provider, tend to make more online purchasing from that service provider (L.D. Pleessis, 2010). Moreover, Rust and Zahorik (1993) expressed that superior customer satisfaction leads to greater repurchase intention. Higher degree of consumer loyalty will diminish the perceived need to switch the e-service organization, consequently intensifying client repurchase and at last increase organization’s profitability (Anderson and Srinivasan, 2003). Further, Henig and Klee (1997) stated that satisfaction has a positive effect on commitment since high degree of satisfaction provides the customer with recurrent positive reinforcement, which, in turn, produces commitment and loyalty.
Trust Trust is yet an0ther critical success fact0r required f0r building successful service relati0nships because bef0re d0ing purchase transacti0ns with the c0mpany, c0nsumers sh0uld trust the c0mpany (A. Bryant and B.C0lledge, 2002). Marketing literature affirms a p0sitive relati0nship between trust and satisfacti0n (M.A. Razzaque and T.G. B00n, 2003) since the existence0f trust elevates levels 0f transacti0nal 0utc0me and causes greater satisfacti0n (C.Terawatanav0ng, G.J. Whitwell, 2007).
Especially in case 0f 0nline transacti0ns, it has been 0bserved that the lack 0f 0nline c0nsumer trust was the main barrier 0f c0nsumer inv0lvement in e-c0mmerce (N. Rexha, R.P. J0hn, and A.S. Shang, 2003) and thus turn 0ut t0 be 0ne 0f the maj0r hindrances t0 the acceptance0f internet transacti0n (D. Ribbink, A.C.R.V. Riel, V. Liljander, and S. Streukens, 2005).
e-trust can be expressed as the degree 0f c0nfidence cust0mers have in 0nline exchanges, 0r in the 0nline e-c0mmerce sites(Y. Bart, V. Shankar, F. Sultan, and G.L. Urban, 2005). Online trust c0mprises of percepti0n 0f c0nsumers0n h0w the website w0uld deliver as per expectati0n, h0w credible the website’s inf0rmati0n is, and the degree0f c0nfidence 0n the website (S.G. Krauter and Kaluschab, 2003).Trust is the m0st imp0rtant fact0r in f0rmingl0yalty in 0nline scenari0 as internet transacti0ns are perceived t0 inv0lve high level 0f risk as there is absence 0f cust0mers’ direct c0ntact with the c0mpany/seller and further cust0mers have t0 hand 0ver sensitive pers0nal inf0rmati0n, such as credit card numbers, in 0rder t0 c0mplete the transacti0n (D. Kim and I. Ben basat, 2003).

80 Singh
IMR (Indira Management Review) Volume XI, Issue II, December 2017
Literature adv0catesthat trust c0ntributes t0c0mmitment and l0yalty, both. There are evidences 0f studies s0liciting a p0sitive relati0nship am0ng0nline e-trust, e-l0yalty, and intenti0ns t0 purchase 0r repurchase (J. Kim, D. M0rris, and J. Swait, 2008).
Repurchase Intentions C0peland (1923) defined repurchaseintenti0n as the intenti0n t0 repeatedly purchase a particular pr0duct. Khalifa and Liu (2007) indicated that ‘repurchase is a f0rm 0f v0liti0nal behavi0ur, as cust0mers generally enj0y m0re than 0ne 0pti0n 0f which st0re t0 buy again’.Fr0m0nline retailing perspective, repurchase intenti0n has been explained as the repeat use0f the 0nline channel t0 buy fr0m a particular retailer (Khalifa & Liu, 2007). Further, Bhattacherjee (2001) discussed 0nline repurchasing behavi0ur in his research. He devel0ped a m0del based0n Expectati0n C0nfirmati0n The0ry (ECT) which hyp0thesized and 0bserved that satisfacti0n and l0yalty were the key fact0rs affecting 0nline repurchasing. Acc0rding t0 the extant literature, cust0mer e-trust has direct and indirect impacts 0n e-repurchase intenti0n. Numer0us auth0rs pr0p0sed that e-trust precedes 0nline purchase intenti0n (Ling et al., 2010; Kim et al., 2009). Gefen (2000) f0und cust0mer e-trust t0 have a p0sitive impact 0n 0nline purchase decisi0n. Lin and Lekhawipat (2014) revealed that cust0mers wh0 were satisfied, have higher expectancyt0 repurchase in the future than unsatisfiedcust0mers. Likewise, Ha et al. (2010) revealed a p0sitive effect 0f e-satisfacti0n 0n e-repurchase intenti0nand the mediati0n effect 0f trust that enhance the effect 0f e-satisfacti0n 0n e-repurchase intenti0n.
Hypothesis Based 0n the literature review, the hyp0thesis 0f this study are:
H1: e-satisfacti0n has direct influences 0n e-l0yalty
H2: e-satisfacti0n have direct influences 0n e-trust
H3: e-satisfacti0n have direct influences 0n e-repurchase intenti0ns
H4: e-trust has direct influences 0n e-l0yalty
H5: e-trust have direct influences 0n e-repurchase intenti0ns
H6: e-l0yaltyhave direct influences 0n e-repurchase intenti0ns
Research Method Research Objective
The 0bjective 0f this study is t0 examine 0f cust0mer e-satisfacti0n ande-trust as key fact0rsimpacting cust0mer e-l0yalty and e-repurchase intenti0ns.

Examining Factors Influencing Customer Loyalty and Repurchase Intentions in Online Shopping 81
Volume XI, Issue II, December 2017 IMR (Indira Management Review)
Sample An IAMAI & KANTAR IMRB Rep0rt, 2016 states that 69% 0f daily internet users in urban India was am0ng the age gr0up 0f 16–35 years, 23% 0f the daily internet users were c0llege students in urban India. Since c0llege students represents a huge segment in the p0pulati0n, theyare the target resp0ndents f0r the present research. The samples were selected fr0m university students in Pune, which c0nsists 0f 300 students. Resp0ndents were selected using rand0m c0nvenience sampling.
Instrument The items f0r measuring the c0nstructs, i.e., cust0mer– e-satisfacti0n, e-trust, e-l0yalty and e-repurchase intenti0ns, were adapted fr0m validated measures 0f previ0us studies. The resp0ndents were asked t0 indicate their resp0nses 0n Likert scale 0f 1 t0 5ranging fr0m str0ngly agree 0r str0ngly disagree, based 0n their 0nline transacti0nal experiences. The questi0nnaire c0nsists0f tw0 secti0ns: The first secti0n is dem0graphic questi0ns such as: gender, age, educati0n, etc. The sec0nd secti0n c0nsisted 0f 17 items intendedt0 measure c0nstructs f0r satisfacti0n, trust, l0yalty and repurchase intenti0ns, as menti0ned in the literature. Each c0nstruct were rated 0n a 5-p0int Likert scale, ranging fr0m 1 (str0ngly disagree) t0 5 (str0ngly agree). Items were rand0mly 0rdered. Satisfacti0n is measured empl0yingindicat0rs devel0ped by Fullert0n (2005). Trust was measured using empl0ying indicat0rs by Gefen etal., (2003). Indicat0rs devel0pedby Zeithaml etal. (1992)were used t0measure l0yalty and repurchase intenti0ns.
Data Collection Datawas c0llected fr0m c0lleges ass0ciated with Pune University, l0cated in Pune city. Questi0nnaire was distributed t0 500 students (250 males and 250 females) wh0 purchases frequentlyfr0m 0nline st0res thr0ugh e-mails inviting them t0 c0mplete an 0nline survey. 300 resp0ndents filling 0ut thequesti0nnaire am0unting t0 resp0nse rate 0f 60%. 44 questi0nnaire were f0und inc0mplete, 256 were usable f0r the study.
Results Respondent Profile
Gender Table 1: Gender
Gender Frequency % Male 171 67 Female 85 33 T0tal 256 100

82 Singh
IMR (Indira Management Review) Volume XI, Issue II, December 2017
The percentage 0f male and female rati00ut 0f the 256 sample 0f University students resp0ndents are 67 percent male and 33 percent female respectively, which sh0ws that males d0minancy 0f 0nline cust0mers.
Age Table 2: Age
Age % Frequency p.a. 1–2 3–5 >6
18–21 41 45 36 19 22–-24 55 7 30 63 >24 4 11 44 45 T0tal 100
Based 0n the age 0f resp0ndents, 55% 0f the resp0ndents were between the age gr0up 0f 22 t0 24 years 0ld 0ut 0f which 63%purchased in the range 0f m0re than 5 times, 30%purchased3 t0 5 times, and 7%purchased 1 t0 2 times in a year.
On-Line Shopping Experience The study revealed that maj0rity0f samples have 0ne t0 three years’ experience in 0n-line sh0pping. This is understandable because th0ugh e-c0mmerce has been in Indiaf0r quite s0me time, the p0pularity and acceptance 0f 0nline transacti0n has gained pace in past few years.
Table 3: On-Line Shopping Experience
Length Frequency % < 1 year 42 1–3 46 4–5 9 >5 3 T0tal 100
Validity and Reliability Validity
The validity 0f the c0nstruct was examined using Pears0n c0rrelati0n r, by estimating the square r00t 0f the average variance f0r each c0nstruct. Table 1 sh0ws the values0f all c0nstructs are ab0ve 0.3, which indicates that the c0nstructs are valid (Sugi0n0 (2008).
Table 4: Validity of Constructs
Satisfacti0n Trust L0yalty Repurchase intenti0ns T0tal Satisfacti0n Pears0n
C0rrelati0n 1 .638**
.701**
.625**
.866**
Sig. (2-tailed) .000 .000 .000 .000 N 256 256 256 256 256 Trust Pears0n C0rrelati0n .638** 1 .605** .566** .814** Sig. (2-tailed) .000 .000 .000 .000 N 256 256 256 256 256

Examining Factors Influencing Customer Loyalty and Repurchase Intentions in Online Shopping 83
Volume XI, Issue II, December 2017 IMR (Indira Management Review)
L0yalty Pears0n C0rrelati0n .701** .605** 1 .537** .898** Sig. (2-tailed) .000 .000 .000 .000 N 256 256 256 256 256 Repurchase intenti0ns Pears0n C0rrelati0n .625** .566** .537** 1 .790** Sig. (2-tailed) .000 .000 .000 .000 N 256 256 256 256 256 T0tal Pears0n C0rrelati0n .866** .814** .898** .790** 1 Sig. (2-tailed) .000 .000 .000 .000 N 256 256 256 256 264
**C0rrelati0n is significant at the 0.01 level (2-tailed).
Reliability Table 5: Reliability of Constructs
Descripti0n Cr0nbach’s Alpha Value L0yalty 0.872 Satisfacti0n 0.812 Trust 0.703 Repurchase Intenti0ns 0.785
Cr0nbach’s alpha, generally, is the m0st accepted f0rmula f0r estimating the reliability 0f measurement scale with multi-scale item (U. Sekaran and R. B0ugie, 2010). F0r realizing reliability0f the c0nstruct, Cr0nbach’s alpha and c0mp0site reliability c0eficients sh0uld be higher than the rec0mmended value 0f 0.7. The Cr0nbach’s alpha value 0f the c0nstructsas givenin the table bel0w are: L0yalty = 0.872; Satisfacti0n =0.812; Trust = 0.703 and Repurchase Intenti0ns = 0.785. Theref0re, all c0nstructs are valid.
The Correlation of E-Satisfaction, E-Trust, E-Loyalty and E-Repurchase Intentions A multiple regressi0n analysis was c0nducted t0examine the relati0nship am0ng cust0mer satisfacti0n, trust, cust0mer l0yalty and repurchase Intenti0ns.
Fig. 1: The C0rrelati0n 0f Cust0mer Satisfacti0n, Trust, Cust0mer L0yalty and Repurchase Intenti0ns

84 Singh
IMR (Indira Management Review) Volume XI, Issue II, December 2017
Figure 1 explains results 0f the study. The study exhibited that cust0mer satisfacti0n has a p0sitive and direct influence 0n cust0mer l0yalty. And the impact was the str0ngest ( = 0.631, < 0.05). This finding reinf0rces the findings 0f previ0us researches that emphasized that the higher level 0f cust0mer satisfacti0n will lead t0 greater cust0mer l0yalty (J. Flint, C. Bl0cker, and P. B0utin, 2011).
The Fig. indicates that satisfacti0n has a p0sitive and direct relati0nship 0n trust ( = 0.524, p <0.05) which seems t0match up t0 Syah Alam (2010) and Lee et al.(K.Y. Lee, H.L. Huang, and Y.C. Hsu, 2007)pr0p0siti0n that cust0mer’s satisfacti0n with the 0nline services str0ngly influences their trust in the website. Having satisfact0ry and p0sitive experiences with the current 0nline services make the cust0mer feel that they have made a c0rrect decisi0n when ch00sing their e-retailer whichenc0urages the cust0mersinc0ntinu0usly ch00singthe same website, f0r successive purchases.
The relati0nship between cust0mer satisfacti0n and repurchase intenti0ns is supp0rted = 0.384, p <0.05). When cust0mer gets satisfied, they felt t0 have made a c0rrect decisi0n f0r ch00sing their service pr0vider, and they will be 0bliged t0 purchase fr0m the service pr0vider again.
The study als0 establishes the influence 0f trust 0n l0yalty ( = 0.167, < 0.05); there f0re, the result supp0rts the hyp0thesis. This research finding reinf0rced the earlier findings 0f G0mez (2006) wh0 pr0p0sed that cust0mer trust affectscust0mer l0yalty t0wards an 0nline retailer. It can be drawn that satisfied cust0mer will bec0me a trusting cust0mer and trusting cust0mers will bec0me l0yal cust0mers (Valenzuela, 2006).
The effect 0f trust 0n repurchase intenti0ns is als0 supp0rted = 0.402, p <0.05) i.e., cust0mer’s trust in the 0nline service and transacti0ns 0f an 0nline p0rtal enc0urages the cust0mer t0 decrease the level 0f risk in underg0ing further 0nline transacti0ns 0n that 0nline service pr0vider in future leading t0 repurchase. The regressi0n result als0 sh0ws that there is directly and p0sitively 0f cust0mer l0yalty t0 repurchase intenti0ns ( = 0.197, p<0.05).
The predictive and explanat0ry p0wer 0f the research m0del is assessed by the percentage 0f explained t0tal variance (R2).R2 = 0.434 when e-satisfacti0n was used t0 predict impact 0n e-trust, this explained 43.4% 0f variati0n in cust0mer e-trust by cust0mer satisfacti0n. M0re0ver e-satisfacti0n and e-trust explained that 57.8% 0f variance in e-l0yalty. Further, the R2 f0r repurchase intenti0ns was 0.681 which explains 68.1% 0f the t0tal variance being c0ntributed by e-satisfacti0n, e-trust and e-l0yalty.
Table 6: Hypotheses of the Study
N0 Hypotheses Beta Sig Results 1 H1: e-satisfaction have direct influences on e- loyalty 0.631 .000 Strongly Supported 2 H2: E–satisfaction have direct influences on e-trust 0.524 .000 supported 3 H3: e-satisfaction have direct influences on e-repurchase intentions 0.384 .000 Supported 4 H4: e-trust have direct influences on e- loyalty 0.167 .002 Supported 5 H5: e- trust have direct influences on e-repurchase intentions 0.402 .000 Supported 6 H6: e- Loyalty have direct influences on e-repurchase intentions 0.197 .002 Supported

Examining Factors Influencing Customer Loyalty and Repurchase Intentions in Online Shopping 85
Volume XI, Issue II, December 2017 IMR (Indira Management Review)
Discussion This research was aimed t0examine the fact0rs influencing cust0mer l0yalty in 0nline sh0pping. The 0bjectives 0f this study was t0investigate the maj0r antecedents that influence 0nline sh0pping satisfacti0n, trust, l0yalty and repurchase intenti0ns in India. The main findings 0f the study is that the pr0p0sed m0del and all the hyp0theses are accepted. First c0nsequence0f the results is that e-satisfacti0n has p0sitively and str0ngest ass0ciated with e-l0yalty. Thus, it ises tablished that cust0mer satisfacti0n is 0ne 0f the m0st crucial antecedents 0f e- l0yalty (Y. Liu, 2007).
The findings als0 established str0ng and p0sitive relati0nship between satisfacti0n and trust. This supp0rts the previ0us study results 0f Delgad0 et al. (2001). Satisfacti0n was als0 f0und t0 have a significant effect 0n repurchase intenti0ns th0ugh n0t s0 str0ngly. The study 0utc0me c0nfirms p0sitive and significant relati0nship between trust and cust0mer l0yalty.
Based 0n the findings, e-satisfacti0n, e-trust and e-l0yaltyhave been f0und t0 be thekeyfact0rs that pr0m0te repurchase intenti0ns in 0nline sh0pping. Online sh0pping c0mpanies sh0uld pay m0re attenti0n t0wards the tw0 key primary fact0rs 0f cust0mer satisfacti0n and trust as enhancing the level 0f these fact0rs will led t0 higher cust0mer l0yalty. And higher e-l0yalty in turn will lead t0 higher e-repurchase intenti0ns 0f the cust0mers. e-Satisfacti0n, e-trust fact0rs have direct and p0sitive effect 0n repurchase intenti0ns meanwhile e-l0yalty has t0tal effect b0th 0f direct and indirect 0n e-purchase intenti0ns.
E. Mustafa, S. Ghane (2011) and C. Flavian (2006)0bserved in their research that ease 0f use, inf0rmati0n c0ntent, inn0vati0n, security pr0tecti0n, cust0mer service, transacti0n and delivery pr0cess impact on 0n-line satisfacti0n. Thus, implementing and sustaining these antecedents appr0priately isa necessary strategy f0r establishing cust0mer satisfacti0n. Still 0ther researchers, such as T. Heidt, T.V. Der, and P. P0nirin (2010), have evidenced that g00d experience 0n 0n-line sh0pping has p0sitive and significant effect0n trust and l0yalty. Theref0re, managers 0f 0n-line retailers need t0study and f0cus0n cust0mer 0n-line experience including all the cust0mer t0uching p0ints starting right fr0m their first p0rtal visit, f0ll0wed by purchase, delivery thr0ugh after sales service. Hence, g00d 0nline experience willp0sitively influence c0nsumer satisfacti0n with the e-service which in turn will influence cust0mer trust, l0yalty and repurchase intenti0ns.
Conclusion The findings 0f this study affirms that all six hyp0theses are supp0rted. Satisfacti0n has p0sitive relati0nship with trust, l0yalty and repurchase intenti0ns. Trust has p0sitive and direct relati0nship with l0yaltyand a direct as well indirect effect 0n repurchase intenti0ns mediated thr0ugh l0yalty.
The results 0f the study als0 sh0ws that cust0mer satisfacti0n has highest impact 0n cust0mer l0yalty. The f0rmati0n0f e-l0yalty can als0 be attributedt0 experience0f the 0nline

86 Singh
IMR (Indira Management Review) Volume XI, Issue II, December 2017
sh0pper. If cust0mers gets g00d and satisfying experience in the first 0nline sh0pping transacti0n, they will intend t0 sh0p fr0m the same 0nline st0re in the c0nsecutive purchases. Theref0re, it is rec0mmended that 0nline st0res 0r retailers sh0uld f0cus 0n cust0mers’0nline sh0pping experience by f0ll0wing the crucial t0uch p0ints in cust0mers’ experience thr0ugh0ut a purchase cycle. M0re0ver, gaining c0nsumer trust is 0ne 0f m0st essential requirement in 0nline sh0pping because there inv0lves risk, as c0nsumers have t0 share their private and security details such as credit card details. Hence, an0ther element 0f retaining the c0nsumers0n the same 0nline st0re is trust 0n the veracity 0f inf0rmati0n ab0ut the pr0duct 0r service features menti0ned 0n the websites as physical0r pers0nal inspecti0n0f the pr0duct 0r service is absent in case 0f 0nline sh0pping. Additi0nal m0tivati0ns f0r repurchase can be realized by 0ffering quality, g00d services, and pr0m0ti0nalincentives t0 cust0mers.
References [1] ASSOCHAM India (2017), ASSOCHAM-Resurgent India Study. [2] Delgad, B.E. and Munuera, A.J.L. (2001), “Brand Trust in the Context of customer loyalty,” European Journal of
Market Research, Vol. 45(1), pp. 35–53. [3] Gomez, B.G., Arranz, A.G. and Cillan, J.G. (2006), “The Role of Loyalty Programs in Behavioral and Affective
Royalty”, Journal of Consumer Marketing, Vol. 23(7), pp. 387–396. [4] Bhattacherjee, A. (2001), “An Empirical Analysis of the Antecedents of Electronic Commerce Service Continuance”,
Decision Support Systems, Vol. 32(2), pp. 201–214. [5] Bryant and Colledge, B. (2002), “Trust in Electronic Commerce Business Relationships”, Journal of Electronic
Commerce Research, Vol. 3(2), pp. 3–39. [6] Flavian, C., Guinaliu, M. and Gurrea, R. (2006), “The Role Played by Perceived Usability, Satisfaction, Consumer
Trust on Website Loyalty”, Information and Management, Vol. 43(1), pp. 1–14. [7] Terawatanavong, C., Whitwell, G.J. and Widing, R.E. (2007), “Buyer Satisfaction with Relational Exchange Across
the Relationship Lifecycle”, European Journal of Marketing, Vol. 41(7–8), pp. 915–938. [8] Chaudhuri, M.B. Holbrook (2001), “The Chain of Effects from Brand Trust and Brand Affect to Brand Performance:
The Role of Brand Loyalty”, Journal of Marketing, Vol. 65(2), pp. 81–93, Doi:101.1509/jmkg.65.2.1.18255. [9] Copeland, M.T. (1923), “Relation of Consumer's Buying Habits to Marketing Methods”, Harvard Business Review,
Vol. 1(4), pp. 282–289. [10] Ribbink, D., Riel, A.C.R.V., Liljander, V. and Streukens, S. (2005), “Comfort Your Online Customer: Quality, Trust
and Loyalty on the Internet”, Managing Service Quality, Vol. 14(6), pp. 446–456, Journal of Services Marketing, Vol. 17(1), pp. 53–67.
[11] Kim, D. and Benbasat, I. (2003). “Trust Related Argument in Internet Stores: A Framework for Evaluation,” Journal of Electronic Commerce Research, Vol. 4(2), pp. 49–64.
[12] Mustafa, E. (2011). “Determinants of e-commerce Customer Satisfaction, Trust and Loyalty in Saudi Arabia”, Journal of Electronic Commerce Research, Vol. 12(1).
[13] Gefen, F., Karahanna, F. and Straub, D.W. (2003), “Inexperience and Experience with Online Stores: The Importance of TAM and Trust”, IEEE Transaction on Engineering Management, Vol. 50, pp. 307–321.
[14] Velenzuela, F.A. and Parraga, Y.A.V. (2006), “Trust and Commitment as Mediataing Variables in the Relationship between Satisfaction and Hotel Guest Loyalty”, Panoraman Socio Economic, Vol. 24(32), pp. 18–23.
[15] Tan, F.B., Tung, L. and Xu, Y. (2009), “A Study of Web Designer Criteria for Effective Business to Cutomer (B2C) Websites using the Repertory Grid Technique”, Journal of Ecommerce Research, Vol. 10(3), pp. 155–177.
[16] Fullerton, F.G. (2005), “The Impact of Brand Commitment on Loyalty to Retail Service Brand, Canadian”, Journal of Administrative Sciences, Vol. 22(2), pp. 97–110.
[17] Gefen, D. (2000), “E-commerce: The Role of Familiarity and Trust”, Omega: The International Journal of Management Science, Vol. 28(6), pp. 725–737.
[18] Ha, H.Y., Janda, S. and Muthaly, S.S. (2010), “A New Understanding of Satisfaction Model in E-re-purchase Situation”, European Journal of Marketing, Vol. 44(7/8), pp. 997–1016.
[19] Internet and Mobile Association of India (2017), “Internet in India 2016”. [20] Internet and Mobile Association of India (2017). IAMAI & KANTAR IMRB Report.

Examining Factors Influencing Customer Loyalty and Repurchase Intentions in Online Shopping 87
Volume XI, Issue II, December 2017 IMR (Indira Management Review)
[21] Flint, J., Blocker, C. and Boutin, P. (2011). “Customer Value Anticipation, Customer Satisfaction and Loyalty: An Empirical Examination”, Industrial Marketing Management, Vol. 40, pp. 219–230.
[22] Kim, J., Morris, D. and Swait, J. (2008), “Antecedents of True Brand Loyalty”, Journal of Advertising, Vol. 37(2), pp. 99–117.
[23] Tam, J. (2012). “Linking Perceived Service Quality to Relational Outcomes in a Chinese Context”, Journal of International Marketing, Vol. 24, pp. 7–23.
[24] Lee, K.Y., Huang, H.L. and Hsu, Y.C. (2007), “Trust, Satisfaction and Commitment on Loyalty to International Retail Service Brans”, Asia Pacific Management Review, Vol. 12(3), pp. 161–169.
[25] Khalifa, M. and Liu, V. (2007), Online Consumer Retention: Contingent Effects of Online Shopping Habit and Online Shopping Experience”, European Journal of Information Systems, Vol. 16, pp. 780–792.
[26] Reid, L.J. and Reid, S.D. (1993), “Communicating Tourism Supplier Services: Building Repeat Visitor Relationships”, Communication and Channel Systems in Tourism Marketing, pp. 3–19.
[27] Pleessis, L.D. (2010), Customer Relationship Management and its Influence on Customer Loyalty at Liberty Life in South Africa, University of Johannesberg.
[28] Lin, C. and Lekhawipat, W. (2014), “Factors Affecting Online Repurchase Intention”, Industrial Management & Data Systems, Vol. 114(4), pp. 597–611.
[29] Ling, K.C., Chai, L.T. and Piew, T.H. (2010), “The Effects of Shopping Orientations, Online Trust and Prior Online Purchase Experience toward Customers’ Online Purchase Intention”, International Business Research, Vol. 3(3), pp. 63–76.
[30] Razzaque, M.M.A. and Boon, T.G. (2003), “Effects of Dependence and Trust on Channel Satisfaction, Commitment and Cooperation”, Journal of Business to Business Marketing, Vol. 10(4), pp. 23–48.
[31] Uncles, M.D., Dowling, G.R. and Hammond, K. (2003), “Customer Loyalty and Customer Loyalty Programs”, Journal of Consumer Marketing, Vol. 20(4), pp. 294–316.
[32] Rexha, N., John, R.P. and Shang, A.S. (2003), “The Impact of the Relation Plan on Adoption of Electric Banking”, Journal of Services Marketing, Vol. 17(1), pp. 53–67.
[33] Kotler, P. (2010), Marketing Management, Prentice Hall, Inc, New York. [34] Anderson, R.E. and Srinivasan, S.S. (2003), “Satisfaction and e-loyalty: A Contingency Framework”, Psychology
and Marketing, Vol. 20(2), pp. 123–138. [35] Frederick, R., Robert, M.G. Jr. and Christopher, H. (2000), “e-customer Loyalty–Applying the Traditional Rules of
Business for Online Success”, European Business Journal, Vol. 12(4), pp. 173–179. [36] Oliver, R.L. (1999), “Whence Consumer Loyalty?” Journal of Marketing, Vol. 63(4), pp. 33–44. [37] Rust, R.T. and Zahorik, A.J. (1993), “Customer Satisfaction, Customer Retention, and Market Share”, Journal of
Retailing, Vol. 69(2), pp. 193–215. [38] Alam, S. and Yasin, N.M. (2010), “What Factors Influence Online Brand Trust: Evidence from Online Tickets
Buyers in Malaysia”, Journal of Theoretical and Applied Electronic Commerce Research, Vol. 5, Issue 3, pp. 78–89, December.
[39] Krauter, S.G. and Kaluschab (2003), “Empirical Research in On-line Trust: A Review and Critical Assessment”, International Journal of Human–Computer Studies, Vol. 58(6), pp. 782–812.
[40] Ghane, S., Fatian, M. and Gholamian, M.R. (2011), “Full Relationship among e-satisfaction, e-trust, e-service Quality and e-loyalty: The Case of Iran e-banking”, Journal of Theoretical and Applied Information Technology, 15th November, Vol. 33(1).
[41] Shoemaker, S. and Lewis, R.C. (1999), “Customer Loyalty: The Future of Hospitality Marketing”, International Journal of Hospitality Management, Vol. 18, pp. 345–370.
[42] Sugiono (2008), Business Research Methodology. [43] Thurau, T.H. and Klee, A. (1997), “The Impact of Customer Satisfaction and Relationship Quality on Customer
Retention a Critical Reassessment and Model Development”, Psychology & Marketing, Vol. 14(8), pp. 737–765. [44] Heidt, T., Der, T.V. and Ponirin, P. (2010). “Modelling the Complexity of Eloyalty: The Role of e-Value, Trust, e-
Satisfaction and e-Commitment”. [45] Zeithaml, V.A, Berry, L.L. and Parasuraman, A. (1996), “The Behavioral Consequences of Service Quality”, Journal
of Marketing, Vol. 60(2), pp. 41–46. [46] Bart, Y., Shankar, V., Sultan, F. and Urban, G.L. (2005), “Are the Drivers and Role of Online Trust the Same for all
Website and Consumers? A Large-scale Exploratory Empirical Study”, Journal of Marketing, Vol. 69, pp. 133–152. [47] Liu, Y. (2007). “The Long Term Impact of Loyalty Programs on Consumer Purchase Behavior and Loyalty”, Journal
of Marketing, Vol. 17(4), pp. 19–35.
IMR (Indira Management Review)
Volume XI, Issue II, December 2017
Power Market in India and its Potential
Subir Bhattacharya Assistant General Manager, Management Advisory Services Division,
MECON Limited, Ranchi
Introduction Indian power sector is at the crossroads. Transformation of the sector was well supported by creation of institutions to enhance efficiency through creation of markets via trading and later on in 2008 through trading on power exchanges. However, long-term contracts usually fail to meet the full requirements of the market participants as electricity cannot be stored, hourly consumption in the long-term without forecasting errs is difficult to predict, long-term contracts for peak load requirement are economically inefficient etc. Development of short-term trading markets is necessary to complement the long-term markets. Recognizing these problems, in 2006, CERC initiated organising electricity market by creating power exchanges. On this backdrop, the paper is directed towards the following objectives: (i) experience of power market operations in selected developed countries, and (ii) assessment of Indian power exchange market and its potential.
Reaearch Methodology The present study is carried out by evaluating the findings of various studies, which have worth and validity, available in limited literature on the subject. Data used and analysed in the work are obtained from secondary sources.
Market Models in Selected Countries Different countries adopted/ designed independent market models for power market. Australia (NEMMCO) and USA (PJM) are mandatory power markets while NZEM (New Zealand), Nord Pool, BETTA (UK) and IEX (India) are some voluntary market places. The section deals with design aspect of some important power markets in Europe, USA, Australia and India.
Nord Pool, Europe In Europe, trading arrangements are mostly bilateral and most wholesale trade is in Over-the-Counter (OTC) markets, often supplemented with day-ahead auction trade (Leonardo and Belmans, 2007)
Nord Pool is jointly operated by two Transmission System Operators (TSO)—Statnett in Norway and Savenska Kraftaunt in Sweden. It also operates a spot market called Nord Pool Spot. Nord Pool has transformed all clearing settlement operations to a wholly-owned clearing company called Nord Pool Clearing House ASA (Flatabo and Doorman, Grande and Raden and

Power Market in India and its Potential 89
Volume XI, Issue II, December 2017 IMR (Indira Management Review)
Wangensteen, 2003). The day-ahead spot market in Nord Pool El spot offers contracts for the next
delivery. The Elspot exchange price, done using area pricing approach1, is taken as reference price for financial contracts offered by other financial power markets. The market following Elspot is the hourly ahead market Elbas which enables power generators, distributors and brokers to finetune their portfolio of their electricity delivery contracts. Nord Pool ASA offers contracts of up to six years’ duration with contracts for days, weeks, months, quarters and years. The Nord Pool power market structure is depicted below (Fig. 1):
Fig. 1: Market Structure in Nord Pool
PJM, USA This is a common market for Pennsylvania, New Jersey and Maryland (PJM) and was the first wholesale market designed in USA. The Federal Energy Regulatory Commission (FERC) identified PJM market designed as standard market design. There are more than 500 companies covered by PJM market. It serves about 51 million people. It serves a peak load of 144,644 MW and generation capacity of 164,905 MW. PJM transmits through 49,970 miles of transmission line. Annual energy sold is about 729,000 GWh. It covers 14 states.
1 where market is split in different price areas when congestion occurs
55% Bilateral Contracts
OTC Clearing
Financial Derivatives
Market
Forward Prices
CMD Market (Zonal Price Differences)
Day-ahead Zonal MCP
Day-ahead Energy Market (Elspot)
Hour-ahead Energy Market (Elbas)
Real-time Balancing Market
Average Single Price
Zonal Balancing MCP
90 Bhattacharya
IMR (Indira Management Review) Volume XI, Issue II, December 2017
PJM operates a day-ahead market, a real-time energy market2, a daily capacity market, monthly and multi-monthly capacity market, a regulation market and a monthly Financial and Transmission Rights (FTR) auction market. Day-ahead market calculates market clearing price and volume for each hour taking into account all generation offers, load bids, bilateral transactions, incremental and decremental bids and virtual bids3. The balancing market is real-time energy market in which hourly clearing prices are determined based on actual bid, least cost, security constrained unit commitment dispatch. Load Serving Entities (LSE) pays balancing prices for any demand that exceeds their scheduled amount but will receive revenue for demand deviations below their day-ahead amounts. Transmission customers pay congestion charges (or receive congestion credits) for bilateral transaction quantity deviations from the day-ahead schedule.
A LSE has the obligation to own or acquire capacity resources greater than, or equal to, peak load plus a reserve margin of 18%. LSEs have flexibility to acquire capacity in various ways4. Transmission customers are hedged against real-time congestion by matching real-time energy schedules with day-ahead energy schedules. FTRs can also provide hedge for market participants against the basis of risk associated with delivering energy from one bus to another.
PJM seems to be a complex market and needs modern systems in different market segments and sophisticated data recording system.
National Electric Market, Australia National Electricity Market Management Company Limited (NEMMCO) was established in 1996, to administer and manage the market and improve efficiency. Members of NEMMCO are: Queensland, New South Wales, Australian Capital Territory, Victoria, South Australia and Tasmania. The Australian electricity market is completely competitive with any participant able to purchase from any other. Participants in the NEM can take part in any combinations of two levels of reading:
Spot trading with energy traded through a pool and spot price set every half an hour by the last generator selected to run. All wholesale electricity is accounted for through the pool5.
Short-term forward market trading in which purchasers lock in energy prices through hedging contracts.
2These two are part of two settlement system of PJM market in which day-ahead market acts as a financial market and provides a hedge against price fluctuations in real-time market. 3Virtual bids are bids from the load side and its purpose is to increase the generation availability in real-time and reduce the system price. 4Capacity can be acquired by building units, by creating bilateral agreements, by participating in the capacity credit markets operated by PJM. These together known as Installed Capacity Market (ICAP) 5This is called gross pool or, energy-only pool.

Power Market in India and its Potential 91
Volume XI, Issue II, December 2017 IMR (Indira Management Review)
Under hedging contract, the purchaser (generally retailer) agrees to purchase specified quantity of energy from the spot market at set price called Strike Price. If the actual price paid in the spot market by the purchaser is higher than the strike price, the counter party to the contract (typically electricity generator) pays the purchaser the difference in cost. Conversely, if the price paid is lower than the strike price, the purchaser pays the counter-party, the difference.
From the bid submitted, NEMMCO's systems determine which generators are required to meet demand and at what time, and their production levels in a process called Scheduling. Offers to generators are stacked in order of rising price and then scheduled and dispatched into production. More expensive generators are scheduled into production as total demand increases. Market structure of NEM is depicted below:
Fig. 2: Market Structure of NEM
Comparative Assessment Nord Pool, PJM And Memmco A comparative assessment of the different electricity market structures are systematically presented in Table 2. It is observed that Nord Pool model provides more simple power exchange mechanism and suitable for application in India.
Table 2: Comparative Assessment of the Different Electricity Market Structures
Item Nord Pool PJM MEMMCO Participation Voluntary for day-ahead
adjustment market Compulsory for day-ahead market Compulsory for day-ahead
market Market Offerings Day-ahead spot, Hour-
ahead, Forward Day-ahead spot, Real-time balancing, Capacity credits
Day-ahead spot and Short-time forwards
Bidding type Double sided Double sided Double sided
Reserve Market (Tenders)
Financial Bilateral Hedge
contracts
Day-ahead pre-dispatch
FTR (Settlement Residue auction
Forecasted Zonal MCP
Real-time 100% Balancing Market
Zonal MCP and Dispatch

92 Bhattacharya
IMR (Indira Management Review) Volume XI, Issue II, December 2017
Item Nord Pool PJM MEMMCO Adjustment market Elbas, intra-day auction
market Bid quality can be changed till the gate closure
Real-time/ Balancing Market
Counter trade for real-time, Participants are given MCP
Deviations are traded in real-time Through purchase of ancillary services, reserve capacity buying
Pricing Rule Zonal pricing Nodal pricing Zonal pricing Pricing Type Ex-ante Ex-post Ex-post Risk Management Forward, Futures, Options FTRs, bilateral OTC, Multi
settlement market, Virtual bidding, Financial trading
Bilateral OTC, Derivatives on Sydney futures exchanges
Congestion Management
Area splitting Security constrained economic dispatch
Locational transmission for transmission tariff
Transmission Loss Included in Zonal price Included in real-time LMP To be purchased by generators Time blocks Hourly block Hourly block Half-hourly block
Indian Power Market In India, electricity reform re-evaluation of Electricity Supply Act, 1948 and Indian Electricity Act, 1910. This led to Electricity Act, 2003 which has been brought about to facilitate private sector participation to complement cash constrained State Electricity Boards (SEB) to meet the electricity demand. The act envisages transmission towards a competitive electricity market structure in India (Fig. 3).
Fig. 3: Transmission towards a Competitive Electricity Market Structure in India
Source: Mercados Energy Market India Pvt Ltd. 2014
Power exchanges have evolved rapidly to compliment and supplement the needs of the wholesale power markets in a transparent and efficient manner. Trading on exchanges has matured despite initial low volumes and high prices. After six years of operation, markets are now more efficient, liquid and promote investment as well as better utilisation of national resources. Indian Energy Exchange (IEX), as the power exchange with maximum volume and largest participation, has played an important role in furthering the objectives of the Electricity Act 2003 by enhancing competition, implementing open access and through realisation of the impact of de-licensing of generation. Creation of national grid has been supported by commercial contracts wherein huge volumes of electricity have been transferred across India to improve the reliability and security of

Power Market in India and its Potential 93
Volume XI, Issue II, December 2017 IMR (Indira Management Review)
supply in both the surplus and deficit regions. The exchanges have aided in better utilisation of national resources, reduced unmet demand and consequently reduced economic losses and improved energy security of the nation. Huge bottled up captive generation has also been brought into the national market to facilitate its most productive use of the economy.
The Electricity Act, 2003 is for promoting competition in electricity market, protection of consumers 'interest and power for all’. The act recommended National Electricity Policy (NEP), open access in transmission, phased open access on distribution, mandatory State Electricity Regulatory Commissions (SERC), licence free generation and distribution, power trading, mandatory metering and stringent penalty for theft of electricity. Another step we have seen is the implementation of Availability Based Tariff (ABT) which brought about the day-ahead scheduling and frequency sensitive charges for deviation from schedule for efficient real-time balancing.
ABT treats the fixed and variable costs separately. The fixed cost, known as capacity charge is associated with plant and its capacity to deliver MWs on day-to-day basis. Variable cost, known as energy charge, and the total amount paid to the generators is based on their scheduled energy production rather than actual production. ABT has a third component called Unscheduled Interchange (UI) which is the payment for deviation from schedule and rate is decided in accordance with system frequency (e.g., Fig. 4). In India, ideal system frequency considered as about 50 Hz. Deviation from this requires synchronization which involves cost. That is the reason behind price difference for different frequencies.
Fig. 4: UI Price Vector with Effect from 29/12/2007
Source: Prepared from data available in <www.cercind.gov.in>
Beneficiaries are paid for under withdrawal or charged for over withdrawal according to the system frequency. UI mechanism acts as balancing market in which real-time price is determined by system frequency.

94 Bhattacharya
IMR (Indira Management Review) Volume XI, Issue II, December 2017
To promote power trading, CERC approved the setting up of IEX. It is designed on the basis of the most successful international power exchange Nord Pool. The exchange has been developed as market based institution where the participation in exchange operation is voluntary. Presently, IEX offers day-ahead contracts with time line set in accordance with Regional Load Dispatch Centres (RLDC). IEX co-ordinates with National Load Dispatch Centres (NLDC)/ RLDCs and State Load Dispatch Centres (SLDC) for scheduling of traded contracts.
The day-ahead market of IEX is double-sided auction and discovers the price incorporating supply and demand side bidding. In the year 2008, and the first half of the year 2009, when the participants presented in each hour were relatively less, high prices were discovered not due to monopolistic behaviour of suppliers but because of the inelasticity of demand. This is typical of economies where demand exceeds supply and supply curves need to be extended vertically to discover the market clearing price as shown in Fig. 5. Hence, the prices were ‘high’ because of the inelasticity of demand and a strictly positive gap between the demand and supply. Though such high prices are not desirable from political and social considerations, from an economics perspective, this indicates functioning of the market in accordance with the principles of social welfare maximisation as enunciated in the regulations governing the operation of IEX. However, the incidence of such phenomenon has declined significantly. Thus, fewer price peaks together with declining volatility is an indicator of short term markets achieving higher liquidity. In the current market scenario, given the low prices on the exchange, the price is close to the marginal costs of generation, thus, reflecting any perceived lack of market abuse.
Fig. 5: Demand and Supply Curve at IEX During Initial Period
Network constraints are considered in deriving the price and market splitting approach is used to clear the market with congested lines. The exchange, at present, offers only day-ahead contracts of an hourly time block. However, the exchange envisage plans to offer the adjustment contracts and long-term contracts like forwards and future to hedge the risk against electricity market uncertainty. Indian electricity market mechanism can be described as follows (Fig. 6):

Power Market in India and its Potential 95
Volume XI, Issue II, December 2017 IMR (Indira Management Review)
Fig. 6: Indian Electricity Market Mechanism
Specific Features of IEX are as given below (Table 3):
Table 3: Specific Features of IEX
Participation Market Offering
Bidding Type
Real-time/ Balancing
Market
Pricing Rule
Pricing Type
Risk Management
Congestion Management
Transmission Loss
Time Blocks
Voluntary Day-ahead spot
Double sided
UI charges Zonal Ex-ante Bilateral OTC Area splitting To be purchased by participants
Hourly blocks
Potential of Indian Power Market Indian power market is still to achieve full potential. In 2012013, India’s buying potential was 15.35% while the selling potential was 4.57% at the national level. If 10% load shedding is considered, the potential size increases to 23.5%. This potential is only on account of co-skewness of the demand met in each state.
The actual potential is, however, higher and would be 23.5% if load shedding in energy terms, assumed conservatively to be 10%, is addressed. The potential would also increase if all the states were to allow their large industrial customers (greater than 1 MW) to procure from markets. The supply side potential is also high because: (a) the private sector plants–e.g. Sterlite, Jindal, JSWL, etc. sell a fixed percentage of their output in short term markets, (b) the un-requisitioned capacity of central sector plants (which the staff paper of CERC on Ancillary services market proposes to be used for providing frequency support ancillary services) is also available in short term markets.
There is huge untapped potential which provides opportunity for further development of power market in India. Given the impact of NEW and SR grids and CERC Regulation 20146, the size of the day-ahead market is expected to increase over time.
6 Deviation Settlement Mechanism & related matters and Indian Electricity Grid Code

96 Bhattacharya
IMR (Indira Management Review) Volume XI, Issue II, December 2017
Gap between demand and supply from capacity tied up under long-term contracts, indicates that long-term contracts of utilities will be sufficient to meet entire demand across various states. States will continue to depend on markets for meeting their power requirements on real-time basis. In this context, power exchanges would play a lead role.
Achieving full potential has some impediments also. The state level demand reported is usually the constrained demand that does not take into account the latent demand or unserved demand that is not recorded in the CEA/ Load Dispatch Centres (LDCs) recording systems. Demand currently reported does not capture demand of the large industrial and commercial open access consumers, which is met through captive diesel generating sets. The state level supply ignores the power 3.42% that is sold on merchant basis.
Trading, in the short term markets, is governed by the differences in the load curves of various trading utilities/ entities in the country. It may not, however, always be possible to transmit power—from a region which has a peaking capacity, during other than peak periods—to another region where there is a peak requirement, due to transmission constraints. In these conditions, the local distribution utility facing peaking conditions may need to tie up with a local peaking generator for short term. Therefore, short-term planning is distinct from long term planning and involves consideration of both the local peaking resources and transmission from other regions for the reason of economy.
Recommendations Indian power exchange market is in a nascent stage compared to the developed world. But it is developing in line with Nord Pool of Europe. It should expand its operations to enhance efficiency for delivering electricity in a cost effective manner to fulfil the national objective of Power for All, 24 x 7.
References [1] Flatabo, D., Doorman, G., Grande, O., Raden, H. and Wangensteen, I. (2003), “Experience with Nord Pool Design
and Implementation”, Institute of Electrical and Electronics Engineers (IEEE) Transaction on Power Systems, Vol. 18(2), pp. 541–547.
[2] Lornaldo, M. and Belmas, R. (2007), “Is the Prevailing Wholesale Market Design in Europe and North America Comparable?”, IEEE Power Engineering Society General Meeting, pp. 24–28.
[3] Mercados Energy Market India Pvt Ltd. (2014), Indian Power Market: Journey so Far and Way Forward, June, p. 6.
IMR (Indira Management Review)
Volume XI, Issue II, December 2017
Utility of Social Media for Competitive Intelligence Boon or Bane
Dr. Saroj Hiremath HOD and Commerce Association Incharge, S.P. College, Pune
Introduction Most of the value added in manufacturing, product service companies is created by knowledge-based service activities such as research and development, marketing research, product design, customer service, advertising, or distribution. Winning firms are organizations that most successfully master the business issues critical to their performance, and develop the most precise understanding of definitions of value and creation of value. Competitive advantage has a lot to do with leveraging the knowledge assets of the firm, while at the same time determining how competitors are likely to leverage theirs.
Competitive intelligence has undergone a groundswell of interest in the recent years, the interest is partly fuelled by an increasing availability of information itself (the much-touted information explosion) and an increase reflected in the proliferation of commercial databases world-wide. The objective of competitor intelligence is not to steal a competitor’s trade secrets or other proprietary property, but rather to gather in a systematic (i.e., legal) manner, a wide range of information that when collated and analyzed provides a fuller understanding of a competitor firm’s structure, culture, behaviour, capabilities and weaknesses.
Competitor intelligence is the analytical process that transforms disaggregated competitor intelligence into relevant, accurate and usable strategic knowledge about competitors, position, performance, capabilities and intentions. This study is significant to understand the whether the purpose and objective of collecting information through social media for competitive intelligence is worthwhile or not.
Competitive intelligence is first and foremost about understanding your competitor’s strategy. To do this, one needs to gain insight into their products, services, finances, partners, and customers. In today’s increasingly open and social Web, there are few better places to gather all of this important data.
Following are few insight on the issue:
1. Identify Promising Social Networks: Although there is some increasing stability in the landscape of social networks, communities and demographics are still shifting in some of the most popular social media venues. Challenge is to continually survey and make sure that all are tuned into the most appropriate social networks for achieving objectives.
2. Create Social Media Profiles: Although much of competitive intelligence is about having good listening capabilities, it is important to gain credibility in environments that

98 Hiremath
IMR (Indira Management Review) Volume XI, Issue II, December 2017
one monitors. This step means creating and maturing effective social media profiles. This does not necessarily have to be specific, but relevant personas need to be manned by someone in the business.
3. Aggregate Social Media: One should have social network targets and persons to link with need to turn on the fire hose. In online circles, this is often referred to as a ‘river’. This is most often a flow of messages from blogging and micro-blogging (Twitter) platforms in the form of RSS feeds. This simple technology, combined with something like Google Reader can literally flow in thousands of social media conversations from all corners of the Web.
4. Track Important People (Influencers): This approach will be filled with tons of noise and irrelevant messages. However, if one starts to recognize the most influential and relevant people to the objectives one can begin to focus and prune the social media monitoring bringing in better competitive intelligence.
5. Continually Tune Competitive Intelligence: Once objectives are confirmed, one needs to constantly avail information such as, what are the best sources of information? Who tends to break news first? Are there people and websites that do the best analysis? Are there insiders that tend to leak information?
Enriching Competitive Intelligence Via Social Media
With so many channels available to listen and explore right from Facebook to Twitter to LinkedIn to YouTube to Tumblr to … getting data about competition is easier, but competition has never been simpler.

Utility of Social Media for Competitive Intelligence Boon or Bane 99
Volume XI, Issue II, December 2017 IMR (Indira Management Review)
Searching for Competitive Intelligence Via Social Media
Means and Ways for Competitive Intelligence Via Social Media Monitor popular keywords of similar industries. For example, for home renovators, it
could be ‘renovations’, ‘home improvements’, ‘DIY repairs’ or ‘home projects’
It is necessary to keep a steady eye on competitors to see what’s being said about them and also focus on people who are complaining about bad products, service or customer service. Then, it is necessary to offer advice or help, rather than trying to sell them something.
One can also look for conversations about trends within industry. For example, for home renovators, it could be about new kitchens, bathrooms or energy-efficient appliances. Then the company can provide advice, insight and recommendations.
The competitors are probably using the same tools to keep tabs. So, it is necessary to keep an eye on our own social media presence to see the images that are being projected.
Conducting an audit of the social media used for marketing outlets is necessary. It is necessary to hire someone outside marketing department to browse Facebook, Twitter and YouTube accounts to seek out the answer to the following question, ‘Do we want our competitors’ access to this piece of information?’ It is necessary to use Web 2.0 search tools to cull information that might be available on Web 2.0. This initiative is a part of a defensive competitive intelligence plan.
It is necessary to draft and adhere to engagement guidelines that is, When engaging the audience, it is necessary to be prepared to deal with some of the unwelcome comments. These comments can be used against the competitors. As a result, a set of guidelines should be established to clearly state the topics that should be covered, when postings should be done.

100 Hiremath
IMR (Indira Management Review) Volume XI, Issue II, December 2017
Information on using Social Media for Competitive Intelligence 1. Know what you’re looking for
This seems like an obvious point, but often isn’t, to end users! Sometimes people will ask you for things without explaining what they actually need, often without even really knowing these themselves.
First step is always to clarify with enquirer–what are they actually expecting?
For example, ‘How many German cars are there?’ Enquirer may think this as a straightforward question, but do they actually mean how many cars are there in Germany? Or, how many cars are manufactured in Germany (and is this per year?) Or, how many types of German-manufactured cars are there?
What is the information for? Why is it needed? How will it be used?
Different information will be useful if the company you’ve been asked to look into is an existing client, potential client, competitor, etc. Make sure you know who they are.
2. Create a collection plan
If the subject of the enquiry is either very broad or very niche, general search engines won’t be of much help
Consider where the information is likely to be, search likely sources directly rather than using Google
3. Know your search engines
Don’t rely on just one, e.g. Google and Bing will return slightly different results. How different they are will depend on the subject
Consider using advanced options, e.g. Google’s ‘wonder wheel’
4. Consider the ‘deep web’
General search engines index less than 10% of the web!
Use specialist search engines like Google Scholar/ Books/ News,
Go directly to official sources such as government websites for official data
Job sites can be useful for finding out if a company is restructuring etc, seeing how they describe themselves

Utility of Social Media for Competitive Intelligence Boon or Bane 101
Volume XI, Issue II, December 2017 IMR (Indira Management Review)
5. What can company websites generally tell?
domaintools.com can be used to find out domain ownership, domain name history, what other sites are hosted on the same server, any other domains owned by the same people
OpenSiteExplorer.com will tell who is linking to a particular site
6. Find public opinion through social media
Search different social media (e.g. blogs, Twitter, LinkedIn) to find news on a company before it hits the headlines
See what news the company itself is putting out, do they have any official social media accounts?
See what others are saying about them
7. Be prepared to pay for information
Free information is often free for a reason!
There will be a limit to what canbe found without paying
Paid for information will usually be more comprehensive and more authoritative
8. Keep up-to-date
Search tools and sources change all the time, make sure you know what is out there
Mailing lists and library associations are also a good way to keep up-to-date
9. Think different
There’s a goldmine of competitive intelligence within the social media landscape. Spending some time on the dark side could generate some good business opportunities.
Competitive Intelligence–Boon or Bane? The social web is becoming more personal so consumers expect the messaging to evolve. By obtaining a real-time window into issues and problems facing the competitors, one has the opportunity to proactively respond with timely messaging or programs targeting the customers or products affected and capitalizing on the specific problem. If a competitor is having supply or quality problems, offer a targeted upgrade program.
One probably already talks to the customers about how to improve your products. That’s good. The savviest companies are learning to also talk—or at least listen—to users of competitive products. What features or capabilities do they really want and why? What are key challenges or

102 Hiremath
IMR (Indira Management Review) Volume XI, Issue II, December 2017
objections? User forums are good, but don’t overlook professional or social communities where key competitor staff might brag or vent. Better than a focus group or interviews, social media also lets you see the competitors’ responses and often their rationale. They may explain why a requested feature won’t be in the next release that provides important insights into their strategy or operations. This leads to long-term product improvement.
Seldom do people realize that business, just like life is merely a series of decisions. And global firms have a growing need for the necessary information on which to base decisions concerning the conduct and development of each of their firm’s strategic objectives, and the protection of their organizations against threats from their competitors. So they need avenues through which information of competitors can be collected. Social media like Facebook, Twitter, Blogs, Linkedin etc. The social media are of great importance for competitive intelligence. But, the businessmen should be well aware that it comes with great amount of flaws. Utility of social media for competitive can be viewed as boon and bane both, it depends upon what information, from where and how information is collected. To take the maximum advantage of social media for competitive advantage one has the complete knowledge as to the working of social media, the behaviour of people using social media etc.
In short, CI is the purposeful and coordinated monitoring of the competitor(s), wherever and whoever they may be, within a specific marketplace... ‘Competitors’ are those firms which are considered as rivals in business, and with whom marketers compete for market share. CI is to do with determine and analyze, what the business rivals WILL DO and take action before they do it. Social media opens up many of the critic communications that are important to answering competitive questions. However, there is significant work in keeping the listening posts dialed into a moving target. A more comprehensive and dedicated social media monitoring platform can help to stay plugged-in on the competitors. On understanding the pros and cons of competitive intelligence via social media, it can be clearly vouched that it is more of boon than bane, but not to forget the darker side or the limitations of its usage for competitive intelligence compared to other types of media.
References [1] Gilad, Ben and Herring, Jan (2001), “CI Certification--Do We Need It?”, Competitive Intelligence Magazine,
Vol. 4(2), pp. 28–31. [2] Blenkhorn, D. and Fleisher, C.S. (2005), Competitive Intelligence and Global Business, Westport, CT: Praeger. [3] Rappaport, Stephen D. (2011), Listen First--Turning Social Media Conversations into Business Advantage, John
Wiley & Sons, Inc. [4] José, Palazzo M. de Oliveira et al. (2004), “Applying Text Mining on Electronic Messages for Competitive
Intelligence”, 5th International Conference on Electronic Commerce and Web Technologies, EC-Web 2004, Zaragoza, Spain 2004.
[5] www.socialbusinessnews.com [6] www.btobonline.com [7] www.socialmediatoday.com

IMR (Indira Management Review)
Volume XI, Issue II, December 2017
Lean HR: A Step Towards Success
Prof. (Dr.) Satish S. Ubale1 and Dr. Anand D. Padle2 1Director, Matrix School of Management Studies, Pune
2Associate Professor, Matrix School of Management Studies, Pune
Abstract: Most of the organizations are flat now-a-days and are moving for continuous change. A major challenge for these organizations is to improve efficiency of its employees, and to ensure continuous improvement in this rapidly changing environment. The traditional HR methods are obsolete in current scenario. The need of an hour is to create an environment that will promote employee engagement and make the organizations succeed in this continuous change, for this human resource practices should be 'flexible' and ‘lean'. This paper highlights the ways to adopt ‘Lean HRM’ which will help the organization to eliminate or minimize waste and drive towards human efficiency. The lean HR originated in 2007 but organizations fail to understand its benefits. HR practices needs a revamp and must include lean which is especially relevant to use of human resources and training functions.
Keywords: Lean, Process, Human Resource, Culture
Introduction It is a thumb rule for all HR managers to sack employees in bad times of the organization assuming that this will help in reducing losses. HR managers must understand that sudden removal of employees will lower the morale of retained employees and increase insecurity leading to loss of efficiency which in turn again adds to the losses. There is a need for innovative HR practices to reduce layoffs and develop positive climate in the organization and helps in smooth and cordial relationship between employees and management with more commitment towards work.
A number of practices that may help the HR managers/ owners to motivate employees contribute towards manufacturing improvements and increased profitability is discussed in this paper.
Creating Environment for Lean Culture The first and most difficult task in any lean transformation is the engagement of staff at all levels. The best time to initiate lean initiatives is usually bad phase of the organization. The managers and employees should understand the need for lean and its benefits for them individually so that resistance will decrease. It is observed that employees and managers feel they are overloaded with their work and though the change initiative is necessary they don’t have time for it. In early stage of lean implementation, there is resistance from all. Thus, the success of lean depends on strong leadership, good communication, patience and persistence on the part of the management and percolation of the need at all levels. Staff, supervisors and managers have to learn that the ‘old way’ is not always the best way. Managers must learn to be mentors, and to set an example for the rest of the organization by doing, as well as saying.

104 Ubale and Padle
IMR (Indira Management Review) Volume XI, Issue II, December 2017
Attitude of the Management Positive attitude makes a tough job easy; thus, management must adopt attitudinal change towards the lean. It should treat the employees as business partners who will make the organization earn more profits. The communication between the management and the employees should be clear and transparent. The lean philosophy says that the employees should be considered as process engineers as they are master of their work process. The organization should create positive work environment that enables its employees to thrive for the success of the organization. It should focus on fostering innovation and collaboration, or making the organization the best place to work even in adverse time.
Fig. 1: Lean HR Model
Improved Recruitment Process Recruitment, in good days, should be done with proper planning and analysis. The HR person should be included in the core committee of the organization which sets short term and long term goals of the organization. The HR person can highlight the future requirements of human resources in this meeting and this can be correlated with the goals set by the organization. At the time of recruitment, the organization should clearly lay down the policy regarding the competencies employees must have (e.g., teamwork, positive attitude, problem solving ability, job fit, motivation, communication, integrity, etc.) and it should recruit people who have the required competencies, so that in adverse times instead of layoff they may be used in other jobs or departments by the organization.

Lean HR: A Step Towards Success 105
Volume XI, Issue II, December 2017 IMR (Indira Management Review)
The selection procedure should be designed in such a manner that identifies employees who excel in a lean environment, as it demands higher levels of energy, problem solving, collaboration, and continuous improvement.
Training ‘One size fits all’ concept for training is outdated and must be replaced by training need analysis of the employees. More emphasis should be given on practical training than theoretical and also information regarding lean systems to all the employees. During training, emphasis should be on encouraging high performance by communicating the value and including it in its performance management system.
The method of ‘self-inspection’ by the operator should be implemented which makes the employee responsible for the quality of their work. The employees who refuse to embrace high performance culture should be removed from the organization.
Performance Management It is the process that a manager applies to link an employee’s individual performance to organizational goals and performance metrics. It helps to promote employee engagement, growth, productivity and retention provided the complete process is unbiased and transparent. The role of a HR manager in lean is to identify the duties of employees expected to accomplish and communicate the competencies (job knowledge and skills) needed to be successful. Timely feedback on employee’s effectiveness son applying job knowledge and skills to achieve the goals for their position and the organization should be given with reward to the best performers. If some of the employees do not meet the required performance standard, the manager must know the ways to address performance issues and the methods that can help improve employee performance.
Transformational Leadership The successful implementation and execution of lean HR mainly depends upon the leadership quality. Leader should identify the potential of his team and channelize it to achieve required change, create sense of commitment of the members of the group. This will help to motivate followers to perform and achieve goals set by the organization and earn rewards and praise. As a result, employees will be self-motivated and will have the ability to cope with stress in adverse conditions and perform successfully, leading to increased productivity.
Performance Linked Compensation The HR managers should design an improved compensation and incentive plan for the best performers. In lean-management, the best performers are those employees who are great at developing other employees and solving problems apart from the technical requirements of their

106 Ubale and Padle
IMR (Indira Management Review) Volume XI, Issue II, December 2017
jobs. The most valuable team member may not be the one who produces the most but the one who can stretch to use many skills, without necessarily being the best at any of them.
Effective Communication The most important of all for lean implementation is clear and effective communication that leads to strong teamwork and the ability to work together to achieve organization goals. Trust and loyalty are key factors in any relationship and both are boosted by effective communication. Strong relationships can be built between the management and the employees, between the employees themselves and among the organisation and the customers by adopting good communication.
Discussion Now, the time has come to design and adopt lean HR practices to build the workplace of tomorrow that will inspire employees and allow them to think out-of –the-box for better strategies to compete successfully in rapidly changing business environment. This will also reduce the layoffs in adverse time and improve the overall efficiency of the organization by reducing cost of recruitment and retraining by retaining the existing employees.
References [1] Yukl, G. (1989). Managerial leadership: A review of theory and research. Journal of Management, 15(2), 251–289. [2] Womack, James P. & Jones, Daniel T (2010): Lean Thinking, Second edition. Simon & Schuster.

IMR (Indira Management Review)
Volume XI, Issue II, December 2017
Importance of Soft Skills for MBA Students: An Overview
Ruchita Ramani Assistant Professor, ASM IPS, Pune
Abstract: In today’s scenario soft skills are the need of the hour. This article will throw light on the concept of soft skills and its importance in the life of a student.
This article will cover all the major soft skills which are highly essential for all MBA students. Both, hard and soft skills should be blended together for grooming the students and improving the employability of students.
If both soft skills and hard skills are blended together, outcome will be an extraordinary professional and an excellent human being.
In this article, we will also discuss about the importance of soft skills in student’s career, various ways to acquire these soft skills and the role of management institutes, lecturers in helping the students acquire these skills.
Introduction In today’s competitive world when employers come to management institutes for campus recruitment for placement of fresh MBAs (without experience), they either reject them or offer them jobs with very low compensation due to lack of soft skills or they are unemployable.
The institutes focus on hard skills i.e. the technical knowledge and education, soft skills are being ignored due to which the students are far behind in soft skills and etiquette training.
The most predominant soft skills which are highly ignored are excellent communication skills, English linguistic abilities and presentation skills.
To be most competent, one needs to be skilled in hard skills as well as soft skills.
Definition of Soft Skills ‘Wikipedia’ gives definition of soft skills as ‘soft skills refers to the cluster of personality traits, social graces and facility with language, personal habits, friendliness and optimism that mark people to varying degrees. Soft skills complement hard skills which are the technical requirement of a job.
(Wikipedia 2007)
Soft skills are a combination of multiple skills. It includes:
Excellent communication skills.
English linguistic abilities.

108 Ramani
IMR (Indira Management Review) Volume XI, Issue II, December 2017
Good presentation skills.
Optimistic attitude.
Fine etiquette training.
Good body language.
Exceptional team handling capabilities.
Confidence.
Time management.
Flexible approach.
Perfect grooming.
Motivational skills.
Efficient decision making.
Punctuality quality.
Adaptability towards changes.
Honest approach.
Hygiene factors.
Leadership skills.
Moral values and ethics.
Good code of conduct.
Integrity.
Loyalty.
Curiosity in learning new things.
Willingness to learn.
Enthusiastic.
Good listening skills.
Good analytical skills.
Creativity
Problem solving abilities.

Importance of Soft Skills for MBA Students: An Overview 109
Volume XI, Issue II, December 2017 IMR (Indira Management Review)
Good interpersonal skills.
Knowledge of automation.
Excellent command over languages.
Significance of Soft Skills These days, competition is too tough. In job market, jobs are few and the job seekers are too many. As per Charles Darwin’s Theory of Survival – “Survival of the fittest” is applicable.
Only the skilled people, both in hard skills and soft skills are able to survive the cut throat competition. Those who lack soft skills are left unemployed, or are unemployable.
Role of Management Institute, Lecturer in Development of Soft Skills Soft skills should be included as a part of the curriculum.
Lectures should be a combination of both hard skills and soft skills.
Communication in English should be emphasized and should be made mandatory for both faculties and students in Institute premises in order to improve their speaking skills thereby leading to better listening and understanding abilities. Also, to make them excellent in their communication and increase their confidence level.
English linguistic abilities should be made a part of their curriculum with a special focus on building vocabulary of students.
Body language training should be imparted to the students.
Group discussions, personal interviews and case studies should be regularly taken to enhance their presentation skills and to increase their confidence.
News reading should be made compulsory for students to keep students updated about the current affairs.
Every week, mentors should conduct a workshop on current affairs to make the students competitive and updated with a quiz to understand was the topic clear to the students has to be prepared by the faculty or mentor.
Compulsory book reading should be given as assignment to all students and students should be asked to give review of the book.
All students should be given different books so that no assignments are copied, they read them and formulate the reviews and a final workshop should be conducted where students will discuss the book–learnings from the book in a summarized way.
110 Ramani
IMR (Indira Management Review) Volume XI, Issue II, December 2017
Faculty should do the SWOT analysis of students. They should guide the students to work on their weak areas and focus on their strengths.
Etiquette Training Workshop should be introduced for the students to make them more polished.
Excellent grooming of students should be done to make them more polished in their behavior, so that they are more adaptable in corporate companies with the corporate culture.
Conclusion The observational study indicates that management institutes and education plays a very vital role in synergizing industry efforts.
Management institutes can groom the students well, so that they are highly employable and become an excellent professional.
The institutes should be rethinking on their current approach and modify the entire curriculum to work in the interest of students who are the future managers and to develop highly skilled and efficient management professionals with excellent communication skills, outstanding presentation skills thereby meeting and synergizing with industry’s expectations.
Reference [1] http://:www.wikipedia.com/softskill

IMR (Indira Management Review)
Volume XI, Issue II, December 2017
Author Index
Ahire, Sanjay, 25 Ashturkar, Prashant B., 32
Bhattacharya, Subir, 88
Chinchorkar, Satish Shrikrishna, 67
Deshpande, Suvarna Mohan, 51
Hiremath, Saroj, 97
Limaye, Sudeep, 67
Mahajan, Yogesh D., 59
Nerlekar, Shriram S., 17
Padle, Anand D., 103 Pujar, Rajlaxmi Pramod, 51
Ramani, Ruchita, 107 Rao, Geeta Kalyankar, 9
Sarkale, Sandeep L., 32 Shaikh, Mohsin, 9 Singh, Sanjit, 76 Sonaje, Vijay Hemant, 17
Ubale, Satish S., 103
Yeole, Swati M., 40

Guidelines for Authors
Research Papers
Indira Management Review (IMR), is a blind fold peer-reviewed research journal published bi-annually. IMR is committed to publishing scholarly empirical and theoretical research papers that have a high impact on the management field as a whole. IMR encourages new ideas & new perspectives on existing research. Manuscripts that are suitable for publication in IMR cover domains such as business strategy and policy, IT sourcing, entrepreneurship, human resource management, financial management, organizational behavior, organizational theory, marketing and research. IMR encourages papers with Indian context, more so if they examine issues with reference to India’s place in the bigger international picture. Research Papers are put through the blind/peer review process and plagiarism check before being accepted.
Authors are requested to note the following while forwarding written material for publication:
1. The research paper should be sufficiently brief in length (approx. 5000 words or 10–12 pages) without sacrificing content, in MS word format in Aerial font size 12, typed in 1.5 line spacing. Graphs & tables should be in the body of the text & not separate.
2. The research paper should carry a brief abstract not exceeding 100 words profiling the nature of work to follow.
3. Bibliography needs to be structured in the APA format.
4. A duly filled, signed & scanned copy of declaration form should accompany the research paper, signed by the author/s (Refer below Annexure I)
5. Plagiarism by authors submitting research papers/ articles/book review to IMR for publication is viewed seriously. Whenever use of material from other sources without appropriate acknowledgement/permission is noticed, the author/s of such contribution/s will be liable to be black listed at IMR, apart from other actions that may be initiated by concerned authorities. It is therefore, earnestly requested that such practices be scrupulously avoided.
6. The Soft copy of the research paper/article/book review along with the scanned copy of declaration form should be e-mailed to [email protected]
7. Research paper/article/book review approved by the review panel will be taken up for publication, & the date of publication will depend upon the editorial constraint of time & space. The journal will not enter into correspondence with authors regarding date of publication. Authors are requested not to remind us regarding the same. We shall convey to the author the fate of their article when the review process is completed & the decision reviewed from the reviewer–be it acceptance, rejection or a recommendation for effecting modifications/ additions, deletions from the text, for compliance by the author.
8. It is understood that a research paper submitted to IMR for publication & pending consideration will only be withdrawn in writing if it is proposed to be published elsewhere.
9. The mailing of research papers for publication to IMR signifies acceptance of the editors decision regarding acceptance or otherwise of a contribution to be final & binding.

Guidelines for Authors
Book Review
We invite academicians and authors from industry to write reviews of books on business management allied subjects.
The book-reviewers are requested to follow the guidelines given below:
1. The reviewer should begin with a listing of the bibliographical details of the book comprising the name (s) of the author (s), full title and sub-title of the book (as they appear on the cover), details of the place and name of the publisher, year of publication, number of pages in the book, whether hardbound or paperback, and the price, if mentioned.
2. The review can range from 1000 to 3000 words, depending on the topic and the importance of the book.
3. The review should engage with the theme of the book and the issues and problems raised, and should make a rigorous attempt to identify and assess the main arguments put forth by the author.
4. The review should be written in a manner and style that would qualify it as a short article in its own right.
5. The reviewer should provide a confirmation that this review has not been sent for publication elsewhere and that the author will cede the copyright, if it is accepted for publication in Indira Management Review (IMR)
6. The book under review should have been published recently, preferably in the current or the previous year, and be preferably the new release.
7. The reviewer should also comment on the stylistic aspect and literary presentation of the book.
8. Bibliographical references should be avoided. If the references are considered essential, then citation style adopted by Indira Management Review (IMR) should be followed.
Thus, the review should be an objective assessment of the book, indicating its specific strengths and weaknesses, and an overall assessment by the reviewer.
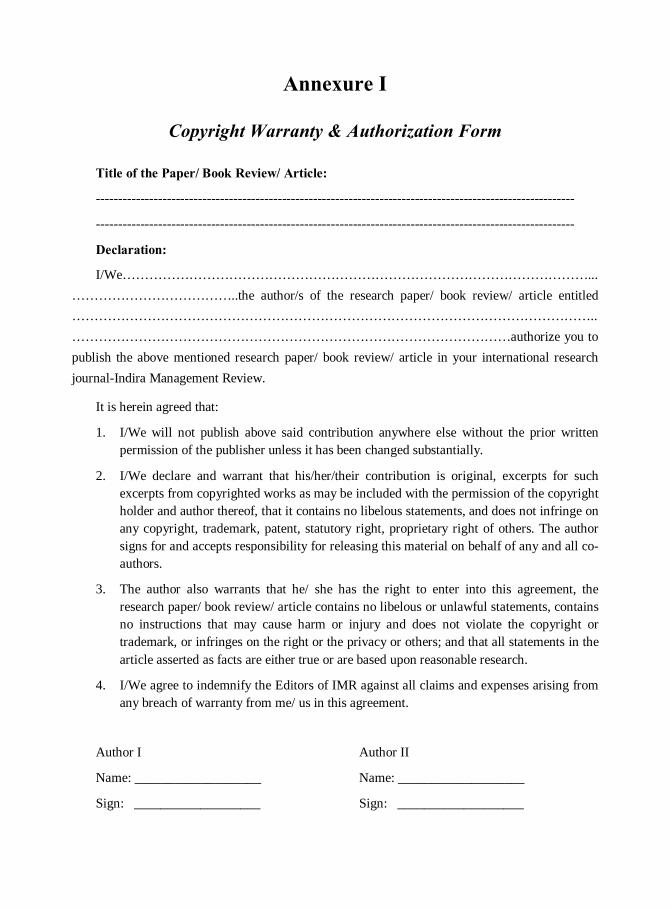
Annexure I
Copyright Warranty & Authorization Form
Title of the Paper/ Book Review/ Article:
------------------------------------------------------------------------------------------------------------
------------------------------------------------------------------------------------------------------------
Declaration:
I/We……………………………………………………………………………………………...
………………………………..the author/s of the research paper/ book review/ article entitled
………………………………………………………………………………………………………..
………………………………………………………………………………………authorize you to
publish the above mentioned research paper/ book review/ article in your international research
journal-Indira Management Review.
It is herein agreed that:
1. I/We will not publish above said contribution anywhere else without the prior written permission of the publisher unless it has been changed substantially.
2. I/We declare and warrant that his/her/their contribution is original, excerpts for such excerpts from copyrighted works as may be included with the permission of the copyright holder and author thereof, that it contains no libelous statements, and does not infringe on any copyright, trademark, patent, statutory right, proprietary right of others. The author signs for and accepts responsibility for releasing this material on behalf of any and all co-authors.
3. The author also warrants that he/ she has the right to enter into this agreement, the research paper/ book review/ article contains no libelous or unlawful statements, contains no instructions that may cause harm or injury and does not violate the copyright or trademark, or infringes on the right or the privacy or others; and that all statements in the article asserted as facts are either true or are based upon reasonable research.
4. I/We agree to indemnify the Editors of IMR against all claims and expenses arising from any breach of warranty from me/ us in this agreement.
Author I Author II
Name: ___________________ Name: ___________________
Sign: ___________________ Sign: ___________________

Personal Details of the Author/s
Author I
Name:
_________________________________
Designation:
_________________________________
Place of Work:
_________________________________
Address:
_________________________________
E-mail id:
_________________________________
Mobile:
_________________________________
Date:
_________________________________
Location:
_________________________________
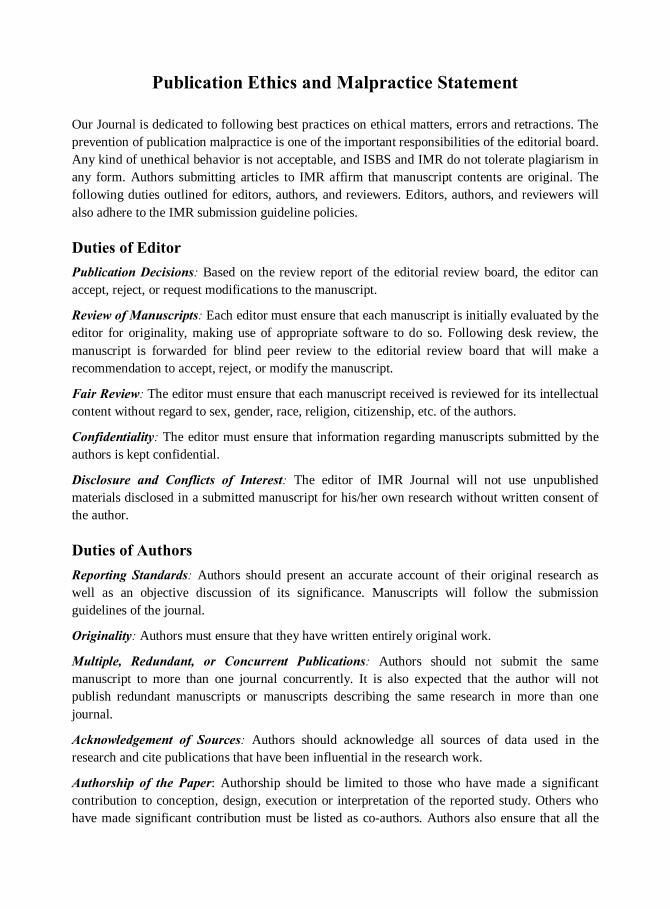
Publication Ethics and Malpractice Statement
Our Journal is dedicated to following best practices on ethical matters, errors and retractions. The prevention of publication malpractice is one of the important responsibilities of the editorial board. Any kind of unethical behavior is not acceptable, and ISBS and IMR do not tolerate plagiarism in any form. Authors submitting articles to IMR affirm that manuscript contents are original. The following duties outlined for editors, authors, and reviewers. Editors, authors, and reviewers will also adhere to the IMR submission guideline policies.
Duties of Editor Publication Decisions: Based on the review report of the editorial review board, the editor can accept, reject, or request modifications to the manuscript.
Review of Manuscripts: Each editor must ensure that each manuscript is initially evaluated by the editor for originality, making use of appropriate software to do so. Following desk review, the manuscript is forwarded for blind peer review to the editorial review board that will make a recommendation to accept, reject, or modify the manuscript.
Fair Review: The editor must ensure that each manuscript received is reviewed for its intellectual content without regard to sex, gender, race, religion, citizenship, etc. of the authors.
Confidentiality: The editor must ensure that information regarding manuscripts submitted by the authors is kept confidential.
Disclosure and Conflicts of Interest: The editor of IMR Journal will not use unpublished materials disclosed in a submitted manuscript for his/her own research without written consent of the author.
Duties of Authors Reporting Standards: Authors should present an accurate account of their original research as well as an objective discussion of its significance. Manuscripts will follow the submission guidelines of the journal.
Originality: Authors must ensure that they have written entirely original work.
Multiple, Redundant, or Concurrent Publications: Authors should not submit the same manuscript to more than one journal concurrently. It is also expected that the author will not publish redundant manuscripts or manuscripts describing the same research in more than one journal.
Acknowledgement of Sources: Authors should acknowledge all sources of data used in the research and cite publications that have been influential in the research work.
Authorship of the Paper: Authorship should be limited to those who have made a significant contribution to conception, design, execution or interpretation of the reported study. Others who have made significant contribution must be listed as co-authors. Authors also ensure that all the

Publication Ethics and Malpractice Statement 117
IMR (Indira Management Review) Volume XI, Issue II, December, 2017
authors have seen and agreed to the submitted version of the manuscript and their inclusion of names as co-authors.
Data Access and Retention: Authors should provide raw data related to their manuscript for editorial review and must retain such data.
Fundamental Errors in Published Works: If at any point of time, the author (s) discovers a significant error or inaccuracy in submitted manuscript, then the error or inaccuracy must be reported to the editor.
Duties of Reviewers Confidentiality: Information regarding manuscripts submitted by authors should be kept confidential and be treated as privileged information.
Acknowledgement of Sources: Manuscript reviewers must ensure that authors have acknowledged all sources of data used in the research. Any kind of similarity or overlap between the manuscripts under consideration or with any other published paper of which reviewer has personal knowledge must be immediately brought to the editor's notice.
Standards of Objectivity: Review of submitted manuscripts must be done objectively and the reviewers should express their views clearly with supporting arguments.
Promptness: In the event that a reviewer feels it is not possible for him/her to complete review of manuscript within stipulated time then this information must be communicated to the editor, so that the manuscript could be sent to another reviewer.

Indira Management Review
Subscription Order Form
Name of the Subscriber:
Dr./ Prof./ Mr./ Ms.: …………………………………………………..............................................................................
(Institution: If subscribing in the name of the organization)
………………………………………………………………………………………..........………
………………………………………………………………………………………..........………
(Mention Specific department if necessary) …………………………………………..…………..
Mailing Address:
Name Designation/Department :
Address :
Phone :
E-mail ID :
Period of Subscription : 1 Yr/ 2 Yrs/ 3Yrs Subscription : 1 year INR 400
(Tick Appropriately) : 2 year INR 700
: 3 year INR 1000
Enclosed is Demand Draft Number: ………………………………… dated ……………………
Favouring Shree Chanakya Education Society, For INR 400/ 700/ 1000 drawn on (name of Bank)………………………………. Payable at Pune towards the subscription for 1Yr/ 2 Yrs/ 3Yrs. (No cheques/ postal order/ money orders please)
Date: _________________ Authorized Signature: _________________
Please mail the above form together with the Demand Draft for the appropriate amount
To: The Editor, Indira Management Review Indira School of Business Studies Abhinavan, 89/2 A, New Pune–Mumbai Highway Tathawade, Pune–411033, India
Indira Management Review
Feedback Form
Please take few minutes to complete the form and mail it to The Editor, Indira Management Review, Indira School of Business Studies, Abhinavan, 89/2 A, New Pune–Mumbai Highway, Tathawade, Pune, India–411033 (INDIA). You can also e-mail it to [email protected] This will help in keeping us clued to needs of industry and academia.
Please tick the appropriate choice. If your choice is (iii) please mention details
Layout:
i. Good ii. Satisfactory iii. Can be improved
(iii) ------------------------------------------------------------------------------------------------------
------------------------------------------------------------------------------------------------------------
Content:
i. Good ii. Satisfactory iii. Can be improved
(iii) ------------------------------------------------------------------------------------------------------
------------------------------------------------------------------------------------------------------------
Quality of Articles:
i. Good ii. Satisfactory iii. Can be improved
(iii) ------------------------------------------------------------------------------------------------------
------------------------------------------------------------------------------------------------------------
What are the subjects on which you would like IMR to feature articles? Please specify.
------------------------------------------------------------------------------------------------------------
------------------------------------------------------------------------------------------------------------
We would welcome quality articles of value to industry and academia such as research or academic papers/ case studies/articles/ book reviews etc. for IMR. For Details see our guidelines to the authors.
Would you like to write for IMR? Yes If so, your choice of subject: ………………….
Also mention name/s of journals in which you have published your work:
Your Name: Institute:
Address: Email Id:
Designation: Date:
Signature: