individual risk perception and flood mitigation: an
TRANSCRIPT
Individual Risk Perception and Flood Mitigation:
An Empirical Study of Protective Actions in Australia
Marvin Shigueiti Uehara
BA, MPA
A thesis submitted for the degree of Doctor of Philosophy at
The University of Queensland in 2017
School of Political Science and International Studies
2
Abstract
The Australian government has increasingly expected that individuals collaborate with public
efforts to reduce hazard risks by taking some action themselves. This expectation, however,
has failed to consider the complexity of the decision-making process at the household level.
Individual decision making is rather complex as it involves a wide range of factors that should
be taken into account before the government can assess to what extent individuals at risk
can effectively contribute to the reduction of hazard risks. This is where a theoretical
framework makes a contribution to this thesis by guiding data collection and analysis. Thus
this thesis resorts to a comprehensive socio-psychological theory to generate empirical data
on the different factors affecting decision making under uncertainty.
The testing of this comprehensive theoretical framework called Protection Motivation
Theory focuses on the explanatory variables of risk perception (‘threat appraisal’) and coping
measures (‘coping appraisal’). Threat appraisal factors have to do with the perception of
hazard risks and coping appraisal variables measure the perceived ability of an individual to
take action. The novelties of this study are i) the application of this theoretical framework,
which has already been tested in order countries, for the first time in Australia, more
specifically among householders living in flood-prone locations in Southeast Queensland; ii)
a dataset featuring significant variability in terms of vulnerability and exposure levels of the
population at risk; iii) the assessment of how heuristics and biases affect decision making
under uncertainty; and iv) qualitative data to unpack non-intuitive associations and
understand the role that the nature of threats and protective actions play in the decisions of
householders to take protective actions.
An interesting finding from previous studies is that coping factors are better
predictors for protective actions than risk perception. This thesis then will verify whether this
association is also observed in the Australian context. However, emerging from this study,
is the argument that individuals at risk living in this region make decisions which do factor in
their hazard risk perceptions and their perceived capacity to take action; however, this
decision-making process also take into account the vulnerability conditions of the population
at risk. Also, qualitative data suggest that exposure to hazard risks shaped by the nature of
the threat and the characteristics of the protective action also play a role in the decision of
householders to take preventive measures that reduce or eliminate flood damage. The
findings on how these conditions and circumstances influence decisions made under
uncertain scenarios are the main contribution of this thesis to the literature.

3
This contribution, however, is not only relevant within the academic community. If
Australian authorities are to enhance the resilience of communities at risk to potential
damage caused by hazards, it needs first to have a better sense of how it can motivate these
at-risk individuals to take specific actions and what constraints these individuals face to make
these decisions. Understanding these challenges in order to gradually reduce the level of
vulnerability among communities mostly at risk is a worthwhile starting-point. The provision
of information and analysis on what motivates and challenges these individuals to take action
is the main objective of this thesis. The expectation is that findings from this study will make
officials revisit their past decisions and readjust their assessments and expectations towards
individuals taking protective actions.

4
Declaration by Author
This thesis is composed of my original work, and contains no material previously published
or written by another person except where due reference has been made in the text. I
have clearly stated the contribution by others to jointly-authored works that I have included
in my thesis.
I have clearly stated the contribution of others to my thesis as a whole, including statistical
assistance, survey design, data analysis, significant technical procedures, professional
editorial advice, financial support and any other original research work used or reported in
my thesis. The content of my thesis is the result of work I have carried out since the
commencement of my higher degree by research candidature and does not include a
substantial part of work that has been submitted to qualify for the award of any other
degree or diploma in any university or other tertiary institution. I have clearly stated which
parts of my thesis, if any, have been submitted to qualify for another award.
I acknowledge that an electronic copy of my thesis must be lodged with the University
Library and, subject to the policy and procedures of The University of Queensland, the
thesis be made available for research and study in accordance with the Copyright Act
1968 unless a period of embargo has been approved by the Dean of the Graduate School.
I acknowledge that copyright of all material contained in my thesis resides with the
copyright holder(s) of that material. Where appropriate I have obtained copyright
permission from the copyright holder to reproduce material in this thesis and have sought
permission from co-authors for any jointly authored works included in the thesis.

5
Publications during candidature
‘No publications’
Publications included in this thesis
‘No publications included’

6
Contributions by others to the thesis
Dr. Alan Huang (University of Queensland), who helped me with statistical analysis
Statement of parts of the thesis submitted to qualify for the award of another degree
‘None’
Research Involving Human or Animal Subjects
The Chair of Research Committee at the School of Political Science and International
Studies, Prof. Christian Reus-Smit, approved the application for ethical clearance of this
research project.
7
Acknowledgements
I would like to thank the following people and organization for their vital contributions:
My supervisors:
Dr. Alastair Stark (University of Queensland), who helped me with thesis structure and
writing.
Professor W. J. Wouter Botzen (Vrije Universiteit, Amsterdam), who helped me with survey
design, theoretical framework, research questions, statistical analysis, originality and key
findings.
Dr. Simon Blomberg (University of Queensland), who helped me with statistical analysis.
and others:
The participants of this study (for filling out and mailing back surveys)
Yeronga Community Centre (for supporting survey development and testing)

8
Financial Support
This research was supported by:
University of Queensland (UQ) International Scholarship
The School of Political Science and International Studies’ PhD Priority Top-up Scholarship
(UQ)
The Graduate School International Travel Award (UQ)
9
Keywords
decision making, uncertainty, complexity, risk perception, regression, disaster
management, flood, australia, public policy, protection motivation theory.
Australian and New Zealand Standard Research Classifications (ANZSRC)
ANZSRC code: 170202, Decision Making, 60%
ANZSRC code: 010401, Applied Statistics, 20%
ANZSRC code: 160510, Public Policy, 20%
Fields of Research (FoR) Classification
FoR code: 1702, Cognitive Sciences, 60%
FoR code: 0104, Statistics, 20%
FoR code: 1605, Policy and Administration, 20%
10
Table of Contents
Abstract ............................................................................................................................................... 2
Declaration by Author ....................................................................................................................... 4
Publications during candidature ...................................................................................................... 5
Publications included in this thesis ................................................................................................. 5
Contributions by others to the thesis .............................................................................................. 6
Statement of parts of the thesis submitted to qualify for the award of another degree.......... 6
Research involving human and animal subjects .......................................................................... 6
Acknowledgments ............................................................................................................................. 7
Financial Support............................................................................................................................... 8
Keywords ............................................................................................................................................ 9
Australian and New Zealand Standard Research Classifications (ANZSRC) ......................... 9
Fields of Research (FoR) Classification ........................................................................................ 9
Table of Contents ............................................................................................................................ 10
Figures .............................................................................................................................................. 14
Tables ................................................................................................................................................ 15
Abbreviations .................................................................................................................................. 15
Chapter 1: Introduction ............................................................................................................... 17
Introduction ....................................................................................................................................... 17
Risk Perception and Decision Making ......................................................................................... 18
Shared Responsibility between Government and Individuals .................................................. 20
Scope and Application of Decision Making under Uncertainty ................................................ 22
Method and Case Study ................................................................................................................. 22
Structure of the Thesis ................................................................................................................... 24
Conclusion ........................................................................................................................................ 25
Chapter 2: Risk Mitigation and Flood Management in Australia ...................................... 27
Introduction ....................................................................................................................................... 27
Risk Mitigation .................................................................................................................................. 28
The Governance and Justifications of Risk Mitigation .............................................................. 28
The Traditional Understanding of Risk Mitigation ...................................................................... 29
The Challenges and Measurements of Risk Mitigation at the Community Level .................. 30
The Politics of Risk Mitigation ....................................................................................................... 31
11
The Role of Insurance in Risk Mitigation ..................................................................................... 32
A More Contemporary Approach to Risk Mitigation .................................................................. 33
Vulnerability and Risk Mitigation ................................................................................................... 34
Multi-level Floodplain Management in Australia ......................................................................... 35
Federal Level ................................................................................................................................... 36
Overview of Flood Risks in Australia ............................................................................................ 37
The Development of Floodplain Management Strategies in Australia .................................... 37
The Definition of Key Terms to Flooplain Management in Australia ....................................... 38
Land Use Planning in Floodplains in Australia ........................................................................... 39
The Definition of Vulnerability in the Context of Land Use Planning ...................................... 39
Federal Strategies to Reduce Flood Risks in Australia ............................................................. 40
Security Industry in Australia and the Challenge of Building Resilient Communities ........... 41
The Relations between Shared Responsibility and Resilience at the Federal Level ........... 42
Criticism to Current Resilient Strategies ...................................................................................... 42
State Level ........................................................................................................................................ 45
Review of Hazard Risks and the State's Approach to Reducing these Risks ...................... 45
The Role of State Government in the Large Scheme of Disaster Management ................... 46
The Recommendations of QFCI to State's Authorities ............................................................. 46
Property Buy-Back Program .......................................................................................................... 47
Reinsurance of Public Infrastructure ............................................................................................ 47
Inter-Departmental Disagreements .............................................................................................. 47
Climate Uncertainty ......................................................................................................................... 48
The Increasing Cost of Premiums and Flood Mitigation ........................................................... 48
The Role of Individual Risk Perception in Informing Policy Making in Queensland ............. 49
Council Level .................................................................................................................................... 49
The History of Flooding in Brisbane ............................................................................................. 50
Before and After the 2011 Major Flood Event ............................................................................ 50
Council's Strategies to Reduce Flood Risks ............................................................................... 51
The Criticisms of QFCI to Local Flood Risk Reduction Strategies .......................................... 51
Conclusion ........................................................................................................................................ 53
Chapter 3: Risk Perception and Decision Making under Uncertainty ............................ 55
Introduction ....................................................................................................................................... 55
Risk Perception Variables .............................................................................................................. 55
12
General Relationships between Risk Perception and Protective Action ................................ 55
The Growing Complexity of Measuring Risk Perception........................................................... 56
Risk Perception in the Context of Floodplain Management ..................................................... 56
Measuring Risk Perception with Socio-Economic Indicators ................................................... 57
Measuring Risk Perception with Cognitive and Subjective Variables ..................................... 59
Additional Variables Used to Measure Risk Perception ............................................................ 60
The Development of the Protection Motivation Theory ............................................................. 60
The Challenges of Measuring Risk Perception .......................................................................... 61
Initial Discussion on Measuring Risk Perception ....................................................................... 61
Risk Perception Shifts over Time .................................................................................................. 62
Bounded Rationality ........................................................................................................................ 62
Cognitive Biases .............................................................................................................................. 63
Differences between Fear-related and Knowledge-related Factors ........................................ 63
The Complexity of Measuring Individual Risk Perception ........................................................ 64
Decision Making under Uncertainty .............................................................................................. 64
Optimization Models in Decision Making ..................................................................................... 65
Ecological Rationality in Decision Making ................................................................................... 68
Conclusion ........................................................................................................................................ 71
Chapter 4: Protection Motivation Theory ............................................................................... 72
Introduction ....................................................................................................................................... 72
Protection Motivation Theory in Public Health ............................................................................ 72
Protection Motivation Theory in Crisis Management ................................................................. 74
Correlation Hypotheses .................................................................................................................. 86
Conclusion ........................................................................................................................................ 90
Chapter 5: Method......................................................................................................................... 92
Introduction ....................................................................................................................................... 92
The Research Setting ..................................................................................................................... 92
The Development of Questionnaire and the Pilot Study ........................................................... 93
Multi-Method Qualitative Method .................................................................................................. 97
Ethical Considerations .................................................................................................................... 98
The Reliability of Results ................................................................................................................ 99
Regression Analysis ..................................................................................................................... 103
Model Selection ............................................................................................................................. 106

13
Definitions and Descriptive Statistics of Variables ................................................................... 108
Dependent Variables .................................................................................................................... 108
Descriptive Statistics of Dependent Variables .......................................................................... 108
Independent Variables .................................................................................................................. 109
Descriptive Statistics of Independent Variables ....................................................................... 110
Threat Appraisal ............................................................................................................................ 110
Perceptual Risks ............................................................................................................................ 110
Objective Risks .............................................................................................................................. 110
Maladaptive Responses ............................................................................................................... 110
Flood Experience........................................................................................................................... 111
Coping Appraisal ........................................................................................................................... 111
Demographics ................................................................................................................................ 111
Household Characteristics ........................................................................................................... 111
Key Messages from Descriptive Statistics ................................................................................ 112
Conclusion ...................................................................................................................................... 113
Chapter 6: Home Improvements and House Raising ........................................................ 119
Introduction ..................................................................................................................................... 119
Home Improvements..................................................................................................................... 120
Empirical Studies on Home Improvements ............................................................................... 125
Conclusion ...................................................................................................................................... 129
House Raising ................................................................................................................................ 131
Empirical Studies on House Raising .......................................................................................... 135
Conclusion ...................................................................................................................................... 138
Chapter 7: Flood Insurance and Relocation ........................................................................ 139
Introduction ..................................................................................................................................... 139
Flood Insurance ............................................................................................................................. 140
Empirical Studies on Flood Insurance ....................................................................................... 143
Conclusion ...................................................................................................................................... 152
Relocation ....................................................................................................................................... 153
Previous Studies on Relocation .................................................................................................. 160
Conclusion ...................................................................................................................................... 164
Conclusion of the Last Two Chapters ........................................................................................ 165
Final Remarks .............................................................................................................................. 167
14
Introduction ..................................................................................................................................... 167
Individual Risk Perception in Flood Mitigation Strategies in Australia .................................. 168
Measuring Risk Perception and Decision Making .................................................................... 169
The Protection Motivation Theory ............................................................................................... 171
Explanatory Variables from Regression Analysis .................................................................... 173
Threat Appraisal ............................................................................................................................ 173
Coping Appraisal ........................................................................................................................... 175
Demographics and Household Characteristics ........................................................................ 176
Conclusion ...................................................................................................................................... 177
Bibliography ................................................................................................................................. 181
Appendices ................................................................................................................................... 194
Questionnaire ................................................................................................................................. 194
Ethics Approval Letter................................................................................................................... 209
Comparative Explanatory Factors of Flood Studies Testing PMT
.......................................................................................................................................................... 210
Cross-Correlation between the Cost of Insurance and Cost Benefit Analysis
.......................................................................................................................................................... 211
Figures
Figure 1 Disaster Management Framework in Australia .......................................................... 36
Figure 2 Interrelationships among Environmental Hazards, Households, Social Context,
and Hazard Adjustments
............................................................................................................................................................ 75
Figure 3 Explanatory Factors for Precautionary Damage Prevention by Residents in Flood-
Prone Areas
............................................................................................................................................................ 76
Figure 4 Unmediated Model Predicting Subjective Experiences, Appraisals, and Coping
Responses
............................................................................................................................................................ 78
Figure 5 Mediated Model Predicting Coping Responses
............................................................................................................................................................ 78
Figure 6 Flow Chart of the Logistic Regression Analyses Applied by Bubeck et al. 2013
............................................................................................................................................................ 79
Figure 7 Extended PMT Framework used by Poussin et al. 2014
............................................................................................................................................................ 81

15
Figure 8 Model of Starominski-Uehara ........................................................................................ 87
Figure 9 Flood Maps ....................................................................................................................... 95
Tables
Table 1 Explanatory Variable Included in the Model of Bubeck et al. 2013
............................................................................................................................................................ 80
Table 2 Significant Variables and p-values of the Model of Bubeck et al. 2013
............................................................................................................................................................ 80
Table 3 Description of Correlation Hypotheses .......................................................................... 88
Table 4 Comparative Survey Return Rates with Previous Studies ....................................... 100
Table 5 Comparative Socio-Economic Indicators between Sample and Region ................ 101
Table 6 Surveys Delivered and Returned, Returned Rate, and Suburb Income ................ 102
Table 7 Definition of Dependent Variables ................................................................................ 108
Table 8 Definition of Independent Variables ............................................................................. 114
Table 9 Descriptive Statistics of Independent Variables ......................................................... 115
Table 10 Model of Home Improvements ................................................................................... 121
Table 11 Home Improvements: Comparative Results with Previous Studies ..................... 128
Table 12 Home Improvements: Comparative Hazard Risks with Previous Studies ........... 129
Table 13 Model of House Raising .............................................................................................. 132
Table 14 Model of Flood Insurance ............................................................................................ 141
Table 15 Model of Relocation ...................................................................................................... 154
Abbreviations
ACSP: Australian Council of Security Professionals
AEP: Annual Exceedance Probability
BCC: Brisbane City Council
COAG: Council of Australian Governments
DCS: Department of Community Safety
DLGP: Department of Local Government and Planning
FEMA: Federal Emergency Management Agency
NDRP: National Disaster Resilient Program

16
NPA: National Partnerships Agreement
NSDR: National Strategy for Disaster Resilience
PMT: Protection Motivation Theory
QFCI: Queensland Floods Commission of Inquiry
RNSA: Research Network for a Secure Australia

17
Chapter 1: Introduction
Introduction
This chapter provides an overview of this thesis. It first situates individual risk perceptions in
the context of decision making theory because the fundamental purpose of this thesis is to
investigate the intricacies of the relationship between risk perception and decision making
among individuals living in floodplain areas in Australia. The chapter then introduces the
concept of shared responsibility to contextualize the study of householder risk perceptions
within Australian flood management policy and to justify its practical relevance to that policy
agenda. This relevance is based primarily on the contemporary understanding that
governments now expect individuals to take more responsibility for reducing the residual
risks presented by low-probability high-impact disasters. As a consequence, policymakers
need to better understand how individuals view those risks and how they do and do not
respond to them. For this reason, this thesis delivers a socio-psychological examination of
individual risk perceptions and decision making using Protection Motivation Theory (PMT).
Academic novelty emerges from the application of PMT for the first time in an Australian
context. Although the PMT model has been applied in other flood-prone areas and nations,
this is the first study that investigates the decisions of Australian residents, living in flood-
prone areas, to take protective actions. Also, this is a novel study because its model, in
comparison with previous ones, i) features the different levels of flood risks threatening this
region, ii) provides statements conveying the types of heuristics and biases that might occur
during decision-making processes and iii) includes different types of and information rate on
the exposure and vulnerability levels of the targeted population. Finally, this study
differentiates from previous models since it collects field data and qualitative comments that
provides nuances of significant associations.
The chapter goes on to present the method and the case study that have been
employed, the structure of the thesis chapters and it concludes with a summary of the main
argument and its contribution to the study of decision making and risk perception. This thesis
argues that policymakers need to better understand how a range of specific conditions and
circumstances affect individual decisions. Conditions relate to perceived hazard risks,
perceived capacity to take action and vulnerability factors (as indicated by regression
analysis). The circumstances that affect household decision-making are the risk exposure
levels of communities, the nature of a threat and the nature of the protective action itself (as
18
suggested by qualitative data). This is an important finding as it suggests that in the
Australian context the individual’s capacity to take protective actions is not necessarily the
main predictor, which is what findings from research conducted in other locations currently
suggests. More generally, this thesis reinforces the importance of investigating to what
extent vulnerability factors can influence decision making among householders living in
flood-prone areas.
Risk Perception and Decision Making
Risk reduction strategies represent a collaborative effort between the government and the
population at risk. However, this collaboration, from a household perspective, can be
influenced by a number of perceptions that need to be considered by policymakers. These
perspectives range from fatalistic predictions that no one can actually do anything to reduce
the risks of major disasters to simplistic views that every aspect of risk reduction can be
delivered either by government or the individuals at risk. Within these two poles, nuanced
understandings about risk reduction are more likely because populations at risk feature
different levels of exposure and vulnerability to threats. However, Lindell and Perry (2000)
argue that investigating how we perceive risk and our capacity to reduce these risks are
important factors shaping decision making. Thus crisis and risk management researchers
(see Bubeck et al. 2013; Floyd et al. 2000; Grothmann and Reusswig 2006; Lindell and
Hwang 2008) have been investigating the factors that determine decision making through
risk perception. These pieces of research vary in terms of the variables used to explain the
decision-making process to take protective actions against disaster risks. For instance, some
authors have focused on understanding how education programs enhance risk perceptions.
The assumption here is that more information about a certain threat promotes behaviour
change by increasing awareness, which in turn results in protective actions (Beatson and
McLennan 2011; Mileti and Peek-Gottschlich 2001; Paton 2003; Shiwaku and Shaw 2008).
Other researchers, however, argue that as important, or even more important than raising
awareness, is an understanding of the capacity of individuals at risk to take action.
Researchers that begin with this premise have resorted to theories such as PMT to evaluate
the importance of coping appraisals in explaining protective behaviour compared with other
variables such as risk perception, disaster experience, perceived responsibility, social
networks, and emotions. The outcome that emerges from these studies is a view that coping
factors1 are stronger predictors of protective action than risk perception (Bubeck et al. 2013;
1 Coping factors are the variables related to individual perceptions about how one believes they can ‘cope with and avert the threatened danger’ (Floyd et al. 2000:411).
19
Floyd et al. 2000; Grothmann and Reusswig 2006; Lindell and Hwang 2008). A third line of
investigation focuses particularly on the challenges that vulnerability and exposure2 factors
exert in the perception of risks and decision-making processes. These authors posit that
exposure levels, and more importantly vulnerability issues, significantly influence the
undertaking of protective actions among individuals at risk (Haque and Burton 2005;
Olofsson and Öhman 2015; Tierney 2006; Wisner et al. 2004). Thus vulnerability, a central
concept in this project, follows the definition of Berry (2002): a pre-existing condition or state
defined by a set of negative attributes that cause people or communities’ susceptibility to
loss.
This thesis contributes to this debate by arguing that there is not a single set of
variables that can equally predict different types of protective actions under different
conditions and circumstances. Instead, the investigation of decision making under
uncertainty3 needs to take into account not only how individuals at risk perceive risks and
their coping abilities but also the nature of the threat, the characteristics of the protective
action, and the vulnerability and exposure levels of populations at risk. Thus if policymakers
wish to have a better understanding about how to facilitate individual protective actions
against major risks, they need to first understand how these different factors affect the
decision of individuals at risk to take these actions. This is an important finding as it suggests
2 In this study, the definition for vulnerability is the combination of the one defined by Wisner et al. (2004:11): ‘the characteristics of a person or group and their situation that influence their capacity to anticipate, cope with, resist and recover from the impact of a natural hazard (an extreme natural event or process)’, and the definition used by the Intergovernmental Panel on Climate Change, adopted also by Emergency Management Australia (2000), which defines vulnerability as ‘the degree to which geophysical, biological and socio-economic systems are susceptible to, and unable to cope with, adverse impacts of climate change’ (IPCC 2007). These two definitions were combined and defined by Berry (2002) as vulnerability being a pre-existing condition or state defined by a set of negative attributes that cause people or communities’ susceptibility to loss. This definition of Berry (2002) for vulnerability, therefore, is the one used in this thesis, which is comprised of the factors included as demographic and household characteristics variables in the model introduced on page 61. As for the definition of exposure, it is the one used by the United Nations for International Strategy for Disaster Reduction: ‘the situation of people, infrastructure, housing, production capacities and other tangible human assets located in hazard-prone areas’ (UNISDR 2014).
3 It is worth noting that in this thesis decision making is framed under uncertainty rather than risk. This is because the occurrence and the extension of the damage of the most recent event that flooded the geographical location of this study in 2011 caught by surprise the great majority of the residents participating in this study (Box et al. 2016:1563). This element of surprise is relevant for drawing the distinction between uncertainty and risk since, as Knight (2012) explains, risk (or uncertainty risk) is when we know the odds of potential outcomes in advance whereas uncertainty (or genuine uncertainty) occurs when we do not know the possible outcomes in advance and also their probabilities. Thus it is possible to argue that when dam operators decided to release water in 2011 they made a decision under risk: they were aware of the potential damage that their decision would cause, and so could calculate it. However, householders living in downstream areas of the dam were not aware of this disaster even when it was imminent. This oblivion state shows that householders make decisions under uncertainty because of the complexity that this process involves – ranging from receiving and trusting government messages to assessing their own risk perceptions and ability to take protective actions.
20
that perceived capacity to take action among householders living in flood-prone areas in
Australia is not the strongest predictor of protective actions, which opposes the main finding
of research conducted in other locations. The factors that end up determining the decision
of householders to take protective actions vary in terms of the conditions (perceived hazard
risks, perceived capacity to take action and vulnerability factors) and the circumstances of
this decision-making process (the exposure levels of communities at risk and the nature of
a threat and of protective actions).
Shared Responsibility between Government and Individuals
The starting point for understanding the debates around risk management in the context of
public policy is the view that risk mitigation should be achieved through a combination of
governments taking structural and non-structural measures and individuals at risk taking
personal protective actions (Box et al. 2013). Public campaigns raising awareness about the
risks of emerging threats are an example of a non-structural measure at the government
level. Structural measures, in turn, are reflected in infrastructure projects which seek to
address large-scale uncertainties resulting from climate variability and climate change. Once
the government reduces short- and long-term risks through structural and non-structural
efforts, the population at risk needs to deal with residual risks. Residuals risks are risks that
spill over during a disaster, or rather, the negative consequences that public risk reduction
strategies could not eliminate. Flood insurance is an example of a response to residual risks
taken by householders (Botzen et al. 2009) living in areas where flooding resulted from dam
water release (Queensland Floods 2011) or the collapse of levees (New Orleans Floods
2005). These examples are extreme in terms of the characteristics of the hazard itself;
however, these types of disasters have become part of collective memory because of the
significant damage and losses that they had delivered. Therefore, such events serve to make
the case that government mitigation strategies must be complemented with protective
actions taken at the household level.
This thesis begins from the assumption that governments alone cannot reduce every
aspect of flood risk in a world of growing uncertainty; as a result, populations at risk should
take protective actions to reduce residual risks. By taking protective actions, these
populations reduce the level of their risks while strengthening their response and recovery
capabilities should a disaster strike and a government’s preventive policies fail. Since
individuals at risk must take action, it is necessary to assess what motivates individuals living
in flood-prone areas to act.
21
This assessment of individual decision making under uncertainty, however, is rather
complex as it involves a wide range of factors that should be taken into account. This is
where PMT can make a contribution (Rogers 1975). This theory understands that individual
decision making depends on risk perception, the actual and perceived capacity that
individuals have to reduce risks, and their attitudes towards the coping measures. The
analysis of both risk perception and coping appraisal variables, in a regression with other
explanatory variables, like vulnerability factors, are the means through which PMT provides
empirical evidence about the factors that influence decisions of householders living in flood-
prone areas to take protective actions or not. The purpose of this thesis is to apply a PMT
model that builds upon previous studies and to then test it for the first time in Australia. The
goal of testing this model is to determine what influences Australian householders to take
protective actions vis-à-vis flood risk threats. In this regard, this study is driven by the
following research questions:
1. What is the role that individual risk perception play in informing flood mitigation
strategies in Australia? (Chapter 2)
2. What are the challenges to measure individual risk perception and decision making
under uncertainty? (Chapter 3)
3. How does a theoretical framework based on PMT help explain decision making about
preparing for flood risk? (Chapters 4 and 5)
4. How do threat appraisal factors4, coping appraisal factors5, and vulnerability6
influence the decision of householders living in flood-prone areas to take protective
actions7? (Chapters 6 and 7)
The expectation is that the measurement of the PMT variables, in addition to vulnerability
factors, will provide an understanding of the variables that influence individual decision
4 Threat appraisal assesses maladaptive responses (such as fatalism, wishful thinking, and denial) and the individual’s perception of the likelihood and impacts of a hazard (Floyd et al. 2000). 5 Coping appraisal focuses on investigating individual perceptions about how one believes they can ‘cope with and avert the threatened danger’ (Floyd et al. 2000:411).
6 Berry (2002) understands that vulnerability is a pre-existing condition or state defined by a set of negative attributes that cause people or communities’ susceptibility to loss.
7 The protective actions assessed in this study under the theoretical framework of PMT are flood insurance, house raising and home improvements. Relocation is the fourth protective action considered in this project but it was deliberately excluded from comparative analysis because of the scope of this project. This project did not have the resources to evaluate the coping factors of this protective action after the decision to relocate was made. In other words, this study did not have the resources to identify and reach out a significant number of residents that had already relocated from the flood-prone suburbs selected for this study. However, insights into how threat appraisal, vulnerability (through regression analysis) and coping factors (based on qualitative data) affect the decision of householders to relocate are provided in chapter seven.
22
making under uncertainty. This understanding is particularly important to floodplain
management in Australia because the federal government has proposed that individuals at
risk should take protective actions to reduce their residual risks to major disasters (COAG
2011). Thus data emerging from this study aim to inform Australian policymakers about the
complexity of motivating individuals at risk to take these actions.
Scope and Application of Decision Making under Uncertainty
Protection Motivation Theory provides a framework that has delivered insights into how
individuals at risk make decisions about protective actions. The two cognitive mediating
processes of this theory are threat appraisal and coping appraisal. Threat appraisal
assesses the individual’s perception of the likelihood and impacts of a hazard (Floyd et al.
2000). Coping appraisal focuses on investigating individual perceptions about how one
believes they can ‘cope with and avert the threatened danger’ (Floyd et al. 2000:411). In the
context of mitigating flood risks, researchers have been particularly interested in
investigating the factors that determine coping appraisal by asking the following questions:
If I do something to reduce or eliminate this risk, will it be effective? (response-efficacy); is
this action feasible in terms of time and the knowledge available? (self-efficacy); and, is the
cost reasonable? (response cost). The general result of these models is a view that these
coping factors are stronger indicators than risk perceptions when explaining the reasons why
some people decide to protect themselves against a threat (Bubeck et al. 2013; Grothmann
and Reusswig 2006; Poussin et al. 2014). This finding constitutes the main hypothesis of
this thesis; namely that coping factors are better predictors of protective actions than threat
appraisal factors in an Australian context. This hypothesis will be tested against data
collected specifically for this study which will then be used to evaluate whether this
hypothesis is confirmed in the Australian context.
Method and Case Study
This study collected quantitative and qualitative data through surveys and field observations.
The return rate of nearly 1800 questionnaires dropped in letterboxes between late spring
and early summer of 2015 was of 26,2% (N:469), which is a strong return rate and absolute
number of responses for this type of study (see page 100 for a comparative analysis with
other empirical studies). In addition, this thesis added some heuristics in the category of
maladaptive responses (such as fatalism, wishful thinking, and denial), to better understand
the role that risk perception exerts on decision making. The author also included
demographic and household characteristics to capture how vulnerability levels affect

23
decision making. Also, the model designed for this project assessed four different types of
protective actions. These protective actions are: flood insurance, house raising, home
improvements and relocation. The comparative analysis of different models based on the
same set of independent variables, with the exception of relocation, will allow this study to
investigate which factors are most prevalent for each type of protective action. This thesis
also gathered a significant number of qualitative data through questionnaires, field
observations, and informal interviews. This qualitative data provided some information to
understand the different perceptions of householders towards dependent and independent
variables, the nature of the hazard in question, and interpret correlations that were initially
qualified as non-intuitive.
The quantitative data were analysed through logistic regression to identify the
relationships among covariates and their significance level with dependent variables of
individual flood protective actions. The dependent variables (house raising, flood insurance,
home improvements and relocation) assessed in this study are i) different in nature, ii)
motivated by different factors, and iii) differ in the level of protection to major flood risks.
These dependent variables are also the most common protective actions against flood risks
taken by the population of this study. As for the independent variables, they were divided in
the following way: i) threat appraisal; ii) coping appraisal; iii) demographics, and iv)
household characteristics. In the case of threat appraisal, it is divided into four sub-groups:
i) perceptual risks; ii) objective risks; iii) maladaptive responses; and iv) flood experience.
These independent variables are the ones generally included in previous models testing the
explanatory power of PMT at the household level in the context of flood mitigation (Bubeck
et al. 2013; Grothmann and Reusswig 2006; Poussin et al. 2014; Zaalberg et al. 2009).
As for the sample of this study, the geographical area and population selected
showcase the relevance of this study for flood risk management. Householders living in the
city of Brisbane have been affected by many river floods such as the ones in 1893, 1974 and
2011, which were all significant by any measure. This Southeastern part of the state of
Queensland has also been affected by other sources of flooding such as creek, waterway
and overland flowpaths due to intense shorter duration rainfall (Brisbane City Council 2014).
In particular, the last two major flood disasters that inflicted this region have been particularly
damaging. The 1974 disaster was a defining event for Brisbane residents. Peaking at 5.45 m
and with insured losses of about $2.3 billion (van den Honert and McAneney 2011), this
event led to changes in the river catchment system, resulting in the construction of the
Wivenhoe Dam in 1984 (Bohensky and Leitch 2014). As for the second event, extreme

24
weather conditions in late 2010 through January 2011 resulted in two major flood events.
The first event was a flash flood, described by Queensland Premier as an inland tsunami,
that affected the city of Toowoomba and then further downstream in the rural Lockyer Valley
(Bohensky and Leitch 2014). The second event was in downstream cities of Ipswich and
Brisbane. In this event the flood peaked at 4.46 m (a new record since 1974), affecting
14,100 properties including the inundation of 1,203 houses and 2,436 businesses (QFCI
2011). Public and private river infrastructure was severely affected (Bohensky and Leitch
2014). This event became known as the 2011 Brisbane flood and turned out as the most
expensive natural disaster in Australia’s history (van den Honert and McAneney 2011; QFCI
2012).
Responsibility for the losses caused by 2011 disaster has been the object of
contentious and judicial debates between flood-affected residents and the state and local
governments. In this debate over who is responsible for disaster-related losses, the local
government, according to the federal and state frameworks, plays a key role in reducing the
risks of major floods since the enactment of mitigation strategies depends on local
government support (QFCI 2012). Local governments are ‘the principal entities involved in
land use planning, development assessment and disaster management’ (QFCI 2012:54).
The importance of local government in mitigating flood risks was also stressed by the Council
of Australian Governments (COAG) which emphasized that local governments also play a
significant role in the management of emergencies (COAG 2011). In this institutional shared
responsibility debate, it is not clear, however, the role that individuals at risk play in mitigating
their risks and, more importantly, how their risk perceptions and challenges to undertake
protective actions inform policy making.
Structure of the thesis
The next chapters begin to review the pertinent literature. The literature review is split across
two chapters. Chapter two examines the policy landscape within which this study is situated
and reviews literature relating to risk mitigation and continues the argument, introduced
above that mitigating risks effectively is dependent upon a better understanding by officials
about the conditions and circumstances of individuals at risk. This review also highlights the
importance of having those individuals who are most at risk participating in decision-making
processes. The chapter also delivers a review of floodplain management in Australia by
highlighting how current policies in Australia acknowledge the importance of considering
individual participation yet fail to translate this rhetoric about community resilience into

25
practice. Chapter three moves onto the thesis’s core business by reviewing the literature
which relates to risk perception and decision making. The objective of this exploration is to:
i) outline the key concepts used in this study and ii) to highlight the challenges of classifying,
measuring, and analyzing the relevant concepts in empirical terms. Chapter four sets out the
project’s theoretical framework. Models that have been previously used to analyze individual
risk perceptions and decision making under uncertainty in the context of floodplain
management are first outlined and then this thesis’s model is justified with reference to each
of its variables and the way in which they can illuminate comparative insights when examined
as a whole. This comparative analysis is justifiable in the sense that all these models have
tested the explanatory power of PMT among householders living in flood-prone areas.
Chapter five makes a detailed presentation of the method used in this project. In this chapter,
the steps that were taken before the data were analyzed are revealed so that the reader can
understand the research design and its possible replicability to other settings. Chapter six
and seven present the quantitative results, discuss correlations and reflect upon the findings
in a comparative light by contrasting the data with results from previous studies. The thesis
ends with a ‘final remarks’ chapter in which it reviews the main findings in light of the theory
being tested and the research questions driving this study. This final section ties together all
the findings organized by the set of explanatory variables and concludes with suggestions
for new avenues of research.
Conclusion
This chapter introduced the breadth and depth of this study. It did so by presenting its
rationale, theoretical framework, target audience and method. In addition, it presented the
thesis structure for readers to understand how research questions will be answered. The
theoretical foundation of this thesis is PMT. This theory allow us to explore relationships
between threat appraisal and coping appraisal, regressed along with vulnerability factors,
and the decisions of individuals at risk to take protective actions. This theory had already
been applied in other contexts but this is the first time it has been used in Australia. This is
the main novelty of this study. Its findings can inform Australia’s policymakers about which
factors most influence individuals at risk to take specific protective actions against major
flood risks and the challenges that these householders face to take these measures. In this
regard, the chapter highlighted that the emerging concept of shared responsibility at the
government level expects that individuals at risk will take action to reduce the residual risks
presented by the effects of major hazards. However, this concept does not yet appreciate
the complexity of the decision-making process at the household level. In particular,
26
policymakers need to understand how conditions and circumstances effect household
decisions leading to protective actions. These conditions are perceived hazard risks,
perceived capacity to take action and vulnerability factors. The circumstances influencing
these decisions are exposure levels, the nature of a threat and the nature of the protective
action. This core finding -- that conditions and circumstances affect decision making under
uncertainty -- is important as it suggests that in the Australian context the individual’s
capacity to take protective actions is not necessarily the main predictor of protective actions,
as previous studies have concluded. In addition, this thesis stresses the importance of
investigating to what extent vulnerability factors influence decision making under uncertainty.
27
Chapter 2: Risk Mitigation and Flood Management in Australia
Introduction
This chapter aims to answer the following research question: What is the role that individual
risk perception play in informing flood mitigation strategies in Australia? In order to answer
this question, this literature review on risk mitigation and floodplain management in Australia
justifies this study by contextualizing it in the policy landscape, making the case that i) risk
mitigation is important in disaster cycles and that ii) current policy in Australia’s floodplain
management needs to further investigate and consider individual perceptions in its floodplain
mitigation strategies. This chapter is followed by another literature review (chapter three) that
answers another research question (What are the challenges to measure individual risk
perception and decision making under uncertainty?) by developing the conceptual nature of
this thesis through the investigation of the literature on risk perception and decision making.
This two-part literature review answers these two research questions and prepares the
reader for the theoretical framework that follows in chapter four.
This chapter on risk mitigation and floodplain management in Australia shows that risk
mitigation is a topic that a growing number of scholars have been studying and a concept
that has evolved over the years. This happens because it has been generally accepted that
investments in risk mitigation yields positive return rates (COAG 2011) and that traditional
mitigation strategies focused on fixing hazard risks should be complemented by policies
aiming to reduce vulnerability at the community level. However, investments in risk mitigation
strategies in Australia are still largely insufficient when compared against the other stages of
the disaster cycle such as preparedness, response, and recovery (McGowan 2012).
After contrasting traditional and contemporary approaches to risk mitigation
strategies, this chapter reviews the over-arching policy guiding the reduction of major flood
risks in Australia. Shared responsibility is the national guideline for mitigation strategies in
the country. In these strategies the federal government argues that individual risk
perceptions are important to the design of effective mitigation strategies (COAG 2011), which
build resilient communities across the country. Building resilience at the community level is
increasingly important in contemporary disaster management frameworks since
policymakers no longer assume that i) individuals at risk hold zero tolerance to low-
probability high-impact disasters; ii) the government alone can reduce threats that pose high
risks; and iii) hazards can be perfectly controlled, particularly due to judgment failures (by
28
experts and individuals at risk) and growing uncertainties around climate change. Thus it is
necessary to understand what the concept of shared responsibility actually means in the
context of floodplain management before assessing the relationships between risk
perception and decision making at the household level in Australia.
Risk Mitigation
This section discusses the role that risk mitigation plays in the disaster cycle. This discussion
highlights the challenges and the development of this concept in the literature. It then focuses
on risk mitigation in the context of flood management and how we could increase the
importance of mitigating flood risks and measure them. Finally, it briefly introduces the
politics of risk mitigation, the role of insurers in mitigating risks, and how risk mitigation relates
to the concept of vulnerability. The main takeaways from this section are i) the challenges to
fund risk mitigation strategies; ii) the evolvement of the concept of risk mitigation over time;
and iii) how it has now been geared towards reducing vulnerability among communities at
risk rather than ‘fixing’ natural hazards.
The Governance and Justifications of Risk Mitigation
Risk mitigation is the cornerstone of emergency management as it is practiced today
(O’Connor 2014). In the current global political economy, mitigating risks is an essential
element of good governance (Letens et al. 2008). The importance of risk mitigation to
governance derives from the fact that it takes into account medium- or long-term prospects
of safety. Mitigation is about thinking ahead, using common sense, and doing whatever it
takes to achieve some payoff in the future (O’Connor 2014). In other words, mitigation is an
ongoing process to identify risks from multiple perspectives (Letens et al. 2008). In terms of
natural hazards, the objective of conducting continual mitigation assessments is to turn
natural disasters into natural hazard events (Ganderton 2005). Hazard mitigation, however,
receives less investments than the other stages of the disaster cycle (Ganderton 2005). For
instance, in the U.S., the Federal Emergency Management Agency (FEMA) spent $28 billion
on recovery between 1988 and 2011 but less than 10% on mitigation over the same period
(FEMA website). In Australia, McGowan (2012) revealed that the allocation of resources to
mitigation efforts is considerably lower than the amount of money spent on disaster response
and recovery. Thus the main challenge of FEMA and disaster management agencies in
Australia is to justify expenditures on mitigation programs.

29
Several independent and government-funded studies revealed the positive return rate
that risk mitigation represents to the public budget. Governments that invest in mitigation as
a long-term goal to reduce or eliminate the impact of hazard risks are likely to witness a 3:1
return on investment, according to the Bureau of Transport and Regional Economics in
Australia, or even a 5:1 average return on investments in flood mitigation according to a
study conducted by Rose et al. (2007) in the U.S.. Other agencies also conducted studies
over the benefit-cost analysis of mitigation strategies. The National Institute of Building
Sciences (2005) identified that for every dollar spent on flood mitigation, society saved an
average of $4.10 in disaster relief and increased taxation. Also, Healey and Malhotra (2009)
found that every dollar spent on mitigation was worth around $15 in terms of the value it
mitigates. The Australian government also recognized the significant return rate of
investments in mitigation (COAG 2011). The Council of Australian Governments found that
‘every dollar invested in flood mitigation saved more than $2.10’ (COAG 2002:24). Risk
mitigation also saves lives. In the U.S., mitigation grants awarded ‘between 1993 and 2003
saved more than 220 lives and prevented nearly 4,700 injuries over approximately 50 years’
(Public Law 111-351). However, despite being considered an important action to protect lives
and a cost-effective strategy, the implementation of mitigation measures has proved hard to
achieve (Wenger et al. 2013). The next sections review the concept of risk mitigation, how it
has evolved over time, and the challenges it faces.
The Traditional Understanding of Risk Mitigation
Risk mitigation started off as a strategy to reduce or eliminate hazard risks. That is, the
primary focus of risk mitigation strategies was fixing hazard risks, particularly in terms of
reducing exposure of infrastructure and communities at risk. Thus, mitigation was defined as
the elimination of, reduction in probability of, or reduction of the effects of potential disasters
(Drabek 1986) or activities preventing the occurrence and lessening the impacts of an event
(Quarantelli 1986). Other researchers also defined mitigation measures along these lines.
Mitchell (2011) and Waugh (2000) defined the goal of mitigation as lessening the adverse
impacts of hazards and related disasters. The underlying idea in all these definitions is that
disaster losses are caused by the impact of hazards on communities and structures exposed
to these risks. Thus, these scholars agree that policy studies should focus on understanding
the nature of hazards so that officials can come up with strategies to reduce or eliminate the
risks imposed by natural hazards.

30
The objective of risk mitigation, therefore, became the reduction of hazard risks through
structural and non-structural mitigation strategies (Alexander 2002). In floodplain
management, structural mitigation strategies are engineering measures such as levees and
dams. Non-structural mitigation measures are non-engineered activities such as land use,
building codes, public education, and insurance. Non-structural strategies are usually
brought in when engineering solutions are too costly or do not result in a substantial reduction
in losses (O’Connor 2014). The main challenge faced by this traditional approach of
mitigation strategies is incorporating structural and non-structural measures into
development initiatives (Bosher 2008; Waugh 2000). The strategies that become part of
developmental initiatives are based on a top-down decision-making process. As Freeman
and Kunreuther (2002) explain, mitigation activities are often the product of policy decisions
made at a national level. However, the emphasis on command and control decision-making
processes ignore local knowledge and provide a paternalistic view of what is best for society
(Dynes and Quarantelli 2000). The result of this paternalistic view is that it does not reduce
the amount of damage and loss of lives (White 1964). Not only that, top-down decisions
ignore statistical inevitabilities such as Hurricane Katrina in New Orleans and Tohoku
earthquake in Japan (Fischetti 2001; Reichhardt 2004) and exacerbate damage by providing
a false sense of security through structural measures (Colten and Sumpter 2009). Thus, in
face of high-impact low-probability disasters, encouraging community participation in
governmental planning became critical to risk mitigation strategies (Nilsson 2010).
The Challenges and Measurements of Risk Mitigation at the Community Level
The goal of reaching out communities to actively participate in deliberative meetings is to
help them reduce damage while increasing community interest in discussing practices of
disaster risk management (Nilsson 2010). Bosher (2008) argues that this holistic approach,
which follows the recommendations of the United Nations’ Hyogo Framework for Action,
should be considered as a system of shared responsibility for the undertaking of mitigation
measures. Urban planning, for instance, is expected to draw extensive and intensive citizen
interest. However, the number of citizens participating in the formulation of hazard mitigation
policies at the local level remains low (Nilsson 2010).
There are many reasons of why community members decide to not actively participate
in discussions about risk mitigation strategies. People are too busy in their daily lives, transfer
the responsibility of risk mitigation to authorities, or are simply not interested in joining
community meetings discussing uncertainty. However, other reasons also play out in this
case. Individuals have cognitive difficulties to rationalize in long-terms (Kahneman and
31
Tversky 1973; Slovic et al. 1974, 1977) and to make decisions under uncertain scenarios
about low-probability high-impact disasters (Slovic and Fischhoff 1977; McEntire 2005).
They also face difficulties to think in counterfactual terms. Ganderton (2005) argues that risk
mitigation should consider counterfactual terms on the basis of benefit-cost analysis. ‘What
society would have lost had mitigation not occurred?’. Ganderton (2005) believes that
counterfactual thinking is an obstacle to human thinking as we rarely observe counterfactual
in history. However, Ganderton (2005:451) states that lack of counterfactual thinking should
not become a problem in risk mitigation because:
past disasters provide ‘real’ data on the benefits and costs of mitigation to the extent that we find two or more similar communities affected by the disaster that vary by the application of the mitigation project.
That is, data replace counterfactual thinking. But even in the absence of past data,
Ganderton (2005) continues, decision makers can still rely on models and simulations to
provide estimates of benefits and costs. However, the main argument of Ganderton (2005)
to consider using benefit-cost analysis in risk mitigation is the belief that this rationale leads
authorities to make better mitigation decisions with limited budgets. Finally, Ganderton
(2005) and Waugh (2000) agree that benefit-cost analysis is not exempt from criticisms but
it offers a pragmatic method to present past evidence while also looking into the future. And
to improve datasets that provide basic information about individuals at risk, Dlugolecki and
Keykhah (2002) suggest the establishment of public-private partnerships so that regulators
can harness the power of institutional investors to better understand the vulnerability levels
of communities at risk.
The Politics of Risk Mitigation
Nevertheless, one should be careful about trusting that public authorities are genuinely
interested in considering risk mitigation strategies. Politicians and bureaucrats tend to have
worries other than thinking about the unthinkable (Boin and McConnell 2007; Charles 1989).
The pressures of politics make it highly unlikely that politicians devote serious attention to
what might fall on society (Charles 1989). The pivotal question then is how to increase the
interest of political and administrative leaders in risk mitigation strategies. One of the
paradoxes of crisis management is that mitigation policies have their best chances to be
implemented at the very moment they fail (Boin and McConnell 2007; Charles 1989).
Researchers call these moments as windows of opportunity. With the occurrence of a crisis,
authorities, the media, and the public share a feeling of the never again which creates a
conducive environment for risk mitigation (Charles 1989). This post-disaster atmosphere
32
becomes even more important because public interest quickly wanes among politicians and
citizens alike when everyday pressures of public administration and daily routine become
prevalent again (Boin and McConnell 2007; Charles 1989).
Traditional crisis scholars acknowledge the difficulties of increasing the interest of
public officials to mitigate risks beyond windows of opportunity. They also admit that the
concept of shared responsibility of risk management with community members poses
significant challenges. For instance, risk management is inherently multiparty (McLennan
and Handmer 2012). This multiparty nature of risk management implies that i) few risks have
a single identifiable cause; ii) it is difficult to identify agents that create risk; iii) to predict
outcomes; and there is rarely iv) one single entity capable of taking responsibility for
mitigating all kinds of risks (McLennan and Handmer 2012). Therefore, conflicts and trade-
offs resulting from the discussion over risk acceptance in a shared-responsibility system
must be addressed in a way that the government and the public agree with its terms.
The Role of Insurance in Risk Mitigation
Mills (2007) argues that the private sector, particularly insurance firms, play an important role
in these debates over risk acceptance and shared responsibility. Insurance limits damage
for the government and the public by acting as a price signal for risk and encouraging the
undertaking of mitigation measures (Botzen and van den Bergh 2008; Kunreuther 1996). A
necessary condition to limit damages, however, is that insurance premiums reflect the risk
faced by the insured property (Kunreuther 2008). Premiums can stimulate development in
less risky areas and restrain development in hazard prone areas (Botzen and van den Bergh
2009). Insurance can also provide incentives to homeowners ‘to invest in measures that
mitigate damage’ (Botzen and van den Bergh 2009:220). Mills (2009) also defends that
individuals that reduce their vulnerability levels should be rewarded with lower insurance
premiums. Kunreuther (2006) argues that these incentives are important since mitigation
measures help individuals at risk to manage risks.
Other authors claim that a combination of individual mitigation measures with
prevention undertaken by the public sector result in diversified risk management strategies
that enhance economic resilience to natural hazards (Charpentier and Maux 2014).
However, Kleindorfer and Kunreuther (1999) found out that homeowners do not undertake
mitigation measures because they i) cannot see the trade-off between spending money now
and future benefits; ii) have little knowledge of financial adaptation; iii) believe that
government relief efforts is a safety net; and iv) lack resources to buy costly premiums. In
33
addition, Blazey and Govind (2007) highlight that individuals at risk do not take protective
actions because risk information is often unclear and the implementation of these actions
are not simple. Thus, the limitations of protective actions, such as insurance, as a risk
mitigation strategy lead economists to propose better incentives for householders to take
risk mitigation measures (Botzen and van den Bergh 2009) and policy researchers to claim
that land-use planning is a more adequate non-structural strategy to mitigate hazard risks.
Comrie (2011), for instance, argues that land-use planning and building standards such as
house raising are more effective than trying to change human adaptive-response through
public education, warning systems, and financial incentives. In addition, Blazey and Govind
(2007) warned that even when individuals at risk have information about hazard risks through
education campaigns, they do not necessarily positively react to these public efforts by taking
protective actions8. Therefore, land-use planning and disaster education are important
variables in mitigation studies. This literature review now turns to another mitigation
approach to reducing hazard risks.
A More Contemporary Approach to Risk Mitigation
Mileti (1999:215) coined the concept of sustainable hazard mitigation, which guides the
current practices of risk mitigation. The main difference between the contemporary approach
of risk mitigation to the traditional one is that sustainable hazard mitigation emphasizes the
concept of vulnerability whereas the traditional approach to risk mitigation focuses on hazard
risks and how to fix them through technology. Haque and Burton (2005:347) explain this
contrast between traditional and contemporary approaches to risk mitigation:
Traditional and dominant approach to mitigation used to be ‘technological-fix school’ of natural processes through land-use planning, building codes, weather forecasting, regulatory intervention in natural resource use, and engineering modification to resist and contain hazards. The current approach to mitigation has been: associate hazard mitigation with societal and physical vulnerability of local communities, and take responsibility for collective and individual response-behaviour.
This explanation of Haque and Burton (2005) reveals that the new concept of risk mitigation
focuses on the assessment of i) local vulnerability and ii) responsibility for individual-
response. Thus technical solutions aiming to fix hazard risks should now be complemented
by the understanding that the investigation of vulnerability, a pre-existing condition or state
8 The investigation of how land-use planning and disaster education determine the design of mitigation strategies is important and has been widely explored in the literature. This thesis acknowledges the relevance of these topics for the development of effective mitigation plans but exploring in detail how these factors influence decision making under uncertainty is beyond the scope of analysis of this thesis.

34
defined by a set of negative attributes that cause people or communities’ susceptibility to
loss (Berry 2002).
Vulnerability and Risk Mitigation
The understanding of risks from the perspective of vulnerability shifts the focus of risk
mitigation strategies. Etkin and Stefanovic (2005) propose a paradigm shift to advance the
studies of disaster mitigation. This shift should no longer focus on the technological-fix school
of hazards but emphasize human interactions with the natural world (Etkin and Stefanovic
2005). In this paradigm shift, human behaviour becomes the core of contemporary risk
mitigation strategies. To justify this shift, Etkin and Stefanovic (2005) explain that losses
related to natural hazards are the product of human behaviours that create exposed and
vulnerable communities. And to eliminate or reduce vulnerability and mitigate risks, it is
necessary to consider underlying values such as people’s world views and the nature of
interaction with the natural domain (Etkin and Stefanovic 2005). However, as Etkin and
Stefanovic (2005:19) explain, the addition of vulnerability in decision-making process
requires that:
risk mitigation decisions no longer be top-down, according to recent lessons from various countries. Mitigation requires ownership and that is why a bottom-up process is important as it considers social, political, and cultural acceptance and sense of ownership.
This bottom-up process is defined by Etkin and Stefanovic (2005) as an interactive,
participatory process, involving local communities since it is this framework that produces
best expected outcomes concerning mitigation, preparedness, and recovery. Slinger et al.
(2007) and Stanghellini (2008) produced evidence in this regard after finding out that
individuals living in flood prone areas change their risk perception after participating in
deliberative processes. This change occurs due to i) increased levels of awareness; ii)
motivation; and iii) trust towards authorities, experts and oneself as agents that take action
against risks (Slinger et al. 2007; Stranghellini 2008). In addition, Etkin and Stefanovic (2005)
state that if the technical approach to mitigation ignores vulnerability, the mitigation of
disasters remain a fallacy rather than a reality.
McLennan and Handmer (2012) provide practical questions that reinforce the
importance of this paradigm shift. It is necessary to question social structural conditions that
create vulnerable groups, as McLennan and Handmer (2012:12) posit:

35
To what extent some people freely choose to live in hazard-prone areas given factors such as limited land availability and high prices in urban areas, weak planning regulations, and uneven access to services in rural areas? How do factors such as changing rural economies, government policies and programmes, poverty, gender and cultural differences shape people's access to economic, social and other resources for risk mitigation, planning and recovery?
These questions are relevant because they show that a comprehensive examination of
social vulnerability is required before discussing where the responsibility for risk mitigation
lies within government and society (McLennan and Handmer 2012).
Thus the understanding of risk mitigation has evolved to actions that reduce
vulnerability (Haque and Burton 2005). These actions are policies and activities that reduce
the vulnerabilities of a community to damage from future disasters (Freeman 2002). And the
assessment of vulnerability shows where mitigation efforts need most to be targeted
(Anderson-Berry and King 2005). Waugh (2000) argues that it is only after understanding
the diversity, needs, strengths and vulnerabilities within communities, that government at all
levels can strengthen local capacity through investments in community engagement.
Therefore, the current approach to risk mitigation follows the principles of sustainable
hazard mitigation. The main difference of this approach to the traditional understanding of
risk mitigation is that the current one reduces risks by emphasizing the vulnerability features
of communities at risk. The addition of vulnerability in mitigation studies allows a holistic
assessment of the challenges that individuals at risk face to implement mitigation strategies.
This discussion is important as it informs the debate over shared responsibility, reviews
decision-making processes, and incorporates other concepts such as sustainability into
policy making. However, this new approach does not deny the importance of higher levels
of governments for implementing risk mitigation strategies. It actually reinforces it, as well as
the relevance of policies from the other stages of the disaster cycle, by stating that top-down
solutions can be legitimized by inputs coming from individuals at risk when local vulnerable
issues are considered in decision-making processes.
Multi-level Floodplain Management in Australia
This section reviews the role of the federal, state, and local governments (Figure 1) in
reducing major flood risks in Australia. This review focuses primarily on how existing multi-
level policies affect and are informed by risk perception and decision making at the
household level. The main objective is to identify the importance that individual risk
perception and protective actions have in the existing shared responsibility system in
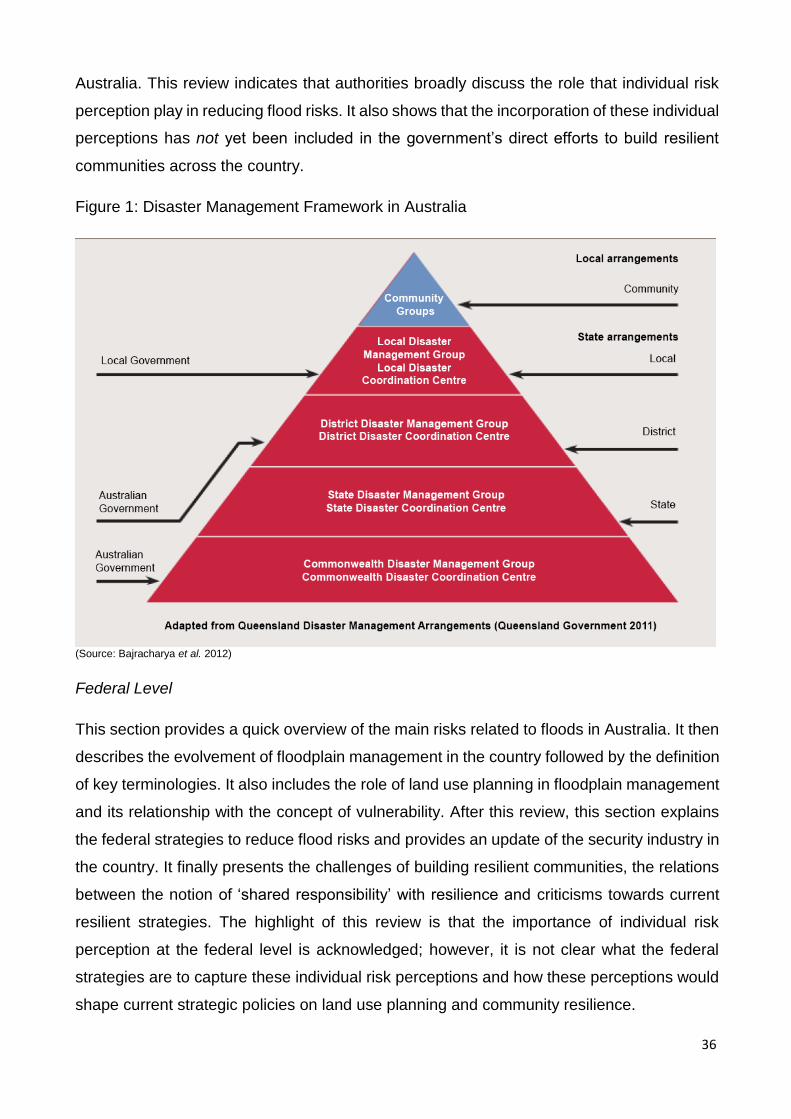
36
Australia. This review indicates that authorities broadly discuss the role that individual risk
perception play in reducing flood risks. It also shows that the incorporation of these individual
perceptions has not yet been included in the government’s direct efforts to build resilient
communities across the country.
Figure 1: Disaster Management Framework in Australia
(Source: Bajracharya et al. 2012)
Federal Level
This section provides a quick overview of the main risks related to floods in Australia. It then
describes the evolvement of floodplain management in the country followed by the definition
of key terminologies. It also includes the role of land use planning in floodplain management
and its relationship with the concept of vulnerability. After this review, this section explains
the federal strategies to reduce flood risks and provides an update of the security industry in
the country. It finally presents the challenges of building resilient communities, the relations
between the notion of ‘shared responsibility’ with resilience and criticisms towards current
resilient strategies. The highlight of this review is that the importance of individual risk
perception at the federal level is acknowledged; however, it is not clear what the federal
strategies are to capture these individual risk perceptions and how these perceptions would
shape current strategic policies on land use planning and community resilience.

37
Overview of Flood Risks in Australia
The four sources of flooding in Australia are heavy rainfall, storm surge, tsunami and dam
failure (or water release) (Queensland Reconstruction Authority 2014). Rainfall and storm
surge floods are the most common and pose more significant threats to communities living
in floodplain areas (Queensland Reconstruction Authority 2014). Floods cause more deaths
and are the most expensive disasters in Australia (Floodplain Management Association
2013; Queensland Reconstruction Authority 2014). The direct costs of floods from 1967 to
2005 was estimated ‘at an average of $377 million per year’ (Queensland Reconstruction
Authority 2014:1). Climate change and climate variability exacerbate the losses caused by
major floods in Australia (Wenger et al. 2013). Risk scenarios project higher intensity and
frequency of floods in the country (Bureau of Meteorology and CSIRO 2012). Despite these
looming scenarios, flooding is considered one of the most manageable types of natural
disaster (Queensland Reconstruction Authority 2014). Thus it is worth reviewing how major
floods have been managed in Australia since the cost of the impact of these events are
becoming unaffordable (Bureau of Transport Economics 2001).
The Development of Floodplain Management Strategies in Australia
According to the Queensland Reconstruction Authority (2014), floodplain management in
Australia has evolved through the following phases9: i) structural works; ii) planning; iii) flood
emergency management; and iv) all-embracing management. In the 1970s levees were
used to protect existing properties at risk. At this time, little consideration was given to the
use of levees and their potential impact on the environment, risk management planning or
even land use planning (Queensland Reconstruction Authority 2014). Despite the existence
of structural works, major floods happened in New South Wales, Victoria and Queensland in
1974 causing significant damage. The result of these events was that structural measures
needed to be complemented with better regulation and land use planning. In the 1980s and
1990s flood emergency management became important after a major flood occurred in New
South Wales requiring the evacuation of an entire community. And since early 1990s, the
federal government has considered an all-embracing approach to floodplain management.
This approach provides states and territories a comprehensive framework to address
floodplain management issues (Queensland Reconstruction Authority 2014). In addition to
reviewing how floodplain management has evolved in Australia, it is also appropriate to
9 It is worth noting that these phases mirror the development of risk mitigation strategies stated in the previous section.

38
understand which international frameworks have federal authorities considered to reduce
major flood risks since the Australian government has historically adopted international
floodplain management standards, more particularly the standards adopted by the U.S.
(Wenger et al. 2012).
In the U.S., the 1:100 year flood was chosen as an actuarial standard for the purposes
of implementing the National Flood Insurance Program in 1971 and its effect has been to
concentrate development just beyond the limits of the 1:100 year event (Wenger et al. 2012).
The adoption of this international standard is problematic because it is not based on ‘sound
scientific and scientific statistical foundations’ (Wenger et al. 2012:338). Wenger et al. argue
that this standard is actually ‘a compromise that balances flood losses against excessive
floodplain regulation’ (2012:338).
The Definition of Key Terms Related to Floodplain Management in Australia
It is also important to review key terms related to floodplain management in Australia before
discussing the current strategies of the federal government towards the reduction of flood
risks. The objective of providing the definition of key terms is to avoid ambiguity in the
interpretation of floodplain management practices and to acknowledge that mitigation
strategies are shaped by the level of understanding around the technical terms and scientific
aspects of hazard risks. According to Queensland Reconstruction Authority (2014), flood risk
is an evaluation of the consequence of a flood of a certain likelihood on a community. As a
result, flood risk management is a formal means of identifying and managing the existing,
future and residual risks of flooding (Queensland Reconstruction Authority 2014). Floodplain
risk management is ‘the cornerstone of floodplain management’ (QFCI 2012:238).
Floodplain management describes risk as a relationship between likelihood and
consequence (Queensland Reconstruction Authority 2014). Likelihood is the probability of
occurrence of a specific flood event, or range of events occurring, and consequence is an
evaluation of what is affected by the event(s) and how (Queensland Reconstruction Authority
2014). In terms of likelihood, planners and builders work with acceptable likelihoods which
is usually defined as a Defined Flood Event (DFE), such as the 1% Annual Exceedance
Probability (AEP) (Queensland Reconstruction Authority 2014). Planners are also interested
in understanding the consequences of an event as well as the range of flood events that may
occur (Queensland Reconstruction Authority 2014). Nonetheless, in order to understand the
consequences of an event, it is necessary to investigate flood behaviour (or flood hazard)
and the exposure, vulnerability and tolerability of people, property and infrastructure to a
flood of a certain likelihood (Queensland Reconstruction Authority 2014). Balancing these

39
three key elements -- exposure, vulnerability and tolerability -- help planners quantify
consequences and make development decisions in floodplains (Queensland Reconstruction
Authority 2014). As for flood hazard, the potential loss of life, injury and economic loss
caused by future flood events (QFCI 2012), it is evaluated in the context of competing
planning interests and community preferences (Queensland Reconstruction Authority 2014).
It is worth noting that flood hazard is also defined as the behaviour or characteristics of
floodwaters (that is, velocity, depth, rate of rise, and length of inundation) (QFCI 2012).
Land Use Planning in Floodplains in Australia
Therefore, land use planning in floodplains responds to the characteristics and conditions of
a floodplain. In Australia, however, 1% AEP event is considered an acceptable risk for
planning purposes nearly everywhere regardless of the potential consequences of the flood
(Queensland Reconstruction Authority 2014). Nonetheless, good planning cannot be
restricted to investigating only flood hazard, it needs to consider more than just the 1% AEP
flood by taking into account the consequences of a hazard in specific communities
(Queensland Reconstruction Authority 2014). It is the community’s acceptance of flood risk
that should frame the local land use responses used to address risk within a local
government area (Queensland Reconstruction Authority 2014). This is particularly important
because a community’s acceptance of risk is likely to be different in new urban areas when
compared with existing areas (Queensland Reconstruction Authority 2014). For instance,
risk acceptance in areas that have developed over time adjacent to waterways and that have
weathered previous flooding events is likely to be higher (Queensland Reconstruction
Authority 2014). In these areas the planning focus should be on building design, resilience
and emergency management (Queensland Reconstruction Authority 2014).
The Definition of Vulnerability in the Context of Land Use Planning
Vulnerability is another key concept in land use planning. According to the Australian
Emergency Management, vulnerability is the degree of susceptibility and resilience of the
community and environment to hazards (EMA 2000). The vulnerability of groups at risk
should be considered based on societal inequalities (EMA 2000:114) such as
location and proximity to a hazard’s sphere of influence, low-income households, women, the very young, the elderly, the unemployed, the disabled, large families, single parents households, newcomers to the community and migrants, ethnic minorities and female-headed households.

40
This analysis of vulnerability shows where mitigation efforts need to be targeted through
education and information campaigns (Anderson-Berry and King 2005)
Federal Strategies to Reduce Flood Risks in Australia
As a review of key terms in regard to floodplain management in Australia has been provided,
it can be presented now how the federal government currently approaches the reduction of
flood risks. The role of the Australian government reflects the government structure; that is,
Commonwealth Government, State and Territory Governments and Local Government
(Birkett and Mala-Jetmarova 2014). Each tier plays a specific role in disaster management
(Birkett and Mala-Jetmarova 2014). The Commonwealth Government plays an umbrella role
in crisis management. It coordinates national research in disaster and emergency
management, information, mitigation policies and practice (Australian Government 2009).
The specific roles of the Commonwealth Government are i) identifying national priorities for
mitigation with other levels of government and ii) providing support for risk assessment and
mitigation measures to states, territories and local government (Australian Government
2004). This leadership role aims to reduce risks and the costs of disasters by mobilizing
resources for disaster relief and community recovery (Australian Government 2004).
The Council of Australian Governments (COAG) released a report in 2002 with
recommendations to shift the orientation of federal floodplain management strategies from
response and recovery to anticipation and loss reduction (or mitigation) (COAG 2002). In
this shift the focus moved from hazards to risk and vulnerability (Eburn and Dovers 2013).
This new orientation recognizes that hazards are an inevitable part of the Australian
landscape (Eburn and Dovers 2013). As hazards cannot be avoided, the focus must change
from emergency management to vulnerability assessments and risk management (Eburn
and Dovers 2013). As Anderson-Berry and King (2005) highlight hazard mitigation lies
mainly with vulnerable communities and individuals. However, in terms of investments in risk
management, the allocation of resources to afflicted communities is concentrated in the
aftermath of disasters which is often the product of emotions, as Lagadec (1990) points out.
However, as Kelly (1995) explains, emotional reactions are frequently unrealistic and
probably inefficient as it diverts resources away from disaster mitigation and preparedness.
Due to the large amount of money allocated in post-disaster activities led by reactive and
emotional decisions, the report released by COAG in 2002 states that pre-disaster measures
are more cost-effective than post-disaster initiatives. Therefore, the focus of disaster
management in Australia, according to the COAG’s report, should be on reducing

41
vulnerability in communities at risk and investing in risk management; that is, mitigation and
preparedness without neglecting the underlying risks imposed by hazard behaviour, mainly
the intensity and frequency of major floods.
The shift of orientation proposed by COAG in 2002 affected the structural frameworks
of disaster management in the country. Since 2002, the Australian government collaborates
with state and local governments to help them develop a five-year disaster mitigation
package to reform their structure of disaster management. This federal support in the form
of funding has been used to promote community and organizational resilience, particularly
since 2008 (COAG 2011). And in 2009, the COAG adopted a whole-of-nation resilience-
based approach to disaster management recognizing that a national, coordinated and
cooperative effort was needed to enhance the country’s capacity to withstand and recover
from emergencies and disasters (COAG 2011). This national strategy known as National
Strategy for Disaster Resilience (NSDR) focuses on building disaster resilient communities
but it also recognizes that disaster resilience is a shared responsibility for individuals,
households, businesses and communities, as well as for governments (COAG 2011). As a
result, in 2010, the federal government launched the National Disaster Resilience Strategy
to articulate their risk reduction strategies at a multi-level government structure through the
National Disaster Resilience Program (NDRP) and National Partnerships Agreement (NPA)
(Rogers 2011). The objectives of this framework are reducing the risk of loss of life and long-
term economic damages (Wenger et al. 2013). The reduction of these risks are expected to
happen through growing investments in non-structural approaches and campaigns that raise
awareness to flood risks (Wenger et al. 2013).
Security Industry in Australia and the Challenge of Building Resilient Communities
In addition to these public policy strategies and structural frameworks, there has been
increased professionalization on the security industry in Australia in recent years (Rogers
2011). Research Network for a Secure Australia (RNSA), the Australian Council of Security
Professionals (ACSP) and conferences such as the annual Safeguarding Australia are
initiatives aiming to promote the exchange of best practices among decision makers and
practitioners (Rogers 2011). However, despite these policy structures and initiatives, the
implementation of these strategies has become increasingly complex as Australian
communities vary largely in their composition and in their level of exposure to risks (COAG
2011). Factors that influence disaster resilience include remoteness, population density and
mobility, socio-economic status, age, and percentage of population for whom English is a
42
second language (COAG 2011). These factors within communities make certain members
more vulnerable than others. The more vulnerable a group is, the more tailored advice and
support it requires (COAG 2011). Therefore, the implementation of policies aiming to build
resilient communities depends on members understanding the risks that may affect them
and others in their community. In addition, it is expected that these community members take
action to prepare for disasters and are adaptive and flexible enough to respond appropriately
during emergencies (COAG 2011).
The Relations between Shared Responsibility and Resilience at the Federal Level
Thus it is noticed that the evolving idea of shared responsibility is at the core of the National
Strategy for Disaster Resilience. McLennan and Handmer (2012) agree to the importance of
sharing responsibility for the reduction of hazards risks since public expectations and
demands of emergency services in Australia may be unrealistically high. In other words,
responsibility for flood risk management should be under the responsibility of the
government, private sector, and communities at risk (Box et al. 2013). Hence, it is necessary
to understand how individuals cope with risks and what strategies promote community
resilience (Boon 2014). The investigation of how individuals cope with risks is important as
it is expected that the costs caused by disasters may be exacerbated by the tendency for
populations and the built environment to continue to develop in hazard-prone areas across
the country (Natural Disasters in Australia 2004). Thus the government needs to find ways
to influence individuals’ choices through urban planning strategies (Boon 2014). However,
Boon (2014) warns that it is up to community members to decide the most suitable mitigation
strategies since they know their limitations to implement each of these actions and the roles
they can play in contributing to reducing flood risks.
Criticism to Current Resilient Strategies
Therefore, the idea of building resilient communities through the comprehensive approach
of shared responsibility is not exempt from criticisms. These criticisms are focused on the
treatment of anticipation and assessment of risks (Rogers 2011). Critiques towards the
current resilience framework lie particularly in relation to its lack funding (Wenger 2013),
which reveals the diminishing role that mitigation plays in disaster management in Australia.
Wenger (2013:34) explains that resilience funding is divided between all states and
territories, and between all natural hazards:
A disadvantage of this breadth of coverage is that limited funds are thinly spread. Australia’s flood damages (1967-2005) averaged $377 million per year and state and
43
federal reconstruction costs following the 2010-11 floods were close to $10 billion. In this context, annual allocation of $30 million by the federal government towards disaster resilience appears grossly insufficient.
Apart from lack of funding, critics also warn about the problems of attempting to build resilient
communities in Australia without carefully considering the assumptions behind the concept
of shared responsibility. According to McLennan and Handmer (2012), the idea of shared
responsibility is not new. Policy officials and risk managers have often asked these
questions: Who shares responsibility, how and for what? (McLennan and Handmer 2012).
The traditional model in Australia understands that professional emergency service
agencies, through interagency coordination, are in charge of managing hazards. However,
these answers can no longer be restricted to disaster management officials. Non-
government organizations, the private sector, and individuals at risk should also be included
in this effort to implement risk reduction strategies (McLennan and Handmer 2012).
However, even if new stakeholders are considered, the abstract idea of shared responsibility
among these new stakeholders makes their answers often too broad and ambiguous to
provide a useful guide for practice (McLennan and Handmer 2012). In addition, the concept
of shared responsibility does not encapsulate the complexity of the problem as the answer
of each stakeholder depends on their ‘underlying structures of belief, perception, and
appreciation’ (Schön and Rein 1994:23). Failing to taking into account these underlying
structures in this complex problem affect proposed solutions since these structures
determine results, information sources, and which stakeholders are accepted in the decision-
making process (Handmer and Dovers 2007).
The underlying factors affecting the decisions of stakeholders, in addition to the
investigation of vulnerability and exposure levels in communities at risk, are not the only
variables that challenge the development of resilient communities. Judgment failures and
customary land and institutional policies are also accountable to the growing complexity of
building resilience in communities at risk in Australia. Rochford (2007), for instance, states
that modern societies expect that all risks can in fact be managed. However, even societies
considered structurally protected may experience disasters because of the failure by experts
to anticipate and make the right decisions regarding risk reduction (Eburn and Dovers 2013).
Thus modern societies need to constantly review and update their risk management
practices in order to not only avoid the adverse effects of disasters but also to limit shifting
the focus from the implementation of mitigation strategies to the blame game of who should
be responsible for failing to properly manage risks (McFarlane et al. 2011). Wenger et al.
(2013) illustrate the importance of updating risk management practices by affirming that

44
many failures in the 2010–11 floods (in Queensland) were the result of human error rather
than inherently bad systems. This statement of Wenger et al. (2013) implies that had risk
management practices been reviewed the damage caused by major floods resulting from
dam water release in Queensland in 2011 could have been avoided or limited (QFCI 2012).
Finally, Wenger et al. (2013) criticize current flood practices in the country and
propose solutions based on a comparative analysis with floodplain management systems in
the U.S. and the Netherlands and the revision of the report released by the Queensland
Floods Commission of Inquiry (QFCI 2012) about the Queensland floods in 2010-2011. The
first policy recommendation that Wenger et al. (2013) suggest is that structural mitigation,
despite providing some protection in face of growing uncertainties, it cannot flood proof
settlement on floodplains and thus it needs to be complemented with non-structural
measures such as development controls and land-use practice that allow floodplain areas to
flood. Second, public authorities cannot ignore that dam operators can fail in their judgments
of risk. The solution that Wenger et al. (2013) recommend to reduce the risk of floods caused
by poor judgment is planning the construction of dams not based on past flood events, as it
happens in Australia, but focused on future flood threats, as it occurs in the Netherlands.
Third, Australia tends to have low tolerance to accidental death, including flood deaths.
Australia should have socially acceptable levels of flood deaths in its resilience strategies;
however, there has been no political debate over this topic (Wenger et al. 2013). Fourth,
Australia’s disaster review process are too detailed. These lengthy documents discourage
flood professionals to read them. Thus it is necessary to simplify these instructive documents
by including what can go wrong in case poor decisions are made and avoiding to instruct
decision making exclusively based on lessons learned. Fifth, Australia’s floodplain
management is behind the U.S. in many ways (Wenger et al. 2013). This occurs particularly
because the U.S. has adopted a 1:500 year standard, which is now widely recommended
for urban levee height and for broader application of risk reduction measures in floodplains
(Wenger et al. 2013). This standard has not yet been adopted in Australia (Wenger et al.
2013). Sixth, Australia should learn from the U.S.’s massive federal expenditure on disaster
relief, which has reduced local accountability and responsibility for planning decisions
(Wenger et al. 2013). The U.S. federal government’s National Flood Insurance Program
created perverse incentives that encouraged floodplain development (Wenger et al. 2013).
However, more recently, disaster relief and mitigation have become increasingly integrated
in the U.S., with federal funding often being conditional on the adoption of appropriate land
use controls (Wenger et al. 2013). Wenger et al. (2013) argue that this is a practice that

45
Australia should follow suit as recent Australian government expenditure on flood recovery
lacks focus and the massive proportion of flood recovery funded by the federal government
could act as a disincentive to the implementation of land use regulation and building codes
by state and local governments.
State Level
This section reviews which natural hazards affects Queensland and how the state has
approached the reduction of hazard risks. It also generally presents the role of the state
government in the large framework of disaster management in the country and what the
Queensland Floods Commission of Inquiry recommended to state’s authorities overhauling
flood policies in the state after the major flood event in 2011. The highlights of these
recommendations are in regard to the program of Property Buy Back, reinsurance of public
infrastructure, inter-departmental disagreements, and the increasing cost of insurance
premiums to householders. This section ends explaining issues arising from climate
uncertainties and the challenge that state’s authorities face to address the demands of local
councils in regard to flood mitigation. It concludes by providing evidence that individual risk
perception has not yet been considered in policy and decision making at the state level.
Review of Hazard Risks and the State’s Approach to Reducing these Risks
The state of Queensland features the greatest risk profile in Australia because of its
geography and population density (Risk Frontiers 2011). The main natural hazards
threatening the state are cyclones, floods, storms, bushfires, landslides and earthquakes
(Davies 2014). Due to this profile, improving resilience is an important and challenging task
in Queensland, particularly in regard to floodplain management (Queensland Reconstruction
Authority 2014a). Thus state authorities need to take into account this risk profile in
development projects to effectively reduce hazard risks (Queensland Reconstruction
Authority 2014a).
This particular pattern of exposure and development, in addition to the decentralised
nature of the state, makes the emergency model in Queensland different from other
jurisdictions (Arklay 2012). Arklay (2012) claims that, in Queensland, there has been a
greater emphasis on the bottom-up approach than elsewhere. Arklay (2012) posits that this
emphasis on a bottom-up communication and planning systems were, for instance, a vital
contributor to Queensland’s successful response to the major floods that affected the state
in 2011. Before further discussing the role of the state government in the 2011 Queensland

46
floods, it is necessary to understand the role that the state plays in the national disaster
management framework.
The Role of State Government in the Large Scheme of Disaster Management
The primary responsibility for disaster management in Australia falls to each state or territory
(Arklay 2012). According to the federal government, the role of state and territory
governments is ‘to coordinate the implementation of floodplain management plans in
accordance with appropriate standards’ (QFCI 2012:256). This coordination involves
providing advice to councils in the areas of planning, hydrology and emergency
management (QFCI 2012). State and territories are also expected to review their floodplain
management plans in ‘intervals of not more than ten years and after severe flood events’
(QFCI 2012:254). The main issue of conducting these reviews is the ‘significant expenses
associated with the establishment and review of floodplain management plans’ (QFCI
2012:255). It is argued, however, that the benefits of reviewing these plans outweigh the
costs (QFCI 2012).
The Recommendations of QFCI to State’s Authorities
The review of floodplain management plans was not the only recommendation made by the
Queensland Flood Commission of Inquiry in 2012. The Inquiry (QFCI 2012) also stated that
it is critical that state authorities review the flood mitigation manual of the Wivenhoe and
Somerset dams (QFCI 2012). Wivenhoe Dam accounts for about fifty percent of the total
Brisbane River catchment area and is one of the largest water storages in the state
(Wivenhow and Somerset Dams Optimisation Study 2014). As for Somerset Dam, it drains
into Wivenhoe Dam and is operated concurrently during floods to maximize the flood
mitigation benefits downstream of Wivenhoe Dam (Wivenhoe and Somerset Dams
Optimisation Study 2014). The Inquiry (QFCI 2012) also warned about the ‘popular
misconception that Wivenhoe Dam would contain all floods emanating in the upper Brisbane
River’ (QFCI 2012:39). Wenger et al. (2013) highlight that the government should address
this levee paradox since dams can give a false sense of security and encourage
development in unsafe floodplain areas. Governments and communities that fail to recognize
the risks resulting from this paradox can fall victims of higher and unexpected water levels
caused by dam release flood as witnessed in Brisbane in the summer of 2010-11 (Calligeros
2011).
47
Property Buy-Back Program
In terms of policies to reduce flood risks at the household level, property buy-back program
(QFCI 2012) is a policy that state and local governments offer to buy properties that are
frequently damaged by floods. However, the Inquiry found out that the Queensland
government does not operate a state administered buy-back program for properties located
in high-risk areas (QFCI 2012). Some councils in Queensland operate formal programs
under which they purchase privately owned properties and re-use the land for purposes other
than residential (QFCI 2012). These councils, however, depend on the state government to
determine each application’s eligibility for funding (QFCI 2012). As a result, property buy-
back programs have generally only been adopted in larger councils, and even then, only on
a small scale (QFCI 2012).
Reinsurance of Public Infrastructure
The Inquiry also made critiques to the funding of mitigation strategies in the state. Gillard
(2011) reveals that the federal government allocated the significant amount of $5.6 billion in
recovery funding to Queensland to restore public infrastructure. This amount could be
significantly lower had Queensland purchased reinsurance for its infrastructure assets. As
van den Honert and McAneney (2011) pointed out, Queensland was the only state that did
not purchase reinsurance for its infrastructure because it claimed that it was not a value-for-
money proposition. As a result, a large amount of recovery funding was sent to Queensland
in the aftermath of the major floods of 2011. The Federal Government needed to raise $1.8
billion by imposing a one-off flood levy on all Australian taxpayers with a taxable income
greater than $50,000 and who were not in receipt of a government disaster recovery payment
for a flood event (van den Honert and McAneney 2011). The Queensland government,
however, argues that it should actually receive larger funds from the federal government to
recover its infrastructure assets since it has contributed more than three times that of the
Commonwealth to the Natural Disaster Relief and Recovery Arrangements considering the
revenue received by the Commonwealth from the different levels of government in the state
(Moore 2014a).
Inter-Departmental Disagreements
Another point stressed by the Inquiry (QFCI 2012) was that the Department of Local
Government and Planning (DLGP) in Queensland routinely disregarded recommendations
proposed by the Department of Community Safety (DCS) (QFCI 2012) before the 2011

48
disaster. The DCS warned DLGP that the state was not complying with the State Planning
Policy 1/03 (SPP1/03) (QFCI 2012). The SPP is the most important state planning instrument
for flood risk assessments in Queensland (Wenger 2013). The SPP makes requirements on
flood mapping and nomination of a defined flood event in the state (QFCI 2012). The decision
of DLGP to disregard warnings from DCS raised serious questions about administrative
procedures and accountability measures in the state (Wenger 2013).
A possible reason for DLGP ignoring these warnings could be the years of drought
before the 2011 disaster. This long period of drought might have influenced the rigor in flood
planning, particularly in relation to disaster response, dam management or land use (QFCI
2012). As the report by the Inquiry stated: complacency about flood prevailed, at least in
parts of the state, over many years (QFCI 2012). Another critique to land use policies in
Queensland is that the provision of cheap and risky residential sites to disadvantaged groups
increased their long-term vulnerability (QFCI 2012). This practice of providing risky areas to
disadvantage groups is not consistent with the community resilience approach promoted at
the national level.
Climate Uncertainty
The Inquiry also expressed concern about the risk that the recommendations made could be
taken up in the short term but forgotten in the long term, especially in the absence of major
floods in the next years (QFCI 2012). This poses a serious problem to the management of
disasters in the state, as some parts of Queensland will experience floods of a magnitude as
great as, or greater than, those of the 2010-2011 disaster (QFCI 2012). Also, existing science
cannot predict when these major floods will happen, or how severe they will be (QFCI 2012).
In addition, uncertainties surrounding climate change are much greater than other
uncertainties in flood studies (QFCI 2012). Thus it is important that land planning systems
accommodate circumstances where the risk of flooding is unknown (QFCI 2012).
The Increasing Cost of Premiums and Flood Mitigation
Another issue at the state level is that householders living in floodplain areas complain about
the increased flood insurance premiums they need to pay despite structural mitigation in
place. The increasing cost of premiums is an issue that the Inquiry (QFCI 2012) and
researchers did not investigate in the state; however, this issue is of great concern for the
communities living in high-risk areas since higher premiums, particularly after major floods,
have significant impact on household finances. Aware of the challenges imposed by higher

49
premiums to communities at risk, the state premier, for instance, wants to bring insurance
premiums down through flood mitigation in Bundaberg, a council in Queensland flooded
twice in the last three years (ABC 2014).
In addition, the state government received nearly two hundred applications on flood
mitigation by councils totaling $574 million (Davies 2014). Mitigation projects listed by
councils are related to flood mapping, flood monitoring cameras, storm water upgrades,
better drainage solution and levees. However, not all the projects can secure funding since
only the projects that meet a set of criteria become eligible to receive this funding from the
state (Davies 2014).
The Role of Individual Risk Perception in Informing Policy Making in Queensland
This policy review shows that the state policy framework does not make explicit references
to the role that individuals play in providing inputs to mitigation strategies. Even when they
do so, it is not clear whether these inputs are seriously considered. For instance, the state
and the Brisbane City Council claim that they have sought community input for floodplain
development projects. The state and local governments argue that they have invited
community members to participate in decision-making processes on a number of occasions
such as the development of a local transport system in a high-risk flood prone area
(Yeerongpilly Transit Oriented Development 2014). However, state authorities are not clear
in their reports about the return rate of the one thousand five hundred newsletters delivered
in regard to the development of this transport system, the effective participation of community
members in the achievement of key milestones, and how community inputs actually
influenced the outcome of these meetings.
Council Level
The last section of this chapter provides a quick overview of the history of flooding in
Brisbane. It then highlights the events leading to the 2011 major flood event in the city and
the legal disputes following it. This final section concludes presenting local strategies to
mitigate flood risks, QFCI’s criticisms to how the City Council has been addressing these
risks and reinforces the understanding that individual risk perception has not yet been
included in strategic decision making process when it comes to reducing risk of communities
living in flood-prone areas.
50
The History of Flooding in Brisbane
The Brisbane city has been affected by major river floods such as the ones in 1893, 1974
and 2011. There has also been flooding in creeks, waterways and overland flowpaths due
to intense shorter duration rainfall (Brisbane City Council 2014). The 1974 disaster was a
defining event for residents as it resulted in the construction of the Wivenhoe Dam in 1984
(Bohensky and Leitch 2014). With the construction of this dam, residents were led to believe
that the city was flood proofed (Pittock 2011). Thus, in the decades following this event, the
urban footprint of Brisbane quickly spread due to increasing wealth, rapid population growth
and urban development (Bohensky and Leitch 2014). This urban growth also resulted in
significant development around waterways and floodplains (Bohensky and Leitch 2014).
Before and After the 2011 Major Flood Event
Then in early 2000s a long period of drought almost emptied the Wivenhoe Dam. This
challenging conditions shifted the focus of the Wivenhoe Dam from flood mitigation to water
security (Hayes and Goonetilleke 2012). However, extreme weather conditions in late 2010
through January 2011 resulted in two major flood events. The first event was a flash flood,
described by Queensland Premier as an inland tsunami, that affected the city of Toowoomba
and then further downstream in the rural Lockyer Valley (Bohensky and Leitch 2014). The
second event was of downstream cities of Ipswich and Brisbane. In this event the flood
peaked at 4.46 m (a new record since 1974), affecting 14,100 properties including the
inundation of 1,203 houses and 2,436 businesses (QFCI 2011). Public and private river
infrastructure was severely affected (Bohensky and Leitch 2014). This event became known
as the 2011 Brisbane flood and turned out as the most expensive natural disaster in
Australia’s history (van den Honert and McAneney 2011; QFCI 2012).
Responsibility for the losses caused by 2011 disaster has been the object of judicial
debates between flooded affected residents and the state and local governments (Remeikis
2014). In this discussion over the responsibility for disaster-related losses, the local
government, according to the federal and state frameworks, plays a key role in reducing the
risks of major floods since the enactment of mitigation strategies depends on local
government support (QFCI 2012). The specific roles that the local government plays, in
coordination with states and territories, are in regard to ensuring all requisite local disaster
planning and preparedness measures are undertaken before a disaster occurs (Australian
Government 2004).
51
Council’s Strategies to Reduce Flood Risks
The Brisbane City Council has specific policies that aims to showcase its responsibility for
floodplain management. The FloodSmart Future Strategy 2012-2031 is the over-arching
strategy guiding policies which aim to address the challenges imposed by increased
development and climate change. This strategy delivers coordinated integration of floodplain
management tools (Brisbane City Council 2014). It aims to ensure i) water availability; ii)
waterway health; and iii) improve the liveability of the city (Brisbane City Council 2014).
However, in order to seize these opportunities, the council needs to strengthen collaboration
efforts with all levels of government, non-governmental organizations, businesses and
residents (Brisbane City Council 2014).
Under this strategy, the council has implemented some policies. These policies are
about stormwater maintenance and new infrastructure, the completion of flood studies and
creek models, early warning alert systems, improved availability and access to flood
information and a program to install backflow prevention devices across a number of
stormwater systems that assist with managing water on the ground (Brisbane City Council
2014). However, in terms of flood studies, these policies are not exempt from criticisms.
These criticisms are found at the institutional level of risk perception and how competing
perceptions end up influencing decision making10.
The Criticisms of QFCI to Local Flood Risk Reduction Strategies
Criticisms to Brisbane’s flood risk reduction strategies were not only in terms of risk
perception and decision making. The Queensland Flood Commission of Inquiry (2012) made
severe critiques to existing mitigation policies at the local level. In terms of funding, the
10 Two months before the striking of the disaster in 2011, the mayor warned residents about flood risks and asked them to not be complacent about emerging threats. ‘People shouldn’t be complacent. This is a flood-prone city’ and ‘no amount of engineering work ... will ultimately deal with the fact that Brisbane will flood again one day’ (Calligeros 2010). This warning was backed up by a meteorologist who confirmed that the type of the 1974 flooding magnitude ‘in the coming months is not out of question’ (Hurst 2010). The warning tone of this message, however, was softened by the authorities operating the Wivenhoe dam, who agreed that the rainfall seen in 1974 was possible but that mitigation measures have improved since then (Hurst 2010). These authorities wanted to reassure the population amidst growing flooding concerns that the Wivenhoe dam effectively worked as a flood mitigation and water storage structure. A water authority asked people living downstream the Brisbane River that they needed to be confident in the measures designed to reduce downstream flooding impacts (Hurst 2010). In addition, the leader of the opposition disagreed on the decision to release water from the Wivenhoe dam in favour of flood mitigation arguing that the government learned nothing from the water crisis and past drought (Hurst 2010). Thus it is important to question to what extent the reassuring message delivered by water authorities and the political controversy over dam water release had any implication in flood risk perceptions and decisions made by authorities and residents living downstream in the months leading to the disaster.

52
Brisbane City Council, along with other local governments, claims that they ‘do not have
sufficient resources to undertake flood studies themselves’ (QFCI 2012:220). However, the
Inquiry (QFCI 2012) highlights that the Brisbane City Council, as Queensland’s (and
Australia’s) largest local government, has substantial resources and staff with expertise in
the technical disciplines necessary to conduct effective floodplain management. In addition,
some councils have received substantial assistance from both state and federal
governments (QFCI 2012).
The Inquiry’s report also expressed concern towards the Voluntary Buy Back
Program. The main critique of the Inquiry regarding this program was around the criteria
applied by the council (QFCI 2012). The eligibility criterion is that a property need to be
flooded with an average recurrence interval of two years (QFCI 2012). However, according
to this criterion, many properties were ruled out despite being flooded frequently (QFCI
2012). The Inquiry then, based on an independent review panel, suggested the council to
consider an extension of the scheme to cover less frequent flooding (QFCI 2012). The Inquiry
admitted that this extension would mean a very substantial increase in the program’s funding
(QFCI 2012). In this regard, the council pointed out that it had sought funding from the state
and federal governments to support the program but the requests had either been rejected
or ignored (QFCI 2012). Finally, the Inquiry’s report concluded, according to submissions
received, that residents considered this program to be very important but too slow and
inadequately funded to support those that are eligible to join the program, and want to sell
their properties and move elsewhere (QFCI 2012).
Critics of flood risk reduction strategies in Brisbane also looked into how land use
planning contributed to the major floods of 2011. van den Honert and McAneney (2011),
after reviewing the causes of the disaster, affirmed that poor land-use planning decisions left
some homeowners in locations designated as high risk. Development in the low-lying areas
along the lower Brisbane River happened despite the city’s history of severe flooding, which
resulted in large concentrations of properties exposed. van den Honert and McAneney
(2011) also criticized the practices of post-event handouts by the government. According to
them, this practice encourages flood victims to rebuild in the same way and in the same
location (van den Honert and McAneney 2011). They argue that these handouts do not
encourage risk-reducing behaviour. In addition, Hayes and Goonetilleke (2012) argued that
the time lapse of over thirty five years since the last event resulted in a significant reduction
of the corporate and collective knowledge with respect to the 2011 disaster.

53
The Inquiry also identified that many victims of 2011 floods had problems with the
settlement of insurance claims (QFCI 2012). This issue became an ongoing source of
frustration for policyholders and insurance companies. Despite this problem not being
directly caused by the council’s decisions, it would be appropriate if local authorities could
elaborate a plan that helps residents and insurers to determine its coverage correctly and
identify spurious insurance claims that have delayed the settling of genuine claims (QFCI
2012). Insurers, however, claim that regulations also need to observe that insurance firms
need to keep rates adequate so that they have the capacity to pay losses in the event of
large risks (Blazey and Govind 2007). Mills (2009) agrees with the importance of keeping
insurance firms solvent but stresses that insurers also need to demonstrate that there will be
an offsetting reduction in the cost of premiums by providing policyholders financial incentives
that encourage them to undertake further protective actions.
This policy review on how the Brisbane City Council has been reducing flood risk
showed that the council has in place several structural initiatives to reduce flood risks to
communities at risk. However, the main finding of this review is the absence of how individual
risk perceptions shape these policies and how the decisions of these at-risk individuals can
help the council reduce residual flood risks based on the federal guideline of shared
responsibility for flood risk mitigation. This absence indicates that the Brisbane City Council
has not yet tapped into the potential on counting on protective actions taken at the household
level to effectively reduce residual flood risks from major flood events.
Conclusion
This review showed that risk mitigation is a government strategy that is economically sound
since it is cheaper, in the long term, than response and recovery activities. Risk mitigation
strategies also save lives. However, in order to be effectively implemented, risk mitigation
strategies need to focus primarily on the most vulnerable segments of a population since
these are the individuals facing the greatest challenges to take protective actions and are
more likely to suffer the most from the effects of a major hazard.
It was also revealed that public authorities have not yet included individual risk
perception and household protective actions in its flood mitigation strategies11. This ‘shared
responsibility’ effort to build resilient communities through individual risk perceptions and
11 It is worth remembering that conducting a thorough investigation over the reasons why officials have not yet implemented its ‘shared responsibility’ policy considering individual risk perceptions is beyond the scope of this project. However, considering the importance of this qualitative investigation with policymakers, a recommendation for future research in this regard is made at the end of this thesis.
54
household responsibility for reducing residual risks is overshadowed by the debate about
which level of government holds the responsibility and have the adequate means to
effectively reduce major flood risks. The federal government is in charge of providing
guidelines and distributing funding. The state and territory governments are the entities
responsible for enforcing national guidelines and distributing funding to local governments.
Local governments are expected to design policies that match the characteristics of their
populations and meet the particularities of their land use planning and hazard risks. This
review provided enough evidence that mitigation policies discussed at multi-level
government are still dominated by a top-down and structural approach to flood risk reduction
and not yet informed by individual risk perceptions.
This review, however, did not collect evidence to argue that this top-down and
structural approach is detrimental to building resilient communities. Top-down policies and
structural mitigation do play important roles to reduce the main risks caused by major floods.
Funding from the federal government to build structural measures reduce major flood risks.
Moreover, growing uncertainty around the frequency, likelihood, magnitude, and severity of
major floods requires that governments at different levels to become actively engaged in
activities that reduce these uncertainties. Thus, coordinated efforts to reduce the main risks
related to major floods is necessary. Nonetheless, this review showed that in the context of
this coordinated effort, the construction of resilient communities based on inputs from
individual risk perception and protective actions at the household level are nearly nonexistent
across government levels in Australia, particularly at the state and local levels.
55
Chapter 3: Risk Perception and Decision Making under Uncertainty
Introduction
The first part of this literature review introduced the concepts of risk mitigation and shared
responsibility and presented their opportunities and challenges in the Australian context from
a government standpoint. This second part of the literature review focuses on the core of
this thesis by presenting the concepts of risk perception and decision making. This chapter
aims to answer the following question: What are the challenges to measure individual risk
perception and decision making under uncertainty? To answer this question accordingly, this
chapter reviews the literature describing the different factors comprising risk perception and
decision making and also the challenges to empirically measure these concepts. This review
is important because it showcases the difficulties that researchers face in attempting to
model individual decision-making processes based on risk perception. It is also justified by
the necessity to provide some context to the independent variables that were considered in
the theoretical framework introduced in the following chapter (chapter four: ‘Protection
Motivation Theory’).
Risk Perception Variables
The first section of this chapter presents the general relationships between risk perception
and protective actions. It then highlights a shift in the development of this field and narrows
down the topic to floodplain management. In this context, socio-economic, in addition to
cognitive and subjective12, factors measuring risk perception are introduced. It concludes
stating stressing the role that the Protection Motivation Theory has played in terms of
measuring individual risk perception.
General Relationships between Risk Perception and Protective Action
The study of protective actions relies upon assessments of how individuals perceive risk
(Frattini and Crosta 2006; Haynes et al. 2008; Slovic et al. 1987). Individual risk perceptions
are often explained by hazard-related phenomena. Bird, for example, reminds us that ‘it is
generally assumed that high risk perception (of a hazard) will lead to personal protective
actions’ (2009:1063). However, Bird also highlights that the relationship between hazard
risks and protective actions ‘depends on many contextual factors’ (2009:1063). In an earlier
work, White (1945) studied contextual factors influencing the decision of individuals at risk
12 Cognitive and subjective variables included in the models of this study are the ones found to be more prevalent in previous studies investigating the challenges that individuals at risk face to reduce their flood risks.

56
to take protective actions. In his pioneering dissertation, White investigated how humans
make adjustments to low-probability high-impact disasters. These are said to be strongly
determined by location and risk perception. Individuals located farther from risk sources tend
to have low-risk perception and as a result are less likely to adjust to threats whereas
individuals living closer to hazard sources are more willing to make these adjustments. These
relationships established the dominant paradigm in the studies of disaster risk reduction in
this area (Burton 1993; Kates 1971). This perception-adjustment paradigm had a strong
influence until the 1990s when the United Nations established the International Decade for
Natural Disaster Reduction and a new paradigm of risk perception evolved.
The Growing Complexity of Measuring Risk Perception
In the 1990s, social scientists once again acknowledged the importance of investigating risk
perception to understand human adjustments to major hazards (Sjöberg 2000). However, it
was understood that hazard adjustments, or responses, could no longer consider only the
perception of hazard risks, or the scientific information or physical impacts resulting from
major hazards (Burns et al. 1993). Instead, researchers argued that the perception-
adjustment paradigm should be expanded to adequately address the complex questions
emerging from the relations between hazard risk and human adjustment. Thus risk and crisis
scholars started considering psychological, social, cultural, institutional, and political
processes (Burns et al. 1993) in their investigations of how risk perception shapes decision
making (Ronan and Johnston 2005). Wachinger et al. (2012) have summarised some of
these contextual factors affecting decision making under uncertainty as disaster experience,
trust in authorities, perceived capacity to reduce residual risks and perceived responsibility
over the undertaking of mitigation measures.
Risk Perception in the Context of Floodplain Management
A similar shift in paradigm was also observed in studies of floodplain management. The
traditional approach to floodplain management was flood resistance. The objective of flood
resistance strategies was to reduce the likelihood and impacts of major floods through
structural and non-structural measures (Haque and Burton 2005). However, uncertainty
around major floods increased because flooding causing extensive damage and loss of lives
continued happening (Haque and Burton 2005). Thus, modern floodplain management
practices started to count on the support of individuals at risk to reduce the impact of residual
risks. However, implementing this new strategy required the government to elaborate
policies that persuade individuals to take protective actions. And the first step to design

57
effective policies that persuade individuals to take protective actions is understanding the
complexity of the relations between risk perception and decision making (Wachinger et al.
2012). Several empirical studies thus emerged about how to measure risk perceptions in
ways which could enhance shared responsibility.
Measuring Risk Perception with Socio-Economic Indicators
A number of studies have been conducted into the ways in which possible relationships
between individual risk perception and decision making can be measured (see, for example,
Bubeck et al. 2013; Grothmann and Reusswig 2006; Poussin et al. 2014; Zaalberg et al.
2009). The type and number of variables vary in these studies. Socio-economic and
demographic factors are often included in models because they provide insights into the
vulnerability levels of the population at risk. The assumption behind heterogeneity factors is
that socio-economic factors play an important role in explaining who takes protective actions.
In one study, for example, Olofsson and Öhman (2015) found that heterogeneity factors
provide important clues to understanding the relations between risk perception and risk
behaviour. Their conclusion was that ‘different groups do indeed perceive and act differently
according to the kind of risk in question’ (2015:14). The heterogeneity factors that Olofsson
and Öhman (2015) considered in their study were gender, age, country of birth, disability
and sexual orientation.
Confirming this broad statement, Beringer (2000) identified several correlations
between demographic and socio-economic factors while studying risk perception and
decision making. The main socio-economic indicator that Beringer (2000) investigated was
education. Several other studies have included heterogeneity variables in their models
(Chen et al. 2012; Hoop and Ruben 2010; Kim et al. 2007; Matsaganis et al. 2010; Kim et
al. 2007; Winchester 2000). These have also identified significant and important correlations.
Tierney (2006:121), for instance, after reviewing lessons from disasters in the U.S., found
that social inequality plays a key role in defining the levels of vulnerability and resilience in a
community. However, the significance, number, and strength of statistical associations have
been quite different in various empirical studies, which has prompted Bushnell and Cottrell
to state that the ‘resultant effect (of demographic and socio-economic variables) is largely
unpredictable’ (2007:13) when explaining or predicting the safety decisions made by
individuals in risky areas. In addition, Lindell and Perry (2000:469) have pointed out that
most studies found significant correlations between heterogeneity variables and decision
making but the explanatory power of these correlations were too small for researchers to

58
categorically affirm that demographic and socio-economic factors are strong determinants of
protective actions.
Other factors tested in studies investigating risk perceptions are: location, housing
tenure, and education13. Householders living closer to sources of major floods are more likely
to perceive the need to take protective actions. Bočkarjova et al. (2009:10) confirmed this
hypothesis after conducting a large-scale survey with householders living in high-risk areas
in the Netherlands in 2008. One of their main findings was also that ‘place of residence acted
as a major determinant of disparities in all perception indicators’ (Bočkarjova et al. 2009:10).
Location, however, was not a strong explanatory factor in the investigation of every type of
hazard. In studies investigating behaviour change among householders living in areas prone
to earthquakes, Lindell and Whitney (2000) stated that location is a variable that is difficult
to interpret. This finding warns researchers that they should be careful about concluding that
the location of a household determines protective actions. In terms of housing tenure, it is
believed that newcomers are more likely to take risks in comparison with long-term residents.
Cortner et al. (1990) confirmed this correlation after finding out that low-awareness levels
among newcomers determined the purchase of homes in risky areas. As for disaster
education programs, these programs are expected to revert low-awareness levels. However,
the effectiveness of educational programs were not consistent, as Rohrmann and Renn
(2000) and Anderson-Berry (2003) highlighted. Nonetheless, disaster education programs
can be stronger predictors of protective actions, particularly if householders participating in
these programs had experienced a disaster before (Lindell and Perry 2000; Mileti and
Darlington 1997; Mileti and Fitzpatrick 1992; Paton 2003). Thus the different factors
measuring risk perception do not yield the same results across studies. An important reason
for that is that the nature of a hazard (probability, frequency, magnitude and severity)
influences individual risk perceptions.
13 Religion is an important variable in shaping risk perception. However, as Gaillard and Texier (2010) highlight, there has been lack of academic interest in the relations between religion and disasters. Researchers may avoid asking about religious beliefs for fear of sounding confronting when collecting personal data (Ehman et al. 1999). Despite that, Wisner (2004) emphasizes the role of religion and spirituality not only in regard to shaping risk perception but also reducing hazard risks. Thus this thesis asked in the survey (question 20 on page 198) whether participants believe that their ‘religious beliefs protect them and their property’ in case of a major flood event. Data on this particular heuristics, however, was not included in this dissertation because the number of independent variables needed to be reduced to avoid overfitting and lack of variability in this particular group (nearly 80% of respondents said that their religious belief had nothing to do with their decisions to take protective action whereas less than one percent actually said that their religious beliefs affect their decision to take a particular protective action) would not contribute to explaining and predicting overall protective actions. This variable, however, is indeed relevant, hence included in the survey, and it will be used in future statistical analyses coming out of this dataset.
59
Measuring Risk Perception with Cognitive and Subjective Variables
Studies on risk perception also often include cognitive or subjective variables in their models.
Cognitive variables are the ones related to the mental processes that affect how an individual
perceives risks. The measurement of risk aversion, for instance, is positively correlated to
the take out of flood insurance (Petrolia et al. 2013). The higher is aversion to risks, the more
likely that a householder will take protective actions. Plattner (2004), however, preferred
investigating decision making through risk acceptability. There were not conclusive results
from Plattner’s study apart from the fact that models measuring risk acceptability should
improve to accurately understand the significance and strength of this mental state in
decision making. Risk denial is another psychological state investigated by researchers.
Bushnell and Cottrell (2007), for example, have argued that risk denial is one of the mental
strategies that individuals at risk use to justify their decisions to not take protective actions.
Individuals that are more likely to deny the risks associated with a hazard are more likely to
not take protective actions. Another type of risk measured is dread risk. Dread risk is
correlated to the trust that householders place on authorities to control threats (Bushnell and
Cottrell 2007). Lower dread levels caused by higher trust on government strategies to
suppress threats result in individuals becoming less likely to take protective actions (Bushnell
and Cottrell 2007). Finally, Rundmo and Moen (2007) measured risk sensitivity and risk
tolerance. Rundmo and Moen (2007) found out that risk sensitivity and risk tolerance were
significant predictors of protective actions. That is, the more sensitive an individual was to a
risk, the more likely that this individual would take safety actions. But the higher risk tolerance
an individual had to a risk, the less likely this individual would take a protective action. It is
important to note that all these cognitive aspects of decision making influence to some extent
the level of worry towards a hazard. Research measuring worry as a predictor of decision
making, however, found out that a broad definition and understanding of worry over the
impacts of hazards have less influence on decision making than questions that accurately
define and determine the level of worry to a certain hazard (Rundmo and Moen 2007;
Bočkarjova et al. 2009).
As for subjective variables such as trust, they also play an important role in shaping
risk perception. Trust in government’s mitigation measures, for instance, are consistently
included in studies investigating individual decision making (Angignard et al. 2014; Calvello
et al. 2015; Greiving et al. 2014; Kabra and Khator 2001; Kundak et al. 2014). Most of these
studies found that trust on public authorities dealing with hazard risks is significantly
correlated to the decision of individuals at risk to take protective actions. When an individual

60
understands that the government is taking the right measures to reduce the impact of
residual risks, this individual is less likely to take protective actions. However, the correlation
between trust on the government and individual decision making is not always
straightforward. Trust on government was found to be a mediating variable explaining the
correlations between other independent variables and protective actions. Trust must be
interpreted in association with other correlations as it serves either to confirm or expand the
understanding of other significant relationships. Bočkarjova et al. (2009), for instance,
identified that trust on government is higher among older, more educated, and higher income
individuals.
Additional Variables Used to Measure Risk Perception
Other variables included in risk models are: willingness to pay, heuristics, time since a
disaster occurred, perceived probabilities, perceived consequences, and social networks.
Kundak et al. (2014) found out that individuals that agree to pay more for safety are more
likely to take protective actions. Kahneman and Tversky (1979) alerted to the role that
heuristics, or rules of thumb, play in the intuition of individuals at risk to take protective
actions or not. Intuition can make individuals see patterns in the frequency of hazards that
are not scientifically correct or decide to not relocate to a safer area as little damaged was
experienced in the last disaster. Clarke and Short (1993) warned to the strong influence that
experience play on decision making. Individuals who had never experienced a disaster or
had experienced a disaster a long time ago were more likely to discount the importance of
undertaking protective actions; particularly if during this time the government provided
structural mitigation measures framed by authorities and perceived by individuals as
effective to reduce future threats. As for perceived probability and severity, Reynaud et al.
(2013) and Proske (2004) understood that protective actions were defined by how
householders perceived the probability of a hazard striking but, more importantly, by how
these householders perceived the likely consequences of a potential disaster to their
property. Finally, Russell et al. (1995) believed that individual decision making also depends
on the social networks of the individual at risk. If an individual at risk knew someone who had
been injured in a disaster, this individual would be more likely to take protective actions.
The Development of the Protection Motivation Theory
Thus there have been many types of cognitive and subjective variables included in empirical
studies investigating risk perception. Many of these studies tested theories largely used in
the realm of public health. An important theory from this field that has contributed to the

61
literature of crisis and risk management is the Protection Motivation Theory. Expanded
behaviour models based on PMT have been constantly evolving in an academic effort to
understand how individuals at risk can help the government reduce residual risks by taking
protective actions. The first step in this process is the investigation of how these individuals
perceive risks so that crisis researchers can continue in their attempts to understand the role
that risk perception plays in decision making under uncertainty (Renner et al. 2008).
The Challenges of Measuring Risk Perception
The second section of this chapter discusses the challenges of measuring risk perception.
To start off, it shows how the measurement of risk perception changed over time. It then
stresses the impact that bounded rationality has had on perceiving and measuring risks.
Thus this section introduces cognitive biases that are often present in risk perception and
explains the differences of fear-related and knowledge-related factors. The section
concludes acknowledging the complex task that is measuring how individuals perceive risks.
Initial Discussion on Measuring Risk Perception
After identifying the variables that contribute to measuring risk perception, it is now time to
discuss how to measure risk perception. However, this is not a simple task to undertake
because of ‘the sheer complexity of risk as a social phenomenon’ (Olofsson and Öhman
2015:16) and the subjective traits of vulnerability assessments (Bushnell and Cottrell 2007).
Therefore, the measurement of individual risk perception requires the construction of
complex models that can identify patterns between variables of different nature and the
interdependence of the values (Olofsson and Öhman 2015).
Models designed to measure risk perception are contextual and value-based
(Olofsson and Öhman 2015). They are context-specific as the values they analyse represent
the population of a particular locality. The uniqueness of each model needs to be highlighted
because of the issue it can generate if results are scrutinized without considering particular
conditions and circumstances of the target population. For example, the presence of building
codes and regulations affect the risk perception of a population since institutional
arrangements influence how people think about and respond to risk (Winter and Fried 2000).
Also, householders that built their houses under specific safety regulations were more aware
of a certain risk because their attention was drawn to the issue (Gilbert 2004). Moreover, risk
perceptions change over time. Renner et al. (2008), for example, identified that perceived
risk and its impacts on motivational behaviour change varies greatly across a lifespan.
Younger people usually perceive themselves as less vulnerable to threats whereas older
62
adults are more likely to take protective actions (Renner et al. 2000, 2007; Schwarzer and
Renner 2000).
Risk Perception Shifts over Time
Changes in risk perception over time can also be explained by other factors. Memory affects
the way individuals perceive the probability of a threat. Bushnell and Cottrell (2007:220)
stressed that as time passed since a disaster happened, and people recovered from their
losses returning to their daily routine, the memory tends to fade and other issues begin to
take priority. Bočkarjova et al. (2009) also noticed the issue of memory among populations
living in high-risk flood areas. Since decades passed after the last event and structural
mitigation was built to prevent other disasters from causing extensive destruction, ‘potential
flood consequences seemed to be forgotten’ by householders living in high-risk areas
(Bočkarjova et al. 2009:3). This illustrates how technical solutions influence disaster
memories, ‘driving away the attention from the potential consequences of a flood’
(Bočkarjova et al. 2009:3). Another factor affecting disaster memories is lifestyle. McCaffrey
(2004) highlighted that people lead busy and complicated lives. Thus, McCaffrey (2004)
complements, the considerations of disasters tend to have low salience compared to other
concerns. However, even if people consider disaster risks in their busy lives, they would
rather take protective actions that are simple to undertake and require little time, effort, and
cost to be implemented (McCaffrey 2004).
Bounded Rationality
The challenge of measuring risk perception is also posed by the question of whether
individuals at risk can cognitively perceive and assess the many risks comprising an
uncertain scenario. Scholars interested in decision making pointed out that the investigation
of risk perception is challenging because of bounded rationality (Miller 1956; Simon 1957,
1991). That is, individuals have difficulties to rationale long-term risks and many variables at
the same time (Kahneman and Tversky 1973; Slovic et al. 1974, 1977). Bounded rationality
influences not only individuals’ risk perception but also probabilistic decisions and the level
of attention individuals give to protective actions (Floyd et al. 2000; Rogers and Prentice-
Dunn 1997). Levee syndrome and dissonant risk perception are examples of bounded
judgments trying to balance risk and safety. Ronan and Johnston explained that levee
syndrome occurs when a structural mitigation measure leads individuals living in a risky area
to assume that ‘risk had been eliminated’ (2005:31). As for dissonant risk perception, it is the
perception that disasters are a coincidence or that new disasters are less likely to happen
63
because communities at risk believe they have the economic resources to protect against
residual risks or had already taken the necessary measures to reduce these risks (Kaiser et
al. 2004).
Cognitive Biases
As bounded rationality shows, threats are not always perceived realistically. Cognitive biases
underlie these unrealistic perceptions14. One of them is the normalcy bias. Individuals that
experienced a disaster but believed that they were not significantly affected are more likely
to believe that they will not be greatly affected in a future disaster, which makes them assume
that they are also prepared to deal with future disasters (Odgers and Rhodes 2002; Ronan
and Johnston 2005). Normalcy bias in turn is influenced by optimistic bias. Optimistic
individuals underestimate the risks of disasters and overestimate their abilities to reduce
hazard risks (Johnston et al. 1999; Kumagai et al. 2004). This overconfidence on one’s
abilities result in increasing levels of exposure among communities at risk (Bushnell and
Cottrell 2007). Another bias that challenges the measurement of risk perception is fatalism.
Fatalistic views of disasters occur when individuals at risk believe that there is nothing they
can do to reduce their residual risks. This fatalistic view of disasters is also known as social
amplification of risk (Kasperson et al. 1988 cited in Ronan and Johnston 2005). Risk
amplification happens because individuals are influenced by the media that, in turn, can yield
public hysteria (Rip 1988).
Differences between Fear-related and Knowledge-related Factors
Therefore, the measurement of risk perception needs to take into account ‘the complexity of
individual and social mechanisms’ (Coppola 2007:162). Siedschlag et al. (2012:7) highlight
that
Humans usually do not fear statistically highly ranked threats to life and health (such as car accidents, food poisoning, cancer and others) whereas they are disproportionately wary of spectacular hazards, even if related vulnerabilities are low.
To address this contradiction accordingly, Coppola (2007:164-166) argues that it is
necessary to make a ‘distinction between fear-related and knowledge-related factors’. Fear-
related factors, or uncontrollable risks, are those risks causing pain and death whereas
knowledge-related factors, or controllable risks, are usually less feared than uncontrollable
14 This paragraph on bounded rationality and cognitive biases serves as a brief explanation about how risk perception relates with cognitive biases. This idea will be expanded further in the next section of this literature review dealing exclusively with decision making under uncertainty.

64
risks. Ronan and Johnston agreed with Coppola by stating that the investigation of the
reasons that motivate people to change behaviour depends on ‘emotional and cognitive
processes’ (2005:32). It is the interdependence between emotional and cognitive variables
that dictate how people perceive risks and take actions to reduce these risks. This
understanding of complexity of risk perception based on the interactions between individual
and social mechanisms is not restricted to the studies of Coppola (2007) and Ronan and
Johnston (2005).15
The Complexity of Measuring Individual Risk Perception
Douglas and Wildavsky (1982) had stressed the importance of studying risk perception and
behaviour change as a social-cultural phenomenon. Slovic agreed with Douglas and
Wildavsky (1982) and thus investigated risk perception employing a ‘psychophysical scaling
and multivariate analysis techniques to produce quantitative representations or cognitive
maps of risk attitudes and perceptions’ among individuals at risk (2000:222). In addition,
Renn et al. stress that psychological studies disregarding complexity, or the analysis of
‘social and cultural variance of risk interpretations’, cannot ‘explain why individuals attend to
certain characteristics of risks and ignore others’ (1992:138). Angignard et al. (2014)
illustrate the importance of considering socio-cultural milieu since it is this cultural risk
paradigm or interconnections between the different factors that determine how a risk is
perceived and evaluated. In terms of policy making, the risk for public authorities ignoring
the complex aspects of risk perception is designing well-intended policies that turn out being
ineffective (Slovic et al. 1987).
In summary, this literature review on risk perception stressed the complexity of
identifying the key variables comprising a model and the challenges to accurately measure
them. The next section explores the concept of decision making.
Decision Making Under Uncertainty
Scholars supporting optimization models emphasize that individuals at risk cannot perceive
long-term risks accurately and as a result make decisions relying on few rules of thumb, or
heuristics, which end up influencing their exposure to major hazards. As a way to help
individuals make better predictions and judgments under uncertainty, these scholars suggest
that individuals be trained to apply the concept of regression, ‘or the calculus of chance’
15 In the next section of this literature review, which covers decision making under uncertainty, the relationship between emotions and decisions will be further elaborated.
65
(Kahneman and Tversky 1973:237), in their decision-making processes (Slovic and
Fischhoff 1977). The expectation is that by applying regression in decision making it will
reduce the number of heuristics leading to ‘severe and systematic errors’ (Kahneman and
Tversky 1973:237) in decision making. In opposition to optimization models, there is a strand
of scholars that argue that the use of heuristics does not necessarily mean that pieces of
information guiding decisions under uncertain scenarios are less efficient than the ones
produced by regression analysis. These scholars, following the precepts of ecological
rationality, which will be explained later in this section, argue that the intuition of individuals
at risk can be framed as rational and effective as any other type of decision-making process.
Optimization Models in Decision Making
Regressions, through the examination of statistical relations, help individuals make
decisions under uncertainty. However, despite all the benefits that statistical thinking add to
the study of decision making, one cannot expect that regression analysis will provide every
answer about why individuals at risk not always take protective actions. Kahneman and
Tversky argue that ‘statistical training alone does not change fundamental intuitions about
uncertainty’ (1973:251). Kahneman and Tversky (1973) made this statement after observing
that otherwise intelligent people have little or no intuitive understanding of the concept of
regression. People in general ‘fail to expect regression in many situations when it is bound
to occur’ (Slovic and Fischhoff 1977:13). Because people cannot estimate relationships
among variables by regressing prediction towards a central value, ‘they typically invent
complex but spurious explanations’ (Slovic and Fischhoff 1977:13).
Other researchers posit that the difficulty to adopt statistical thinking in decision
making has more to do with innate characteristics of human beings. Sinsheimer (1971)
claims that human brain has evolved in a sense that it can deal with immediate problems but
we have not yet evolved an intellect capable of dealing conceptually with uncertainty. We
are trial-and-error learners ‘who ignore uncertainty and rely predominantly on habit or simple
deterministic rules’ (Slovic and Fischhoff 1977:18). Slovic and Fischhoff (1977) are not very
hopeful that humans can correct their mental errors in dealing with uncertainty even in face
of major catastrophes. Slovic and Fischhoff suggest that this happens because of the way
‘relevant information is presented to us’ (1977:28). When we are told in different ways about
the impact of a threat on our life, we adopt different perspectives of risk. For instance, the
perception of radiation as a risk is perceived as minimal if we are told that life expectancy
tends to be less impacted by the effects of radiation based on how far we live from a nuclear
66
power plant (Slovic and Fischhoff 1977). However, if this information is shared with us only
in terms of how many additional cancer deaths per year we are subjected to due to exposure
to radiation, we are likely to be more reactive to this piece of information (Slovic and Fischhoff
1977).
Statistical thinking is particularly important when it comes to understanding why and
how householders in floodplain areas take protective actions. The importance of considering
regression analysis derives mainly from the variability of inputs. Slovic and Fischhoff (1977)
highlight the difficulties that individuals face to conceptualize floods that have never
occurred. When individuals make decisions over whether they should take protective
actions, this process is highly conditioned to an immediate past. The future, however, does
not necessarily mirrors the past. This is the reason why Slovic and Fischhoff (1977) argue
that statistical thinking should be taught and encouraged. Slovic and Fischhoff (1977) argue
that people need to recognize the existence of uncertainty and find a way to rationally deal
with it. Consistency in decision making under uncertainty, however, relies on individuals
‘being accustomed to monitoring their decisions’ (Slovic and Fischhoff 1977:31). A decision
cannot be based only on predicted outcomes. It is important in this mental process to
consider a range of input variables, their interdependence, and their effect to avoid heuristics.
One intuition, for instance, distorting decision making among individuals living in flood-prone
areas is hindsight. Reasoning based on hindsight thoughts arranges a semantic memory in
a way that new information serves to build upon and confirm previous values and beliefs
(Slovic and Fischhoff 1977). However, individuals applying regression in their decisions are
more likely to reduce or even eliminate these biases by enhancing their decision-making
process through the addition and understanding of the effect and interdependence of co-
factors leading to a certain decision (Slovic and Fischhoff 1977).
Decision making, then, is determined by attitudes, which, in turn, are shaped by cues
that can be divided into cognitive, affect, and past behaviour. Availability bias is a cognitive
bias that use intuition that involves judging the probability or frequency of an event based on
how easy it is to imagine an event happening or how easy it is to remember the occurrence
and consequences of previous events (Slovic and Fischhoff 1977). Slovic and Fischhoff
stress that this state of mental availability is also affected ‘by subtle factors such as recency
and emotional saliency’ (1977:14). These factors can cause ‘serious errors’ in decision
making (Slovic and Fischhoff 1977:14). In the case of floods, for instance, Kates (1962)
argues that availability bias makes people living on floodplains appear to be prisoners of
their experience. This occurs because residents in floodplains use experience to set
67
downward and upward bounds that end up determining expected losses from major floods.
These bounds limit their ability to learn from new information and practices (Kates 1962).
Availability bias also relates to nudging individual decisions to a particular direction (Kousky
and Shabman 2016:19). Kuran and Sunstein (1999) argue that risk communication
strategies should tap into ‘choice architects’ (Thaler and Sunstein 2008) to shift the attention
of some individuals to specific problems. The expectation is that the behavior changes of
these particular individuals would then lead a ‘cascade effect’, that is, behavior change
among a larger group of people. For instance, Kousky and Shabman (2015:19) suggest that
‘choice’ contexts should be used to nudge more householders to join public flood insurance
programs in order to reduce the public cost of paying for recovery after a disaster.
Meyer (2006) points out three other cognitive biases affecting decision making under
uncertainty. Individuals at risk tend i) to learn from short-term experiences; ii) to extrapolate
experience into the future; and iii) to discount future rewards in comparison with decisions
made to address short-term risks (Meyer 2006). McEntire (2005) agrees that individuals at
risk are not always able to make good decisions when it comes to addressing low-probability
high-impact events. McEntire cites Mileti (1999:106) to argue that poor decision making
occurs because risk is primarily accessed in terms of ‘the probability of an event or condition
occurring’ (2005:211). Citing Clark (2005), McEntire claims that individuals at risk need ‘to
put greater emphasis on the consequences of low-probability high-impact disasters in order
to have a better sense of emerging risks’ (2005:211). McEntire (2005), however, cites
Kloman (2000:3), to warn that even after balancing decision making with probability and
consequence in equal terms, individuals at risk should still not feel fully protected against
low-probability high-impact disasters since risk management is a never-ending collaborative
effort.
Another internal cue that shapes intentions is affect, or the feelings and emotions
towards an event. Moderate levels of anxiety are correlated with maximal performance
(Yerkes and Dodson 1908). Too little anxiety, however, results in no or weak correlation
whereas high levels of anxiety leads to inhibition (Ronan and Deane 1998). Worry is a source
of anxiety and Dooley et al. (1992) found that concern when framed as worry it is positively
correlated to protective actions. Emotions that result in a fatalistic state of mind also affect
decision making. Resignation is the product of fatalistic emotions among individuals at risk
and the severe level of resignation is depression (Peterson et al. 1993). Lindell and Perry
(2000), however, claimed that fatalism in the context of crisis is less about emotions and
more about lack of information about the effectiveness of adjustment measures. Turner et
68
al. (1986) agree that the decision to take protective actions depends on raising awareness
over the effectiveness of protective actions but the government cannot ignore the importance
that emotions have on decision making under uncertainty.
Past behaviour is the third internal cue shaping decision making under uncertainty.
Wortman et al. (1999) argue that initial behaviour is often the best predictor of future
behaviour. Individuals that had sought information about protective actions were more likely
to take these actions (Mileti and Fitzpatrick 1992; Ronan et al. 1998; Turner et al. 1986).
Also, individuals that had taken protective actions were also more likely to take other
protective actions (Mileti and Darlington 1997; Mileti and O’Brien 1992). Past behaviour is
also important because it creates mental schemes that can hinder or facilitate behaviour
change. Renn et al. (1992) explain that individuals select characteristics of events and
interpret them based on how past behaviours shaped their perceptions and mental schemes.
Understanding these perceptions and mental schemes becomes more important considering
that these interpretations are transformed into a message which then gains amplification
stations through the way individuals behave and communicate (Renn et al. 1992). Past
behaviour also shapes decision making between individuals and authorities differently.
Authorities tend to make decisions based on their political, economic and regulatory
experiences whereas individuals decide to accept or not a certain risk after assessing
whether these risks are acceptable based on their perceived hazards risks and their socio-
economic conditions to effectively reduce these risks (Plattner 2004).
Ecological Rationality in Decision Making
Gigerenzer and Marewski argue that heuristics is a viable alternative to complex decision
models. Marewski and Gigerenzer (2012:79) state that ‘complex (e.g. regressions) models
that assign optimal weights to various predictor variables’ (Marewski and Gigerenzer
2012:83) are unrealistic because of the complexity to compute optimal solutions. Instead,
Marewski and Gigerenzer explain, people use simple strategies in searching for solutions
that ‘are good enough with respect to an organism’s goals’ (2012:80). However, according
to the lessons of Herbert Simon, the father of ‘bounded rationality’, and who stated that
optimization models are rarely possible in the real world, behavior and performance do not
depend only on the goals but also on the environment of the decision maker. According to
this statement, Marewski and Gigerenzer (2012) introduce the concept of ecological
rationality, which they claim is an alternative to optimization and irrationality. The core of
ecological rationality is the use of heuristics, or an adaptive toolbox, and the selection of an

69
adequate tool in this environment. In other words, the challenge in the rationality proposed
by Marewski and Gigerenzer (2012) is identifying in this adaptive toolbox which heuristics is
more adequately adapted to a specific decision-making environment.
Marewski and Gigerenzer state that heuristics suits decision making under
uncertainty because this is a ‘strategy that ignores part of the available information and
focuses on few relevant predictors’ (2012:78). The main benefits of applying this adaptive
toolbox in cases of uncertainty is that it is simple to use, easy to teach (Marewski and
Gigerenzer 2012). In addition, this adaptive toolbox generates outcomes fast and as
accurate as optimization models while empowering individual decision makers by not
leaving responsibility to experts (Marewski and Gigerenzer 2012). Marewski and Gigerenzer
(2012) also advocate heuristics as superior to regression models since optimization models
are not completely free from the influence of noise data. Marewski and Gigerenzer argue
that optimization models integrate noises and too much information which makes this
information-greedy method ‘more likely to end up overfitting past observations’ (2012:86)
while decreasing its ability to predict new events. In other words, optimization models are
effective to explain past events but not to predict new events.
Heuristics incorporates noise data without risk overfitting a model. Kao and Couzin
(2014) state that in the absence of the wisdom of crowds, finite information and a small
group size can actually maximize decision accuracy. In this situation, it is the noise in these
small groups that enhances their accuracy, allowing individuals in such groups to avoid the
detrimental effects of correlated information while exploiting the benefits of collective
decision making (Kao and Couzin 2014). Thus Kao and Couzin (2014) suggest that noise in
small groups can maximize decision accuracy across many contexts. Johnson et al. (2013)
agree with Kao and Cousin (2014) when they assert that under conditions of uncertainty and
asymmetric costs of false positives and false negatives, biases can lead to mistakes in one
direction but -- in so doing -- steer decision makers away from more costly mistakes in the
other direction.
Marewski and Gigerenzer (2012) propose that experts should increasingly rely on
heuristics in their decision making under uncertainty. Experts should be trained to use
heuristics effectively (Marewski and Gigerenzer 2012). For instance, fast-and-frugal
heuristics relies on simple decision strategies that result in smart behavior (Marewski and
Gigerenzer 2012). Fast-and-frugal heuristics are trees characterized by ‘the limited number
of exits they have; only a few predictors can be looked up, but they will always lead to a
decision’ (Marewski and Gigerenzer 2012:82). In the application of fast-and-frugal heuristics

70
tree, researchers look out for how experts ‘make inferences, estimations and other
judgments about unknown and uncertain criteria’ (Marewski et al. 2010:104). Marewski et
al. rely on core human capacities such as memory and vision to explore ‘regularities in the
structure of the human physical and social environment’ (2010:86). Gaissmaier and
Schooler (2008) reinforce the role of heuristics in decision making under uncertainty by
arguing that the relationship between memory and the recognition of patterns is subjected
to the environment that the decision maker is embedded in. For instance, the use of memory
to identify patterns in a new environment can be counterproductive since there could be no
patterns to be observed (Gaissmaier and Schooler 2008). In cases like this, individuals need
to adopt an exploratory behavior to detect changes in the environment (Gaissmaier et al.
2006).
Thus Plessner and Czenna argue that being more analytical and less intuitive, as
Kahneman and Tversky (1973) suggest, do not necessarily lead to ‘more effective and
rewarding solutions’ (2008:251) when it comes to decisions made under uncertain
scenarios. Intuition, or spontaneous responses to an environment, ‘can outperform more
deliberate ways of thinking’16 (Plessner and Czenna 2008:251). In particular, people are
most likely to benefit from their intuitions when ‘they possess implicit knowledge that is of
use in a given judgment or decision task and dissociated from explicit knowledge’ (Plessner
and Czenna 2008:259). This implicit knowledge depends on the environment and thus any
investigation on the effectiveness of heuristics needs to consider the determination of
situations in which people can benefit from their intuitive responses (Hogarth 2005). This
investigation then leads to the following question: In a given situation, can I scientifically
decide between either using analytical thought or trusting my intuition? (Hogarth 2005).
Hogarth (2001) responded this question by analyzing people’s learning environments and
making a distinction between wicked learning environments (with little or no feedback) and
kind environments (with accurate feedback). The findings of Hogarth (2001) suggest that
16 Qualitative data from this study confirm that in some instances intuition is indeed a good basis for decision making with respect to low probability events like floods for which people have little possibilities for learning. An old couple, who returned from holiday before the dam water release in January 2011, decided to evacuate their property based on their understanding that another major flood event was very likely because they were aware that the dam located upstream the Brisbane River was reaching its capacity to store water safely. In addition, they were fearful that the government had not yet provided any accurate information on its strategies to release this stored water in a way that it would cause minimal damage for the residents living in flood-prone areas downstream. Another example of the use of intuition for decision making comes from an amateur meteorologist relying only on assessing weather forecasts (QFCI 2012). This resident living in a flood-prone area downstream the Brisbane River had also predicted that dam operators would have no other choice than releasing stored water and that the magnitude of this event was likely to cause significant damage to householders living downstream.

71
the benefits of intuition are valid only for kind environments17. Based on these findings,
Hogarth (2001) suggest several measures that can be developed with the aim of educating
people’s intuitive skills. Nevertheless, researchers such as Hammond et al. (1987)
emphasize the interaction of cognitive biases and the nature of the task to evaluate the
validity of intuitive responses. In this alternative approach, McMackin and Slovic (2000)
found out that intuition features an advantage in undertaking intuitive tasks whereas
reflection suits better analytical problems.
Conclusion
This second part of the literature review presented the key concepts of this thesis. It first laid
out the complexity of determining and measuring variables of risk perception models. It then
described the different positions of cognitive psychologists on their models to assess
efficiency in decision-making processes under uncertainty. This review also showed that
scholars believe that individuals at risk cannot assess risk from the complexity that a high-
risk disaster requires. As a result of not being able to make optimal decisions, these
individuals increase their exposure to hazard risks. This review also introduced the concept
of ecological rationality which opposes optimization models by arguing that decision-making
process based on key indicators, or heuristics, can in some cases be faster and as accurate
as complex models such as regression analysis. This thesis sees these opposing cognitive
models as complementary and thus it adds elements of both of them in the models of this
thesis, as presented in the next chapter, which aim to capture the complexity of assessing
decision making under uncertainty in the context of flood mitigation.
17 According to this finding, flood environments featuring limited information for action are less suitable for the use of intuition as a driving force behind decisions under uncertainty. However, as the examples above demonstrated, even in wicked environments such as the one experienced in Brisbane in January 2011, there is still room for the use of intuition if people have some knowledge and experience fueled by curiosity and uneasiness. Examples of people that have tapped into their intuitive skills are the old couple and the amateur meteorologist mentioned in the footnote above.
72
Chapter 4: Theoretical Framework
Introduction
This chapter and the following one (chapter five: ‘Method’) focus on answering the following
question: How does a theoretical framework based on PMT help explain decision making
about preparing for flood risk? This chapter starts answering this question by elaborating the
literature underpinning the theoretical framework of this thesis and setting out its details with
justifications for its variables. The four areas that this chapter covers are i) the origins of the
PMT in Public Health; ii) the use of PMT in Crisis Management studies; iii) the description of
the model used in this thesis particularly focused on the comparative analysis of four
protective actions different in nature and protective levels; and iv) the description of
hypotheses. The explanation of this theory in order to justify its relevance for the objective
of this study, which is the provision of information and analysis on the motivations and
challenges that householders face to take protective actions, is part of the foundation of this
thesis, its findings, and main argument.
Protection Motivation Theory in Public Health
The main assumption behind the motivation theories in public health is that ‘people still
engage in potentially harmful or negligent (i.e., maladaptive) behaviors’ (Floyd et al.
2000:408). Thus public health researchers came up with theories to investigate the reasons
why people engage in these behaviours, and how adaptive and maladaptive responses
based on these behaviours are initiated and maintained. Weinstein (1993), after reviewing
key theories describing health-protective behaviours, highlighted that these theories share
the notion that motivation to take a protective action depends on the level of a perceived
threat and the desire to avoid a negative outcome. Weinstein (1993) also identified that these
theories share a cost-benefit analysis component in their models. These cost-benefit
analyses mean that individuals weigh the costs of taking a protective action against the
expected benefits of taking that action. However, according to Weinstein (1993), PMT is the
only to include self-efficacy as a separate component. Bandura (1992) argues that self-
efficacy is an important element influencing socio-psychological processes.
In addition to its self-efficacy component, PMT singles out among other theories as it
helps explain the effects of fear appeals on health attitudes and behaviors (Rogers 1975).
Fear-arousing communications have a significant impact on the selection of behaviors (Floyd
et al. 2000:409). Sutton (1982), after conducting a meta-analysis on fear-arousing
communication studies, revealed that increased levels of fear consistently increased the
73
level of response to a threat. In addition, Sutton (1982) found out that positive perceptions
on response efficacy increased the intentions to take protective actions as well. Rogers
(1975) also highlighted that PMT was developed according to an expectancy-value theory,
which also included reward and self-efficacy components. In addition, PMT models include
environmental sources of information (such as verbal persuasion and observational learning)
and intrapersonal sources (such as personality aspects and feedback from prior experience)
(Floyd et al. 2000:409).
Threat appraisal and coping appraisal are the two cognitive mediating processes of
PMT. This theory posits that it is the combination of these processes that defines protection
motivation. In this process to investigate the reasons behind protective actions, threat
appraisal is addressed first as ‘a threat must be perceived or identified before there can be
an evaluation of the coping options’ (Floyd et al. 2000:410). Threat appraisal evaluates
adaptive and more particularly maladaptive behaviors (Floyd et al. 2000). Threat-appraisal
variables are comprised of maladaptive response rewards (intrinsic and extrinsic) and the
perception of threat (severity and vulnerability) (Floyd et al. 2000). Rewards are known to
increase the probability of selecting the maladaptive response (not to protect the self or
others) whereas increased threat perception decreases the probability of selecting a
maladaptive response (Floyd et al. 2000). As for coping appraisal, it evaluates the ability to
cope with and avert the threatened danger (Floyd et al. 2000). Coping appraisal is comprised
of efficacy variables (such as response efficacy and self-efficacy) and response costs (Floyd
et al. 2000). Response efficacy is ‘the belief that the adaptive response will work, that taking
the protective action will be effective in protecting the self or others’ (Floyd et al. 2000:411).
Self-efficacy is ‘the perceived ability of the person to actually carry out the adaptive response’
(Floyd et al. 2000:411). And response costs are any costs (e.g., monetary, personal, time,
effort) associated with taking the adaptive coping response (Floyd et al. 2000:411).
Response efficacy and self-efficacy increase the probability of selecting the adaptive
response whereas response costs decrease the probability of electing the adaptive response
(Floyd et al. 2000:411).
The output of PMT models is the decision (or intention) to initiate, continue, or inhibit
adaptive or maladaptive responses (Floyd et al. 2000). The typical dependent variables in
PMT models are measures of behavioral intentions (Rogers and Prentice-Dunn 1997). The
purpose of PMT research is to persuade people at risk ‘to follow the communicator’s
recommendations; so, intentions indicate the effectiveness of the attempted persuasion’
(Floyd et al. 2000:411). Rogers and Prentice-Dunn (1997) reviewed the literature and found
74
support for PMT and its components. However, Floyd et al. (2000) warned that this review
was based on a narrative perspective. Thus more quantitative understanding of PMT models
is needed to provide a more accurate assessment of the magnitude of the contribution of
PMT components (Floyd et al. 2000:411). For instance, it is important to identify whether
some variables relate more strongly to behavioral intentions than others (Floyd et al.
2000:411).
Thus PMT models have revealed important results to the design of individual and
community interventions (Floyd et al. 2000:420). The models testing PMT show that a
protective action is a positive function of severity since one must believe that there is some
harm and that one is vulnerable to this harm. When these considerations override the
rewards (intrinsic such as pleasure and extrinsic such as peer approval), this appraisal of
threat variables motivates an individual to initiate the coping process. However, in order to
adopt the recommended coping response, one must believe that performing the coping
response will avoid the danger and that one has the ability and will to perform this response.
These considerations must outweigh the costs (such as withdrawal symptoms) of performing
the coping response (Floyd et al. 2000:420). In public health studies, coping variables have
showed slightly stronger relations with the adaptive behaviors than did the threat variables
(Floyd et al. 2000:420). However, both coping and threat were in the moderate range in
these studies (Floyd et al. 2000:420). The approximate effect size of 0.40 for the threat
variables represents roughly 70% of an experimental group versus only 50% of a control
group selecting the adaptive behavior. The approximate effect size of 0.56 for the coping
variables represents roughly 76% of an experimental group versus only 50% of a control
group selecting the adaptive behavior (Floyd et al. 2000:420).
Protection Motivation Theory in Crisis Management
According to Grothmann and Reusswig (2006:104), PMT provides researchers interested in
natural hazards with an elaborate framework for understanding human behaviour. Lindell
and Perry (2000) were the first researchers to use PMT extensively to explore natural
hazards (Figure 2 describing the interdependences of the study of Lindell and Perry 2000).
In their studies of adjustments to seismic risks, Lindell and Perry (2000) investigated the
relationships between coping actions and threat appraisal (or risk perception). Their key
contribution, according to Zaalberg et al. (2009:1760), suggests that PMT predicts protective
actions when threat appraisal is high and coping actions are appraised as effective and
feasible. As for non-protective actions such as denial, fatalism, and wishful thinking, Lindell

75
and Perry (2000) found out that these occur when threat appraisal is high and coping actions
are appraised as ineffective or unfeasible. Studies by Lindell and Hwang (2008), Lindell and
Whitney (2000), and Prater and Lindell (2000) also acknowledged the importance of
considering coping appraisal in the prediction of protective actions. That is, individuals at risk
can, in some contexts, be more likely to take protective actions based on a positive
perception of their coping abilities than to their level of awareness to the risks of a hazard
striking and potential destruction it can cause. This is an important contribution to the
academic knowledge of risk and crisis management because it suggests that increasing the
effectiveness of mitigation requires more attention to perceptions of individual costs and
benefits vis-à-vis protective actions than risk awareness. In other words, it is not enough to
know a threat you also need to know that you can address it.
Figure 2: Interrelationships among Environmental Hazards, Households, Social Context, and
Hazard Adjustments
(Source: Lindell and Perry 2000:489)
In terms of flood mitigation, Grothmann and Reusswig (2006) were the first to apply PMT
through an investigation into the factors (perceptual or socio-economic) that predict the
likelihood of taking protective action (See Figure 3 for an overview of the model used by
Grothmann and Reusswig 2006). In their study, Grothmann and Reusswig (2006:118)
emphasise that:
PMT is valuable to use precisely because it introduces the concept of coping appraisal. By taking into account the way in which people estimate their own options and ability to react to a threat, along with the effectiveness and costs of these options, one can gain a much clearer picture of people’s decision to respond to the threat. Even if theoretical insights into risk perception are becoming more sophisticated, the

76
results from the empirical study…suggest[s] that behavioural research in natural hazards research – or at least flood protection – should include the study of people’s own perceptions and assessments of their adaptive and pro-active capacities.
The analysis of coping appraisal is, therefore, an exploration of a series of questions that
individuals implicitly or explicitly address in their self-reflections on risk: If I do something to
reduce or eliminate this risk, will it be effective? (response-efficacy); Is this action feasible in
terms of time and the knowledge I have available? (self-efficacy); and, Is the cost of this
action reasonable? (response cost). Perceptual and socio-economic data collected based
on these questions have yielded significant correlations with protective and non-protective
individual actions (Bubeck et al. 2013; Grothmann and Reusswig 2006; Poussin et al. 2014).
In other words, by using CA’s variables to predict protective actions, researchers have begun
to understand that an individual’s own assessment of its proactive capacities are important
indicators to explain the reasons why some people decide to protect themselves against a
threat while others do not.
Figure 3: Explanatory Factors for Precautionary Damage Prevention by Residents in Flood-
Prone Areas
(Source: Grothmann and Reusswig 2006:105)
This study uses PMT to assess the relationships between individual risk perception and
protective actions in high-risk flooding areas in Brisbane. The variables considered in this
study are similar to those used by Grothmann and Reusswig (2006), Zaalberg et al. (2009),
Bubeck et al. (2013), and Poussin et al. (2014), which have all empirically investigated flood
mitigation strategies and individual risk perception via PMT frameworks. Grothmann and
Reusswig (2006) were the first researchers exploring flood mitigation at the individual level
77
to use PMT. They conducted telephone surveys with 157 residents living in flood-prone areas
in Cologne, Germany. In their model, threat appraisal comprises perceived probability and
perceived severity around assessments of a ‘hypothetical threat in the future’ (Grothmann
and Reusswig 2006:108). For the assessment of how past flood experiences influence
protective actions, Grothmann and Reusswig (2006) created a category called ‘threat
experience appraisal’. This distinction between past and future events aimed to understand
the roles of uncertainty and certainty in decision making. While they both ‘motivate people
to take precautionary action’ (Grothmann and Reusswig 2006:107), future scenarios capture
degrees of uncertainty whereas past experiences influence decisions based on events that
already happened, thus encouraging decisions which are based on more certain grounds.
In a similar vein, this model also examines potential and actual levels of exposure in
terms of threat appraisal. As Grothmann and Reusswig explain ‘perceived probability is the
person’s expectation of being exposed to the threat’ (2006:106) and ‘perceived severity is
the person’s estimate of how harmful the consequences of the threat would be to things he
or she values if the threat actually occurs’ (2006:106). The model also examines an
individual’s perceptions about government mitigation measures because, as Grothmann and
Reusswig (2006) argue, this is crucial for understanding individual decision making because
‘if the residents at risk rely on the efficacy of the public or administrative flood protection they
will probably take less precautionary action themselves’ (2006:107).18 Finally, an important
aspect of Grothmann and Reusswig’s (2006) model is their hypothesis that ‘socio-
psychological factors … have a higher explanatory power than a traditional socio-economic
model, including age, gender, income, education and being owner or tenant of the home’
(2006:108). Socio-psychological factors include people’s subjective perceptions of flood risk,
coping abilities, etc. (Grothmann and Reusswig 2006:117)
Zaalberg et al. (2009) have also tested PMT but in the delta river areas of the
Netherlands. The population in this study were households from different flood risks zones
along the Rhine and Meuse Rivers (See Figures 4 and 5). Zaalberg et al. (2009) compared
these populations based on their feelings towards floods. Their goal was to understand the
role that exposure to floods and threat appraisal variables (perceived vulnerability and
consequences) play in motivating individuals to take preparedness actions. This model also
uses psychological variables to explore the relationships between risk perception and
18 It is worth noting, as seen in questionnaire on page 194, that this thesis collected individual risk perception towards government mitigation measures as well as the role of social networks in decision making. However, these sets of explanatory variables were disregarded in this thesis since it was advised that they were not relevant for the analytical framework proposed in this study.

78
protective actions by investigating the role that past flood experience has on future coping
responses. Their hypotheses, confirmed by their findings, are that flood victims, because of
their highly negative perceptions: i) have stronger intentions to take adaptive actions against
future flooding than non-victims; ii) appraise themselves as more vulnerable to future
flooding than non-victims, and; iii) evaluate adaptation as more effective than prevention.
This final point happens because flood victims count on social support and have stronger
negative emotions (than non-victims) when it comes to prevention measures previously in
place (2009:1774).
Figure 4: Unmediated Model Predicting Subjective Experiences, Appraisals, and Coping
Responses
(Source: Zaalberg et al. 2009:1762)
Figure 5: Mediated Model Predicting Coping Responses
(Source: Zaalberg et al. 2009:1763)
Protection Motivation Theory has also been examined in Germany by Bubeck et al. (2013).
Four types of mitigation measures were investigated in this study: structural building
measures (such as improving building stability and using flood-resistant materials), adapted

79
building use (such as avoiding expensive items and expensive fixed interior in flood-prone
storeys), and flood barriers (such as fixed or mobile flood barriers) (See Figure 6). These
measures were incorporated in the model of this study under ‘Home Improvements’. The
fourth measure investigated is flood insurance, which was also included in this study. In
terms of flood experience, 64% of participants had experienced floods before. And 48% of
these participants had implemented some mitigation measures and 24% of householders
had taken out flood insurance (Bubeck et al. 2013:1330). Bubeck et al. (2013) were
particularly interested in exploring the variables of coping appraisal in relation to
precautionary behaviour. In this regard, Bubeck et al. (2013) asked the following question:
Does coping appraisal predict flood-mitigation behaviour? This focus is explained by the
authors because threat appraisal variables were not ‘a good predictor of flood mitigation
behaviour’ (Bubeck et al. 2013:1328). Conversely, coping variables were revealed ‘to be
consistently related to flood-mitigation behaviour’ (Bubeck et al. 2013:1328). Thus, after
running regressions, Bubeck et al. (2013) confirmed their hypothesis that the perception that
a mitigation measure is efficient and possible or easy (in terms of cost, knowledge, and time
available) is a stronger predictor for flood-mitigation behaviour than risk perceptions.
Figure 6: Flow Chart of the Logistic Regression Analyses Applied by Bubeck et al. 2013
(Source: Bubeck et al. 2013:1331)
Poussin et al. (2014) tested an extended framework of the model of Grothmann and
Reusswig (2006) in France. Out of total participants, nearly 60% of them had some flood
experience and the questions that Poussin et al. (2014:72) asked were somewhat similar to
that of Grothmann and Reusswig in Germany. Poussin et al. (2014:70) asked the following
questions in their study: ‘To what extent do households implement flood damage mitigation
measures, and what are the factors that influence individual decisions to prepare for
flooding? (2014:70). Their model, like in Bubeck et al. (2013), also added social networks

80
Table 1: Explanatory Variable Included in the Model of Bubeck et al. 2013
(Source: Bubeck et al. 2013:1331)
Table 2: Significant Variables and p-values of the Model of Bubeck et al. 2013 (This table
corresponds to ‘Table 3’ on Figure 6)
(Source: Bubeck et al. 2013:1332)
and social norms into their statistical analysis. Social networks and social norms are,
according to Poussin et al., ‘mitigation measures taken by friends, family, or neighbours’
(2014:72). The main finding in the study of Poussin et al. is that threat appraisal has a ‘small
effect on household’s mitigation behaviour’ whereas coping appraisal has ‘a more important
influence on flood preparedness’ (2014:70).
The model used for this thesis incorporates elements of the models cited above (See
‘Comparative Explanatory Factors of Flood Studies Testing PMT’ on page 210). In terms of
explanatory variables, the model of this thesis continues the exploration of threat appraisal
variables and the effect on vulnerability variables on decision making based on
demographics and household characteristics. The main differences between the model
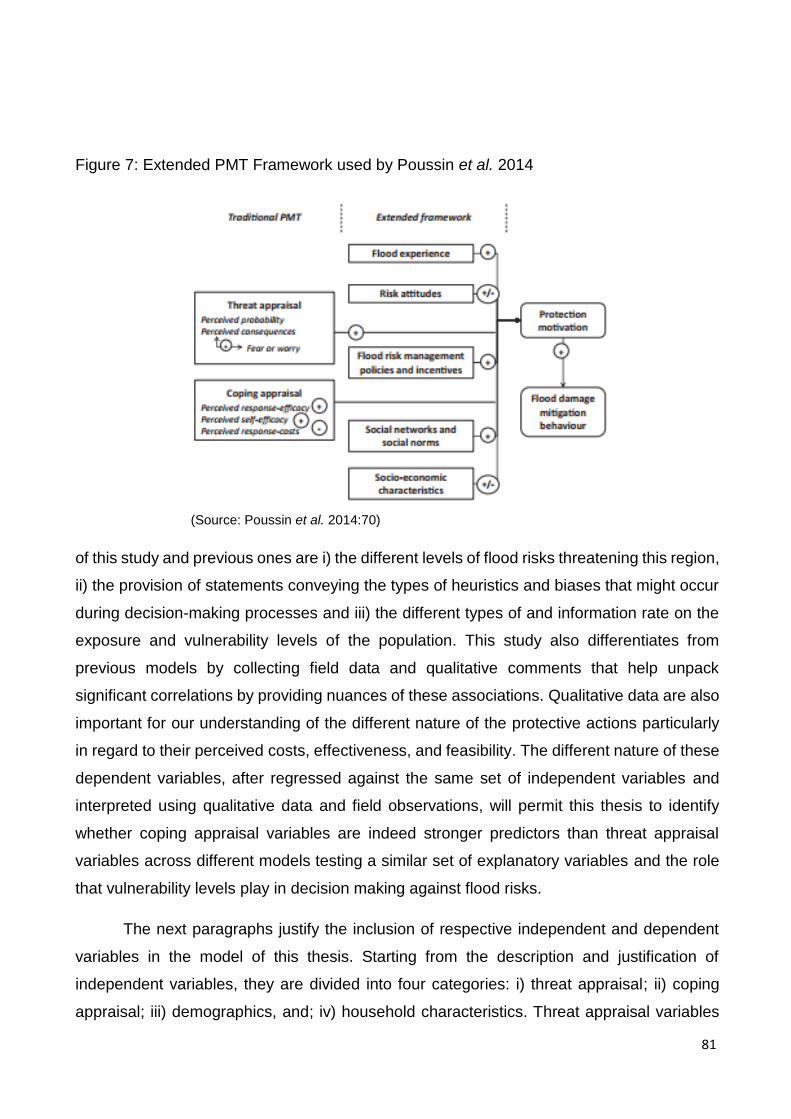
81
Figure 7: Extended PMT Framework used by Poussin et al. 2014
(Source: Poussin et al. 2014:70)
of this study and previous ones are i) the different levels of flood risks threatening this region,
ii) the provision of statements conveying the types of heuristics and biases that might occur
during decision-making processes and iii) the different types of and information rate on the
exposure and vulnerability levels of the population. This study also differentiates from
previous models by collecting field data and qualitative comments that help unpack
significant correlations by providing nuances of these associations. Qualitative data are also
important for our understanding of the different nature of the protective actions particularly
in regard to their perceived costs, effectiveness, and feasibility. The different nature of these
dependent variables, after regressed against the same set of independent variables and
interpreted using qualitative data and field observations, will permit this thesis to identify
whether coping appraisal variables are indeed stronger predictors than threat appraisal
variables across different models testing a similar set of explanatory variables and the role
that vulnerability levels play in decision making against flood risks.
The next paragraphs justify the inclusion of respective independent and dependent
variables in the model of this thesis. Starting from the description and justification of
independent variables, they are divided into four categories: i) threat appraisal; ii) coping
appraisal; iii) demographics, and; iv) household characteristics. Threat appraisal variables
82
are about the perception of a hazard and its effects. Coping appraisal variables measure
one’s ability to reduce flood risks without government or any external support. Demographic
variables reveal key socio-economic indicators of the sample. Household characteristics are
further vulnerability factors such as housing ownership, tenure, and the presence of
vulnerable groups. In the case of threat appraisal sub-categories, perceptual risks are related
to the hazard itself; objective risks have to do with flood damage; maladaptive responses are
reasons that lead householders to not take protective actions; and flood experience are
subjective financial and psychological impacts caused by major floods.
Every independent variable has a reason to be included in the model. Threat appraisal
variables measure, as mentioned, the perception of householders towards a hazard and its
effects. However, this is a very broad term that requires refined categories to be more
accurately assessed. Thus this thesis divided the broad concept of threat appraisal into i)
perceptual risks; ii) objective risks; iii) maladaptive responses, and; iv) flood experience. The
sub-category of perceptual risks includes variables related to the hazard itself; that is, the
perceived likelihood, frequency, loss estimates, distance to the source, and hazard
magnitude. These perceptual risks are often believed in the literature to be the main drivers
of protective action among individuals at risk (Bird 2009:1063). For instance, governments
generally assume that informing individuals at risk about the characteristics of a hazard and
the potential damage that it can cause is enough to convince individuals at risk to take
protective actions against major hazard risks (Bubeck et al. 2012:1491).
The other sub-category of threat appraisal is objective risks19. This sub-category
consists of factors that indicate actual losses resulting from major floods. The purpose of
including these factors in the model is to measure whether the level of inundation in a
property, the total of value damaged, and whether a property had to be demolished ended
up influencing the decision of householders to take protective actions. This sub-category is
under threat appraisal as it measures how past experience translated into actual losses
affects risk perception. This sub-category is also commonly included in previous models as
it is assumed that individuals that experienced higher losses are often more likely to take
protective actions (Siedschlag et al. 2012:7).
19 Freedy et al. (1994:258) distinguish objective from subjective risk factors. Objective risks are about actual losses and they are positively associated with increasing levels of psychological distress. An example of objective risk is property loss. Subjective risk factors, however, are defined as risk perceptions after an event that was likely to had caused traumatic experiences. Low control and perceived threat to life, such as ‘worry’, are examples of these subjective experiences.
83
The other sub-category of threat appraisal included in the model is maladaptive
responses20, or the decisions of householders to not take protective actions. The addition of
maladaptive responses is necessary as individuals at risk also come up with reasons that
justify their decision to downplay the importance of protective actions or completely ignore
the necessity to consider these protective actions despite their exposure to major flood risks
(Floyd et al. 2000:411). The justification for not taking protective actions can be explained in
some cases by cognitive biases (Floyd et al. 2000:411). For instance, availability bias, or the
facility to remember and retrieve information from memory, affects risk perception and as a
result the decision of householder to take action under uncertain scenarios (Slovic and
Fischhoff 1977:14). Availability bias is a broad cognitive bias that underlines the maladaptive
response of ‘positive experience’21 included in this sub-category. Anchoring is another
cognitive bias, or heuristics, that explains a maladaptive response since individuals that had
a ‘positive experience’ may project their experiences into the future, preventing them from
considering other factors in their decision-making process (Slovic and Fischhoff 1977:16).
Fatalism is another heuristics commonly found in the literature that justifies the decision of
individuals at risk to not take protective actions (Bubeck et al. 2012). When individuals at risk
deem that the magnitude and severity of a hazard is too high, they become convinced that
there is nothing they can actually do to effectively reduce their risks. Thus they decide to not
take any protective action. Also, individuals at risk also resort to a comparative analysis of
the risks of living in a flood-prone area by assessing the costs and benefits to continue living
in a risky location. As the literature states, if the individual at risk argues that the benefits of
20 It is worth remembering that maladaptive responses are added as a sub-category of threat appraisal because Floyd et al. (2000) explain that threat appraisal evaluates adaptive and more particularly maladaptive behaviors. Threat-appraisal variables are comprised of maladaptive response rewards (intrinsic and extrinsic). A protective action is a positive function of severity since one must believe that there is some harm and that one is vulnerable to this harm. When these considerations override the rewards (intrinsic such as pleasure and extrinsic such as peer approval), this appraisal of threat variables motivates an individual to initiate the coping process. 21 The four maladaptive responses included in the model are: positive experience, fatalism, cost benefit analysis and attachment. ‘Positive experience’ claims that if a householder had coped well with previous major flood events without taking any action beforehand, this householder would have believed that s/he did not need to take any action to reduce potential flood damage to the property. ‘Fatalism’ has to do with the perception that major floods events are too powerful and thus there is nothing that a householder can do to reduce damage to the property. ‘Cost benefit analysis’ is a statement that justifies the decision to not take protective actions because householders may claim that the benefits of living in their property, as it is, are higher than the costs resulting from flood damage. ‘Availability heuristics’ (see page 66) could potentially be used as an alternative label for ‘cost benefit analysis’ as this nomenclature is directly related to heuristics. Finally, ‘attachment’ is related to the protective action of ‘relocation’ as it measures how emotional attachment that the householder has to its property, land, and community justifies the decision of householders to take the risks of continuing living in a food-prone area.

84
living where they are outweigh the costs caused by a major flood, they are more likely to
accept the risks and stay where they are (Ganderton 2005).
The last threat appraisal sub-category is flood experience. In this sub-category it was
included subjective factors that measure risk perception such as worry to major floods and
whether respondents feel that they have been psychologically and/or financially affected by
a major disaster. The literature argues that the higher are these subjective factors to the
effects of a major hazard, the more likely that individuals at risk will take protective actions
(Ronan and Johnston 2005:22; Weinstein 1988:373). However, Bočkarjova et al. (2009:10)
argue that these subjective factors do not actually result in significant correlations with
protective actions.
Coping appraisal variables22 are the other set of independent variables included in
this model. These variables are divided into response-efficacy, self-efficacy, and response
cost. Response-efficacy measures the perceived effectiveness of a protective action. Self-
efficacy assesses perceived feasibility of householders undertaking a protective action in
terms of the time and knowledge they have available. Response cost evaluates the
perceived monetary cost of a protective action. The definitions of these coping appraisal
variables are similar to previous PMT studies, particularly to Bubeck et al. (2013). Bubeck et
al. (2013) built their model based on categories and definitions found in key empirical studies
such as Grothmann and Reusswig (2006), Zaalberg et al. (2009), and Milne et al. (2000).
This study borrows the definition of self-efficacy used by Bandura, who suggest that self-
efficacy is about ‘people’s beliefs about their capabilities to produce designated levels of
performance that exercise influence over events that affect their lives’ (1992:71) and of
Grothmann and Reusswig, who defined self-efficacy in the context of flood mitigation as ‘the
perceived ability to perform a protective response’ (2006:106).
The other two categories included in this set of independent variables are
demographics and household characteristics. These variables need to be included in the
model because they are intuitively part of individual risk perceptions (Tierney 2006:121) and,
more importantly, they shape householders’ decisions to take protective actions (Tierney
2006:121). Every study empirically assessing the relations between risk perception and
decision making has included some vulnerability factors in their assessment (Tierney
22 In a recent study, Bubeck et al. (2017) explore the factors that explain and predict individuals’ capacity to take protective actions. They state that socioeconomic factors do not fully explain and predict these actions among householders living in flood-prone areas. Thus they suggest that social norms and connections are better explainers and predictors about the capacity of individuals at risk to take action against flood risks.

85
2006:121). The heterogeneity nature of vulnerability factors allow researchers to have a
more in-depth understanding of how the different characteristics of a population end up
affecting perceived risks and individuals’ ability to take protective actions. The demographics
variables included in the model of this thesis are: age, gender, education, income, and
property value. These demographic factors are the most common found in empirical studies
as they are independent of each other and provide an overview about the socio-economic
characteristics of the sample (Olofsson and Öhman 2015:3). As for household
characteristics, the factors included in the model are: home ownership, housing tenure,
expected housing tenure, and the presence of vulnerable groups such as children, the elderly
and the physically disabled. The inclusion of further vulnerability factors is justified by the
findings in the literature that vulnerable groups face more challenges to take protective
actions (Olofsson and Öhman 2015:3). This thesis then will investigate whether this is also
the case among the population of this study.
Finally, this thesis justifies the inclusion of the dependent variables in the model. The
four dependent variables, or protective actions, added in the model are house raising, flood
insurance, home improvements, and relocation. House raising consists in the elevation of a
property to recommended official levels. Flood insurance is a policy that covers damage
caused by floods. Home improvements are retrofitting measures inside and outside a
property in order to sustain and reduce the impact of floods. Relocation is the intention to
move out from a flood-prone area and resettle in an area featuring lower flood risks.
These four protective actions assessed in this study differ largely in terms of the
protection level they provide against major flood risks. They also differ in terms of the
monetary costs to be implemented and available knowledge and time that householders
enjoy before undertaking them. Thus these four protective actions are expected to provide
an overview of how different levels of flood protection at the household level can be
determined by the same set of independent variables. If the results of the models, for
instance, indicate that coping appraisal variables are significantly correlated with the majority
of the protective actions, despite their different nature, it will be possible to confirm the crucial
role that coping appraisal variables play in explaining and predicting the undertaking of
protective actions. However, if results show that there is no uniformity in the models
explaining the decision to take these protective actions, it would then be possible to conclude
that the undertaking of protective actions under uncertain scenarios is more dependent on
other factors such as threat appraisal factors and vulnerability indicators. Hence, the diverse
nature of these protective actions will allow this study to test whether coping appraisal
86
variables are indeed strong explanatory factors regardless of the protective action in
question, the nature of the hazard itself, and the vulnerability and exposure levels of
communities at risk.
It is now necessary to explain the different types of home improvements added in the
model. The home improvements included in the model are flood barriers, flood-resistant
materials, water resistant walls, wall openings, drainage systems, electrical lines, and
habitable rooms installed in higher levels. The definition of each of this home improvement
seems not necessary as they are self-explanatory. The justification to add these variables in
the model is that they are the most common dependent variables included in previous flood
studies testing the explanatory power of PMT (See Bubeck et al. 2013; Grothmann and
Reusswig 2006). The inclusion of these variables in these studies are justified as they usually
assess flood events that occur between shorter intervals and can cause damage to
householders living in flood-prone areas. Thus home improvements are expected to reduce
risks against types of flood that are not generally classified as high-impact low-probability
events, as the main one investigated in this study. In addition, the inclusion of these
preventive measures are necessary to conduct a comparative analysis of the findings of this
thesis with previous ones despite the differences of the hazard risks between previous
studies and the main one investigated in this thesis.
Since the justification of every variable included in the model has now been
completed, find below the schematic view of the model of this thesis (Figure 1).
Correlation Hypotheses
This study investigates the same hypotheses of previous studies. This is necessary for
comparative analysis between the findings of this thesis with previous studies. It is only
testing the same hypotheses of previous empirical studies that this thesis can adequately
evaluate the contribution of the findings of thesis to the literature. The hypotheses of previous
studies are in regard to the relations between risk perception and decision making. For
example, Zaalberg et al. (2009:1759) identified that ‘stronger emotions’ predict the way flood
victims adopt and perceive adaptive actions. Grothmann and Reusswig, for their part, found
out that damage prevention in flood-prone areas cannot rely only on the perception of flood
risks and their potential consequences but also on ‘the possibility, effectiveness and cost of
precautionary measures’ (2006:101). This recommendation echoes Bubeck et al’s.
(2013:1327) hypothesis that ‘flood-coping appraisal is an important variable in terms of
precautionary behaviour’ (2013:1327) and Poussin et al’s. (2013:69) study which highlights
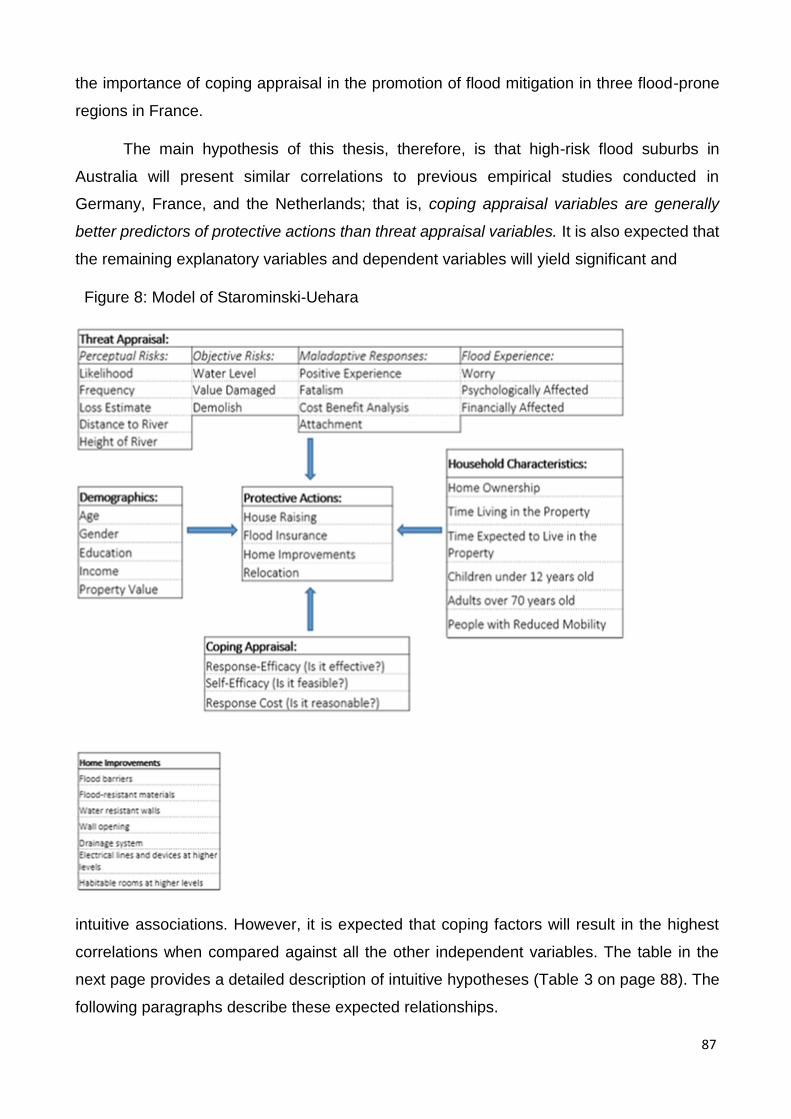
87
the importance of coping appraisal in the promotion of flood mitigation in three flood-prone
regions in France.
The main hypothesis of this thesis, therefore, is that high-risk flood suburbs in
Australia will present similar correlations to previous empirical studies conducted in
Germany, France, and the Netherlands; that is, coping appraisal variables are generally
better predictors of protective actions than threat appraisal variables. It is also expected that
the remaining explanatory variables and dependent variables will yield significant and
Figure 8: Model of Starominski-Uehara
intuitive associations. However, it is expected that coping factors will result in the highest
correlations when compared against all the other independent variables. The table in the
next page provides a detailed description of intuitive hypotheses (Table 3 on page 88). The
following paragraphs describe these expected relationships.
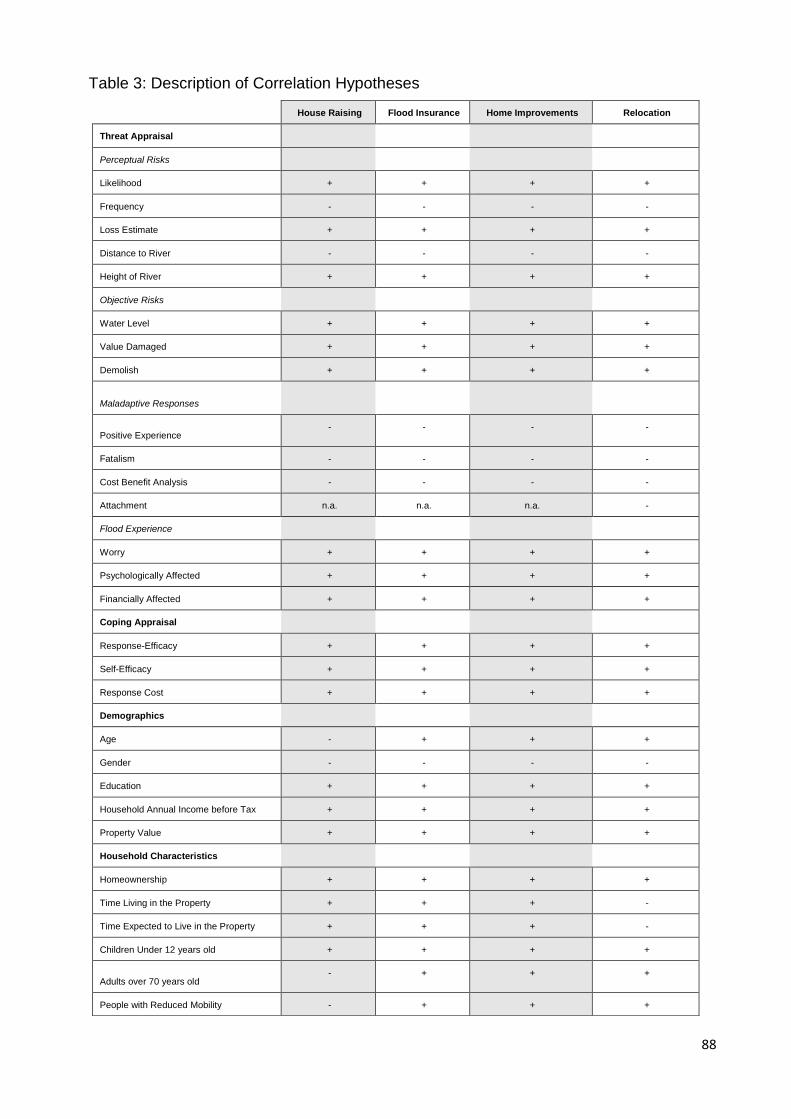
88
Table 3: Description of Correlation Hypotheses
House Raising Flood Insurance Home Improvements Relocation
Threat Appraisal
Perceptual Risks
Likelihood + + + +
Frequency - - - -
Loss Estimate + + + +
Distance to River - - - -
Height of River + + + +
Objective Risks
Water Level + + + +
Value Damaged + + + +
Demolish + + + +
Maladaptive Responses
Positive Experience - - - -
Fatalism - - - -
Cost Benefit Analysis - - - -
Attachment n.a. n.a. n.a. -
Flood Experience
Worry + + + +
Psychologically Affected + + + +
Financially Affected + + + +
Coping Appraisal
Response-Efficacy + + + +
Self-Efficacy + + + +
Response Cost + + + +
Demographics
Age - + + +
Gender - - - -
Education + + + +
Household Annual Income before Tax + + + +
Property Value + + + +
Household Characteristics
Homeownership + + + +
Time Living in the Property + + + -
Time Expected to Live in the Property + + + -
Children Under 12 years old + + + +
Adults over 70 years old - + + +
People with Reduced Mobility - + + +

89
The description of the Table 3 is organized by independent variables. It first describes
relationships between threat appraisal variables with dependent variables, followed by
coping appraisal variables, demographics, and household characteristics. In regard to threat
appraisal factors, when householders believe that major floods are more likely to happen,
they are expected to be more likely to take all the four protective actions. This is also true
when householders believe that a major flood is more likely to cause them higher flood-
related losses and a larger hazard magnitude increases the probability of property losses.
However, if householders understand that these major floods happen over longer periods of
time and they live farther from the source of flooding, these householders are expected to
become less likely to take any kind of protective action.
As for objective risks, they are all expected to feature a positive correlation with
protective actions. This means that householders that had actually experienced higher water
levels in their property, higher flood-related damages, or had to demolish their property are
all expected to be more likely to take all the protective actions included in the model. In terms
of maladaptive responses, all the correlations are expected to be negative. This is intuitively
correct as these independent variables measure the cognitive biases of individuals at risk
that justify their decisions to not take a protective action. That is, the better positive
experience a householder had after a flood event, the less likely this householder is to take
any sort of action to reduce flood risks to its property. Also, if a householder perceives that
major flood risks are of such a high magnitude, they become less likely to take any action.
This rationale also applies to individuals who argue that they have conducted a cost benefit
analysis to justify their decision to ignore the undertaking of protective actions. Householders
who argue that the benefits of living where they are, without taking any protective action, are
higher than the costs associated with protective actions are less likely to take any of the
protective actions included in the model.
In regard to flood experience, householders are expected to positively react to the
factors that measure their subjective perception of flood risks. The more worried, more
psychologically and/or financially affected a householder is about major flood risks, the more
likely this householder is to take any sort of protective action. These paragraphs summarized
the expected relationships between threat appraisal factors and protective actions. The
description of hypotheses now turn to the explanation of coping appraisal variables as well
as vulnerability factors.
All the coping appraisal factors are expected to be positive correlated with protective
actions. The more effective, the easier, and the cheaper is the perception of a householder
90
towards a protective action, it becomes more likely that these actions will be undertaken by
these individuals exposed to major flood risks. It is worth noting here that the protective
action ‘relocation’ is not regressed against coping appraisal variables. This happens because
the accurate estimation of the coping factors of this protective action could only be done
among those residents who had already relocated, which is beyond the scope of this study.
This study then evaluates the intention of current residents living in flood-prone areas to
relocate.
As for vulnerable factors seen in the model as demographic variables, they are not
expected to differ under different protective actions. This expectation, however, is expected
to change with older adults. The elderly are expected to be less likely to raise their property
because of the mobility issues it will cause. However, older adults are more likely to take all
the other kinds of protective actions. This positive correlation is expected to be the same in
terms of education, household income, and property value. Householders that feature higher
educational levels, income, and property value are expected to be more likely to take all
types of protective actions. And in terms of gender, women are expected to be more likely
to take protective actions than men.
Finally, the vulnerability levels of householders can also be assessed based on
whether they own the property they live in or not, the time they have lived in the property,
the time they expect to continue living there, and the presence of vulnerable groups in the
household. Householders that own their property and live with children under twelve years
old are expected to be more likely to take all protective actions. However, householders that
have lived longer periods in their property and/or expect to continue to live for many years in
their flood-prone property are less likely to relocate, despite being expected to take other
protective actions. Also, householders living with the elderly and the disabled are expected
to not raise their property to reduce their flood risks although they are more likely to take
other protective actions. These are the descriptions of the correlations found in the
hypotheses table.
Conclusion
This chapter presented the relevance of the PMT for a mitigation study like this thesis has
focused on by collecting and analysing data on individual risk perception. It did so by
reviewing how previous studies tested this theory, in addition to introducing the hypotheses
of these studies and presenting their main findings. The findings of this model, supported by
qualitative data, will then be compared against hypotheses to assess whether regression

91
analysis confirms these intuitive correlations and how these findings contribute to the
literature. This chapter also explained and justified the addition of each set of independent
variables. This explanation and justification was necessary to provide a theoretical
background that sustains the main argument of this thesis. The main argument of this thesis
is that the decision-making process of protective actions depends on the conditions
(perceived hazard risks, perceived capacity to take action and vulnerability factors), as
regression analysis highlights; and the circumstances of a population at risk such as
exposure and the nature of a threat and of protective actions, as qualitative data indicate.
92
Chapter 5: Method
Introduction
This chapter continues answering the question: How does a theoretical framework based on
PMT help explain decision making about preparing for flood risk? It does so by describing
the methodology which operationalized the theoretical framework introduced in the previous
chapter. The primary concern in this regard is to highlight the replicability of the research
design and the validity and generalizability of the findings which emerge as a consequence
in the next two chapters (chapters six and seven, which present the results of this thesis).
As such, the discussion here has three elements. It begins by detailing the ‘where’ and the
‘how’ of data collection. This initially means discussing the way in which the study’s survey
data were generated. This chapter, therefore, defines the geographical and demographical
setting within which the data were gathered (with explicit reference to flood risk) before
setting out the details of the pilot study that preceded the distribution of the final survey and
the ethical considerations that were involved. Thereafter, the nature of the sample is
discussed in terms of response rate, the participants and the validity of the sample. However,
in this thesis qualitative data are also used. This was generated via fieldwork observations,
informal interviews and an open-ended survey question. This second component of the
methodology is also outlined below and justified in terms of its ability to substantiate
quantitative findings. Finally, this chapter discusses the treatment of the data by first defining
the appropriateness of regression to this project and then defining variables and presenting
the descriptive statistics of independent and dependent variables.
The Research Setting
The population and the geographical location of this study are the householders living in
eleven Southern and inner Southern suburbs in Brisbane, Queensland. The location of these
suburbs as well as their respective flood maps can be found in Figure 9 (page 95). The first
map sets out the suburbs, the second map outlines the geographical parameters of the three
largest recorded flood events in Brisbane’s history, which occurred in 1893, 1974 and 2011.
The third map is an overlay of the first two in which the flooded areas are superimposed on
the suburbs. What we can see in this last map is that each flood significantly affected the
region that has been selected for this study. In other words, this is an appropriate region for
a study of this kind because of its exposure to flood risks. This overlay also highlights how
risk is concentrated in this geographical area. This is important because it increases the
chances that a significant number of householders living in this region have experienced
93
floods events and as a result have taken some protective actions to reduce their risks.
Descriptive statistics showed that seventy percent of respondents participating in this study
were flooded before whereas thirty percent had never been flooded.23
This area also features a wide variety of socio-economic indicators. This is important
because in the model proposed in chapter four, the demographic variables -- age, gender,
education, household income and property value -- are the means through which the sample
is stratified. This is based on the assumption that groups differentiated by these categories
perceive risks differently and have different capacities to address these risks. In other words,
a priori, this region was defined as appropriate for a study of this nature because of the
diversity of its population. In addition, this region is exposed to different flood risks (river,
creek, overland, and storm tide flooding) and its residents have experienced different levels
of flood damage. This overall diversity in terms of vulnerability and exposure provides
variability to data collection which supports statistical analysis and ultimately the
generalizability of findings.
The Development of the Questionnaire and the Pilot Study
Survey questions were initially designed after several informal consultations with
householders living in the region studied in this thesis, in addition to flood management
scholars and practitioners in Queensland’s local and state governments. The survey that
was used in this thesis is attached in Appendix (page 183). It was created specifically for this
research project and is a self-completion survey comprised of closed questions that ask for
both subjective and factual content. The subjective questions are organized along a typical
five-point Likert-scale with end-labelled values while the factual questions come in scalar,
fully-labelled values. Krosnick and Fabrigar (1997) explain that fully-labelled scales are
easier to answer, more reliable and have greater applicability to factual questions than end-
labelled scales (see also, Dillman and Christian 2005). There are various ways that an end-
labelled scale can be visually displayed in a survey (Christian and Dillman 2004). In this
questionnaire, to help respondents remember the direction of the scale, a visual display of
‘strong disagreement’ was placed on the first value of the scale whereas a sign of ‘strong
agreement’ was placed over the last sign of the scale.
23 Four percent (N:17) of respondents’ property were flooded in the 1893 flood event. Fifty six percent (N:264) of respondents’ property were flooded in the 1974 disaster. Sixty four percent (N:303) of respondents’ property were flooded in the 2011 event. And fifteen percent (N:71) of respondents’ property were flooded in the 2013 event.

94
Factual questions often use numeric bands, despite the fact that they provide less
information than exact values, because respondents might be sensitive to providing exact
factual data or might struggle to remember exact values (Campanelli et al. 2011). Since it
was necessary to balance the range and interval of these numeric bands, their values were
organized in a way that would ensure that they would not affect the mean and variance of
grouped data (Newbold and Carlson 2003). In relation to subjective questions, Likert scales
were used to collect data. The exact number of these scales, however, have been the object
of heated debate in the literature. Some argue that a three-point scale is good enough as a
rating instrument (Jacoby and Matell 1971:499) whereas others argue that larger scales,
such as ten-point end-defined scales, are better in terms of strengthening the reliability of
data (Cummins and Gullone 2000:74). Thus it is necessary to find a balance in a survey
instrument. Garner and Hake (1951:446) and Guilford (1954) both stress that this balance is
achieved by the use of a number of scales that are neither too short, since it reduces the
raters’ discriminative powers, nor too long, as it risks going beyond a rater’s limited powers
of discrimination. In this thesis, a five-point Likert scale was chosen after empirical testing
through the pilot process (see below). The primary reasons for choosing a five-point scale
are the provision of a mid-point for neutrality (Garland 1991:66), reduce social desirability
bias (respondents’ desire to please interviewer) and help reinforce the validity and reliability
of responses by allowing researchers to identify the direction and the strength of
householders’ opinion about a topic (Garland 1991).
The other debate surrounding Likert-scales relates to their capacity to measure self-
efficacy and whether they can be used for parametric statistics. Maurer and Pierce
(1998:329) argue that Likert-scales can, like traditional measures, effectively measure
people’s judgments of their own capability to take a certain action. In this regard they are
said to be effective for measuring the magnitude, strength and generality of self-efficacy
(Maurer and Pierce 1998:324). Magnitude is about the belief that a person can perform an
action; strength reflects the person’s confidence to perform this action at a certain level; and
generality is the extent to which self-efficacy in one situation extends to other situations
(Maurer and Pierce 1998:324). Thus, after comparing different techniques, Maurer and
Pierce (1998:328) demonstrated that Likert and traditional measurement formats provide
similar results when measuring self-efficacy. In relation to parametric statistics, Norman
(2010:626) posits that the literature often argues that Likert scales, because they are ordinal,
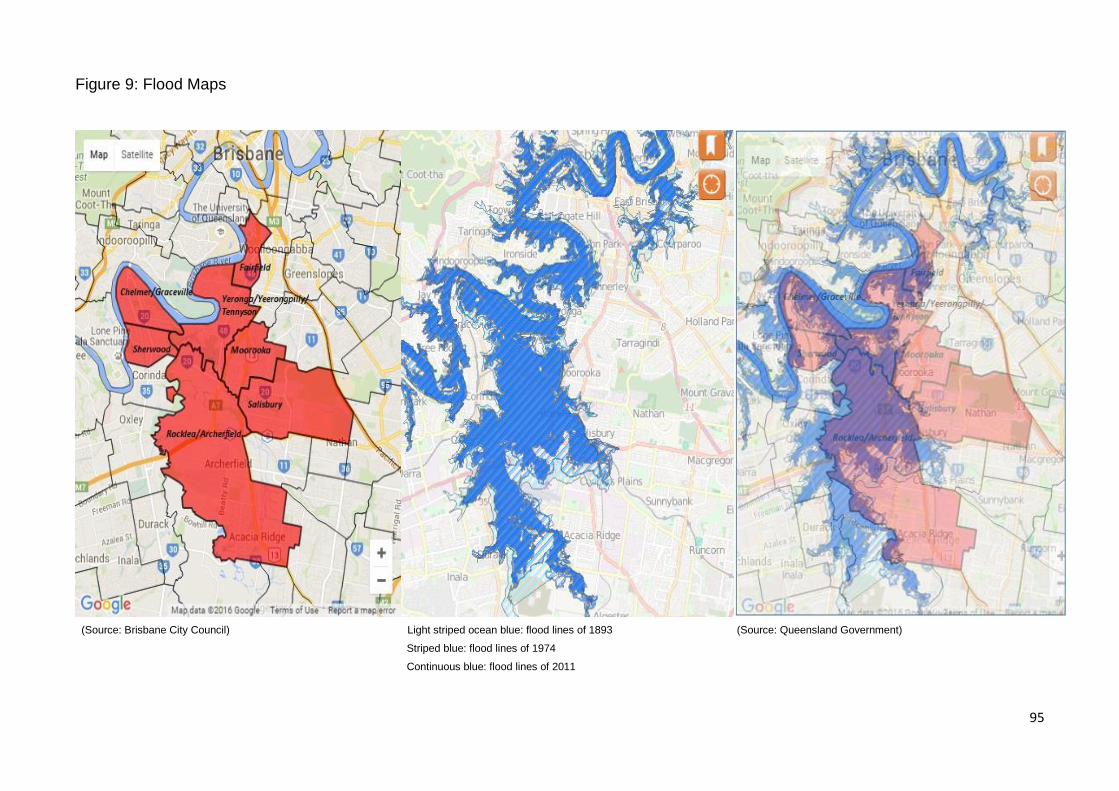
95
Figure 9: Flood Maps
(Source: Brisbane City Council) Light striped ocean blue: flood lines of 1893 (Source: Queensland Government)
Striped blue: flood lines of 1974
Continuous blue: flood lines of 2011

96
cannot be used for parametric studies; in other words, Likert scales do not meet the criterion
of a probability distribution based on a fixed set of parameters (Jamieson 2004:1217)
because the intervals between values cannot be presumed to be equal. This is important
because it is largely agreed that parametric models produce more accurate and precise
estimates than non-parametric methods, whose parameter set is not fixed and can increase
or decrease if more information is added in the model. In addition, as Norman (2010:627)
states, the literature tends to criticize choice statistical models, such as those based on Likert
scales, because their sample size are often too small and the data may not be normally
distributed. However, after deconstructing each of these concerns, Norman concluded that
not only Likert data but also small sample sizes and unequal variances with non-normal
distributions can be used for parametric statistics without fear about the robustness of the
data or researchers ‘coming to the wrong conclusion’ (2010:631).
Early drafts of the survey were piloted with individuals from the population of the
study. An initial draft of the questionnaire was used to interview fifteen householders living
in the geographical region under scrutiny. This process provided evolving feedback about
the clarity and presentation of questions and the extent to which the survey as a whole was
seen as something valid which would subsequently encourage a reasonable response rate.
Key to this was the initial confirmation that each protective action within the model was salient
in the eyes of the respondents. This was important because protective actions are context-
specific. What will be considered to be a relevant protection action in one region in relation
to one flood risk may not be appropriate in another that is exposed to a different type and
level of risk. The initial piloting also influenced the nature of those questions that explained
the decision to take or not a protective action and more particularly in regard to heuristics,
which are the maladaptive responses to these actions (for example, questions 19 and 20 on
page 198). The pilot process also assisted with the wording of questions by allowing for the
translation of the technicalities of flood management into understandable language that
could be consumed on the doorstop.
These changes to the survey were subsequently re-tested through a focus group of
ten participants who were living in the flood areas. The clarity of the survey questions and
answers, in addition to its presentation, was established through this process because only
small-scale changes to wording were identified as an issue. These included the wording of
sentences that led to ambiguity such as the heuristics statements (see questions 19 and 20
on page 198). Hence the formative interviews and focus group feedback, as methods
97
literature predicts, both improved the clarity of the survey and lightened the burden on
participants (Collins 2003; Van Teijlingen and Hundley 2002). Data collected from these
observations were excluded from final results.
Multi-Method Qualitative Methodology
Field observations started at the early development of the questionnaire. This preliminary
fieldwork allowed the investigator to ‘discover’ the field and identify patterns of behaviour
(Hobbs and Wright 2006:277) among the population included in this study. These initial field
observations were important in the sense that they generated a series of reflectiveness
exercises over the format and content of this survey, as Hobbs and Wright (2006:203)
propose. A second round of field work occurred during the distribution of surveys. All the
householders participating in this study were visited by the investigator at least twice during
the process of data collection. The first time householders were visited was when the
questionnaire was dropped in the letterbox. If the questionnaire was not returned within two
weeks, a friendly reminder was dropped in the same letterbox. These field visits to the
participating households generated further qualitative data through occasional and informal
interviews as well as additional field observations in regard to protective actions (mainly
house raising) and the levels of exposure (proximity to water sources) and vulnerability
(socio-economic indicators). These informal interviews, or ethnographic type of
conversations that occur during the course of participant observation (Spradley 2016:123),
were important in the sense that they helped the investigator to collect further data that
produced knowledge about the practices found among the population (Brinkmann
2014:1008).
However, this qualitative data, which also include comments left in the survey by
respondents, were used only to provide further nuances to regression. Final conclusions
made in this thesis were not generated based on this qualitative data. This is important to
highlight because, despite the insights and the amount of information that field observations,
informal conversations and comments generated, this qualitative data risk reinforcing
individualistic tendencies and subjectivity (Alldred and Gillies 2002:151) in the findings of this
thesis. Atkinson and Silvermann (1997:305) warn to the risks of lack of neutrality in scientific
projects that rely only on interviews for data collection. We have lived in a postmodern society
in which a person’s self is continuously reinforced due to the confessional settings that
predominantly exist around us and range from talk shows to research based solely on
interviews (Atkinson and Silvermann 1997:305).
98
Ethical Considerations
Every study with humans involves some degree of risk. Marczyk et al. (2005:250) explain
that these risks range from ‘minor discomfort or embarrassment caused by somewhat
intrusive or provocative questions to more severe effects on participants’ physical or
emotional well-being’. After providing a historical background on the advancements of ethical
considerations in research, Marczyk et al. (2005) highlight a series of principles that
researchers should carefully consider during their research. The first fundamental principle
is respect, which means treating individuals as autonomous agents and protecting
vulnerable participants. Beneficence is another key ethical principle and it means that
investigators need to be kind and ‘do no harm’ to participants by maximizing their benefits
and minimizing potential harms. Another principle is justice, which relates to fairness both in
terms of the selection of procedural inputs and intended and actual outcomes. This is a
particularly important principle as it addresses issues of discrimination in research. These
three principles (respect, beneficence, and justice) underpin the right of participants for
confidentiality (Marczyk et al. 2005). Confidentiality in research means that participants have
the right of ‘control over the use of his or her personal information as well as the right to have
the information that he or she shares with research team kept private’ (Marczyk et al. 2005:
262). These principles are reflected in a number of ethical practices and processes.
In terms of question construction, for example, some questions asked for information
about issues that could provoke undesirable memories and emotions that could have caused
discomfort, particularly amongst the most vulnerable and highly exposed to floods. The
framing of these sensitive questions (for example, questions 2, 3 and 11 in Appendix on
page 194) respected a form of words which would not cause offense to respondents. The
survey also sought to use plain language wherever possible to ensure that participants would
not feel threatened in any way by the technical aspects of this project. It also provided a
cover letter to participants outlining the confidentiality and anonymity of the collected data. It
was stressed in this cover letter that participation in this survey was voluntary and all answers
provided would be used for statistical purposes only and any private information (such as
home address) would be kept secure at all stages of the project. Every survey dropped in
the household was provided with a returned pre-paid envelop to ensure that these returned
surveys would reach directly the researcher. Once the information provided by respondents
was coded and digitalised, it was placed in a secured file at the School of Political Science
and International Studies at the University of Queensland. Only the researcher of this project
99
had access to this file. As for the digital data, they were anonymized immediately and saved
in a secured computer in the University of Queensland. The cover letter also highlighted how
the participation of respondents would be helping their community through the donation of
five dollars for each returned survey to a local community centre highly respected amongst
its members through the provision of empirical data that would help inform decision making
at the government level. Finally, the research project was reviewed and appraised by an
institutional review board, based in the School of Political Science at the University of
Queensland, which approved the project before it began (see page 209).
The Reliability of Results
This section covers the reliability of the results provided in the subsequent chapters. A key
issue in this regard is validity. Thus assessing the validity of this experiment is important.
Validity is the degree to which results are attributable to the independent variable and not
some other rival explanation (Rubin and Babbie 2012:183). The key measure for validity is
confidence that changes in the dependent variable are actually caused by the independent
variable (Rubin and Babbie 2012:183). In order to determine whether validity presents strong
evidence of cause-and-effect, we need to look at different aspects of a research design that
could threaten validity and ensure that these have been minimized (Rubin and Babbie
2012:195).
All these threat elements were covered in this thesis but in different sections and
chapters. For instance, i) the definition of each variable is found in this chapter (pages 108
and 114); ii) the maturation (or passage of time) of data collection and events considered
was specified and presented earlier in this chapter (page 95) and on chapter three (page
61); iii) the testing of the relevance of these variables was conducted during pilot surveys
(page 96); iv) the instrumentation of data are also explained in this chapter (pages 106 and
107); v) statistical regression justification is found later in this chapter (page 103-105) and in
the presentation of each model in the ‘Results’ chapters (pages 121, 132, 141 and 154); vi)
research reactivity, or ‘the changes in outcome data that are caused by researchers or
research procedures rather than the independent variable’ (Rubin and Babbie 2012:195), is
also presented in the ‘Results’ chapters (page 121); vii) selection bias is explained in this
section through the presentation of survey rates and indicators (pages 102); and viii) attrition
(or experimental mortality), the drop-out rates, is also presented in this chapter when
descriptive statistics is introduced on tables featuring the percentages of each independent
variable (see N of each variable) (page 115). Cox (2016) recommends a minimum of fifty

100
cases per independent variable and explains that larger samples are needed because
maximum likelihood coefficients are large sample estimates. All the independent variables
added in the model used here feature more than fifty observations.
Alongside these aspects of research design, the key measure of validity is the
relatively high response rate for this type of study (see Table 4). The questionnaire was
delivered to 1796 householders. The number of surveys returned was 469 (26.16% return
rate). Two incentives were promised in the cover letter for returned questionnaires: 1) that
all respondents24 would receive a subsequent letter with details about the initial results of the
survey; 2) that every survey completed would lead to a donation of five dollars to a local
community centre in the region that provided a number services to residents during the 2011
floods (Yeronga Community Centre). Questionnaires and reminders were delivered between
late spring and early summer of 2015. No flood warnings or any other weather issues were
in effect during that time. This is important because any abnormality during this period could
have had an effect on the results.
Table 4: Comparative Survey Return Rate with Previous Studies
Type of Survey Number of Participants (N) Returned Rate
Starominski-Uehara (2016) Dropped in letterboxes 469 26.2%
Bubeck et al. (2013) Telephone-aided 752
Poussin et al. (2011) Mail 885 10.5%
Zaalberg et al. (2009) Mail 516 32.3%
Grothmann and Reusswig (2006) Telephone-aided 157
As for external validity, this study selected householders to yield a distribution of respondents
reflecting the different levels of flood risks and socio-economic indicators within the selected
24 ‘Respondent’ can be any person living in the property. Survey testing, qualitative data, field observations and empirical data indicate, however, that the person who filled out the survey was likely to be the head of the household and also the most knowledgeable about flood risks. This is because respondents who express little or no interest in participating commonly stated that they would not mail back the questionnaire because they were not in position to answer these questions (e.g. renters and those with no flood experience whatsoever). Conversely, many of returned surveys included additional comments left by respondents indicating that these respondents were not only the ones making decisions in terms of protective actions but also had something else to share about flood risks faced by the property they lived in. In addition, demographic indicators as seen on Table 5 (on page 101) and Table 9 (on page 115) strengthen the probability of heads of the household comprising the core of respondents of this study.
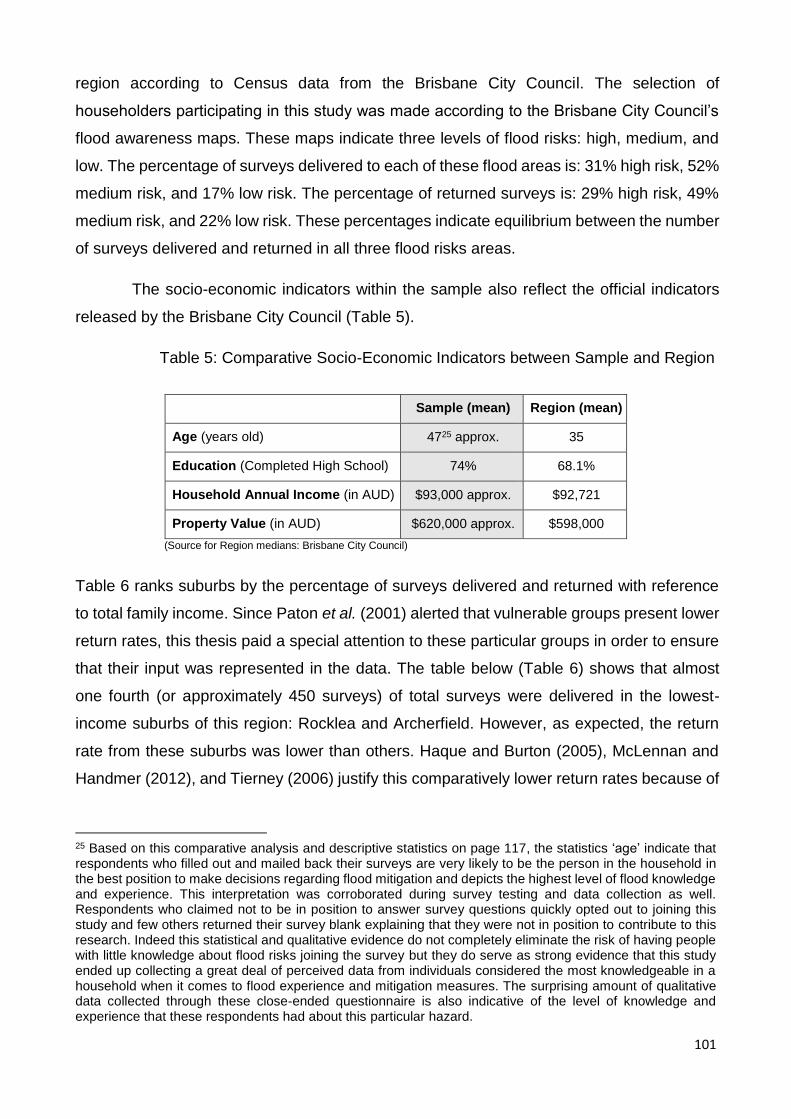
101
region according to Census data from the Brisbane City Council. The selection of
householders participating in this study was made according to the Brisbane City Council’s
flood awareness maps. These maps indicate three levels of flood risks: high, medium, and
low. The percentage of surveys delivered to each of these flood areas is: 31% high risk, 52%
medium risk, and 17% low risk. The percentage of returned surveys is: 29% high risk, 49%
medium risk, and 22% low risk. These percentages indicate equilibrium between the number
of surveys delivered and returned in all three flood risks areas.
The socio-economic indicators within the sample also reflect the official indicators
released by the Brisbane City Council (Table 5).
Table 5: Comparative Socio-Economic Indicators between Sample and Region
Sample (mean) Region (mean)
Age (years old) 4725 approx. 35
Education (Completed High School) 74% 68.1%
Household Annual Income (in AUD) $93,000 approx. $92,721
Property Value (in AUD) $620,000 approx. $598,000
(Source for Region medians: Brisbane City Council)
Table 6 ranks suburbs by the percentage of surveys delivered and returned with reference
to total family income. Since Paton et al. (2001) alerted that vulnerable groups present lower
return rates, this thesis paid a special attention to these particular groups in order to ensure
that their input was represented in the data. The table below (Table 6) shows that almost
one fourth (or approximately 450 surveys) of total surveys were delivered in the lowest-
income suburbs of this region: Rocklea and Archerfield. However, as expected, the return
rate from these suburbs was lower than others. Haque and Burton (2005), McLennan and
Handmer (2012), and Tierney (2006) justify this comparatively lower return rates because of
25 Based on this comparative analysis and descriptive statistics on page 117, the statistics ‘age’ indicate that respondents who filled out and mailed back their surveys are very likely to be the person in the household in the best position to make decisions regarding flood mitigation and depicts the highest level of flood knowledge and experience. This interpretation was corroborated during survey testing and data collection as well. Respondents who claimed not to be in position to answer survey questions quickly opted out to joining this study and few others returned their survey blank explaining that they were not in position to contribute to this research. Indeed this statistical and qualitative evidence do not completely eliminate the risk of having people with little knowledge about flood risks joining the survey but they do serve as strong evidence that this study ended up collecting a great deal of perceived data from individuals considered the most knowledgeable in a household when it comes to flood experience and mitigation measures. The surprising amount of qualitative data collected through these close-ended questionnaire is also indicative of the level of knowledge and experience that these respondents had about this particular hazard.
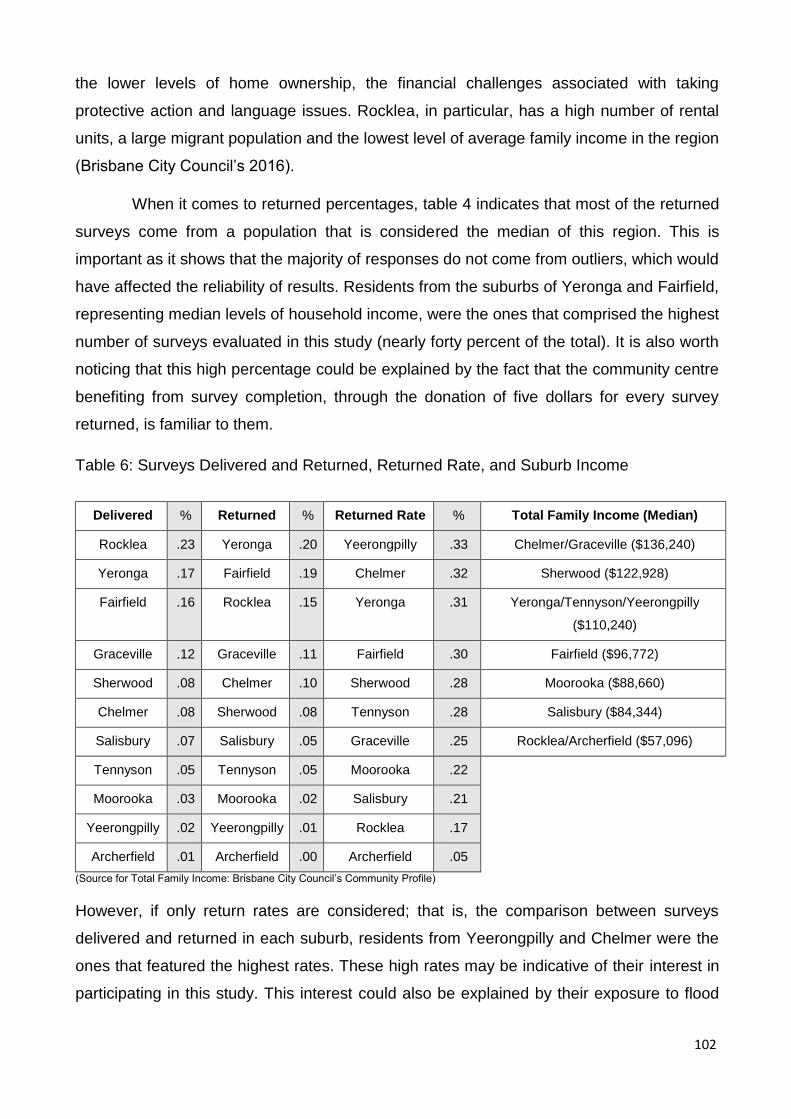
102
the lower levels of home ownership, the financial challenges associated with taking
protective action and language issues. Rocklea, in particular, has a high number of rental
units, a large migrant population and the lowest level of average family income in the region
(Brisbane City Council’s 2016).
When it comes to returned percentages, table 4 indicates that most of the returned
surveys come from a population that is considered the median of this region. This is
important as it shows that the majority of responses do not come from outliers, which would
have affected the reliability of results. Residents from the suburbs of Yeronga and Fairfield,
representing median levels of household income, were the ones that comprised the highest
number of surveys evaluated in this study (nearly forty percent of the total). It is also worth
noticing that this high percentage could be explained by the fact that the community centre
benefiting from survey completion, through the donation of five dollars for every survey
returned, is familiar to them.
Table 6: Surveys Delivered and Returned, Returned Rate, and Suburb Income
Delivered % Returned % Returned Rate % Total Family Income (Median)
Rocklea .23 Yeronga .20 Yeerongpilly .33 Chelmer/Graceville ($136,240)
Yeronga .17 Fairfield .19 Chelmer .32 Sherwood ($122,928)
Fairfield .16 Rocklea .15 Yeronga .31 Yeronga/Tennyson/Yeerongpilly
($110,240)
Graceville .12 Graceville .11 Fairfield .30 Fairfield ($96,772)
Sherwood .08 Chelmer .10 Sherwood .28 Moorooka ($88,660)
Chelmer .08 Sherwood .08 Tennyson .28 Salisbury ($84,344)
Salisbury .07 Salisbury .05 Graceville .25 Rocklea/Archerfield ($57,096)
Tennyson .05 Tennyson .05 Moorooka .22
Moorooka .03 Moorooka .02 Salisbury .21
Yeerongpilly .02 Yeerongpilly .01 Rocklea .17
Archerfield .01 Archerfield .00 Archerfield .05
(Source for Total Family Income: Brisbane City Council’s Community Profile)
However, if only return rates are considered; that is, the comparison between surveys
delivered and returned in each suburb, residents from Yeerongpilly and Chelmer were the
ones that featured the highest rates. These high rates may be indicative of their interest in
participating in this study. This interest could also be explained by their exposure to flood

103
risks and flood experience and by the opportunity that these residents enjoyed to voice their
concerns over the issue while revealing the protective actions they had undertaken. Also, it
is important to note that residents from these suburbs, Chelmer in particular, present the
highest household income and levels of education in the region of this study, according to
the Brisbane City Council’s Community Profile.
Hence the proximity of the parameters of sample and region supports the
generalization of findings. That is, findings from this study are useful to understand the
perception of flood risks and the decision making processes of householders not only
participating in this study but also of all those living in the selected region, and perhaps
householders living elsewhere under similar flood risks and socio-economic conditions.
Finally, there were very few complaints from respondents in regard to their
understanding of the questions listed in the questionnaire. In addition, a great number of
respondents left comments along the survey and in the section for further comments in the
questionnaire, which indicates the relevance of the topic for these respondents. Some
respondents, however, did mention that some of these questions were not relevant to their
specific case, and so they left blank the responses to these questions.
Regression Analysis
The main goal of this study is to determine whether there are relationships between the
independent variables and the dependent variables in the model described in the previous
chapter. Wilson and Lorenz (2015:6) explain that there are two types of relationships
potentially connecting independent and dependent variables: functional and statistical.
Functional relationships are expressed by mathematical formulae (Wilson and Lorenz
2015:6); for instance, velocity equals distance divided by time. Statistical relationships,
however, are not as exact as functional relationships (Wilson and Lorenz 2015:6). Statistical
relationships have two identifiable markers. The dependent variable has a distribution
associated with it and has a relationship that can be described by the mean and its predictor
variables in a systematic fashion (Wilson and Lorenz 2015:6). This relationship is expressed
through a line (one predictor) or plane (two or more predictors) with the expected value as
the central point of a distribution of possible results of the dependent variable (Wilson and
Lorenz 2015:40). Statistical relationships also present a variation of the observations around
the systematic part (Wilson and Lorenz 2015:6). For instance, the relationship between the

104
decision to take out flood insurance and perceived cost of flood insurance before and after
a flood event features a statistical relationship.
Logistic regression is used in this study. This regression is preferred as a model for
binary responses since it relies on odds, which helps the interpretation of results and society
can easily relate to such findings (Wilson and Lorenz 2015:30). Another advantage of logistic
regression is that it is appropriate for prospective and retrospective studies. A prospective
study involves the selection of two comparable groups, one for treatment and the other for
control, to be observed over a period of time (Wilson and Lorenz 2015:28). A prospective
study is conducted to determine whether there is an association between certain explanatory
variables and the occurrence of a particular event (Wilson and Lorenz 2015:28).
Retrospective studies are used for investigating rare conditions. The benefits of conducting
retrospective studies are that i) they are relatively inexpensive; ii) the sample sizes do not
have to be extremely large; iii) they require less time than prospective studies because the
outcome being studied already occurred; and iv) they can simultaneously look at multiple
risk factors (Wilson and Lorenz 2015:28). Thus a retrospective study compares individuals
who experienced a particular event with individuals who did not experience this event. In this
study, therefore, information on the independent factors associated with the disaster was
obtained retrospectively for each person participating in the study.
As the general form of the model, it is:
In this ‘p1’ is the probability of the outcome Y, given X1 ... XI are the independent variables,
and β1 ... βI are the regression coefficients estimated from the data. Logistic regression
model forms a linear combination of the independent variables to impact the logit, which is
log (probability of event/probability nonevent) (Wilson and Lorenz 2015:33). On the logit
scale the relation is linear, on the probability scale it has the shape of an S, and on the odds
scale it is also nonlinear (Wilson and Lorenz 2015:18).
Logistic regression is also useful for this study because it calculates the probability
of success (e.g. taking out flood insurance) over the probability of failure of a dependent
variable (e.g. not taking out flood insurance). Logistic regression is also different from other
models such as linear regression and discriminant analysis. In logistic regression ‘the
105
outcome variable … is binary or dichotomous’ (Hosmer and Lemeshow 2004:1) whereas in
linear regression the outcome is assumed to be continuous (Hosmer and Lemeshow 2004).
Logistic regression is also more adequate than discriminant analysis when there are different
types of independent variables in the model. Discriminant analysis requires continuous
independent variables (Cox 2016). The goal of logistic regression is finding the best fitting,
most parsimonious and interpretable model that describes the relationship between a
dependent and a set of independent variables (Hosmer et al. 2013).
Odds ratio is the primary parameter estimated when fitting a logistic regression
model (Kleinbaum and Klein 2010:32). It is a measure of association between an exposure
and an outcome (Szumilas 2010:227). It provides then an estimate for the relationship
between two binary variables which examines the effects of other variables on that
relationship (Bland and Altman 2000). For instance, this coefficient is ‘the estimated increase
in the log odds of the outcome per unit increase in the value of the exposure’ (Szumilas
2010:227). Hosmer et al. state that ‘the simple relationship between the coefficient and the
odds ratio is the fundamental reason logistic regression has proven to be a powerful analytic
research tool’ (2013:53).
There are other important aspects to note about logistic regression that are relevant
to this thesis. The first is that it does not have a means of assessing the goodness of fit
between observed values and expected variables, ‘at least not one that has been agreed
upon by statisticians’ (Wilson and Lorenz 2015:35). As a consequence, this thesis adopts
the Nagelkerke modification R-square because it is the most reported of the R-square
estimates in logistic regression and because it provides a more reliable measure of
relationships (Wilson and Lorenz 2012: xiii). Another is multicollinearity, which occurs when
there is a high correlation of (at least) one independent variable with a combination of others
(Mansfield and Helms 1982:158). There are two ways to determine whether there is
multicollinearity among independent variables. The first way is looking at a correlation matrix
to identify whether the independent variables correlate above a certain level. Mansfield and
Helms (1982:159) suggest that correlations with coefficients above .75 could indicate signs
of multicollinearity. Another way to determine multicollinearity is to examine the Variance
Inflation Factor (VIF). A VIF of greater than 5 is generally considered evidence of
multicollinearity (Mansfield and Helms 1982:159). This thesis looks at the correlation matrix
to identify possible cases of multicollinearity.

106
Finally, it is worth emphasising that the assumptions of logistic regression are met
in this study (see Laerd 2013 for an in-depth overview of these assumptions). The
assumptions of logistic regressions are that: i) the dependent variable has only two
categories; ii) there is one or more independent variables that are either continuous (infinite
number of possible values) or categorical (when a variable can take only one value of a
limited number of possible values); iii) there are independence of observations and each
dependent variable is mutually exclusive and exhaustive (i.e. a home is either raised or not),
and; iv) there is a minimum of fifty cases per explanatory variable, as Cox (2016)
recommends, because ‘larger samples are needed than for linear regression because
maximum likelihood coefficients are large sample estimates’.
Model Selection
The goal of a model is to select the variables that result in the best model. To achieve this
goal, it is necessary to have i) a plan for selecting variables and ii) a set of methods for
assessing the adequacy of the model in terms of individual variables and overall performance
(Hosmer et al. 2013:305). The traditional approach to model building involves seeking the
most parsimonious model that still accurately reflects the true outcome experience of the
data (Hosmer et al. 2013:92). Minimizing the number of variables makes a model more likely
to be numerically stable and more easily adopted for use (Hosmer et al. 2013:92). The more
variables included in a model, however, the greater the estimated standard errors become,
and the more dependent the model becomes on the observed data (Hosmer et al. 2013:92).
Thus overfitting the model, a conditional selection bias that selects independent variables
influenced by the more extreme values (Steyerberg et al. 1999:935), has implications on the
predictability power of the model. As Wang et al. (2007:62) explain model selection depends
on what the statistical analysis aims to achieve. If goodness of fit (or interpretation of
coefficients) is the main goal, the study then should adopt a higher p-value in determining
statistical significance so that more covariates are added in the final model, which may help
explain the phenomenon observed. A high p-value means a higher probability of finding the
observed, or more extreme. In this sense, Lee and Koval (1997:559) argue that the choice
of p-value = 0.05 is too stringent, often excluding important variables from the model.
However, if the objective is to build a model with strong predictability power, researchers
may adopt a lower p-value.
This study aims to build the most parsimonious model that not only accurately
explains variance in a dependent variable but also features a strong predictability power. To

107
build this model, this study decided to use the stepwise method26. The main reason for
adopting this selection of independent variables is that, as Hosmer et al. (2013:116) explain,
outcomes investigated are relatively new and the important covariates may not be known
and associations with the outcomes not well understood. In these cases, studies like this one
decide to collect many possible covariates and screen them for significant associations
(Hosmer et al. 2013:116). The benefit of employing a stepwise selection procedure is that it
‘provides a fast and effective means to screen a large number of variables, and to fit a
number of logistic regression equations simultaneously’ (Hosmer et al. 2013:125).
Steyerberg et al. (1999), however, highlights the issues with stepwise selection methods.
The two main problems of these methods are that they are ‘biased estimation of the
regression coefficients’ (Steyerberg et al. 1999:935) and this biased is caused by the size of
the sample and the risks that ‘one or random covariates are selected’ (Steyerberg et al.
1999:935).
In this study, all independent variables were included and then individually
eliminated, based on the highest significant values. This is the backward stepwise method.
The independent variables kept in the final model were the ones with p-values below 0.05.
Significant values, or p-values, lower than 0.05 indicate strong evidence against the null
hypothesis27 that the coefficient is zero (Cox 2016). Thus the remaining independent
variables in each model were significantly correlated with a dependent variable and the final
model presents a strong explanatory and, particularly, predictability power. This regression
analysis was done using SPSS Statistics 23. In addition to help select variables for this
model, this software also tested the dataset for multicollinearity. As mentioned,
multicollinearity occurs when there are high correlations among predictor variables, leading
to unreliable and unstable estimates of regression coefficients (Allison 2012:60).
Independent variables were discarded if correlation coefficients were higher than 0.5 (Field
2009).
26 Stepwise regression is a method of fitting a regression model in which the choice of covariates occurs automatically. In each step, an independent variable is added or subtracted according to a specified criterion (Draper and Smith 1981). The specified criterion in the model of this study was the p-value of 0.05. The variables that presented higher p-values were individually subtracted from the model until the final model presented only variables featuring a p-value equal or below 0.05. 27 Null hypothesis is the ‘no difference’ of ‘no association’ hypothesis to be tested (usually by means of a significance test) against an alternative hypothesis that postulates non-zero difference or association’ (Everitt and Skrondal 2002:307). In other words, the prediction that there is no relationship between the independent and dependent variables (Hinton 2014:352)

108
Definitions and Descriptive Statistics of Variables
In the previous chapter the sets of variables used in the model were introduced and justified.
This section provides a more detailed definition of the variables included in this thesis. This
is important as it enhances the replicability of the study and permits other researchers to
compare results across different models. Descriptive statistics for each of these variables
are also provided so that the reader can have a basic understanding of the data used in the
thesis prior to analysis.
Dependent Variables
The four dependent variables used in this study are protective actions. They were selected
because they are the most common protective actions among the population of this study.
Additionally, these variables are important for comparative analysis because they are i)
different in nature; ii) are motivated by different factors; and iii) differ in the level of protection
they provide to major flood risks. These protective actions are also different in terms of
implementation costs, feasibility (time and knowledge householders have available to
undertake them), and perceived efficiency. Thus it is important to understand how these
different protective actions are explained by the same set of independent variables so that a
comparative analysis regarding the opportunities and challenges to undertake them can be
made in the following chapters. The four dependent variables and their respective definition
are (Table 7):
Table 7: Definition of Dependent Variables
Dependent Variables Definition
House Raising The elevation of a home to recommended official levels against major floods
Flood Insurance An insurance policy that covers damage caused by floods
Home Improvements Retrofitting a home (inside and outside) to sustain and reduce the impact of floods
Relocation Intention to move out from a flood-prone area and resettle in an area featuring
lower flood risks
Descriptive Statistics of Dependent Variables
In absolute numbers and comparative percentage terms, flood insurance (N: 393) is the most
popular protective action among respondents. The percentage of householders that have
taken out flood insurance is 88% (N: 347) against 12% (N: 46) of householders who said

109
that they have not purchased flood insurance. Followed by flood insurance, home
improvements (N: 338) is the second most popular protective action but significantly lower
in absolute and relative numbers if compared against flood insurance. The percentage of
householders that made some type of home improvements is 39% (N: 132) against 61% (N:
206) of respondents that did not make any home improvement. Relocation (N: 394) is the
third most popular protective action and comparatively similar to home improvements despite
presenting a comparatively higher number of respondents who said that they would not like
to relocate. The percentage of respondents that would like to relocate is 30% (N: 116) against
70% (N: 278) that would not like to move out from where they live. Finally, house raising (N:
347) is the least popular protective action. The percentage of householders that have their
property raised is 20% (N: 68) against 80% (N: 279) of householders who said that they did
not raise their property.
Independent Variables
The selection of independent variables took into account those used in the models of
previous studies (Bubeck et al. 2013; Grothmann and Reusswig 2006; Poussin et al. 2011;
Zaalberg et al. 2009) as well as the responses and comments from interviews and focus
groups during the testing and development of the questionnaire. As mentioned in the
previous chapter, these independent variables were divided in the following way: i) threat
appraisal; ii) coping appraisal; iii) demographics, and iv) household characteristics. In the
case of threat appraisal, it is divided into four sub-groups: i) perceptual risks; ii) objective
risks; iii) maladaptive responses; and iv) flood experience. Table 8 (on page 114) provides
the definition of each of these independent variables.
The majority of the independent variables in this study are categorical. A categorical
variable is measured on a nominal scale with categories that determine class or group
membership. A categorical variable takes values that denote non-numerical categories or
classes. That is, it represents a set of discrete events, such as groups and decisions that
can be classified into categories (Wilson and Lorenz 2015). Categorical variables are also
known as discrete variables, meaning a limited set of numerical values that are typically
counting numbers, or whole numbers (Wilson and Lorenz 2015). There are two main types
of categorical variables: nominal and ordinal variables. Ordinal variables consist of a rank,
or a rating. The limitation to this type of measurement is that the researcher cannot be
assured of the preciseness of a measurement. For instance, ‘5’ on a Likert scale is higher
than ‘4’ but it is not very precise because it does not show how much higher ‘5’ is if compared
110
to ‘4’ or whether the difference between ‘5’ and ‘4’ is the same as the difference between ‘4’
and ‘3’ (Wilson and Lorenz 2015). As for nominal variables, these variables are mutually
exclusive and exhaustive (Wilson and Lorenz 2015). This means that nominal variables can
only be measured in terms of whether an individual belongs to a certain category (Wilson
and Lorenz 2015).
Descriptive Statistics of Independent Variables
The following paragraphs describe the statistics of independent variables included in the
model. These descriptions provide a sense of the characteristics of the sample in terms of
different vulnerability and risk perception levels and also how respondents perceive the cost,
effectiveness and feasibility of undertaking protective actions. Table 9 (on page 115)
summarises these percentages and their distribution. At the end of these descriptions, key
messages learned from these descriptive statistics are outlined.
Threat Appraisal
Perceptual Risks
The majority of respondents believe that another major flood is extremely likely to happen.
The large majority also believe that major floods occur in cycles of fifty years. In addition,
most respondents, nearly one third of them, believe that a major flood can cause them
financial losses over AU$100,001. As for the distance to the source of flooding, nearly 40%
of respondents claim that they live less than a hundred metres from the source of a major
flood. In terms of their perception of the magnitude of a major flood, the majority of
respondents, nearly 45% of them, believe that the Brisbane River needs to rise between four
and eight metres to cause damage to their property.
Objective Risks
Nearly seventy percent of respondents have experienced some inundation in their property.
Little more than half of respondents experienced value damaged over AU$50,001. Only very
few respondents needed to demolish their property after the 2011 flood event.
Maladaptive Responses
Most respondents are not influenced by a ‘positive experience’ with flood events in their
decision to take protective actions. That is, respondents that claimed not being affect by
major flood do not think that they do not need to take protective actions because they were
not affected in the last event. In other words, most respondents are likely to take protective

111
actions despite not being directly affected in the last flood event. Respondents also do not
seem to be significantly affected by a fatalistic perception of major flood risks. There is no
clear evidence suggesting that the perception of major flood events being too powerful
reduces the motivation of householders to take protective actions. In addition, the number of
respondents that enjoy living where they are is higher than the number of respondents
claiming that the costs of living where they are is higher that the benefits of living under risk.
This means that there are more respondents unsure about taking protective actions because
they simply enjoy living in their property, even if this is not protected against flood risks. In
terms of not moving out from a flood-prone area, the number of respondents claiming that
they feel emotionally attached to their property or community is slightly higher than the
number of respondents that do not feel emotionally attached to their property or community.
Flood Experience
Most respondents are worried about the risks of major floods. However, the majority of them
have not been psychologically, and more particularly, financially affected by the impacts of
major floods.
Coping Appraisal
House raising is considered an effective protective action although not perceived as
affordable, and more particularly, simple to undertake. As for home improvements, most
respondents do not think that their cost is reasonable, that they are simple to undertake, and
they provide effective protection against major floods. In regard to flood insurance, this is
clearly not perceived as affordable, and more particularly, effective against major flood risks.
Most respondents are unsure about the claim that taking out flood insurance can be
considered a simple task to undertake.
Demographics
Nearly 65% of respondents are between forty one and seventy years old. They are almost
equally divided in terms of gender. In addition, most respondents feature higher levels of
education and income. As for property value, little more than half of the properties included
in this study are between a half and one million dollars.
Household Characteristics
The large majority of respondents own the property they live in. The number of respondents
that have been living longer periods in the property tend to decrease over time. This trend is
112
confirmed by a variable that indicates that most respondents live shorter periods in their
property. As far as the presence of vulnerable groups in the household, most respondents
do no live with children under twelve years old, adults over seventy years old, and people
with disability. However, if these three groups are compared against each other, the number
of children is higher than the number of the elderly, which is higher than the number of the
people that need assistance to evacuate from the household in case of an emergency.
Key Messages from Descriptive Statistics
In terms of risk perception, these percentages indicate that respondents perceive major
floods as a serious risk to their property. This high risk perception is expressed in terms of
flood-related losses, in the past and in the future, and previous flood experiences, which is
illustrated by perceived magnitude of major floods that can cause damage to the property.
In addition, it is interesting to observe that flood experience does not seem to exert a great
deal of influence in the decision of respondents to not take protective actions. That is,
respondents seem to agree that their high exposure to major floods requires the undertaking
of actions that reduce their flood risks. However, respondents do not completely
acknowledge the uncertain nature of major floods when they claim that these disasters occur
through cycles. Respondents also convince themselves that protective actions might not be
necessary based on a rationale weighing in the costs of hazard risks vis-à-vis the benefits
of living in their property without taking protective actions. One could argue that respondents
may decide to not take protective actions because they have not been sufficiently affected
in psychological and financial terms. This lack of significant flood experience may affect
decision making despite the fact of respondents claiming that they are worried about the
impacts of major floods in their property.
Another important takeaway is in regard to the characteristics of protective actions.
As expected, house raising is considered the most effective action against major flood risks.
Flood insurance, in turn, is considered to be the simplest action to undertake (in terms of
time and knowledge available) but as expensive as house raising and the least effective
against major flood risks. As for home improvements, they are generally and negatively
considered in their every aspect (cost, effectiveness, and feasibility) by the majority of
respondents in this study.
Finally, this descriptive analysis provided an overview of the socio-economic
characteristics of the sample. These heterogeneity factors reveal key vulnerability factors of
the population at risk. There are no major surprises coming out of these descriptions.
113
However, it is worth highlighting that the majority of respondents present lower vulnerability
levels particularly because they present higher household annual incomes and do not live
with the groups that tend to be the worst affected by disasters.
Conclusion
This chapter provided a detailed description of how this study was conceived. This
description helps investigators that wish to replicate this study. The main goal, however, of
presenting variables, statistical methods, and model selection; in addition to describing the
development of the questionnaire and the selection of the geographical area and population,
was to reinforce the adequacy of resorting to the PMT to conduct a critical analysis of the
problem defined in this thesis while discussing the findings of this study. These findings are
presented in the next chapters. As for the main findings resulting from descriptive statistics,
it indicates that householders are generally worried about and acknowledge the risks of
major floods to their property. However, flood experience does not seem to lead to protective
actions. In addition, respondents admit that they are exposed to flood risks and claim that
these major events occur through cycles of longer periods. The majority of respondents do
not consider the uncertain nature of these events. Respondents also resort to a cost-benefit
rationale to convince themselves that undertaking protective actions before a major disaster
strikes might not be necessary. The majority of participants of the study have also claimed
not to be psychologically and/or financially affected by past flood events. As for protective
actions, house raising is regarded as the most effective to reduce or eliminate major flood
risks whereas flood insurance is by and large the most popular despite being perceived as
not affordable or effective to reduce major flood risks. As for home improvements, they are
poorly regarded in terms of efficiency, feasibility and cost by the participants of this study.

114
Table 8: Definition of Independent Variables
Threat Appraisal
Perceptual Risks:
Likelihood Respondents' estimate whether a major flood is likely to happen in the street where they reside
Frequency Respondents' estimate how often a major flood is likely to happen in the street where they reside
Loss Estimate Respondents' estimate their financial loss to the next major flood damaging their property
Distance to River Respondents' estimate how far their property is to the Brisbane River
Height of River Respondents' estimate how high the Brisbane river needs to rise above high tide to cause flood damage to their property
Objective Risks:
Water Level Respondents' information over the water level in their property in the 2011 floods
Value Damaged Respondents' information over the value of the damaged caused by the 2011 floods to their property
Demolish Respondents' information over whether they had to demolish their property after the 2011 floods or not
Maladaptive Responses:
Positive Experience
Respondents argue that they would not take protective actions because they have successfully coped with floods without
taking any protective action beforehand
Fatalism
Respondents argue that they would not take protective actions because major floods are too powerful events so there is
nothing that they can do reduce their flood risks
Cost Benefit Analysis
Respondents argue that they would not take protective actions because costs of taking protective actions are higher than the
benefits of living in their property the way it is
Attachment Respondents argue that they would not relocate because they are emotionally attached to their property, land, or community
Flood Experience:

115
Worry Respondents reveal the level of their 'worry' to major floods
Psychologically Affected Respondents reveal whether they have been psychologically affected by floods
Financially Affected Respondents reveal whether they have been financially affected by floods
Coping Appraisal
Response-Efficacy Respondents estimate the effectiveness of the protective action
Self-Efficacy Respondents estimate the feasibility of (or simplicity) the protective action (in terms of time and knowledge available)
Response Cost Respondents estimate whether the cost of undertaking the protective action is reasonable
Table 9: Descriptive Statistics of Independent Variables
Threat Appraisal
Perceptual Risks
Extremely
unlikely 2 3 4
Extremely
likely
Likelihood (N: 465) 11% 14% 24% 21% 30%
Once every
5 years
Once every
20 years
Once every
50 years
Once every
100 years
Other
periods
Frequency (N: 455) 5% 10% 40% 30% 8%
Less than
AU$2,000
$2,001-
$5,000
$5,001-
$10,000
$10,001-
$30,000
$30,001-
$50,000
$50,001-
$100,001
More than
$100,001
Loss Estimate (N: 371) 16% 11% 6% 14% 10% 15% 28%
Less than 5
metres
6-15
metres%
16-30
metres
31-100
metres
101-500
metres
501-1
kilometre
More than 1
kilometre
Distance to River (N: 438) 4% 6% 9% 19% 25% 14% 25%
Less than 2
metres 2.1-4 metres 4.1-6 metres 6.1-8 metres
8.1-10
metres
10.1-12
metres
12.1-14
metres
More than
14.1 metres

116
Height of River (N: 338) 6% 18% 24% 19% 12% 7% 4% 9%
Objective Risks
0 cm 1 cm-50 cm
51 cm - 1
metre
1.1 metre -
1.5 metre
1.51 metre -
2 metres
More than 2
metres
Water Level (N: 379) 31% 9% 10% 10% 15% 26%
Less than
AU$5,000
$5,001-
$15,000
$15,001-
$30,000
$30,001-
$50,000
$50,001-
$100,000
More than
$100,001
Value Damaged (N: 363) 26% 8% 7% 7% 17% 35%
No Yes
Demolish (N: 468) 97% 3%
Maladaptive Responses
Not agree at
all 2 3 4
Completely
agree
Positive Experience (N: 390) 34% 18% 22% 14% 13%
Fatalism (N: 416) 19% 17% 23% 16% 25%
Cost Benefit Analysis (N: 405) 14% 8% 22% 27% 28%
Attachment (N: 406) 24% 11% 23% 21% 21%
Flood Experience
Worry (N: 467) 9% 21% 24% 23% 24%
No Yes
Psychologically Affected (N: 468) 63% 37%
Financially Affected (N: 468) 77% 23%
Coping Appraisal
House Raising
Not agree at
all 2 3 4
Completely
agree
Cost (N: 297) 47% 21% 25% 4% 4%

117
Simple (N: 290) 65% 12% 12% 6% 5%
Effective (N: 302) 19% 11% 20% 21% 30%
Home Improvements
Cost (N: 212) 20% 18% 38% 18% 6%
Simple (N: 248) 27% 28% 31% 12% 2%
Effective (N: 226) 22% 16% 33% 21% 9%
Flood Insurance
Cost (N: 394) 38% 20% 26% 12% 4%
Simple (N: 378) 18% 18% 26% 20% 19%
Effective (N:387) 59% 12% 13% 9% 8%
Demographics
18-30 31-40 41-50 51-60 61-70 71-80 81-90 91-100
Age (N: 448) 6% 15% 19% 25% 19% 11% 6% 1%
Male Female
Gender (N: 444) 51% 49%
Primary High School Technical
Some
University University
Post-
graduate
Education (N: 442) 4% 17% 12% 9% 24% 34%
Less than
AU$30,000
$30,001-
$50,000
$50,001-
$80,000
$80,001-
$100,000
$100,001-
$200,001
More than
$200,001
Household Annual Income (N: 374) 13% 12% 16% 10% 32% 18%
Less than
AU$250,000
$250,001-
$500,000
$500,001-1
million
$1 million-$2
million
More than
$2 million
Property Value (N: 411) 1% 26% 52% 12% 9%
Household Characteristics
No Yes
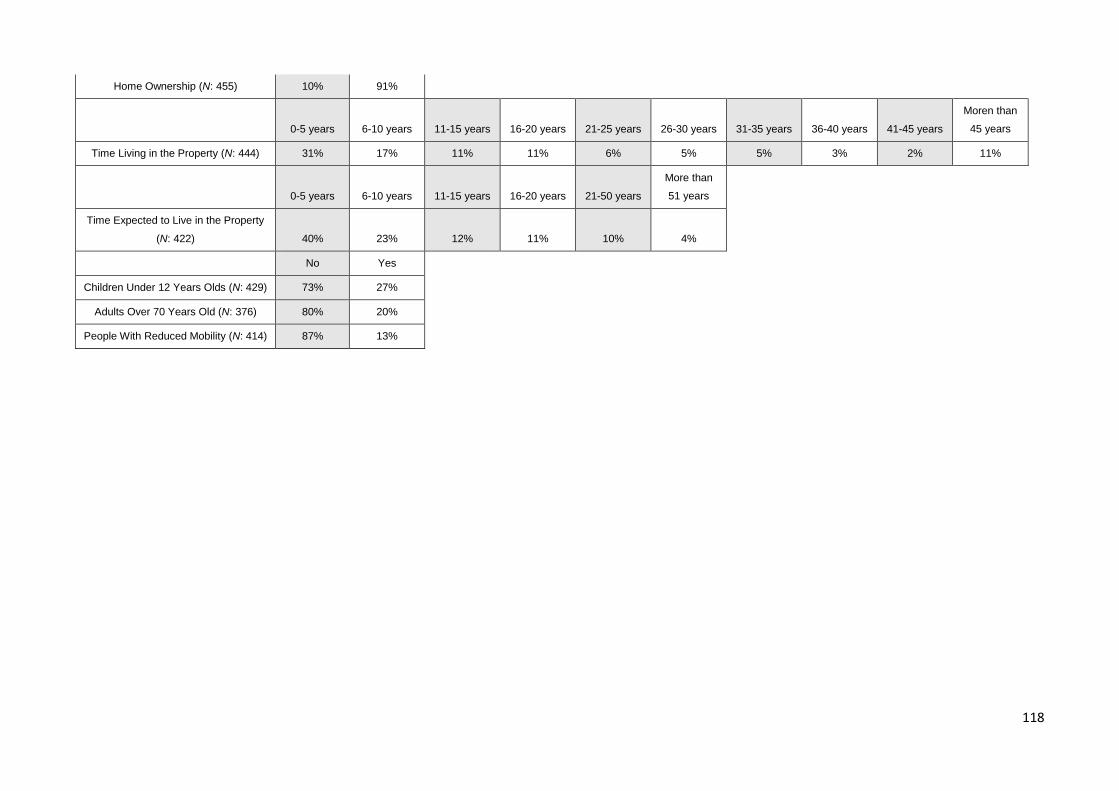
118
Home Ownership (N: 455) 10% 91%
0-5 years 6-10 years 11-15 years 16-20 years 21-25 years 26-30 years 31-35 years 36-40 years 41-45 years
Moren than
45 years
Time Living in the Property (N: 444) 31% 17% 11% 11% 6% 5% 5% 3% 2% 11%
0-5 years 6-10 years 11-15 years 16-20 years 21-50 years
More than
51 years
Time Expected to Live in the Property
(N: 422) 40% 23% 12% 11% 10% 4%
No Yes
Children Under 12 Years Olds (N: 429) 73% 27%
Adults Over 70 Years Old (N: 376) 80% 20%
People With Reduced Mobility (N: 414) 87% 13%
119
Chapter 6: Home Improvements and House Raising
Introduction
This chapter and the following one present the statistical results of the model of each
protective action. The results in these chapters attempt to answer the following research
question: How do threat appraisal factors, coping appraisal factors, and vulnerability
influence the decision of householders living in flood-prone areas to take protective actions?
In order to answer this question, the results of this study were divided into two chapters:
home improvements and house raising followed by flood insurance and relocation. In each
of these protective actions, the model featuring the significant correlations is presented and
transcribed based on their respective strength to explain the dependent variable. During the
description of these associations, qualitative data, when available, are introduced to support
the interpretation of relationships and suggest possible associations that the model did not
yield as significant. Generalizations of the model, however, only take into account model
results. This means that quantitative data, not qualitative data, are the basis for comparative
analysis.
After the description of these statistical results this thesis conducts a comparative
analysis primarily with other empirical studies that also tested PMT for flood mitigation based
on individual risk perceptions. Previous empirical studies testing the same theory serve to
compare and contrast findings, which is a fundamental step to strengthen the findings of this
model and evaluate to what extent they contribute to the literature. However, when studies
testing the explanatory power of PMT were not available, this thesis resorted to other pieces
of research that did not consider the same set of explanatory variables introduced by this
theoretical framework. The findings of these studies, despite testing other theories and
hypotheses, are important in the sense that they provide alternative views, variables, and
interpretations to analyze the relevance of the explanatory variables of this framework to
predict protective actions.
The findings presented in these chapters are not as straightforward as policy
researchers would have desired. No easy conclusions can be made. As previous studies
have identified, coping factors can be good predictors for protective actions, as the variable
response cost in the models of home improvements and house raising demonstrate. This
association, however, was not observed in the model of the most widespread protective
action in this thesis which is flood insurance despite qualitative data indicating that this
association should be expected. In addition, this thesis found out that threat appraisal factors

120
are also important for decision-making processes under uncertainty since they are
significantly correlated with dependent variables in every model of this thesis. Also, model
results indicate that the decision of householders to take a protective action does not only
depend on coping appraisal variables and/or threat appraisal factors. It is equally important
that officials understand the different levels of vulnerability among populations at risk.
Qualitative data also indicate that i) exposure, ii) the level of protection provided by
preventive measures; and, iii) the nature of the hazards threatening these communities also
influence the decision of householders taking specific protective actions. It is only after
understanding how all these different factors contribute to the decision of a householder in
taking specific protective actions that authorities can gauge the level of commitment from at-
risk individuals to collaborate with public efforts aimed at reducing residual risks to their
property.
Home Improvements
Home improvements are the second most popular protective actions but significantly lower
in absolute and relative numbers if compared against flood insurance, the most popular
protective action in this study. The percentage of householders that made some type of home
improvements is thirty nine percent whereas nearly ninety percent of respondents have flood
insurance. As for the descriptive statistics of the coping appraisal variables of these
measures, respondents in general do not think that their cost is reasonable, that they are
simple to undertake, and they provide effective protection against major floods if the two
extreme values of the Likert scale are compared (see values ‘Not agree at all’ and
‘Completely agree’ on Table 9 on page 116). However, it is worth noting that the majority of
respondents who answered these coping questions about home improvements are actually
unsure about the cost, feasibility (in terms of the time and knowledge they have available)
and the effectiveness of these measures to reduce flood damage to their property (see value
3 on Table 9 on page 116). These percentages are comparatively higher when compared
against the median value of house raising and flood insurance. This comparatively analysis
indicates that there is more uncertainty around the coping factors of home improvements
than house raising and flood insurance. In terms of qualitative data, the main finding is that
these measures are generally seen as effective to deal with storm-related floods but not
against major riverine floods. In this study, home improvements are related to the following
preventive measures: flood barriers, flood-resistant materials, water resistant walls, wall
openings, drainage systems, electrical lines and habitable rooms installed at higher levels.
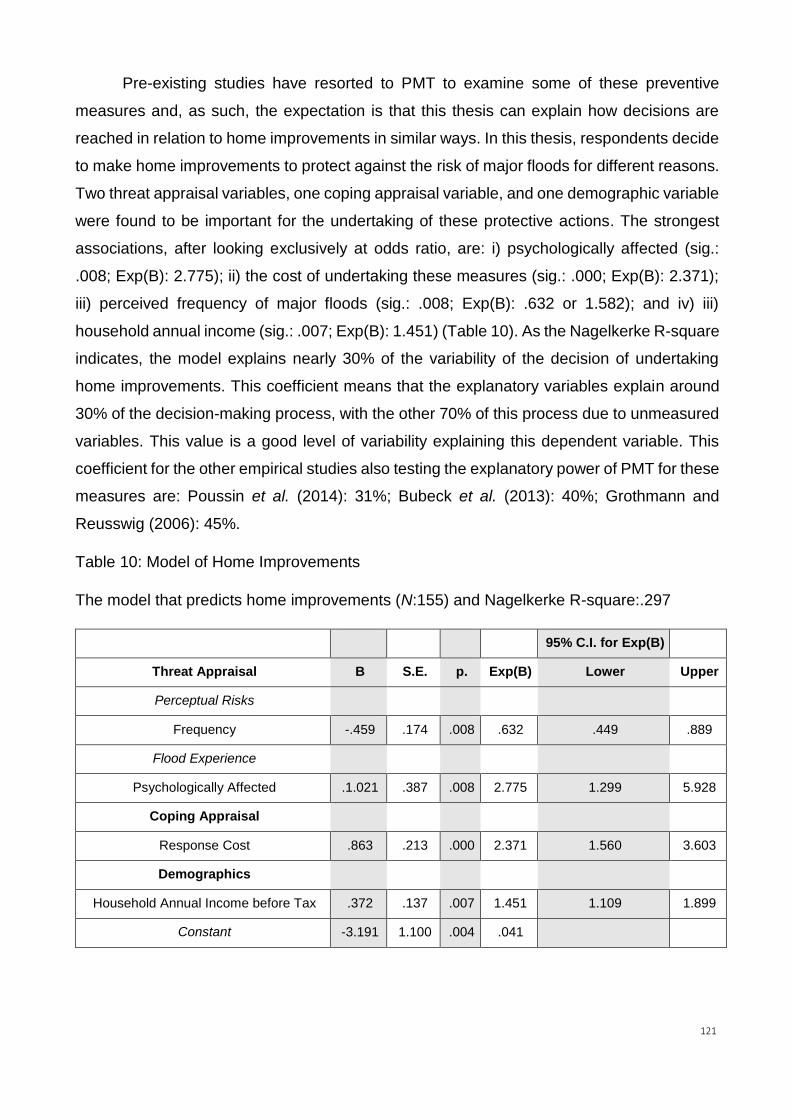
121
Pre-existing studies have resorted to PMT to examine some of these preventive
measures and, as such, the expectation is that this thesis can explain how decisions are
reached in relation to home improvements in similar ways. In this thesis, respondents decide
to make home improvements to protect against the risk of major floods for different reasons.
Two threat appraisal variables, one coping appraisal variable, and one demographic variable
were found to be important for the undertaking of these protective actions. The strongest
associations, after looking exclusively at odds ratio, are: i) psychologically affected (sig.:
.008; Exp(B): 2.775); ii) the cost of undertaking these measures (sig.: .000; Exp(B): 2.371);
iii) perceived frequency of major floods (sig.: .008; Exp(B): .632 or 1.582); and iv) iii)
household annual income (sig.: .007; Exp(B): 1.451) (Table 10). As the Nagelkerke R-square
indicates, the model explains nearly 30% of the variability of the decision of undertaking
home improvements. This coefficient means that the explanatory variables explain around
30% of the decision-making process, with the other 70% of this process due to unmeasured
variables. This value is a good level of variability explaining this dependent variable. This
coefficient for the other empirical studies also testing the explanatory power of PMT for these
measures are: Poussin et al. (2014): 31%; Bubeck et al. (2013): 40%; Grothmann and
Reusswig (2006): 45%.
Table 10: Model of Home Improvements
The model that predicts home improvements (N:155) and Nagelkerke R-square:.297
95% C.I. for Exp(B)
Threat Appraisal B S.E. p. Exp(B) Lower Upper
Perceptual Risks
Frequency -.459 .174 .008 .632 .449 .889
Flood Experience
Psychologically Affected .1.021 .387 .008 2.775 1.299 5.928
Coping Appraisal
Response Cost .863 .213 .000 2.371 1.560 3.603
Demographics
Household Annual Income before Tax .372 .137 .007 1.451 1.109 1.899
Constant -3.191 1.100 .004 .041
122
Respondents that claimed not to be psychologically affected by the impacts of major floods
were less likely to make home improvements. The inclusion of psychological variables in
statistical models has been advocated by researchers investigating the relationships
between the psychological effects of disasters on decision making. Burns et al. (1993)
argued that the complexity of the investigation of risk perception required statistical models
to expand its analysis by considering the addition of psychological variables. Ronan and
Johnston (2005) agreed with Burns et al. (1993) by stating that psychological factors shape
risk perception and as result decision making under uncertainty. Acknowledging the
importance of psychological variables in decision-making process, this thesis specified
these variables as i) worry to major floods; ii) psychologically affected to the last major
disaster, and; iii) financially affected by the last major disaster. It was the specification of
these psychological variables, as suggested by Ronan and Johnston (2005) and Burns et
al. (1993), that permitted this thesis to identify that not being psychologically affected by a
major disaster has a significant effect on the decision of householders to not make home
improvements.
Followed by this threat appraisal variable, respondents that believed that the cost of
implementing these home improvements was not reasonable were less likely to undertake
these protective actions. This correlation is confirmed by qualitative data: ‘The extra cost
associated with renovating in a flood zone makes it too expensive for us to do (home
improvements)’. This expected correlation is also partially confirmed by a respondent from
Yeronga: ‘We installed all (home improvements) listed but I do not agree the cost was
reasonable’.
After this coping appraisal variable, the strongest factor explaining the decision of
undertaking home improvements was the perception of householders over flood frequency.
Respondents that perceived the frequency of major floods occurring over longer intervals
and cyclically were less likely to undertake these measures. This finding is in accordance to
a study of Mileti (1999). Mileti (1999) found out that the perception of the frequency of flood
events has an impact on decision making but this perception was not enough to persuade
individuals at risk to take protective actions. This thesis agrees with this statement as the
perception of the frequency of major floods does have an influence on the undertaking of
home improvements but this factor does not feature the strongest association in the model.
This finding is also substantiated by the studies of Kahneman and Tversky (1979). These
researchers studied the role of intuition in decision making. When individuals claim that a
123
threat happen over longer periods of time and through cycles, this perception influences their
decision to take a protective action. Kahneman and Tversky (1979) explain that the cognitive
bias of anchoring explains the decision of not taking a protective action. Householders resort
to short cuts, an initial piece of information to make subsequent judgments, in the process
of adjusting their decisions. As a result, they fail to include additional information in their
decisions and to acknowledge that the high level of uncertainty of a threat does not permit
the assessment of major floods as cyclical events -- or to affirm that they occur over longer
periods. This association, however, is not the most determinant in the model of home
improvements to the extent that it permits us to affirm that these householders are mainly
influenced by this association in their decision to not make home improvements.
Finally, respondents with higher annual income were more likely to make home
improvements.28 The importance of this predictor was stated in the literature. Olofsson and
Öhman (2015), supported by Beringer (2000), argued that heterogeneity factors such as
household income shapes decision making. Investigators need to understand the different
socio-economic characteristics of a population to anticipate how each group will prepare and
react to a major disaster. The inclusion of a socio-economic factor in the model of home
improvements is also particularly important since, as van den Honert and McAneney (2011)
argue, poor-land use decisions, that pushed lower-income families to live in highly exposure
areas, are key factors that explain the level of vulnerable communities. Also, the Queensland
Floods Commission of Inquiry (QFCI 2012) warned policymakers that a key reason for the
exposure of these communities was the fact that the Brisbane City Council offered cheap
residential sites to disadvantaged groups, which increased their exposure to major floods
and their long-term vulnerability. The statement made by the Commission (QFCI 2012)
confirms the findings of the studies conducted by Tierney (2006), who claimed that socio-
economic factors play a key role in determining the levels of vulnerability and resilience of
communities at risk.
Thus, and after observing all these expected correlations, it is worth stressing that
the undertaking of home improvements is particularly dependent on i) whether respondents
feel they have been psychologically affected by the last major flood event, and; ii) on their
perceived cost of these measures. This is the main contribution of this thesis to the literature
28 This correlation indicates that low income may reflect a budget constraint. This is also a logical interpretation of this variable. However, this study places income under the category of vulnerability because the literature has highlighted that different groups -- heterogeneity factors -- perceive flood risk differently and also display different abilities to reduce these risks (Haque and Burton 2005; Heath et al. 2009; Olofsson and Öhman 2015; Tierney 2006; Wisner et al. 2004)

124
in regard to this protective action as it provides evidence over how psychological effects and
perceived costs shape the decisions of householders to undertake home improvements.
As for non-significant correlations, the coping appraisal variables response-efficacy
and self-efficacy did not result in significant correlations with the undertaking of home
improvements. However, qualitative data provide insights into how these relationships could
unfold. In regard to response-efficacy, it could be argued that respondents do not perceive
that home improvements are effective to reduce risks to major floods. ‘These actions do not
reduce my risks to major floods’, said a respondent from Rocklea. ‘No use of home
improvements (for) when river is higher water does not run off’, was the remark made from
another resident from Rocklea. ‘Home improvements like drainage can be efficient to deal
with storm-related (local overland flow) but not against major floods’, complemented a
resident from Fairfield. Also, there is distrust towards the effectiveness of home
improvements as preventive measures, as this resident from Graceville revealed: ‘Many of
these actions had already been carried out on the property by 2011 but we were flooded in
1974 and in 2011.’ Thus the perceived lack of efficiency of home improvements to reduce
risks to major flood events could explain the decision of respondents to not undertake these
preventive measures.
Self-efficacy, in addition, did not yield any significant relationship with home
improvements. Comments made by respondents indicate that undertaking home
improvements is not a simple decision to make. A resident from Chelmer made a remark
that perhaps summarises the perception of respondents about the challenge to undertake
home improvements. ‘(Home improvements) are only simple for new houses not for
established ones’. Two residents from Rocklea also explained why they did not undertake
some of these home improvements: ‘It leaves dirty water on the walls and is a health risk’
and ‘some of these home improvements attract rats’. Other respondents said that they do
not know whether home improvements are simple or not to undertake like this respondent
from Fairfield: ‘I do not know about these measures hence cannot answer’. There are also
respondents who wanted to make some home improvements but were not allowed as this
other resident from Fairfield highlighted: ‘I tried to install electrical lines and devices to higher
levels but was not allowed (by the Council)’. Thus, according to qualitative data, the
undertaking of home improvements is not generally seen as simple because of its costs,
ignorance towards these measures, and regulations that prevent residents from taking these
actions.
125
Empirical Studies on Home Improvements
Four flood studies also tested home improvements under PMT (Bubeck et al. 2013;
Grothmann and Reusswig 2006; Poussin et al. 2014; Zaalberg et al. 2009). The discussion
in this section compares the statistical results of this study in relation to previous ones before
drawing conclusions. The following analysis is organized in the following way: first, threat
appraisal variables; second, coping appraisal variables; third, demographics; and fourth,
household characteristics. Table 1129 on page 128 provides an overview of this comparative
analysis.
Before initiating this comparative analysis, it is necessary to identify the nature of the
flood hazard in each of these studies (Table 12 on page 129). Lindell and Perry (2000)
demonstrated that the nature of hazard risks shapes risk perception and as a result decision
making. Thus this table shows that river flooding is the most common type of major floods
across these empirical studies with the exception of Zaalberg et al. (2009). The study of
Zaalberg et al. (2009) investigated protective actions based on the experience of victims and
non-victims with a sea flood event that occurred in the Netherlands in 1953. It is also possible
to notice that the major flood event included in each study occurred in last twenty years with
the exception once again of the study of Zaalberg et al. (2009). However, it is worth noticing
that the studies of Bubeck et al. (2013) and Grothmann and Reusswig (2006) analyzed the
same flood event and that the magnitude and severity of river flooding in their studies is
lower than the extreme events that occurred in France, Australia, and the Netherlands.
Poussin et al. (2014) provided detailed information on the characteristics of the
hazards of the selected events in their study and also on total losses and casualties since
these numbers contribute to the assessment of the magnitude and severity of a hazard on
exposed communities. River floods are the major type of flooding in France (Poussin et al.
2014) but they also add other sources in their comparative analysis across three flood-prone
regions in the country. Similarly to Poussin et al. (2014), a major river flood event that
occurred in the last ten years is the main disaster assessed in this study and this thesis also
included regions that were affected by other types of flooding. Therefore, it is possible to
argue that the results of the model of home improvements is more accurately compared
29 The purpose of Table 9 is to provide a quick overview about the explanatory and predictability power of PMT among five studies conducted in different conditions and circumstances. These overview indicates i) which significant associations are observed across models; ii) trends in risk behaviour regardless of differences in conditions and circumstances; and iii) highlight factors that are the most significant in each observed context.
126
against the findings of Poussin et al. (2014) rather than the other three studies included in
the following comparative analysis.
Initiating now the comparative analysis, Grothmann and Reusswig (2006) identified
a positive relationship between perceived likelihood, loss estimate, and fear of major floods
with the undertaking of home improvements. Zaalberg et al. (2009) also identified a positive
relationship between perceived loss estimate and home improvements. Poussin et al.
(2014), however, found out a negative relationship between perceived loss estimate and
home improvements. The explanation that Poussin et al. (2014) gave to this negative
correlation was that respondents felt more secured after making home improvements. As for
flood experience, Grothmann and Reusswig (2006) identified a positive relationship with
home improvements. When it comes to maladaptive responses, Grothmann and Reusswig
(2006) found out that wishful thinking, fatalism, and denial are negatively correlated with
home improvements. This correlation was the strongest predictor in their study and
interpreted as a variable that ‘de-motivates precautionary behavior’ (2006:118). Zaalberg et
al. agreed with Grothmann and Reusswig (2006) by highlighting that threat denial was ‘an
indispensable part of the mediating process explaining mean differences in behavioral
intentions and threat denial between victims and nonvictims’ (2009:1774). The role of
maladaptive responses negatively influencing the undertaking of home improvements was
also identified by Bubeck et al. (2013). In their study, Bubeck et al. stated that ‘wishful
thinking and postponement’ ‘significantly influenced’ (2013:1334) the decision of
householders to not make home improvements. Therefore, perceptual risks and more
particularly maladaptive responses are factors that help explain the decision of householders
making home improvements in these studies.
However, when these threat appraisal30 variables are compared against the results
of this thesis, there is no widespread consensus around these explanatory variables. Flood
experience was the only common variable31, in terms of significance and correlation
direction, between this study and previous research. According to this study and Grothmann
30 It is possible to argue here that had this study not used an expanded model for threat appraisal, its results could be more similar to previous studies. However, conducting this analysis is beyond the scope of this thesis. 31 This correlation may have occurred because participants in this study have recently experienced a major flood event, which might explain why this flood experience is predominant among other threat appraisal variables. This correlation could have turned out differently had the major flood event assessed in this study happened many years ago. This interpretation, however, must be taken carefully as the study of Poussin et al. (2014), which assessed a major flood event as recent as the one considered in this study, did not yield similar correlations to this study for threat appraisal variables.

127
and Reusswig (2006) respondents that have not experienced flood before were less likely to
have made home improvements and vice-versa. Flood experience in terms of being
psychologically affected by major floods is the strongest association in the model of this
study as well as one of the strongest correlations in the model of Grothmann and Reusswig
(2006). In addition, the model of this study was the only one that identified a significant
correlation between perceived frequency of major floods with the undertaking of home
improvements.
As for non-significant correlations, this study could not determine whether perceived
probability and loss estimate positively influence the undertaking of home improvements, as
Grothmann and Reusswig (2006) and Zaalberg et al. (2009) did. Also, this study did not find
a negative relationship between loss estimate and home improvements as Poussin et al.
(2014) did. The same applies to maladaptive responses. Bubeck et al. (2013), Zaalberg et
al. (2009), and Grothmann et al. (2006) identified that respondents do not make home
improvements because of their maladaptive responses such as wishful thinking, fatalism,
and denial. These correlations turned out to be strong predictors in these studies. In the
model of this study such correlation was not identified.
As far as coping appraisal variables are concerned, Zaalberg et al. (2009) were
surprised with the negative correlation of response-efficacy and home improvements in their
study. They expected a positive relationship but flood victims ‘appraised the effectiveness of
prevention as lower than nonvictims’ (2009:1772). Grothmann and Reusswig (2006),
however, identified a positive correlation between response-efficacy and home
improvements. Respondents that perceive home improvements as effective to reduce flood
risks were more likely to take this protective action. The strength of this relationship was the
second strongest predictor in the study of Grothmann and Reusswig (2006). Poussin et al.
(2014) and Bubeck et al. (2013) did not find any significant relationship between response-
efficacy and home improvements in their models.
In terms of response cost, only the study of Poussin et al. (2014) identified a significant
relationship with home improvements. This relationship turned out negative, which means
that respondents who perceive these measures to be costly and time-consuming are less
likely to have implemented them (2014:73). As for self-efficacy, or ‘the perceived ability to
perform a protective response’ (Grothmann and Reusswig 2006:106), Poussin et al. (2014),
Bubeck et al. (2013), and Grothmann and Reusswig (2006) identified a positive relationship
between this variable and home improvements. These studies found out that respondents
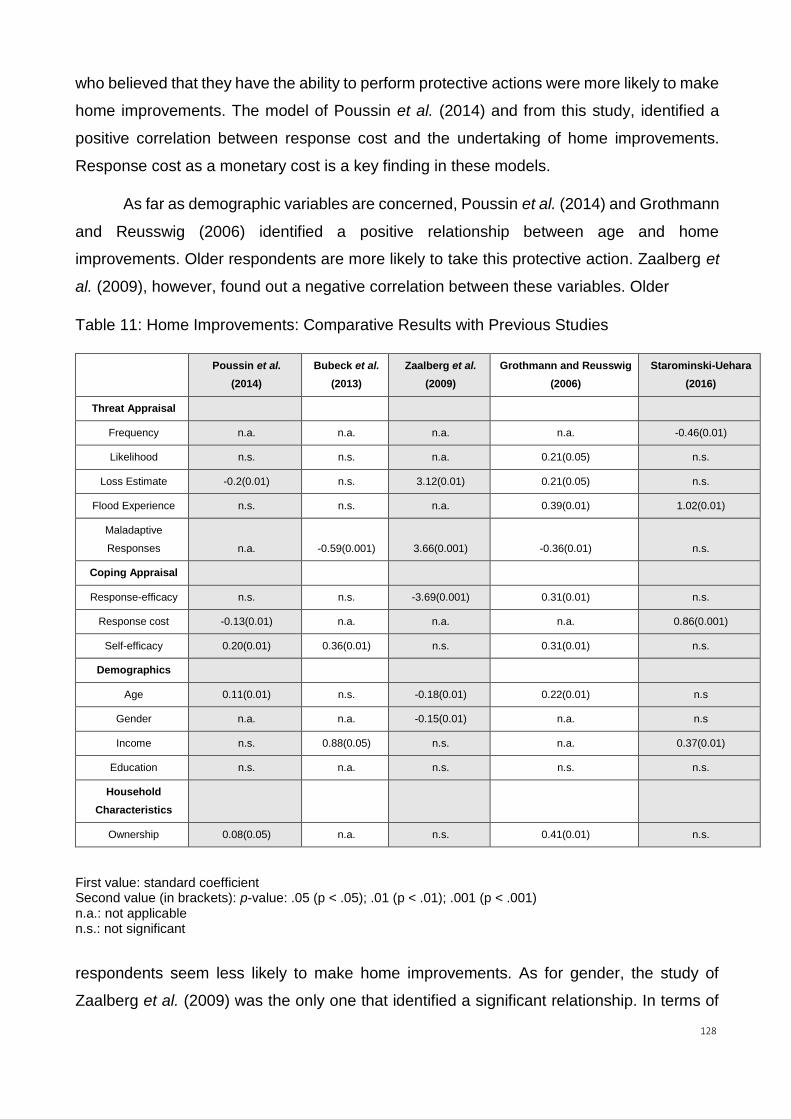
128
who believed that they have the ability to perform protective actions were more likely to make
home improvements. The model of Poussin et al. (2014) and from this study, identified a
positive correlation between response cost and the undertaking of home improvements.
Response cost as a monetary cost is a key finding in these models.
As far as demographic variables are concerned, Poussin et al. (2014) and Grothmann
and Reusswig (2006) identified a positive relationship between age and home
improvements. Older respondents are more likely to take this protective action. Zaalberg et
al. (2009), however, found out a negative correlation between these variables. Older
Table 11: Home Improvements: Comparative Results with Previous Studies
Poussin et al.
(2014)
Bubeck et al.
(2013)
Zaalberg et al.
(2009)
Grothmann and Reusswig
(2006)
Starominski-Uehara
(2016)
Threat Appraisal
Frequency n.a. n.a. n.a. n.a. -0.46(0.01)
Likelihood n.s. n.s. n.a. 0.21(0.05) n.s.
Loss Estimate -0.2(0.01) n.s. 3.12(0.01) 0.21(0.05) n.s.
Flood Experience n.s. n.s. n.a. 0.39(0.01) 1.02(0.01)
Maladaptive
Responses n.a. -0.59(0.001) 3.66(0.001) -0.36(0.01) n.s.
Coping Appraisal
Response-efficacy n.s. n.s. -3.69(0.001) 0.31(0.01) n.s.
Response cost -0.13(0.01) n.a. n.a. n.a. 0.86(0.001)
Self-efficacy 0.20(0.01) 0.36(0.01) n.s. 0.31(0.01) n.s.
Demographics
Age 0.11(0.01) n.s. -0.18(0.01) 0.22(0.01) n.s
Gender n.a. n.a. -0.15(0.01) n.a. n.s
Income n.s. 0.88(0.05) n.s. n.a. 0.37(0.01)
Education n.s. n.a. n.s. n.s. n.s.
Household
Characteristics
Ownership 0.08(0.05) n.a. n.s. 0.41(0.01) n.s.
First value: standard coefficient Second value (in brackets): p-value: .05 (p < .05); .01 (p < .01); .001 (p < .001) n.a.: not applicable n.s.: not significant
respondents seem less likely to make home improvements. As for gender, the study of
Zaalberg et al. (2009) was the only one that identified a significant relationship. In terms of

129
income, this thesis as well as Bubeck et al.’s (2013) identified a significant relationship with
home improvements. Householders with higher income are more likely to make home
improvements. As for education, none of the studies identified any significant relationship.
Table 12: Home Improvements: Comparative Hazard Risks with Previous Studies
* in terms of insurance of recent severe floods
The only household variable that all these studies have in common is homeownership.
Poussin et al. (2014) and Grothmann and Reusswig (2006) identified a positive relationship
of homeownership with home improvements. Respondents who own their property are more
likely to make home improvements. The other studies, including this one, could not identify
this relationship from their dataset.
Conclusion
At a micro-level, the model of this study yielded results that are different from previous
research. This finding is in accordance to a study from Lindell and Perry (2000), who argued
that the relationships between past behavior and protective actions are always different
across studies because they are conducted in different times, locations, and contexts. In this
study, the independent variables that are strongly associated with the undertaking of home
improvements are flood experience and response cost. That is, respondents that claimed
not to be psychologically affected by major floods and believe that the cost of implementing
32 Engel (1997:31) 33 Hays (2016) 34 Kok et al. (2002) 35 Engel (1997:31) 36 Hays (2016) 37 Carbone and Hanson (2012)
Region Types of floods Last major event Damage* Casualties
Bubeck et al.
(2013)
The Rhine River
(Germany) River floods 1995
500 million
German Mark32 433
Poussin et al.
(2014)
Three regions
(France)
River floods; flash floods;
and coastal floods 2010
120 million-1.5
billion euros 23
Zaalberg et al.
(2009)
Southwest
(Netherlands)
Sea flood; overland flood;
and river dike breakdown 1953 0.7 billion Euro 185334
Grothmann and
Reusswig (2006)
The Rhine River
(Germany) River floods 1995
500 million
German Mark35 436
Starominski-
Uehara (2016)
The Brisbane River
(Australia)
River, overland, creek,
storm tide floods 2011
AU$68 million-
AU$2.3 billion 3537

130
home improvements was not reasonable were less likely to undertake these preventive
measures. In the model of Poussin et al. (2014), it is loss estimate and self-efficacy that
featured the strongest associations. In the study of Bubeck et al. (2013), it is income and
maladaptive responses that drive the decision of home improvements. For Zaalberg et al.
(2009), it is maladaptive response and response-efficacy. Finally, for Grothmann and
Reusswig (2006), homeownership and flood experience determine the decision of
householders to take this protective action.
Thus the PMT explains the undertaking of home improvements in different ways in
each model. This happens because of the nature of these environments. In addition, there
are differences over sample size and methods used to compare and contrast significant
associations. Hence it is not surprising that similar and significant associations across
models under PMT were not consistently identified. However, the explanatory and predictor
power of PMT is not undermined by this lack of similarity across models. The comprehensive
set of variables that PMT provided allowed this thesis to identify that householders at risk
participating in this study make their decisions to undertake home improvements particularly
based on their flood experience, which is supported by the work of psychologists
investigating decision making under uncertainty. These findings may have not been
identified had this theory not been considered.
In relation to the hypothesis that coping appraisal is a better predictor than threat
appraisal for protective actions, it is possible to argue that coping factors help predict the
undertaking of home improvements. Similarly to the general findings of Bubeck et al. (2013)
and Poussin et al. (2014), this study identified, at a macro-level, that the coping appraisal
variable (response cost: sig.: .000 and Exp(B): 2.371) features an association as strong as
a threat appraisal variable (psychologically affected: sig.: .008 and ExP(B): 2.775) with these
preventive measures. The confirmation of this hypothesis shows that despite the challenges
to identify specific similarities across studies conducted in different conditions and contexts,
PMT can still generally argue that coping appraisal variables are valid explanatory factors to
predict the motivations driving the decisions of householders to retrofit their properties.38
38 This study makes some broad policy recommendations to increase the number of householders undertaking home improvements. First, the government should frame the undertaking of home improvements as a mitigation strategy that help householders reduce their anxiety over major flood risks. Second, the government should look into ways to make the implementation of these measures more affordable. Third, it should promote economic activities and/or programs that increase the income of the vulnerable members living in a flood-prone area. Fourth, it should address the perception that major floods occur through cycles. A key feature of major disasters is their uncertainty, particularly in regard to their likelihood, frequency, magnitude, and severity. Public campaigns can increase the level of awareness in relation to the role of home improvements as
131
It is worth noticing, however, that descriptive statistics indicate that these retrofit
measures are generally not perceived as affordable, simple to undertake, and effective
against major flood risks. Descriptive statistics also show that, there is more uncertainty
about the coping factors of these measures than the coping factors of house raising and
flood insurance. Finally, it is necessary to highlight that qualitative data reinforce the notion
that these measures are not perceived as effective to reduce damage caused by major flood
events. Flood insurance is also not perceived as effective to reduce damage against major
disasters (It is actually perceived as the least effective among the three protective actions
assessed in this study) whereas house raising is perceived as the most effective of these
mitigation strategies in relative and absolute terms.
House Raising
Not surprisingly, because of its high costs and challenges to be implemented (see Table 9
on page 116), house raising is the least popular protective action among participants in this
study. Less than twenty percent of respondents had their property raised. House raising,
however, is an important protective action against major flood risks, particularly among
residents living next to sources of flooding and who had experienced extensive flood
damage, according to field observations. Descriptive statistics confirms the importance of
this protective action by indicating that house raising, in comparison with the other protective
actions, is considered to be more effective to reduce flood damage than flood insurance and
home improvements (see Table 9 on page 116 for respective percentages). This study then
provides empirical evidence on how threat appraisal, coping appraisal and vulnerability
influence the decisions of householders in relation to this particular protective action. House
raising is associated with three variables. All these associations and respective directions
were expected. These variables are comprised of one threat appraisal (maladaptive
response: positive experience; sig.: .006; Exp(B): .673 or 1.48); one coping appraisal
(response cost; sig.: .015; Exp(B): 1.442) and one vulnerability demographic factor (age;
sig.: .005; Exp(B): .701 or 1.42) (Table 11). As the Nagelkerke R-square indicates, the model
explains nearly 16% of the variability in the decision of raising a property. This value is a
standard level of variability explaining a dependent variable in social science studies.
protective actions and how these measures can effectively reduce residual risks. And fifth, the government could partner with insurers to create financial incentives for residents undertaking home improvements. These incentives could be in the form of discounts in property taxes and insurance premiums, targeting especially low-income households.
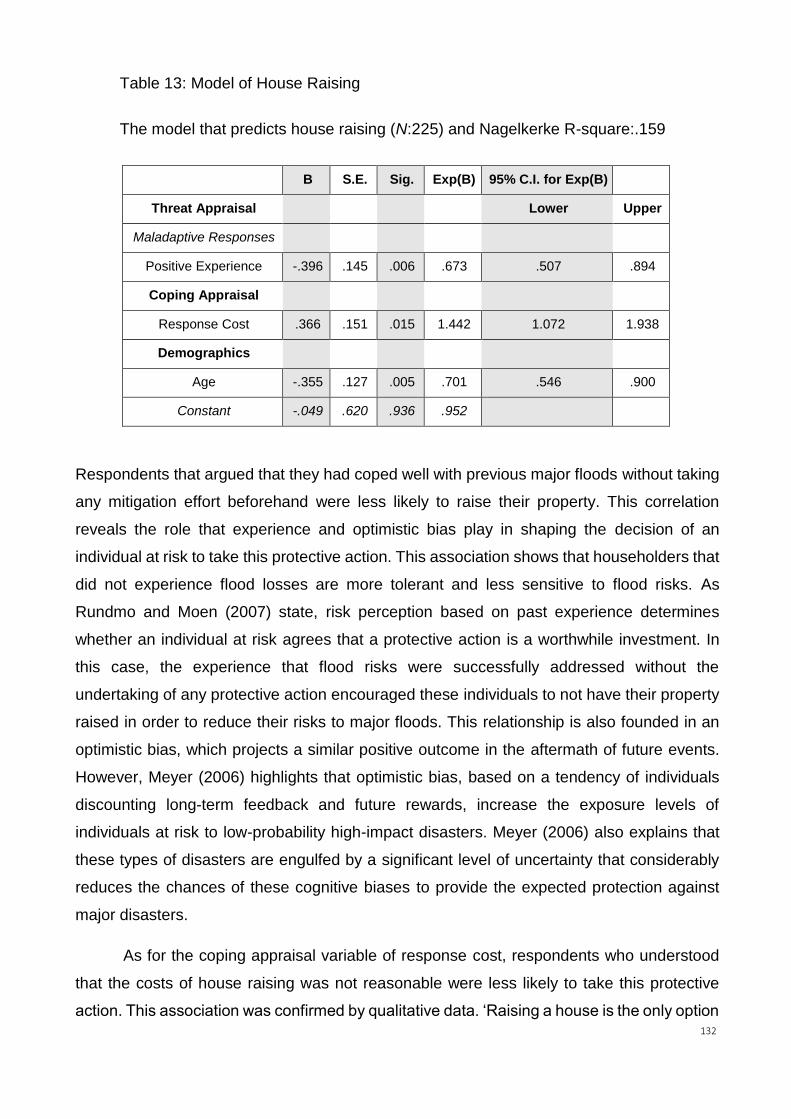
132
Table 13: Model of House Raising
The model that predicts house raising (N:225) and Nagelkerke R-square:.159
B S.E. Sig. Exp(B) 95% C.I. for Exp(B)
Threat Appraisal Lower Upper
Maladaptive Responses
Positive Experience -.396 .145 .006 .673 .507 .894
Coping Appraisal
Response Cost .366 .151 .015 1.442 1.072 1.938
Demographics
Age -.355 .127 .005 .701 .546 .900
Constant -.049 .620 .936 .952
Respondents that argued that they had coped well with previous major floods without taking
any mitigation effort beforehand were less likely to raise their property. This correlation
reveals the role that experience and optimistic bias play in shaping the decision of an
individual at risk to take this protective action. This association shows that householders that
did not experience flood losses are more tolerant and less sensitive to flood risks. As
Rundmo and Moen (2007) state, risk perception based on past experience determines
whether an individual at risk agrees that a protective action is a worthwhile investment. In
this case, the experience that flood risks were successfully addressed without the
undertaking of any protective action encouraged these individuals to not have their property
raised in order to reduce their risks to major floods. This relationship is also founded in an
optimistic bias, which projects a similar positive outcome in the aftermath of future events.
However, Meyer (2006) highlights that optimistic bias, based on a tendency of individuals
discounting long-term feedback and future rewards, increase the exposure levels of
individuals at risk to low-probability high-impact disasters. Meyer (2006) also explains that
these types of disasters are engulfed by a significant level of uncertainty that considerably
reduces the chances of these cognitive biases to provide the expected protection against
major disasters.
As for the coping appraisal variable of response cost, respondents who understood
that the costs of house raising was not reasonable were less likely to take this protective
action. This association was confirmed by qualitative data. ‘Raising a house is the only option
133
but it is too expensive’, said a resident from the low-income suburb of Rocklea. Another
resident from Rocklea agreed: ‘(I want to take mitigation measures) but only if I can save
enough money to raise my house’. ‘I would love to be able to afford to raise my house so
that I do not stress every time there is a rain event’, complemented another resident from
Rocklea. These responses were expected as Rocklea is highly exposed to flood risks and
considered a low-income suburb in the region of this study. However, the high cost involved
in house raising was also observed in suburbs featuring higher household income. ‘I would
love to increase my flood protection by raising the property and other actions but do not have
the cash to do so’, said a resident from Graceville. ‘It is expensive not only to raise a property
from the ground up but also to raise another meter and comply with new standards’, another
resident in Graceville pointed out.39
The third significant association in this model is with the demographic variable of
age. The older the respondent is, the less likely that a house is raised. This correlation is
observed in the following comments: ‘I am a pensioner and cannot afford to raise the house’,
said a resident in Fairfield. This statement was complemented by a resident from Rocklea:
‘(Living) with a 80-year-old pensioner40 plus a dog frightened of stairs I would need a lift’.
Heath et al. (2009) warned that the elderly need a special attention to reduce their flood risks.
The elderly, as well as other vulnerable groups, perceive risks differently, feature different
risk tolerance, and require different response options to reduce their risks to major disasters
(Heath et al. 2009).
As for explanatory variables that did not yield significant correlations, it is somewhat
surprising that response-efficacy did not yield a significant association with house raising.
This is a surprising finding because descriptive statistics show that house raising is perceived
as an effective protective action despite not being perceived as affordable and simple to
undertake41. The non-significant association with response-efficacy might have occurred
39 To reduce the costs of raising a property, respondents suggested that the government could launch a program to help them undertake this protective action. ‘I would have raised the house if I had money from the government’, claimed a resident in Rocklea. A resident from Chelmer agreed: ‘We thoroughly investigated raising our house -- undertook hydrology, soil testing and engineering but found the technical difficulties and soil characteristics made it prohibitively expensive to undertake. We would have considered again if there was a subsidy or grant available’.
40 Being a ‘pensioner’ means, based on observations and informal interviews, that older residents are less likely to raise their property because of the burden that this structural measure would pose to the mobility in and out of a property (see page 90 for more information on this association).
41 In comparative terms, house raising is perceived as more effective to reduce major flood risks than home improvements and flood insurance.

134
because of respondents’ comments on the perceived effectiveness of this measure. For
instance, a resident in Rocklea said that he was interested in raising his property but ‘Q100
(1% chance of flood occurring in any year) level may not be high enough, as neighbours with
recently-raised houses discovered in 2011’. The concern of this resident was shared by
another one in Fairfield who reported about his new home: ‘It was a newly constructed house
that was built to the Brisbane City Council standards applicable in 2010 (but) the habitable
areas were flooded in 2011’. A resident in Sherwood shared the same experience:
We raised our house in 2009. (We) complied with Council Q100 regulations for the development under the house. Despite this, the water was higher than expected in 2011 and we had about 500mm above our compliant level.
In regard to the coping appraisal variable of self-efficacy, it also did not yield any significant
relationship with house raising. Qualitative data, however, indicate that this correlation could
be positively correlated since respondents seemed to not have their property raised because
they did not agree that this protective action was simple to undertake. ‘It is not practical to
raise our house’, said a resident from Yeronga. ‘My house is brick, I cannot raise it’, stated
another participant from Tennyson. ‘Slab houses (which is ours) make it very difficult to take
preventive measures’, was the comment made by a resident living in Fairfield. And ‘raising
above 2011 flood level is impractical due to current height’, claimed a resident from
Sherwood.
Self-efficacy was also affected by concerns around aesthetics, sale price, lack of
information, and the impossibility to use vacant space under the elevated property. A
respondent from Graceville emphasised how ‘high excess raising to the new heights looks
terrible and out of proportion and cannot sell house with usable bedroom's downstairs’.
Similar concerns were shared by an elderly in Fairfield who had his house raised to 2011
standards but could not turn the space under the elevated house into habitable rooms. Along
these lines, a resident from Rocklea said that he was not motivated to have his property
raised because ‘(it) would not recoup costs raising after selling it’. As for the impossibility to
use the space under the elevated house, it was also an object of concern for a resident in
Graceville because ‘rules seem unreasonable for habitable spares’. In addition, a resident
from Fairfield expressed his concern over the challenges imposed by certifiers in the process
of raising a property. Concerns and complaints towards the work of certifiers were also made
by a resident in Graceville: ‘On three occasions when we did renovations certifiers wrote that
property was not at risk of flooding (but we were flooded in 2011)’. Finally, a resident in
135
Graceville said that there was lack of official information on how to raise a house; ‘(I am)
looking at raising (my) house but (there is) not good information on websites for rules’.
Therefore, qualitative data provided insights into different challenges that
householders face to regard this protective action as effective and simple to undertake. It
also revealed that current legislation on this measure is not widely accessible and limits the
ability of householders to recoup investments. Despite the importance of this qualitative data
to provide nuances of the challenges to implement this protective action, it cannot be
generalised to the risk of skewing the statistical findings and the predictability power of the
model of this protective action.
Empirical Studies on House Raising
House raising has not been widely included in previous flood studies that tested PMT. Thus
the basis of the discussion in this section will be around variables significantly associated
with house raising based on empirical studies dealing with this protective action outside the
hypotheses proposed by PMT.
The maladaptive response of positive experience has not been measured in
previous research when it comes to house raising. Thus the only conclusion that this study
can make is that respondents who claimed they did well in reducing their flood risks, despite
not taking any protective action beforehand, are less likely to have their property raised. This
relationship reinforces the importance of considering local factors (circumstances) to
understand nuances of risk perceptions in a particular locality. In this regard, Angignard et
al. (2014) state that risk perceptions are dependent upon the variation in different cultural
contexts and the interconnections within these contexts that shape individual risk perception
and inform how communities deal with different types of risks.
This finding is also explained by other results found in the literature. Odgers and
Rhodes (2002) and Ronan and Johnston (2005) showed that individuals that experienced a
disaster but believed that they were not significantly affected were more likely to believe that
they would not be greatly affected in future disasters. This heuristics is known as normalcy
bias, which, in turn, is influenced by optimistic bias. This normalcy bias rationale leads these
individuals to assume that they are prepared enough to deal with future disasters (Odgers
and Rhodes 2002; Ronan and Johnston 2005). As for optimistic bias, Johnston et al. (1999)
and Kumagai et al. (2004) explain that this occurs when individuals underestimate the risks
of disasters and overestimate their abilities to reduce hazard risks. Bushnell and Cottrell
136
(2007) warn that overconfidence in one’s abilities result in increasing levels of exposure and
vulnerability among individuals at risk.
It is also worth noticing that availability bias, another common type of heuristics found
in the literature of crisis management (Kates 1962:140), was not observed in the findings.
Availability bias, in the form of remembering and imagining the frequency and likelihood of
major threats, did not have an effect in the decision-making process of participants.
Respondents were not influenced by how easy they can remember or imagine the frequency
and likelihood of major floods42. The absence of this threat appraisal variable in the findings
is important as it indicates, in opposition to what it is oftentimes stated in the literature (Paton
and Johnston 2001), that perceived frequency and likelihood of major hazard events affect
the decisions of the population at risk to take protective actions.
As for coping appraisal variables, the association with response cost reinforced the
role of benefit-cost analysis proposed by Ganderton (2005). Ganderton (2005) explains that
individuals’ risk acceptance is influenced by the perception of the benefits and costs of a
protective action. If perceived benefits are low whereas perceived costs are high, the
individual at risk is more likely to accept these risks and thus not have its property raised. A
possible solution to reduce the high costs of house raising could be the provision of some
government assistance as it already happens in New South Wales (Smith and Penning-
Rowsell 1982). This financial support assisting individuals at risk to raise their property might
reduce vulnerability levels among populations at risk since Wenger (2013) highlights that the
majority of householders living in risky areas end up settling in these areas because the
government allowed that these high-risk areas were offered at cheap prices for disadvantage
groups.43 This seems to be the case in this thesis as mainly respondents living in lower-
income suburbs claimed that they bought land and built a house in a flood risk area because
42 This could have occurred because sixty percent of respondents experienced the 2011 flood event and fifty six percent of participants experienced the 1974 flood event. Had a lower number of participants experienced these major flood events and these disasters had occurred over a longer period of time, the influence of availability bias through the variables or risk perception of frequency and likelihood could have exerted some influence on the decision of respondents to take house raising as a protective action.
43 The provision of some form of grant to low-income householders would be in accordance with the national effort to build resilient communities by reducing long-term vulnerability (QFCI 2012). However, reducing the costs of house raising could not be enough to convince householders to undertake this protective action. As Penning-Rowsell and Smith (1987) found out, house raising did not provide enough protection to reduce the psychological effects caused by major floods in their study on house raising in Lismore, New South Wales. Thus the perceived lack of effectiveness of house raising as a protective action could undermine policies aiming to encourage the undertaking of this preventive measure through cost reduction. Also, this thesis did not identify any significant association between the perceived effectiveness of this protection action and its undertaking.

137
the government had promised them that a major flood would never happen again in their
property area. ‘I was advised by Brisbane City Council (BCC) when I purchased the property
that it would no longer flood due to the construction of Wivenhoe Dam’, said a respondent
from Rocklea. Another respondent from the same suburb complemented: ‘Prior to
purchasing our house we checked with Brisbane City Council who advised that with the
building of Wivenhoe Dam we would be above the 1974 flood level, as it had reduced it by
eight meters’.44
The third and last significant association with house raising is age. The elderly are
less enthusiastic about raising their property than younger adults. The main reasons for that
are the high cost of this measure for the elderly and because it affects their mobility. This
demographic characteristic, therefore, shape risk perception and decision making, and so it
should be included in policies aiming to foster protective actions in communities at risk. This
finding illustrates the importance of including demographic variables in vulnerability
assessments to identify which groups are more vulnerable to the risks of major hazards
(EMA 2000) or face the main challenges to take protective actions. The federal agency of
Emergency Management Australia has included the factor ‘age’ as a variable that
determines vulnerable groups and guides the degree of susceptibility and resilience of a
community towards environmental hazards because it acknowledges that vulnerability,
meaning susceptibility to harm, is comprised of pre-existing conditions found in communities
at risk (EMA 2000). In addition, Olofsson and Öhman (2015) and Tierney (2006) warned
about the importance of investigating demographic variables such as ‘age’ to predict
protective actions. Demographic characteristics of a population determine, according to
Olofsson and Öhmann (2015) and Tierney (2006), risk perception among different groups.
The vulnerability and exposure levels of each demographic and socio-economic groups
44 These respondents, however, were severely affected by another major flood decades later and as a result the value of their property significantly decreased. The decrease in property value caused long-term financial setbacks to them. Householders who lost value on land due to the 2011 event have organized a second class action against the Queensland Government seeking flood compensation (Moore 2017). In addition, flooded householders could no longer sell their property for a price that would allow them to buy an equivalent property elsewhere. As a result, respondents resorted to house raising to protect against future floods and in an attempt to recoup investments made after selling the property and moving to a location featuring lower flood risks. And when the long-term cost and benefit of house raising was compared against other protective actions, the decision of raising a property may have increased since many respondents argued that they could no longer afford the higher premiums of flood insurance. In this context, pensioners were particularly affected not only by the increasing cost of premiums but also by the decrease of their property value, the depletion of their savings, and the psychological impacts that major floods have had in their daily activities.
138
affect the way these different groups perceive flood risks and their ability to reduce these
risks.
Conclusion
By testing house raising under PMT, it was found that this protective action is influenced by
experience, cost, and age. Older respondents are less likely to raise their properties.
Householders who had coped well with previous floods are also less likely to take this
mitigation measure. And respondents who perceive that the cost of house raising to be too
high are equally less willing to undertake this protective action. These results warn
policymakers that policies aiming to encourage this preventive measure among populations
at risk must first take into account the circumstances (experience and cost) and vulnerability
conditions of respondents so that the expected results of these policies can be achieved. In
terms of the hypothesis that coping factors are better predictors than risk perception, these
findings indicate that the coping appraisal variable (response cost) is an important factor
predicting the undertaking of this protective action. However, the maladaptive response
framed as ‘positive experience’ and the vulnerable factor of ‘age’ are equally important
factors in the effort of explaining the decision of raising a property. Finally, this thesis
identified that vulnerability factors such as ‘age’, as policy documents state, should be
carefully considered in mitigation strategies aiming to reduce flood risks through house
raising. It is only after understanding the challenges that a specific group faces that officials
can gauge the level of commitment of vulnerable householders living in flood-prone areas to
collaborate to government efforts by taking actions that reduce their residual risks to major
flood events.
In addition, it is important to stress that descriptive statistics indicates that house
raising is the least popular protective action among householders because of its high costs
and challenges to be implemented. This measure, however, is an important protective action
against major flood risks, particularly among vulnerable residents living next to sources of
flooding and who had experienced extensive flood damage, according to field observations.
Descriptive statistics confirms the importance of this protective action by indicating that
house raising is considered to be more effective to reduce damage from major flood events
than flood insurance and home improvements
139
Chapter 7: Flood Insurance and Relocation
Introduction
This chapter continues to answer the question: How do threat appraisal factors, coping
appraisal factors, and vulnerability influence the decision of householders living in flood-
prone areas to take protective actions? Thus it introduces the results of the models of flood
insurance and intention to relocate. Flood insurance is the most common protective action
in this study and it is largely explained by homeownership, a condition that first needs to be
met for householders to take out flood insurance for their properties. This vulnerability
condition to flood risks is a surprising finding as descriptive statistics and qualitative data
suggested that flood insurance was very likely to be associated with coping appraisal factors
and more particularly response cost. Many respondents complained about the high and
growing cost of premiums but these high prices appeared not to be determinant to the take
out of flood insurance when this is regressed with other explanatory variables. This result is
also surprising because a previous study testing flood insurance under PMT found that
coping factors are strongly associated with this protective action (Bubeck et al. 2013). The
difference between these findings may be explained by the features of the hazard risks in
these different geographic locations, in addition to exposure levels, flood experiences, and
socio-economic indicators of the different populations in each study. Descriptive statistics
could also explain this difference by indicating that more householders claim that the benefits
of living in their property, as it is, are higher than the costs resulting from flood damage (see
question 20 on page 198 and the distribution of its descriptive statistics on page 116).
Qualitative data and field observations also suggest that the majority of residents enjoy living
in their properties and communities despite uncertainty caused by flood risks.
As for the intention to relocate, this model did not include coping appraisal variables.
However, results provide some insights into other relationships with this protective action.
For instance, the level of worry about the impacts of major floods and gender are important
predictors of this protective action. This finding stresses the role of a socio-psychological
model explaining protective actions but it also challenges it by identifying that men, perhaps
because of their lower levels of awareness to flood risks, are more likely to relocate than
women. These are particular interesting findings since there are no empirical studies yet that
have tested this theoretical framework for relocation. Previous empirical research
investigating motivations to relocate have focused on stratifying a population by census data,

140
and so paid no attention to how perceptual risks, objective risks, maladaptive responses,
and household characteristics can also affect the intention of residents in flood-prone areas
to relocate. This complex decision-making process is also revealing because the literature
on this protective action is dominated by policy studies that commonly argue that relocation
is an effective protective action against flood risks (Okada et al. 2014) and the government
plays a key role in encouraging this protective action through structural measures and
specific programs (van den Honert and McAneney 2011). This position is supported by the
arguments that individuals put themselves at risk since they cannot perceive long-term risks
(Kahneman and Tversky 1973; Slovic and Fischhoff 1977) and payouts after disasters
motivate decision makers to not take protective actions in preparation of the next disaster
(van den Honert and McAneney 2011; Wenger et al. 2013).
Flood Insurance
Flood insurance is the most common protective action among respondents in this study.
Nearly ninety percent of respondents have a flood insurance policy. This is a surprising
number since descriptive statistics show that most respondents do not perceive flood
insurance as an affordable, and more particularly, an effective protective action against
major flood risks (see Table 9 on page 117).45 Respondents are also unsure about whether
they can claim that taking out flood insurance is a simple task to carry out if only responses
to this protective action is assessed (see Table 9 on page 117). However, if the percentages
of flood insurance are compared against house raising and home improvements, the
perception of the cost of flood insurance is seen as lower than house raising and higher than
home improvements (see Table 9 on page 117). Another intuitive finding confirmed by
descriptive statistics is that more respondents agree that flood insurance is simpler to take
out than raising or retrofitting a property (see Table 9 on page 117). Finally, it is interesting
to note that the number of respondents who do not agree that flood insurance is effective to
reduce flood damage is significantly higher than the other protective actions (see Table 9 on
page 117). The perception that flood insurance does not reduce flood damage lies in the
understanding that flood insurance is largely perceived as a means to recover from flood
45 This high uptake may have to do with requirements from banks (e.g. mortgages) for householders living in flood-prone areas to hold a flood insurance policy in case of disasters. Confirming this suspicion through qualitative investigation, however, is beyond the scope of this study. Nevertheless, a respondent from Graceville made a comment in this regard: ‘Flood insurance is not option in our suburb via insurer (Commonwealth Bank) regardless of if you flooded or not.’
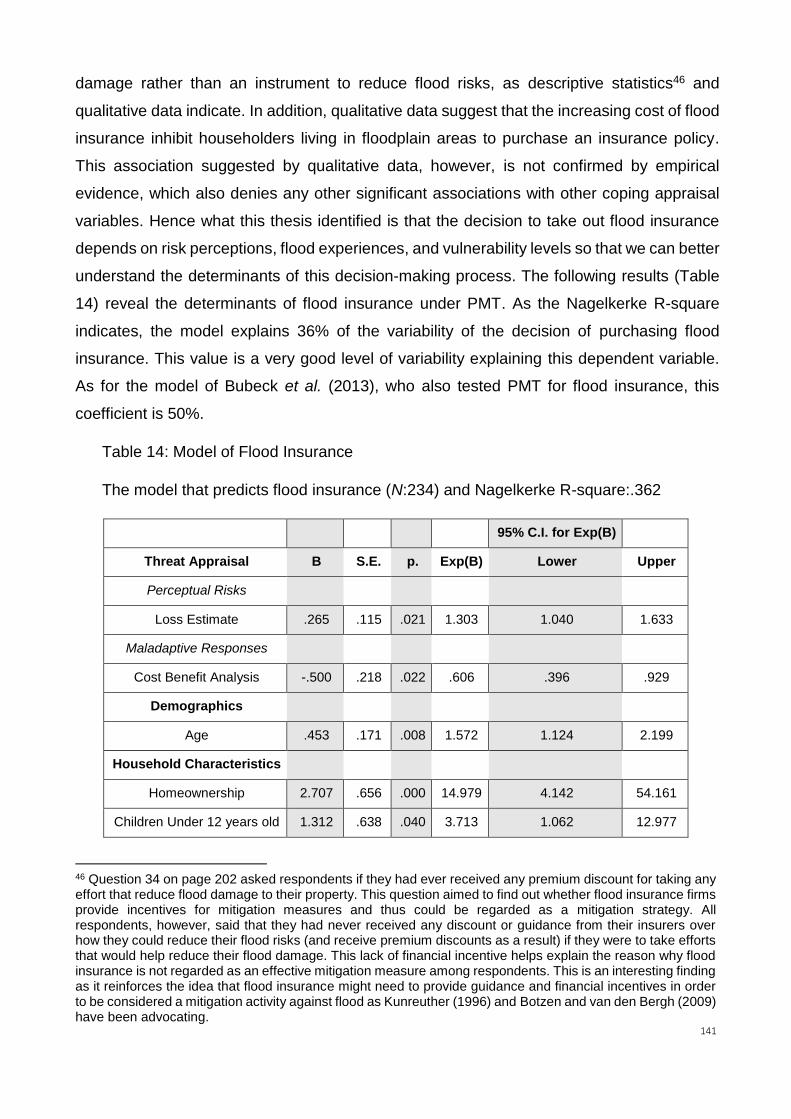
141
damage rather than an instrument to reduce flood risks, as descriptive statistics46 and
qualitative data indicate. In addition, qualitative data suggest that the increasing cost of flood
insurance inhibit householders living in floodplain areas to purchase an insurance policy.
This association suggested by qualitative data, however, is not confirmed by empirical
evidence, which also denies any other significant associations with other coping appraisal
variables. Hence what this thesis identified is that the decision to take out flood insurance
depends on risk perceptions, flood experiences, and vulnerability levels so that we can better
understand the determinants of this decision-making process. The following results (Table
14) reveal the determinants of flood insurance under PMT. As the Nagelkerke R-square
indicates, the model explains 36% of the variability of the decision of purchasing flood
insurance. This value is a very good level of variability explaining this dependent variable.
As for the model of Bubeck et al. (2013), who also tested PMT for flood insurance, this
coefficient is 50%.
Table 14: Model of Flood Insurance
The model that predicts flood insurance (N:234) and Nagelkerke R-square:.362
95% C.I. for Exp(B)
Threat Appraisal B S.E. p. Exp(B) Lower Upper
Perceptual Risks
Loss Estimate .265 .115 .021 1.303 1.040 1.633
Maladaptive Responses
Cost Benefit Analysis -.500 .218 .022 .606 .396 .929
Demographics
Age .453 .171 .008 1.572 1.124 2.199
Household Characteristics
Homeownership 2.707 .656 .000 14.979 4.142 54.161
Children Under 12 years old 1.312 .638 .040 3.713 1.062 12.977
46 Question 34 on page 202 asked respondents if they had ever received any premium discount for taking any effort that reduce flood damage to their property. This question aimed to find out whether flood insurance firms provide incentives for mitigation measures and thus could be regarded as a mitigation strategy. All respondents, however, said that they had never received any discount or guidance from their insurers over how they could reduce their flood risks (and receive premium discounts as a result) if they were to take efforts that would help reduce their flood damage. This lack of financial incentive helps explain the reason why flood insurance is not regarded as an effective mitigation measure among respondents. This is an interesting finding as it reinforces the idea that flood insurance might need to provide guidance and financial incentives in order to be considered a mitigation activity against flood as Kunreuther (1996) and Botzen and van den Bergh (2009) have been advocating.

142
Constant -1.059 1.148 .356 .347
The numbers above show that household characteristics are the variables that best explain
the decision of respondents to take out flood insurance and, in particular, owning a property
is the key influence on decisions to take out flood insurance (sig.: .000; Exp(B): 14.979). This
variable was significantly larger than all the others in the model. And considering that the
large majority of respondents had taken out flood insurance, it is possible to conclude that
the majority of them also own the property they live in, which means that they meet the
condition to take this protective action against this major disaster47. The direction of this
association indicates, from an insurance standpoint, that householders in this thesis present
overall low vulnerability levels to major flood risks. Also, respondents that live with younger
children are more likely to take out flood insurance (sig.: .040; Exp(B): 3.713). A possible
explanation to this relationship is that respondents who have children take out flood
insurance because they feel more vulnerable to flood risks and thus they are more willing to
reduce losses in case they experience flood damage. By reducing losses, these respondents
with younger children would be able to recover faster from a disaster. This finding reinforces
the research of Tierney (2006) on disaster resilience as the presence of vulnerable groups
in a household affect ‘the capacity to endure disaster impacts’ and the ability of householders
to ‘recover as rapidly as possible’ (Tierney 2006:121).
The take out of flood insurance depends on other variables. When respondents
disagree that the benefits of living where they are, without taking any mitigation action
beforehand, are higher than the costs they would incur by investing in a protective action,
they are more likely to take out flood insurance (sig.: .022; Exp(B): .606 or 1.650). These
findings are in accordance to the benefit-cost analysis of mitigation measures conducted by
Ganderton (2005). Ganderton, however, also argues that benefit-cost analysis of disaster
mitigation ‘must be seen as an input to a larger decision-making process rather than an end
in itself’ (2005:117). By ‘a larger decision-making process’, Ganderton means that ‘most
disaster mitigation projects involve decisions with physical, economic, political, social and
47 It is necessary to highlight here that a significant number of renters and short-term residents, through informal interviews, stated that they could not provide accurate information on protective actions, and thus decided to not fill out and mail back the survey to the researcher. Renters and short-terms residents argued that it is was not their responsibility to take structural mitigation measures in the property they lived in and that they were not aware of the challenges that their landlords faced on taking or not protective actions. Also, many of them did not have any flood experience, and so they found that they were not in a position to answer survey questions despite the cover letter of the survey encouraging them to participate in the study. The percentages of homeowners and renters in this study are ninety and ten percent, respectively.

143
emotional dimensions’ (2005:117). Thus this model includes variables that go beyond
monetary terms, as Ganderton suggests (2005:463), and looks into how risk perceptions and
vulnerability factors affect the take out of flood insurance as well.
The other ‘threat appraisal’ variable that explains the take out of flood insurance is the
perception of how much a respondent would lose in case a major flood occurs (sig.: .021;
Exp(B): 1.303). This perceptual risk suggests that respondents take out flood insurance
because they are sensitive to the perception of the amount they may lose in case a major
flood hits their property, as Kanehman and Tversky (1979) and Slovic and Fischhoff (1977)
indicated in their studies about probabilistic thinking. One of the main findings of these
scholars was that the prospect of losing is more likely to influence decision making than the
possibility of winning.
Finally, older respondents are more likely to take out flood insurance (sig.: .008;
Exp(B): 1.572). Older respondents could be more likely to take out flood insurance because
they discount other protective actions -- such as house raising -- as effective, reasonable, or
feasible against flood damage. Thus they resort to flood insurance to protect them against
flood damage. This relationship is supported by the findings of Olofsson and Öhman (2015)
about the role of heterogeneity factors mediating the association between risk perception
and risk behavior. Olofsson and Öhman (2015) argue that stratifying populations at risk is
important because different groups perceive and act differently according to the kind of risk
in question.
Therefore, ‘household characteristics’ present the highest association with the take
out of flood insurance. Respondents that own their property and live with young children are
more likely to take out flood insurance. The decision of taking out flood insurance also
depends, but to a lower extent, to a cost benefit analysis, loss estimate, and the age of
respondents. These variables altogether determine whether a respondent is more likely to
take out flood insurance or not.
Empirical Studies on Flood Insurance
This section compares and contrasts the findings delivered above with the work of Bubeck
et al. (2013), which is the only other study that tested the explanatory power of PMT for flood
insurance. As a result of this limited comparative analysis, this section incorporates studies
that examine risk perception and flood insurance with a similar set of explanatory variables
144
(e.g. Grothmann and Reusswig 2006; Kellens et al. 2013; Lindell and Hwang 2008;
Weinstein 1988).
The most significant finding from Bubeck et al. (2013) relates to the role that coping
appraisal variables play in the prediction of the take out of flood insurance. They identified
that householders who perceived that flood insurance was an effective flood mitigation
measure and had enough ‘practical guidelines’ (or ability to undertake this preventive
measure) were significantly more likely to take out flood insurance. Two other variables
defined as important by Bubeck et al. (2013) were flood experience and avoidance. The
findings here were that the greater the flood experience and the belief that the property would
not be affected by flood damage, the less likely it was that householders would take out flood
insurance. The avoidance and non-protective response is an intuitive correlation, and so it
was expected by Bubeck et al. (2013). However, the negative correlation of flood mitigation
with flood experience came out as a surprise. Bubeck et al. (2013) explained this unexpected
relationship based on the characteristics of the German insurance system. The German
insurance system denies insurance coverage to high-risk areas (Bubeck et al. 2013:1335).
That is, householders living in high-risk properties cannot have flood insurance because they
are denied flood coverage by insurers.
This study, however, did not identify any significant correlation between coping
appraisal and the purchase of flood insurance48. According to the model of this study, there
is no evidence that participants of this project are influenced by the cost of insurance, its
perceived effectiveness or their perceived ability to take it out as a preventive measure. The
most significant variables found in this thesis which explain the take out of flood insurance
are household characteristics, such as homeownership and having dependent children.
48 It is worth noticing that the sample in this study presents less variation in the response scale than the study of Bubeck et al. (2013). High and low levels in the response scale cause a loss in power. And maximum power is achieved when responses are 50%. However, the fact that nearly ninety percent of respondents in this study took out flood insurance does not invalidate the findings of this model for few reasons. First, the distribution of the survey considered and captured a significant number of householders living in three different flood zones (high, medium, and low flood risks). The sample size (see page 90) for each flood zone directly affects the value of parameter estimates. Second, the parameter estimates (coefficients) of some covariates of this model are large and significant, which indicate that these covariates are indeed associated with the probability of taking out flood insurance. Third, this model does not assume that it captured every single factor determining the probability of taking out flood insurance since the pseudo R-square (Nagelkerke) of .362 suggests that this model explains 36% of the variability of the take out of flood insurance. In other words, the model discovered some variables that significantly explain flood insurance but there are probably other variables that have not been included (or are even unknown to the researcher) that may also be important. In addition, this pseudo R-square of .362 is a very good indicator for a model trying to understand human behaviour. Having said that, the response scale of this study of ninety percent is not optimal but it is not either 100% or 0%, which would have invalidated the analysis.
145
There are other differences between this study and Bubeck et al. (2013). In this study,
older respondents are more likely to take out flood insurance whereas Bubeck et al. (2013)
did not identify any association in this regard. Also, Bubeck et al. did not find any relationship
between ‘perceived consequence’ (2013:1334) and the take out of flood insurance. This
study, however, found out an association between this threat appraisal variable with the
purchase of flood insurance. Respondents that estimate higher losses to major floods are
more likely to take out flood insurance. This intuitive finding is also relevant in terms of
revealing that risk aversion is also an important factor to be consider when assessing
decision making under uncertain scenarios (Hudson et al. 2014; Petrolia et al. 2013; Poussin
et al. 2014).
A similarity between this study and Bubeck et al.’s (2013) could be in relation to
maladaptive responses to the risks of major floods. If this correlation is analyzed from the
perspective of the householders that did not take out flood insurance, it is possible to state
that Bubeck et al. (2013:1335) identified that ‘avoidance’ (or the belief that a householder
would not be affected by floods) explains the decision of householders to not take out flood
insurance. This study refined the understanding of ‘avoidance’ by explaining that the belief
that perceived benefits of living where individuals at risk are outweigh the costs of
implementing preventive measures influences their decision to not take out flood insurance.
Thus both studies identified maladaptive responses to flood risk perception; however, the
finding of this study carries a more precise understanding of the term ‘avoidance’ than the
study of Bubeck et al. (2013).
Another similarity between this study and Bubeck et al. (2013) could be in terms of
flood experience since none of the studies identified a clear association with the take out of
flood insurance. Bubeck et al. (2013:1335) did find out a significant correlation between the
experience with floods and the take out of flood insurance. This relationship, however, came
out as counterintuitive because of the denial of German insurers to provide coverage to high-
risk properties. As for this study conducted in Australia, the maladaptive response ‘cost
benefit analysis’ takes into account elements of flood experience; however, none of the other
variables explicitly related to flood experience (worry; psychologically affected; financially
affected) yielded any significant correlation with the take out of flood insurance. Thus it is
possible to conclude that flood experience is not strongly associated with the decision of
householders to take out flood insurance based on the models of this study as well as
Bubeck et al.’s (2013).

146
Thus this study and the results of Bubeck et al. (2013) present more differences than
similarities in regard to the important protective action of flood insurance against low-
probability high-impact disasters. In Bubeck et al.’s (2013) model, the standard hypothesis
that coping appraisal is a stronger predictor than threat appraisal is confirmed. This study,
however, did not only not identify these correlations but also stressed that the most
significant predictor of the purchase of flood insurance is a vulnerable indicator. Individuals
that do not meet the condition to take out flood insurance such as owning the property they
live in do not have the incentive to reduce their risks to major floods through this protective
action. The strength of this correlation is significantly stronger than the other associations
yielded by the model. This is an important contribution of this thesis to empirical studies
testing PMT to predict the take out of flood insurance.
The assessment of the strength of the model now takes into account empirical studies
that also investigated determinant variables for flood insurance but not under PMT. The
objective of this further comparison is to investigate the significance of models that did not
follow PMT’s principles. This comparative analysis allows this investigation to better identify
the strength of this model vis-à-vis other studies and to expand the understanding of what
lead householders living in flood-risk areas to take out flood insurance. The following
paragraphs first discuss threat appraisal variables, followed by coping appraising variables,
then demographics, and household characteristics before a summary is made.
In relation to perceptual risks, which are part of threat appraisal, the overall
understanding in the literature is that perceived personal risks based on the likelihood,
frequency, and severity (or loss estimate) of floods is positively correlated to the purchase
of flood insurance (Lindell and Hwang 2008:551). However, these perceived personal risks
depend on other variables to explain a decision to take out flood insurance (Kellens et al.
2013). Thus models trying to explain the purchase of flood insurance should not investigate
only ‘beliefs about likelihood and severity’ of floods (Weinstein 1988:373). This thesis is in
accordance with Weinstein’s (1988) statements by suggesting that perceived personal risks
are not enough to explain the purchase of flood insurance.
In terms of objective risks, which are also part of threat appraisal, the literature states
that flood damage is positively correlated to the take out of flood insurance (Kellens et al.
2013; Kundak et al. 2014). The higher experienced losses are, individuals at risk become
more likely to take out flood insurance. Reynaud et al. (2013) and Proske (2004) also
observed a positive correlation between the likelihood of major floods with the decision of

147
taking out flood insurance. Reynaud et al. (2013) and Proske (2004), however, highlighted
that this association is mediated by the perceived probability and severity of major hazards.
That is, the perceived probability and severity of major hazards influence the perception of
individuals about potential damages caused by a major hazard. Weinstein (1988) once again
supports the expansion of preventive models that can accurately predict the undertaking of
protective actions through the incorporation of elements such as beliefs and intentions to
better understand how these factors actually lead to action. The model of this study is also
again in accordance with the position of Weinstein (1988) as it did not find any significant
correlation between objective risks and the purchase of flood insurance.
As for maladaptive responses, which are another sub-category of threat appraisal, the
literature stresses the importance of investigating the justifications that individuals give to
themselves in order to not take out flood insurance (Grothmann and Reusswig 2006). The
model of this study, if assessed from the perspective of householders that decided to not
take out flood insurance, substantiates the importance of this investigation since it identified
that individuals living in flood-risk areas do not take out flood insurance because they believe
that the benefits of living where they are, without taking any preventive measures, are higher
than the costs they would incur to protect against flood damage or the risks of flood damage.
This result is corroborated by the findings of Weinstein (1988) that precautionary
behaviour is influenced by beliefs and intentions of individuals at risk. This association
indicates that residents incorporates risk acceptance into their decision making. As Geiger
(2005) and Plattner (2004) suggest, utilitarian studies need to consider the risk levels that
are marginally accepted by individuals at risk in order to understand decision-making
processes. Ganderton (2005) argues that the assessment of risk acceptability should involve
a number of pragmatic factors provided by benefit-cost analysis so that we can predict when
individuals at risk take out protective actions based on the variability of their risk attitudes. At
the government level, one mediated factor of risk acceptance, according to the Queensland
Reconstruction Authority (2014), is the development of properties next to waterways, which
is a form of institutional acceptance to flood risks. To mitigate these risks, the Queensland
Reconstruction Authority (2014) recommends the enactment of regulations that improve
building design, resilience factors (such as insurance), and emergency management. At the
individual level, Petrolia et al. (2013) argued that the higher the risk aversion is (in monetary
terms), the more likely it is that the householder will take out flood insurance after purchasing
a property in a flood-risk area. This study agrees with Petrolia et al. (2013) as it found that

148
that respondents are influenced by their risk aversion, or the probability to be financially
impacted by major floods. Householders are more likely to take out flood insurance when
they perceive that the costs of living in a flood-prone property is higher than the benefits of
living in this property and community. Thus this association indicates that respondents make
a decision of purchasing flood insurance after considering the marginal costs and benefits
of undertaking this protective action. This finding about how risk acceptability is influenced
by risk aversion is an important finding of this thesis in terms of the cognitive psychology of
decision making under uncertainty.
This thesis also identified that associations with threat appraisal variables help explain
the take out of flood insurance but they are not enough or feature the most significant
variables to understand what lead individuals at risk to take out flood insurance. Nonetheless,
an innovative experiment of Zaalberg and Midden (2010) identified that 3D simulations of
water levels inundating a property influenced participants to take out protective actions. The
use of technology to inform flood risks could increase the significance of threat appraisal
variables in models investigating risk perception and decision making under uncertainty. In
addition, the update of existing flood maps managed by the Brisbane City Council may also
exert some influence on the threat appraisal levels among residents living in flood-prone
areas. The update of these maps is a recommendation of the Queensland Commission of
Inquiry after conducting a thorough investigation about the causes of the disaster in 2011
(QFCI 2012).49 This Inquiry, as well as qualitative data, found out that these flood maps were
outdated.
As for coping appraisal variables, this thesis did not find any significant correlation
between coping appraisal variables and flood insurance. The perception of the costs,
feasibility and efficiency of flood insurance as a protective action did not influence the
decision of householders to take out this protective action. The absence of these coping
appraisal variables is surprising since a previous study considering the same theoretical
49 The government should collaborate with insurers in its effort to review and expand existing flood maps. As Dlugolecki and Keykhah (2002) highlighted, flood maps provide basic information about flood risks to individuals at risk. Flood maps also inform the debate over compulsory building requirements. Householders and insurers require that flood maps reflect actual risks but these maps need to be updated. Flood maps not only indicate flood risks but they also serve to justify the price of insurance policies. Householders living in higher risk areas are expected to pay more than residents living in lower risk areas. However, as a respondent highlights, ‘the (flood) maps (available online) are so rare and incorrect in relation to flood river flood overlays and floodwise report’. In addition, Wenger et al. (2013), citing the Inquiry’s report (QFCI 2012), stated that the Brisbane City Council consistently disregarded the recommendations by the state that it needed to enhance its flood mapping program to better guide development projects.

149
framework identified strong correlations between the perceived ability of individuals at risk
and their decision to take out flood insurance (Bubeck et al. 2013). This is also an
unexpected result as qualitative data indicated that many respondents, particularly high-risk
residents, were unhappy about the high costs of flood insurance (‘The cost of insurance for
high-risk properties is far too expensive to consider’). In addition, the increase in premiums
seems to affect not only high-risk properties but all householders living in a flood-zone area
(‘Insurance in our suburb went up post-2011 but that was for all houses, not just those that
flooded’). Low-income householders, however, seemed to be particularly affected by this
spike in prices (‘The ongoing cost of insurance must be considered. It has gone up nearly
25% since the flood. It is almost non-affordable now, i.e. $350 for a modest house’). Finally,
a respondent summarised the impact that the increased cost of flood insurance meant to her
(‘The flood insurance increases have been the worst impact from the floods’).50
Despite claims that the growing cost of premiums affected the take out of flood
insurance and that insurance firms should reduce the cost of premiums for high-risk
householders to increase the number of policyholders, this thesis did not find any empirical
evidence supporting these claims. The cost of flood insurance51 is not a main factor
explaining the purchase of flood insurance. Other factors actually present stronger
associations with the decision of householders to take out of flood insurance. This statistical
finding is particularly important for officials and insurance firms. Public authorities can
observe that the cost of flood premiums does not prevent a great number of householders
from purchasing flood coverage, despite householders complaining about the growing costs
of premiums particularly after a major disaster. As for insurance firms, they find in this model
evidence that support their concern over adverse selection and moral hazard (Hudson et al.
2014). By being able to match flood risks with the cost of premiums, as Kunreuther (2008)
advocate, insurance firms reduce their risk of insuring for lower prices householders that
present higher risks and repetitive losses. By operating in a market that allows price
adjustments (Blazey and Govind 2007), insurers can create financial incentives such as
discounts for householders that reduce their flood risk by undertaking further protective
actions (Botzen and van den Bergh 2009) such as house raising and home improvements.
50 As a result of the increase in prices, a respondent asked for the cost of premium to be reduced, particularly because the government aims to reduce flood risks by investing in mitigation measures such as the construction of new dams: ‘If the flood mitigation measures taken by the State government and the Council do mean that future flooding is less likely then the insurance companies should be reducing premiums – which they do not seem to be doing’, a respondent stated.
51 Cross-correlation between the variables ‘insurance cost’ and ‘cost benefit analysis’ is provided on page 211.
150
In this regard, however, descriptive statistics reveal that none of the nearly five hundred
participants of this study said that insurers provide any sort of guidance -- or discount -- on
how they can reduce their flood risks by taking further protective actions. Thus, respondents
largely see flood insurance as a recovery measure against flood damage and not as a
mitigation action against flood risks. In this effort to build more resilient communities during
the recovery process, Kunreuther (1996) and Botzen and van den Bergh (2009) argue that
flood preparedness could be improved if insurers reward mitigation activities taken by their
policyholders with financial incentives.52
It was also expected that not only response cost but also response-efficacy would
result in significant correlations with the take out of flood insurance. A respondent highlighted
the psychological advantage of having a flood insurance policy: ‘I have taken out flood
insurance since 2011, for peace of mind’. Another respondent also explained that flood
insurance is an important measure to recover from flood-related losses: ‘I lived in this
property as a child and my parents did not have insurance and did not get government help.
It took them much longer to recover from 1974’. Finally, another respondent agreed that
insurance can be an effective recovery mechanism against flood damage but it presents its
own challenges: ‘Insurance eases financial burden but has many issues of its own’. The
issues that this respondent make reference to are in relation to self-efficacy, or the ability, to
take out flood insurance.
It was expected that respondents would be influenced by their perception over the
simplicity of taking out flood insurance, particularly if compared against the other protective
actions included in this study. However, the decision of purchasing a policy presented
several challenges. The main challenge does not seem to be in relation to the take out of a
flood insurance policy but in regard to the coverage and the payment of flood losses by
insurance firms. One respondent, for instance, said that he ‘thought he had flood insurance
before the 2011 floods’. Another one complemented: ‘Lost everything including house.
Insurance did not pay’. And even when policyholders had the right coverage they claimed
52 However, lack of financial incentives by insurers reduce the importance of their claim that they need to increase their premium prices to reduce their risks of moral hazard, when the insured deny to reduce their exposure to risks. In this study, not a single respondent who claimed to hold a flood insurance policy said that they were granted any type of discount for undertaking other protective actions. Thus the government should work with insurers to offer policyholders a financial incentive to take further protective actions and reduce the cost of their premiums. As van den Honert and McAneney (2011) state, the government has a moral obligation to engage in this type of discussion with insurers since it permitted householders to build and live in flood-prone areas. Also, Poussin et al. (2014:76) suggest that discounts in insurance premiums or subsidies could be granted for householders that implement expensive but cost-effective mitigation measures.
151
that they were not paid to the extent they expected: ‘I was not paid my full insurance figure
on my policy’. This means that this householder found out that his flood insurance did not
provide full coverage to his losses only after the aftermath of the disaster in 2011, or that the
insurer did not pay what it had promised after conducting its damage assessment. Another
respondent expressed his frustration about the lengthy process over the identification of the
causes of flood in 2011: ‘Only the dingoes in the insurance industry care about where it
(‘water’) comes from so that they can get out of paying. We simply want our stuff fixed!’ And
when respondents did not agree on the assessment of the insurer about the extension of the
damage in their property, they said that ‘Suncorp (insurer) threatened me with no payment
if I challenged their assessment’. Finally, another householder complained about the
challenge to take out a full flood insurance policy: ‘The insurance company will not give us
properly worded flood coverage even though the government says body corporates must
insure against all flood and water damage’. Therefore, qualitative data suggest possible
relationships between coping appraisal variables and the take out of flood insurance.
However, empirical data could not identify none of these associations.
Other literature also pointed out that it did not find any significant association between
coping appraisal variables and the purchase of insurance (Lindell and Whitney 2000). Lindell
(2013:115), testing the take out of insurance for seismic risks, expressed surprise to the lack
of significant correlations between the take out of insurance and coping appraisal variables
since these results defy the prediction that coping appraisal variables play an important role
to understand why individuals at risk take out insurance. This non-significant association
between insurance and coping variables challenge the economic determinants of decision
making (Lindell 2013:115). Lindell (2013) did not provide theoretical insights into the reasons
why insurance and coping appraisal variables were not positively correlated. The explanation
of Lindell (2013) for this lack of correlation was centered on methodological limitations of
statistical models. In the same study, Lindell (2013) did not find any consistent correlations
between demographics and the purchase of insurance. This is the main difference between
the studies of Lindell and this project. This thesis identified predictors of decisions to take
out insurance based on demographic and household characteristics.
Previous research identified that homeownership and income predict the take out of
flood insurance (Kellens et al. 2013). This study agrees that homeownership predicts the
decision of purchasing flood insurance. Income, however, did not yield any significant
correlation with this dependent variable. Lindell and Hwang (2008) also did not find out any
significant relationship between income and the purchase of insurance. Another expected
152
relationship that this study and Lindell and Hwang (2008) did not find out was the one
between housing tenure and the take out of insurance. This study, as well as Lindell and
Hwang (2008), cannot affirm that respondents who expect to live longer in the property are
more likely to purchase insurance. Finally, this study identified that respondents who live
with a vulnerable group are more likely to take out flood insurance. No other study, as far as
we are aware of, identified this relationship.
Conclusion
Empirical studies that investigated the motivations of householders living in flood-risk areas
to take out flood insurance resulted in more similar results with the findings of this study than
the model of Bubeck et al. (2013), which also assessed the purchase of flood insurance
under PMT. Bubeck et al.’s (2013) determinant factors are the coping variables of efficiency
and feasibility. This study, however, did not find any significant correlation in this regard
despite comments made by respondents on flood insurance about its high costs, perceived
efficiency as a recovery tool and being relatively simpler to ‘undertake’ in comparison with
other protective actions (see page 117). As for empirical studies not testing PMT, they have
identified that homeownership positively influences the take out of flood insurance (Kellens
et al. 2013). This study also identified this correlation and the strength of this relationship is
significantly higher than any other variable added in the model. Homeownership is a strong
explanatory variable in this study but homeowners living with children are even more likely
to take out flood insurance as a protective action. These relationships determining the
purchase of flood insurance are the main contribution of this model to the literature because
of the strength of this association and the high uptake of flood insurance as a protective
action against major flood risks when compared against house raising and home
improvements. This finding, therefore, confirms the statement of Emergency Management
Australia (EMA 2000) that the assessment of social-inequalities, in terms of homeownership,
should guide vulnerability assessments among communities at risk in Australia.
Other significant correlations are loss estimate, cost benefit analysis, and age. The
explanatory power of these variables, however, is considerably weaker than the association
with homeownership, which is a vulnerability factor associated with household
characteristics and a basic condition that first needs to be met before considering the take
out of this protective action. These other associations deriving from the model are important
in the sense that they indicate the role that heuristics, through the interdependence of risk
aversion and risk acceptability, play on the decision-making process of individuals facing

153
major flood risks. Also, this thesis once again highlighted that demographic factors, such as
age, which is a key vulnerability indicator of a community at risk, end up determining risk
perception and more importantly the ability of these vulnerable groups to take protective
actions.
Finally, it is worth highlighting some descriptive statistics that suggest the reason why
flood insurance is significantly more popular than house raising and home improvements
among the participants of this study despite not being perceived as effective as a mitigation
measure. This may be explained, as the association ‘cost benefit analysis’ from the model
identified, by the fact that more householders claim that the benefits of living in their property,
as it is, are higher than the costs resulting from flood damage (see question 20 on page 198
and the distribution of its descriptive statistics on page 117). Qualitative data and field
observations confirm this association by suggesting that the majority of residents enjoy living
in their properties and communities. These residents are generally unwillingly to move
elsewhere and therefore agree to take out flood insurance to mitigate the psychological and
financial burden deriving from uncertainty about flood damage.
Relocation
Relocation is the third most popular protective action among householders. Thirty percent of
respondents would like to leave their flood-prone property.53 However, this percentage is
significantly behind flood insurance as a protective action, which is adopted by nearly ninety
percent of participants, little behind home improvements, which represents nearly forty
percent of respondents, but ahead of house raising, which comprises nearly twenty percent
of householders. However, the majority of respondents would not like to live elsewhere and
a reason to this position could be that they enjoy living where they are: ‘Love living here so
will never leave due to concern of future floods’, stated a respondent living along the
Brisbane River.
From a public policy perspective, relocation is considered an effective protective
action against the risks of repetitive and major floods (Okada et al. 2014:29). The decision
to relocate, however, depends on a cost-benefit analysis conducted by public authorities. As
53 It is important to notice that the nature of this dependent variable is different from the other ones included in this study. This dependent variable measures the intention of householders to leave the area they live. Thus this decision has not yet been made. In regard to the other three dependent variables added in this study, they are decisions already implemented by the householders living in a flood-prone area.
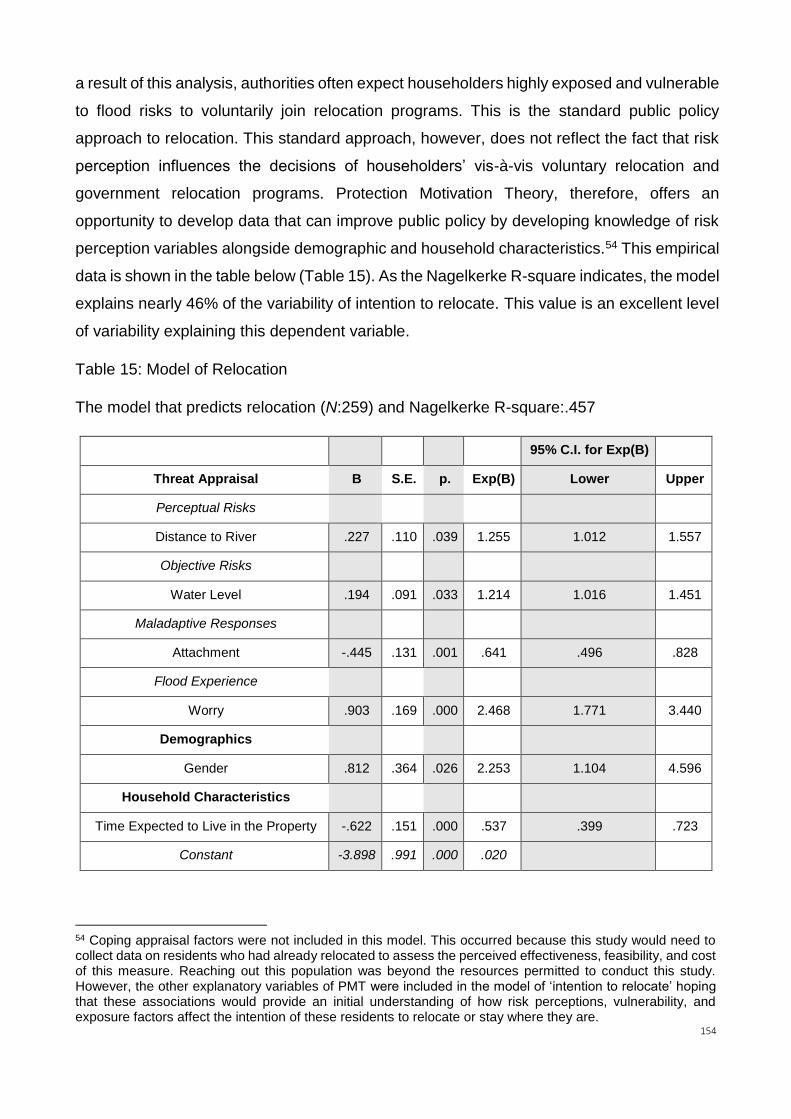
154
a result of this analysis, authorities often expect householders highly exposed and vulnerable
to flood risks to voluntarily join relocation programs. This is the standard public policy
approach to relocation. This standard approach, however, does not reflect the fact that risk
perception influences the decisions of householders’ vis-à-vis voluntary relocation and
government relocation programs. Protection Motivation Theory, therefore, offers an
opportunity to develop data that can improve public policy by developing knowledge of risk
perception variables alongside demographic and household characteristics.54 This empirical
data is shown in the table below (Table 15). As the Nagelkerke R-square indicates, the model
explains nearly 46% of the variability of intention to relocate. This value is an excellent level
of variability explaining this dependent variable.
Table 15: Model of Relocation
The model that predicts relocation (N:259) and Nagelkerke R-square:.457
95% C.I. for Exp(B)
Threat Appraisal B S.E. p. Exp(B) Lower Upper
Perceptual Risks
Distance to River .227 .110 .039 1.255 1.012 1.557
Objective Risks
Water Level .194 .091 .033 1.214 1.016 1.451
Maladaptive Responses
Attachment -.445 .131 .001 .641 .496 .828
Flood Experience
Worry .903 .169 .000 2.468 1.771 3.440
Demographics
Gender .812 .364 .026 2.253 1.104 4.596
Household Characteristics
Time Expected to Live in the Property -.622 .151 .000 .537 .399 .723
Constant -3.898 .991 .000 .020
54 Coping appraisal factors were not included in this model. This occurred because this study would need to collect data on residents who had already relocated to assess the perceived effectiveness, feasibility, and cost of this measure. Reaching out this population was beyond the resources permitted to conduct this study. However, the other explanatory variables of PMT were included in the model of ‘intention to relocate’ hoping that these associations would provide an initial understanding of how risk perceptions, vulnerability, and exposure factors affect the intention of these residents to relocate or stay where they are.
155
The independent variable that presented the highest association with ‘intention to relocate’
is worry (sig,: .000; Exp(B): 2.468). As expected, respondents less worried about floods were
less likely to relocate. This correlation indicates that flood experience could have a strong
influence in the decision of respondents to relocate. Qualitative data confirm this correlation,
particularly in regard to the other direction of the correlation: respondents more worried about
the risk of major floods are more likely to relocate. A respondent from Sherwood worried
about experiencing once again the effects of a major disaster said: ‘I am moving. I will not
be here (in the next event)’. And a resident from Graceville agreed: ‘(We) have just sold our
house’. Flood experience may also be associated with flood damage since it may increase
the level of worry among respondents. A householder that had been financially affected by
major floods, for instance, said: ‘As soon as I finish repairing it (my house) from 2011 flood
(I) will be selling (it) and moving out’. Therefore, according to qualitative data, respondents
generally worried about the impacts of major floods are more willing to relocate and the ones
that have experienced flood damage are even more keen to settle elsewhere.
There are other factors related to the risk perception of major floods that explain
‘intention to relocate’. If respondents do not feel emotionally attached to their property and/or
community, they are more likely to relocate (sig.: .001; Exp(B): .641 or 1.56).55 Or they are
less likely to relocate (and perhaps take other protective actions) if they are attached to their
property and/or community. In this regard, a respondent from Yeronga said the following:
We love living where we live, so we will continue to live here and flood proof as best as we can. It is not practical to raise our house, so this means flood insurance and flood proof materials on the ground.
In addition, respondents would also not like to relocate if they experienced lower water levels
in their property or would be more willing to relocate if they had experienced higher levels of
water in their property (sig.: .033; Exp(B): 1.214).56 The latter correlation is substantiated by
55 This maladaptive response, called in this study as ‘attachment’, was only included in this model. This occurred because the argument that an emotional attachment to the property, land and/or community would only make sense when assessed for ‘intention to relocate’. 56 This perception over rising flood waters is mediated by the level of worry among householders. The literature pointed out the importance of mediating risk perception with psychological investigations of individuals at risk (Burns et al. 1993; Dooley et al. 1992). Ronan and Johnson (2005) agreed that a broaden exploration of risk perception would provide a better prediction of decision making. However, the prediction of psychological aspects of decision making, as Rundmo and Moen (2007) stated, must be specific to give respondents the opportunity to express the level of their worry to a certain hazard. Giving the possibility for respondents to rank the level of possible inundation in their property and worry about major hazards provides important insights into decision-making processes. This is what the survey of this thesis did by providing a Likert-scale in which respondents could rank their worry level to major flood events and inform the water level in their property in the last disaster.
156
qualitative data. A resident from Sherwood revealed that: ‘Our (previous) house was
inundated with approximately four metres of water suffering significant damage which is why
we moved’. Another resident from Sherwood also stressed flood damage as a motivation to
relocate: ‘We sold our flood affected house and moved to a house that was not flooded but
could suffer flood damage (minor hopefully) in future floods similar to 2011’. It is interesting
to note that this respondent admitted that the new house is also subjected to flood risks.
However, this perception did not discourage relocation to a place where major floods can
still cause property damage. This statement illustrates the role that risk acceptance plays in
shaping risk perception and decision making (Geiger 2005). Geiger (2005:226) defends that
the investigation of decision making under uncertainty needs to consider the observed
variability of risk acceptance attitudes so that we can understand the extent of the properties
of marginally acceptable risks among householders living in high-risk areas.
Moreover, respondents who lived farther from the Brisbane River were more likely to
relocate (sig.: .001; Exp(B): 1.255). This result was not expected. The expectation was that
respondents who lived farther from the river would be less likely to relocate -- or closer to the
river more likely to relocate. This association then may come across as non-intuitive.
However, this non-intuitive association is logical if we interpret this association in the
following way. First, living closer to the river might be perceived to yield more benefits than
costs. ‘We love living here’, said a respondent living in a property next to the Brisbane River
in Fairfield. Respondents living closer to the river might also have the financial means to
protect against damage by being fully insured against flood risks. A great number of
householders situated along the Brisbane River live in high-end properties. Second, this non-
intuitive association confirms that floods causing extensive damage are not only river
flooding. Major floods causing extensive damage can also result from other types of flooding
such as overland and creek flooding, which affect households living farther from the river.
Respondents, particularly from Rocklea, which is an inner suburb, claim that they are
constantly affected by creek floods. ‘Whenever it rains hard or the river breaks its banks, we
flood’, stated a resident from this suburb. Thus floods that result in repetitive and extensive
damage are also caused by other sources rather than river flooding and this damage can be
significant enough to convince householders to relocate57.
57 This finding reinforces the role that the location of a property, mediated by vulnerability and exposure levels, has on the decision of a householder to relocate. This finding challenges the perception-adjustment paradigm of the seminal work of White (1945). White argued that individuals located farther from major threats are less likely to adjust to a major hazard. The finding of this thesis, however, shows that residents living closer to the
157
Another strong association was gender (sig.: .026; Exp(B): 2.253). Men were more
likely than women to relocate. This result was unexpected. The expectation was that women
would be more willing to move out from a flood-prone area. In an extensive literature review,
Rundmo and Moen (2007) identified that men are less likely to react to major risks than
women. This occurs because men’s behaviour is more risk-oriented and less risk-reducing
(Olofsson and Öhman 2015). Beringer (2000), however, argued that risk perception is less
about gender and more about knowledge towards major risks influencing risk attitudes.
Beringer (2000) identified that men tend to have better understanding of major risks than
women. As a result, men are less likely to perceive a major risk to be a greater threat.
However, apart from gender and knowledge explanations of why men are less influenced by
major risks than women, Olofsson and Rashid (2011) observed that in societies where the
so-called White Male Effect is not dominant men can be more sensitive than women for some
kind of risks. This is an interesting finding as it suggests that gender equality has an effect
on risk perception. This finding of Olofsson and Rashid (2011) may support the result of
Beringer (2000) by suggesting that risk perception is less about gender per se and more
about the level that each person has been exposed to formal education and information
about major threats. If this thesis were to agree with the assumptions of this last statement,
it is possible to argue that the finding of this study suggests that women among the
respondents are more educated and informed than men about major flood risks and this is
the reason why they are less likely to relocate. This rationale is supported by a cross
tabulation from the dataset of this thesis, which indicates that women are indeed more
educated than men among the population of this study. In the higher educational brackets
of the survey (some university, university, and post-graduate degrees), the respective
percentage of women is higher than men (52.6%; 55%; 55.3% against 47.4%; 49%, 44%).
Brisbane River are not as likely to relocate as householders living farther from this main source of major disasters. This is because it is not the location of a property that determines the relocation of a householder but the vulnerability level of the householder to these events, which may prevent them from adjusting to hazard risks. In addition, the literature and this study stress that property location is also part of a larger problem. Land-use planning is actually the determinant factor to understand the role that location plays in risk perception and decision making under uncertainty. As the Queensland Flood Commissions of Inquiry (2012) highlighted it was the offer of cheap land in flood-prone areas that increased major flood risks for householders. van den Honert and McAneney (2011) stated that the government needed to review its land-use development plans if it wants to reduce exposure to flood risks among vulnerable communities. In this regard, a respondent from Rocklea highlighted the responsibility of the Brisbane City Council for his losses: ‘The Council developed and sold this land in 1980 knowing it had been flooded in 1974. Houses should have not been built here in the 1980s and 1990s’.
158
This possible association is also interesting in the sense that it suggests that higher
educational levels make individuals at risk less likely to relocate while also challenging the
conventional wisdom on the topic, which is that lower educational levels explain why some
people refuse to relocate from hazard risk areas (Shiwaku and Shaw 2008).
The other significant association is between relocation and ‘housing tenure’ (sig.:
.000; Exp(B): .537 or 1.86). Respondents that expect to live longer in their property are less
likely to relocate. This result is intuitive, and so was expected. There is no reason to believe
why respondents who want to live longer in their property would like to settle elsewhere. The
main assumption in this correlation is that respondents chose to live longer in their property
after assessing the risks of having their property struck by a major flood. In this sense, a
resident admitted she was only able to afford the current property she lives in with her family
in Fairfield because of the high-flood risks of this property and the lower market price of this
property after being severely affected by the disaster in 2011. This respondent stated, in
addition, that they were aware of the flood risks of this area before purchasing this high-risk
property and this is why they have retrofitted their property to sustain the risk of another
major event. Based on the structural changes made on the property, this respondent said
that the impacts of major floods are no longer a major concern, and so she plans to live for
many years with her family in this property and community.
As for coping appraisal variables, they were not included in this model. The
measurement of coping variables would require the expansion of the scope of this project.
Only respondents who had already relocated would be able to accurately answer questions
related to the cost, effectiveness and feasibility of relocation as a protective action. The
participation of householders who had relocated would also have required access to further
resources. As this project did not have access to these resources, it included in its target
population only respondents who still live in flood-zone areas. Householders no longer living
in flood zone areas are, therefore, beyond the scope of this project.
Nonetheless, some respondents still living in a flood zone area left comments in the
survey indicating some possible relationships between relocation and coping appraisal
variables. For instance, in terms of ‘response-efficacy’, a respondent from Rocklea said: ‘The
only preventive measure that would work is moving out of here’. As for ‘response cost’, some
respondents said they wished to relocate but they could not because they still feel the
financial effects of the 2011 floods. In this regard, a respondent from Fairfield said: ‘The main
financial loss incurred has been a loss (of property) in monetary value (, so) we are staying
159
here for a while’. A respondent from Sherwood agreed: ‘financially it (2011 floods) has set
us back significantly’. In Yeronga, a respondent highlighted that he would not only need to
continue living in a flood-prone area but also take further preventive measures as a result of
not being able to relocate: ‘Our property has lost value because of the floods, so we will
continue to live here and flood proof as best as we can’. Relocation, however, can also be
regarded as a cheaper protective action to undertake as this respondent from Fairfield
explained: ‘The extra cost associated with renovating in a flood zone makes it too expensive
for us to do. We will have to move to meet our growing family needs rather than renovate
here.’ In terms of ‘self-efficacy’, settling elsewhere is not simple. A respondent from Rocklea
highlighted the impact that flood damage caused in his relocation plans: ‘I cannot sell (my
property) as now I have 50% mortgage’. In addition, a respondent from Yeronga revealed
the issue of finding a similar property elsewhere: ‘(I would) extremely like (to relocate) but
(…) it has to be an equivalent to the existing house’. And this respondent from Yeronga
stated that he would also like to relocate but finding a safe location is not properly easy: ‘I
need to find land and house that government and universe can guarantee is safe’.
Self-efficacy could have been strongly associated with intention to relocate if the
government had in place a comprehensive program supporting these householders to sell
their high-risk properties. However, a respondent from Yeronga argued that the Brisbane
City Council (BCC) relocation program called Buy-Back Scheme ‘was not available or offered
after floods’. A respondent from Fairfield seriously affected by the 2011 floods
complemented: ‘We were told that BCC does not have money to buy back properties
anymore’. A resident from Rocklea revealed another issue with this scheme: ‘We were
approached without applying for the Council buy-back but their offer was not economically
viable’. There is also the issue of eligibility in this scheme as this respondent from Rocklea
revealed after approaching the Council to buy back his property: ‘I was told (by the Council)
that I do not get wet enough’. Thus qualitative data suggest that coping factors might
influence relocation in the following way: householders are more likely to relocate because
they perceive that this protective action is effective; however, relocating is not cheap or an
easy decision to make because of the many costs involved and the impossibility to count on
a public program that supports this decision.
Therefore, respondents that are more willing to relocate are those i) increasingly
worry about the effects of a major flood event to their property; ii) men; iii) who do not expect
to live longer in the property they currently reside; iv) do not feel attached to their property
160
and community; v) have experienced repetitive flood damage from creek or overland
flooding; and vi) witnessed higher levels of inundation in their property resulting in significant
damage. As for qualitative data on coping factors, they revealed that relocation as a
protective action can be seen as effective. In terms of cost, relocation is generally
considered expensive but also cheaper if a large retrofitting effort is required. And this
protective action is not regarded as simple to undertake because of the different challenges
that respondents face to sell their property, find a correspondent property elsewhere, and
be eligible to join a public buy-back scheme.
Previous Studies on Relocation
Relocation was not considered in previous PMT research. Moreover, studies that examine
relocation as a floodplain management tool have a tendency to examine the issue as a policy
concern. Such studies assess relocation via cost and benefit analyses calibrated towards
facilitating government interests (see, for example, van den Honert and McAneney (2011)
on the relocation of the Grantham community after the Queensland floods in 2011). Thus
the literature does not provide empirical evidence to conduct a substantial comparative
analysis with the findings of this study. Therefore, in order to stress the importance of the
results of this thesis, the next paragraphs summarise the main topics and findings of these
policy studies. This is to show that qualitative and quantitative research explore different
variables, and so the current policy literature on relocation needs to be complemented and
expanded with empirical evidence from a comprehensive theoretical framework.
Policy arguments in favor of relocation are usually that, first, relocation in cases of
high exposure and repetitive losses ‘is the best possible risk mitigation in terms of reducing
exposure to future floods’ (Okada et al. 2014:29). Second, relocation, as land-use planning
and hazard mitigation strategies, creates ‘sustainable and resilient communities (and)
reduces long-term costs’ (Okada et al. 2014:29). However, it has been acknowledged that
relocation can also result in ‘significant problems’ (Menoni and Pesaro 2008:35). These
problems are in relation to the issue of public financing relocation (Menoni and Pesaro 2008)
but also the challenges that relocation creates in terms of ‘reducing livelihood security, social
capital and cultural ties’ (King et al. 2014:84). These negative aspects of relocating a
community requires that the government and community leaders understand that relocation
is not a simple process but ‘the result of complex interconnected political, economic and
social factors’ (Menoni and Pesaro 2008:35).

161
From a land-use perspective, relocation is regarded a successful enterprise if the
community living in a flood-prone zone is relocated to an area featuring lower flood risks.
This is the argument of van den Honert and McAneney (2011) after observing that the
Queensland government in conjunction with local leaders succeeded in relocating the
majority of high-risk Grantham’s residents to a location presenting lower flood risks. Another
benchmark that resulted in positive appraisals in the literature for the relocation of the
residents of Grantham township was that the public money was not allocated to ‘post-event
handouts by government (that) often encourage victims to rebuild in the same way and in
the same location’ (van den Honert and McAneney 2011:1168). Public money in the form of
‘special grants of $35,000 for eligible landholders’ helped affected householders interested
in relocating to alleviate ‘the costs associated with resettlement’ (Okada et al. 2014:27).
According to the policy study of Sipe and Vella (2014), the success of the Grantham
relocation was due to quick action and political leadership. Sipe and Vella explained that the
existence of ‘a small, highly connected team that made decisions rapidly’ (2014:411) was an
important factor to expedite the relocation process. Also, this ad hoc group, with the support
of the media, was able to make quick decisions because it created ‘momentum and focused
the community after initial rescue and recovery was completed’ (Sipe and Vella 2014:411).
In addition, local leaders not only were actively involved in the process but also decided ‘to
take a risk and try something that is often discussed but rarely done: relocate residents living
in flood zones’ (Sipe and Vella 2014:411). The ‘success’ of this relocation process is
indicative of a window of opportunity seized by decision makers in the aftermath of a major
disaster based on a collective feeling of ‘never again’, as Charles (1989) explains.
Relocation, however, is fraught with many challenges as a preventive measure. This
is particularly true if this protective action is analyzed only from a government perspective.
The Grantham township succeeded in framing relocation as ‘good news’ and as a result
could rely on state and federal government support (Sipe and Vella 2014:411). Higher levels
of government became involved in helping a small community because this ‘story helped to
divert attention away from other more serious affected areas’ (Sipe and Vella 2014:411). In
addition, the case study of Grantham is an exception in the literature. Higher levels of
government often do not become involved in relocation issues at the local level since it

162
requires buy-in from community leaders and compliance to existing planning regulations
(Sipe and Vella 2014).58
Moreover, the success of relocation policies depends on the participation of citizens
and community leaders in the early stages of the decision-making processes (Sipe and Vella
2014). If community involvement does not take place early on, householders ‘subject to
buyouts and relocation can be splintered over the perception of risk and harm’ (Shriver and
Kennedy 2005 cited in Sipe and Vella 2014:402). Community willingness to participate in the
relocation discussions, therefore, is the starting point of any attempt to investigate
motivations behind this protective action. However, scarce empirical research on relocation
does not investigate the motivations of individuals at risk to relocate. The existing empirical
pieces of research, such as King et al. (2014), only stratify the characteristics of populations
more likely to relocate based on demographic variables.
King et al. (2014) investigated the demographic characteristics of householders
towards voluntary relocation in Australia. The two communities included in their study were
Gundagai in New South Wales and Clermont in Queensland. The Gundagai floods occurred
in 1851 and the Clermont floods happened in 1916. Through the examination of demographic
data, King et al. identified that: renters were more likely to relocate, newcomers were also
‘more prone to relocate than longer-term residents’ and younger residents (2014:88). These
results from King et al. (2014) were also reached by this thesis. Respondents that did not
expect to live longer in their property were more likely to relocate. That is, renters,
newcomers, and younger residents could all be characterized as householders who do not
expect to stay longer in their properties. As for complementing the demographic correlations
58 The results of the statistical model and qualitative data of this study object statements often made by officials. Government authorities are used to argue that major flood risks are exacerbated by the tendency of populations to build and develop in hazard-prone areas (Natural Disasters in Australia 2004) and disregards that vulnerable groups in general are pushed to live in hazard-prone areas, as stated by Delfin Jr. and Gaillard (2008). However, empirical evidence and statements made by the participants in this study, supported by the literature, indicate that the government cannot simply blame some groups to have developed in areas of risk. The government needs to take its share of responsibility since they are the entity that allowed development, and even re-development, in flood risk areas (van den Honert and McAneney 2011) in the first place. Thus, if the government does not take its share of responsibility to flood risks by reviewing its land-use development plans, it becomes increasingly less convincing the government’s position that it needs to invest in understanding how to shape individuals’ choices (Boon 2014) or provide structural protection against major floods (Moore 2014). These official arguments are only justifiable if one agrees on the assumption put forth by public officials that individuals deliberately choose to settle in flood-prone areas, which is clearly not the case among the most vulnerable groups. A low-income householder from Rocklea said that he bought a property in an area that ‘floods all the time’ ‘not because I decided. It was what I could afford’.

163
of King et al. (2014), one variable that the model of this study identified and was not seen in
the results of King et al. (2014) was that men were more likely to relocate than women.
The model of this thesis present significant differences with the study of King et al.
(2014). The main difference is that King et al. (2014) did not capture the motivations of
residents to relocate whereas this study included risk perception factors in its model. This
project found out, for instance, that residents living in flood-prone areas were motivated to
relocate if they i) were worried about flood risks; ii) did not feel attached to their property and
community; iii) had experienced higher levels of water in their property; and iv) had been
affected by creek and overland flooding. All these findings are related to the perception of
flood risks, flood damage experience and different types of flood events. King et al. (2014)
included only demographic factors in their investigation of what led householders to relocate.
In regard to the variable ‘worry’, which is the main explanatory factor for relocation, the
significance of this correlation illustrates the importance of investigating decision making
based on the distinction between fear-related (risk aversion) and knowledge-related (risk
acceptability) factors (Coppola 2007; Ronan and Johnston 2005). Fear-related factors to
major floods, or the perception that major flood risks are uncontrollable and as a result can
cause pain and death, as Coppola (2007) and Ronan and Johnston (2005) explain, are more
likely to influence decisions than knowledge-related factors, which are related to controllable
risks and thus less feared by individuals at risk. However, considering that most participants
in this study were not willing to relocate59, it is possible to argue that knowledge-related
59 This finding is important in terms of challenging the argument found in the public policy literature in Australia that the relocation of individuals at risk, as a land use mitigation strategy, is the most adequate strategy to reduce risks from high-risk and repetitive flood damage. The literature agrees that individuals at risk should be relocated if they are highly exposed to major flood risks. This policy decision, however, is not realistic. First, the majority of householders do not want to move out. Second, the great part of these individuals are aware of the risks they face and thus are willing to take -- or already took -- protective actions. Third, the public cost of financing relocation for a great number of high-risk properties is prohibitive and receive significant political resistance in agenda-setting from communities not directly benefitting from these measures. Fourth, growing climate uncertainties and judgment failures shatter the notion of complete safety, no matter how hard authorities want to make communities at risk believe that they can control and eliminate every kind of threat. Thus it is also not completely valid the argument stated in the policy literature that post-disaster handouts automatically result in higher exposure to future major disasters. This claim is only true if these handouts disregard the benefits of protective actions at the household level to reduce residual risks. Individuals at risk can effectively reduce these risks, even after being severely affected by a major disaster, if they are emotionally and financially prepared to recover from flood-related damage. Thus post-event handouts that encourage rebuilding at the same location does not necessarily increase exposure to risks but it can actually reduce these risks if they are conditioned to or facilitate the enactment of protective actions by these householders. In addition, policymakers often forget to see disasters as cycles. And within these cycles, realistic recovery strategies are policy opportunities to encourage individuals at risk to take actions that reduce further their risks while also preparing them to respond and recover faster from the effects of the next disaster.

164
factors, rather than fear-related factors, drive the decision of these householders to continue
living in a flood-prone area.
Conclusion
This model provided nuances that reveal to policymakers the motivations that drive residents
living in flood-prone areas to relocate or continue living in flood-risk areas. This empirical
investigation on what drives householders at risk to relocate or not depends on how threat
appraisal variables (such as flood experience, maladaptive responses, objective risks, and
perceptual risks) shape the decision of householders at risk. Policymakers that understand
how threat appraisal, coupled with demographic and household characteristics, influences
decision making under uncertainty are more likely to design effective relocation policies for
populations living in flood-prone areas and before a disaster strikes60.
When it comes to specific findings, men worried about the risks of major floods are
more likely to move out from a flood-prone area than the other segments of the population
of this study. This is an interesting finding as it suggests the role that gender equality and
education have on risk perception. This association is also important in the sense that it
challenges the widespread perception in public policy and cognitive literatures that lower
levels of education put individuals at risk (Shiwaku and Shaw 2008). This association proved
exactly the opposite perhaps because predictive models need to consider how risk aversion
60 Evidence from this study challenges policy statements made at the different levels of government in Australia. The federal government states that the primary responsibility for disaster management in the country lies with the state and local governments (Australian Government 2004). These governments need to manage their floodplains in accordance to national guidelines (QFCI 2012). The coordination between state and local governments should aim to reduce flood risks through investments in mitigation measures. These measures are expected to draw support from different players and particularly from individuals at risk. However, a surprising element in these policy statements is the complete absence of the role that individual risk perception plays in the reduction of flood risks. A possible reason for this absence is that the government does not have elaborated yet a clear strategy to reach out and be informed by individual risk perceptions. In addition, lack of financial support to relocation programs such as the Buy-Back Program (QFCI 2012) and the absence of policies supporting highly exposed and vulnerable householders reveal that the government does not have in place a comprehensive set of policies to correct the mistakes made in its land-use development plans. Moreover, the government does not display a set of strategies to promote a systematic reduction of the exposure levels among the most vulnerable communities. Lack of these strategies is attributed to superficial understandings by government officials about how past decisions and structural conditions create vulnerable groups (McLennan and Handmer 2012). Another reason is that authorities seem more interested in the political opportunities that disasters create to the reinforcement of leadership positions and the chance to justify investments in structural mitigation projects under the prospect that the same disaster would never happen again (Boin and McConnell 2007; Charles 1989). In this context, Hayes and Goonetilleke (2012) and QFCI (2012) express concern about the future of floodplain management in the country. Hayes and Goonetilleke (2012) argue that a time lapse of thirty years between major events would reduce the impetus of institutions to reduce flood risks. As for the Inquiry (QFCI 2012), it warns that public officials could implement mitigation measures in the short-term but forget them in the long-term due to the absence of major disasters.

165
and risk acceptability, as key psychological factors behind decision-making processes,
influence individuals at risk to relocate or not. In addition, this thesis revealed that the location
of a property is certainly important to predict who wants to relocate or not but this variable
only becomes a determinant factor if this is associated with vulnerable indicators such as the
financial capacity of a householder to settle elsewhere. This finding reinforces the
importance of applying comprehensive theoretical frameworks to predict decisions in
uncertain scenarios. Finally, this thesis also showed that housing tenure strengthens the
complexity of decision making. Individuals at risk decide to live longer in a flood-prone
property after considering the long-term risks of this property vis-à-vis protective actions that
reduce residual flood risks in the long-term and a cost benefit analysis of living in this property
and community.
Conclusion of the Last Two Chapters (Chapters 6 and 7)
The overall finding of the last two chapters is that PMT contributes to the understanding of
the motivations of individuals at risk to take protective actions. The contribution of this
theoretical framework happens in the sense that it provides a set of explanatory variables
that help researchers and officials identify the key motivations that lead individuals at risk to
decide to take action to reduce their risks to a major hazard. However, the hypothesis that
coping appraisal factors are generally better predictors than threat appraisal variables for all
the types of protective actions and in every condition and circumstance is not true. This
occurs because i) vulnerability factors play an important role in the decision of householders
to take a protective action or not (for example, the associations between homeownership
and the presence of children under 12 years old with the decision of taking out flood
insurance). Also, as descriptive statistics indicates, ii) the characteristics of these preventive
measures are perceived differently (for instance, flood insurance is perceived as the least
effective but simpler to ‘undertake’ than house raising and home improvements. House
raising, in turn, is perceived as the most effective against major flood risks and home
improvements present the highest level of uncertainty around its coping factors) (see page
117). Also, iii) the values of threat appraisal and vulnerability factors (demographics and
household characteristics) vary largely among the respondents of this study (see pages 117
and 118). Thus, when the results of this study are compared against other models testing
the same theory, this thesis found that associations across models differ, particularly in
regard to coping and vulnerability factors.

166
Therefore, the hypothesis that coping appraisal is a stronger predictor than threat
appraisal across models and studies conducted in different times and locations must be
carefully reviewed. However, it is correct to assert, as the literature highlights, that PMT
provides to researchers the opportunity to evaluate key motivation factors shaping decision
making under uncertainty. These motivation factors reveal, for instance, to what extent cost
benefit analysis based on risk aversion and risk acceptability explain the undertaking of
protective actions vis-à-vis basic vulnerability conditions, as the model of flood insurance
illustrates. The expectation is that this knowledge on the complex relationship between
individual risk perception and decision making under uncertainty can be used to review
current mitigation policies and inform the design of targeted strategies aiming to reduce the
risks to major disasters at the community level, and particularly among the most vulnerable
and exposed groups in Australia. As for the results of the model of relocation, it also
reinforces the importance of this theoretical framework to identify key reasons that lead
householders to relocate or continue living in their property. The associations of this model
showed that the investigation of householders who wish to relocate or not is influenced not
only by a number of threat appraisal factors but also vulnerability conditions.

167
Final Remarks
Introduction
These final remarks review the main findings of this thesis not by separating sections into
protective actions but by organizing them according to research questions and explanatory
variables from regression analysis. The purpose of this organisation is to review research
questions and answer them more objectively while also giving readers an overview of how
each set of explanatory variables from the model used in this study explains protective
actions in general. As a reminder, the research questions of this thesis are: i) What is the
role that individual risk perception play in informing flood mitigation strategies in Australia?;
ii) What are the challenges to measure individual risk perception and decision making under
uncertainty?; iii) How does a theoretical framework based on PMT help explain decision
making about preparing for flood risk?, and; iv) How do threat appraisal factors, coping
appraisal factors, and vulnerability influence the decision of householders living in flood-
prone areas to take protective actions?
In order to answer these questions, this thesis investigated the role that individual
risk perception play in flood mitigation strategies in Australia; evaluated the challenges to
measure individual risk perception and decision making under uncertainty; identified and
explained the theoretical framework that guided the measurement of key indicators, and;
assessed the significance of threat appraisal factors, coping appraisal factors and
vulnerability as explanatory variables influencing the decision of householders living in a
flood-prone area to take four types of protective actions (flood insurance, house raising,
home improvements, and relocation). In relation to the last research question, the hypothesis
was that the perceived ability (coping appraisal) of individuals to reduce their personal risks
to a major disaster is a stronger explainer than their perception of hazard risks (threat
appraisal) vis-à-vis the decision to take protective actions. This hypothesis, however, was
challenged and supplemented, particularly by findings from studies that emphasized the role
that vulnerable factors play in decision making.
Thus an important finding of this thesis is that in the Australian context the individual
capacity to take protective actions is not necessarily the main predictor of protective actions.
That is, it is not always the case that coping factors are better predictors than threat appraisal
variables for the undertaking of protective actions. The empirical reason for this finding is
that i) vulnerability factors can yield associations that are stronger than coping factors. In
168
addition, descriptive statistics and qualitative data indicate that ii) individuals at risk perceive
the cost, effectiveness and feasibility of each protective action in quite different ways; ii) the
nature of these protective actions can be significantly different; iii) the conditions of each
disaster in terms of the characteristics of the hazard and the circumstances of each study
can be quite distinct; and, iv) exposure levels influence risk perception and decision making.
As far as academic novelty is concerned, this thesis is i) the first research applying PMT in
the context of flood mitigation in Australia; ii) its dataset features significant variability when
it comes to vulnerability and exposure levels; iii) it assesses the role of heuristics and biases
in decision making under uncertainty; and iv) is supported by qualitative data to unpack non-
intuitive associations and understand the role that the nature of threats and protective actions
play in the decisions of householders to take protective actions.
Individual Risk Perception in Flood Mitigation Strategies in Australia
Chapter two answered the question: What is the role that individual risk perception play in
informing flood mitigation strategies in Australia? This chapter first showed that risk
mitigation is a strategy that policymakers should consider in their strategies to reduce the
costs of disasters in the long term. Mitigating potential threats also makes communities at
risk more resilient since these communities will then find themselves in a better position to
respond and recover from disasters after they have invested in risk reduction activities.
Nevertheless, the priority of mitigation strategies should be on reducing the risks of the most
vulnerable groups within these communities as these groups are the ones that face the main
difficulties to take actions that reduce their risks to the impact of major hazards. Because of
these difficulties to reduce their residual risks to major disasters, vulnerable individuals are
more likely to struggle to respond and recover from the effects of high-impact low-probability
disasters. Thus vulnerability variables should be considered in empirical studies assessing
statistical relationships between risk perception and decision making.
The thesis literature review then investigated how individual risk perception61 informs
flood mitigation strategies in Australia. It revealed that the inclusion of these individual risk
perceptions in flood mitigation strategies are still restricted to political rhetoric. This means
that inputs from communities at risk have not yet been considered in flood mitigation
61 The justification of the reasons why policymakers should consider individual risk perceptions in their effort to build resilient communities and a strategy that policymakers could pursue in order to improve their practices of flood risk management by promoting and facilitating protective actions at the household level is stated on page 29.
169
strategies for the design of public policies that contribute to reducing residual risks. This is
because the debate about who shares the responsibility to build resilient communities
revolves around which level of government is responsible to build resilient communities. After
the review of this political debate, it became clear that it is the local government that should
be leading the coordinating efforts to create resilient communities (COAG 2011; QFCI
2012:54; van den Honert and McAneney 2011). Local leadership coordinating the efforts to
mitigate residual risks is expected because the literature indicates that local initiatives have
been financially supported by the federal government and count on technical assistance
provided by the state government (QFCI 2012). However, this review showed that the
Brisbane City Council has not yet seriously considered how individual risk perceptions can
inform the design of public policies that shape flood mitigation strategies aiming to reduce
residual risks to major flood events and, as a result, build more resilient communities.
Measuring Risk Perception and Decision Making
Chapter three answered the following question: What are the challenges to measure
individual risk perception and decision making under uncertainty? This chapter answered
this question by reviewing the key concepts that are used in this thesis. It first showed that
the perception-adjustment paradigm dominated the studies of risk perception and decision
until the 1990s. However, the premise that human adjustments to hazard risks are mainly
dependent on how proximity to hazards influences risk perception did not result in a
significant reduction in flood damage for householders living in risky areas. Thus a new
theory emerged. Sustainable Hazard Mitigation (Mileti 1999:215) focused on the vulnerability
factors of communities at risk. This new theory argued that the reduction of damage from
hazards at the householder level should assess how vulnerability factors are determined by
psychological, social, cultural, institutional and political processes (Haque and Burton 2005;
Olofsson and Öhman 2015; Tierney 2006; Wisner et al. 2004). It was only after
understanding the dynamics of these relationships that researchers, and officials, would
understand what lead individuals at risk to make adjustments to hazard risks and thus reduce
their residual risk to major disasters62. Based on this new avenue of research, this study also
62 It is worth noticing that investigating the different reasons that create vulnerable communities is beyond the scope of this thesis. This thesis is particularly interested in investigating how vulnerability factors influence decision making. This is the focus of this thesis in regard to the concept of vulnerability in the context of flood mitigation strategies in Australia.
170
focused on the measurement of vulnerable indicators as another set of explanatory variables
explaining decision making under uncertainty.
This review of risk perception also showed that the measurement of how individuals
at risk perceive hazard risks can be divided into cognitive or subjective variables. Cognitive
variables are the ones directly related to mental processes such as attention, memory and
reasoning (Danili and Reid 2006). These cognitive factors were included in this study in the
form of survey questions that explored the levels of risk aversion, risk acceptability, risk
denial, dread risk, risk sensitivity and risk tolerance. Also, it is necessary to highlight that
these cognitive variables are mediated by the level of how worried an individual is in relation
to a certain threat, which then requires specific measurement scales to validate regression
analysis. In relation to subjective variables measuring risk perception, an important variable
in this regard is the level of trust that individuals have in a government’s structural mitigation
measures. Trust, however, should be interpreted along with demographic variables such as
age, education, and income. Questions on perceived trust to structural flood mitigation in
Queensland were included in the survey of this thesis but its data excluded from analysis63.
When it comes to measuring risk perception, chapter three showed that this task is
rather difficult because of the complexity of models built to identify patterns of behaviour and
the relationships between variables. The building of these models is also challenging
because they are context-specific. This means that every model needs to be unique in order
to represent the values of a particular population and locality. In addition, the literature
pointed out that risk perceptions change over time which means that what motivates
behaviour change vary across a lifespan64 (Baan and Klijn 2004; Terpstra et al. 2009).
As for decision making, this thesis reviewed two literatures: one that supports
optimization models and another that focuses on heuristics. The literature about optimization
models argues that individuals at risk struggle to consider long-term risks in their decisions
and thus they end up making decisions that rely on rules of thumb, or heuristics, which can
increase their exposure to major hazards (see, for example, Kahneman and Tversky 1973;
Kates 1962; McEntire 2005; Meyer 2006; Sinsheimer 1971; Slovic and Fischhoff 1977). This
literature then proposes that individuals be trained to apply the concept of regression
63 The reason for excluding this set of independent variables is found in the footnote of page 77. 64 This statement is important as it shows that the results of this thesis assess correlations at a point in time; that is, data were collected only once. It would be important then that other studies follow suit and collect similar data at other times so that researchers can investigate to what extent risk perception changes over time and how it influences protective actions at the locations targeted in this study.

171
analysis to monitor changes in their decision-making processes. Scholars supporting this
proposition argue that this statistical training reduces the number of heuristics leading to a
decision that may increase exposure to hazard risks. However, supporters of the theory of
ecological rationality argue that the use of heuristics does not necessarily mean that pieces
of information guiding decisions under uncertain scenarios are less efficient than the ones
produced by regression analysis (see, for example, Gaissmaier and Schooler 2008;
Hammond et al. 1987; Johnson et al. 2013; Kao and Couzin 2014; Marewski and Gigerenzer
2012; Plessner and Czenna 2008). In addition, these scholars claim that the rules of thumb
that individuals at risk use to make decisions under uncertainty can be framed as rational
and effective as any other type of decision-making process. An important finding in this
regard is the result of the correlation ‘cost benefit analysis’ from the model of flood insurance.
This correlation indicated that when costs are perceived to be higher than perceived benefits
among householders that decided to not take a protective action, this perception ended up
influencing the decision of householders to take out flood insurance.
The Protection Motivation Theory
Chapter four is an important part of this thesis as it explained the main novelty and
contribution of this study for the literature. This chapter answered the question: How does a
theoretical framework based on PMT help explain decision making about preparing for flood
risk? After being tested in other countries (Germany, France and the Netherlands), this
theoretical framework was applied for the first time in Australia. The objective was to test this
theory and compare data emerging from Australian householders with findings from
householders living in other settings and verify to what extent these results are consistently
similar or different. Moreover, the application of this framework and the comparative analysis
of correlations aimed to provide tested empirical data to Australian policymakers. This data
highlights the importance of investigating the complexity of individual decision making under
uncertainty, thus helping authorities design policies that can mitigate residual risk to major
flood events. In addition to testing out the precepts of PMT in a new location, this studied
paid close attention to the variability of data in terms of vulnerability and exposure levels of
the population at risk and the role that heuristics and biases play in their decisions to take or
not a protective action. In this scenario, qualitative data helped understand the role that the
nature of threats and each of the protective actions plays on the interactions between risk
perception and decision making.
172
Chapter four, then, answered the question of how this theoretical framework can
explain decision making in the Australian context65. The academic justification for the use of
this theory happened through illustrating the extensive use of it in the field of public health
as a means to investigate why individuals at risk engage in non-adaptive responses in face
of potential threats. Those chapters also explained that the presence of ‘coping factors’ as
sets of explanatory variables was the main reason that led crisis management researchers
to consider this theory as a framework that would help explain, in addition to risk perception,
how the capacity of individuals at risk to reduce their risk to a threat fare against risk
perception (threat appraisal) and other sets of independent variables. Once this review on
the importance of this theoretical framework was completed, the thesis then presented the
ways in which previous studies tested this theory, introduced their hypotheses and presented
their main findings (see, for example, Bubeck et al. 2013; Grothmann and Reusswig 2006;
Poussin et al. 2014). This chapter also justified the appropriateness of this theory for this
study by explaining each set of independent variables in light of what this theory and previous
studies proposed.
Following this chapter justifying the selection of this theoretical framework, this thesis
provided a method chapter, chapter five, detailing how this study was conceived. The
detailed description of the method used in this thesis contributed to answering the research
question by explaining how this study was structured according to the precepts of this theory
and how it can then be replicated in other settings. Thus, the detailed explanation on the
variables, statistical methods, model selection, the description of the development of the
questionnaire, and the selection of the geographical area and population, all served to
reinforce the justification for this theoretical framework as suitable for a study that was
expected to critically analyse a specific problem identified in Australia. Finally, this method
chapter provided some initial findings based on descriptive statistics. The main findings from
descriptive statistics showed that householders were generally worried about major flood
risks; however, flood experience alone did not seem to lead to protective actions. Also,
respondents admitted that they were exposed to flood risks and claimed that these major
events occurred through cycles of longer periods. This meant that the majority of
respondents did not consider the uncertain nature of these high-impact low-probability
events. Respondents also resorted to a cost-benefit analysis to convince themselves that
65 The explanatory power of the models of home improvements, house raising and flood insurance can be found, respectively, on pages 121, 132 and 141. The Nagelkerke R-square of the models highlighted in this study ranges from .159 to .457.

173
undertaking protective actions before a major disaster strikes might not be necessary. If the
benefits of not taking protective actions were perceived to be higher than their perceived
costs, householders might decide to not take these actions before a disaster occurs.
Moreover, the majority of participants of the study have claimed not to be psychologically
and/or financially affected by past flood events. As for protective actions, house raising was
seen as the most effective measure to reduce or eliminate major flood risks whereas flood
insurance was the most popular despite being perceived as not affordable or effective to
reduce these risks. As for home improvements, they were poorly regarded in terms of their
efficiency, feasibility and cost to reduce major flood risks. The introduction of these findings
was important to complement the findings emerging from regression analysis that followed
in Chapters 6 and 7.
Explanatory Variables from Regression Analysis
The final section of these ‘final remarks’ answers the last research question of this thesis:
How do threat appraisal factors, coping appraisal factors, and vulnerability influence the
decision of householders living in flood-prone areas to take protective actions? In order to
answer this question, this section presents the main findings from the regression analysis of
chapter six and seven in three sections: threat appraisal, coping appraisal and vulnerable
factors (demographic and household characteristics). This organization aims to help the
reader have a better sense of how each set of explanatory variable contributes to explain
and predict the decision of householders to take protective actions. Descriptive statistics and
qualitative data are also added in these sections when they provide further insights into how
these statistical relationships explain decision making.
Threat Appraisal
The findings from threat appraisal variables are important as they reveal the role that overall
risk perception has on decision making. This group of variables were present in every model,
which indicates the important role that risk perception has on decision making. However,
correlations emerging from the models do not indicate that these relationships are
significantly stronger than the other set of explanatory variables. This finding suggests that
other factors also play an important, or more important, role in determining the decision to
take protective actions. This general finding indicates that the perception of hazard risks,
losses related to major floods, heuristics underlying decisions to not take protective actions
and ongoing experiences with flood events all help explain the decision of householders to
174
take a protective action or not. For instance, the perception that raising a property is not
necessary was partially explained by respondents’ opinion that they had not experienced
major effects during the last disaster, despite not taking any protective actions beforehand.
In terms of flood insurance, respondents agreed to take this protective action based on the
perception that they would incur in higher losses if they did not have flood insurance to
protect them against flood damage. As for the undertaking of home improvements,
respondents that claimed not to be psychologically affected by the last disaster were, as
expected, less likely to retrofit their property against future major floods. And in regard to
relocation, individuals less worried about the impacts of another disaster on their property
were found to be less willing to move out to a place featuring lower flood risks. These
associations, therefore, illustrate the importance of threat appraisal for the individual
assessment over whether the undertaking of protective actions is worthwhile.
Another important finding that emerged after comparative analysis is that cost benefit
analysis, in the form of contrasting risk aversion and risk acceptability, can play an important
role in risk perception studies at the household level. The literature warns that individuals
accept a certain level of risk and this acceptance must be computed in order for researchers
and policymakers to understand to what extent householders living in flood-prone areas are
willing to take a protective action. The associations of the models of flood insurance and
relocation, for instance, show that householders living in Southeast Queensland are
influenced by the interaction of their risk aversion and risk acceptance to a major hazard.66
This finding on risk aversion and risk acceptance is important in the sense that it informs
insurers and policymakers alike that their strategies to increase the number of policyholders,
and to motivate them to take further protective actions, face challenges and opportunities.
Insurers and policymakers need to identify policy opportunities on how to promote further
mitigation strategies among a population that is generally not willing to move out of their
current property, since they enjoy living in their community and seems to accept the risks of
living in an area likely to be affected by a high-impact but low-probability hazard, and have
already taken protective actions, such as flood insurance.
66 The associations of risk aversion and risk acceptability were deducted from the following relationships: ‘cost benefit analysis’ in the model of insurance and ‘worry’ in the model of relocation. Respondents were more likely to take out flood insurance if they perceived that the benefits of not taking action were lower than the costs they would incurred by not being insured. This relationship suggests that risk acceptability played a role in the judgement of householders about the trade-offs between being insured or not. As for the variable risk aversion, this association was seen in the model of relocation since respondents who argued to be less worried about major flood risks were found to be less likely to relocate. This association not only measured the level of ‘worry’ among respondents but also indicated how a certain level of risk acceptability affects risk aversion itself.

175
This thesis also provided further insights on the influence that the location of a
property has on the adoption of protective actions (Burton 1993; Kates 1971; White 1945).
For instance, householders living close to flood sources, such as creeks, are more willing to
relocate than respondents that actually live along the Brisbane River, the main source of
threat. This is an important finding emerging from this thesis as it indicates that major floods,
or flood events serious enough to motivate individuals at risk to relocate, are not necessarily
caused by the source of major flood disasters such as riverine flooding. Location is mediated
by vulnerable factors like income since low-income householders experiencing repetitive
losses to different magnitudes of flood events, which is the case of respondents living in low-
lying areas farther from the Brisbane River, are actually the group most willing to settle
elsewhere. This finding has important policy implications in terms of land use planning,
development projects and relocation programs (as stated in the footnotes of page 156).
Thus it is possible to argue that threat appraisal factors are important variables in
shaping how individuals at risk make decisions to take a protective action or not. The take
out of flood insurance depends on loss estimates to major flood events and an assessment
of the trade-offs between being insured or not. In regard to house raising, the heuristics that
a past experience could be projected into the future influences the decision to take this
protective action. In relation to home improvements, the perception that major floods occur
over shorter or longer periods of time and whether a respondent has been psychologically
affected by a major event shape the decision to retrofit a property. Finally, willingness to
relocate depends on variables that reveal the distance of a property to major flood sources,
past inundation levels in the property, whether the respondent feel attached or not to the
property, land and/or community and the level of worry to the next major disaster. All these
factors provide insights to officials which can help them build public strategies that can, in
turn, build resilient communities for those living in at-risk locations.
Coping Appraisal
Coping appraisal variables were expected to yield the strongest associations with protective
actions. As expected, the protective actions of house raising and home improvements were
significantly associated with the perceived cost of these measures. Respondents that
perceived that the cost of house raising and home improvements being too high were less
likely to engage in these protective actions. However, these protective actions feature
serious constraints about addressing major flood risks. First, house raising is the least
176
popular protective action among householders, which means that this measure is restricted
or considered only by a restricted group of residents and presents significant challenges for
individuals considering undertaking it. Second, home improvements are also adopted by a
reduced number of householders and these preventive measures are not seen as effective
in protecting properties against flood damage, particularly from major threats. Third, the
associations of the response cost with the undertaking of house raising and home
improvements are not very strong motives in comparison with other significant correlations
to emphatically conclude that the majority of respondents are particularly influenced by the
perceived cost of these measures than other factors in their decision to take these protective
actions. This is an important finding of this thesis as it opposes the claims made in the
literature on the relevance of coping factors to predict decision making under uncertainty in
different conditions and circumstances (see, for example, Bubeck et al. 2013; Poussin et al.
2014).
In addition, flood insurance67, which is the most common protective action in this
thesis, did not result in any significant relationship with coping appraisal variables according
to regression analysis, despite qualitative data indicating the opposite and descriptive
statistics showing that the percentages of some coping appraisal factors can be highly
polarized (see page 117). This finding emerging from the regression model, that flood
insurance was not associated with coping appraisal variables, and more particularly
response cost, is arguably one of the most important takeaways of this thesis as this result
contradicts findings from a previous study (see Bubeck et al. 2013), which argued that coping
factors are better determinants than threat appraisal variables to the take out of flood
insurance policies. This finding has important implications for insurers and policymakers
alike.68
Demographics and Household Characteristics
These variables were added in the model because they collect data on the vulnerability levels
of the population at risk. These variables were expected to yield significant associations with
protective actions but not as strong as it was finally generated by the models of this thesis.
For instance, the model of flood insurance indicated that we cannot understand what
67 Statistical information on how variation on this dependent variable affected the results of this model is found on page 144. 68 Some policy implications of these results were briefly stated in the footnotes found in pages 148, 149 and 150.
177
motivates householders to take out flood insurance if we do not know whether they own the
property they live in. Also, respondents are more willing to purchase a flood insurance policy
if they feel vulnerable to the impacts of a major flood because of the presence of children in
the household. These significant associations on vulnerable factors with flood insurance
confirm the findings of research investigating the effect of vulnerability on protective actions
(see, for example, Olofsson and Öhman 2015; Tierney 2006). These studies stress that risk
reduction activities should concentrate on reducing the basic vulnerable aspects of the
groups mostly at risk. This thesis provides strong evidence in this regard.
Also, demographic and household characteristic variables turned out to be important
for assessing the complexity of decision making in every model. For instance, the decision
to raise a property depends on the age of the householder. The undertaking of home
improvements is influenced by household income. And householders that intend to relocate
are associated with gender and housing tenure. All these categories are important in the
sense that they reveal that different groups perceive and react differently to hazard risks.
Understanding these differences is important to assess the challenges that these groups
face to take protective actions against a low-probability high-impact disaster, as vulnerability
studies have been advocating (Olofsson and Öhman 2015; Tierney 2006). Therefore, these
vulnerable factors provide further information to policymakers over how public strategies can
be framed and implemented based on the different factors that motivate individuals at risk to
take specific protective actions.
Conclusion
This thesis concludes that the decision-making process to take protective actions is fairly
complex. The decision to take a protective action is, as results emerging from PMT suggest,
influenced by how householders perceive hazard risks, their ability to take protective actions,
and their level of vulnerability to a threat. In addition, as descriptive statistics and qualitative
data indicate, the characteristics of the hazard, the nature of protective actions, and the
exposure level of a householder to a disaster could also play a role in this decision making
process. However, in opposition to what previous research testing the same theoretical
framework has suggested, this thesis argues that it is not possible to claim that the perceived
cost, efficiency and feasibility of adopting protective actions is a stronger predictor of
protective action in any condition and circumstance of a community at risk. For instance, the
perceived cost of a preventive measure as a constraint to action is true in some cases (such

178
as house raising and home improvements) but not applicable in other situations (such as
flood insurance). Thus it is the differences in these conditions and circumstances that end
up determining which factors are the most determinant to a decision-making process leading
to the undertaking of a specific protective action. These conditions are perceived hazard
risks, perceived capacity to take action and vulnerability factors, as regression analysis
points out. And the circumstances of this decision-making process are the exposure levels
of communities at risk and the nature of a threat and of protective actions, as suggested by
qualitative data.
If Australian authorities disregard the complexity of these decision-making
processes they are likely to make wrong assessments about the interest and capacity of
individuals at risk to collaborate with public efforts to reduce residual risks deriving from major
flood risks. However, if officials and practitioners acknowledge the complexity of motivating
individuals at risk to take protective actions and the constraints these individuals face to take
these actions, then these officials will find themselves in a better position to set realistic
expectations on the level of commitment that these individuals are willing to provide to the
public effort of building more resilient communities living in flood-prone areas across the
country. The acknowledgment of the complexity of individual decision-making processes
leading to changes on current mitigation measures at the government level, however, should
be expected to occur only in the long-term69. This is because the current top-down structure
largely prevails in Australia when it comes to decisions on mitigation measures; in addition,
information from individual risk perception shaping mitigation measures has not yet been
considered in this structure.
This thesis also understands that the different government levels, particularly local
government (in the form of Brisbane City Council in this study) need to increasingly consider
these individual inputs into its strategic policy decisions. This is important for officials
because the risk of not including individual risk perceptions, coping factors and vulnerability
variables in policy making is the development of mitigation strategies that are not likely to
69 The context of this political and public policy debate was delineated in chapters two and three of this thesis. These chapters reviewed the role that individual risk perception has on government decision-making processes. The main takeaways from these chapters were that: i) mitigation policies discussed at multi-level government are still dominated by a top-down and structural approach to flood risk reduction and not yet informed by individual risk perceptions and that ii) the construction of resilient communities based on inputs from individual risk perception and protective actions at the household level are incipient across government levels in Australia, particularly at the local level.
179
produce optimal outcomes. This is likely to occur because these strategies would ignore that
hazard risks are perceived differently within and among communities and the success of
these strategies ultimately depends on the buy-in of these communities at risk, particularly
the most vulnerable and exposed groups (see, for example; Boon 2014; Etkin and Stefanovic
2005; McLennan and Handmer 2012; Nilsson 2010; Queensland Reconstruction Authority
2014; Slinger et al. 2007; Stanghellini 2008). Moreover, to secure community support,
officials need to revisit their past decisions, readjust their hopes about citizen collaboration
and make decisions based on data depicting variances on factors shaping decision making
under uncertainty70. This thesis makes a contribution in this regard.
This thesis also suggests71 some research avenues for those interested in expanding
knowledge in this area. The replication of this study at other points in time is important
because risk perceptions change over time, which affect the decisions that householders
make to protect themselves (see Baan and Klijn 2004 and Terpstra et al. 2009). Thus there
are few recommendations, based on the findings of this study, that are important for future
projects. First, the protective action of relocation should be expanded with the inclusion of
householders who had already relocated. Data collected from these householders would
broaden the understanding of the perceived costs, effectiveness, and feasibility of this
protective action. Second, researchers could approach insurance firms to gather data over
the number of residents that have flood insurance policies in a certain location. This data
would allow future studies to assess the real penetration of flood insurance in a flood-prone
area. Moreover, insurers should be interviewed and questioned over their opinion about the
provision of discounts to policyholders that implement mitigation measures in their
properties. Third, public officials could also be approached at the different government levels
to comment on their strategies to design mitigation strategies based on a bottom-up decision
making process focused on individual risk perception and the challenges that vulnerable
groups face to take protective actions72.
70 Policy recommendations to improve the resilience of communities at risk can be found in the footnote of pages 130, 131, 133 and 136. 71 These suggestions also address the limitations of this thesis: i) no data on ‘coping factors’ in the ‘relocation’ model; ii) lack of official information over flood insurance penetration; and iii) no qualitative data on the perceived challenges that policymakers face to foster local decision-making processes. 72 This last recommendation is particularly important because it adds a key important qualitative element to this investigation which is beyond the scope of this thesis. The objective of this thesis was to assess the role of individual risk perception in a floodplain context in Australia. The goal was not to conduct an extensive review of disaster policies or critique the existing mitigation measures in place. Some policy review and critique, however, can be found in the chapters 2 and 3 of this thesis. This literature review on public policy was only

180
In conclusion, this thesis argues that policymakers need to investigate conditions and
circumstances affecting decision making. In the context of flood mitigation, these conditions
are perceived hazard risks, perceived capacity to take action and vulnerability factors, and
the circumstances are the exposure levels of communities at risk and the nature of a threat
and of protective actions. This finding is important because it suggests, according to
regression models, that in the Australian context the individual capacity to take protective
actions is not necessarily the main predictor of protective actions. Also, this research
reinforces the importance of investigating to what extent vulnerability73 factors can influence
decision making among householders living in flood-prone areas.
conducted because it was necessary that this thesis first investigated the role that individual risk perception plays at different government levels in Australia. It was only after finding out that individual participation in policymaking had been acknowledged as an important factor in building resilient communities but had not yet been seriously considered in mitigation strategies, that this study decided to adopt a theoretical framework that would provide a framework to guide individual data collection. The expectation was that the analysis of this data would inform officials about the factors driving decision making under uncertainty at the household level. This clarification over the scope of this project is necessary to focus the attention of the reader to the main objective of this study, which is investigating how individuals at risk perceive flood risks and how this perception, among other variables, affects their decision to take protective actions.
73 This statement is supported by empirical evidence depicting that vulnerability factors are significant in every model of this thesis: ‘age’ and ‘homeownership’ for flood insurance; ‘age’ for house raising; ‘household income’ for home improvements, and; ‘time expected to live in the property’ for relocation. Thus policies designed based on these vulnerability factors are more likely to effectively contribute to flood mitigation efforts carried out by government officials.

181
Bibliography
ABC (2014) Flood buster: Some of the worst affected suburbs in the Brisbane floods will soon have better protection. ABC News QLD. <http://search.informit.com.au.ezproxy.library.uq.edu.au/documentSummary;dn=TSM201401150193;res=TVNEWS>
Alexander, D. E. (2002) Principles of emergency planning and management. Oxford University Press on Demand.
Alldred, P.; Gillies, V. (2002) Eliciting research accounts: Re/producing modern subjects. Ethics in qualitative research, 146-165.
Allison, P. (2012) When Can You Safely Ignore Multicollinearity? Statistical Horizons. Accessed on June 20, 2016. http://statisticalhorizons.com/multicollinearity
Anderson-Berry, L. J. (2003) Community vulnerability to tropical cyclones: Cairns, 1996-2000. Natural Hazards, 30, 209-232.
Anderson-Berry, L.; King, D. (2005) Mitigation of the Impact for Tropical Cyclones in Northern Australia through Community Capacity, Mitigation and Adaptation for Global Change, 10:367-392. In Mitigation of Natural Hazards and Disasters: International Perspectives, by C. Haque. Springer: The Netherlands, 2005.
Angignard, M.; Garcia, C.; Peters-Guarin, G.; Greiving, S. (2014) The Relevance of Legal Aspects, Risk Cultures and Insurance Possibilities for Risk Management. In Mountain Risks: From Prediction to Management and Governance (pp. 327-340). Springer Netherlands.
Arklay, T. (2012) Queensland’s state disaster management group: An all agency response to an unprecedent natural disaster. Australian Journal of Emergency Management, 27(3):9-19.
Atkinson, P.; Silverman, D. (1997). Kundera's Immortality: The interview society and the invention of the self. Qualitative inquiry, 3(3), 304-325.
Australian Government (2004) Natural disasters in Australia—reforming mitigation, relief and recovery arrangements. Department of Transport and Regional Services on behalf of the Council of Australian Governments (COAG), Canberra, ACT, Australia
Australian Government (2009) Australian emergency management arrangements. Attorney General’s Department, Australian Government, Canberra, ACT, Australia
Baan, P. J.; Klijn, F. (2004). Flood risk perception and implications for flood risk management in the Netherlands. International Journal of River Basin Management, 2(2), 113-122.
Bajracharya, B.; Hastings, P.; Childs, I.; McNamee, P. (2012) Public-private partnership in disaster management: a case study of the Gold Coast. Australian Journal of Emergency Management, The, 27(3), 27.
Bandura, A. (1992) Self-efficacy mechanism in psychobiologic functioning. Self-efficacy: Thought control of action, 2.
Beatson, R.; McLennan, J. (2011) What Applied Social Psychology Theories Might Contribute to Community Bushfire Safety Research After Victoria’s “Black Saturday”, Australian Psychologist, 46(3):171-182.
Beringer, J. (2000) Community fire safety at the urban/rural interface: the bushfire risk. Fire Safety Journal, 35(1), 1-23.
Berry, L. J. (2002) Community Vulnerability to Land-Falling Tropical Cyclones and Storm Surges. Unpublished PhD thesis, James Cook University, Cairns.
Bird, D. K. (2009) The use of questionnaires for acquiring information on public perception of natural hazards and risk mitigation – a review of current knowledge and practice. Natural Hazards and Earth System Sciences, 9:1307-1325.
Birkett, D.; Mala-Jetmarova, H. (2014) Chapter 14: Plan, Prepare and Safeguard: Water Critical Infrastructure Protection in Australia. In Clark, R.: Hakim, S. Securing Water and Wastewater Systems, Protecting Critical Infrastructure 2, Swizerland: Springer.

182
Bland, J. M.; Altman, D. G. (2000) The odds ratio. Bmj, 320(7247):1468. Blazey, P.; Govind, P. (2007) Financial Adaptation Challenges for the Insurance Industry
Due to Climate Change. Macquarie Journal of Business Law, 4:15-48. Bočkarjova, M.; van der Veen, A.; Geurts, P. A. T. M. (2009) A PMT-TTM model of protective
motivation for flood danger in the Netherlands. ITC Working Papers Series Paper 3-November.
Bohensky, E.; Leitch, A. (2014) Framing the flood: a media analysis of themes of resilience in the 2011 Brisbane flood. Regional Environmental Change, 14(2):475-488.
Boin, A.; McConnell, A. (2007) Preparing for Critical Infrastructure Breakdowns: The Limits of Crisis Management and the Need for Resilience. Journal of Contingencies and Crisis Management, 15(1):50-59.
Boon, H. J. (2014) Disaster resilience in a flood-impacted rural Australian town. Natural Hazards, 71(1):683-701
Bosher, L. (2008) Hazards and the Built Environment: Attaining Built-in Resilience”. New York: Taylor & Francis.
Botzen, W.; van den Bergh, J. (2008) Insurance against climate change and flooding in the Netherlands: Present, future and comparison with other countries. Risk Analysis, 28(2), 413-426.
Botzen, W.; van den Bergh, J. (2009) Managing natural disaster risks in a changing climate, Environmental Hazards, 8(3):209-225
Box, P., Bird, D., Haynes, K., King, D. (2016) Shared responsibility and social vulnerability in the 2011 Brisbane flood. Natural Hazards, 81(3), 1549-1568.
Box, P.; Thomalla, F.; Honert, R. (2013) Flood Risk in Australia: Whose Responsibility Is It, Anyway?, Water, 5:1580-1597.
Brinkmann, S. (2014) Interview (pp. 1008-1010). Springer New York. Brisbane City Council (2014) Brisbane’s FloodSmart Future. Available at:
http://www.brisbane.qld.gov.au/community/community-safety/disasters-emergencies/types-disasters/flooding/flood-policy-plans-projects/brisbanes-floodsmart-future-strategy. Accessed on December 16, 2014.
Bubeck, P.; Botzen, W. J. W.; Kreibich, H.; Aerts, J. C. J. H. (2013) Detailed insights into the influence of flood-coping appraisals on mitigation behaviour. Global Environmental Change, 23(5), 1327-1338.
Bubeck, P.; Wouter Botzen, W. J.; Laudan, J.; Aerts, J. C.; Thieken, A. H. (2017) Insights
into Flood‐Coping Appraisals of Protection Motivation Theory: Empirical Evidence from Germany and France. Risk Analysis.
Bureau of Meteorology (BOM) (2011) Known floods in the Brisbane & Bremer River Basin, including the cities of Brisbane and Ipswich. Bureau of Meteorology: Melbourne, Australia, 2011. http://www.bom.gov.au/qld/flood/fld_history/brisbane_history.shtml. Accessed on November 10, 2014.
Bureau of Meteorology and CSIRO (2012) State of the climate 2012. Bureau of Meteorology, Melbourne
Bureau of Transport Economics (2001) Economic Costs of Natural Disasters in Australia, Report No. 103, Canberra, Bureau of Transport Economics.
Burns, W. J.; Slovic, P.; Kasperson, R. E.; Kasperson, J. X.; Renn, O.; Emani, S. (1993) Incorporating structural models into research on the social amplification of risk: Implications for theory construction and decision making. Risk Analysis, 13(6), 611-623.
Burton, I. (1993) The environment as hazard. Guilford Press. Bushnell, S.; Cottrell, A. (2007) Living with bushfire: What do people expect? Communities
living with hazards. Centre for Disaster Studies, James Cook University. Calligeros, M. (2010) Memories come flooding back. The Brisbane Times, October 12 2010,
Accessed on August 1 2016:

183
http://www.brisbanetimes.com.au/environment/weather/memories-come-flooding-back-20101011-16gf0
Calligeros, M. (2011) Wivenhoe Dam release caused Brisbane flood: report. The Sydney Morning Herald, March 11 2011. Accessed January 23, 2015: http://www.smh.com.au/environment/weather/wivenhoe-dam-release-caused-brisbane-flood-report-20110311-1bqk7.html
Calvello, M.; Papa, M. N.; Pratschke, J.; Crescenzo, M. N. (2015) Landslide risk perception: a case study in Southern Italy. Landslides, 1-12.
Campanelli, P., Nicolaas, G., Jäckle, A., Lynn, P., Hope, S., Blake, M.; Gray, M. (2011) A classification of question characteristics relevant to measurement (error) and consequently important for mixed mode questionnaire design. Royal Statistical Society, October, 11.
Carbone, D.; Hanson, J. (2012) Floods: 10 of the deadliest in Australian history. Australian Geographic. March 08, 2012. Accessed on September 5, 2016: http://www.australiangeographic.com.au/topics/history-culture/2012/03/floods-10-of-the-deadliest-in-australian-history/
Charles, M. et al. (1989) Coping with crises: the management of disasters, riots, and terrorism, Charles C. Thomas, Illinois.
Charpentier, A.; Le Maux, B. (2014) Natural catastrophe insurance: How should the government intervene? Journal of Public Economics, 115:1-17.
Christian, L. M.; Dillman, D. A. (2004) The influence of graphical and symbolic language manipulations on responses to self-administered questions. Public Opinion Quarterly, 68(1), 57-80.
Clarke, L.; Short Jr, J. F. (1993) Social organization and risk: Some current controversies. Annual Review of Sociology, 375-399.
Collins, D. (2003) Pretesting survey instruments: an overview of cognitive methods. Quality of life research, 12(3), 229-238.
Colten, C. E.; Sumpter, A. R. (2009). Social memory and resilience in New Orleans. Natural Hazards, 48(3):355-364.
Comrie, N. (2011). Review of the 2010–11 flood warnings & response. State of Victoria. Coppola, D.P. (2007) Introduction to International Disaster Management. Oxford:
Butterworth Heinemann. Cortner, H. J.; Gardner, P. D.; Taylor, J. G. (1990) Fire hazards at the urban-wildland
interface: What the public expects. Environmental Management, 14(1), 57-62. Council of Australian Governments (COAG) (2002) Natural Disasters in Australia: Reforming
Mitigation, Relief and Recovery. Canberra, ACT: Australian Government Department of Transport and Regional Services
Council of Australian Governments (COAG) (2011) National Strategy for Disaster Resilience: Building our nation’s resilience to disasters. Accessed 10 August 2014. Available at: https://www.coag.gov.au/sites/default/files/national_strategy_disaster_resilience.pdf
Cox (2016) Logistic Regression. Accessed on May 15, 2015. https://www.staff.ncl.ac.uk/mike.cox/III/spss10.pdf
Cummins, R. A.; Gullone, E. (2000, March) Why we should not use 5-point Likert scales: The case for subjective quality of life measurement. In Proceedings, second international conference on quality of life in cities (pp. 74-93).
Danili, E.; Reid, N. (2006) Cognitive factors that can potentially affect pupils’ test performance. Chemistry Education Research and Practice, 7(2), 64-83.
Davies, A. (2014) Councils scramble for flood mitigation funds, The Observer 16 May 2014. Accessed on August 29, 2014. http://www.gladstoneobserver.com.au/news/councils-scramble-for-flood-mitigation-funds/2259737/

184
Delfin Jr.,F. G.; Gaillard, J-C. (2008) Extreme Versus Quotidian: Addressing Temporal Dichotomies in Philippine Disaster Management, Public Administration and Development, 28:190-199.
Dillman, D. A.; Christian, L. M. (2005) Survey mode as a source of instability in responses across surveys. Field methods, 17(1), 30-52.
Dlugolecki, A.; Keykhah, M. (2002) Climate change and the insurance sector: Its role in adaptation and mitigation. Greener Management International, (39):83-99.
Dooley, D.; Catalano, R.; Mishra, S.; Serxner, S. (1992) Earthquake preparedness: predictors in a community survey1. Journal of Applied Social Psychology, 22(6):451-470.
Douglas, M.; Wildavsky, A. (1982) Risk and culture: An essay on the selection of technological and environmental dangers. Berkeley and Los Angeles.
Drabek, T. E. (1986) Hazard perceptions. In Human System Responses to Disaster (pp. 319-347). Springer, New York.
Draper, N. R. Smith. H. (1981) Applied regression analysis, 85-96. Dynes, D.; Quarantelli, E. (2000) A Conversation with Russell Dynes and E.L. Quarantelli,
Environmental Hazards, 2(1):3-9. Eburn, M.; Dovers, S. (2013) Risk Management from a Legal and Governance Perspective.
DDN Conference Paper. Ehman, J. W.; Ott, B. B., Short; T. H., Ciampa; R. C.; Hansen-Flaschen, J. (1999) Do patients
want physicians to inquire about their spiritual or religious beliefs if they become gravely ill?. Archives of Internal Medicine, 159(15), 1803-1806.
Emergency Management Australia (EMA) (2000) Emergency Risk Management: Applications Guide, Canberra, Australia, Emergency Management.
Engel, H. (1997). The flood events of 1993/1994 and 1995 in the Rhine River basin. IAHS Publications-Series of Proceedings and Reports-Intern Assoc Hydrological Sciences, 239, 21-32.
Etkin, D.; Stefanovic, I. L. (2005) Mitigating natural disasters: The role of eco-ethics. In Mitigation of Natural Hazards and Disasters: International Perspectives (pp. 135-158). Springer Netherlands.
Everitt, B.; Skrondal, A. (2002) The Cambridge dictionary of statistics (Vol. 106). Cambridge: Cambridge University Press.
Field, A. (2009) Discovering statistics using SPSS, 3rd edition. Sage Publications, London. Fischetti, M. (2001) Drowning New Orleans. Scientific American, 285(4):76-85. Floodplain Management Association (2013) Media Release – Brisbane River Catchment
Flood Study Essential, Says FMA, October 14 2013, accessed on September 23 2014. Available at: http://floods.org.au/media-release-brisbane-river-catchment-flood-style-essential-says-fma/
Floyd, D.; Prentice-Dunn, S.; Rogers, R. (2000) A Meta-Analysis of Research on Protection Motivation Theory. Journal of Applied Social Psychology, 30(2):407-429.
Frattini, P.; Crosta, G. B. (2006) Valutazione dell’accettabilità del rischio da frana e analisi costi-benefici. Giornale di Geologia Applicata, 4:49-56.
Freedy, J. R.; Saladin, M. E.; Kilpatrick, D. G., Resnick; H. S.; Saunders, B. E. (1994) Understanding acute psychological distress following natural disaster. Journal of Traumatic Stress, 7(2), 257-273.
Freeman, P.; Kunreuther, H. (2002) Environmental Risk Management for Developing Countries. The Geneva Papers on Risk and Insurance, 27(2):196-214.
Gaillard, J. C.; Texier, P. (2010). Religions, natural hazards, and disasters: An introduction. Religion, 40(2), 81-84.
Ganderton, P. (2005) Benefit-Cost Analysis of Disaster Mitigation: Application as a Policy and Decision-Making Tool, Mitigation and Adaptation for Global Change, In: Haque, C.
185
(ed.) Mitigation of Natural Hazards and Disasters: International Perspectives, The Netherlands: Springer, 10:411-441.
Garland, R. (1991) The mid-point on a rating scale: Is it desirable. Marketing bulletin, 2(1), 66-70.
Garner, W. R.; Hake, H. W. (1951) The amount of information in absolute judgments. Psychological Review, 58(6), 446.
Geiger, G. (2005) Risk acceptance from non-linear utility theory, Journal of Risk Research, 8(3):225-252.
Gilbert, J.B. (2004) The bushfire risk: community awareness and perception on the rural-urban fringe of Melbourne, Unit Dissertation, University College, London. Accessed from www.nillumbikratepayers.asn. au/the_bushfire_risk.html on 21/11/06.
Gillard, J. (2011) Rebuilding after the floods: media release 27 January 2011, Prime Minister of Australia. http://www.pm.gov.au/press-office/rebuilding-afterfloods. Accessed 31 July 2015.
Greiving, S.; van Westen, C.; Corominas, J.; Glade, T.; Malet, J. P.; van Asch, T. (2014) Introduction: The components of Risk Governance. In Mountain Risks: From Prediction to Management and Governance (pp. 1-27). Springer Netherlands.
Grothmann, T.; Reusswig, F. (2006) People at risk of flooding: why some residents take precautionary action while others do not. Natural hazards, 38(1-2):101-120.
Guilford, J. P. (1954). Psychometric methods . Handmer, J.; Dovers, S. (2007) Handbook of disaster and emergency policies and
institutions. London: Earthscan. Haque, C.; Burton, I. (2005) Adaptation Options Strategies for Hazards and Vulnerability
Mitigation: An International Perspective, Mitigation and Adaptation for Global Change, 10:335-353. In Mitigation of Natural Hazards and Disasters: International Perspectives, by C. Haque. Springer: The Netherlands, 2005.
Hayes, J.; Goonetilleke, A. (2012) Building community resilience – learning from the 2011 floods in Southeast Queensland, Australia. In Kakimoto, R. and Yamada, F. (eds.) 8th Annual Conference of International Institute for Infrastructure, Renewal and Reconstruction: International Conference on Disaster Management (IIIRR 2012), Kumamoto University, Kumamoto, Japan, pp. 51-60.
Haynes, R. B.; Ackloo, E.; Sahota, N.; McDonald, H. P.; Yao, X. (2008) Interventions for enhancing medication adherence. Cochrane Database Syst Rev, 2(2).
Hays, W. (2016) Notable Historic Floods in Europe. Global Alliance for Disaster Reduction, University of North Carolina, USA. Accessed on February 26th 2017: www.pitt.edu/~super7/47011-48001/47731.ppt
Heath, R.; Lee, J.; Ni, L. (2009) Crisis and Risk Approaches to Emergency Management Planning and Communication: The Role of Similarity and Sensitivity, Journal of Public Relations Research, 21(2):123-141.
Hinton, P. R. (2014) Statistics explained. Routledge. Hobbs, D.; Wright, R. (Eds.) (2006). The Sage handbook of fieldwork. Sage. Hosmer Jr, D. W.; Lemeshow, S. (2004) Applied logistic regression. John Wiley & Sons. Hosmer Jr, D. W.; Lemeshow, S.; Sturdivant, R. X. (2013) Applied logistic regression (Vol.
398). John Wiley & Sons. Hudson, P.; Botzen, W. W.; Czajkowski, J.; Kreibich, H. (2014) Adverse Selection and Moral
Hazard in Natural Disaster Insurance Markets: Empirical evidence from Germany and the United States. Wharton Risk Management and Decision Processes Center, Working Paper # 2014-07.
Hurst, D. (2010) Could the 1974 flood happen again?, The Sydney Morning Herald, October 13 2010. Accessed on Aug 1 2016: http://www.smh.com.au/environment/weather/could-the-1974-flood-happen-again-20101012-16hpq.html
186
IPCC (2007) IPCC Fourth Assessment Report: Climate Change 2007. Working Group II: Impacts, Adaptation and Vulnerability. Accessed on April 24, 2017. Available at: https://www.ipcc.ch/publications_and_data/ar4/wg2/en/ch19s19-1-2.html
Jacoby, J.; Matell, M. S. (1971) Three-point Likert scales are good enough. Journal of Marketing Research, 8(4), 495-500.
Jamieson, S. (2004) Likert scales: how to (ab) use them. Medical education, 38(12), 1217-1218.
Johnston, D.M.; Bebbington, M.S.; Lai, C-D.; Houghton, B.F.; Paton, D. (1999) Volcanic hazard perceptions: comparative shifts in knowledge and risk, Disaster Prevention and Management 8(2): 118-126.
Kabra, R.; Khator, R. (2001) The 1994 Plague Outbreak in Surat, India, in Farazmand, A. Handbook of Crisis and Emergency Management, Marcel Dekker, New York/Basel, 2001.
Kahneman, D.; Tversky, A. (1973) On the psychology of prediction. Psychological Review, 80(4):237-251
Kahneman, D.; Tversky, A. (1979) Prospect theory: An analysis of decision under risk. Econometrica: Journal of the econometric society, 263-291.
Kaiser, G., et al. (2004) COMRISK Subproject 3: Public Perception of Coastal Flood Defence and Participation in Coastal Flood Defence Planning. Final Report. Kiel, Germany. p. 1e212
Kates, R. W. (1962) Hazard and choice perception in flood plain management. Chicago, Illinois, University of Chicago, 1962. 157 P.
Kates, R. W. (1971) Natural hazard in human ecological perspective: hypotheses and models. Economic Geography, 47(3), 438-451.
Kellens, W.; Terpstra, T.; De Maeyer, P. (2013) Perception and communication of flood risks: a systematic review of empirical research. Risk Analysis, 33(1):24-49.
Kelly, C. (1995) ‘A framework for improving operational effectiveness and cost efficiency in emergency planning and response’. Disaster Prevention and Management. 4(3):25–31
King, D.; Bird, D.; Haynes, K.; Boon, H.; Cottrell, A.; Millar, J.; Thomas, M. (2014). Voluntary relocation as an adaptation strategy to extreme weather events. International journal of disaster risk reduction, 8: 83-90.
Kleinbaum, D. G.; Klein, M. (2010). Logistic regression: a self-learning text. Springer Science & Business Media.
Kleindorfer, P. R.,; Kunreuther, H. (1999). The complementary roles of mitigation and insurance in managing catastrophic risks. Risk Analysis, 19(4), 727-738.
Knight, F. H. (2012) Risk, uncertainty and profit. Courier Corporation. Kok, M., Vrijling, J. K., Van Gelder, P. H. A. J. M., & Vogelsang, M. P. (2002, September).
Risk of flooding and insurance in the Netherlands. In Proceedings of the Second International Symposium on Flood Defence. Beijing, China, September 10-13 (pp. 146-154). Science Press, New York, NY, USA.
Kousky, C.; Shabman, L. (2016) Understanding flood risk decision making. Implications for flood risk communication program design. Resources for the future, accessed on February 6th, 2018. Available at: https://pdfs.semanticscholar.org/20a8/7f410390f8d7186e9feecdd04ef5dc7a4e6b.pdf
Krosnick, J. A.; Fabrigar, L. R. (1997) Designing rating scales for effective measurement in surveys. Survey measurement and process quality, 141-164.
Kumagai, Y.; Carroll, M.S.; Cohn, P. (2004) Coping with interface wildfire as a human event: lessons from the disaster/hazards literature, Journal of Forestry, 102(6):28-32.
Kundak, S.; Türkoglu, H.; İkli, A. (2014) Risk perception in Istanbul: An earthquake-prone city. Risk, 11(1):117-137.
187
Kunreuther, H. (1996) Mitigating disaster losses through insurance. Journal of Risk and Uncertainty, 12(2–3):171–187.
Kunreuther, H. (2006) Disaster mitigation and insurance: Learning from Katrina. The Annals of the American Academy of Political and Social Science, 604(1):208-227.
Kunreuther, H. (2008) Reducing losses from catastrophic risks through long-term insurance and mitigation. Social Research, 905-930.
Kuran, T.; Sunstein, C. R. (1999) Availability cascades and risk regulation. Stanford Law Review, 683-768.
Laerd (2013) Logistic Regression. Accessed on June 20, 2016. https://statistics.laerd.com/spss-tutorials/binomial-logistic-regression-using-spss-statistics.php
Lagadec, P. (1990) States of Emergency: Technological Failures and Social Destabilization. London: Butterworth-Heinemann.
Lee, K.; Koval, J. J. (1997) Determination of the best significance level in forward stepwise logistic regression. Communications in Statistics-Simulation and Computation, 26(2):559-575.
Letens, G. et al. (2008) Towards a Balanced Approach in Risk Identification, 20(3):3-9. Lindell, M. (2013) North American cities at risk: household responses to environmental
hazards. In Cities at Risk (pp. 109-130). Springer Netherlands. Lindell, M. K.; Hwang, S. N. (2008) Households' perceived personal risk and responses in a
multihazard environment. Risk Analysis, 28(2):539-556. Lindell, M. K.; Whitney, D. J. (2000) Correlates of household seismic hazard adjustment
adoption. Risk Analysis, 20(1):13-26. Lindell, M.; Perry, R. (2000) Household adjustment to earthquake hazard. A review of
research. Environment and Behaviour, 32:461–501. Mansfield, E. R.; Helms, B. P. (1982) Detecting multicollinearity. The American
Statistician, 36(3a): 158-160. Marczyk, G., DeMatteo, D.; Festinger, D. (2005) Essentials of research design and
methodology. John Wiley & Sons Inc. Marewski, J. N., Gaissmaier, W.; Gigerenzer, G. (2010) Good judgments do not require
complex cognition. Cognitive processing, 11(2), 103-121. Marewski, J. N.; Gigerenzer, G. (2012) Heuristic decision making in medicine. Dialogues in
clinical neuroscience, 14(1), 77-89. Maurer, T. J.; Pierce, H. R. (1998) A comparison of Likert scale and traditional measures
of self-efficacy. Journal of applied psychology, 83(2), 324. McCaffrey, S. M. (2004) Thinking of wildfire as a natural hazard. Society and Natural
Resources: An International Journal, 17(6):509–516. McEntire, D. A. (2005) Why vulnerability matters: Exploring the merit of an inclusive disaster
reduction concept. Disaster Prevention and Management: An International Journal, 14(2):206-222.
McFarlane, B.; McGee, T.; Faulkner, H. (2011) Complexity of homeowner wildfire risk mitigation: an integration of hazard theories, International Journal of Wildland Fire, 20(8):921-931.
McGowan, J. (2012) A Missed Opportunity to Promote Community Resilience? – The Queensland Floods Commission of Inquiry, Australian Journal of Public Administration, 71(3):355-363.
McLennan, B.; Handmer, J. (2012) From risk to resilience? Reframing shared responsibility in Australian disaster policy. Proceedings of 3rd Human Dimensions of Wildland Fire, April 17 -19, 2012, Seattle, Washignton, USA.
Menoni, S.; Pesaro, G. (2008) Is relocation a good answer to prevent risk? Criteria to help decision makers choose candidates for relocation in areas exposed to high
188
hydrogeological hazards. Disaster Prevention and Management: An International Journal, 17(1):33-53.
Meyer, R. (2006) Why We Under-Prepare for Hazards, in On Risk and Disaster: Lessons from Hurricane Katrina, R. Daniels, D. Kettl, and H. Kunreuther, University of Pennsylvania Press: Philadelphia.
Mileti, D. (1999) Disasters by design: A reassessment of natural hazards in the United States. Joseph Henry Press.
Mileti, D. S.; Darlington, J. D. (1997) The role of searching in shaping reactions to earthquake risk information. Social Problems, 44(1):89-103.
Mileti, D. S.; Fitzpatrick, C. (1992) The causal sequence of risk communication in the Parkfield earthquake prediction experiment. Risk Analysis, 12(3):393-400.
Mileti, D.; Peek-Gottschlich, L. (2001) Hazard and Sustainable Development in the United States, Risk Management, 3(1):61-70.
Miller, G. (1956) The magical number seven, plus or minus two: some limits on our capacity for processing information. Psychological Review, 63(2):81-97.
Mills, E. (2007) Synergisms between climate change mitigation and adaptation: an insurance perspective. Mitigation and Adaptation Strategies for Global Change, 12(5):809-842.
Mills, E. (2009) A Global Review of Insurance Industry Responses to Climate Change. The Geneva Papers, 34: 323-359.
Milne, S.; Sheeran, P.; Orbell, S. (2000) Prediction and Intervention in Health-Related Behaviour: A Meta-Analytic Review of Protection Motivation Theory. Journal of Applied Social Psychology, 30(1):106-143.
Mitchell, D. (2011) Assessing and Responding to Land Tenure Issues in Disaster Risk Management, FAO Land Tenure Manuals 3, Rome.
Moore, T. (2014) New dams could be built near Linville or Willowbank: study. Brisbane Times. Available at: http://www.brisbanetimes.com.au/queensland/new-dams-could-be-built-near-linville-or-willowbank-study-20141216-12844g.html. Accessed on 16 December 2014.
Moore, T. (2014a) Queensland’s disaster relief funding under threat from federal government. Brisbane Times [online], 25 Nov 2014. Available at: http://www.brisbanetimes.com.au/queensland/queenslands-disaster-relief-funding-under-threat-from-federal-government-20141124-11t0w6.html. Accessed on November 26, 2014.
Moore, T. (2017) People who lost value on land are entitled to Queensland flood compensation: 2011 campaigner, Brisbane Times, April 28th 2017. Accessed on April 28th 2017. Available at: http://www.brisbanetimes.com.au/queensland/people-who-lost-value-on-land-are-entitled-to-queensland-flood-compensation-2011-campaigner-20170428-gvv20m.html
National Institute of Building Sciences (2005) Natural Hazard Mitigation Saves: An Independent Study to Assess the Future Savings from Mitigation Activities. Volume 2 − Study Documentation, Multihazard Mitigation Council.
Natural Disasters in Australia (2004) Reforming mitigation, relief and recovery arrangements. A report to the Council of Australian Governments by a high level officials group, Canberra.
Newbold, P.; Carlson, W. C. (2003). Betty M. Thorne Statistics for Business and Economics (Vol. 850). Prentice Hall.
Nilsson, J. (2010) What’s the Problem? Local Officials’ Conceptions of Weaknesses in their Municipalities’ Crisis Management Capabilities, Journal of Contingencies and Crisis Management, 18(2).
Norman, G. (2010) Likert scales, levels of measurement and the “laws” of statistics. Advances in health sciences education, 15(5), 625-632.
189
O’Connor, T. (2014) Criminal Justice. Accessed on: July 28, 2014. http://www.drtomoconnor.com/3430/3430lect06.htm
Odgers, D. P.; Rhodes, A. (2002) Community response to the New South Wales bushfires 2001-2002. East Melbourne: Australasian Fire Authorities Council.
Okada, T.; Haynes, K.; Bird, D.; van den Honert, R.; King, D. (2014). Recovery and resettlement following the 2011 flash flooding in the Lockyer Valley. International journal of disaster risk reduction, 8:20-31.
Olofsson, A.; Öhman, S. (2015) Vulnerability, values and heterogeneity: one step further to understand risk perception and behaviour. Journal of Risk Research, 18(1):2-20.
Paton, D. (2003) Disaster Preparedness: a social-cognitive perspective. Disaster Prevention and Management, 12(3):210-216.
Paton, D., Millar, M.; Johnston, D. (2001) Community resilience to volcanic hazard consequences. Natural hazards, 24(2), 157-169.
Penning‐Rowsell, E. C.; Smith, D. I. (1987) Self‐Help Flood Hazard Mitigation: The Economics of House‐Raising in Lismore, NSW, Australia. Tijdschrift voor economische en sociale geografie, 78(3):176-189.
Peterson, C.; Maier, S. F.; Seligman, M. E. (1993) Learned helplessness: a theory for the age of personal control. Oxford University Press, New York.
Petrolia, D. R.; Landry, C. E.; Keith, H. (2013) Risk preferences, risk perceptions, and flood insurance, Land economics, 89(2):227-245.
Pittock, J. (2011) Dammed if you do. GWF Discussion Paper 1102, Global Water Forum, Canberra, Australia. Available at: http://www.globalwaterforum.org/2011/10/01/damned-if-you-do/. Accessed 10 Nov 2014
Plattner, Th. (2004) Risk 21 – Coping with Risks Due to Natural Hazards in the 21st Century: Proceedings of the Risk 21 Workshop, Monte Verita, Ascona, Switzerland, 28 November-3 December. Taylor & Francis Group: 67-76.
Poussin, J. K.; Botzen, W. W.; Aerts, J. C. (2014). Factors of influence on flood damage mitigation behaviour by households. Environmental Science & Policy, 40:69-77.
Prater, C.; Lindell, M. (2000) Politics of Hazard Mitigation. Natural Hazards Review, 1(2):73-82
Proske, D. (2004) Katalog der Risiken. Risiken und ihre Darstellung. Dresden. Retrieved from: http://www.qucosa.de/fileadmin/data/qucosa/documents/71/1218786958574-1736.pdf [last access: 2011-11-07].
Public Law 111-351. (2011) To amend the Robert T. Stafford Disaster Relief and Emergency Assistance Act to reauthorize the pre-disaster mitigation program of the Federal Emergency Management Agency, January 4. H.R. 1746, 111th Congress
Quarantelli, E. (1986) Disaster Crisis Management, Disaster Research Center, University of Delaware.
Queensland Floods Commission of Inquiry (QFCI) (2012) Final report. Brisbane, Australia. Accessed 18 July 2014. Available at: http://www.floodcommission.qld.gov.au/publications/final-report/
Queensland Reconstruction Authority (2014) Part 1 – Interim measures to support floodplain management in existing planning schemes. Planning for stronger, more resilient floodplains, accessed on September 25, 2014. Available at: http://www.dsdip.qld.gov.au/resources/guideline/qra/planning-stronger-floodplains-part-01.pdf
Queensland Reconstruction Authority (2014a) Planning for stronger, more resilient floodplains. Part 2 – Measures to support floodplain management in future planning schemes. Queensland Government, accessed on September 25 2014. Available at: http://www.dsdip.qld.gov.au/resources/guideline/qra/planning-stronger-floodplains-part-02.pdf

190
Reichhardt, T. (2004) Hurricane Ivan highlights future risk for New Orleans. Nature, 431(7007):388-388.
Remeikis, Amy (2014) ‘Queensland flood victims pin hope on class action’. The Brisbane Times 8 July 2014. Accessed August 10 2014. Available at: http://www.brisbanetimes.com.au/queensland/queensland-flood-victims-pin-hope-on-class-action-20140708-zt008.html
Renn, O.; Burns, W.J.; Kasperson, J. X.; Kasperson, R. E.; Slovic, P. (1992) The Social Amplification of Risk: Theoretical Foundations and Empirical Applications, Journal of Social Issues, 48(4):137-160.
Renner, B.; Knoll, N.; Schwarzer, R. (2000). Age and body make a difference in optimistic health beliefs and nutrition behaviours. International Journal of Behavioural Medicine, 7(2):43-159.
Renner, B.; Schupp, H.; Vollmann, M.; Hartung, F.; Schmälzle, R.; Panzer, M. (2008) Risk perception, risk communication and health behaviour change. Zeitschrift für Gesundheitspstchologie, 16(3):150-153.
Renner, B.; Spivak, Y.; Kwon, S.; Schwarzer, R. (2007) Does age make a difference? Predicting physical activity of South Koreans. Psychology and aging, 22(3):482.
Reynaud, A.; Aubert, C.; Nguyen, M-H. (2013) Living with Floods: Protective Behaviours and Risk Perception of Vietnamese Households, The Geneva Papers, 38:547-579.
Risk Frontiers (2011) State-wide Natural Hazard Risk Assessment, Queensland Department of Community Safety, Queenland Government. URL: http://www.disaster.qld.gov.au/ Disaster%20Resources/SWNHRA.html
Rochford, F. (2007) ‘The Law of Negligence in a 'Risk Society’; Calculating Ideas of Reasonable Risk’. Griffith Law Review, 16(1):172-191.
Rogers, P. (2011) Development of Resilient Australia: enhacing the PPRR approach with anticipation, assessment and registration of risks. Australian Journal of Emergency Management, 26(1):54-58.
Rogers, R. (1975) A protection motivation theory of fear appeals and attitude change. The Journal of Psychology: Interdisciplinary and Applied, 91(1):93-114.
Rogers, R. (1983) Cognitive and physiological processes in fear appeals and attitude change: a revised theory of protection motivation. In: Cacioppo, B.; Petty, L. (eds.) Social Psychophysiology: A Sourcebook. London: Guilford, 153-176.
Rogers, R. W.; Prentice-Dunn, S. (1997) Protection motivation theory. Rohrmann, B.; Renn, O. (2000) Risk perception research. In Cross-cultural risk
perception (pp. 11-53). Springer US. Ronan, K. R.; Deane, F. P. (1998) Normative data and individual variation. Cognitive-
Behaviour Therapy for Children and Families, 74. Ronan, K. R.; Johnston, D. M. (2005) Community Resilience to Disasters. Promoting
Community Resilience in Disasters: The Role for Schools, Youth, and Families, 9-48. Ronan, K. R.; Johnston, D. M.; Hull, A. (1998) A community’s understanding of earthquake
risk in the Manawatu. Report prepared for the Earthquake Commission. Massey University Client Report.
Rose, A.; Porter, K.; Dash, N.; Bouabid, J.; Huyck, C.; Whitehead, J.; Shaw, D.; Eguchi, R.; Taylor, C.; McLane, T.; Tobin, L.; Ganderton, P.; Godschalk, D.; Kiremidjian, A.; Tierney, K.; West, C. (2007) Benefit-Cost Analysis of FEMA Hazard Mitigation Grants, Natural Hazards Review, 8(4):97-111.
Rubin, A.; Babbie, E. R. (2012) inter. Cengage Learning. Rundmo, T.; Moen, B. E. (2007) Risk sensitivity and priority of safety. Risk, Reliability and
Societal Safety, 2:1623-1629. Russell, L. A.; Goltz, J. D.; Bourque, L. B. (1995) Preparedness and hazard mitigation actions
before and after two earthquakes. Environment and Behaviour, 27:744–770.

191
Schön, D. A.; Rein, M. (1994) Frame reflection: Toward the resolution of intractable policy controversies. Basic Books.
Schwarzer, R.; Renner, B. (2000) Social-cognitive predictors of health behaviour: action self-efficacy and coping self-efficacy. Health psychology,19(5):487.
Shiwaku, K.; Shaw, R. (2008) Proactive co‐learning: a new paradigm in disaster education, Disaster Prevention and Management: An International Journal, 17(2):183–198.
Siedschlag, A.; Stangl, R.; Silvestru, D.; Fritz, F.; Jerković, A.; Kindl, S. (2012) Methods to integrate considerations on culture, ethics and citizen acceptance into urban planning for resilience enhancing and vulnerability reduction regarding citizen security.
Simon, H. (1957) Models of man. New York: Wiley. Simon, H. (1991) Bounded Rationality and Organizational Learning. Organization Science,
2(1):125-34 Sinsheimer, R. L. (1971) Views: The Brain of Pooh: An Essay on the Limits of Mind:
Advances in genetics have opened up the possibility that man will some day have the potential to change his central nervous system. At the same time we are becoming aware of quantitative limitations of our intellectual capacities. American scientist, 59(1):20-28.
Sipe, N.; Vella, K. (2014) Relocating a flood-affected community: good planning or good politics?. Journal of the American Planning Association,80(4):400-412.
Sjöberg, L. (2000) Factors in risk perception. Risk analysis, 20(1):1-12. Slinger, J.; Cuppen, M.; Hendriks, M. M. M. (2007) How responsive are scientists and policy
makers to the perceptions of Dutch and Flemish citizens living alongside the Scheldt Estuary? Insights on Flood Risk Management from the Netherlands.
Slovic, P.; Fischhoff, B.; Lichtenstein, S. (1987) Behavioural decision theory perspectives on protective behaviour.
Slovic, P.; Kunreuther, H.; White, G. F. (1974) Decision processes, rationality, and adjustment to natural hazards. Natural hazards: Local, national, global, 187-205.
Slovic, P; Fischhoff, B. (1977) Cognitive Processes and Societal Risk Taking. In: Jungermann, H.; de Zeeuw, G. (eds.) Decision Making and Change in Human Affairs, Boston: Dordrecht-Holland, 7-36.
Smith, D. I.; Penning-Rowsell, E. (1982). An evaluation of house-raising as a flood mitigation strategy for Lismore, NSW. Australian National University, Centre for Resource and Environmental Studies.
Spradley, J. P. (2016) Participant observation. Waveland Press. Stanghellini, L. (2008) Stakeholder discourse and water management - Implementation of
the participatory model CATCH in a Northern Italian alpine sub-catchment. Hydrol. Earth Syst. Sci, 160, 7, 7938.
Steyerberg, E. W.; Eijkemans, M. J.; Habbema, J. D. F. (1999). Stepwise selection in small data sets: a simulation study of bias in logistic regression analysis. Journal of clinical epidemiology, 52(10):935-942.
Szumilas, M. (2010) Explaining odds ratios. J Can Acad Child Adolesc Psychiatry, 19, 227:229.
Terpstra, T.; Lindell, M. K.; Gutteling, J. M. (2009) Does Communicating (Flood) Risk Affect (Flood) Risk Perceptions? Results of a Quasi‐Experimental Study. Risk analysis, 29(8), 1141-1155.
Thaler, R. H.; Sunstein, C. R. (2008) Nudge: Improving decisions about health, wealth, and happiness. London: Penguin Books.
The United Nations Office Strategy for Disaster Risk Reduction (UNISDR) (2014) Terminology. Accessed on 5 August 2014. Available at: http://www.unisdr.org/we/inform/terminology
192
Tierney, K. (2006) Social Inequality, Hazards, and Disasters. In On Risk and Disaster: Lessons from Hurricane Katrina, eds. Ronald J. Daniels, Donald F. Kettl, and Howard Kunreuther. Philadelphia: University of Pennsylvania Press.
Turner, R. H.; Nigg, J. M.; Paz, D. H. (1986) Waiting for disaster: Earthquake watch in California. Univ of California Press.
van den Honert, R. C.; McAneney, J. (2011). The 2011 Brisbane floods: causes, impacts and implications. Water, 3(4):1149-1173.
Van Teijlingen, E.; Hundley, V. (2002) The importance of pilot studies. Nursing Standard, 16(40), 33-36.
Wachinger, G.; Renn, O.; Begg, C.; Kuhlicke, C. (2012) The Risk Perception Paradox – Implications for Governance and Communication of Natural Hazards, Risk Analysis, 33(6):1049-1065.
Wang, Q.; Koval, J. J.; Mills, C. A.; Lee, K. I. D. (2007) Determination of the selection statistics and best significance level in backward stepwise logistic regression. Communications in Statistics-Simulation and Computation, 37(1):62-72.
Waugh, W. (2000) Living with Hazards, Dealing with Disasters: An Introduction to Emergency Management, New York: M. E. Sharpe, Inc.
Weinstein, N. D. (1988) The precaution adoption process. Health psychology, 7(4):355. Weinstein, N. D. (1993) Testing four competing theories of health-protective
behaviour. Health psychology, 12(4):324. Wenger, C. (2013) Climate Change Adaptation and Flooding: Australia’s Statutory and
Institutional Arrangements, presented at Flood Plain Conference. Accessed on September 9, 2014: http://www.floodplainconference.com/papers2014/Caroline%20Wenger%20full%20paper.pdf
Wenger, C.; Hussey, K.; Pittock, J. (2012) The use of the 1:100 year standard in the United States: insights for Australia?, Australian Environment Review, 337-340.
Wenger, C.; Hussey, K.; Pittock, J. (2013) Living with floods: Key lessons from Australia and abroad. National Climate Change Adaptation Research Facility, Gold Coast, 267 pp.
White, G. F. (1945) Human adjustment to floods. White, G. F. (1964) Choice of adjustment to floods. Chicago, University of Chicago, 1964.
P.150. Wilson, J. R.; Lorenz, K. A. (2015) Modeling Binary Correlated Responses Using SAS, SPSS
and R (Vol. 9). Springer. Winter, G.; Fried, J. S. (2000) Homeowner perspectives on fire hazard, responsibility, and
management strategies at the wildland-urban interface. Society & Natural Resources, 13(1), 33-49.
Wisner, B. et al. (2004) At Risk: Natural Hazards, People’s Vulnerability and Disasters. New York: Routledge.
Wivenhoe and Somerset Dams Optimisation Study (2014) Queensland Government, Department of Energy and Water Supply, accessed on September 24 2014. Available at: http://www.dews.qld.gov.au/water-supply-regulations/flood-mitigation-initiatives/wivenhoe-and-somerset-dams-optimisation-study
Wortman,C.; Loftus, E.; Weaver, C. (1999) Psychology (5th ed.). New York: Harper Collins College.
Yeerongpilly Transit Oriented Development (2014) Queensland Government, Department of State Development, Infrastructure and Planning, accessed on September 24 2014. Available at: http://www.dsdip.qld.gov.au/local-area-planning/yeerongpilly-transit-oriented-development.html
Yerkes, R. M.; Dodson, J. D. (1908) The relation of strength of stimulus to rapidity of habit‐formation. Journal of comparative neurology and psychology,18(5):459-482.

193
Zaalberg, R.; Midden, C. (2010) Enhancing human responses to climate change risks through simulated flooding experiences. In Persuasive technology (pp. 205-210). Springer Berlin Heidelberg.
Zaalberg, R.; Midden, C.; Meijnders, A.; McCalley, T. (2009) Prevention, adaptation, and threat denial: Flooding experiences in the Netherlands. Risk Analysis, 29(12):1759-1778.

194
Appendices: Questionnaire
None of the questions are mandatory and more than one answer can be provided for the
same question. While answering, try being as accurate as possible and consider only the
property located in the unit, number, and street mentioned below. If a question does not
apply to you, please skip it.
Flooding, in this survey, is the inundation/overflow of your property caused by water
released from natural watercourses (sea, lakes, rivers, creeks, etc.) and modified
watercourses (reservoir, canals, dams, etc.).
In which street do you live? __________________________ What is the property
number? _______ What is the unit number? ______
I O Own O Rent O Other:__________ the property where I currently reside
I have lived in this property since _______________ (month) __________ (year) or for
__________ (years)
I will live in this property for the next O 0-5 years O 6-10 years O 11-15 years O 16-20
years O 21-50 years O more than 51 years
1. In regard to the property mentioned above, do you know if it has been flooded in
any of the following years?
O Yes: When? O 1893 O 1903 O 1908 O 1931 O 1974 O 2011 O 2013 O Another
Year(s):______________ O No
2. In your lifetime, are any of the following statements true about your experience
with floods?
A property of mine has been damaged in a flood in the last O 0-5 years O 6-20 years O
21-50 years O more than 51 years O never
I or an immediate family member have been O physically injured O
psychologically/emotionally affected by a flood
I have experienced disruption to O my job that prevented me from working O my daily
activities
O A friend, relative, neighbour, or co-worker I know personally has been injured in a flood
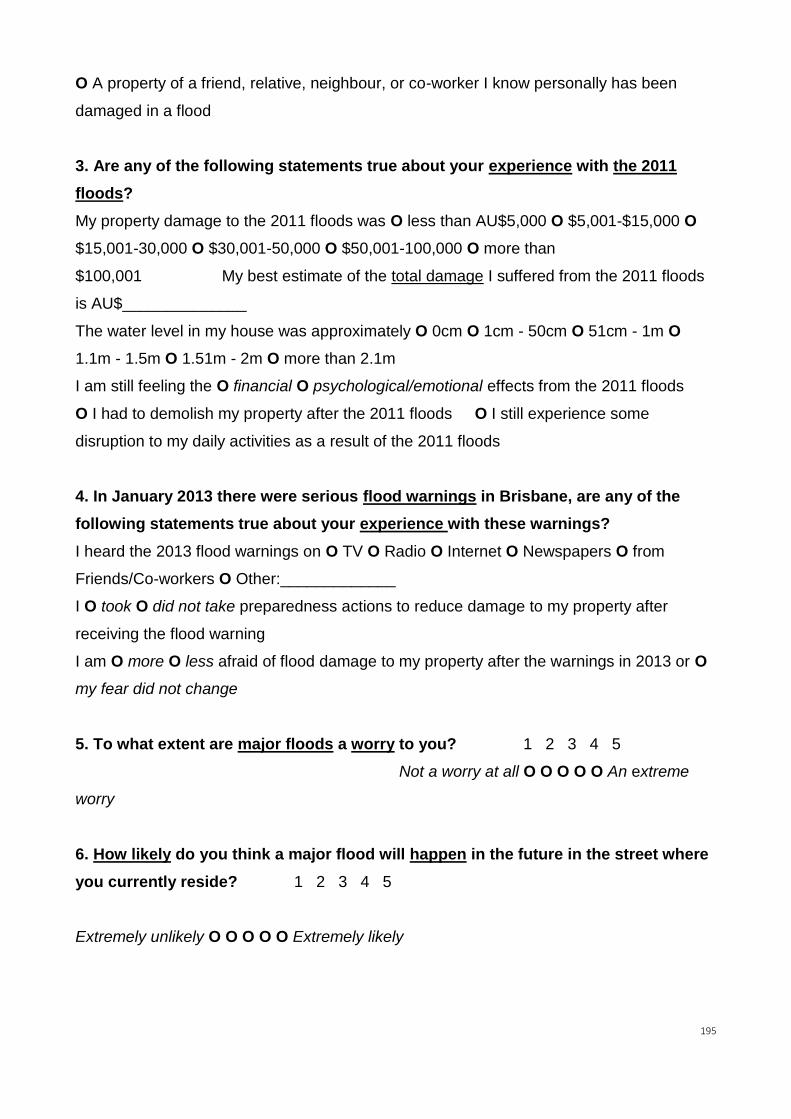
195
O A property of a friend, relative, neighbour, or co-worker I know personally has been
damaged in a flood
3. Are any of the following statements true about your experience with the 2011
floods?
My property damage to the 2011 floods was O less than AU$5,000 O $5,001-$15,000 O
$15,001-30,000 O $30,001-50,000 O $50,001-100,000 O more than
$100,001 My best estimate of the total damage I suffered from the 2011 floods
is AU$______________
The water level in my house was approximately O 0cm O 1cm - 50cm O 51cm - 1m O
1.1m - 1.5m O 1.51m - 2m O more than 2.1m
I am still feeling the O financial O psychological/emotional effects from the 2011 floods
O I had to demolish my property after the 2011 floods O I still experience some
disruption to my daily activities as a result of the 2011 floods
4. In January 2013 there were serious flood warnings in Brisbane, are any of the
following statements true about your experience with these warnings?
I heard the 2013 flood warnings on O TV O Radio O Internet O Newspapers O from
Friends/Co-workers O Other:_____________
I O took O did not take preparedness actions to reduce damage to my property after
receiving the flood warning
I am O more O less afraid of flood damage to my property after the warnings in 2013 or O
my fear did not change
5. To what extent are major floods a worry to you? 1 2 3 4 5
Not a worry at all O O O O O An extreme
worry
6. How likely do you think a major flood will happen in the future in the street where
you currently reside? 1 2 3 4 5
Extremely unlikely O O O O O Extremely likely
196
7. How often do you think a major flood will happen on average in the street where
you currently reside?
O never O once every 5 years O once every 20 years O once every 50 years O once
every 100 hundred years O Other: every______years
8. What is your estimate of your financial loss to the next major flood damaging
your property?
O less than AU$2,000 O $2,001-$5,000 O $5,001-10,000 O $10,001-30,000 O $30,001-
50,000 O $50,001-100,001 O more than $100,001
My best estimate of the total damage I will suffer from a next major flood is
AU$__________
9. To what extent do you think existing dams on the Brisbane River upstream
reduced damage to your property against the 2011 floods?
1 2 3 4 5
Not reduced at all O O O O O Completely reduced
10. How likely do you think existing dams on the Brisbane River upstream may
reduce damage to your property against major floods in the future?
1 2 3 4 5
Extremely unlikely O O O O O Extremely likely
11. To what extent do you think that water released from the Wivenhoe Dam in 2011
increased damage to your property? 1 2 3 4 5
Not at all O O O O O Completely
12. Do you think the government can control flood damage through dam water
release? O Yes O No (If ‘Yes’, please answer questions 13 and 14)
13. If you think the government can control flood damage through dam water
release, how much damage to your property value would you accept?
O 0% O 1-25% O 26-50% O 51-75% O 76-99% O 100% (of damage to my property value)
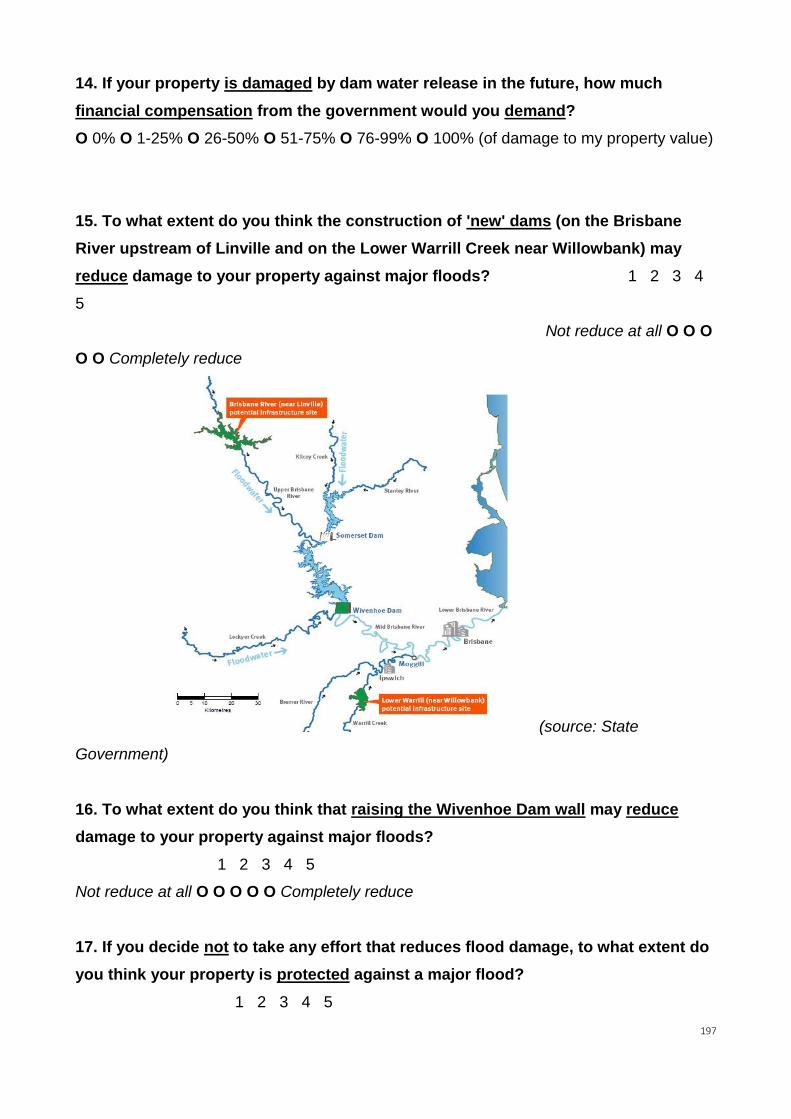
197
14. If your property is damaged by dam water release in the future, how much
financial compensation from the government would you demand?
O 0% O 1-25% O 26-50% O 51-75% O 76-99% O 100% (of damage to my property value)
15. To what extent do you think the construction of 'new' dams (on the Brisbane
River upstream of Linville and on the Lower Warrill Creek near Willowbank) may
reduce damage to your property against major floods? 1 2 3 4
5
Not reduce at all O O O
O O Completely reduce
(source: State
Government)
16. To what extent do you think that raising the Wivenhoe Dam wall may reduce
damage to your property against major floods?
1 2 3 4 5
Not reduce at all O O O O O Completely reduce
17. If you decide not to take any effort that reduces flood damage, to what extent do
you think your property is protected against a major flood?
1 2 3 4 5

198
Not protected at all O O O O O Completely protected
18. If you decide not to take any effort that reduces flood damage, to what extent do
you accept the risk of your property being damaged by a major flood?
1 2 3 4 5
Not accept the risk at all O O O O O Completely accept the risk
19. To what extent do you agree with the following statements? I am not sure about
taking any effort that reduces flood damage to my property myself because...
Not agree at all 1 2 3 4 5 Completely agree
I have coped well with major flood events without taking any effort that reduces flood
damage,
so I will cope well with another one without taking any effort
beforehand……………………………………………...…………………O O O O O
Major floods are too powerful, so there is nothing I can do to reduce damage to my
property……………..……….………….O O O O O
Major floods are natural events that cannot be accurately controlled or predicted,
so I must learn how to quickly adapt to potential damages to my
property……….…………..……………………………………….....O O O O O
20. To what extent do you agree with the following statements? I am not sure about
taking any effort that reduces flood damage to my property myself because...
Not agree at all 1 2 3 4 5 Completely agree
The benefits of living in this property, as it is, are higher than the costs resulting from flood
damage.….....................................O O O O O
My religious beliefs protect me and my property
…………………………………………………………………………………..……………………
…………..O O O O O
I am emotionally attached to my property, land, or community,
so I will take all the risks to continue living here
…………………………………………………………………………………..……………………
……………..O O O O O
199
My in- and out-house mobility will be affected if I take some efforts such as house
raising……………………………………....................O O O O O
21. To what extent do you agree with the following flood preparedness statements?
Not agree at all 1 2 3 4 5 Completely agree
I am psychologically/emotionally prepared to cope with a flood event of similar magnitude
to the one of 2011…………………..O O O O O
I am financially prepared to cope with a flood event of similar magnitude to the one of
2011…………………………………………….. O O O O O
22. To what extent do you think it is… Not at all 1 2
3 4 5 Completely
The government's responsibility to reduce flood damage to your property……..O O O O O
Your responsibility to reduce flood damage to your property………………………...…O O O
O O
23. To what extent do you trust the government’s following efforts to effectively
reduce flood damage to your property?
Not trust at all 1
2 3 4 5 Completely trust
Management of existing and future dams on the Brisbane River upstream……......O O O O
O
Maintenance and upgrade of the City's stormwater drainage network……………....O O O
O O
Regular clearing and management of the City's waterways………………………………...O
O O O O
Risk analysis of the City's catchment areas (water drainage and movement).….....O O O O
O
Installation of devices that prevent the undesirable reversal
of the flow of water (‘backflow’) on the street where I live………………………………....O O
O O O
Changes to flooding standards for building and development across the City….....O O O O
O
200
Residential property buy-back
scheme…………………………………………………………….….O O O O O
River dredging along the Brisbane
River……………………………………………………….….….O O O O O
24. To what extent do you agree with the following statements about land use
planning? I support the creation of open areas that can naturally be inundated
(floodplains) along the Brisbane River because...
Not
agree at all 1 2 3 4 5 Completely agree
Farming, recreation, and forests are better usage for
floodplains……………………………………………………………….………O O O O O
Engineering structures such as dams allow development but these structures also
increase the impacts of major floods if high volumes of water are quickly
released………………………………….…….….O O O O O
These open areas work as ‘buffer zones’ that effectively reduce flood damage to my
property…………………………O O O O O
25. After experiencing flood damage, to what extent do you expect financial
assistance from... Not expect at all 1 2 3 4 5 Greatly expect
the government?…O O O O O
the community?…..O O O O O
the insurer?…………O O O O O
your relatives?……..O O O O O
26. To what extent do you agree with the following statements? I may take efforts to
reduce flood damage to my property...
Not agree at all 1 2 3 4 5 Completely agree
To protect my property value………………………………..O O O O O

201
To protect myself and my family……………………………O O O O O
To reduce my flood damage expenses…………………...O O O O O
27. To what extent would you like to relocate (move out) from the location you
currently reside? 1 2 3 4 5
Do not like at all O O O O O Extremely like
28. Which statements about property 'buy-back' are true?
My property O is O is not eligible for the Brisbane City Council’s residential property buy-
back scheme
I applied to the Brisbane City Council’s residential property buy-back scheme O before O
after the 2011 floods
O I have never applied to the Brisbane City Council’s residential property buy-back
scheme
I O am O am not planning to apply to the Brisbane City Council’s residential property buy-
back scheme
My application to the Brisbane City Council’s residential property buy-back scheme was O
accepted O denied
29. Which statements about preventing water from coming into your property
through house raising are true?
I raised my property O before O after the 2011 floods O I raised my property after the
2013 flood warnings
O I have never raised my property I O am O am not planning to raise my property O
Raising did not protect my property in the 2011 floods
30. To what extent do you agree with the following statements on property raising to
reduce flood damage to your property?
Not agree at all 1 2 3 4 5 Completely agree
Today’s costs of raising my property are
reasonable………………………………………………………………………………………....…
…….O O O O O

202
Raising my property is 'simple' (or 'feasible' in terms of the amount of time and knowledge I
have available)……………O O O O O
Raising my property effectively reduces flood
damage……………………………………………………………………………………………….
O O O O O
31. Which flood insurance statements are true?
I took out flood insurance O before O after the 2011 floods O I took out flood insurance
after the 2013 flood warnings
O I have never taken out flood insurance I O am O am not planning to take out flood
insurance
32. Have you noticed an increase in the cost of flood insurance since the 2011
floods? O Yes O No (If ‘Yes’, please answer question 33)
33. Which of the following statements are true about the increase of your flood
insurance premium since the 2011 floods? The cost of my flood insurance has
increased by… O 0% O 1-50% O 51-100% O 101-200% O 201-300% O 301-400% O
401-500% O Other:_________________
34. Have you ever received any premium discount for taking any effort that reduces
flood damage to your property (for example: house raising)?
O Yes: How much? O AU$1-100 O $101-300 O $301-500 O $501-1,000 O more than
$1,000 O No
35. In your last losses to a major flood, how much of the total damage was covered
by flood insurance?
O 0% O 1-25% O 26-50% O 51-75% O 76-99% O 100%
36. To what extent do you agree with the following statements about insurance
coverage? Flood insurance…
Not agree at all 1 2
3 4 5 Completely agree

203
Should cover damage resulting from floods caused by stormwater/rainfall runoff ('flash
flooding')..............................O O O O O
Should cover damage resulting from floods caused by riverine/inland
flooding………………………………………………………….O O O O O
Should cover damage resulting from floods caused by actions of the sea/sea level
rise/storm surge………………………….O O O O O
Coverage and definitions are
confusing……………………………………………………………………………………………
………………………….O O O O O
37. To what extent do you agree with the following statements about insurance to
your property?
Not
agree at all 1 2 3 4 5 Completely agree
Today’s costs of flood insurance are
reasonable……………………………………………………………………………………………
…….………O O O O O
Taking out flood insurance is 'simple' (or 'feasible' in terms of the amount of time and
knowledge I have available)….O O O O O
Flood insurance effectively reduces flood
damage………………………………………………………………………………………………
………O O O O O
38. To what extent do you agree with the following statements about insurance?
Not agree at all 1 2 3 4 5 Completely agree
I accept to pay premiums that reflect potential flood damage to my
property……………………………………….…….O O O O O
The cost of flood insurance affects my decision to invest in flood damage
protection…………………………….…...O O O O O
I accept to increase my deductible (the amount I pay out-of-pocket
for expenses before the insurer will cover the remaining costs) to reduce the cost of my
flood insurance…..O O O O O
Insurers' recommendations effectively reduce flood damage to my
property……………………………………………....O O O O O

204
39. Do you need excess flood insurance because the estimated cost to rebuild your
property from flood damage is higher that the primary flood coverage? OYes: How
much? Oless than AU$100,000 O$100,001-250,000 O$250,001-500,000 O$500,001-1
million Omore than 1 million O No
40. To what extent do you agree with the following insurance-related statements?
Not agree
at all 1 2 3 4 5 Completely agree
The government should subsidize my flood insurance from tax
payments………………………………………………………………....O O O O O
If I decide to live in a high-risk area, a mortgage loan could be only approved if I take out
flood insurance...……………..O O O O O
When the Brisbane City Council updates its flood hazard maps,
I must accept the further costs that these updates may have on my flood
insurance…………………………….……………………O O O O O
The coverage provided by flood insurance helps me recover
quickly……………………………..……………………………………..…....O O O O O
There are not enough options of flood insurance policies available in the
market….………………………………………………..….O O O O O
41. Which of the following measures have you taken to reduce flood damage to your
property?
O installed fixed or mobile flood barriers O installed flood-resistant materials O installed
water resistant walls
O installed wall openings that allow the entry and exit of flood waters O installed water
drainage system O installed electrical lines and devices to higher levels O installed
habitable rooms to higher levels O None of them O Other measures I
took:__________________________________
42. To what extent do you agree with the following statements? Today’s costs of the
following flood damage protection measures are reasonable:
Do not agree
at all 1 2 3 4 5 Completely agree

205
installed fixed or mobile flood barriers………………………………………………... O O O O
O
installed flood-resistant materials……………………………………………………….. O O O
O O
installed water resistant walls……………………………………………………………... O O O
O O
installed wall openings that allow the entry and exit of flood waters….. O O O O O
installed water drainage system………………………………………………………….. O O O
O O
installed electrical lines and devices to higher levels…………………….…….. O O O O O
installed habitable rooms to higher levels……………………………………..……..O O O O
O
43. To what extent do you agree with the following ‘statements? The following flood
damage protection measures are 'simple' to undertake (or 'feasible' in terms of the
amount time and knowledge I have available):
Do not agree at all 1 2 3 4 5
Completely agree
installed fixed or mobile flood barriers……………………………………………….. O O O O
O
installed flood-resistant materials………………………………………………………. O O O O
O
installed water resistant walls…………………………………………………………….. O O O
O O
installed wall openings that allow the entry and exit of flood waters…. O O O O O
installed water drainage system…………………………………………………………. O O O
O O
installed electrical lines and devices to higher levels………………………….. O O O O O
installed habitable rooms to higher levels…………………………………….……..O O O O O
44. To what extent do you agree with the following ‘statements? The following flood
damage protection measures effectively reduce damage to my property:
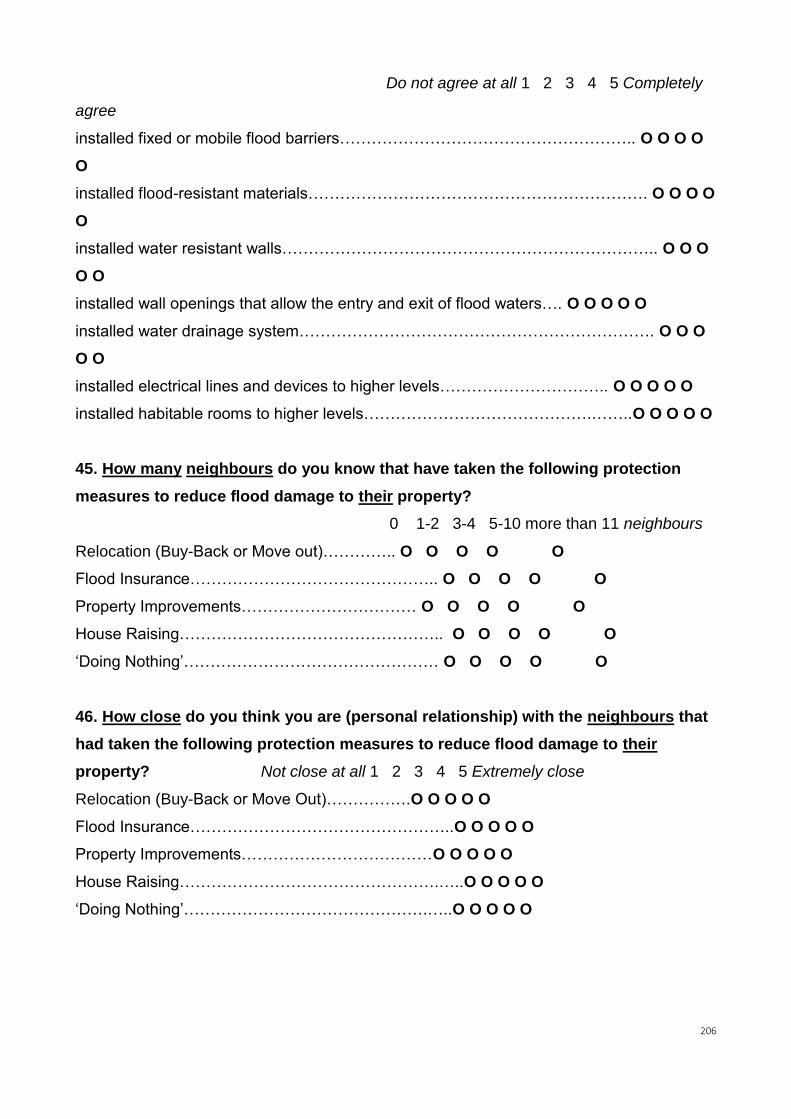
206
Do not agree at all 1 2 3 4 5 Completely
agree
installed fixed or mobile flood barriers……………………………………………….. O O O O
O
installed flood-resistant materials………………………………………………………. O O O O
O
installed water resistant walls…………………………………………………………….. O O O
O O
installed wall openings that allow the entry and exit of flood waters…. O O O O O
installed water drainage system…………………………………………………………. O O O
O O
installed electrical lines and devices to higher levels………………………….. O O O O O
installed habitable rooms to higher levels…………………………………….……..O O O O O
45. How many neighbours do you know that have taken the following protection
measures to reduce flood damage to their property?
0 1-2 3-4 5-10 more than 11 neighbours
Relocation (Buy-Back or Move out)………….. O O O O O
Flood Insurance……………………………………….. O O O O O
Property Improvements…………………………… O O O O O
House Raising………………………………………….. O O O O O
‘Doing Nothing’………………………………………… O O O O O
46. How close do you think you are (personal relationship) with the neighbours that
had taken the following protection measures to reduce flood damage to their
property? Not close at all 1 2 3 4 5 Extremely close
Relocation (Buy-Back or Move Out)…………….O O O O O
Flood Insurance…………………………………………..O O O O O
Property Improvements………………………………O O O O O
House Raising………………………………………….…..O O O O O
‘Doing Nothing’……………………………………….…..O O O O O
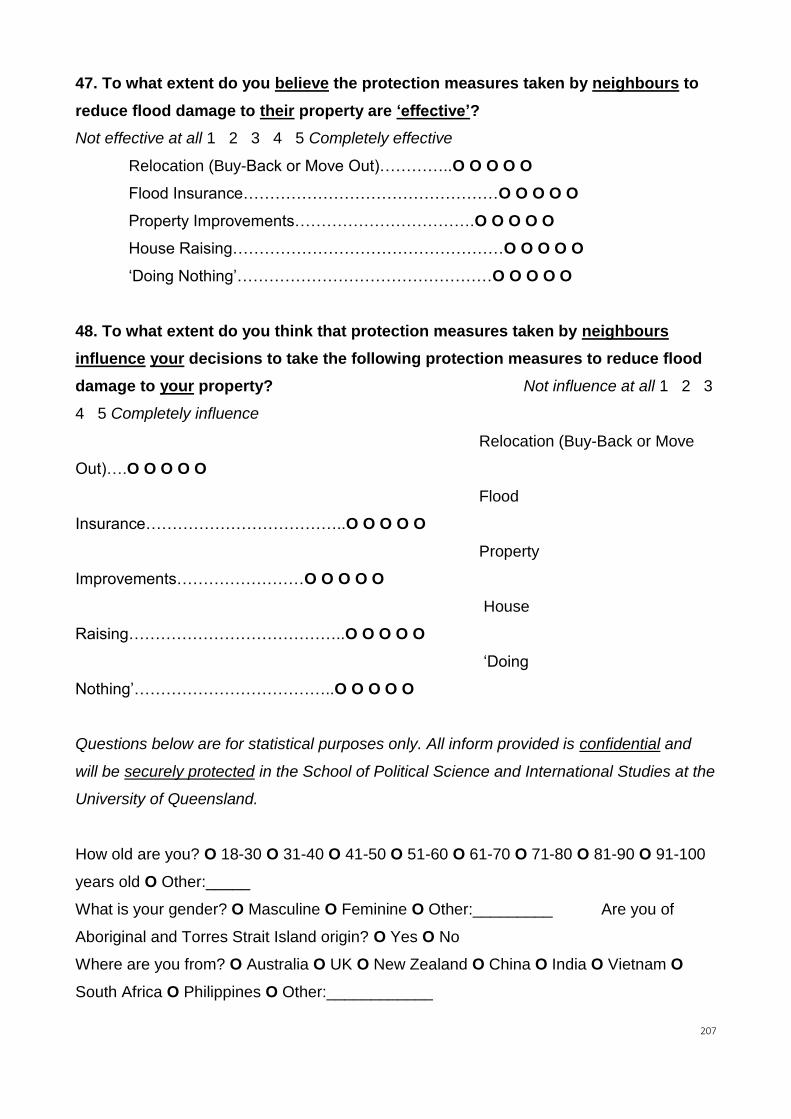
207
47. To what extent do you believe the protection measures taken by neighbours to
reduce flood damage to their property are ‘effective’?
Not effective at all 1 2 3 4 5 Completely effective
Relocation (Buy-Back or Move Out)…………..O O O O O
Flood Insurance…………………………………………O O O O O
Property Improvements…………………………….O O O O O
House Raising……………………………………………O O O O O
‘Doing Nothing’…………………………………………O O O O O
48. To what extent do you think that protection measures taken by neighbours
influence your decisions to take the following protection measures to reduce flood
damage to your property? Not influence at all 1 2 3
4 5 Completely influence
Relocation (Buy-Back or Move
Out)….O O O O O
Flood
Insurance………………………………..O O O O O
Property
Improvements……………………O O O O O
House
Raising…………………………………..O O O O O
‘Doing
Nothing’………………………………..O O O O O
Questions below are for statistical purposes only. All inform provided is confidential and
will be securely protected in the School of Political Science and International Studies at the
University of Queensland.
How old are you? O 18-30 O 31-40 O 41-50 O 51-60 O 61-70 O 71-80 O 81-90 O 91-100
years old O Other:_____
What is your gender? O Masculine O Feminine O Other:_________ Are you of
Aboriginal and Torres Strait Island origin? O Yes O No
Where are you from? O Australia O UK O New Zealand O China O India O Vietnam O
South Africa O Philippines O Other:____________

208
What is your marital status? O Married O De Facto O Single O Never Married O Divorced
O Separated O Widowed
What is your highest level of education? O Primary O High School O Technical O Some
University O University O Post-Graduate
What is your yearly household income before tax? O less than AU$30,000 O $30,001-
50,000 O $50,001-$80,000 O $80,001-100,000
O $100,001-200,000 O more than $200,001
The market value of my property is O less than AU$250,000 O $250,001-500,000 O
$500,001-1 million O $1 million-2 million O more than $2 million My best estimate of my
property value is AU$_______________
I live in a O Separate House (Single Family) O Separate House (Multiple Family) O Semi-
Detached House/Townhouse O Apartment O Flat & Unit O Other:____________________
Are there children in the household that are under 12 years old? O Yes O No / Are there
adults in your household that are over 70 years old? O Yes O No / Are there people
with reduced mobility in your household? O Yes O No
How many people live in your property? ___ Do you have pets? O Yes O No
The habitable rooms in my property are located O at the ground level O between ground
level and 1m O 1.1 - 2m O 2.1 - 3m O more than 3m
My property is located in a O high-risk O medium-risk O low-risk flood zone according to
the Brisbane City Council's flood awareness maps
O I do not know the flood risks for my property
How far do you think it is your property from the Brisbane River? O less than 5 metres O 6-
15 metres O 16-30 metres O 31-100 metres O 101-500 metres O 501 metres-1 kilometre
O more than 1 kilometre
How much do you think the Brisbane River needs to rise above high tide to cause flood
damage to your property? O less than 2 metres O 2.1-4 metres O 4.1-6 metres O 6.1-8
metres O 8.1-10 metres O 10.1-12 metres O 12.1-14 metres O more than 14.1 metres
My property has been damaged by O overland O creek O river O storm tide flooding
before
Do you have additional comments about flood risks and mitigation measures for your
property?

209
Ethics Approval Letter
From: Muriwai Salam <[email protected]> Sent: Monday, April 27, 2015 4:57 PM To: Marvin Shigueiti Uehara Cc: Alastair Stark; Barbara Sullivan; Stephen Bell; POLSIS RHD ENQUIRY; Christian Reus-Smit Subject: Marvin Shigueiti UEHARA - Outcome of Ethical Clearance Application Dear Marvin, I am writing to inform you that your application for Ethical Clearance has been approved for your research project “Individual Risk Perception and Flood Mitigation: An Empirical Study of Hazard Adjustments in Australia”. I wish you well with your project. Kind regards Prof. Christian Reus-Smit Chair of Research Committee School of Political Science and International Studies By way of Vanessa Muriwai Vanessa Salam Research Higher Degree Administrative Officer | School of Political Science & International Studies The University of Queensland | St Lucia Queensland 4072 telephone +61 7 3365 3043 | fax +61 7 3365 1388 email [email protected] | web www.polsis.uq.edu.au/ CRICOS 0025B
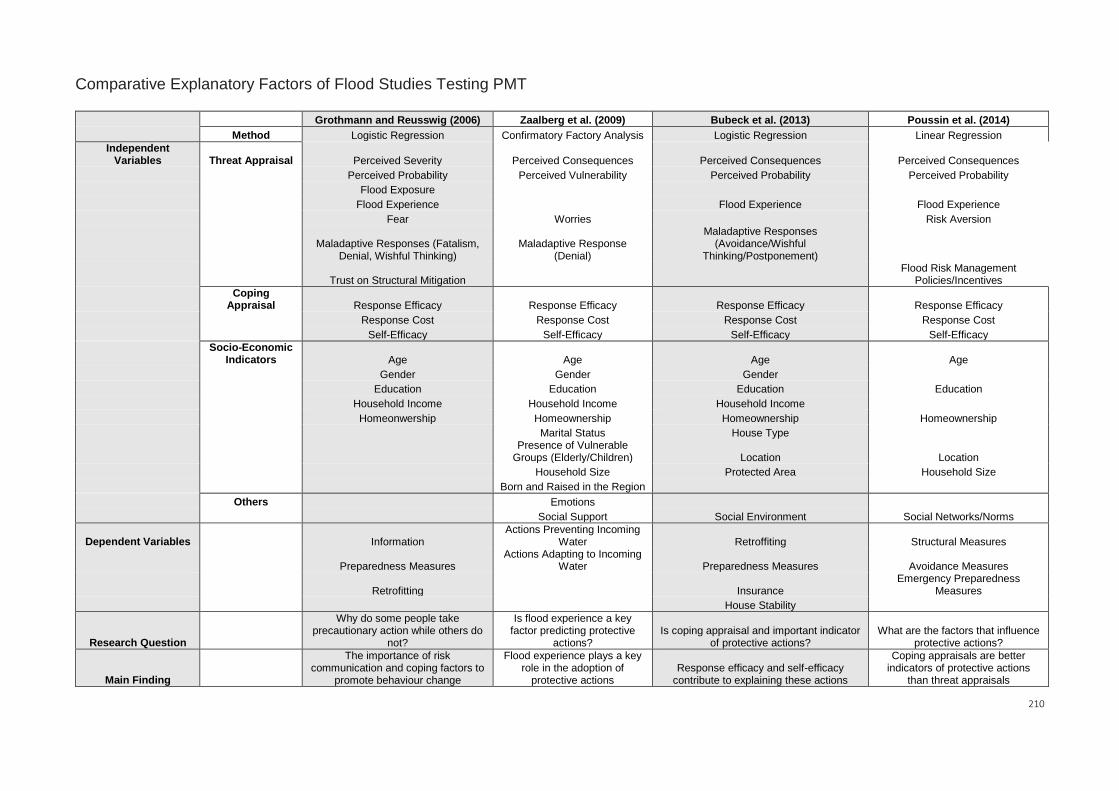
210
Comparative Explanatory Factors of Flood Studies Testing PMT
Grothmann and Reusswig (2006) Zaalberg et al. (2009) Bubeck et al. (2013) Poussin et al. (2014)
Method Logistic Regression Confirmatory Factory Analysis Logistic Regression Linear Regression
Independent Variables Threat Appraisal Perceived Severity Perceived Consequences Perceived Consequences Perceived Consequences
Perceived Probability Perceived Vulnerability Perceived Probability Perceived Probability
Flood Exposure
Flood Experience Flood Experience Flood Experience
Fear Worries Risk Aversion
Maladaptive Responses (Fatalism, Denial, Wishful Thinking)
Maladaptive Response (Denial)
Maladaptive Responses (Avoidance/Wishful
Thinking/Postponement)
Trust on Structural Mitigation
Flood Risk Management Policies/Incentives
Coping Appraisal Response Efficacy Response Efficacy Response Efficacy Response Efficacy
Response Cost Response Cost Response Cost Response Cost
Self-Efficacy Self-Efficacy Self-Efficacy Self-Efficacy
Socio-Economic Indicators Age Age Age Age
Gender Gender Gender
Education Education Education Education
Household Income Household Income Household Income
Homeonwership Homeownership Homeownership Homeownership
Marital Status House Type
Presence of Vulnerable Groups (Elderly/Children) Location Location
Household Size Protected Area Household Size
Born and Raised in the Region
Others Emotions
Social Support Social Environment Social Networks/Norms
Dependent Variables Information Actions Preventing Incoming
Water Retroffiting Structural Measures
Preparedness Measures Actions Adapting to Incoming
Water Preparedness Measures Avoidance Measures
Retrofitting Insurance Emergency Preparedness
Measures
House Stability
Research Question
Why do some people take precautionary action while others do
not?
Is flood experience a key factor predicting protective
actions? Is coping appraisal and important indicator
of protective actions? What are the factors that influence
protective actions?
Main Finding
The importance of risk communication and coping factors to
promote behaviour change
Flood experience plays a key role in the adoption of
protective actions Response efficacy and self-efficacy
contribute to explaining these actions
Coping appraisals are better indicators of protective actions
than threat appraisals

211
Cross-Correlation between the Cost of Insurance and Cost Benefit Analysis
Correlations
INSURANCE_COST MALADAPTIVE_COST_BENEFIT
INSURANCE_COST Pearson Correlation 1 .231**
Sig. (2-tailed) .000
N 395 361
MALADAPTIVE_COST_BENEFIT Pearson Correlation .231** 1
Sig. (2-tailed) .000
N 361 406
**. Correlation is significant at the 0.01 level (2-tailed).