indonesia - home · financial inclusion insights by …finclusion.org/uploads/file/reports/indonesia...
TRANSCRIPT

INDONESIA
June 2017
WAVE 3 REPORTFII TRACKER SURVEYConducted September – November 2016
Market in Dieng Plateau (Indonesia 2009) by Paul Arps (CC BY 2.0)

PUTTING THE USER FRONT AND CENTER
2
INDONESIA
The Financial Inclusion Insights (FII) program responds to the need identified by multiple stakeholders for timely demand-side data and practical insights into digital financial services (DFS), including mobile money, and the potential for their expanded use among the poor.
The FII team implements nationally representative population surveys and qualitative research studies in Bangladesh, India, Indonesia, Kenya, Nigeria, Pakistan, Tanzania and Uganda to:
• Track access to and demand for financial services, especially DFS;
• Measure adoption and use of DFS among key underserved groups (females, poor, rural, etc.);
• Identify drivers and barriers to further adoption of DFS;
• Evaluate the agent experience and the performance of mobile money agents; and
• Produce actionable, forward-looking insights based on rigorous data to support product and service development and delivery.
The FII program is managed by InterMedia. Visit the FII Resource Center to learn more: www.finclusion.org.

CONTENTS
3
Executive Summary 4
Customer Journey 12
Preconditions 17
Access & Trial 26
Registration 32
Active Use 37
Advanced Active Use 41
Special Topic: Financial Lives 44
Key Indicators Summary 49
Methodology & Research Description 51
Glossary 53
INDONESIA

EXECUTIVE SUMMARY
4
INDONESIA

What is financial inclusion?
Financial inclusion means that individuals and businesses have access to useful and affordable financial products and services that meet their needs – transactions, payments, savings, credit, and insurance – delivered in a responsible and sustainable way (The World Bank). Financially included individuals are those who have an account in their name with a full-service financial institution.
How is it measured?
We measure financial inclusion as the percentage of adults (15+ years old) who report having at least one account in their name with an institution that offers a full suite of financial services, and comes under some form of government regulation.
How is it created?
Financial inclusion is created through the uptake and use of individual accounts with institutions that offer a full suite of financial services – savings, credit, moneytransfers, insurance, and investment. Full-service financial institutions include banks, mobile money service providers, and nonbank financial institutions (NBFIs), such as deposit-taking microfinance institutions (MFIs) and financial cooperatives.
What institutions and services do not count?
Individuals who own accounts with institutions that are not full service, such as credit-only MFIs, are not considered financially included. Individuals who do not have their own full-service account or use someone else’s account are not considered financially included. Individuals who only use services, such as money guards, savings collectors, and digital recharge cards that are not attached to a bank or MFI account are also considered financially excluded.
UNDERSTANDING FINANCIAL INCLUSION
INDONESIA– EXECUTIVE SUMMARY
5

Adult population(15+)
Adult population (15+)
Gender Age
Male 50% 15-24 24%
Female 50% 25-34 24%
Geography 35-44 21%
Urban 51% 45-54 15%
Rural 49% 55+ 16%
Income Aptitude
Above the $2.50/day poverty line 38% Basic literacy 83%
Below the $2.50/day poverty line 62% Basic numeracy 99%
SURVEY DEMOGRAPHICS
6Source: InterMedia Indonesia FII Tracker survey Wave 3 (N=6,060, 15+), September-November 2016.
INDONESIA – EXECUTIVE SUMMARY

• Indonesia’s large and diverse population, economic dependence on oil and gas exports, and island geography raise opportunities and challenges for inclusion. Indonesia’s economy has experienced steady growth over the last four years. However, more than half of the population (more than 250 million people) continues to live on less than $2.50 a day, according to World Bank data.
• Cash is the preferred transaction mode, and the underbanked rely heavily on informal and non-full service institutions. Cash is accepted by most traditional merchants in Indonesia. Therefore, adults, particularly those living below the poverty line and in rural areas, typically access loans in cash from friends and relatives, and save in small amounts at home. Many rely on informal rotating savings groups, such as arisans.
• While mobile money continues to be in a nascent stage, digital financial services (DFS) providers view the Indonesian market as having high potential, particularly given the large number of bankable people, geographic conditions, mobile phone ownership levels, government-to-person (G2P) money flows, and a growing demand for digital payments.
o The remittance market is particularly ripe for disruption. Migrant workers sent billions home, often through expensive Western Union transfers and risky account mediators (holders of bank accounts who serve as intermediaries for a fee). The high cost and risk of existing options create an opening for growth in services for sending money more easily, reliably, and cheaply.
o Mobile money and DFS growth will depend on a more favorable regulatory landscape, effective customer outreach, expanding merchant acceptance, and growing the cash in/cash out point-of-service network.
Regulatory Environment
• The Indonesian government supports financial inclusion and financial technology growth. Following new microfinance and branchless banking regulations in 2015, the government announced a National Strategy for Financial Inclusion (SNKI) in November 2016. Among other objectives, the SNKI has set a goal to expand bank account ownership to 75 percent of the adult population by 2019.
o President Jokowi has emphasized strategies to incorporate G2P digital payment capabilities for items such as social assistance payments, transportation, food and bills.
o Achieving SNKI’s objectives to expand financial inclusion to the broad population may be complicated by the concentration of bank account ownership in specific demographic groups, including men, urban residents, and households with incomes above the poverty line.
• Signaling its support for the expansion of DFS through financial technology (fintech), in October 2016, the OJK announced that more progressive financial technology regulations were under development.
o The regulations are intended to consolidate regulatory authority and include creating an environment that actively encourages the expansion of financial technology by establishing a “regulatory sandbox” that enables companies to test new products without complying with existing regulations.
COUNTRY CONTEXT
7
INDONESIA – EXECUTIVE SUMMARY

• Banks remained a powerful driver of Indonesian financial inclusion. In 2016, almost one in three Indonesian adults (30 percent) reported having ever used a bank and 93 percent of Indonesian adults who registered full-service accounts held a bank account.
o Of those who had ever used a bank, 81 percent held an account. Further, almost all full-service bank account holders were active users (94 percent).
o Bank account ownership rose among women, residents of rural areas, and those below the poverty line at a rate that outpaced their counterparts.
• Less than 1 percent of Indonesian adults have ever used mobile money. Awareness of mobile money services, while low, did rise from 8 percent in 2015 to 15 percent of adults in 2016.
o Accommodating merchant acceptance of both cash and e-payments, and efforts to replicate the success of e-wallets could help drive more robust adoption.
o Bridging the gap between awareness and use requires skill building – consumers with greater mobile phone proficiency were more likely to have mobile money accounts and to be financially included.
o Twenty-six percent of those who were aware of mobile money said they did not save with mobile money because they did not know how to open an account.
• Arisans, or rotating savings groups, appeared to be the preferred financial services provider for the unbanked or otherwise underserved members of society (women, those living in rural areas, or those living below the poverty line). However, because arisans are not full service they are not included in the FII inclusion figures.
o Twenty-two percent of Indonesian adults had used an arisan and 11 percent had used a microfinance institution (MFI).
NOTABLE STATISTICS
8
INDONESIA – EXECUTIVE SUMMARY
Source: InterMedia Indonesia FII Tracker survey Wave 3 (N=6,060, 15+), September-November 2016.
34%Financially
included
3% have a full-
service NBFI account
24% have a full-
service bank account
0.7% have a
registered mobile money account
26% Financially included
*Overlap representing those who have multiple kinds of financial accounts is not shown.
2016: Financial Inclusion*(Shown: Percentage of Indonesian adults, N=6,060)

FINANCIAL AND DIGITAL INCLUSION
9Source: InterMedia Indonesia FII Tracker survey Wave 3 (N=6,060, 15+), September-November 2016.
.
INDONESIA – EXECUTIVE SUMMARY
*Percentage of Indonesian adults, (N=6,060)
• Banks were the primary means of inclusion in 2016. Almost one in four Indonesian adults had registered full-service bank accounts. However, both mobile money and nonbank financial institution (NBFI) full-service account registration remained low as many Indonesians used informal or non-full-service institutions, including 24% of adults who used informal savings groups.
• The majority of financially included adults have digital access to their accounts. Digital inclusion is driven by bank account registration.
• Full-service registered NBFI accounts were not digital: Less than 1% of Indonesians held a full-service NBFI account with digital features.
26
Digitally included through a mobile money account
22
.7
21
Digitally included through a full-service bank account
Digitally included through a full-service NBFI account.9
Financially Included* Digitally Included*
Have a registered mobile money account
.7
Have a full-service bank account
24
Have a full-service NBFI account3
Types of account ownership are not mutually exclusive.

ACCESS AND REGISTRATION AT A GLANCE
10Source: InterMedia Indonesia FII Tracker surveys Wave 1 (N=6,000, 15+), August-November 2014; Wave 2 (N=6,060, 15+), August-November 2015; Wave 3 (N=6,060, 15+), September-November 2016.
.
• In 2016, 34% of Indonesians had access to some form of full-service financial account, and 26% had a registered account.
• The proportion of the adult population that holds a registered bank account increased by only 1 percentage point from 2015 to 2016. The larger, 4-percentage-point increase from 2014 to 2016 is statistically significant.
• Most Indonesians remain unaware of mobile money and very few have ever accessed any mobile money service. Banks are viewed more positively than mobile money in terms of convenience, reliability, and user control by those that are aware of both services.
INDONESIA – EXECUTIVE SUMMARY
4
20
0.1
23
3
23
0.3
24
3
24
0.7
26
Nonbank financialinstitution
Bank Mobile money NBFI, bank, and/ormobile money
4
26
0.1
28
7
27
0.4
31
9
30
0.9
34
Nonbank financialinstitution
Bank Mobile money NBFI, bank, and/ormobile money
Account access/trial(Shown: Percentage of Indonesian adults for each year)
Registered users(Shown: Percentage of Indonesian adults for each year)
2016 (N=6,060)2015 (N=6,060)2014 (N=6,000)

ACTIVE USE AND ADVANCED USE AT A GLANCE
11
• Financially included Indonesians are active users of their accounts. The size of the active user population increased significantly from 2014 to 2016.
• The percentage of active users who had ever used an advanced service declined as the growth in active bank account users was not matched by the uptake of advanced services.
INDONESIA – EXECUTIVE SUMMARY
Source: InterMedia Indonesia FII Tracker surveys Wave 1 (N=6,000, 15+), August-November 2014; Wave 2 (N=6,060, 15+), August-November 2015; Wave 3 (N=6,060, 15+), September-November 2016.
.
2016 (N=6,060)2015 (N=6,060)2014 (N=6,000)
3
19
0.1
21
2
22
0.2
23
3
23
0.4
24
Nonbank financialinstitution
Bank Mobile money NBFI, bank, and/ormobile money
2
12
0.1
14
2
17
0.2
18
2
15
0.2
16
Nonbank financialinstitution
Bank Mobile money NBFI, bank and/ormobile money
Advanced active registered users(Shown: Percent of Indonesian adults for each year)
Active registered users(Shown: Percent of Indonesian adults for each year)

CUSTOMER JOURNEY
12
PRECONDITIONS ACCESS & TRIAL REGISTRATION ACTIVE USE ADVANCED ACTIVE USE
INDONESIA

• Financial inclusion may be conceived as a process through which an individual’s needs are met by advancing step-by-step toward increasingly active engagement with a growing range of financial services.
• Understanding how different demographic groups advance on the customer journey is useful for developing strategies and interventions to assist more individuals with becoming users of the financial services that meet their needs.
• Five major stages in the customer journey are described in the figure below. The registration stage is where the FII program counts an individual as financially included, but the journey begins before, and extends after, registration.
CUSTOMER JOURNEY
13
INDONESIA – CUSTOMER JOURNEY
PRECONDITIONS ACCESS & TRIAL REGISTRATION ACTIVE USE ADVANCED ACTIVE USE
Preconditions are the set of skills and resources necessary to progress on the customer journey for a specific type of financial account. Differentpreconditions are required to start the customer journey fordifferent types of financial accounts.
Access & trial is the use of a full-service bank or NBFI account, or a mobile money account, registered in the individual’s name or in someone else’s name, including over-the-counter transactions completed via mobile money agents.
Registration of a full-service bank, mobile money, or NBFI account is the point in the customer journey where individuals are counted as financially included.
Active use means that an individual has used his/her registered account to transfer money, save, or borrow within the previous 90 days.
Advanced active use includes saving, borrowing, bill payment, merchant payment, receiving wages, and/or receiving government payments using a financial account registered in the user’s name within the previous 90 days.

Source: InterMedia Indonesia FII Tracker survey Wave 3 (N=6,060, 15+), September-November 2016.
.
Mobile Money
Banks
ACCESS & TRIAL REGISTRATION ACTIVE USE ADVANCED ACTIVE USE
.9% .7% .4% .2%
30% 24% 23% 15%
NBFIs 9% 3% 3% 2%
PATHWAYS TOWARD FINANCIAL INCLUSION
14
INDONESIA – CUSTOMER JOURNEY
(Percentage of Indonesian adults, N=6,060)
• Over four in 10 Indonesians had access to full-service financial accounts, mainly through banks. Mobile money and NBFI use are still very low among Indonesians.
• While bank access most often resulted in full-service account registration (81%) and subsequent active use of these accounts, some Indonesians fell off the customer journey at the advanced active use stage because of their lack of need or lack of availability of advanced services.

THE BANKING CUSTOMER JOURNEY
15
INDONESIA – CUSTOMER JOURNEY
• In 2016, most Indonesians who accessed a bank account used an account registered in their name. Almost all (96%) of those who registered a full-service bank account used their accounts actively.
• Only 65% of active users progressed to advanced use. There is thus an opportunity to expand the uptake of advanced financial services, such as bill pay.
• Bank users were disproportionately male, urban, and above the $2.50 /day poverty line. Nonbank users tend to be involved in informal savings groups more often than they are involved in formal financial institutions.
ACCESS & TRIAL 30%** REGISTRATION 24%** ACTIVE USE 23%**ADVANCED
ACTIVE USE 15%**
80%* 96%* 65%*
2016: Conversion rate for each step in the banking customer journey(Shown: Percentage of Indonesian adults)
**Proportion of the total population at each stage in the journey*Proportion that progressed to the next stage in the journey
Source: InterMedia Indonesia FII Tracker survey Wave 3 (N=6,060, 15+), September-November 2016.
.

THE NBFI CUSTOMER JOURNEY
16
INDONESIA – CUSTOMER JOURNEY
2016: Conversion rate for each step in the NBFI customer journey (Shown: Percentage of Indonesian adults)
• A small percentage of Indonesians use an array of full-service nonbank financial institutions (NBFIs), including pawnshops, cooperatives, Post Office Banks, and microfinance institutions (MFIs). MFIs are present in rural and remote areas, and are one of the very few options for financial services, but the cost of using their services tends to be high.
• While 9% of Indonesians had ever used NBFIs, only 3% of all adults (or 33% of those with access) actually registered with a full-service NBFI. Of registered NBFI users, almost all used the account actively, but only 67% of the registered active users used advanced functions.
ACCESS & TRIAL 9%** REGISTRATION 3%** ACTIVE USE 3%**ADVANCED
ACTIVE USE 2%**
33%* 100%* 67%*
**Proportion of the total population at each stage in the journey*Proportion that progressed to the next stage in the journey
Source: InterMedia Indonesia FII Tracker survey Wave 3 (N=6,060, 15+), September-November 2016.
.

PRECONDITIONS ACCESS & TRIAL REGISTRATION ACTIVE USE ADVANCED ACTIVE USE
PRECONDITIONS
17
INDONESIA

PRECONDITIONS FOR FINANCIAL INCLUSION
18
INDONESIA – PRECONDITIONS
• Certain resources and skills are preconditions for advancing on the customer journey.
• While some of the following preconditions are necessary to access a financial account, others are not strictly necessary, but enable a consumer to register a financial account and use it in a meaningful manner to reap the benefits of financial inclusion.
Source: InterMedia Indonesia FII Tracker survey Wave 3 (N=6,060, 15+), September-November 2016.
.
Resources Knowledge and skills
Having the necessary ID
Mobile phone access
SIM card ownership
Geographical access
Financial literacy
Numeracy
Ability to send/receive text
Preconditions for financial
inclusion
Mobile money awareness

PRECONDITIONS: KEY INDICATOR TRENDS
19
INDONESIA – PRECONDITIONS
2016: Key indicators of preparedness for digital financial services (Shown: Percentage of Indonesian adults, N=6,060)
99%
Have basic numeracy
98%
Have the necessary ID*
2015 99% 79% 62% 8% NA% 98% 69%
2014 99% 76% 63% 6% NA% 96% 68%
15%
Mobile money awareness
14%
Financial literacy
66%
Own a SIM card
80%
Mobile phone access
68%
Ability to send or receive a text
*Identification documents (ID) necessary for registering a mobile money or a bank account include one of the following: a national ID, passport, voter’s card, driver’s license, company or government ID, birth certificate or school ID.
• While almost all adults had the necessary ID and basic numeracy skills, and eight in 10 had access to a mobile phone, other components of DFS readiness held at lower levels. Fourteen percent of the population displayed financial literacy. Despite steadily increasing from 2014, only 15% of adults were aware of mobile money in 2016.
• Other key preconditions for digital financial services use -- the ability to send or receive text messages and SIM card ownership -- held steady in 2016. One-third of the population lacks these key preconditions, limiting the market potential for DFS.
Source: InterMedia Indonesia FII Tracker surveys Wave 1 (N=6,000, 15+), August-November 2014; Wave 2 (N=6,060, 15+), August-November 2015; Wave 3 (N=6,060, 15+), September-November 2016.
Future mobile money users?The large majority of youths (ages 15 to 24) meet the key preconditions for mobile money use: 86% are able to
text and 81% own phones. However, only 12% were aware of mobile
money.

FINANCIAL LITERACY AND NUMERACY
20
INDONESIA – PRECONDITIONS
15 13 1712 16 13
99 98 100 98 99 99
Urban (n=3210) Rural (n=2850) Above poverty(n=2395)
Below poverty (n=3665) Male (n=2334) Female (n=3726)
Financial literacy Numeracy
20% of the financially
included population is
financially literate
2016: Numeracy and financial literacy, by demographic(Shown: Percentage of financial literacy by demographic)
• Financial literacy is relatively low across all demographics in Indonesia. Those above the poverty line and men tend to have the highest levels, while women and those below the poverty line tend to have the lowest levels.
• Notably, nearly all of Indonesian adults, across all demographics, have numeracy skills. Numeracy enables the use of financial services, but financial literacy reduces the risk of misuse.
Source: InterMedia Indonesia FII Tracker survey Wave 3 (N=6,060, 15+), September-November 2016.
New to the FII survey in 2016,
the financial literacy indicator
uses a combination of survey
items that measure basic
knowledge of four fundamental
concepts in financial decision-
making (interest rates, interest
compounding, inflation, and risk
diversification) following the
Standard and Poor’s Rating
Service’s Global Financial
Literacy Survey methodology.

MOBILE PHONE RELATED PRECONDITIONS BY GENDER
21
INDONESIA – PRECONDITIONS
5% gap 82% of men vs. 77% of women
accessed a phone
7974
8176
82 77
Men Women
Mobile phone access
69
56
69
55
73
59
Men Women
SIM card ownership
14% gap73% of men vs. 59% of women owned
a SIM card
7264
74
6573
63
Men Women
Ability to send or receive texts
10% gap73% of men vs. 63% of women
had sent a text message
• Men had greater access to mobile phones, more frequently owned SIM cards, and more often had the ability to send or receive text messages compared to women. Closing these gender gaps on the key preconditions for the use of digital financial servicesis necessary to promote broad-based user growth and empower women to control their own finances.
Source: InterMedia Indonesia FII Tracker surveys Wave 1 (N=6,000, 15+), August-November 2014; Wave 2 (N=6,060, 15+), August-November 2015; Wave 3 (N=6,060, 15+), September-November 2016.
2016 (N=6,060)2015 (N=6,060)2014 (N=6,000)
(Shown: Percentage of Indonesian adults, by gender, men: n=3,023, women: n=3,037)

ADVANCED PHONE USAGE
22
INDONESIA – ACCESS/TRIAL
• Forty-three percent of phone owners had a smartphone. Urban phone owners were much more likely to have a smartphone than rural phone owners.
• Only 5% of Indonesian phone users had ever made a financial transaction on their phone. Other kinds of advanced phone usage such as social media and internet browsing are more common and indicate potential for mobile money uptake.
• Advanced phone usage is lowest for those below the poverty line, older populations, and rural residents.
2016: Ability of phone users to use advanced functions(Shown: Percentage of Indonesian adults with phone access, N=4,576)
51
28
50
33
67
51
33
20
Urban
Rural
Above poverty line
Below poverty line
15-24
25-34
35-44
45-54
2016: Advanced phone usage by demographic group(Shown: Percentage of Indonesian adults in each category)
Source: InterMedia Indonesia FII Tracker survey Wave 3 (N=6,060, 15+), September-November 2016. 34
15
28
5
17
35
42
36
21
Used/Browsed the internet
Sent/Received photo messages
Downloaded music, video, or games
Made a financial transaction
Used "Call Tunes" or other audio/video on-demand from operator services
Used Facebook, WhatsApp, Twitter, Instagram oranother social networking site
Took a color picture
Used the touch screen
Downloaded/used any other mobile application

71
34
57
31
39
48
1214 17
5 8
3328
9
20
913
5 7
25 23
4
17
6
36
8679
11 11
39
51
Any POS Retail store with over-the-counter MM kiosk
MM agent Banking agent Bank branch ATM Informal saving/lendinggroup
BPR
Less than 1 km from home 1-5 km from home More than 5 km from home Don't know
GEOGRAPHICAL ACCESS
23
2016: Proximity to points-of-service (POS) for financial institutions(Shown: Percentage of Indonesian adults, N=6,060)
More than half of adults know of a retail store offering OTC services within 5 km,
few know of a MM or banking agent within that distance.
Approximately half of all adults know of a lending group within 1 km and 39%
know of an ATM within 1 km.
85% of adults live within 5 km of a POS.
Of these, only
38% use mobile money, a bank or an NBFI.
INDONESIA – PRECONDITIONS
Source: InterMedia Indonesia FII Tracker survey Wave 3 (N=6,060, 15+), September-November 2016.
• Twenty-one percent of those who needed credit but could not access it said it was because they did not know of an access point. Awareness of point-of-service locations, particularly of mobile money agents’ locations, is low.
• A significant percentage of Indonesians know that a financial institution is within walking distance of them, however, proximity does not impact financial inclusion figures because many of these access points are informal or not full-service in nature.

AWARENESS OF MOBILE MONEY
24
INDONESIA – PRECONDITIONS
• While still low compared to other countries, awareness of mobile money increased significantly versus 2015 across all demographic segments, and men and women showed equal rates of awareness. Awareness was lowest among the rural and below-poverty-line segments of the population.
• The increase in awareness compared to 2015 shows that conditions are becoming more favorable for the adoption of mobile money.
6 6 6
8
3
10
3
89
8
13
3
14
4
1516
15
22
8
21
12
Total population Male Female Urban Rural Above poverty line Below poverty line
Source: InterMedia Indonesia FII Tracker surveys Wave 1 (N=6,000, 15+), August-November 2014; Wave 2 (N=6,060, 15+), August-November 2015; Wave 3 (N=6,060, 15+), September-November 2016.
Awareness of mobile money providers by demographic group
85%were unaware of mobile money in 2016. Of
these (n=5,292),
53%live in rural areas
14%lack basic literacy
24%have no access to a phone
2016 (N=6,060)2015 (N=6,060)2014 (N=6,000)

OTHER DIGITAL PRODUCTS OUTPACE MOBILE MONEY
25
INDONESIA – PRECONDITIONS
*These products are not included in the financial inclusion rate calculation.** Brizzi is a digital payment recharge card and Doku is an online/offline wallet system.
Digital or mobile-based financial products that are not mobile money, including nonbank e-money issuers such as mobile network operators, payment providers (e.g., Brizzi, XENDIT, AyoPay, or Doku**), financial planning companies (e.g., jojonomics), and digital financial management and online comparison sites (e.g., Cermati, Barkesa) outperform mobile money in awareness and registered account ownership, showing some traction for digital financial products.
16%
2016: Awareness of digital or mobile-based financial products that are not mobile money
(Shown: Percentage of Indonesian adults, N=6,060)
2016: Registered accounts for digital or mobile-based financial products that are not mobile money(Shown: Percentage of Indonesian adults, N=6,060)
4%
Source: InterMedia Indonesia FII Tracker survey Wave 3 (N=6,060, 15+), September-November 2016.
ACCESS & TRIAL
INDONESIA
26
PRECONDITIONSACCESS &
TRIALREGISTRATION ACTIVE USE
ADVANCED ACTIVE USE

ACCESS AND TRIAL OF FINANCIAL SERVICESINDONESIA – ACCESS & TRIAL
Source: InterMedia Indonesia FII Tracker surveys Wave 1 (N=6,000, 15+), August-November 2014; Wave 2 (N=6,060, 15+), August-November 2015; Wave 3 (N=6,060, 15+), September-November 2016.
4
26
0.1
28
7
27
0.4
31
9
30
0.9
34
Nonbank financialinstitution
Bank Mobile money NBFI, bank, and/ormobile money
2014 (N=6,000) 2015 (N=6,060) 2016 (N=6,060)
Access to financial services(Shown: Percentage of Indonesian adults for each year)
• Access to full-service financial accounts continued to steadily improve, driven by the growing use of banks and NBFIs.
• The proportion of the population who had their own mobile money account or used someone else’s account remained very small, but nevertheless doubled year-over-year.
1 in 10 Indonesians had ever used full-service
NBFI accounts

9%
30%
61
34%
NBFI
Bank
Mobile money
Total
.9%
ACCESS TO FINANCIAL SERVICES
28
INDONESIA – ACCESS & TRIAL
Rural(n=2,940)
26%
.7%
33%
.7%
25%
.5%
21%
8%
29%
9%
20%
9%
Women(n=3,037)
Poor(n=3,779)
• Men, including those under 35, urban populations, and those above the poverty line were more likely to have ever used financial services. Access for women is nearly equal to access for men.
• Generally, rural populations that tend to be older and poorer face the biggest hurdles to access. For instance, 74% of those working in agriculture had never used formal financial services.
Source: InterMedia Indonesia FII Tracker survey Wave 3 (N=6,060, 15+), September-November 2016.
2016: Access to financial services, by demographics(Shown: Percentage of Indonesian adults in each group)
Despite low levels of access, only
5%of adults said that
they needed credit in the past year, but could not access it.
This finding indicates that
many borrowers are using informal
and non-full-service providers

OVER-THE-COUNTER (OTC) USE
29
INDONESIA – ACCESS & TRIAL
OTC users(Shown: Percentage of Indonesian adults for each year)
• OTC or unregistered use of mobile money was very low in Indonesia. Overall OTC use increased slightly, led by small gains in OTCbank and NBFI use, perhaps because these institutions expanded their person-to-person (P2P) offerings.
• OTC users were predominantly female, below the poverty line, and older than 35 years old, and spread equally across urban andrural locations.
2016: OTC users of any financial service, by demographic(Shown: Percentage of Indonesians adults who access any financial service over the counter, n=495)
Urban
Above $2.50/day poverty line
Rural
MenWomen
Below $2.50/day poverty line
62%
38%
38%
62%
51% 49%
56% 44%Younger than 35 years-old
Older than 35 years-old
5
0
0.8
5
7
0.1
4 4
8
0.3
5
6
OTC Any OTC MM OTC NBFI OTC Bank
Source: InterMedia Indonesia FII Tracker surveys Wave 1 (N=6,000, 15+), August-November 2014; Wave 2 (N=6,060, 15+), August-November 2015; Wave 3 (N=6,060, 15+), September-November 2016.
2016 (N=6,060)2015 (N=6,060)2014 (N=6,000)
ACCESS TO NON-FULL-SERVICE FINANCIAL INSTITUTIONS
30
INDONESIA – ACCESS & TRIAL
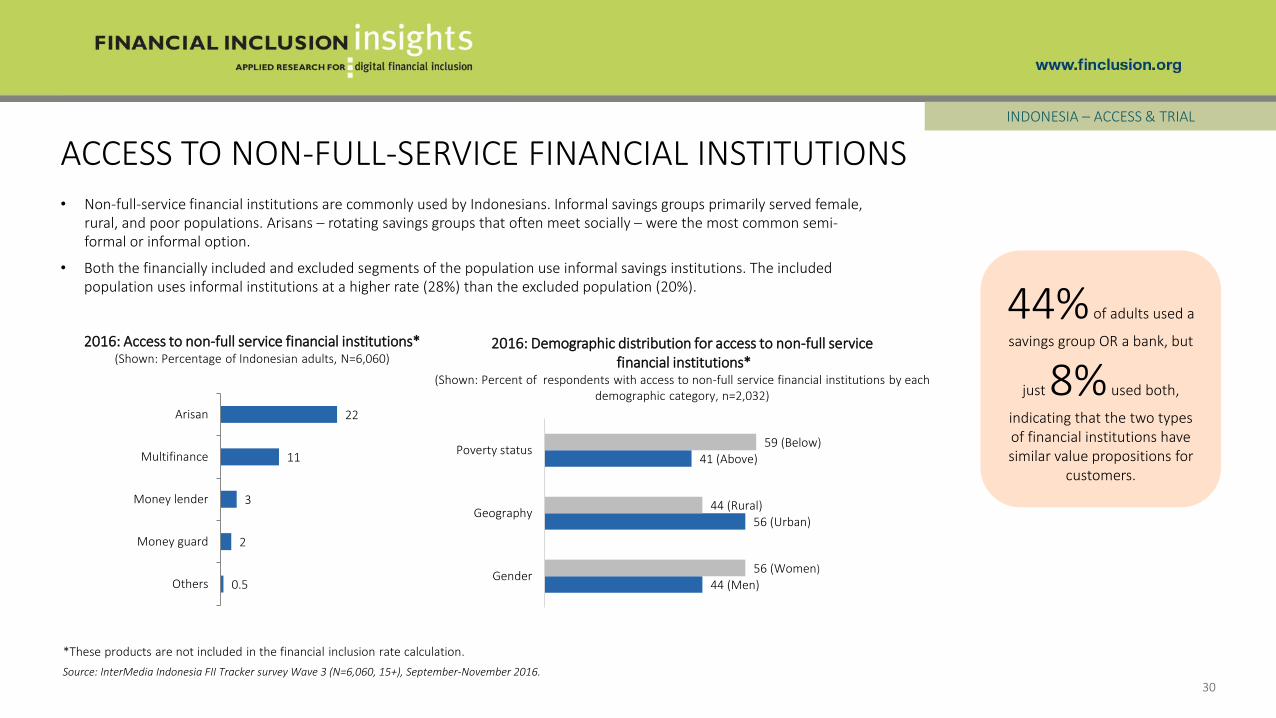
• Non-full-service financial institutions are commonly used by Indonesians. Informal savings groups primarily served female, rural, and poor populations. Arisans – rotating savings groups that often meet socially – were the most common semi-formal or informal option.
• Both the financially included and excluded segments of the population use informal savings institutions. The included population uses informal institutions at a higher rate (28%) than the excluded population (20%).
2016: Access to non-full service financial institutions*(Shown: Percentage of Indonesian adults, N=6,060)
0.5
2
3
11
22
Others
Money guard
Money lender
Multifinance
Arisan
2016: Demographic distribution for access to non-full servicefinancial institutions*
(Shown: Percent of respondents with access to non-full service financial institutions by each demographic category, n=2,032)
44 (Men)
56 (Urban)
41 (Above)
56 (Women)
44 (Rural)
59 (Below)
Gender
Geography
Poverty status
*These products are not included in the financial inclusion rate calculation.
Source: InterMedia Indonesia FII Tracker survey Wave 3 (N=6,060, 15+), September-November 2016.
44% of adults used a
savings group OR a bank, but
just 8% used both,
indicating that the two types of financial institutions have similar value propositions for
customers.

CONVERSION FROM MOBILE MONEY AWARENESS TO USE
31
INDONESIA – REGISTRATION
*Questions allowed for multiple responses. Not all responses shown.
2014 (n=305) 2015 (n=401) 2016 (n=729)
4
4
14
40
21
2
4
14
28
NA
2
8
12
27
I do not trust that my moneyis safe
I never have money to maketransactions with the service
I don't need (an account), Idon't make any transactions
I don't know what it is for
I do not know how to use theservice
Primary reasons for mobile money nonuse among MM aware individuals(Shown: Percentage of Indonesian adults who are aware, but do not use, MM by year)
Vs. 9% of those who did not register for bank accounts because they do
not know what a bank account is for
Vs. 34% of those who did not register for banks accounts
because they never have enough money to make transactions
Nonuse among those who are aware of mobile money may be due to individuals not perceiving mobile money’s value or misunderstanding the purpose of mobile money.
Mobile money is less trusted than cash
27% of adults who were aware
of mobile money said the main reason they do not use it to save is because they use other means.
66% saw cash as the best way
of guaranteeing how money was spent.
58% said cash was the best
option to access your money.
Source: InterMedia Indonesia FII Tracker surveys Wave 1 (N=6,000, 15+), August-November 2014; Wave 2 (N=6,060, 15+), August-November 2015; Wave 3 (N=6,060, 15+), September-November 2016.

REGISTRATION
32
PRECONDITIONS ACCESS & TRIAL REGISTRATION ACTIVE USE ADVANCED ACTIVE USE
INDONESIA

REGISTERED FINANCIAL ACCOUNT OWNERSHIP
33
INDONESIA – REGISTRATION
Rural
Below $2.50/day poverty line
Urban
Female
Male
Above $2.50/day poverty line
29%
18%
24%
40%
35%
17%
2016: Registered financial accounts owners by demographic(Shown: Percentage of Indonesian adults with registered financial accounts)
4
20
0.1
23
3
23
0.3
24
3
24
0.7
26
Nonbank financialinstitution
Bank Mobile money NBFI, bank, and/ormobile money
2014 (N=6,000) 2015 (N=6,060) 2016 (N=6,060)
Registered financial account owners(Shown: Percentage of Indonesian adults for each year)
Source: InterMedia Indonesia FII Tracker surveys Wave 1 (N=6,000, 15+), August-November 2014; Wave 2 (N=6,060, 15+), August-November 2015; Wave 3 (N=6,060, 15+), September-November 2016.
• The portion of the population that holds a registered bank account continued its slow but steady rise in 2016, driving the increase in financial inclusion nationally. Inclusion among women was 5 percentage points lower than among men.
• Bank access was a major determinant for registration: 81% of Indonesians who have ever used a bank have a registered full-service account. Forty-two percent of those who had accessed mobile money or an NBFI were registered account holders.

TOP REASONS FOR NOT REGISTERING ACCOUNTS
34
INDONESIA – REGISTRATION
2016: Reasons for not registering a bank account(Shown: Percentage of Indonesian adults who gave the following reasons for not having
a personal bank account, by gender)
2016: Reasons for not registering a mobile money account(Shown: Percentage of Indonesian adults who gave the following reasons for not using a
personal mobile money service, by gender)
2
6
5
15
22
38
1
3
4
13
21
43
No one among my friends or families usesthis service
I never have enough money to maketransactions
I do not trust that my money is safe on amobile money account
I do not need one, I do not make anytransactions
I do not know how to use the service
I do not understand this service; I do notknow what I can use it for
Men (N=171) Women (N=230)
Questions allowed for multiple responses
• Common reasons for not registering bank accounts included a perceived lack of funds or need, and not knowing how to open an account. Reasons were broadly similar across genders. Other findings indicate a sense that there were cheaper, better-suited informal alternatives, as well as perhaps a preference for group savings mechanisms.
• Educating consumers about finances could raise registration; those that did not register for bank accounts had lower levels of financial literacy. For mobile money, a lack of understanding about the service and how to open an account were the main reasons for not registering.
9
8
20
34
9
9
21
33
I do not know what it is
I do not know how to open one
I do not need one, I do not make anytransactions
I never have money to maketransactions with this service
Women (N=2,899) Men (N=1,611)
Source: InterMedia Indonesia FII Tracker survey Wave 3 (N=6,060, 15+), September-November 2016.

DEMOGRAPHICS OF NBFI ACCOUNT HOLDERS
35
INDONESIA – REGISTRATION
Female (n=3,726) Rural (n=2,850) Poor (n=3,665)
• Nonbank financial institution (NBFI) account holders are most often female, rural, and below the poverty line. The drop-off from NBFI use to registration of accounts may reflect a misalignment between full-service accounts and customer needs that makes NBFI registration unattractive compared to alternatives.
• Full-service NBFIs may be unable to attract unregistered customers away from informal institutions, and registered customers may be better served by banks that better meet their needs and/or are found in closer proximity.
Source: InterMedia Indonesia FII Tracker survey Wave 3 (N=6,060, 15+), September-November 2016.
0.4
2
0
1
0.4
2
0.2
2
0.2
2
0.1
1
Bank Perkreditan Rakyat(BPR)
Cooperatives Pawnshops Post Office Bank
3% of adults have NBFI registered accounts
2016: NBFI registered account holders, by demographic(Shown: Percentage of NBFI account holders, by demographic, N=6,060)
4 4
3
Female Rural Poor
2016: NBFI registered account holders, by NBFI category(Shown: Percentage of Indonesian adults, by demographic)

DEMOGRAPHIC DYNAMICS OF BANK ACCOUNT HOLDERSINDONESIA – REGISTRATION
Source: InterMedia Indonesia FII Tracker surveys Wave 1 (N=6,000, 15+), August-November 2014; Wave 2 (N=6,060, 15+), August-November 2015; Wave 3 (N=6,060, 15+), September-November 2016
• While, urban and above-poverty market segments showed the highest levels of financial inclusion, bank account ownership has slowly spread to more rural and low-income populations. In fact, registration growth in 2016 was greatest for female, poor, and rural market segments.
• This growth could be driven by state-owned banks, which followed the government’s financial inclusion imperatives, tend to be larger, better able to manage credit risk (a factor that remains a major concern for adding low-income customers), and have more expansive networks to access customers than smaller, cost-sensitive banks with lighter footprints.*
20
24
17
29
11
37
11
2326
20
33
13
39
13
2427
21
34
15
39
16
Total population Male Female Urban Rural Above povertyline
Below povertyline
2014 2015 2016
Demographic trends for registered bank account ownership (Shown: Percentage of Indonesian adults who fall into each category)
What about youth?(15-24 years old)
One in five young people held a registered full-service bank
account. They were more reliant on hiding cash at home or trusting
friends and family with savings. Low employment rates among the
youth likely hinder banks’ willingness to lend to them (only
30% of youths were employed and more than half were students).
*PWC Indonesia Banking Survey 2017. Retrieved from: http://www.pwc.com/id/en/publications/assets/financialservices/ibs-2017.pdf.
ACTIVE USE
37
PRECONDITIONS ACCESS & TRIAL REGISTRATION ACTIVE USE ADVANCED ACTIVE USE
INDONESIA

ACTIVE USE
38
3
19
0.1
21
2
22
0.2
23
3
23
0.4
24
Nonbank financialinstitution
Bank Mobile money NBFI, bank, and/ormobile money
2014 (N=6,000) 2015 (N=6,060) 2016 (N=6,060)
INDONESIA – ACTIVE USE
Active registered users(Shown: Percentage of Indonesian adults for each year) 24% of Indonesians actively
used a full-service account registered in their name, and
20% had digital access to
their registered accounts. Only
8% of bank, mobile money,
and/or NBFI account holders were inactive
• Once Indonesians registered for full-service accounts, they were typically active users.
• Active use grew incrementally in 2016 driven by small increases in the percentage of registered NBFI and bank account users who used their accounts in the 90 days before the survey.
Source: InterMedia Indonesia FII Tracker surveys Wave 1 (N=6,000, 15+), August-November 2014; Wave 2 (N=6,060, 15+), August-November 2015; Wave 3 (N=6,060, 15+), September-November 2016

CONVERSION FROM REGISTRATION TO ACTIVE USEINDONESIA – REGISTRATION
Source: InterMedia Indonesia FII Tracker surveys Wave 1 (N=6,000, 15+), August-November 2014; Wave 2 (N=6,060, 15+), August-November 2015; Wave 3 (N=6,060, 15+), September-November 2016.
• Indonesians were active users of their registered financial accounts; registration leads directly to active use for nearly all Indonesians, especially those served by banks.
• Ninety-four percent of bank account holders had used their accounts in the 90 days preceding the survey.
81
92
91
75
95
93
86
94
92
2016 2015 2014
Registered account holders(Shown: Percentage of Indonesian adults for each year)
4
20
0.1
23
3
23
0.3
24
3
24
0.7
26
Nonbank financial institution
Bank
Mobile money
Any financial service
of these
Active portion of registered account holders(Shown: Percentage of registered users for each type of account, by year)
Types of accounts are not mutually exclusive.
Sample size is to small to analyze for mobile money
39

40
INDONESIA – ACTIVE USE
*Statistically significant Pearson chi2 p<0.0001 for each demographic category and account status. Types of accounts are not mutually exclusive.
14
13
20
23
26
32
37
0.2
0.03
0.4
0.4
0.4
0.7
0.7
3
4
3
3
3
2
3
16
15
21
24
27
33
38
Below poverty line (n=3,665)*
Rural (n=2,850)*
Women (n=3,741)*
Total population (N=6,060)
Men (n=2,303)*
Urban (n=3,210)*
Above poverty line(n=2,395)*
Active bank account holders Active mobile money account holders Active NBFI account holders All active financial account holders
18 percentage
point urban/rural
gap
Largest gap in poverty
status(22
percentage points)
REGISTERED ACTIVE USE BY DEMOGRAPHIC
Source: InterMedia Indonesia FII Tracker survey Wave 3 (N=6,060, 15+), September-November 2016.
2016: Active account usage by demographic(Shown: Percentage of each subgroup)
• In Indonesia, active users were more likely to be urban, above poverty line and male.
• Large divides in active account usage persist across poverty status, geography and gender.

ADVANCED ACTIVE USE
41
PRECONDITIONS ACCESS & TRIAL REGISTRATION ACTIVE USE ADVANCED ACTIVE USE
INDONESIA

ADVANCED ACTIVE USE
42
INDONESIA – ADVANCED ACTIVE USE
2
12
0.1
14
2
17
0.2
18
2
15
0.2
16
Nonbank financialinstitution
Bank Mobile money NBFI, bank, and/ormobile money
2014 (N=6,000) 2015 (N=6,060) 2016 (N=6,060)
Advanced active registered users(Shown: Percentage of Indonesian adults for each year)
• While two-thirds of all active registered account holders used their accounts for advanced activities such as bill pay or wage deposits, only 16% of all Indonesians use their registered accounts at least monthly or more often for advanced activities.
• An uptick in fintech P2P payments alternatives may have contributed to the decline in bank-to-bank transfers in 2016 that led to slightly lower overall use by active bank account holders of advanced account features.
Source: InterMedia Indonesia FII Tracker surveys Wave 1 (N=6,000, 15+), August-November 2014; Wave 2 (N=6,060, 15+), August-November 2015; Wave 3 (N=6,060, 15+), September-November 2016
*Individuals who have used their accounts in the past 30 or 90 days for an advanced financial service
Thirty- and 90-day active users of advanced services*(Shown: Percentage of Indonesian adults for 2016)
30-day active use 90-day active use
13% Bank 14%

ADVANCED ACTIVE USE − BANKS
INDONESIA – ADVANCED ACTIVE USE
• Active bank users used their accounts more often for advanced activities than for basic activities, including P2P. Saving or setting aside money, and receiving wages were the most common advanced account uses. Slightly fewer active bank account holders used advanced activities compared to 2015; however, the majority still use their accounts for advanced activities.
• A sharp decline in bank-to-bank transfers from 2015 to 2016 contributed to the overall decline in advanced active use.
65% of active bank account
holders have used a bank account to
do advanced activities
2016: Advanced bank account uses(Shown: Percentage of active bank account holders, n=1,307)
2
2
3
3
4
7
19
30
42
Receive G2P payments
Bank-to-bank transfers
Pay for large acquisitions
Insurance activity
Pay for goods at a store
Loan activity
Bill pay
Receive wages
Save/set aside money
By comparison, bank-to-bank transfers were
conducted by 37 percent of active bank account
holders in 2015
Source: InterMedia Indonesia FII Tracker survey Wave 3 (N=6,060, 15+), September-November 2016.
3523
35
6577
65
2014 (N=1,100) 2015 (N=1,291) 2016 (N=1,307)
Basic activities only (CICO, account management, P2P) Advanced activities
2016: Active bank account holders – advanced and basic usage(Shown: Percentage of active bank account holders)

SPECIAL TOPIC: FINANCIAL LIVES
INDONESIA
44

SAVINGS BEHAVIORS
45
INDONESIA – FINANCIAL LIVES
Source: InterMedia Indonesia FII Tracker survey Wave 3 (N=6,060, 15+), September-November 2016.
• Thirty-five percent of Indonesians said their savings exceeded their debt and 60 percent had ever saved in their lives. Yet, these savings are not making it into formal full-service financial services.
• Thirty-four percent of adults said they ONLY saved with informal institutions, 15 percent only saved with formalinstitutions (11 percent said they had saved with both).
63
41
20
10
Cash at home
Bank
In-kind assets (e.g., gold)
Family and friends
2016: Where do Indonesians save money?(Shown: Percentage of Indonesian adults who have ever saved, n=3,620)
Almost 2x as many women as men save
through in kind assets, using their
gold jewelry.
89% of the
financially included have saved while
only 49% of
the financially excluded have
saved

• Indonesians in different demographic groups save for similar reasons at about the same rates. Savings were most often intended to cover regular expenses and for emergencies.
• The majority of Indonesians do not know the interest rate earned on their savings.
SAVINGS BEHAVIOR DEMOGRAPHICS
46
INDONESIA – FINANCIAL LIVES
35
47
71
60
31
12
23
34
45
65
73
25
1419
37
47
7266
28
11
20
Build children’s fund for education
Protect your family frompoverty and crime
In case of emergency Just to make ends meet Start/expand your ownbusiness
Build children's fund forwedding
Buy or build a house
Above poverty (who have saved) Extremely poor (who have saved) Poor (who have saved)
2016: Reasons to save by income level(Shown: Percentage of Indonesian adults who have saved, by income level)
Source: InterMedia Indonesia FII Tracker survey Wave 3 (N=6,060, 15+), September-November 2016.
Of adults who had ever saved,
27% knew the interest
rate they had earned.
47% of the financially
included population (those with registered full-service accounts) knew their interest rate.
Almost half of those who have
children enrolled in school must pay school fees

INFORMAL SAVINGS GROUPS
47
INDONESIA – FINANCIAL LIVES
• Informal savings groups are part of daily life for many Indonesians. Of those who participate in these informal groups, one in four said it was to socialize/meet friends.
• These groups are seen as “rainy day” funds and viewed as a trusted loan distribution system. Over one in three participants in a savings group said they periodically distribute all the money held by the group to their members (36 percent). One in four savings group members cited the opportunity to receive a lump sum as the most important reason to join a group.
• Informal savings groups were not driven by a lack of other options. Less than 1% said the most important reason to use such a savings group was because they could not get money anywhere else.
Source: InterMedia Indonesia FII Tracker survey Wave 3 (N=6,060, 15+), September-November 2016.
40% said to help one another with
unexpected expenses such as
funerals
21% said to help one another with loans and credit
(although only 3% cited this as the most important
reason to join one)
25% said to collect and take turns receiving a
lump sum periodically
23% did so to save and lend
money to members and/or non-members to
be repaid with interest
Examples of reasons for participating in an informal
savings group
BORROWING BEHAVIORS
48
INDONESIA – FINANCIAL LIVES
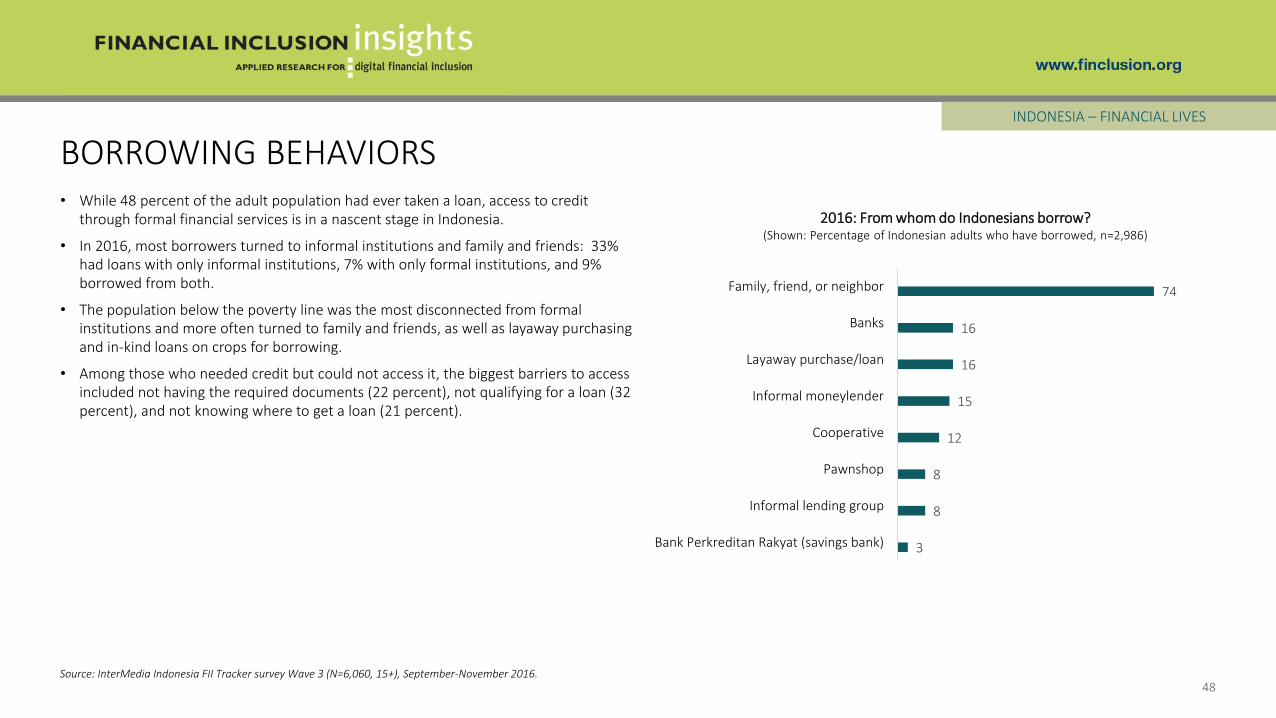
• While 48 percent of the adult population had ever taken a loan, access to credit through formal financial services is in a nascent stage in Indonesia.
• In 2016, most borrowers turned to informal institutions and family and friends: 33% had loans with only informal institutions, 7% with only formal institutions, and 9% borrowed from both.
• The population below the poverty line was the most disconnected from formal institutions and more often turned to family and friends, as well as layaway purchasing and in-kind loans on crops for borrowing.
• Among those who needed credit but could not access it, the biggest barriers to access included not having the required documents (22 percent), not qualifying for a loan (32 percent), and not knowing where to get a loan (21 percent).
Source: InterMedia Indonesia FII Tracker survey Wave 3 (N=6,060, 15+), September-November 2016.
3
8
8
12
15
16
16
74
Bank Perkreditan Rakyat (savings bank)
Informal lending group
Pawnshop
Cooperative
Informal moneylender
Layaway purchase/loan
Banks
Family, friend, or neighbor
2016: From whom do Indonesians borrow?(Shown: Percentage of Indonesian adults who have borrowed, n=2,986)
KEY INDICATORS SUMMARY
INDONESIA
49

50
Key IndicatorsYear Base
Definition2014 2015 2016
Adults who have active digital stored-value accounts18% 22% 20%
All adults (15+)6,000 6,060 6,060
Poor adults who have active digital stored-value accounts9% 12% 13% Adults (15+)
<$2.5/day3,761 3,598 3,665
Poor women who have active digital stored-value accounts7% 10% 10% Women (15+)
<$2.5/day2,269 2,178 2,236
Rural women who have active digital stored-value accounts 8% 10% 9%
Rural women (15+)1,712 1,716 1,754
Adults who have active digital stored-value accounts and used advanced financial services (beyond basic wallet & P2P)11% 17% 14%
All adults (15+)6,000 6,060 6,060
Poor adults who have active digital stored-value accounts and used advanced financial services (beyond basic wallet & P2P)
5% 8% 9% Adults (15+) <$2.5/day3,761 3,598 3,665
Poor women who have active digital stored-value accounts and used advanced financial services (beyond basic wallet & P2P)
3% 6% 6% Women (15+) <$2.5/day2,269 2,178 2,236
Rural women who have active digital stored-value accounts and used advanced financial services (beyond basic wallet & P2P)
4% 6% 5%Rural women (15+)
1,712 1,716 1,754
Digital stored-value accounts: accounts in which a monetary value is represented in a digital electronic format and can be retrieved/transferred by the account owner remotely. For this particular study, DSVAs include a bank account or NBFI account with digital access (a card, online access or a mobile phone application) and a mobile money account.
KEY INDICATORS SUMMARYINDONESIA
Source: InterMedia Indonesia FII Tracker surveys Wave 1 (N=6,000, 15+), August-November 2014; Wave 2 (N=6,060, 15+), August-November 2015; Wave 3 (N=6,060, 15+), September-November 2016.

METHODOLOGY & RESEARCH DESCRIPTION
51
INDONESIA

SURVEY SUMMARY
• Annual, nationally representative survey (N=6,060) of Indonesianadults aged 15+
• Face-to-face interviews lasting, on average, 91 minutes
• Third survey (Wave 3) conducted from 9/20/2016 to 11/30/2016
• Tracks trends and market developments in DFS based on the information gathered in the first survey, conducted in 2014, and the second survey, conducted in 2015
DATA COLLECTION
• Basic demographics and poverty measurement (Grameen Progress Out of Poverty Index)
• Access/use of mobile devices
• Access/use of mobile money
• Access/use of formal financial services (e.g., bank accounts)
• Access/use of semi-formal and informal financial services (e.g., microfinance institutions, cooperatives, village savings groups)
• Financial literacy and preparedness
• General financial behaviors
FII INDONESIA TRACKER SURVEY DETAILS
52
INDONESIA – METHODOLOGY & RESEARCH
Source: InterMedia Indonesia FII Tracker survey Wave 3 (N=6,060, 15+), September-November 2016.

Access to bank – Counts individuals who have a full-service bank account registered in their name or report use of a full-service bank account that belongs to someone else.
Access to mobile money or NBFI – Counts individuals who have ever used a mobile money service or a full-service NBFI account.
Active registered user – An individual who has an account registered in their name and has used it in the last 90 days.
Adults with DFS access – Adults (15+) who either own a DFS account or have access to someone else’s account
Advanced active registered user – An active registered user who has ever used at least one advanced financial service.
Advanced DFS use – Advanced use of digital financial services includes activities other than basic cash-in, cash-out and person-to-person transfers, such as savings, bill pay, investment, and insurance.
Basic use – The use of an account to cash-in (deposit) or cash-out (withdraw), transfer money to another individual, or conduct account maintenance.
Below the poverty line – In this particular study, adults living on less than $2.50 per day, as classified by the Grameen Foundation’s Progress out of Poverty Index.
Cooperative – Typically, a business or other professional organization that is owned and run jointly by its members, who share profits or benefits. Cooperatives may release some of the profits/funds as loans to its members.
Customer journey – An illustration of progressive stages through which consumers become more active users of more sophisticated financial services.
Credit-only nonbank financial institutions – Financial institutions that only disburse loans to their customers.
Digital financial services (DFS) – Financial services provided through an electronic platform (e.g., mobile phones, debit or credit electronic cards, internet).
Financial inclusion – Individuals who have an account with an institution that provides a full suite of financial services and comes under some form of government regulation. Services include savings, money transfers, insurance or investment. Institutions that only offer loans to consumers, such as some MFIs, are not considered to be full-service institutions.
Financial literacy – Basic knowledge of four fundamental concepts in financial decision-making (interest rates, interest compounding, inflation, and risk diversification) as measured by the Standard and Poor’s Rating Service’s Global Financial Literacy Survey.
Full-service financial institutions – Financial institutions that offer loans to their customers and at least one of the followingadditional services: savings, money transfers, insurance, or investments.
Grameen Progress out of Poverty Index (PPI) – A poverty measurement tool from the Grameen Foundation wherein a set of country-specific questions are used to compute the likelihood that a household is living below a specific income threshold.
Microfinance institution (MFI) – An organization that offers financial services to low-income populations. Almost all give loans to their members, and many offer insurance, deposit and other services.
Mobile money (MM) – A service in which a mobile phone is used to access financial services.
Nonbank financial institution (NBFI) – A financial organization that is not formally licensed as a bank or a mobile money provider, but whose activities are regulated, at least to some extent, by the central bank within the country. Such financial institutions include microfinance institutions (MFI), cooperatives, Post Office (Savings) Banks and savings and credit cooperatives (SACCOs).
Numeracy – The ability to use basic math skills, including counting, addition, division, multiplication and computing short-and long-term interest rates.
Post Office (Savings) Bank – A bank that offers savings and money transfers and has branches at local post offices.
Registered user – Counts individuals who have a financial account registered in their name
Savings and credit cooperative (SACCO) – A unique member-driven, self-help group owned and managed by its members, who have a common bond. Its main purpose is to build up funds through regular contributions by each member, with the aim of providing affordable credit and collective investments for its members.
Unregistered/over-the-counter (OTC) user – An individual who has used DFS through someone else’s account, including a mobile money agent’s account or the account of a family member or a neighbor.
Urban/rural – Urban and rural persons are defined according to their residence in urban or rural areas as prescribed by the national bureau of statistics.
GLOSSARY
53
INDONESIA

For more information, contact:
Nadia van de Walle, Senior Research Manager [email protected]
Samuel Schueth, Director of Research [email protected]