indonesia’s power sector: clean coal policy...
TRANSCRIPT
March 2011
INDONESIA’S POWER SECTOR: CLEAN COAL
POLICY ANALYSIS
CE
NT
ER
F
OR
C
LE
AN
A
IR
P
OL
IC
Y
Di
al
og
ue
.
In
si
gh
t.
So
lu
ti
on
s

1 | P a g e
ACKNOWLEDGMENTS
This report was prepared Dan Huber and Anmol Vanamali from the Center for Clean Air Policy. The authors also thank the main sponsor of this report, the Center for Clean Air Policy (CCAP), and especially Matthew Ogonowski and Ned Helme. The authors would like to thank Jos Wheatley and Sarah Love of the UK Department for International Development (DFID) for their generous financial support for the project. The authors would also like to thank Agus Purnomo from DNPI for his support for this project. For avoidance of any doubt and for the purpose of clarity, the authors would like to state that this report is based on an independent study. The contents of the report reflect the views of the authors and not necessarily the views of the UK or Indonesian governments.

2 | P a g e
Table of Contents
Figures....................................................................................................................................................... 2
Tables ........................................................................................................................................................ 3
I. Executive Summary ...................................................................................................................... 4
I.A. Introduction ..................................................................................................................................... 4
II. Introduction ................................................................................................................................ 2
III. Coal Background ........................................................................................................................ 4 A. Resources and Reserves: .................................................................................................. 4 B. Quality: ............................................................................................................................. 4
C. Location and Production: ..................................................................................................... 5
D. Consumption: ................................................................................................................... 5
IV. Coal Industry ............................................................................................................................... 7 A. Major Players: .................................................................................................................. 7 B. Transport: ......................................................................................................................... 7
V. Regulatory Regime ....................................................................................................................... 8 A. NEC .................................................................................................................................. 8
B. NCP .................................................................................................................................. 9 C. Law Number 4 of 2009 .................................................................................................. 10 D. Challenges ...................................................................................................................... 12
VI. Clean Coal Support and Key Regulatory Players .......................................................... 13
VII. BAU Projections ....................................................................................................................... 15
VIII. Use of Coal in the Power Sector under BAU Scenario ............................................. 18
IX. Use of Coal in the Power Sector under Carbon Pricing .............................................. 23
X. Coal in the Power Sector: Sensitivities ................................................................................ 27
XI. Emission Reduction Policy Requirements ..................................................................... 32 A. Benchmarking ................................................................................................................ 34 B. Benchmarking Analysis ................................................................................................. 36 C. Coal Upgrading Technologies ........................................................................................ 39
D. Coal Producer Tax .......................................................................................................... 40
XII. Policy Recommendations ..................................................................................................... 43
Figures
Figure 1: Indonesia Intensity Rates ................................................................................................. 2
Figure 2: Indonesia’s Coal Resources and Reserves ....................................................................... 4
Figure 3: Coal Quality ...................................................................................................................... 5
Figure 4: Indonesian Domestic Coal Consumption, 2006 ............................................................... 5
Figure 5: Energy Sources ................................................................................................................ 6
Figure 6: 2025 Energy Mix Targets ................................................................................................. 8
Figure 7: Production by License Type 2004-2009 (Million Tons).................................................. 11
Figure 8: BAU Coal Production ...................................................................................................... 15
Figure 9: Coal Consumption by Energy Content 2010-2014......................................................... 16
Figure 10: BAU Coal Production without Export Limits ................................................................ 17

3 | P a g e
Figure 11: Geographic Distribution of Coal Electrical Capacity ................................................... 18
Figure 12: Coal-fired Electrical Capacity Projection ..................................................................... 19
Figure 13: Supercritical Capacity Projection ................................................................................ 20
Figure 14: Coal Fired Electrical Generation Projection ................................................................. 21
Figure 15: Supercritical Generation Projection .......................................................................... 21
Figure 16: Projected Emissions from Subcritical and Supercritical Plants ................................... 22
Figure 17: Projected Capacity Levels (2030) Under Varied Carbon Prices ................................... 23
Figure 18: Projected TWh Generated (2030) Under Varied Carbon Prices ................................ 24
Figure 19: Capacity Factors and Technology .............................................................................. 25
Figure 20: Capacity Factors for Subcritical Coal............................................................................ 26
Figure 21: Case 1: Coal Power Capacity ....................................................................................... 27
Figure 22: Case 1: Coal Power Generation .................................................................................. 28
Figure 23: Case 2: Coal Power Capacity ........................................................................................ 28
Figure 24: Case 2: Coal Power Generation ................................................................................... 29
Figure 25: Case 3: Coal Power Capacity ........................................................................................ 29
Figure 26: Case 3: Coal Generation Capacity ............................................................................... 30
Figure 278: Coal Technology and Fuel Type ................................................................................. 33
Figure 289: Coupled Benchmarking Functionality ........................................................................ 35
Figure 29: 1.25% Intensity Benchmark Scenario ......................................................................... 36
Tables Table 1: CO2 Emissions from Different Fuels and Power Cycles ................................................... 13
Table 2: BAU Coal Consumption (Million Tons) ............................................................................ 15
Table 3: Projected Coal Usage ...................................................................................................... 18
Appendix .......................................................................................................................................................45

4 | P a g e
I. Executive Summary
I.A. Introduction
Indonesian economic and development policy has historically been focused on assuring economic growth and stability of power supplies. This stems in part from the fact that the country’s pace of development and the fate of its economy depends on the rapid growth of the power sector. But as Indonesia brings huge amounts of new capacity online to fuel its development, emissions will continue to soar. While Indonesia maintains relatively low per capita fossil fuel emissions, the emissions intensity of the country is currently the highest among major carbon emitters. It is Indonesia’s carbon intensity, or the tonnage of CO2 produced per MWh of electricity, that is driving the rapid growth rate of emissions intensity. Intensity rose at around 2% per year between 1994 and 2004, making it only one of two examples of major economies (Brazil) that has seen intensity rise with GDP. The primary reason for this increase in emissions intensity is the use of coal in the power sector. While coal is currently only a minor component in the mix of fuel sources for Indonesia’s energy demand, accounting for 24.4%,, it is expected to quickly become a major contributor as Indonesia’s National Energy council (NEC) calls for coal to supply 33% of the national energy need by 2025. Indonesia’s dwindling supplies of oil are spurring the exploitation of abundant and cheap coal reserves. The challenge for policymakers will be how to cut down on the number of MWh generated by carbon inefficiency subcritical plants and correspondingly, ensure that emissions from subcritical plants declines and is eventually phased out. This objective can be achieved while ensuring a secure, domestic energy supply for Indonesia’s growing economy
I.B. Methodology This study was conducted in 3 phases viz (1) analysis on the potential impact of carbon pricing on the use of coal in the power sector (2) projecting power generation options under various policy scenarios that do not include a carbon price, such as a ban on all subcritical power generation after 2012 and the introduction of Integrated Gas Combined Cycle (IGCC) in 2020 (3) benchmarking analysis of a 1% and 1.25% decline in the emissions intensity of the coal sector.
I.C. Indonesia’s Coal Sector This study looks at the current state of Indonesia’s coal sector in order to indentify key stakeholders in the coal industry and existing policies that help guide energy production in Indonesia.

5 | P a g e
Indonesia’s coal resource and reserves have dramatically increased between 2005 and 2009. This is in part due to new coal discoveries, improved technology making coal recovery more economical and a renewed emphasis by the government on exploration. Production was at 229Mt in 2008, 254 Mt in 2009, and 275Mt in 2010 of combined coking and steam coals, representing almost a 20% increase. About 70-75% of Indonesian’s coal production was shipped abroad, totaling about 175Mt in 2009, sold mostly to Asia (85%) The three major classes of players in the Indonesian coal industry are the state company, private domestic companies and foreign firms. Indonesia’s largest private firm is PT Bumi Resources, who possess the largest coal reserves out of any player. The regulatory regime of the Coal Industry is comprised of various government agencies and councils. The Ministry of Energy and Mineral Resources (MEMR) governs the Indonesian coal industry. Working within MEMR, is the Directorate General of Minerals and Coal which consists of several departments relevant to coal exploitation. Taken together, this organization represents the primary regulatory authority at the national level and they possess a mandate to form and implement policies as directed by the president and the National congress. In addition, the National Energy Council (NEC) was formed in 2007 to set the agenda for national energy policy which, among other things, established energy targets to be achieved by 2025 and set a goal to reduce energy intensity by 1% each year.
The report looks at three national polices that help guide energy use in Indonesia and specifically the consumption of coal. These are
National Coal Policy (NCP) - The NCP is a directive for promoting coordination in management, exploitation, utilization and development of coal for the period from 2005-2020.
Law Number 4 of 2009- Law Number 4 of 2009 was a reform bill designed to simplify the permitting process, as well as clarify regulatory authority among the central
Directorate General of Minerals and Coal
Ministry of Energy and Mineral Resources
Secretariat
Business Development Directorate
Engineering and Environmental
Directorate
President National Congress
National Energy
Council

6 | P a g e
government and other authorities. While its central pieces are new permitting and pricing regulations, it also includes provisions for community development.
Domestic Sales Requirement- The domestic sales requirement establishes that the central government has an obligation through Law Number 4 to set the Domestic Market Obligation (DMO) for the short, medium and long term. This mechanism sets a level of production that companies must sell on the domestic market based on production and projected demand.
The National Coal Policy has a number of provisions that could potentially provide support for clean coal initiatives. The policy is designed to support increased use of coal, as Indonesia chooses the technologies for its next generation of projects. There is opportunity in this to support a cleaner direction for the future use of coal. There may also be opportunity to leverage the development and conservation priorities contained in the NCP to promote cleaner and more sustainable coal usage.
I.C. BAU Projections BAU projections for Indonesia state that both coal production and domestic consumption of coal are expected to drastically increase through 2025. However, exports are expected to remain stable under requirements from Law Number 4 of 2009 that sufficient coal be available for domestic demand. In general, domestic energy demand is expected to grow by 7% annually due to GDP growth of around 6%. The growth in the electricity demand is expected to be about 9% while coal consumption for electricity production is expected to also increase by 7% annually.
Source: Domestic Coal Supply and Demand in Indonesia Toward 2025, Coal Supply Outlook in the APEC Region, Clean Fossil Energy Technical and Policy Seminar, Hanoi, Vietnam (2007)
150
90
240
150
130
280
150
170
320
150
220
370
0
50
100
150
200
250
300
350
400
Million Tons
2010 2015 2020 2025
Year
Export
Domestic
Production

7 | P a g e
By 2030, 75% of electricity will be supplied by coal and a staggering 90% of carbon emissions will come from burning coal in the electricity sector. Therefore, it is in this sector that policy efforts should be focused to reduce emissions intensity.
I.D. Carbon Pricing & Sensitivity Analysis This report analyzes what new electricity capacity is projected to be built by 2030 under different carbon price regimes and finds that at a carbon price of $50 per ton, virtually no new subcritical capacity is built. It also finds that the total amount of electricity generated by new coal fueled sources drops off at $30 per ton, suggesting that most subcritical plants are not economic at a $40 per ton carbon price and other, non-coal sources are built and are generating instead at the higher carbon prices. The analysis also covers a sensitivity analysis, projecting power generation options under three policy scenarios that do not include a carbon price. First case assumes a ban on the construction of all subcritical power generation after 2012. The primary response of the model to banning subcritical technology is that it greatly accelerates the rate at which both supercritical and IGCC technology is adapted as well as increasing the total amount of non-subcritical coal generation by 2030. Second case considered the introduction of IGCC in 2020 to start replacing old subcritical coal power capacity. This results in a small decrease in subcritical capacity as compared to case 1, but it does project an earlier adaptation of IGCC. Third case combines both case 1 and 2 together, banning subcritical technology after 2012 and replacing old subcritical plants with IGCC in 2020. The capacity mix by 2030 under this case is only marginally different from case 1, primarily due to the earlier adaptation of IGCC technology.
I.E. Policy Requirements and Recommendations Policy Requirements In order to decrease the emissions intensity of the coal industry the tariff will either
need to be increased or international support will need to close the gap. Currently the government is already moving to reduce the subsidy level due to the strain on the national budget, which is a positive development for cleaner technology.

8 | P a g e
Beyond stakeholders, any policy will have to be in line with the National Energy Policy as well as the national coal Policy of Indonesia. Together, the primary directive of these policies is to ensure the security and adequacy of domestic energy supply at low cost to spur development.
The National Coal Policy which aims to increase the usage of mine-mouth power plants, which utilize low rank coals that are not suitable for transport, represent a huge threat to future reduction in emissions intensity and will have to either be built with best available technology or the low rank coal will need to be upgraded. A policy to address emissions for the coal sector will have to correctly incentivize upgrading technology as well as fuel switching.
Regulatory certainty is of critical importance here as plants may easily switch between bituminous and sub-bituminous coals, but lignite plants cannot switch to other coal types. As many plans are currently being planned and built, a clear regulatory signal would be central to ensuring the best available technology is implemented to minimize emissions across fuel type.
Benchmarking The most efficient system is a direct command and control mechanism that requires PLN, the state utility that owns virtually all of the coal-based power capacity, to meet or exceed the National Energy Policy’s intensity benchmark of a 1% reduction per year. An industry benchmark with a no-lose approach offers the best combination of simplicity, results and stakeholder buy in. In addition, the intensity benchmark would be based on CO2 tonnage per unit electricity as opposed to carbon tonnage per unit energy. If a command and control policy is adapted requiring a 1% decline in the emissions intensity of the coal sector, the intensity will be roughly equivalent to what the intensity of the coal sector would be in 2030 under a $40 per ton carbon price. Coal Sector Emissions Intensity Scenarios
0.65
0.7
0.75
0.8
0.85
0.9
0.95
2010 2020 2030
Year
Inte
nsity
MT/
TWh
Elec
tric
ity
BAU
CP80
CP40
1% per year
Sens 1
Difference
in Total
Emissions

9 | P a g e
The costs for improved technology as mandated by the benchmark would be indirectly carried by the government as the government would incur additional expense to its subsidy regime. Therefore, international support would be required to alleviate the burden to the central government. Funds could either be available from an international market or from donor countries in the event that Indonesia exceeds its intensity target.
Policy Recommendations The recommended policy is to immediately announce intensity benchmarks that are inclusive of all existing coal capacity. These benchmarks should not be too far below BAU to start with, as many coal projects have already broken ground, but should get progressively more stringent to encourage use of best available technology for new construction. Depending on technology advances, coal rank could become important to further reducing the intensity of Indonesia’s power sector. If coal production remains sticky and does not respond to market demands for cleaner coal through the intensity benchmarking, or if coal upgrading technology is not progressing at the needed rate, the additional mechanism of a coal rank tax may be implemented to further incentivize the industry. The magnitude of the tax would be dependent on the difference in carbon emissions between low rank coal and higher rank coal in order to equalize the marginal damages between the ranks. To encourage buy in from the coal industry all revenues from the taxes would be passed back into research for upgrading technology and eventually subsides for increasing upgrading capacity. In the short run, shifting to supercritical technology will suffice in meeting Indonesia’s intensity goals, however in the long run, future technological improvements in generation technology or coal upgrading will be required for the electricity sector to continue reducing its intensity.

2 | P a g e
II. Introduction Today, Indonesia has relatively low per-capita fossil fuel emissions, lower even than some Asian counterparts such as China or India. However, as Indonesia’s pace of development is expected to increase rapidly, emissions will follow suit. Already, Indonesia has experienced power shortages that are extremely expensive both economically and in terms of political capital for the nation’s leaders. Therefore, Indonesia will be bringing huge amounts of new capacity online both to satisfy the gaps in current supply and to ensure a reliable supply for the country’s growing demand. Indonesia’s pace of development and the fate of its economy depends on the rapid growth of the power sector. Against this backdrop, Indonesia faces the challenge of maximizing emission reductions below a BAU scenario at a minimum financial and publicity cost. Among major carbon emitters, Indonesia currently has the highest growth rate in its emissions intensity. For most economies, even developing ones such as India and China, as GDP rises, emissions intensity falls; Indonesia is one of two examples of major economies (Brazil) that has seen intensity rise with GDP.1 Intensity rose at around 2% per year between 1994 and 2004, although during the later part of this era, emissions intensity was increasing at a much slower rate. In comparison, China’s emissions intensity declined by 4% per year over this timeframe.2 Figure 1 shows the rate of change of various intensity measures during the 1994 to 2004 period. The majority contributor to the growth rate of emissions intensity is Indonesia’s carbon intensity, that is, the tonnage of CO2 produced per MWh of electricity. The energy intensity (amount of energy expended per unit GDP) is also rising, but at a much lower rate than the carbon intensity. Indonesia is growing, but in an inefficient way.
Figure 1: Indonesia Intensity Rates
1 Challenges in Mitigating CO2 Emission in Indonesia: Fossil Fuel Combustions: Rsosudarmo, Jotzo, Yusuf, Nurdianto
2 Challenges in Mitigating CO2 Emission in Indonesia: Fossil Fuel Combustions: Rsosudarmo, Jotzo, Yusuf, Nurdianto

3 | P a g e
Source: Challenges in Mitigating CO2 Emission in Indonesia: Fossil Fuel Combustions
The main driver of this shift in emissions intensity is the power sector, specifically coal. Indonesia is building inefficient coal power at a breakneck pace and this capacity is not only expanding to fulfill new demand, but also replacing less intense sources of generation, such as oil.
0.00%
0.50%
1.00%
1.50%
2.00%
2.50%
3.00%
3.50%
4.00%
4.50%
Energy Intensity (Energy/GDP) Carbon Intensity (Emissions/Energy) Emissions Intensity (Emissions/GDP)
1994-1999
1999-2004

4 | P a g e
III. Coal Background
A. Resources and Reserves:
Both the size of Indonesia’s coal resource and reserves drastically increased between 2005 and 2009 as depicted in Figure 2. The increase reflects both new coal discoveries, as well as improvements in technology that make coal recovery more economical. In addition, the Indonesian government put a renewed emphasis on exploration with the issuance of the National Coal Policy (NCP) in 2004.
Figure 2: Indonesia’s Coal Resources and Reserves
Source: Domestic Coal Supply and Demand in Indonesia Toward 2025, Coal Supply Outlook in the APEC Region (2007)
Source: Indonesia’s Coal Policy, Indonesia-Japan Coal Seminar (2009)
B. Quality:
The overwhelming majority of Indonesian coal is either low rank (Lignite) or medium rank (Sub-Bituminous) comprising 86% of Indonesian coal (Figure 3).3 Lesser amounts of high energy coal exist and are mined for the export market. These deposits will be the first to be depleted. The
3 Domestic Coal Supply and Demand in Indonesia Toward 2025, Coal Supply Outlook in the APEC Region, Clean Fossil Energy
Technical and Policy Seminar, Hanoi, Vietnam (2007)
0
20
40
60
80
100
120
2005 2008
Year
Bil
lio
n t
on
s
Resources
Reserves

5 | P a g e
calorific value of Indonesian coal is generally of medium to low energy content between 4000 and 7000 MJ/kg.4 Indonesian coal also has relatively high moisture content.5
Figure 3: Coal Quality
C. Location and Production:
Virtually all of Indonesia’s coal is located in either Kalimantan or Sumatra and about 80% of the high rank coal is estimated to be located in Kalimantan.6 Currently the most developed regions are East and South Kalimantan as well as South Sumatra and Bengkulu. Production was at 229Mt in 20087, 254Mt in 2009 and 275Mt in 2010 of combined coking and steam coals, outpacing projections.8 About 70-75% of Indonesia’s coal production was shipped abroad, totaling about 175Mt in 2009, sold mostly to Asia (85%).9 Indonesia enjoys a significant competitive advantage with exports due to its proximity to major coal buyers. However, it should be noted that production statistics vary considerably depending on source.i
D. Consumption:
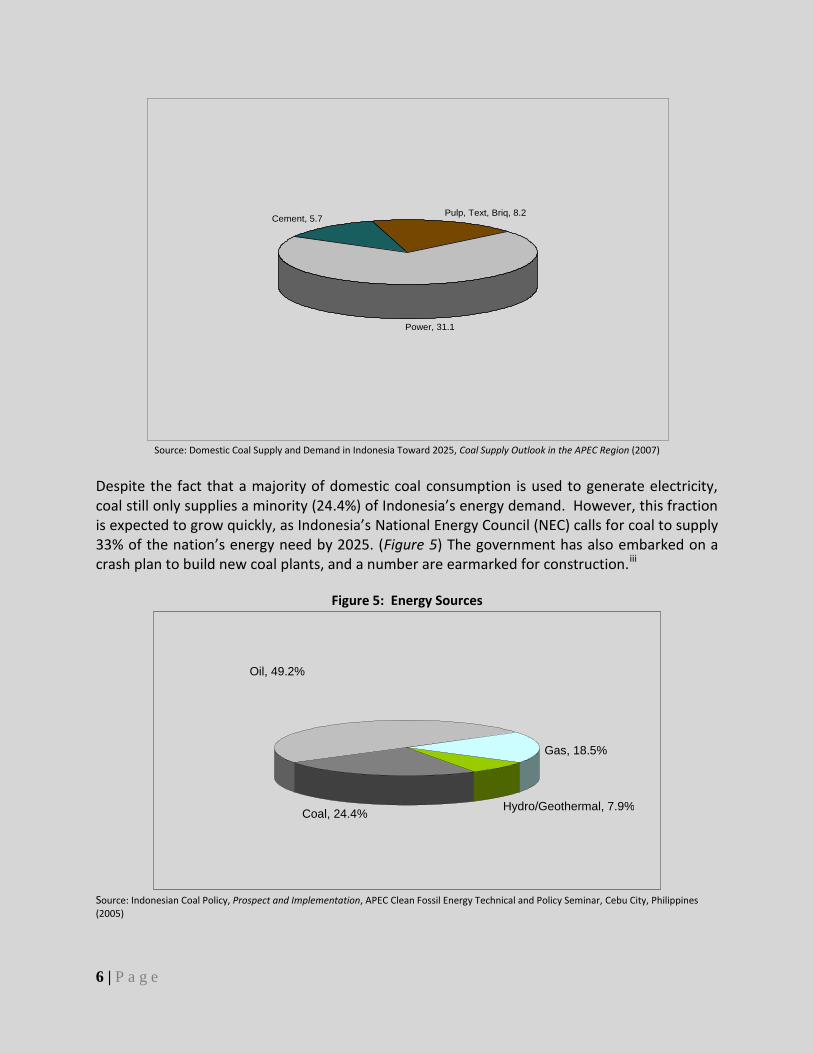
Indonesia’s domestic consumption of coal is dominated by the electricity generation sector as seen in Figure 4. Estimates vary, but domestic coal consumption has been rising steadily and considering the trend, likely rose above 50Mt in 2010.ii
Figure 4: Indonesian Domestic Coal Consumption, 2006
4 Survey of Energy Resources, World Energy Council
5 Indonesia’s Coal Industry Past Accomplishments- Future Prospects, LP Power Consultants, Ltd, Coal Trans Asia (2010)
6 Indonesian Coal Policy, Prospect and Implementation, APEC Clean Fossil Energy Technical and Policy Seminar, Cebu City,
Philippines (2005) 7 Survey of Energy Resources, World Energy Council
8 Bloomberg L.P.
9 Indonesia’s Coal Industry- Looking Ahead, Coaltrans Asia Conference, Bali Indonesia
Lignite 24%
Sub-Bituminous
62%
Bituminous 13%Anthracite 1%
6 | P a g e
Source: Domestic Coal Supply and Demand in Indonesia Toward 2025, Coal Supply Outlook in the APEC Region (2007)
Despite the fact that a majority of domestic coal consumption is used to generate electricity, coal still only supplies a minority (24.4%) of Indonesia’s energy demand. However, this fraction is expected to grow quickly, as Indonesia’s National Energy Council (NEC) calls for coal to supply 33% of the nation’s energy need by 2025. (Figure 5) The government has also embarked on a crash plan to build new coal plants, and a number are earmarked for construction.iii
Figure 5: Energy Sources
Source: Indonesian Coal Policy, Prospect and Implementation, APEC Clean Fossil Energy Technical and Policy Seminar, Cebu City, Philippines (2005)
Power, 31.1
Cement, 5.7Pulp, Text, Briq, 8.2
Coal, 24.4%
Oil, 49.2%
Gas, 18.5%
Hydro/Geothermal, 7.9%

7 | P a g e
IV. Coal Industry
A. Major Players:
Historically, there have been three major classes of players in the Indonesian coal industry, the state company, private domestic companies and foreign firms. The state coal company, PT Bukit Asam (PTBA) has the second largest coal reserves in Indonesia and produces around 8% of Indonesia’s coal, though it has fallen behind a few private companies in recent years. PTBA also sells the majority of its coal domestically, unlike most other players that primarily export.10 Since 2002, the government has embarked on a gradual privatization program for PTBA, reducing state ownership to a target of 65.8%.11 In addition to the state company, private firms have been very active in the industry. Both domestic and foreign owned firms are currently growing due to strong export demand. PT Bumi Resources is Indonesia’s largest private firm and possesses the largest coal reserves out of any player. In recent years, investment by foreign firms has boomed, as the price of coal has soared and emerging economies look to secure energy supplies. As of 2006, official statistics showed 63 private domestic firms and 18 foreign firms actively engaged in mining.12
B. Transport:
Due to the archipelagic geography of Indonesia, most coal is transported by ship from 17 different terminals, mostly in South and East Kalimantan. The terminals range in size from 5000 to 200,000 DWT.13 Indonesia’s inland transport system is highly flexible and modular, using river barges, trucks, conveyors and floating facilities. This is easy to expand and is inexpensive, but is heavily dependent on diesel fuel.14 In the future, the NCP calls for an integrated national transportation system that will link mines and terminals in southern Sumatra and all of Kalimantan.
10
Indonesian Coal Policy, Prospect and Implementation, APEC Clean Fossil Energy Technical and Policy Seminar, Cebu City, Philippines (2005) 11
Tambang Batubara Bukit Asam Company Report, G.K. Goh Research 12
Domestic Coal Supply and Demand in Indonesia Toward 2025, Coal Supply Outlook in the APEC Region, Clean Fossil Energy Technical and Policy Seminar, Hanoi, Vietnam (2007) 13
Domestic Coal Supply and Demand in Indonesia Toward 2025, Coal Supply Outlook in the APEC Region, Clean Fossil Energy Technical and Policy Seminar, Hanoi, Vietnam (2007) 14
Indonesia’s Coal Industry, Past Accomplishments- Future Prospects, LP Power Consultants, Ltd, Coal Trans Asia, (2010)

8 | P a g e
V. Regulatory Regime The Ministry of Energy and Mineral Resources (MEMR) governs the Indonesian coal industry. The ministry is part of the executive branch of the government and the minister occupies a cabinet level position, appointed by the president. Working within MEMR, is the Directorate General of Minerals and Coal which consists of several departments relevant to coal exploitation: The Secretariat of the Directorate General of Minerals and Coal, the Directorate of the Minerals and Coal Program, the Business Development Directorate of Coal and the Engineering and Environmental Directorate of Minerals and Coal. Taken together, this organization represents the primary regulatory authority at the national level and they possess a mandate to form and implement policies as directed by the president and the National Congress. However, in Indonesia, as in many places, authority often overlaps with other ministries, land use regulators and provincial officials.
Figure 6: 2025 Energy Mix Targets
Source: Domestic Coal Supply and Demand in Indonesia Toward 2025, Coal Supply Outlook in the APEC Region, Clean Fossil Energy Technical
and Policy Seminar, Hanoi, Vietnam (2007)
A. NEC
In 2007, the National Energy Council (NEC) was formed to set the agenda for national energy policy, to replace BAKOREN, the previous institution.15 The NEC is comprised of seven government officials, appointed by the president and eight stakeholders, who are vetted by the House of Representatives. The NEC is nominally headed by the president, but the Minister of Energy and Mineral Resources heads the body on a daily basis. The NEC’s mission statement is to “Guarantee sustainable energy supply to support critical national interest.” In support of this
15
Role and Function of Established National Energy Council (NEC) Under the New Energy Law, Indonesia-Netherland 13th
Joint Energy Working Group (2008)
Renewables, 5%
Geothermal/Biofuel, 5% Oil, 20%
Coal, 33%
N. Gas, 30%
Liquefied Coal, 2%

9 | P a g e
vision, the NEC has established energy targets to be achieved by 2025. (Figure 6) The NEC also has ancillary goals of:
Guaranteeing a domestic energy supply Creating “added value” in energy sources Managing energy sources in an ethical and sustainable manner Providing affordable energy for low income people and developing domestic capacity
for energy management Energy diversification Energy conservation
In support of the goals of conservation and sustainability, the NEC has set a goal to reduce energy intensity by 1% each year.16
B. NCP
Indonesia’s National Coal Policy (NCP) was adopted by the Minister of Energy and Mineral Resources in 2004. The policy is a directive for promoting coordination in management, exploitation, utilization and development of coal for the period from 2005 to 2020. The policy aims to secure coal supplies for export and domestic use as well as “manage coal resources to acquire the greatest benefits for welfare and to increase coal utilization in accordance with policy.” The NCP envisions several policy frameworks operated within the management policy. The management policy oversees implementation of exploitation policy, utilization policy and development policy in accordance with the 1945 constitution, NEP and the Regional Autonomy Policy. The role of coal in the system is that of a “strategic commodity and a prime mover of economy, community and development.”17 The cornerstones of the exploitation policy are to improve the investment climate and to intensify exploration and production. There is evidence this policy has been successful as statistics from section 1.1 shows that reserves, production and exports have all markedly increased in recent years. The exploitation policy also calls for attention to be given to conservation, the environment, fiscal returns and increasing the share of coal production by the state coal company, PT Bukit Asam to 13.5%.18 The utilization policy calls primarily for a diversification of uses, especially those that add value to the commodity. The policy also calls for a reduction in prices, support for exports and increased use of low rank coals. As these low rank coals have low energy densities, it is less efficient to transport, thus the NCP calls for increased development of “mine mouth” power plants that minimize transport costs. In addition to increasing brown coal usage, the policy also
16
Role and Function of Established National Energy Council (NEC) Under the New Energy Law, Indonesia-Netherland 13th
Joint Energy Working Group (2008) 17
Indonesian Coal Policy, Prospect and Implementation, APEC Clean Fossil Energy Technical and Policy Seminar, Cebu City, Philippines (2005) 18
Indonesian Coal Policy, Prospect and Implementation, APEC Clean Fossil Energy Technical and Policy Seminar, Cebu City, Philippines (2005)

10 | P a g e
encourages extraction of coal bed methane (CBM) from coal deposits and increasing production of coal briquettes for small industrial and household use. The development policy gives significant attention to increasing R&D on diversifying uses for coal. Upgrading brown coal (UBC), as well as coal liquefaction and gasification are mentioned as research directions and the policy calls for the creation of a coal technology center. Clean coal technology is mentioned in the context of building pilot plants in the 2010-2020 timeframe that can be leveraged to spur development and deployment of advanced coal technologies in the future. Development policy also includes provisions to improve livelihoods by coupling skills training and local development to coal development and by improving institutional organization
C. Law Number 4 of 2009
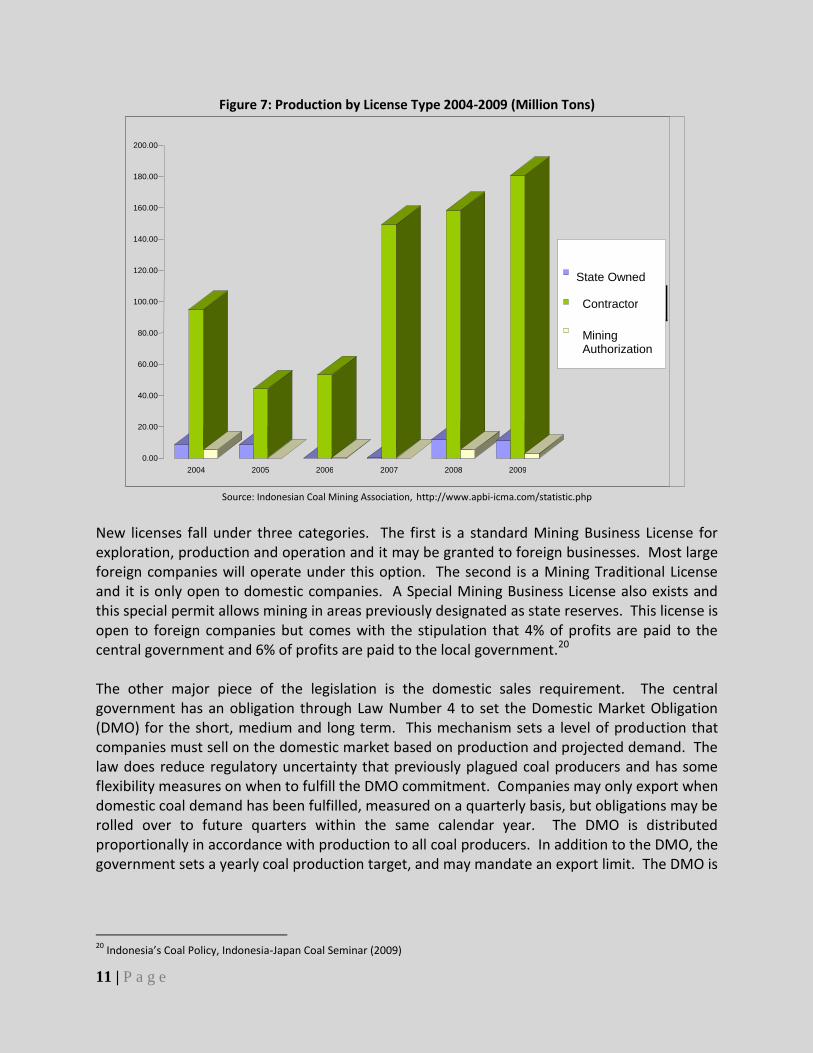
Law Number 4 of 2009 was a reform bill designed to simplify the permitting process, as well as clarify regulatory authority among the central government and other authorities. It replaced Law Number 11 of 1967 that previously regulated the coal industry. The central pieces of the law are new permitting and pricing regulations, but it also includes provisions for community development. As part of the changeover, new entrants into the coal industry will immediately be permitted under Law Number 4 and existing actors will gradually move over to the new system as grandfathered contracts expire. Previously, a permit to mine was either in the form of a Mining Authorization (MA) or a Coal Contact to Work (CCoW). Small operations were generally granted authorizations and large companies held work contracts. In 2007 there were 442 companies with an MA, 169 of which possessed production permits and 273 with survey/exploration permits. In contrast, 81 companies held CCoW production permits. Of these 81 companies, 35 held production stage permits and 46 held permits for survey, exploration, feasibility and construction.19 Despite the small number of CCoW companies, production under the CCoW was vastly higher than the amount of coal produced under MAs. These licenses will remain valid until all contracts affiliated with them expire, at which point all new licenses and contracts will be governed under Law Number 4 of 2009. Figure 7 shows Mining Authorization, Coal Contract to Work as well as state coal production from 2004-2009.
19
Domestic Coal Supply and Demand in Indonesia Toward 2025, Coal Supply Outlook in the APEC Region, Clean Fossil Energy Technical and Policy Seminar, Hanoi, Vietnam (2007)
11 | P a g e
Figure 7: Production by License Type 2004-2009 (Million Tons)
Source: Indonesian Coal Mining Association, http://www.apbi-icma.com/statistic.php
New licenses fall under three categories. The first is a standard Mining Business License for exploration, production and operation and it may be granted to foreign businesses. Most large foreign companies will operate under this option. The second is a Mining Traditional License and it is only open to domestic companies. A Special Mining Business License also exists and this special permit allows mining in areas previously designated as state reserves. This license is open to foreign companies but comes with the stipulation that 4% of profits are paid to the central government and 6% of profits are paid to the local government.20 The other major piece of the legislation is the domestic sales requirement. The central government has an obligation through Law Number 4 to set the Domestic Market Obligation (DMO) for the short, medium and long term. This mechanism sets a level of production that companies must sell on the domestic market based on production and projected demand. The law does reduce regulatory uncertainty that previously plagued coal producers and has some flexibility measures on when to fulfill the DMO commitment. Companies may only export when domestic coal demand has been fulfilled, measured on a quarterly basis, but obligations may be rolled over to future quarters within the same calendar year. The DMO is distributed proportionally in accordance with production to all coal producers. In addition to the DMO, the government sets a yearly coal production target, and may mandate an export limit. The DMO is
20
Indonesia’s Coal Policy, Indonesia-Japan Coal Seminar (2009)
0.00
20.00
40.00
60.00
80.00
100.00
120.00
140.00
160.00
180.00
200.00
2004 2005 2006 2007 2008 2009
State Owned
Contractor
Mining Authorization

12 | P a g e
set by the Minister of Energy and Mineral Resources in consultation with governors, regents, mayors of coal producing areas and House of Representatives.21 In addition to the DMO, the Indonesian central government also publishes the Indonesian Coal Price Reference (ICPR) a monthly adjusted price based on a basket of indices that is a reference to consumers and producers. Domestic and export coal sales as well as tax rates will be based on the benchmark and it is designed as a price floor to optimize state revenues from coal.22 The reference price is generally below world market prices and exhibits less volatility.23 The government reserves the power to determine coal price for specific domestic needs, such as a lower price for low rank, brown coal. As the DMO and ICPR bestow substantial power on the Ministry of Energy and Mineral Resources, and different prices and market obligations may be set for different uses and types of coal, these mechanisms may be an avenue to subsidize and encourage development of cleaner schemes.
D. Challenges
Law Number 4 of 2009 was specifically formulated to address many of the challenges facing the structure of coal regulation in Indonesia. Nevertheless, the jury is still out on the effectiveness of the regulation. Historically, there has been significant conflict between central government and the administration of the autonomous regions. Coal mining areas may overlap both regulatory structures and in some cases, neither authority clearly supersedes the other. Despite overlapping authority structures, in some regions production is still not controlled.24 Law enforcement of illegal mining is also weak, again resulting in uncontrolled production. Regulation may conflict between land use ordinances, forest preservation laws and MEMR policies. In addition, tax regimes sometimes overlap, causing conflict.25
21
Indonesia’s Coal Policy, Indonesia-Japan Coal Seminar (2009) 22
Indonesia’s Coal Industry- Looking Ahead, 16th
Annual Coal Trans Asia Conference, Bali Indonesia (2010) 23
Indonesia’s Coal Policy, Indonesia-Japan Coal Seminar (2009) 24
Indonesian Coal Policy, Prospect and Implementation, APEC Clean Fossil Energy Technical and Policy Seminar, Cebu City, Philippines (2005) 25
Indonesian Coal Policy, Prospect and Implementation, APEC Clean Fossil Energy Technical and Policy Seminar, Cebu City, Philippines (2005)

13 | P a g e
VI. Clean Coal Support and Key Regulatory Players The National Coal Policy has a number of provisions that could potentially provide support for clean coal initiatives. The policy is designed to support increased use of coal, as Indonesia chooses the technologies for its next generation of projects. There is opportunity in this to support a cleaner direction for the future of coal. There may also be opportunity to leverage the development and conservation priorities contained in the NCP to promote cleaner and more sustainable coal usage. Increasing exploitation of low rank coal is a priority of the NCP. Indonesia has large reserves of low rank coal, yet brown coal is not widely traded on the international market due to high shipping costs per unit of energy. Transport of scarcer high energy density coal is more efficient for the export market. Low rank coal is used more domestically and increasing the consumption is seen as closely linked to the pace of development. However, despite its low energy density, low rank coals do have some benefits. Lignite has a high percentage of volatile matter, which makes it easier to gasify or liquefy. An Integrated Drying and Gasification Combined Cycle (IDGCC) plant has the potential to reduce CO2 emissions from brown coal to a level similar to a supercritical black coal power plant, although the technology is far from implementation on a wide scale. Brown coal is very likely to be developed regardless of carbon emissions due to the importance of reducing oil consumption in the power sector. IDGCC combined with Carbon Capture and Storage (CCS) would have the potential to reduce emissions further, and captured CO2 could be re-injected as part of an Enhanced Oil Recovery (EOR) project, further lessening the strain on the scarce supply of oil. However, Indonesia’s efforts to improve R&D are not projected to be online in the short term, thus significant technology transfer and support would be required to develop an IDGCC plant. Another option, that could be undertaken unilaterally, is using brown coal in supercritical power plants. The emissions from supercritical brown coal plants are lower than a brown coal subcritical plant, yet still higher than a subcritical black coal plant as seen in Table 1.
Table 1: CO2 Emissions from Different Fuels and Power Cycles
Process kgCO2/MWh
Brown Coal Subcritical Steam Cycle 1160
Brown Coal Supercritical Steam Cycle 1020
Brown Coal IDGCC 810
Black Coal Supercritical Steam Cycle 790
Black Coal IGCC 740
Natural Gas Steam Cycle 490
Natural Gas GTCC 380 Source: HRL Developments Pty Ltd, Australia, IDGCC number likely optimistic
The NCP also calls for “value added” processes for coal. Indonesia is currently the lowest cost producer for export in Asia, and thus is under intense market pressure to keep prices low. In

14 | P a g e
addition, a large portion of its coal deposits are so low value that it is not economical to even transport them domestically. Thus, adding value and increasing the prices Indonesia can charge for its coal is very important to increasing revenues in the future. In addition to liquefaction and gasification, Upgrading Brown Coal (UBC) processes have the potential to add value and increase the efficiency of brown coal usage to that of black coal, and thus reduce carbon emissions. UBC processes have the potential to add as much as 10$ per ton over the value of low rank coals due to the resultant high energy and low ash content of the product.26 A UBC pilot plant already opened in 2005 in Cirebon, Java Barat district, Indonesia. The NCP also calls for diversification in the utilization of coal, thus opportunity may exist for developing multiple competing clean coal technologies even if the process is uneconomic in the short term. Indonesia has aspirations of aiding development goals and adding expertise to its workforce through the NCP as well. The NCP requires an increase in R&D as well as the development of a coal technology center. Advanced technologies such as IGCC and UBC could greatly improve the knowledge base of the domestic workforce and act as a “development multiplier” for local development, a further argument in favor of advanced coal. In addition to discussions of exploitation and value, the NCP also mentions sustainability and environmental conservation. The policy indicates an understanding among policymakers that coal reserves are finite, and that coal represents a unique and limited opportunity for development. Technologies and policies that promote a more efficient use of coal thereby extending the coal development window are likely to be very attractive to Indonesia. The key actors for coal policy in Indonesia are the Minister of Energy and Mineral Resources, Director of Mining and Coal and the President. These officials have considerable influence, as laws governing coal policy provide considerable leeway for interpretation by public officials. The National Energy Council is the body that drafts energy policy and includes ministers as well as key energy stakeholders. The overall future of energy will be dictated by the NEC while coal policy is the jurisdiction of the Ministry of Energy and Mineral Resources with guidance from the President and congress. Other players also have an interest in clean coal as well. The Environmental Ministry is under a mandate to improve the quality of the air and BAPPENAS has a climate change program.
26
Japan Coal Energy Center; Kobe Steel, Ltd http://www.brain-c-jcoal.info/cctinjapan-files/english/2_4D2.pdf

15 | P a g e
VII. BAU Projections BAU projections for Indonesia state that both coal production and domestic consumption of coal are expected to drastically increase through 2025. However, exports are expected to remain stable under requirements from Law Number 4 of 2009 that sufficient coal be available for domestic demand. Projections are made based on current trends as well as on the NEP energy diversification targets and NCP requirements. For example, the National Coal Policy calls for the building of significant new coal capacity by 2010, which has been taken account for in consumption projections. In general, domestic energy demand is expected to grow by 7% annually due to GDP growth of around 6%.27 The growth in electricity demand is expected to be about 9%, while coal consumption for electricity production is expected to also increase by 7% annually.28 Domestic coal consumption for cement is expected to grow at an even faster rate, 12% per annum, than electricity. In order to supply the coal for the projected increase in demand, production is similarly expected to increase, as seen in Figure 7. In addition, Metals, Pulp and Paper, Textiles, Briquettes and UBC are forecast to become major consumers. Table 2 shows projected domestic coal consumption for a basket of different applications. Coal consumption projections through 2014 by energy content appear in Figure 8. Figure 10 shows an alternate projection through 2015 that assumes that the government does not move to limit exports and that Indonesia can supply both its domestic market and the export market.
Table 2: BAU Coal Consumption (Million Tons)
Figure 8: BAU Coal Production
27
Indonesian Coal Policy, Prospect and Implementation, APEC Clean Fossil Energy Technical and Policy Seminar, Cebu City, Philippines (2005) 28
Domestic Coal Supply and Demand in Indonesia Toward 2025, Coal Supply Outlook in the APEC Region, Clean Fossil Energy Technical and Policy Seminar, Hanoi, Vietnam (2007)
Industry 2006 2010 2015 2020 2025
Electricity 31.1 72.3 96.0 105.0 118.0
Cement Industry 5.7 8.4 15.0 23.0 34.0
Metallurgical Industry, Pulp, Textile and Briquette 1.9 4.0 8.0 11.0 18.0
UBC 0.0 1.0 6.0 20.0 30.0
Other 6.3 4.3 5.0 11.0 20.0
Total 45.0 90.0 130.0 170.0 220.0

16 | P a g e
Source: Domestic Coal Supply and Demand in Indonesia Toward 2025, Coal Supply Outlook in the APEC Region, Clean Fossil Energy Technical and Policy Seminar, Hanoi, Vietnam (2007)
Figure 9: Coal Consumption by Energy Content 2010-2014
Source: The Role of Coal in Indonesia’s Future Domestic Energy Mix, CoalTrans Bali (2010)
150
90
240
150
130
280
150
170
320
150
220
370
0
50
100
150
200
250
300
350
400
Million Tons
2010 2015 2020 2025
Year
Export
Domestic
Production
8.2
27.7
4.9
25.8
28.7
4.9
32.2
36.9
8.9
35.4
43.2
8.9
44.3
42.1
8.9
0
10
20
30
40
50
60
70
80
90
100
2010 2011 2012 2013 2014
6100 kcal/kg
5100 kcal/kg
4200 kcal/kg

17 | P a g e
Figure 10: BAU Coal Production without Export Limits
Source: Domestic Power: James T. Booker and Associates
30
25
158
60
36
212
70
39
229
85
46
267
0
50
100
150
200
250
300
350
400
Million Tons
2008 2012 2013 2015
Year
Exports
Other Domestic
Power
18 | P a g e
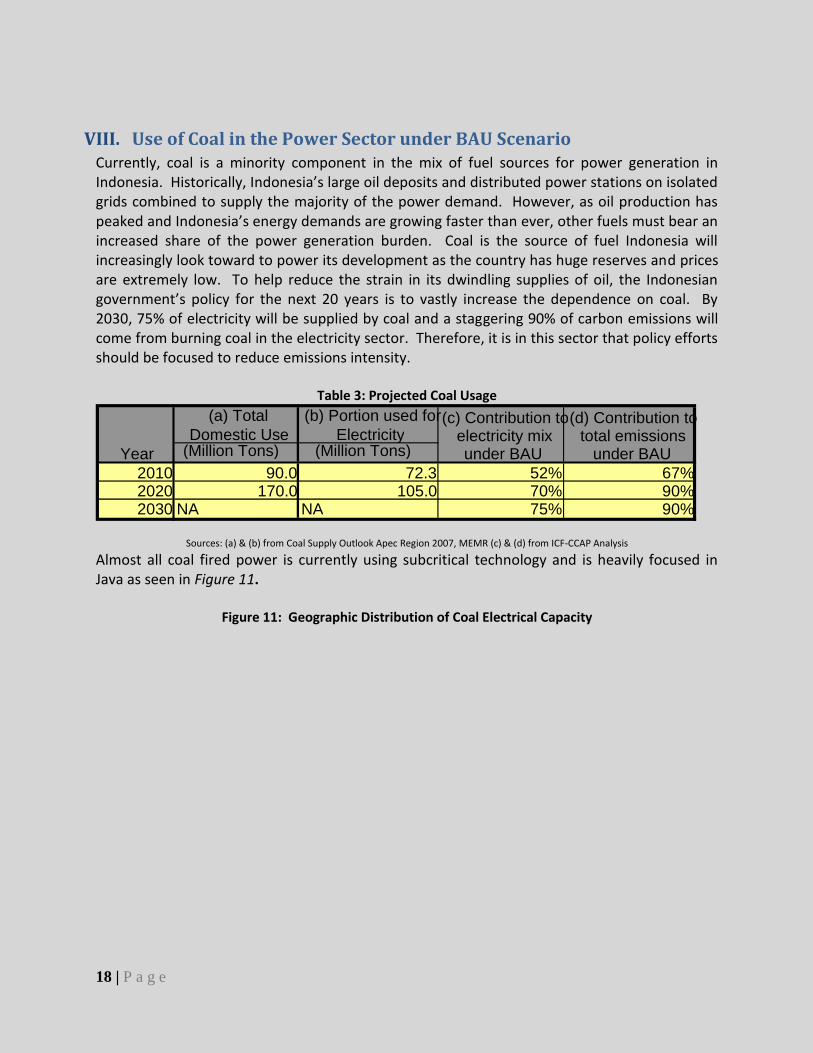
VIII. Use of Coal in the Power Sector under BAU Scenario Currently, coal is a minority component in the mix of fuel sources for power generation in Indonesia. Historically, Indonesia’s large oil deposits and distributed power stations on isolated grids combined to supply the majority of the power demand. However, as oil production has peaked and Indonesia’s energy demands are growing faster than ever, other fuels must bear an increased share of the power generation burden. Coal is the source of fuel Indonesia will increasingly look toward to power its development as the country has huge reserves and prices are extremely low. To help reduce the strain in its dwindling supplies of oil, the Indonesian government’s policy for the next 20 years is to vastly increase the dependence on coal. By 2030, 75% of electricity will be supplied by coal and a staggering 90% of carbon emissions will come from burning coal in the electricity sector. Therefore, it is in this sector that policy efforts should be focused to reduce emissions intensity.
Table 3: Projected Coal Usage
Sources: (a) & (b) from Coal Supply Outlook Apec Region 2007, MEMR (c) & (d) from ICF-CCAP Analysis
Almost all coal fired power is currently using subcritical technology and is heavily focused in Java as seen in Figure 11.
Figure 11: Geographic Distribution of Coal Electrical Capacity
(a) Total
Domestic Use
(b) Portion used for
Electricity (Million Tons) (Million Tons)
2010 90.0 72.3 52% 67% 2020 170.0 105.0 70% 90% 2030 NA NA 75% 90%
(c) Contribution to electricity mix under BAU
(d) Contribution to total emissions
under BAU Year
19 | P a g e
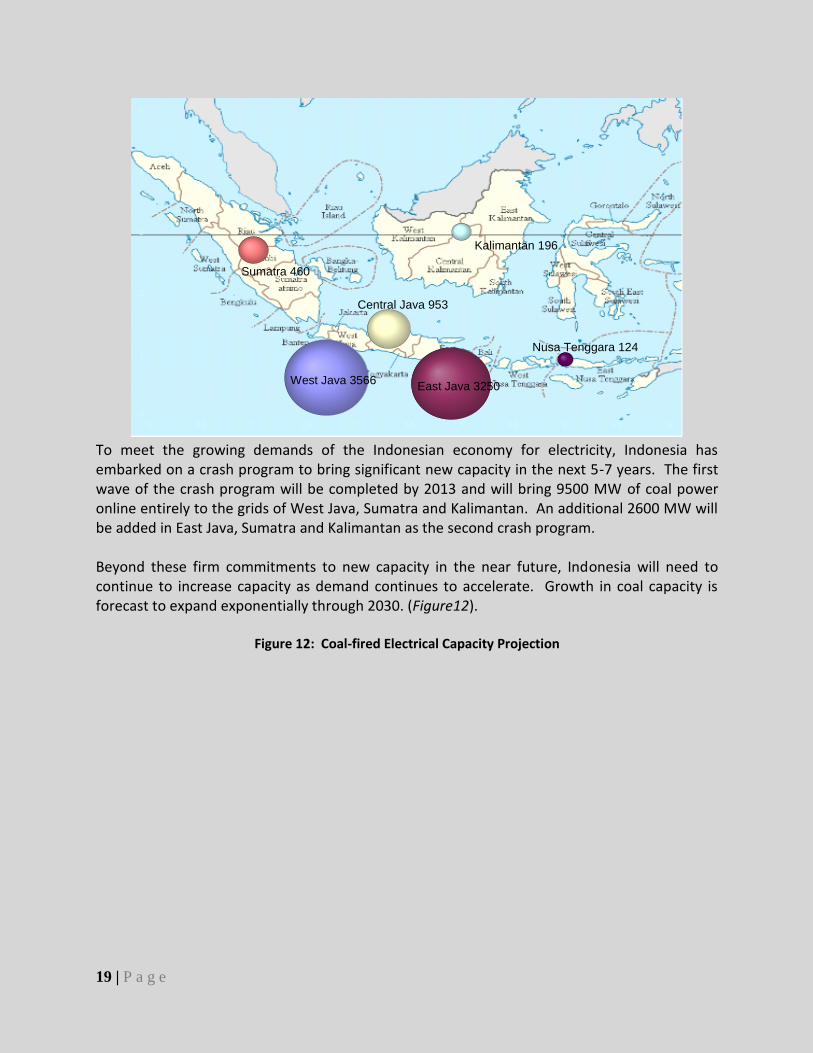
To meet the growing demands of the Indonesian economy for electricity, Indonesia has embarked on a crash program to bring significant new capacity in the next 5-7 years. The first wave of the crash program will be completed by 2013 and will bring 9500 MW of coal power online entirely to the grids of West Java, Sumatra and Kalimantan. An additional 2600 MW will be added in East Java, Sumatra and Kalimantan as the second crash program. Beyond these firm commitments to new capacity in the near future, Indonesia will need to continue to increase capacity as demand continues to accelerate. Growth in coal capacity is forecast to expand exponentially through 2030. (Figure12).
Figure 12: Coal-fired Electrical Capacity Projection
West Java 3566 East Java 3250
Central Java 953
Kalimantan 196
Nusa Tenggara 124
Sumatra 460
0
1
2
3
4
5
0 0.5 1 1.5 2 2.5 3 3.5 4 4.5 5

20 | P a g e
While most of the capacity projected to come online in the next couple years uses subcritical technology, supercritical technology is expected to become a larger part of the electrical capacity mix under BAU due to its superior economics. (Figure 13) Supercritical coal fired power plants burn coal more efficiently than subcritical plants, resulting in lower emissions per MWh of electricity produced.
Figure 13: Supercritical Capacity Projection
0
20,000
40,000
60,000
80,000
100,000
120,000
140,000
2010 2020 2030
MW
East Java
Central Java
West Java
Sumatra
Nusa Tenggara
Kalimantan

21 | P a g e
In line with the increases in capacity, the total generated MWh by coal fired technology is also projected to increase. Accordingly, supercritical technology is expected to account for a larger and larger share of MWh of electricity generated by coal. Older supercritical technology will be less important to the generation mix. (Figures 13 and 15)
Figure 14: Coal Fired Electrical Generation Projection
Figure 15: Supercritical Generation Projection
0
100
200
300
400
500
600
700
800
900
2010 2020 2030
TWh
East Java
Central Java
West Java
Sumatra
Nusa Tenggara
Kalimantan
0%
10%
20%
30%
40%
50%
60%
70%
80%
90%
100%
Capacity (MW)
2010 2015 2020 2025 2030 Year
Supercritical
Subcritical

22 | P a g e
In line with the huge increases in power generation, emissions are projected to increase in total, as well as from both supercritical and subcritical technology. Subcritical technology
accounts for a slightly higher proportion of emissions as compared to the MWh it produces.
Figure 16: Projected Emissions from Subcritical and Supercritical Plants
0%
10%
20%
30%
40%
50%
60%
70%
80%
90%
100%G
en
era
tio
n (
MW
h)
2010 2015 2020 2025 2030
Year
Supercritical
Subcritical
0
100
200
300
400
500
600
700
800
900
2020 2030 Year
Supercritical Coal Subcritical Coal
Em
iss
ion
s (
MtC
O2)
23 | P a g e
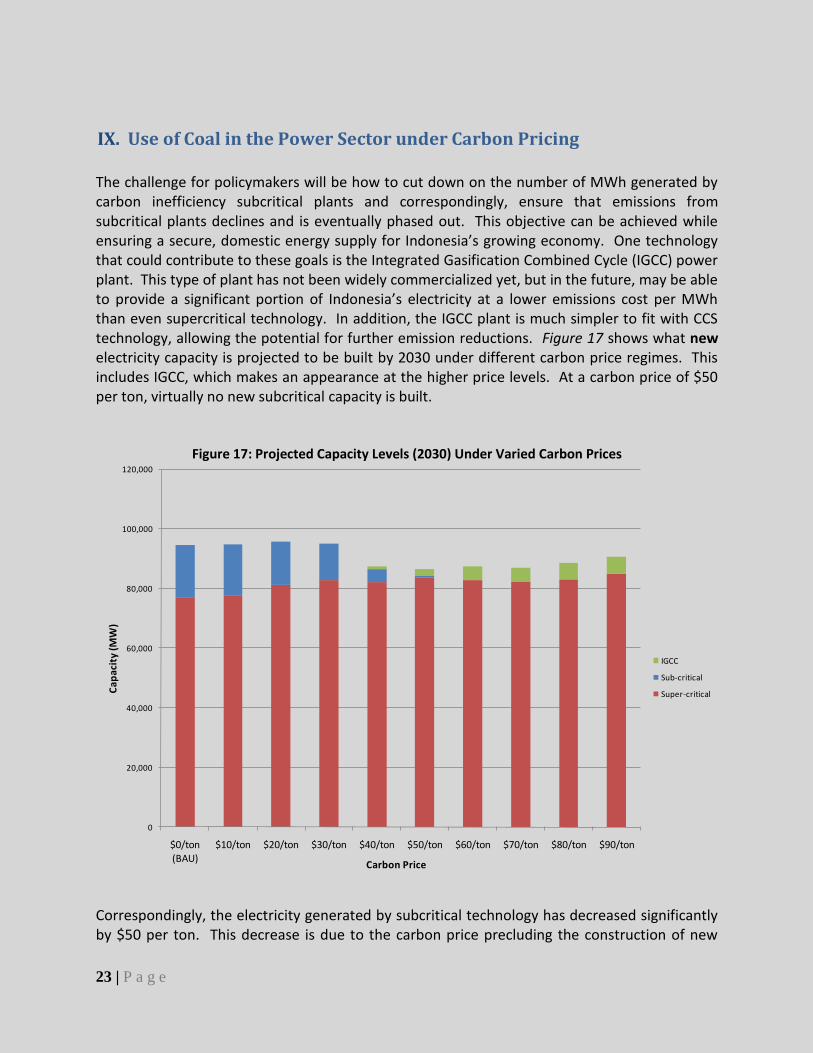
IX. Use of Coal in the Power Sector under Carbon Pricing The challenge for policymakers will be how to cut down on the number of MWh generated by carbon inefficiency subcritical plants and correspondingly, ensure that emissions from subcritical plants declines and is eventually phased out. This objective can be achieved while ensuring a secure, domestic energy supply for Indonesia’s growing economy. One technology that could contribute to these goals is the Integrated Gasification Combined Cycle (IGCC) power plant. This type of plant has not been widely commercialized yet, but in the future, may be able to provide a significant portion of Indonesia’s electricity at a lower emissions cost per MWh than even supercritical technology. In addition, the IGCC plant is much simpler to fit with CCS technology, allowing the potential for further emission reductions. Figure 17 shows what new electricity capacity is projected to be built by 2030 under different carbon price regimes. This includes IGCC, which makes an appearance at the higher price levels. At a carbon price of $50 per ton, virtually no new subcritical capacity is built.
Figure 17: Projected Capacity Levels (2030) Under Varied Carbon Prices
Correspondingly, the electricity generated by subcritical technology has decreased significantly by $50 per ton. This decrease is due to the carbon price precluding the construction of new
0
20,000
40,000
60,000
80,000
100,000
120,000
$0/ton (BAU)
$10/ton $20/ton $30/ton $40/ton $50/ton $60/ton $70/ton $80/ton $90/ton
Cap
acit
y (M
W)
Carbon Price
IGCC
Sub-critical
Super-critical
24 | P a g e
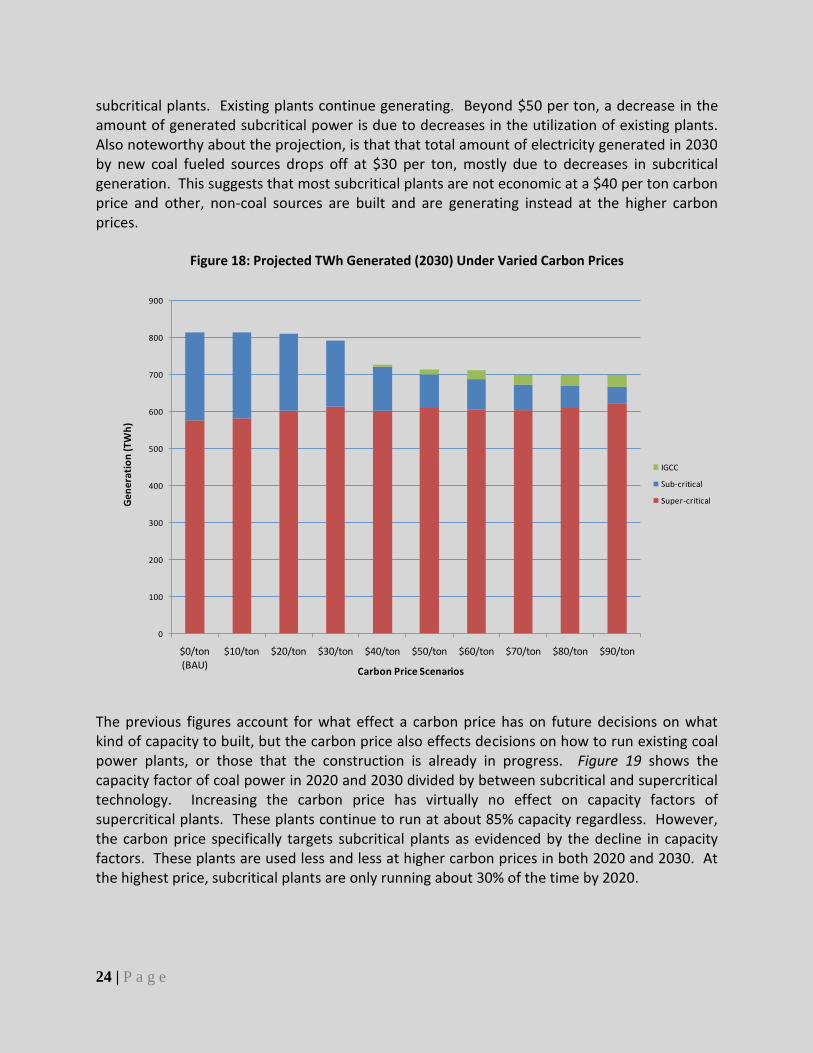
subcritical plants. Existing plants continue generating. Beyond $50 per ton, a decrease in the amount of generated subcritical power is due to decreases in the utilization of existing plants. Also noteworthy about the projection, is that that total amount of electricity generated in 2030 by new coal fueled sources drops off at $30 per ton, mostly due to decreases in subcritical generation. This suggests that most subcritical plants are not economic at a $40 per ton carbon price and other, non-coal sources are built and are generating instead at the higher carbon prices.
Figure 18: Projected TWh Generated (2030) Under Varied Carbon Prices
The previous figures account for what effect a carbon price has on future decisions on what kind of capacity to built, but the carbon price also effects decisions on how to run existing coal power plants, or those that the construction is already in progress. Figure 19 shows the capacity factor of coal power in 2020 and 2030 divided by between subcritical and supercritical technology. Increasing the carbon price has virtually no effect on capacity factors of supercritical plants. These plants continue to run at about 85% capacity regardless. However, the carbon price specifically targets subcritical plants as evidenced by the decline in capacity factors. These plants are used less and less at higher carbon prices in both 2020 and 2030. At the highest price, subcritical plants are only running about 30% of the time by 2020.
0
100
200
300
400
500
600
700
800
900
$0/ton (BAU)
$10/ton $20/ton $30/ton $40/ton $50/ton $60/ton $70/ton $80/ton $90/ton
Gen
erat
ion
(TW
h)
Carbon Price Scenarios
IGCC
Sub-critical
Super-critical

25 | P a g e
Figure 19: Capacity Factors and Technology
Upon closer inspection, the decline in usage of subcritical plants can be broken down further. (Figure 20) Existing plants, which are older and less efficient, experience the most dramatic decline in usage. Plants that are in the works, yet not operational yet are indicated by the “Firm” label. These plants will come online in the near future and use newer, more efficient technology. These newer plants experience less of an erosion of usage under higher carbon prices than the older plants. In addition, the capacity factor of the older, existing plants is nonlinear with carbon price. This could indicate that there is a group of existing plants that quickly become uneconomic with even a mild carbon price. This is the “low hanging fruit” and is quickly shut down when carbon is priced. Existing plants do not see a drastic decline in usage again until $70 per ton of CO2, the point at which existing subcritical technology begins to be totally phased out of use. These results could be interpreted as though there are two groups of existing plants using technology of differing efficiency or it could indicate that it is easy to substitute other energy sources for subcritical coal to a certain point (at which subcritical runs about 40% of the time) and much more difficult to substitute enough alternative energy later. Interestingly, the curves for 2020 and 2030 are very consistent among technology level. This indicates that it is about as easy to reduce the capacity factors of subcritical coal in the next 10 years as it is in the next 20. These carbon price incentives will result in immediate impacts to other, lower emitting options.
0
0.1
0.2
0.3
0.4
0.5
0.6
0.7
0.8
0.9
1
BAU CP10 CP20 CP30 CP40 CP50 CP60 CP70 CP80 CP90
Carbon Price
Cap
acit
y F
acto
r
Subcritical 2020
Supercritical 2020
Subcritical 2030
Supercritical 2030

26 | P a g e
Figure 20: Capacity Factors for Subcritical Coal
0
0.1
0.2
0.3
0.4
0.5
0.6
0.7
0.8
0.9
1
BAU CP10 CP20 CP30 CP40 CP50 CP60 CP70 CP80 CP90
Carbon Price
Cap
acit
y F
acto
r
Existing 2020
Firm 2020
Existing 2030
Firm 2030

27 | P a g e
X. Coal in the Power Sector: Sensitivities
Beyond these projections under different carbon prices, the analysis also covers a sensitivity analysis, projecting power generation options under various policy scenarios that do not include a carbon price. The first case assumes a ban on the construction of all subcritical power generation after 2012. After this date, the design of all new coal fired power plants will have to be using supercritical technology. As is expected, subcritical capacity is much lower as compared to the BAU case and it is mostly replaced by supercritical and later, IGCC technology. Figure 21 details the changes in capacity under sensitivity case 1 through 2030. These numbers are relative to the BAU scenario, thus supercritical capacity does not decline between 2020 and 2025, it simply increases at a rate slower than under BAU. The primary response of the model to banning subcritical technology is that it greatly accelerates the rate at which both supercritical and IGCC technology is adapted as well as increasing the total amount of non-subcritical coal generation by 2030. Figure 22 shows the effects on power generation, which shows similar results to the changes in capacity.
Figure 21: Case 1: Coal Power Capacity
-25
-20
-15
-10
-5
0
5
10
15
20
25
2015 2020 2025 2030
Year
Cap
ac
ity
(G
W)
IGCC Coal Super Critical Coal Sub Critical

28 | P a g e
Figure 22: Case 1: Coal Power Generation
The second sensitivity case considered was the introduction of IGCC in 2020 to start replacing old subcritical coal power capacity. (Figure 23) This scenario results in a small decrease in subcritical capacity as compared to case 1, but it does project an earlier adaptation of IGCC. By 2030 the only difference between the cases is that the first has traded 5 more megawatts of subcritical capacity for supercritical capacity. The changes in generation closely follow the changes in capacity. (Figure 24)
Figure 23: Case 2: Coal Power Capacity
-200
-150
-100
-50
0
50
100
150
200
2015 2020 2025 2030
Year
Ge
ne
rati
on
(T
Wh
)
IGCC Coal Super Critical Coal Sub Critical

29 | P a g e
Figure 24: Case 2: Coal Power Generation
Sensitivity case 3 combines both case 1 and 2 together, banning subcritical technology after 2012 and replacing old subcritical plants with IGCC in 2020. (Figure 25) The capacity mix by 2030 under this case is only marginally different from case 1, primarily due to the earlier adaptation of IGCC technology. Again, the generation mix is largely similar to the changes in capacity. (Figure 25)
Figure 25: Case 3: Coal Power Capacity
-150
-100
-50
0
50
100
150
2015 2020 2025 2030
Year
Gen
era
tio
n (
MW
h)
IGCC Coal Super Critical Coal Sub Critical
-25
-20
-15
-10
-5
0
5
10
15
20
2015 2020 2025 2030
Year
Cap
ac
ity
(G
W)
IGCC Coal Super Critical Coal Sub Critical

30 | P a g e
Figure 26: Case 3: Coal Generation Capacity
The distribution of the various technologies under the sensitivity cases is also revealing (Figure 27). Subcritical generation on Java is replaced by supercritical generation while subcritical coal on the other islands either remains subcritical, or in the case of Sumatra, is replaced with IGCC technology. The reason that IGCC technology is solely used in Sumatra is because the power grid there is not organized in a way that would allow economical use of large, supercritical power plants.
-200
-150
-100
-50
0
50
100
150
200
2015 2020 2025 2030
Year
Gen
era
tio
n (
TW
h)
IGCC Coal Super Critical Coal Sub Critical
-25
-20
-15
-10
-5
0
5
10
15
20
25
2015 2020 2025 2030
Year
Cap
acit
y (
GW
)
IGCC Coal Super Critical Coal Sub Critical

31 | P a g e
Figure 27: Distribution of various technologies under sensitivity scenarios
0
100
200
300
400
500
600
700
800
900
BAU Sensitivity 1 Sensitivity 2 Sensitivity 3
Ge
ne
rati
on
(TW
h)
Scenarios
IGCC Non-Java
Subcritical Non-Java
Supercritical Non-Java
IGCC Java
Subcritical Java
Supercritical Java

32 | P a g e
XI. Emission Reduction Policy Requirements Historically, Indonesian economic and development policy has been focusing on assuring economic growth and stability of power supplies. This has left a gap in the policy framework that would address CO2 emissions. Recent policies from the government have stated the goal of reducing emissions intensity and curbing environmental impacts, but these have yet to be formulated into real, actionable policy. This is due to the complexity of the country, diversity of stakeholders and a lack of expertise and clarity of possible options and mechanisms for abatement. Any comprehensive national policy would have to obtain buy-in from this large diversity of players. Any national system would involve systematic transfers of wealth between sectors and companies that would complicate the chances for agreement. This issue along with the fact that coal power is responsible for much of the increase in emissions intensity means that a sectoral approach is preferable, at least in the short term. In the power sector, the state utility, PLN, dominates the landscape, thus it is a single entity at the negotiating table, and transfers of wealth will occur within the same organization. A policy organized in this way can be negotiated by the government and PLN over only the coal portion of their capacity. In addition, PLN abides by the national electricity tariff set by the central government. This rate of electricity is below production costs and has not been adjusted since 2003.29 The sticky nature of the tariff has been a major barrier limiting investment in newer technologies. In the short term, PLN cannot afford to build new technology because the costs cannot be passed onto customers and investors are not eager to lend to an industry where no further profit margins are possible. In order to decrease the emissions intensity of the industry, the tariff level will either need to be increased or international support will need to close the gap. Currently the government is already moving to reduce the subsidy level due to the strain on the national budget, which is a positive development for cleaner technology. Beyond stakeholders, any policy will have to be in line with the National Energy Policy as well as the National Coal Policy of Indonesia. Together, the primary directive of these policies is to ensure the security and adequacy of domestic energy supply at low cost to spur development. Towards this end, coal exploitation is a certainty given the dwindling reserves of oil, its low price and extensive domestic reserves. Any policy that aims to restrict the replacement of oil consumption with coal usage in the short to medium term will be untenable. Similarly, deployment of a policy that recommends high cost sources of energy that impedes economic growth and development will meet considerable resistance. Politically, the security of supply is very important, as democratically elected leaders are very responsive to constituents who are subjected to blackouts.30 In recent years the country has endured numerous outages, and the government is determined to avoid repeating these mistakes. Additionally, exporting coal is increasingly important to the economy and the government. Coal mines employ large numbers
29
Electricity Industry in Indonesia after the Implementation of Electricity Law Number 20/2002: Proposed Agendas to Support Implementation of the Law: Nugroho, Thamrin, Hardjakoesoema, International Association for Energy Economics Conference, Taipei, 3-6 June 2005 30
IEA, Baruya, P

33 | P a g e
of workers, build infrastructure in underdeveloped areas and pay royalties to both local and national governments. The government’s top priority is domestic supply, but coal exporters exercise considerable influence. Use of higher rank coal domestically will compete with the export market, and ergo, far eastern coal importers for the foreseeable future.31 Indonesian government projections indicate an intention to cap exports at 150 million tons per year, but in practice this level has already been breached.32 International projections expect that coal exports will continue if costs in limiting exports are too high. An emissions reduction strategy that cuts into coal exports will likely be similarly ineffective. Due to export pressures as well as Indonesia’s vast reserves of low rank coal, Indonesia will increase its usage of low ranked coals. The National Coal Policy aims to increase the usage of mine-mouth power plants. These plants utilize low rank coals that are not suitable for transport then use high voltage transmission cables to bring the power to market.33 In the case of Indonesia, these plants would be built in Sumatra and the power would be transmitted to Java via undersea cables. These plants represent a huge threat to future reductions in emissions intensity and will have to either be built with best available technology or the low rank coal will need to be upgraded. A policy to address emissions for the coal sector will have to correctly incentivize upgrading technology as well as fuel switching. Regulatory certainty is of critical importance here as plants may easily switch between bituminous and sub-bituminous coals, but lignite plants cannot switch to other coal types. As many plants are currently being planned and built, a clear regulatory signal would be central to ensuring the best available mitigation technology is implemented to minimize emissions across fuel types. Figure 28 shows the duality of emission reduction possibilities that any efficient coal sector policy must address. The ovals represent possible emission and efficiency levels currently possible for the varying technologies. These variances depend upon subtle factors of plant design and scale. Finally, the policy should be as broad as is possible without compromising the aforementioned requirements. A broader policy will result in a larger and more efficient market as well as equalizing the marginal abatement cost across a wider variety of options
Figure 278: Coal Technology and Fuel Type
31
Indonesia supplies 30% of the Pacific Basin coal market. Source: WorldCoal Asia Special, May 2009 32
Indonesian Coal Policy, Prospect and Implementation, APEC Clean Fossil Energy Technical and Policy Seminar, Cebu City, Philippines (2005) 33
Domestic Coal Supply and Demand in Indonesia Toward 2025, Coal Supply Outlook in the APEC Region, Clean Fossil Energy Technical and Policy Seminar, Hanoi, Vietnam (2007)

34 | P a g e
Note: IGCC Heat Rate Source from IEAiv
A. Benchmarking
In light of these goals, an industry benchmark with a no-lose approach offers the best combination of simplicity, results and stakeholder buy in. As the state utility, PLN, owns virtually all of the coal capacity and has a monopoly on transmission infrastructure, a domestic trading scheme is not viable. PLN would have no trading partners and an internal trading scheme is not viable considering the company’s hierarchical structure. In addition, tax incentives would have little effect on PLN due to the large subsidies already provided to PLN, although the government has considered drastically reducing subsidies by 2014.34 The Indonesian state sets electricity tariffs that are largely below cost, and then covers the shortfall. The costs of a tax system would be entirely borne by the central government. Therefore the most efficient system is a direct command and control mechanism that requires PLN’s coal holdings to meet or exceed the National Energy Policy’s energy intensity benchmark of a 1% reduction per year. In addition, the intensity benchmark would be based on CO2 tonnage per unit electricity as opposed to carbon tonnage per unit energy. This would allow the plant to improve efficiency over a wider variety of processes. Some intensity measurements consider the amount of usable heat generated at the boiler but for the purposes of this analysis, the wattage of electricity is paramount. The sector wide benchmark can be coupled with an array of benchmarks for coal plants of all capacities and technologies to ensure maximum abatement. These plant appropriate mitigation actions are set in accordance with the technology level and fuel type of the plant. These separate benchmarks would complement each other in a coupled
34
http://www.thejakartapost.com/news/2010/03/23/govt-expects-remove-electricity-subsidy-2014.html
0.7
0.75
0.8
0.85
0.9
0.95
1
1.05
1.1
7000 7500 8000 8500 9000 9500 10000 10500
Net Unit Heat Rate (BTU/KWh)
CO
2 T
on
s/M
Wh
Ele
ctr
icit
y
Bituminous
Sub-Bituminous
Lignite
High Efficiency Technology Path
High Efficiency
Fuel Path
Subcritical
Supercritical
IGCC
Lignite
Sub-Bituminous
Bituminous

35 | P a g e
benchmarking system where the coal sector intensity target is met through contributions from benchmark targets for each plant. PLN would choose the lowest abatement cost between improving technology of new plants and upgrading the efficiency of older plants or any combination of the two. Figure 29 shows possible intensity reductions in light of a theoretical benchmark of .9 tons CO2/MWh for both existing and new plants. Choice of mitigation pathways will depend on the lowest marginal abatement cost as determined by PLN. It is not important that every plant meets the benchmark, but rather that the average intensity of the total terawatts produced meets the target.
Figure 289: Coupled Benchmarking Functionality
The costs for improved technology as mandated by the benchmark would be indirectly carried by the government as the government would incur additional expense to its subsidy regime. Additionally, newer technology is perceived to carry higher risks and banks are not always eager to offer financing for higher risk, higher cost projects. This burden of financing would again fall upon the central government. Due to these constraints, international support would be required to lift the burden from the central government. Funds could either be available from an international market or from donor countries in the event that Indonesia exceeds its intensity target. These funds would be passed on to PLN as part of the incentive structure. Soft loans could support new technology and the incremental tariff support would be available to bridge the gap between the government tariff price and the costs of cleaner technology. As this gap is the result of market distortions, it is not sustainable in the long run and the incremental tariff support would be phased out gradually while Indonesia allows the price of electricity to rise to market levels. Soft loans would both support the construction of new
0.7
0.75
0.8
0.85
0.9
0.95
1
1.05
1.1
7000 7500 8000 8500 9000 9500 10000 10500
Net Unit Heat Rate (BTU/KWh)
CO
2 T
on
s/M
Wh
Ele
ctri
city
Intensity Target 2015
Coupled Benchmark for
Improving Intensity of New Plants
Coupled Benchmark for Improving
Intensity of Existing Plants
Arrows represent
possible improvement
paths for existing and
new plants
Existing Plant
Intensity
Reductions
New Plant
Intensity
Reductions
Supercritical
Subcritical
IGCC
Bituminous
Sub-Bituminous
Lignite
Current Intensity Level

36 | P a g e
technology and provide guarantees in the event of technology failures. These guarantees would induce banks to lend to technologically riskier projects at rates comparable to established technology. Details of the international mechanisms will be discussed in another paper. Over time, as older plants are phased out and newer ones use increasingly better technology, the benchmark will have to be adjusted to assure continuing reductions in intensity. It is advisable that it is renewed at regular intervals to adjust to the BAU bottom line and to provide certainty in the medium term to investors and utility planners. Any linkages to an international system would have to be similarly adjusted.
B. Benchmarking Analysis
If a command and control policy is adapted requiring a 1% decline in the emissions intensity of the coal sector, the intensity will be roughly equivalent to what the intensity of the coal sector would be in 2030 under a $40 per ton carbon price. A graph showing the BAU scenario, 1% reduction and two carbon price examples appears in Figure 30.
Figure 30: Coal Sector Emissions Intensity Scenarios
Datav
The $40 carbon price causes intensity to decline farther by 2020, but the rate of decline slows by 2030. The carbon price is preferable in this scenario because the area under the curve is what defines the cumulative emissions assuming comparable generation levels. The declining 1% benchmark is no different from a BAU scenario until 2020, when the intensity benchmark begins to require abatement below BAU. Of course, the intensity benchmark can be set to a stricter level in order to match cumulative emissions under a certain carbon price scenario. Figure 31 shows a declining 1.25% benchmark that results in a lower intensity in 2030 yet similar total emissions for the period. The benchmark allows higher emissions than the carbon price earlier in the period and requires more drastic improvements in intensity later. This structure could allow increased flexibility, allowing PLN to build more CO2 intense plants in the short term while planning for a greater commitment in the long run.
Figure 29: 1.25% Intensity Benchmark Scenario
0.65
0.7
0.75
0.8
0.85
0.9
0.95
2010 2020 2030
Year
Inte
nsity
MT/
TWh
Elec
tric
ity
BAU
CP80
CP40
1% per year
Sens 1
Difference
in Total
Emissions

37 | P a g e
Datav
Figure 32 shows the approximate contribution different technologies can make towards lowering intensity. These zones are by definition approximate as fuel choices are not known with certainty and emissions depend on a myriad of technological and design choices. In the short run, supercritical technology is sufficient to reduce emissions intensity by a significant amount. However, in the long run, coal upgrading and IGCC technology will be required to drop the emission intensity of the coal sector to the levels required, especially if Indonesia continues to increase usage of low rank coal.
Figure 32: Potential Intensity Reduction by Technology
0.65
0.7
0.75
0.8
0.85
0.9
0.95
2010 2020 2030
Year
Inte
ns
ity
MT
/TW
h E
lectr
icit
y
BAU
CP80
CP40
1.25% per year
Sens 1
Decreased
Emissions
Increased
Emissions

38 | P a g e
Under a BAU scenario, the intensity of generation is expected to decline by 2020. This expected intensity level roughly corresponds to new construction of around 60% and 75% supercritical capacity by 2020 and 2030 respectively. Under a relatively aggressive 1.25% yearly reduction in intensity for the coal sector, between 90 and 100% of new construction will have to be supercritical to keep up with the baseline as existing plants are highly inefficient and are a drag on the overall numbers for the sector. The following estimations are a rough calculation and are subject to significant uncertainty. As supercritical plants incur a higher cost per KW, Indonesia will bear a financial burden by attempting to meet the benchmark. The estimated additional cost of adhering to the 1.25% annual benchmark by 2020 could be as much as USD 1 Bn depending on the exact projections of the efficiency and intensity of the new supercritical coal plants. If the plants turn out to be slightly less efficient than anticipated, many more need to be built replacing old plants to achieve the intensity target, increasing the cost to the upper end of the range. Between 2020 and 2030 Indonesia will incur huge costs by attempting to keep pace with the 1.25% benchmark using only coal based generation technology. Cumulatively, the costs will be between 6 and 15 billion or more above BAU due to the need for inclusion of very expensive technologies such as carbon capture and storage to offset higher intensity conventional coal power. These calculations are very uncertain as they make numerous assumptions (such as limited technological progress), but nevertheless give an estimate of the magnitude of the commitment required. International financing would need to make up the shortfall through intensity trading and a series of soft loans. An estimate of the amount of CO2 saved by 2020 would be around 10 million tons, although this is subject to considerable uncertainty. Figure 33 shows the approximate costs of switching the Indonesian coal industry from the BAU intensity path to the lower intensity path.
0.7
0.75
0.8
0.85
0.9
0.95
1
1.05
1.1
7000 7500 8000 8500 9000 9500 10000 10500
Net Unit Heat Rate (BTU/KWh)
CO
2 T
on
s/M
Wh
Ele
ctr
icit
y
Supercritical
IGCC
Supercritical
Subcritical
IGCC
Bituminous
Sub-Bituminous
Lignite
Improved
Technology
Coal
Upgrading
Coal Upgrading

39 | P a g e
Figure 33: Intensity Path and Cost
Data
vi
C. Coal Upgrading Technologies
The incentivizing of the use of higher rank coals from the intensity benchmarking regime will need to be reconciled with the determination of the Indonesian government to use more of the country’s vast reserves of low rank coal. The numerous technologies in the field of coal upgrading provide opportunity for increased use of low rank coal while reducing their emissions profile to that of a higher ranked product. One example is the upgraded brown coal process under development by Kobe Steel Ltd. in Japan. The process uses a slurry dewatering technique to dry out the coal and replace the porous cavities with heavy oil. This increases the energy density of the coal and allows more efficient combustion, thereby reducing emissions. This technology has already captured the attention of Indonesian authorities. In 2001, Japan and Indonesia began working in conjunction to develop a commercially viable UBC process and two demonstration plants using Kobe’s UBC process are currently operating in Indonesia. The latest plant, located in Kalimantan can process 590 tons per day. This estimated cost is under $10 per ton depending on the raw coal price.35 In addition, PT Bayan International Pte Ltd, as part of a joint venture with White Energy, is operating a 1 Mt/year briquetting plant that lowers moisture content of low rank coals and increases energy density. This process claims to increase the energy content by 30-200% and decrease the moisture content to 6-8% from 25-55%.36 There has also been some discussion by Evergreen Energy and the Sumitomo
35 Coal Upgrading, Nunes, IEA Clean Coal Centre, October 2009 36
Coal Upgrading, Nunes, IEA Clean Coal Centre, October 2009
0
500
1000
1500
2000
2500
3000
3500
4000
2010 2020 2030
Year
$ (
Mil
lio
ns
)
0.6
0.65
0.7
0.75
0.8
0.85
0.9
0.95
Inte
ns
ity
(T
on
s C
O2
/MW
h E
lectr
icit
y)
Cost
BAU Intensity
1.25% Annual
Target
Emission
Reduction by
2020
Emission
Reduction by
2030
500
1000
3000
6000
9000
12000
15000

40 | P a g e
Corporation around building a K-fuel plant in Indonesia. The K-fuel process is proven as it is in use in Wyoming at a scale of 750,000 Mt/year since 2005. The K-fuel process uses high temperature and pressure to collapse the pores in the coal, forcing out the water. This increases energy density and decreases moisture content, thereby lowering emissions when this more efficient product is burned at coal plants.37 Taken together, these technologies provide an important bridge for Indonesia to simultaneously increase its energy security as well as reduce its emissions intensity. Without upgrading technology Indonesia will be forced into using higher and higher emitting low rank coals as the limited deposits of higher rank coals are used or exported overseas. Indonesia’s huge reserves of lower ranked sub-bituminous coals are well suited to the upgrading process due to their lower ash contents. Upgraded coals may even demand a higher price than high rank coals of similar energy content due to their lower ash levels and comparable CO2 emission level.
D. Coal Producer Tax
The intensity benchmarking mechanism will provide incentives for PLN to improve technology as well as source cleaner coal. However, the coal extraction industry is heavily regulated and prices are frequently distorted. Therefore, it may be efficient to implement a complementary mechanism that directly affects coal producers. A tax system could be implemented with low rank, higher emitting coals receiving a higher tax than cleaner coals. In particular, upgraded coal could be incentivized in this way as it serves many goals beyond simply being cleaner. Upgraded coal has lower ash content, and does not decrease the availability of naturally occurring high rank coals for export. As an additional mechanism, Indonesia could allow companies to fulfill their Domestic Market Obligations (DMO) through upgrading technology instead of selling export quality coal. Currently, producers unwillingly sell at a lower price domestically as higher prices abroad are only available to them when domestic demand is satisfied under the DMO. Assuming that upgrading is cheap and fairly economic, producers could free up additional supplies for sale overseas by upgrading the lower rank coal that cannot be exported. Exporters may even choose to export the upgraded coal instead, selling high rank coal to the domestic market. Either way, the domestic market receives a higher quantity of more efficient coal and exports are able to increase simultaneously. To ensure coal mining stakeholder cooperation, proceeds from taxing the higher emitting coals could be reinvested in upgrading technology research, thereby benefitting the industry in the long run. International support through technology support and transfer programs could be effective here as well, speeding commercialization of upgrading technology. The magnitude of the tax would be dependent on the difference in carbon emissions between low rank coal and higher rank coal in order to equalize the marginal damages between the ranks. Coal emissions can vary considerably within ranks but for simplicity the taxes would likely define cutoffs at the generally accepted differentiations among ranks. Taking bituminous
37
Coal Upgrading, Nunes, IEA Clean Coal Centre, October 2009

41 | P a g e
coal as a baseline, emissions for sub-bituminous coals are around 4% higher and lignite is 11% higher when measured under similar conditions. Increasing carbon emissions can be assumed to linearly increase marginal damages, therefore an efficient tax rate would impose a 4% tax on sub-bituminous coals and an 11% tax on the sale of lignite. Assuming that these taxable coals make up perhaps %20 of Indonesia’s production, the tax could bring in roughly $150 million per year for research. Figure 34 shows the emissions intensity differences for the coal ranks assuming a 660 MW supercritical power plant. Figure 35 shows the magnitude of the tax for different Indonesian coal ranks.
Figure 34: Coal Rank and Emissions Intensity
Figure 35: Total Coal Price by Rank
0.72
0.74
0.76
0.78
0.8
0.82
0.84
0.86
0.88
Bituminous Sub-Bituminous Lignite
Emis
sio
n In
ten
sity
(tC
O2/M
Wh
Ele
ctri
city
)
Coal Rank
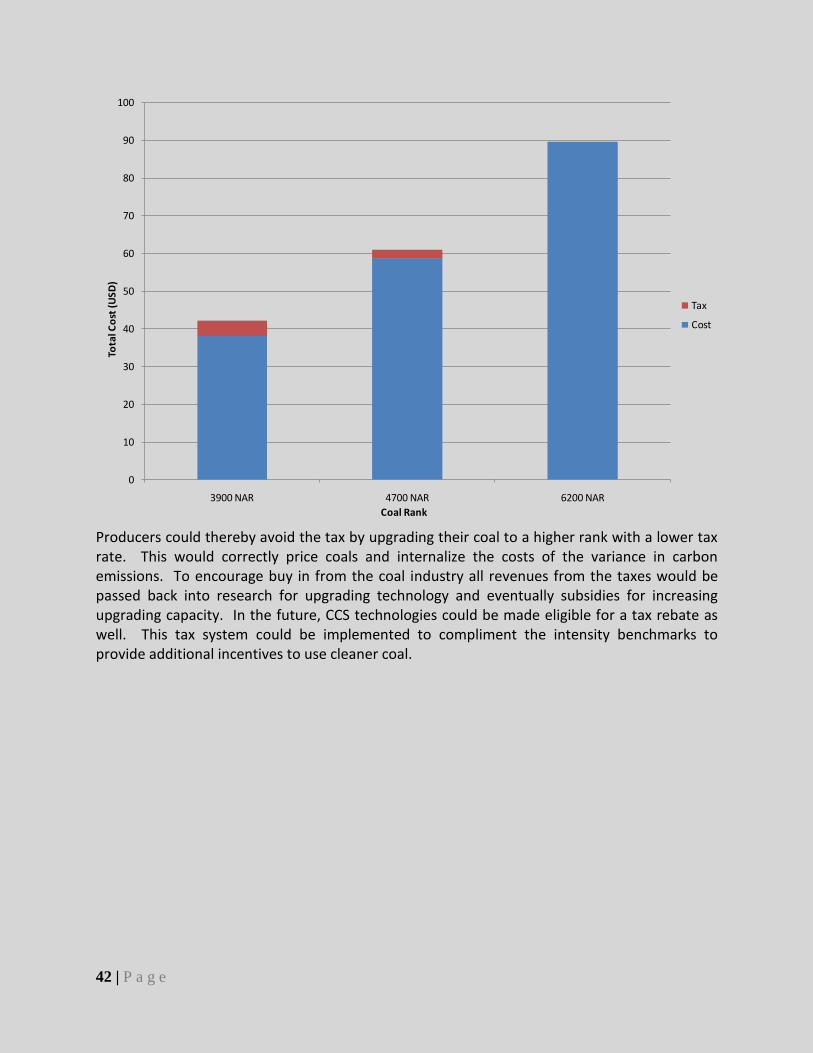
42 | P a g e
Producers could thereby avoid the tax by upgrading their coal to a higher rank with a lower tax rate. This would correctly price coals and internalize the costs of the variance in carbon emissions. To encourage buy in from the coal industry all revenues from the taxes would be passed back into research for upgrading technology and eventually subsidies for increasing upgrading capacity. In the future, CCS technologies could be made eligible for a tax rebate as well. This tax system could be implemented to compliment the intensity benchmarks to provide additional incentives to use cleaner coal.
0
10
20
30
40
50
60
70
80
90
100
3900 NAR 4700 NAR 6200 NAR
Tota
l Co
st (
US
D)
Coal Rank
Tax
Cost

43 | P a g e
XII. Policy Recommendations The recommended policy is to immediately announce intensity benchmarks that are inclusive of all existing coal capacity. The National Energy Policy currently calls for reductions in energy intensity and could be amended to specifically target coal for its specific importance in decreasing national energy intensity. The benchmarking targets for the power sector would likely be implemented under a law stemming from the NEP and could even be included under a larger sectoral approach where each emitting sector is subject to differentiated and appropriate mitigation actions. These benchmarks should not be too far below BAU to start with, as many coal projects have already broken ground, but should get progressively more stringent to encourage use of best available technology for new construction. Indonesia’s second crash program to build subcritical coal capacity has not yet entirely been implemented and if possible, should be amended to shift as much capacity as possible to supercritical to comply with the benchmark. Additionally, it is expected that Indonesia will announce a third crash program to fulfill the growing electricity demand. This crash program should further shift the ratio of new construction toward supercritical capacity. International funds may be needed immediately to fill budget gaps with soft loans, as the money for the second crash program has likely already been budgeted. Depending on technology advances, coal rank could become important to further reducing the intensity of Indonesia’s power sector. If coal production remains sticky and does not respond to market demands for cleaner coal through the intensity benchmarking, or if coal upgrading technology is not progressing at the needed rate, the additional mechanism of a coal rank tax may be implemented to further incentivize the industry. It is likely that the National Coal Policy will need to be amended or a law similar to number 4 of 2009 will need to be enacted to implement the recommendations. The NCP already gives attention to emissions and advanced technology, but specific references to the importance of coal power efficiency could be added. To implement the broad changes in the taxation of low rank coals and the adjustments to the DMO, another law would have to be implemented in accordance with the NCP as number 4 of 2009 was. Once capacity has been built and comfort has been achieved with supercritical technology, support from the international community will no longer be needed as the technology is competitive on its own merits elsewhere in the world. As this point, international support would shift to riskier technologies such as IGCC or CCS. In the short run, shifting to supercritical technology will suffice in meeting Indonesia’s intensity goals, however in the long run, future technological improvements in generation technology or coal upgrading will be required for the electricity sector to continue reducing its intensity. Intensity levels under a carbon price and under benchmarks are below what current technology is likely to be able to provide for Indonesia. In the absence of improved coal technology by 2020, perhaps a different fuel mix can provide the required intensity reductions in lieu.

44 | P a g e
Appendix i Indonesia Coal Production Estimates (Million tons)
Production
Directorate General of
Mineral and Coal
Bloomberg Indonesian
Coal Mining Association
World Energy
Council
Directorate General of
Mineral, Coal and
Geothermal
BP Statistical
Review
2007 179 N/A 124 N/A 215 216
2008 194 N/A 136 229 N/A 229
2009 226 254 150 N/A N/A 252
2010 151 275 N/A N/A N/A N/A
ii Indonesia Coal Consumption Estimates (Million tons)
Consumption
Directorate General of Mineral and Coal
Indonesian Coal Mining Association
Directorate General of Mineral, Coal and Geothermal
BP Statistical Review
2007 31 31 53 46
2008 49 41 N/A 49
2009 38 46 N/A 50
2010 47 N/A N/A N/A
iii Planned New Coal Fired Power Plants 2010-2015 (MW) Java 2010 2011 2012 2013 2014 2015 Suralaya 625
Indramayu 900
Rembang 630
Paiton 7 660
Lontar 945
Pelabuhan Ratu 1050
Pacitan 630
Tanjung Awar-2 700
Adipala 660
Cirebon 660
Paiton 3 815
Tanjungjati B 3-4 1320
Celukan Bawang 130
Central Jawa 2000

45 | P a g e
New Indramayu 2000
Total 2815 3285 2265 0 3360 2000
Sumatra 2010 2011 2012 2013 2014 2015 Meulaboh 200
Pangkalan Susu 440
Tarahan 200
Simpang Belimbing 227
Pesisir Sumbar 224
Riau 100 100
Pangkalan Susu 200 200
Banjasari 200
South Sumatera 2 225
South Sumatera Mine Mouth 300 300
Riau Mine Mouth 300 300
Total 0 1067 324 725 800 600
Kalimantan 2010 2011 2012 2013 2014 2015 Asam-asam 130
Pangkalan Bun 14
New Kaltim 50
Pulang Pisau 120
Muara Jawa 200
New Kalsel 100 100
New Kaltim 100 100
Sampit 50
Total 0 130 64 520 200 50
Sulawesi 2010 2011 2012 2013 2014 2015 North Sulawesi 2 50
Gorontalo 50
Molotabu 20
North Sulawesi 1 25 25
Gorontalo 23
Kotamobagu I 40
Kotamobagu II 40
Barru 100
South Sulawesi 1 100 100
Takalar 100 100
Takalar-2 100 100
Total 0 200 168 265 240 100 Source: The Role of Coal in Indonesia’s Future Domestic Energy Mix, CoalTrans Bali (2010)

46 | P a g e
iv Bituminous
Efficiency (LHV) Heat Rate (BTU/kwh) Emission (Tons/MWh)
Super 660MW 44 7756.25 0.773994
Sub 250MW 36 9479.861 0.945992
IGCC 600MW 45 7583.889 0.756794
Sub-Bituminous
Efficiency (LHV) Heat Rate (BTU/kwh) Emission (Tons/MWh)
Super 660MW 43 7936.628 0.804552
Sub 250MW 35 9750.714 0.988449
IGCC 600MW 44 7756.25 0.786266
Lignite
Efficiency (LHV) Heat Rate (BTU/kwh) Emission (Tons/MWh)
Super 660MW 42 8125.595 0.867422
Sub 250MW 34 10037.5 1.071521
IGCC 600MW 43 7936.628 0.847249
v Intensity (MtCO2/MWh) 2010 2020 2030 BAU 0.891304 0.808725 0.757985
CP80 0.891304 0.736264 0.69814
CP40 0.891304 0.771044 0.726272
1% per year 0.891304 0.80608 0.729004
1.25% per year 0.891304 0.785954 0.693056
Sens 1 0.891304 0.754209 0.717097
vi Intensity Path and Cost Data 2010 2015 2020 2025 2030
Power (kwh) 10,502,283 21,004,566 34,018,265 50,114,155 92,922,374
BAU intensity path 0.891304 0.858696 0.808725 0.774848 0.757985
1.25% path intensity 0.891304 0.836973 0.785954 0.738045 0.693056
Ratio for low intensity path 0.836773 0.786034 - -
Ratio for high intensity path 0.858273 0.808394 - -
Cost for lower intensity 13898.2 18027.88
BAU cost (USD Mn) 13622.51 17672.6
Low intensity %sub 0.365 0.07
%super 0.635 0.93
BAU %sub 0.49 0.2

47 | P a g e
%super 0.51 0.8