industrial catalytic cracking
TRANSCRIPT
7
Industrial Catalytic Cracking
7.1 FEED SELECTION AND PRETREATMENT
Since the 1970s, the basic feedstock for catalytic cracking has been crude oil vacuumdistillate. Depending on the conjuncture and market demands for fuel oils, visbreak-ing or coking distillate as well as deasphalted oil were also used as feed. In very rarecases a portion of the straight-run gas oil was included in the catalytic cracker feed.
The increase of the price of crude oil starting in the 1970s and the increase ofgasoline consumption led to the trend of converting crude as completely as possibleto motor fuels. Thus, residual fuel was replaced by natural gases, hydroelectric, andnuclear energy, and sometimes even with coal. This situation led to the extension andeven the general use of catalytic cracking and to a significant increase in the amountsof vacuum residue processed by visbreaking and coking. Concomitantly importantinvestments were made in hydrocracking units as tools for the complete conversionof vacuum residue into light products.
The situation changed fundamentally in the middle of the 1980s. The differencebetween the price of residual fuel and of gasoline, which was 125 $/t at the beginningof the 1980s dropped within a few years to 20 $/t. Concomitantly, the differencebetween the cost of the light and heavy crude oils decreased from 50–60 $/t to 12 $/t.
In these conditions the investments for new hydrocracking units became non-profitable and it became necessary to find other less expensive solutions for thecomplete conversion of residues to light products.
The solution adopted was to use as feed to the catalytic cracking units, straightrun residue, initially as supplement to the traditional feeds and subsequently byitself.
The direct cracking of the straight run residue required the development ofcatalysts with adequate characteristics, and of units capable of burning the muchlarger amounts of coke which form now on the catalyst.
The use in catalytic cracking of the mentioned feeds accentuates the impor-tance of ensuring the lowest possible concentrations of heavy metals, especially of Ni
Copyright © 2003 by Taylor & Francis Group, LLC
and V, and of Conradson carbon, in order to make the process economicallyfeasible.
The following sections will discuss the requirements set for the selection of thefeed and the pretreatment processes used for obtaining raw materials of the specifiedquality.
7.1.1 Vacuum Distillation of Straight Run Residue
The two current trends, i.e., to produce vacuum cuts with 5658C end point, and toincrease the production of heavy crude oils with high Conradson carbon values andhigh Ni and V concentrations, made it necessary to improve the vacuum distillationcolumns.
The procedures considered depend to a large extent on the characteristics of theprocessed crude oil. Thus, the process and constructive recommendations mostlyrefer to the processing of crude oils of a specified quality [1–3]. However, thereported information allows one to draw conclusions concerning recent develop-ments and future trends.
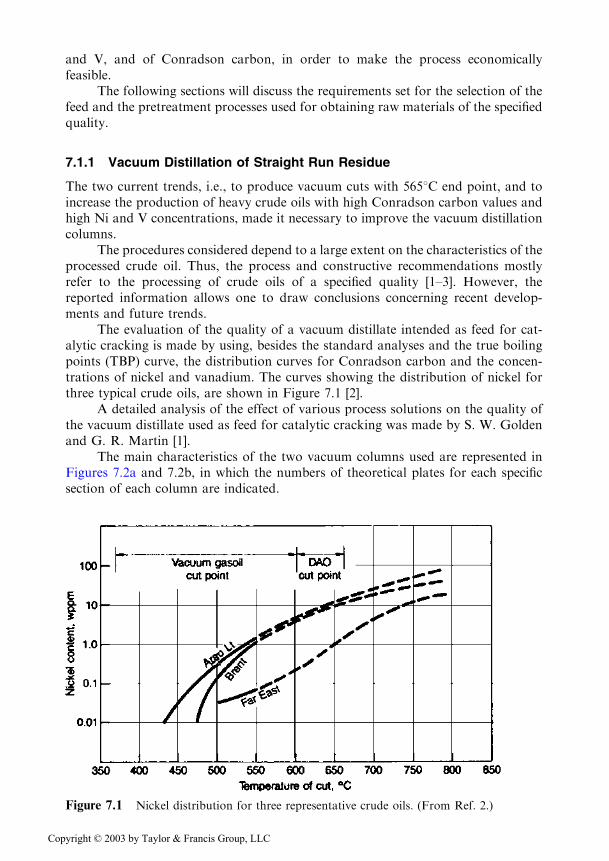
The evaluation of the quality of a vacuum distillate intended as feed for cat-alytic cracking is made by using, besides the standard analyses and the true boilingpoints (TBP) curve, the distribution curves for Conradson carbon and the concen-trations of nickel and vanadium. The curves showing the distribution of nickel forthree typical crude oils, are shown in Figure 7.1 [2].
A detailed analysis of the effect of various process solutions on the quality ofthe vacuum distillate used as feed for catalytic cracking was made by S. W. Goldenand G. R. Martin [1].
The main characteristics of the two vacuum columns used are represented inFigures 7.2a and 7.2b, in which the numbers of theoretical plates for each specificsection of each column are indicated.
Figure 7.1 Nickel distribution for three representative crude oils. (From Ref. 2.)
Copyright © 2003 by Taylor & Francis Group, LLC
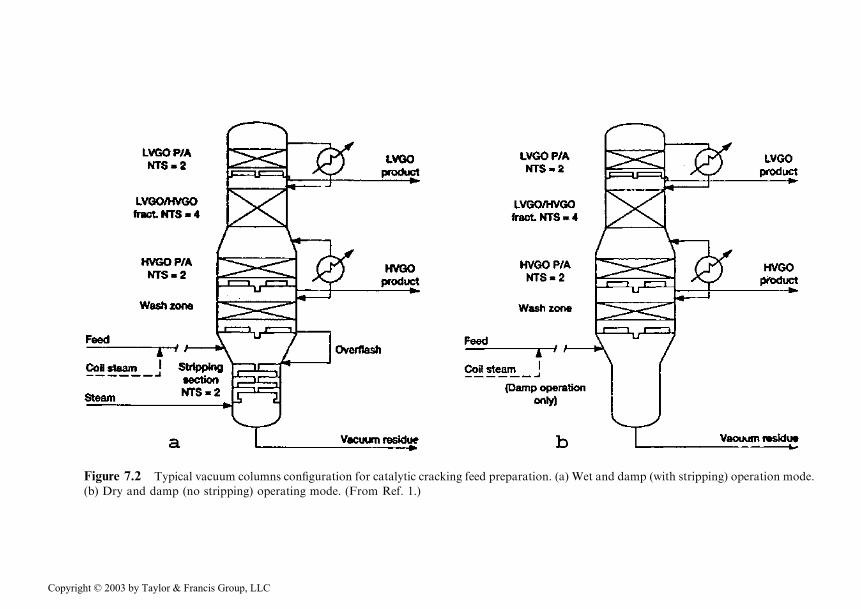
Figure 7.2 Typical vacuum columns configuration for catalytic cracking feed preparation. (a) Wet and damp (with stripping) operation mode.
(b) Dry and damp (no stripping) operating mode. (From Ref. 1.)
Copyright © 2003 by Taylor & Francis Group, LLC
The light distillate, obtained as the top product in the two columns, had in allcases an end point (TBP method) of 3908C and was used as component for the Dieselfuel. Only the heavy distillate obtained was used as feed for catalytic cracking.
For a feed having the characteristics:
Initial TBP 3608CDensity 0.9965
Molecular mass 505
Conradson carbon 8.3wt %
Nickel 28 ppm
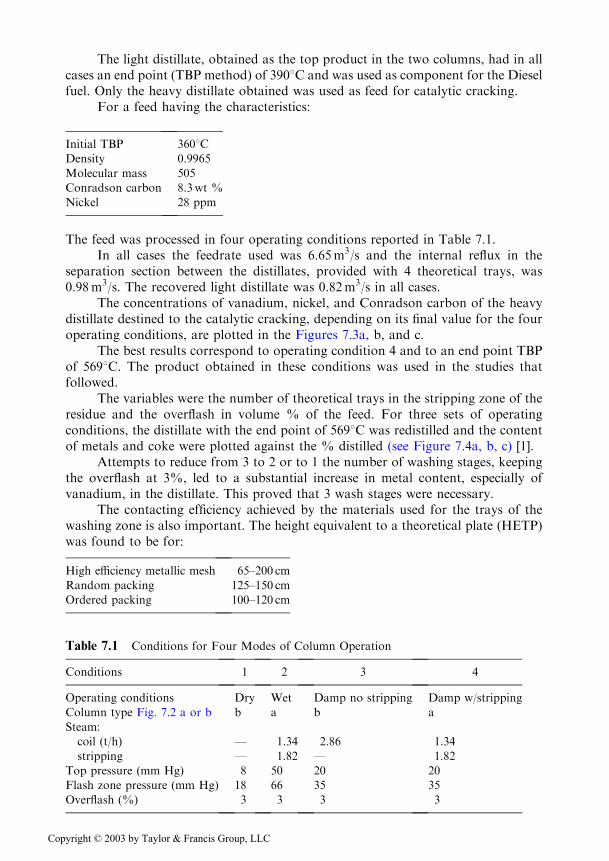
The feed was processed in four operating conditions reported in Table 7.1.In all cases the feedrate used was 6.65m3/s and the internal reflux in the
separation section between the distillates, provided with 4 theoretical trays, was0.98m3/s. The recovered light distillate was 0.82m3/s in all cases.
The concentrations of vanadium, nickel, and Conradson carbon of the heavydistillate destined to the catalytic cracking, depending on its final value for the fouroperating conditions, are plotted in the Figures 7.3a, b, and c.
The best results correspond to operating condition 4 and to an end point TBPof 5698C. The product obtained in these conditions was used in the studies thatfollowed.
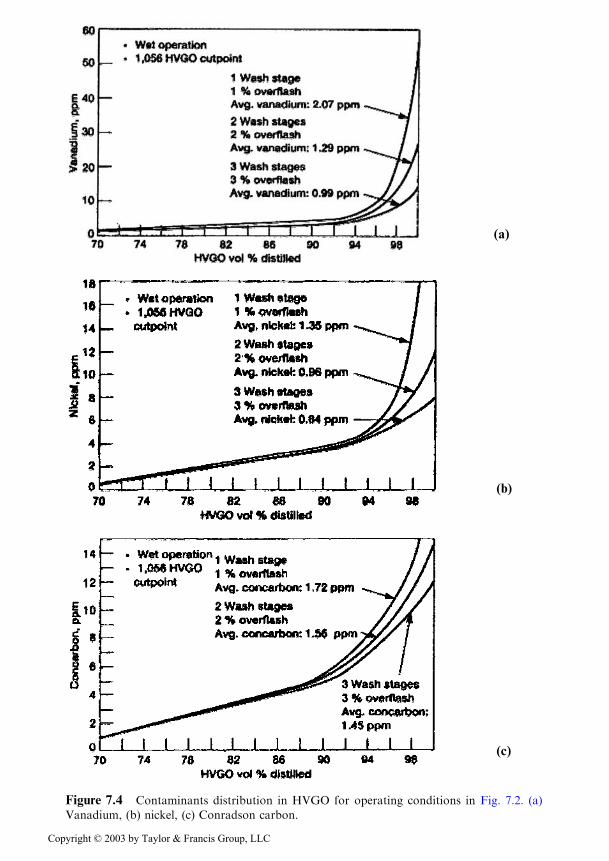
The variables were the number of theoretical trays in the stripping zone of theresidue and the overflash in volume % of the feed. For three sets of operatingconditions, the distillate with the end point of 5698C was redistilled and the contentof metals and coke were plotted against the % distilled (see Figure 7.4a, b, c) [1].
Attempts to reduce from 3 to 2 or to 1 the number of washing stages, keepingthe overflash at 3%, led to a substantial increase in metal content, especially ofvanadium, in the distillate. This proved that 3 wash stages were necessary.
The contacting efficiency achieved by the materials used for the trays of thewashing zone is also important. The height equivalent to a theoretical plate (HETP)was found to be for:
High efficiency metallic mesh 65–200 cm
Random packing 125–150 cm
Ordered packing 100–120 cm
Table 7.1 Conditions for Four Modes of Column Operation
Conditions 1 2 3 4
Operating conditions Dry Wet Damp no stripping Damp w/stripping
Column type Fig. 7.2 a or b b a b a
Steam:
coil (t/h) — 1.34 2.86 1.34
stripping — 1.82 — 1.82
Top pressure (mm Hg) 8 50 20 20
Flash zone pressure (mm Hg) 18 66 35 35
Overflash (%) 3 3 3 3
Copyright © 2003 by Taylor & Francis Group, LLC
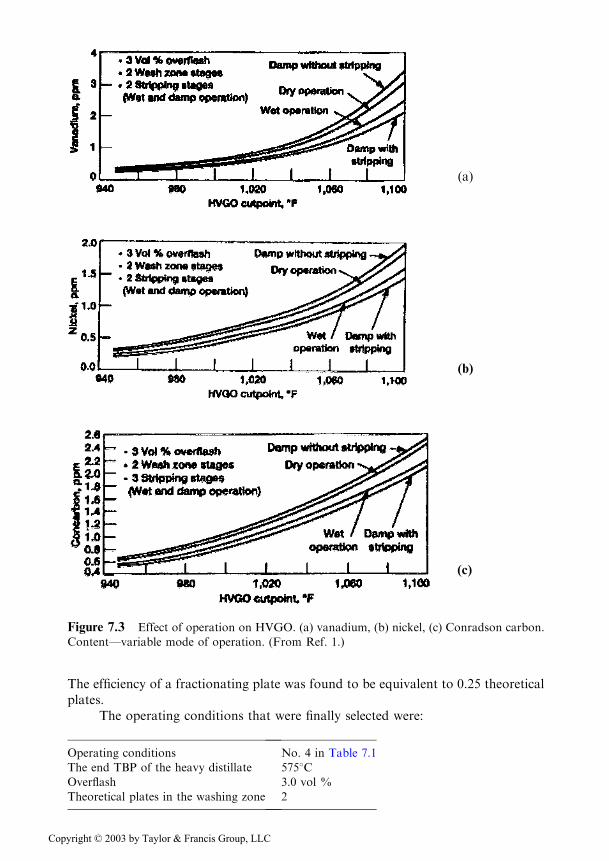
The efficiency of a fractionating plate was found to be equivalent to 0.25 theoreticalplates.
The operating conditions that were finally selected were:
Operating conditions No. 4 in Table 7.1
The end TBP of the heavy distillate 5758COverflash 3.0 vol %
Theoretical plates in the washing zone 2
Figure 7.3 Effect of operation on HVGO. (a) vanadium, (b) nickel, (c) Conradson carbon.
Content—variable mode of operation. (From Ref. 1.)
(a)
(b)
(c)
Copyright © 2003 by Taylor & Francis Group, LLC
(a)
Figure 7.4 Contaminants distribution in HVGO for operating conditions in Fig. 7.2. (a)
Vanadium, (b) nickel, (c) Conradson carbon.
(b)
(c)
Copyright © 2003 by Taylor & Francis Group, LLC

The results obtained in these conditions:
20.9% vol. of the feed as heavy distillate, containing:
0.85 ppm Ni
1.15 ppm V
1.5 ppm coke
Besides the problems of the number of theoretical trays in each section of thecolumn, of the side reflux, and of the residue stripping, the measures taken fordecreasing the formation of a fog of liquid drops in the vaporization zone of thecolumn are also important. Fog formation is favored by the high inlet velocity(about 90m/s) of the feed. From this point of view, the tangential inlet of the feedstream in the column is recommended, since it favors the separation of the liquiddrops under the effect of the centrifugal force, and of other constructive meansimplemented in the design of the vaporization zone [4].
7.1.2 Processing of the Vacuum Residue
At the beginning of this chapter, several processes were indicated for obtainingcatalytic cracking feedstocks from vacuum residues: visbreaking, coking, deasphalt-ing with lower alkanes, and also hydrocracking. Several synergies between fluidcatalytic cracking and hydroprocessing were also mentioned [77].
The main issues concerning the processes of visbreaking and coking were dis-cussed in Chapter 4 and those of hydrocracking in Chapter 11.
The deasphalting process applied here is different from the ‘‘classical’’ propanedeasphalting used for producing lubricating oils, since it uses higher alkanes andresults in significantly higher yields of deasphalted product. As shown in Table 7.2,the content of Ni, V, and coke in the deasphalted product increases with the mole-cular weight of the alkane solvent [5]. The data of this table are orientative only,since the yields and the metal content in the deasphalted product is to a large extent
Table 7.2 Deasphalting of Arabian Light Vacuum Residue
Characteristics and yields Feed
Deasphalted with
C3H8 C4H10 C5H12
Density (d154 ) 1.003 0.935 0.959 0.974
Viscosity at 1008C, cSt 345 34.9 63 105
Conradson carbon (wt %) 16.4 1.65 5.30 7.90
Asphaltenes (insoluble C7) (wt %) 4.20 <0.05 <0.05 <0.05
Nickel (ppm) 19 1.0 2.0 7.0
Vanadium (ppm) 61 1.4 2.6 15.5
Sulfur (wt %) 4.05 2.55 3.30 3.65
Nitrogen (ppm) 2,875 1,200 1,950 2,170
Yields, wt % 100 45.15 70.10 85.50
Source: Ref. 5.
Copyright © 2003 by Taylor & Francis Group, LLC

depending on the properties of the crude oil from which the vacuum distillate wasobtained and on the particularities of the deasphalting process.
Overall, the product from the classical propane deasphalting mixed with therespective vacuum distillate may be submitted without other treatments to the cat-alytic cracking in classical plants. The deasphalted product obtained from butanedeasphalting may be submitted directly to the catalytic cracking in mixture withvacuum distillate only in units designed for processing a heavy feed, whereas theproduct from pentane deasphalting needs to be hydrofined prior to catalytic crack-ing.
It is to be remarked that mixtures of light alkane hydrocarbons are often usedas solvents. Besides the C3�C5 alkanes, light gasolines containing no aromatichydrocarbons may be used as deasphalting solvents.
The selection of the type of deasphalting unit depends on the hydrocarbonsused. It is recommended that the plant should use supercritical conditions for therecovery of the solvent (as in the ROSE process) that lead to important energysavings. The detailed examination of the performance of various deasphaltingunits is beyond the framework of this book.
A comparison between the results obtained by the catalytical cracking of thevacuum distillate by itself and in mixture with the products from visbreaking, cok-ing, or deasphalting is given in Table 7.3. In the same table also the yields obtainedby direct cracking of straight run residue with or without previous hydrofining arealso given. These processes will be discussed in the next chapter.
7.1.3 Direct Use of the Straight Run Residue
The use of this feed became possible after catalytic crackers with two-step regenera-tors were developed. Such units can burn much larger amounts of coke than theearlier ones and have means for recovering the excess heat produced in the regen-erator. Also, catalysts with better tolerance towards contaminating metals weredeveloped.
The use of the straight run residue as feed for the catalytic cracking and thenecessity for its pretreatment depend upon the level of coke and especially of metalcontent. The limits accepted as guiding values are given in Table 7.4 [7–9].
Results obtained in the direct cracking of the straight run residue are comparedwith those of a distillate in Table 7.5.
The large amounts of metals present on the equilibrium catalyst make compul-sory the use of passivators, especially of antimony. The passivation leads to anincrease by about 4% of the gasoline/conversion ratio and to a decrease by about16% of the deposited coke. The reduced extent of the secondary reaction catalyzedby the metals (dehydrogenation, demethylation etc.) leads to a decrease by about45% of the hydrogen and by about 25% of the amount of C1�C2 hydrocarbonsproduced.
Quite different technologies were obtained by the combination of the catalyticcracking of residues with the contacting in a ‘‘riser’’ system of the feed with an inertsolid material, heated to high temperatures by the burning of the deposited coke—the ART [9,10] and 3D [11] processes.
These processes achieve in fact a coking on a heat carrier, in a riser system, atvery short contact time and high temperatures. The presence of butadiene in the
Copyright © 2003 by Taylor & Francis Group, LLC
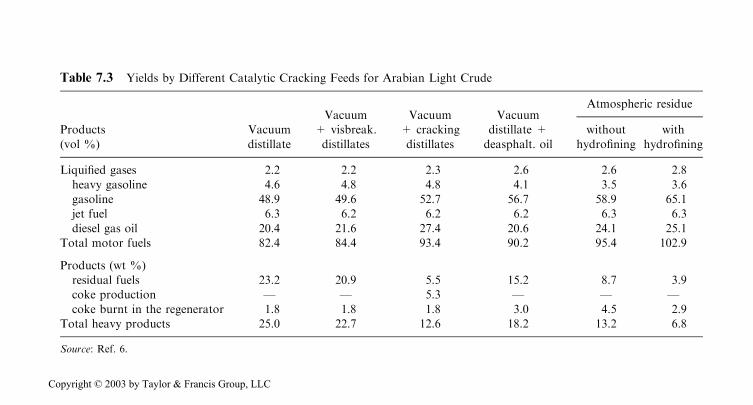
Table 7.3 Yields by Different Catalytic Cracking Feeds for Arabian Light Crude
Products
(vol %)
Vacuum
distillate
Vacuum
+ visbreak.
distillates
Vacuum
+ cracking
distillates
Vacuum
distillate +
deasphalt. oil
Atmospheric residue
without
hydrofining
with
hydrofining
Liquified gases 2.2 2.2 2.3 2.6 2.6 2.8
heavy gasoline 4.6 4.8 4.8 4.1 3.5 3.6
gasoline 48.9 49.6 52.7 56.7 58.9 65.1
jet fuel 6.3 6.2 6.2 6.2 6.3 6.3
diesel gas oil 20.4 21.6 27.4 20.6 24.1 25.1
Total motor fuels 82.4 84.4 93.4 90.2 95.4 102.9
Products (wt %)
residual fuels 23.2 20.9 5.5 15.2 8.7 3.9
coke production — — 5.3 — — —
coke burnt in the regenerator 1.8 1.8 1.8 3.0 4.5 2.9
Total heavy products 25.0 22.7 12.6 18.2 13.2 6.8
Source: Ref. 6.
Copyright © 2003 by Taylor & Francis Group, LLC
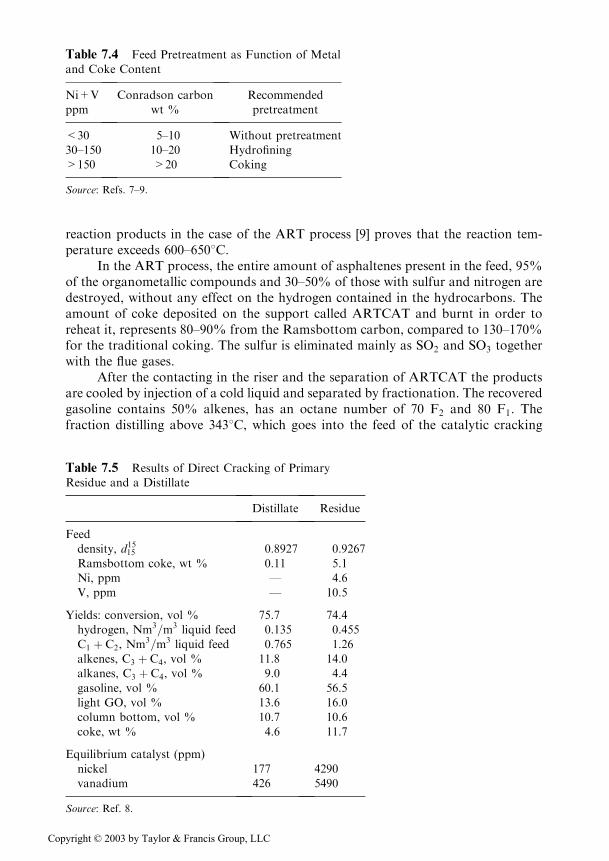
reaction products in the case of the ART process [9] proves that the reaction tem-perature exceeds 600–6508C.
In the ART process, the entire amount of asphaltenes present in the feed, 95%of the organometallic compounds and 30–50% of those with sulfur and nitrogen aredestroyed, without any effect on the hydrogen contained in the hydrocarbons. Theamount of coke deposited on the support called ARTCAT and burnt in order toreheat it, represents 80–90% from the Ramsbottom carbon, compared to 130–170%for the traditional coking. The sulfur is eliminated mainly as SO2 and SO3 togetherwith the flue gases.
After the contacting in the riser and the separation of ARTCAT the productsare cooled by injection of a cold liquid and separated by fractionation. The recoveredgasoline contains 50% alkenes, has an octane number of 70 F2 and 80 F1. Thefraction distilling above 3438C, which goes into the feed of the catalytic cracking
Table 7.4 Feed Pretreatment as Function of Metal
and Coke Content
Ni+V
ppm
Conradson carbon
wt %
Recommended
pretreatment
<30 5–10 Without pretreatment
30–150 10–20 Hydrofining
>150 >20 Coking
Source: Refs. 7–9.
Table 7.5 Results of Direct Cracking of Primary
Residue and a Distillate
Distillate Residue
Feed
density, d1515 0.8927 0.9267
Ramsbottom coke, wt % 0.11 5.1
Ni, ppm — 4.6
V, ppm — 10.5
Yields: conversion, vol % 75.7 74.4
hydrogen, Nm3=m3 liquid feed 0.135 0.455
C1 þ C2, Nm3=m3 liquid feed 0.765 1.26
alkenes, C3 þ C4, vol % 11.8 14.0
alkanes, C3 þ C4, vol % 9.0 4.4
gasoline, vol % 60.1 56.5
light GO, vol % 13.6 16.0
column bottom, vol % 10.7 10.6
coke, wt % 4.6 11.7
Equilibrium catalyst (ppm)
nickel 177 4290
vanadium 426 5490
Source: Ref. 8.
Copyright © 2003 by Taylor & Francis Group, LLC
or of the hydrocracking, is similar to a vacuum distillate. The process makes possiblethe conversion of very heavy vacuum residues and even of the natural bitumens [9].A portion of the ARTCAT is consumed in the process.
The solid inert contact material used in the 3D process [11] is not consumed inthe process. It allows the processing of very heavy feeds having densities of the order0.975, and containing about 43% components with boiling temperatures above5408C and 10.7% Conradson carbon. Since it contains 2.6% S and 440 ppm metals,the product resulting from the contacting requires a preliminary hydrofining beforebeing submitted to catalytic cracking.
A 3D industrial plant with a capacity of 500,000 t/year was started in 1989 [11].The catalytical cracking of the liquid product obtained by the recovery of crude
oil by means of underground combustion is to some extent similar to the aboveprocesses. Raseev et al. studied the cracking of such a feed, with the followingcharacteristics [11]:
Density d204 ¼ 0:9274Characterization factor K ¼ 11:4Molecular mass M ¼ 347
Metals content 8.9 ppm
The comparative tests performed in a catalytic cracking unit with fixed bed ofcatalyst showed that this feed was similar to a coking distillate.
7.1.4 Feed Hydrofining
The hydrofining of the feed can significantly improve the performance of the cata-lytic cracking [12,13,77,78].
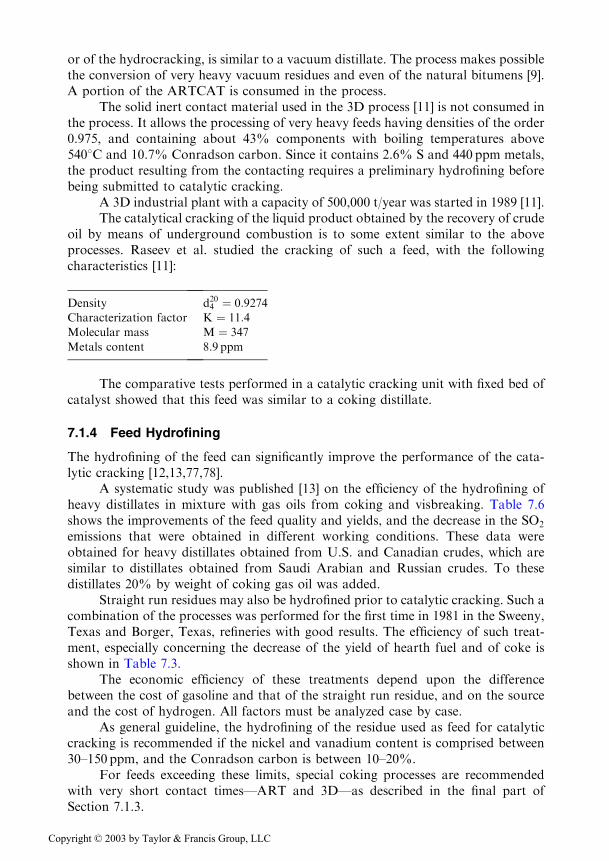
A systematic study was published [13] on the efficiency of the hydrofining ofheavy distillates in mixture with gas oils from coking and visbreaking. Table 7.6shows the improvements of the feed quality and yields, and the decrease in the SO2
emissions that were obtained in different working conditions. These data wereobtained for heavy distillates obtained from U.S. and Canadian crudes, which aresimilar to distillates obtained from Saudi Arabian and Russian crudes. To thesedistillates 20% by weight of coking gas oil was added.
Straight run residues may also be hydrofined prior to catalytic cracking. Such acombination of the processes was performed for the first time in 1981 in the Sweeny,Texas and Borger, Texas, refineries with good results. The efficiency of such treat-ment, especially concerning the decrease of the yield of hearth fuel and of coke isshown in Table 7.3.
The economic efficiency of these treatments depend upon the differencebetween the cost of gasoline and that of the straight run residue, and on the sourceand the cost of hydrogen. All factors must be analyzed case by case.
As general guideline, the hydrofining of the residue used as feed for catalyticcracking is recommended if the nickel and vanadium content is comprised between30–150 ppm, and the Conradson carbon is between 10–20%.
For feeds exceeding these limits, special coking processes are recommendedwith very short contact times—ART and 3D—as described in the final part ofSection 7.1.3.
Copyright © 2003 by Taylor & Francis Group, LLC
The hydrofining of the distillates is applied in a large number of catalyticcracking units. An important result is the almost complete reducing of SO2 emissionsto the atmosphere, a very important factor for the protection of the environment[78].
7.2 PROCESS HISTORY, TYPES OF UNITS
7.2.1 Fixed Bed and Moving Bed Units
The catalytic cracking process on alumosilica catalysts was implemented commer-cially for the first time by F. J. Houdry and Socony Vacuum Oil Co. with a fixed bedof catalyst in cyclic operation in a unit having a processing capacity of 320m3/day.
The unit, which started operation on April 6, 1936 in the Paulsboro, NewJersey refinery, was provided with 3 reactors. This ensured, by means of an auto-matic valve system, a cyclic operation: 10min reaction and 10min regeneration,separated by 5min of stripping.
Besides the technical difficulties in operation, including the removal of theregeneration heat, the process had the major disadvantage of continuous changeof the effluent composition along the cycle. The conversion decreased strongly asthe amount of coke deposited on the catalyst increased.
Table 7.6 FCC Results from Untreated and Treated Feeds Using
Hydrotreater/FCC
Untreated Low severity Moderate severity
HT severity
operating conditions
max.
naphtha
max.
naphtha
max.
diesel
max.
naphtha
max.
diesel
Feedstock
dens., g/cm3 0.9123 0.8866 0.8927 0.8745 0.8805
sulfur, w ppm 17,500 100 178 33 53
nitrogen, w ppm 1,050 140 185 8 10
UOP K index 11.75 11.96 12.10 12.12 12.27
VAPB, 8C 416 376 433 376 437
Products (wt %)
dry gas 4.0 2.9 1.8 3.1 2.0
LPG 14.0 16.6 9.8 19.4 11.4
gasoline 46.2 55.9 36.6 58.6 38.5
LCO 20.0 13.6 43.3 11.2 41.7
decant oil 9.8 4.7 4.4 3.3 3.3
coke 6.0 4.6 2.6 3.4 2.0
Sulfur (wppm)
gasoline 2,700 6 — <3 —
gas oil 27,400 146 — 70 —
decant oil 33,700 443 — 156 —
SO2 emission, g/kg of feed 4.235 0.109 — 0.037 —
Source: Ref. 13.
Copyright © 2003 by Taylor & Francis Group, LLC

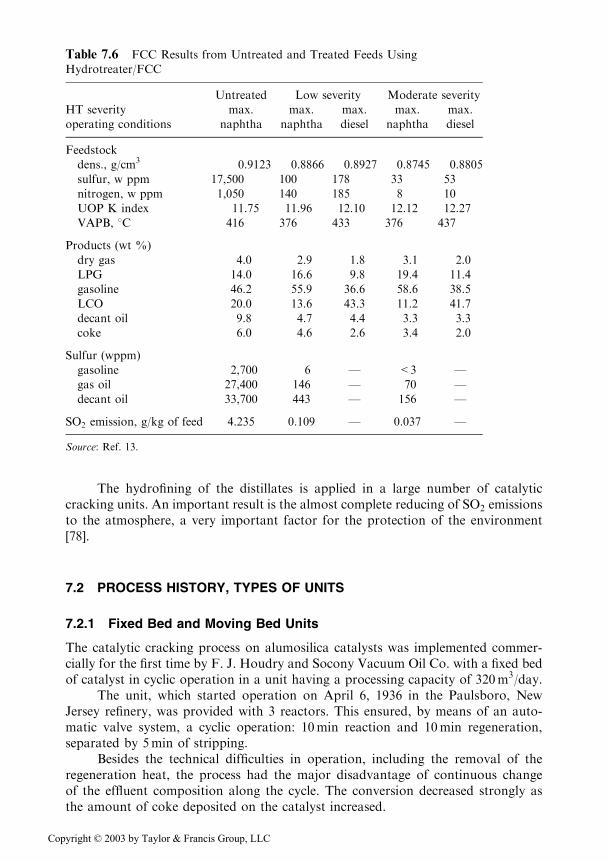
In order to eliminate this disadvantage, Socony Vacuum Co. developed a unitwith a moving bed of catalyst, the Thermofor Catalytic Cracker (TCC) in Figure 7.5,and simultaneously the Houdry process with moving bed shown in Figure 7.6. Asshown in the two figures, the difference between the two processes consists in sepa-rate vessels or in a unique body for the reactor and the regenerator.
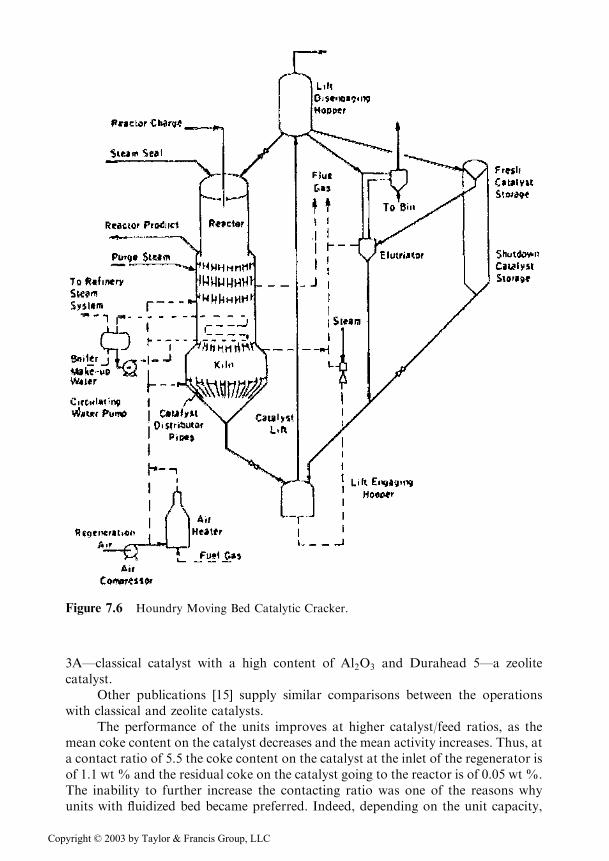
Initially, the catalyst was shaped as 3mm pellets while subsequent particleswere of spherical shape with the same diameter. The elevator system used at thebeginning was replaced in 1949 by pneumatic transport for the used catalyst, whichpermitted high catalyst/feed ratios and later on, the processing of heavier feeds. InFigure 7.7, the device located at the basis of the transport is sketched, which makespossible changing the contact ratio by acting on the flowrate of injected primary air.
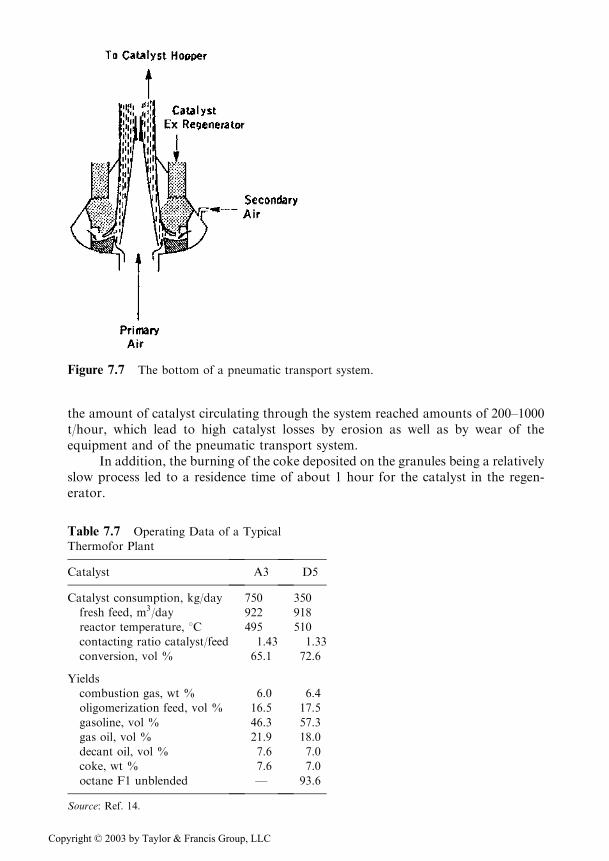
Operating data for a Thermofor unit was given in Table 7.7 [14]. They refer tothe processing of a gas oil from mid-Continent crude, having d20
4 ¼ 0:8984, 50%distillation at 4008C, characterization factor K ¼ 11:9. Two catalysts were used:
Figure 7.5 Sacony Vacuum Thermofor Catalytic Cracker.
Copyright © 2003 by Taylor & Francis Group, LLC
3A—classical catalyst with a high content of Al2O3 and Durahead 5—a zeolitecatalyst.
Other publications [15] supply similar comparisons between the operationswith classical and zeolite catalysts.
The performance of the units improves at higher catalyst/feed ratios, as themean coke content on the catalyst decreases and the mean activity increases. Thus, ata contact ratio of 5.5 the coke content on the catalyst at the inlet of the regenerator isof 1.1 wt % and the residual coke on the catalyst going to the reactor is of 0.05 wt %.The inability to further increase the contacting ratio was one of the reasons whyunits with fluidized bed became preferred. Indeed, depending on the unit capacity,
Figure 7.6 Houndry Moving Bed Catalytic Cracker.
Copyright © 2003 by Taylor & Francis Group, LLC
the amount of catalyst circulating through the system reached amounts of 200–1000t/hour, which lead to high catalyst losses by erosion as well as by wear of theequipment and of the pneumatic transport system.
In addition, the burning of the coke deposited on the granules being a relativelyslow process led to a residence time of about 1 hour for the catalyst in the regen-erator.
Figure 7.7 The bottom of a pneumatic transport system.
Table 7.7 Operating Data of a Typical
Thermofor Plant
Catalyst A3 D5
Catalyst consumption, kg/day 750 350
fresh feed, m3/day 922 918
reactor temperature, 8C 495 510
contacting ratio catalyst/feed 1.43 1.33
conversion, vol % 65.1 72.6
Yields
combustion gas, wt % 6.0 6.4
oligomerization feed, vol % 16.5 17.5
gasoline, vol % 46.3 57.3
gas oil, vol % 21.9 18.0
decant oil, vol % 7.6 7.0
coke, wt % 7.6 7.0
octane F1 unblended — 93.6
Source: Ref. 14.
Copyright © 2003 by Taylor & Francis Group, LLC

The sizes of the reactor also became important. The reactor for a unit of 1million t/year has a diameter of 5m and a height of the catalyst bed of 4–5m.
For all these reasons and other technical difficulties, the capacity of the plantswith moving bed did not exceed 1.5 million t/year and they were or are graduallybeing replaced by fluidized bed units.
More details on this process, its various variations, examples of performancedata and its estimation, and design methods for the reactor–regenerator system arepresented in an earlier work of the author [4] and in other studies [16–18].
7.2.2 ‘‘Classical’’ Fluid Bed Units
The first catalytic cracking unit in fluidized bed was started in May 1942 at the BatonRouge refinery of Standard Oil Co. as a result of a conjugated effort of a greatnumber of American petroleum companies, determined by the state of war. For thesame reason, in a relatively short time, the number of the units in the U.S. increasedconsiderably. The processing capacities in the occidental countries reached the fol-lowing values:
Year m3/day
1945 160,000
1950 270,000
1960 830,000
1970 1320,000
1978 1575,000
In 1995 in the U.S. alone, the number of the units exceeds 350 and the proces-sing capacity is over 1,600,000m3/day.
The first catalytic cracking unit, called Model I, is characterized by the ascend-ing circulation of the catalyst through the reactor and the regenerator, together withthe reaction products, and the flue gases respectively. The separation of the catalystis performed in external cyclone systems (see Figure 7.8). The plant had a processingcapacity of 2400m3/day and required 6000 tons steel, 3200m pipes, 209 controlinstruments, and 63 electromotors. A complete description of these beginnings wasmade by A. D. Reichle [17].
Only 3 Model I units were ever built, being followed by the Model II, char-acterized by the internal placement of the cyclones, fluidization in dense phase, anddescendent pipes for catalyst transport at its exit from the reactor and regenerator(see Figure 7.9). These solutions decreased the diameter of the reactor and theregenerator and the necessary amount of metal. The first Model II unit was startedat the end of 1942, also in the Baton Rouge refinery, where several months before theoperation of the Model I unit was started.
The Model II units were reproduced in the former Soviet Union under thename of A-1 and then B-1. A type B-1 unit was installed in the Onesti Refinery inRomania.
The Model III unit differs from Model II by the location at the same level ofthe reactor and of the regenerator, which required the use of a higher pressure for the
Copyright © 2003 by Taylor & Francis Group, LLC
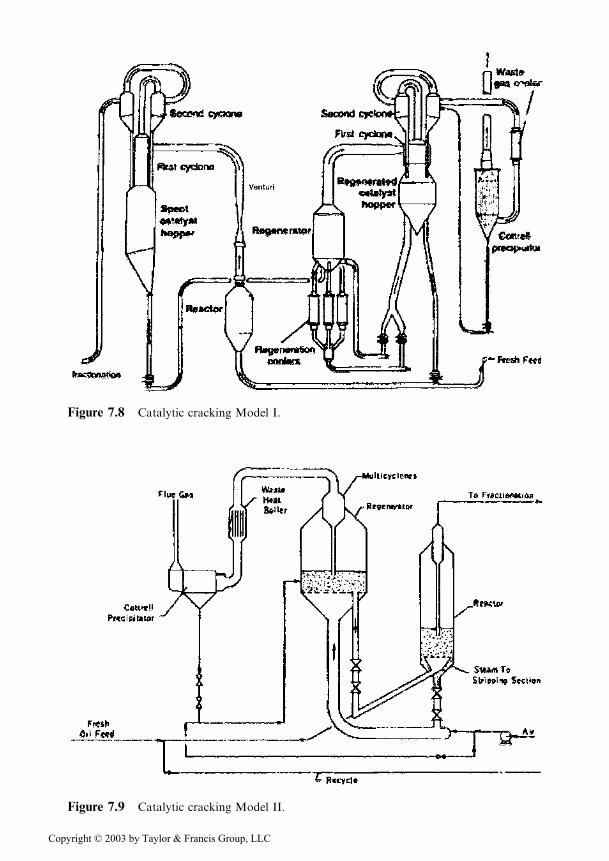
Figure 7.8 Catalytic cracking Model I.
Figure 7.9 Catalytic cracking Model II.
Copyright © 2003 by Taylor & Francis Group, LLC
regeneration air. Higher pressure became possible due to improved compressionequipment.
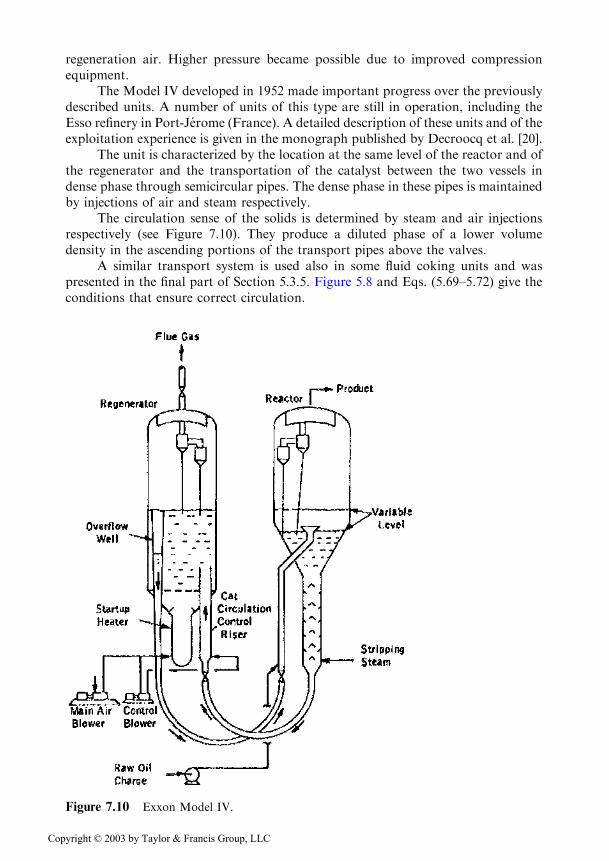
The Model IV developed in 1952 made important progress over the previouslydescribed units. A number of units of this type are still in operation, including theEsso refinery in Port-Jerome (France). A detailed description of these units and of theexploitation experience is given in the monograph published by Decroocq et al. [20].
The unit is characterized by the location at the same level of the reactor and ofthe regenerator and the transportation of the catalyst between the two vessels indense phase through semicircular pipes. The dense phase in these pipes is maintainedby injections of air and steam respectively.
The circulation sense of the solids is determined by steam and air injectionsrespectively (see Figure 7.10). They produce a diluted phase of a lower volumedensity in the ascending portions of the transport pipes above the valves.
A similar transport system is used also in some fluid coking units and waspresented in the final part of Section 5.3.5. Figure 5.8 and Eqs. (5.69–5.72) give theconditions that ensure correct circulation.
Figure 7.10 Exxon Model IV.
Copyright © 2003 by Taylor & Francis Group, LLC

Another characteristic of this unit is the increase of the diameters of the reactorand regenerator in their upper part, which ensures a dense phase of fluidized catalystbetween the distributor and this section with a bulk density of about 0.3 g/cm3. Theincrease of the diameter in the upper part decreases the amount of catalyst which isin this zone and accordingly decreases the rate of the overcracking reactions that leadto the decomposition of the gasoline to gases. Figure 7.11 gives the variation of thebulk density along the reactor height for different operating condition [21].
Another design adopted in the same period was to locate the reactor and theregenerator, coaxially, one above the other. This resulted in metal economy and thedecrease of investment costs.
Thus units were built with the reactor overlapping the regenerator as in theUOP ‘‘stacked unit’’ (1947) and the Kellogg Orthoflow A (1951), and wherein theregenerator is overlapped to the reactor: Orthoflow B. The first option correspondsto a higher pressure in the regenerator, which increases the burning rate of the cokeand leads to the decrease of the equipment diameter, but in exchange, needs a largerconsumption of energy for air compression. The schematic flow sheet of theOrthoflow system A is given in Figure 7.12.
A more detailed description of the catalytic cracking units of the classical typeincluding the sizes and the characteristic operating parameters, the yields, and thequality of the products was presented earlier by Raseev [4] and by other authors,such as Wuithier [22].
7.2.3 Units with Riser Reactors
The reactors of units of the classical type, which are described in the previous sec-tion, are characterized by intense backmixing of the catalyst and of the hydrocar-bons, the behavior of the reactor being similar to that of a perfectly mixed reactor.On the other hand, the reactor of the ‘‘riser’’ type is in fact a tubular plug-flowreactor.
Figure 7.11 Variation of catalyst bulk density in Model IV reactors. (From Ref. 21.)
Copyright © 2003 by Taylor & Francis Group, LLC
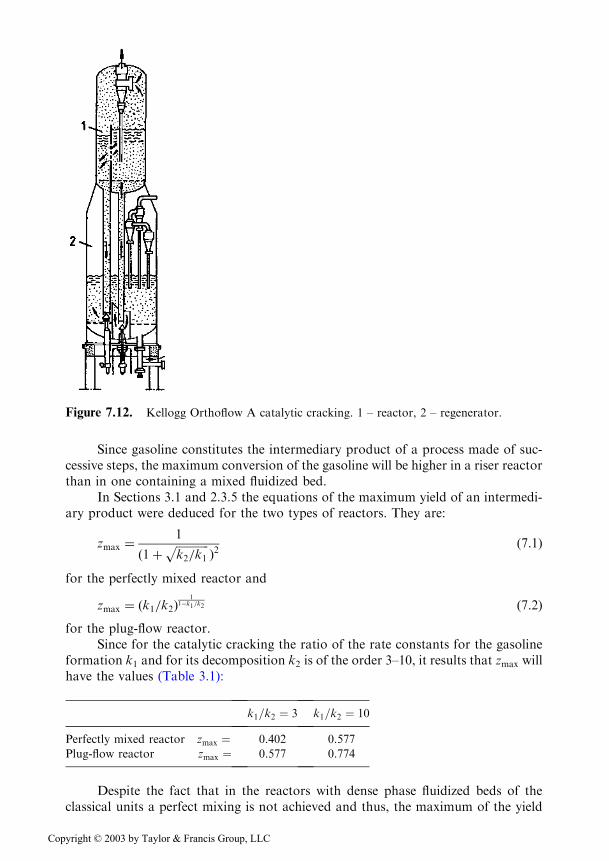
Since gasoline constitutes the intermediary product of a process made of suc-cessive steps, the maximum conversion of the gasoline will be higher in a riser reactorthan in one containing a mixed fluidized bed.
In Sections 3.1 and 2.3.5 the equations of the maximum yield of an intermedi-ary product were deduced for the two types of reactors. They are:
zmax ¼1
ð1þffiffiffiffiffiffiffiffiffiffiffiffik2=k1
pÞ2 ð7:1Þ
for the perfectly mixed reactor and
zmax ¼ ðk1=k2Þ1
1�k1=k2 ð7:2Þfor the plug-flow reactor.
Since for the catalytic cracking the ratio of the rate constants for the gasolineformation k1 and for its decomposition k2 is of the order 3–10, it results that zmax willhave the values (Table 3.1):
k1=k2 ¼ 3 k1=k2 ¼ 10
Perfectly mixed reactor zmax ¼ 0.402 0.577
Plug-flow reactor zmax ¼ 0.577 0.774
Despite the fact that in the reactors with dense phase fluidized beds of theclassical units a perfect mixing is not achieved and thus, the maximum of the yield
Figure 7.12. Kellogg Orthoflow A catalytic cracking. 1 – reactor, 2 – regenerator.
Copyright © 2003 by Taylor & Francis Group, LLC

will have somewhat larger values and the kinetic of the catalytic cracking is morecomplex than that for two successive reactions, the advantages of the reactor of the‘‘riser’’ reactors are obvious.
Therefore, after 1960, when the first riser type unit was developed by Kellogg,all new units are provided with a reactor of this type. Moreover, the classical plantsin operation were revamped and the reaction system was modified to riser.
7.2.3.1 Revamping of Classical Units
The revamping of classical catalytic cracking units by the incorporation of the‘‘riser’’ reactor was applied to all plants in operation. The manner in which therevamping was implemented depends on the type of the classical unit.
The following examples refer to plants IA/IM, which are similar to the classicalModel II, of the former Soviet Union and to the Model IV, which was revamped atthe ESSO Refinery of Port-Jerome (France) and the revamping of a riser plant inCaltex Refinery in Kurnell (NSW, Australia).
Revamping of the plant of the type IA/IM. A complex program for the moderni-zation of the IA/IM units, with the purpose of bringing them to the performancesof the modern plants, was decided in 1985 and comprised of 8 tasks, of which 5were implemented by the year 1992 [23].
The process scheme of the system reactor–regenerator, as it will appear after allthe modifications have been implemented is shown in Fig. 7.13.
The performed modifications refer to: a) use of high efficiency dispersers forachieving a good mixing of the feed with the regenerated catalyst; b) increase oftemperature in the catalyst-feed mixing point, which leads to the increase of thetemperature in the transport line to the reactor, which fulfils thus the part of ariser; c) improvement of the valves on the transport lines; d) use of promoters forthe CO! CO2, conversion, which increases the temperature in the catalyst-feedmixing point; e) additives for decreasing the emissions of SO2 and SO3.Concomitantly, the catalysts were replaced with others that are more active andmore resistant to attrition.
Until the end of 1992, the following modifications were implemented: f) themodification of the devices through which the catalyst-feed mixture enters the reac-tor; g) the two-step regeneration of the catalyst, the first taking place in a centralfluidization chamber, marked by 10 in the figure; h) the completion of the system forthe retaining of the catalyst fines by installing a group of external cyclones and theuse of existing Cottrell filters, without reintroducing into the system the dust retainedtherein. The last measures limited the concentration of the catalyst in the flue gasesto 0.15 mg/m3, compared to 0.6 g/m3 reported previously.
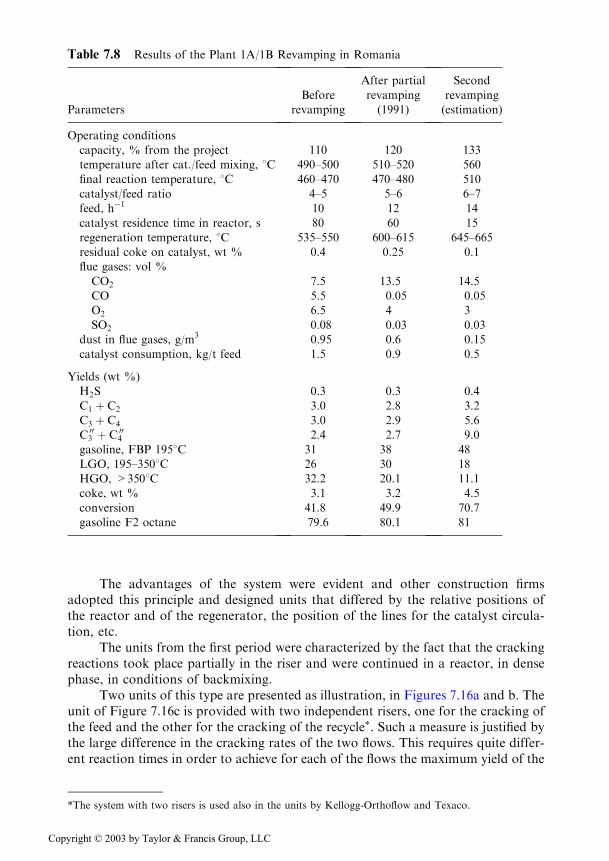
The results following the revamping are compared in Table 7.8, with the pre-vious situation and the final results obtained after the completion of the revamping.
Revamping of the Model IV unit. The Model IV unit was presented in Figure7.10 and described, in its classical version, in Section 7.2.2.
The modifications focused on the reactor and they were performed in succes-sion as indicated by a, b, and c in Figure 7.14 [20]. The modifications are justified bythe fact that for the zeolitic catalyst used, the maximum gasoline yield corresponds tothe composition at the inlet in the vessel marked ‘‘reactor’’, the transfer pipe fulfillingthe part of riser (see Figure 7.15) [24].
Copyright © 2003 by Taylor & Francis Group, LLC
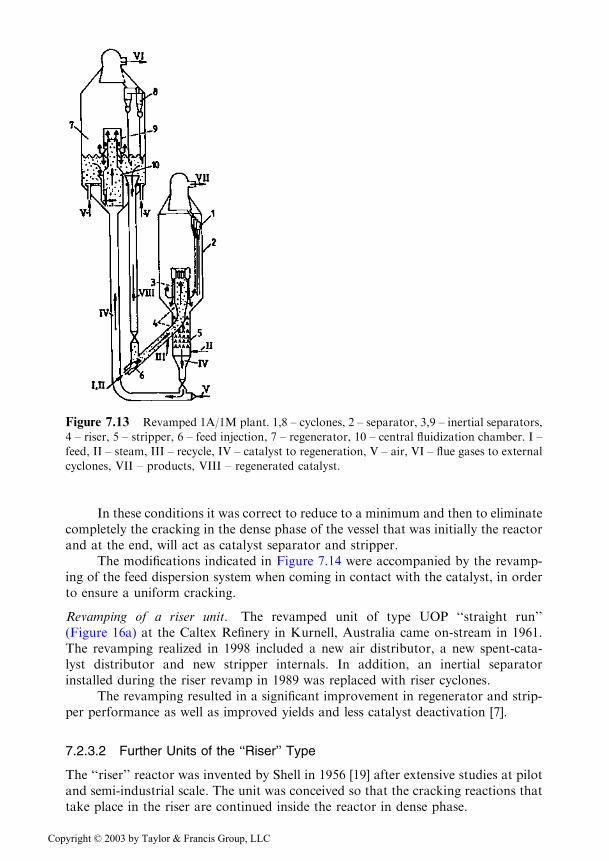
In these conditions it was correct to reduce to a minimum and then to eliminatecompletely the cracking in the dense phase of the vessel that was initially the reactorand at the end, will act as catalyst separator and stripper.
The modifications indicated in Figure 7.14 were accompanied by the revamp-ing of the feed dispersion system when coming in contact with the catalyst, in orderto ensure a uniform cracking.
Revamping of a riser unit. The revamped unit of type UOP ‘‘straight run’’(Figure 16a) at the Caltex Refinery in Kurnell, Australia came on-stream in 1961.The revamping realized in 1998 included a new air distributor, a new spent-cata-lyst distributor and new stripper internals. In addition, an inertial separatorinstalled during the riser revamp in 1989 was replaced with riser cyclones.
The revamping resulted in a significant improvement in regenerator and strip-per performance as well as improved yields and less catalyst deactivation [7].
7.2.3.2 Further Units of the ‘‘Riser’’ Type
The ‘‘riser’’ reactor was invented by Shell in 1956 [19] after extensive studies at pilotand semi-industrial scale. The unit was conceived so that the cracking reactions thattake place in the riser are continued inside the reactor in dense phase.
Figure 7.13 Revamped 1A/1M plant. 1,8 – cyclones, 2 – separator, 3,9 – inertial separators,
4 – riser, 5 – stripper, 6 – feed injection, 7 – regenerator, 10 – central fluidization chamber. I –
feed, II – steam, III – recycle, IV – catalyst to regeneration, V – air, VI – flue gases to external
cyclones, VII – products, VIII – regenerated catalyst.
Copyright © 2003 by Taylor & Francis Group, LLC
The advantages of the system were evident and other construction firmsadopted this principle and designed units that differed by the relative positions ofthe reactor and of the regenerator, the position of the lines for the catalyst circula-tion, etc.
The units from the first period were characterized by the fact that the crackingreactions took place partially in the riser and were continued in a reactor, in densephase, in conditions of backmixing.
Two units of this type are presented as illustration, in Figures 7.16a and b. Theunit of Figure 7.16c is provided with two independent risers, one for the cracking ofthe feed and the other for the cracking of the recycle�. Such a measure is justified bythe large difference in the cracking rates of the two flows. This requires quite differ-ent reaction times in order to achieve for each of the flows the maximum yield of the
Table 7.8 Results of the Plant 1A/1B Revamping in Romania
Parameters
Before
revamping
After partial
revamping
(1991)
Second
revamping
(estimation)
Operating conditions
capacity, % from the project 110 120 133
temperature after cat./feed mixing, 8C 490–500 510–520 560
final reaction temperature, 8C 460–470 470–480 510
catalyst/feed ratio 4–5 5–6 6–7
feed, h�1 10 12 14
catalyst residence time in reactor, s 80 60 15
regeneration temperature, 8C 535–550 600–615 645–665
residual coke on catalyst, wt % 0.4 0.25 0.1
flue gases: vol %
CO2 7.5 13.5 14.5
CO 5.5 0.05 0.05
O2 6.5 4 3
SO2 0.08 0.03 0.03
dust in flue gases, g/m3 0.95 0.6 0.15
catalyst consumption, kg/t feed 1.5 0.9 0.5
Yields (wt %)
H2S 0.3 0.3 0.4
C1 þ C2 3.0 2.8 3.2
C3 þ C4 3.0 2.9 5.6
C 003 þ C 00
4 2.4 2.7 9.0
gasoline, FBP 1958C 31 38 48
LGO, 195–3508C 26 30 18
HGO, >3508C 32.2 20.1 11.1
coke, wt % 3.1 3.2 4.5
conversion 41.8 49.9 70.7
gasoline F2 octane 79.6 80.1 81
*The system with two risers is used also in the units by Kellogg-Orthoflow and Texaco.
Copyright © 2003 by Taylor & Francis Group, LLC
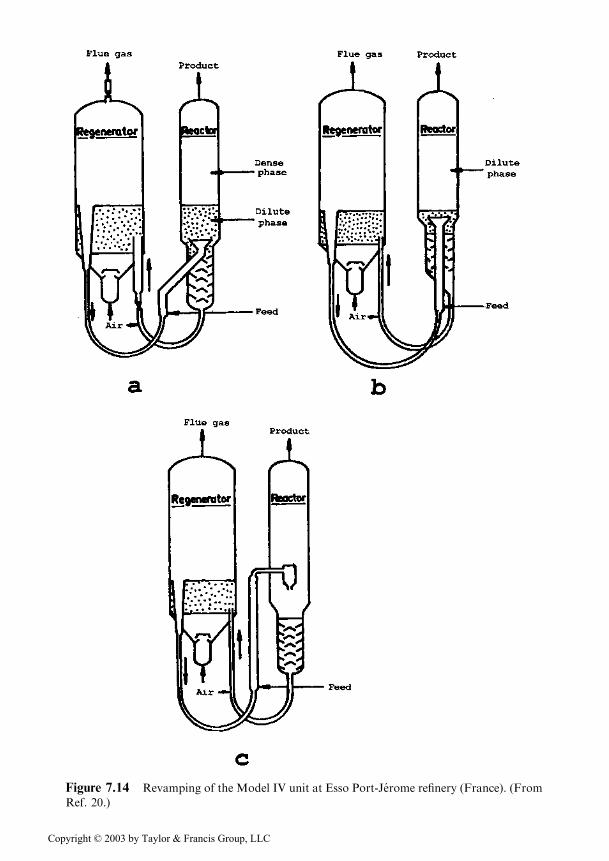
Figure 7.14 Revamping of the Model IV unit at Esso Port-Jerome refinery (France). (From
Ref. 20.)
Copyright © 2003 by Taylor & Francis Group, LLC
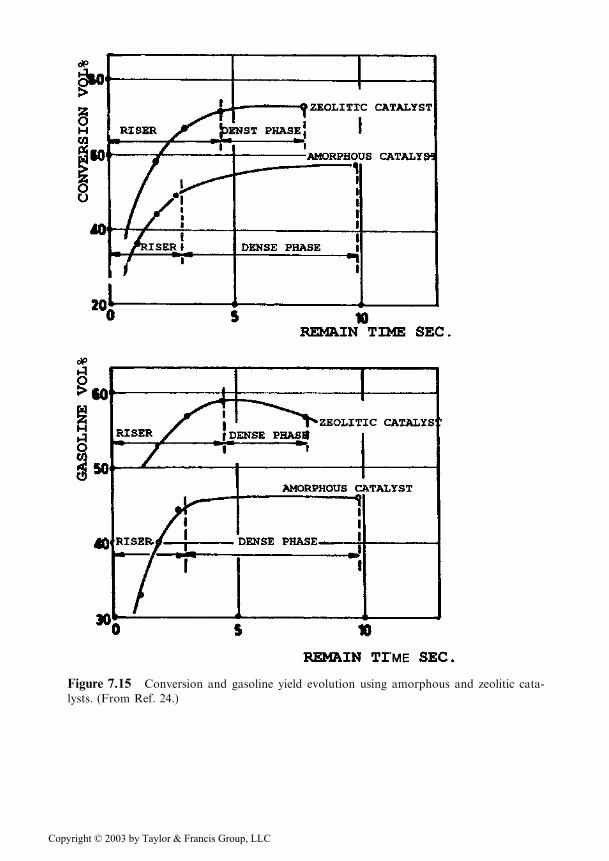
Figure 7.15 Conversion and gasoline yield evolution using amorphous and zeolitic cata-
lysts. (From Ref. 24.)
Copyright © 2003 by Taylor & Francis Group, LLC
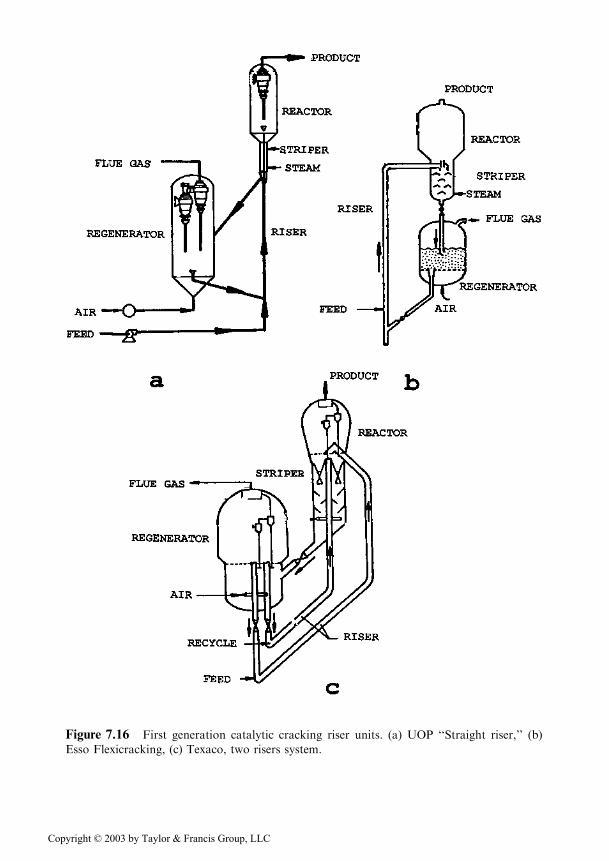
Figure 7.16 First generation catalytic cracking riser units. (a) UOP ‘‘Straight riser,’’ (b)
Esso Flexicracking, (c) Texaco, two risers system.
Copyright © 2003 by Taylor & Francis Group, LLC
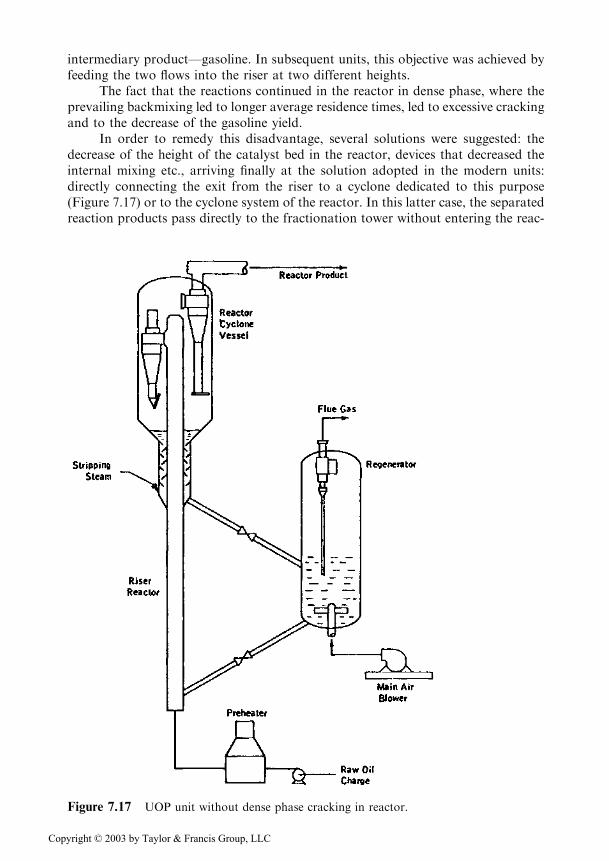
intermediary product—gasoline. In subsequent units, this objective was achieved byfeeding the two flows into the riser at two different heights.
The fact that the reactions continued in the reactor in dense phase, where theprevailing backmixing led to longer average residence times, led to excessive crackingand to the decrease of the gasoline yield.
In order to remedy this disadvantage, several solutions were suggested: thedecrease of the height of the catalyst bed in the reactor, devices that decreased theinternal mixing etc., arriving finally at the solution adopted in the modern units:directly connecting the exit from the riser to a cyclone dedicated to this purpose(Figure 7.17) or to the cyclone system of the reactor. In this latter case, the separatedreaction products pass directly to the fractionation tower without entering the reac-
Figure 7.17 UOP unit without dense phase cracking in reactor.
Copyright © 2003 by Taylor & Francis Group, LLC
tor, the role of which remains only to ensure the operation of catalyst stripping. Thesesolutions require, of course, substantial improvements of the performance of thecyclone system.
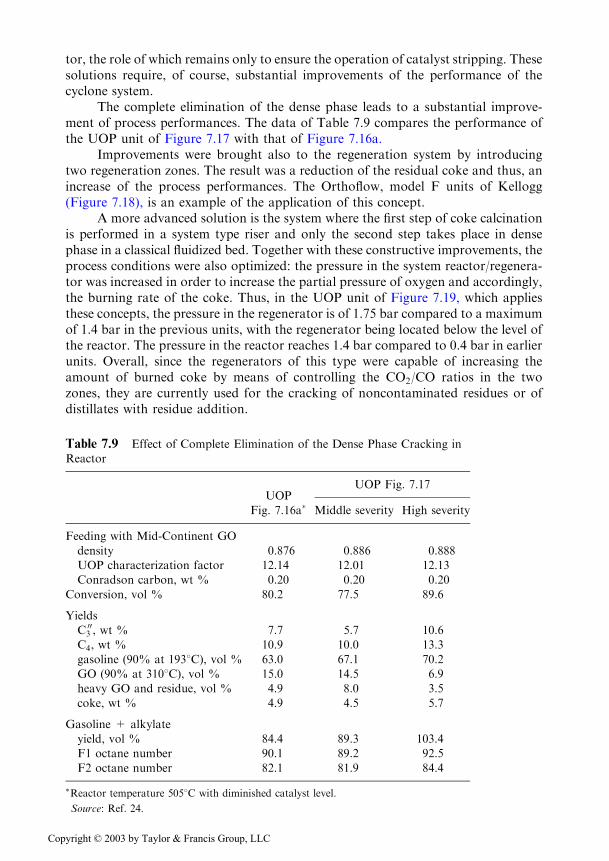
The complete elimination of the dense phase leads to a substantial improve-ment of process performances. The data of Table 7.9 compares the performance ofthe UOP unit of Figure 7.17 with that of Figure 7.16a.
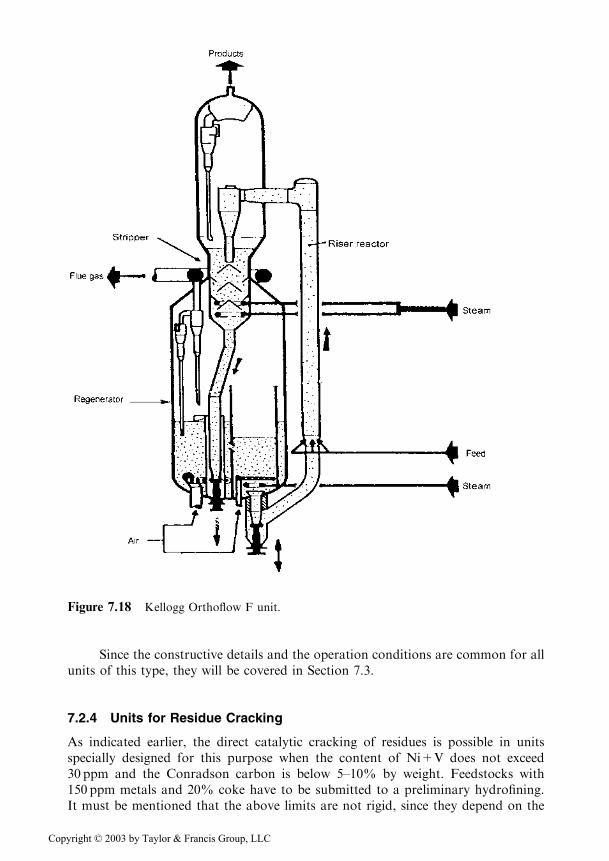
Improvements were brought also to the regeneration system by introducingtwo regeneration zones. The result was a reduction of the residual coke and thus, anincrease of the process performances. The Orthoflow, model F units of Kellogg(Figure 7.18), is an example of the application of this concept.
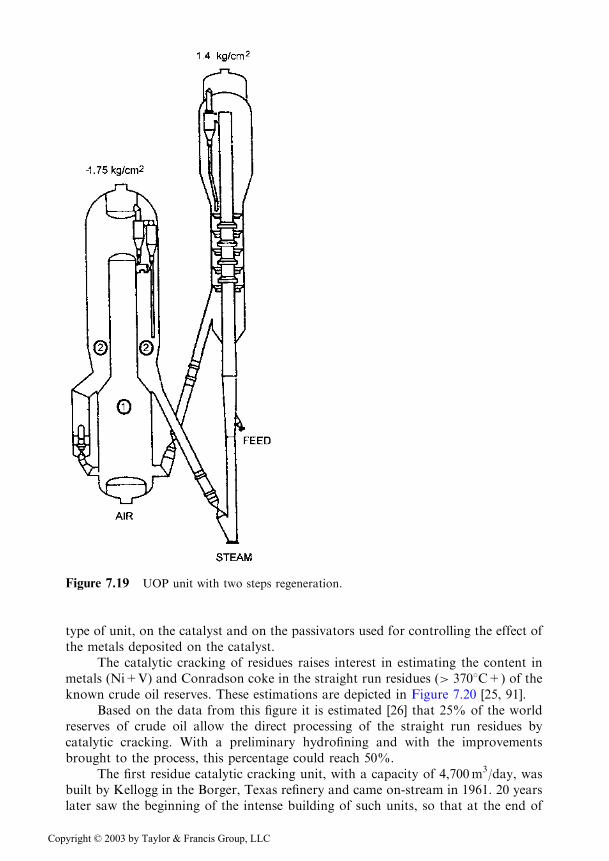
A more advanced solution is the system where the first step of coke calcinationis performed in a system type riser and only the second step takes place in densephase in a classical fluidized bed. Together with these constructive improvements, theprocess conditions were also optimized: the pressure in the system reactor/regenera-tor was increased in order to increase the partial pressure of oxygen and accordingly,the burning rate of the coke. Thus, in the UOP unit of Figure 7.19, which appliesthese concepts, the pressure in the regenerator is of 1.75 bar compared to a maximumof 1.4 bar in the previous units, with the regenerator being located below the level ofthe reactor. The pressure in the reactor reaches 1.4 bar compared to 0.4 bar in earlierunits. Overall, since the regenerators of this type were capable of increasing theamount of burned coke by means of controlling the CO2/CO ratios in the twozones, they are currently used for the cracking of noncontaminated residues or ofdistillates with residue addition.
Table 7.9 Effect of Complete Elimination of the Dense Phase Cracking in
Reactor
UOP
Fig. 7.16a�
UOP Fig. 7.17
Middle severity High severity
Feeding with Mid-Continent GO
density 0.876 0.886 0.888
UOP characterization factor 12.14 12.01 12.13
Conradson carbon, wt % 0.20 0.20 0.20
Conversion, vol % 80.2 77.5 89.6
Yields
C 003 , wt % 7.7 5.7 10.6
C4, wt % 10.9 10.0 13.3
gasoline (90% at 1938C), vol % 63.0 67.1 70.2
GO (90% at 3108C), vol % 15.0 14.5 6.9
heavy GO and residue, vol % 4.9 8.0 3.5
coke, wt % 4.9 4.5 5.7
Gasoline + alkylate
yield, vol % 84.4 89.3 103.4
F1 octane number 90.1 89.2 92.5
F2 octane number 82.1 81.9 84.4
�Reactor temperature 5058C with diminished catalyst level.
Source: Ref. 24.
Copyright © 2003 by Taylor & Francis Group, LLC
Since the constructive details and the operation conditions are common for allunits of this type, they will be covered in Section 7.3.
7.2.4 Units for Residue Cracking
As indicated earlier, the direct catalytic cracking of residues is possible in unitsspecially designed for this purpose when the content of Ni+V does not exceed30 ppm and the Conradson carbon is below 5–10% by weight. Feedstocks with150 ppm metals and 20% coke have to be submitted to a preliminary hydrofining.It must be mentioned that the above limits are not rigid, since they depend on the
Figure 7.18 Kellogg Orthoflow F unit.
Copyright © 2003 by Taylor & Francis Group, LLC
type of unit, on the catalyst and on the passivators used for controlling the effect ofthe metals deposited on the catalyst.
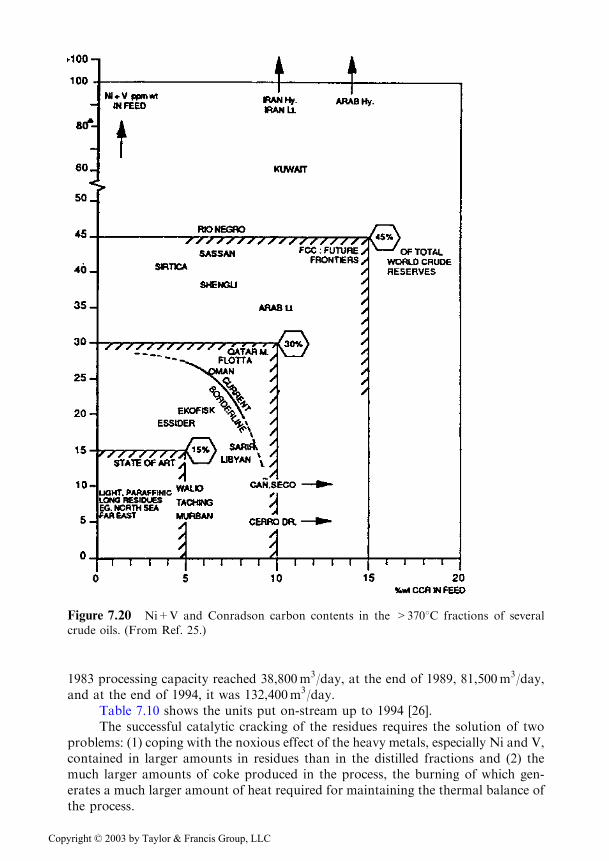
The catalytic cracking of residues raises interest in estimating the content inmetals (Ni+V) and Conradson coke in the straight run residues (> 3708C+) of theknown crude oil reserves. These estimations are depicted in Figure 7.20 [25, 91].
Based on the data from this figure it is estimated [26] that 25% of the worldreserves of crude oil allow the direct processing of the straight run residues bycatalytic cracking. With a preliminary hydrofining and with the improvementsbrought to the process, this percentage could reach 50%.
The first residue catalytic cracking unit, with a capacity of 4,700m3/day, wasbuilt by Kellogg in the Borger, Texas refinery and came on-stream in 1961. 20 yearslater saw the beginning of the intense building of such units, so that at the end of
Figure 7.19 UOP unit with two steps regeneration.
Copyright © 2003 by Taylor & Francis Group, LLC
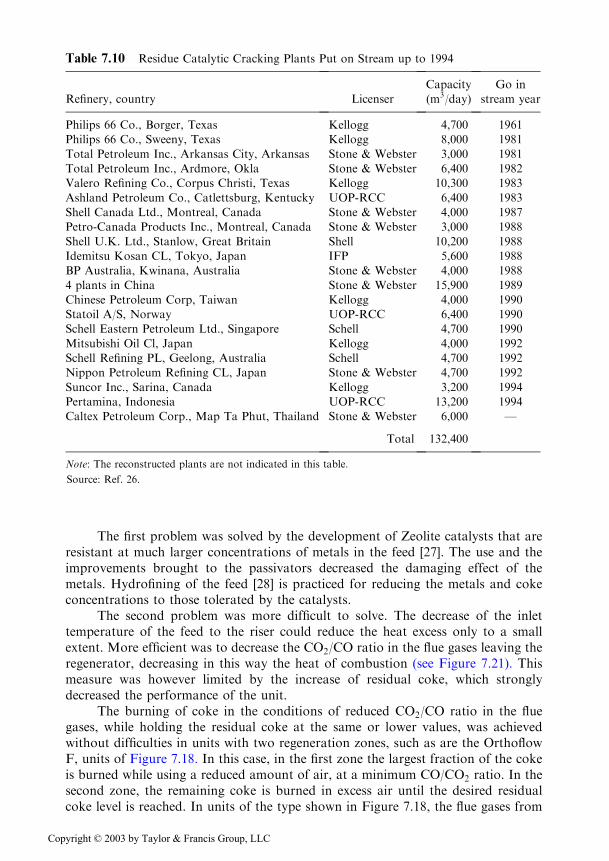
1983 processing capacity reached 38,800m3/day, at the end of 1989, 81,500m3/day,and at the end of 1994, it was 132,400m3/day.
Table 7.10 shows the units put on-stream up to 1994 [26].The successful catalytic cracking of the residues requires the solution of two
problems: (1) coping with the noxious effect of the heavy metals, especially Ni and V,contained in larger amounts in residues than in the distilled fractions and (2) themuch larger amounts of coke produced in the process, the burning of which gen-erates a much larger amount of heat required for maintaining the thermal balance ofthe process.
Figure 7.20 Ni+V and Conradson carbon contents in the >3708C fractions of several
crude oils. (From Ref. 25.)
Copyright © 2003 by Taylor & Francis Group, LLC
The first problem was solved by the development of Zeolite catalysts that areresistant at much larger concentrations of metals in the feed [27]. The use and theimprovements brought to the passivators decreased the damaging effect of themetals. Hydrofining of the feed [28] is practiced for reducing the metals and cokeconcentrations to those tolerated by the catalysts.
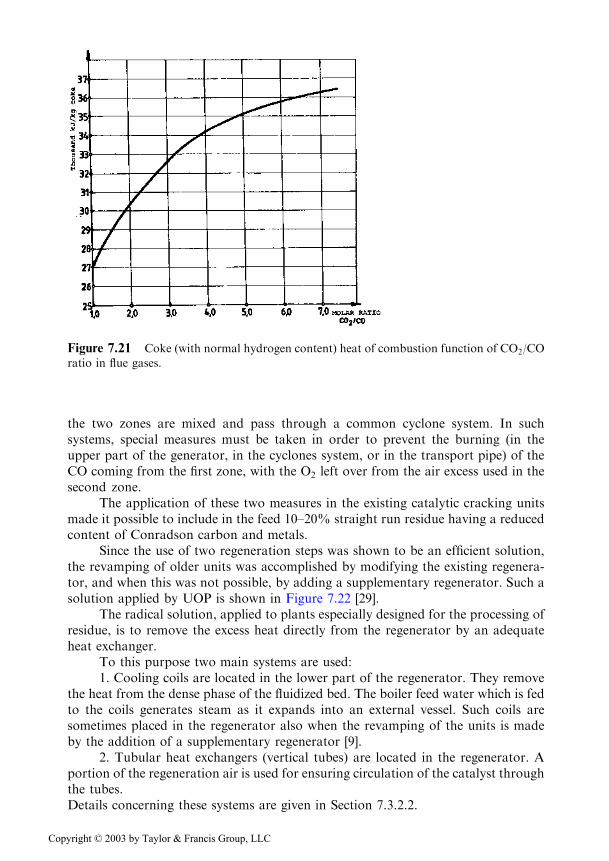
The second problem was more difficult to solve. The decrease of the inlettemperature of the feed to the riser could reduce the heat excess only to a smallextent. More efficient was to decrease the CO2/CO ratio in the flue gases leaving theregenerator, decreasing in this way the heat of combustion (see Figure 7.21). Thismeasure was however limited by the increase of residual coke, which stronglydecreased the performance of the unit.
The burning of coke in the conditions of reduced CO2/CO ratio in the fluegases, while holding the residual coke at the same or lower values, was achievedwithout difficulties in units with two regeneration zones, such as are the OrthoflowF, units of Figure 7.18. In this case, in the first zone the largest fraction of the cokeis burned while using a reduced amount of air, at a minimum CO/CO2 ratio. In thesecond zone, the remaining coke is burned in excess air until the desired residualcoke level is reached. In units of the type shown in Figure 7.18, the flue gases from
Table 7.10 Residue Catalytic Cracking Plants Put on Stream up to 1994
Refinery, country Licenser
Capacity
(m3/day)
Go in
stream year
Philips 66 Co., Borger, Texas Kellogg 4,700 1961
Philips 66 Co., Sweeny, Texas Kellogg 8,000 1981
Total Petroleum Inc., Arkansas City, Arkansas Stone & Webster 3,000 1981
Total Petroleum Inc., Ardmore, Okla Stone & Webster 6,400 1982
Valero Refining Co., Corpus Christi, Texas Kellogg 10,300 1983
Ashland Petroleum Co., Catlettsburg, Kentucky UOP-RCC 6,400 1983
Shell Canada Ltd., Montreal, Canada Stone & Webster 4,000 1987
Petro-Canada Products Inc., Montreal, Canada Stone & Webster 3,000 1988
Shell U.K. Ltd., Stanlow, Great Britain Shell 10,200 1988
Idemitsu Kosan CL, Tokyo, Japan IFP 5,600 1988
BP Australia, Kwinana, Australia Stone & Webster 4,000 1988
4 plants in China Stone & Webster 15,900 1989
Chinese Petroleum Corp, Taiwan Kellogg 4,000 1990
Statoil A/S, Norway UOP-RCC 6,400 1990
Schell Eastern Petroleum Ltd., Singapore Schell 4,700 1990
Mitsubishi Oil Cl, Japan Kellogg 4,000 1992
Schell Refining PL, Geelong, Australia Schell 4,700 1992
Nippon Petroleum Refining CL, Japan Stone & Webster 4,700 1992
Suncor Inc., Sarina, Canada Kellogg 3,200 1994
Pertamina, Indonesia UOP-RCC 13,200 1994
Caltex Petroleum Corp., Map Ta Phut, Thailand Stone & Webster 6,000 —
Total 132,400
Note: The reconstructed plants are not indicated in this table.
Source: Ref. 26.
Copyright © 2003 by Taylor & Francis Group, LLC
the two zones are mixed and pass through a common cyclone system. In suchsystems, special measures must be taken in order to prevent the burning (in theupper part of the generator, in the cyclones system, or in the transport pipe) of theCO coming from the first zone, with the O2 left over from the air excess used in thesecond zone.
The application of these two measures in the existing catalytic cracking unitsmade it possible to include in the feed 10–20% straight run residue having a reducedcontent of Conradson carbon and metals.
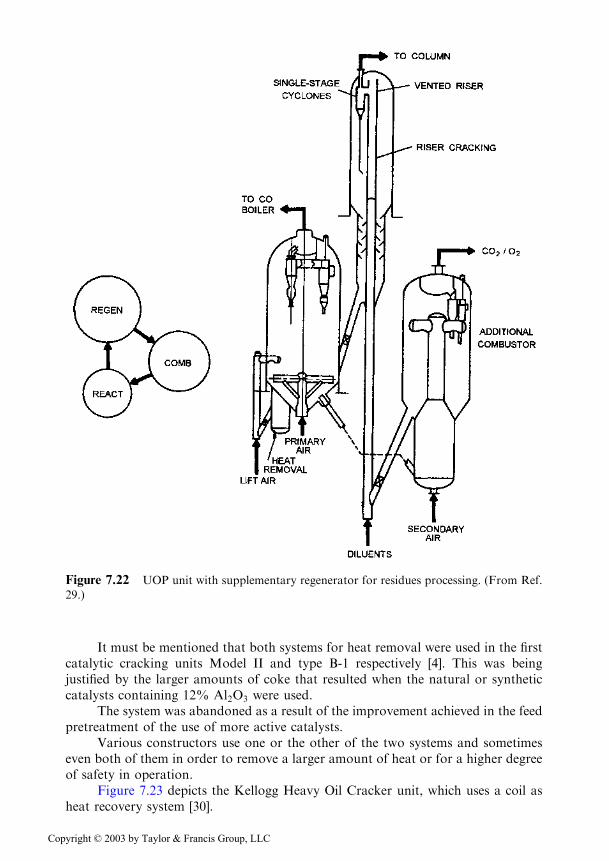
Since the use of two regeneration steps was shown to be an efficient solution,the revamping of older units was accomplished by modifying the existing regenera-tor, and when this was not possible, by adding a supplementary regenerator. Such asolution applied by UOP is shown in Figure 7.22 [29].
The radical solution, applied to plants especially designed for the processing ofresidue, is to remove the excess heat directly from the regenerator by an adequateheat exchanger.
To this purpose two main systems are used:1. Cooling coils are located in the lower part of the regenerator. They remove
the heat from the dense phase of the fluidized bed. The boiler feed water which is fedto the coils generates steam as it expands into an external vessel. Such coils aresometimes placed in the regenerator also when the revamping of the units is madeby the addition of a supplementary regenerator [9].
2. Tubular heat exchangers (vertical tubes) are located in the regenerator. Aportion of the regeneration air is used for ensuring circulation of the catalyst throughthe tubes.Details concerning these systems are given in Section 7.3.2.2.
Figure 7.21 Coke (with normal hydrogen content) heat of combustion function of CO2/CO
ratio in flue gases.
Copyright © 2003 by Taylor & Francis Group, LLC
It must be mentioned that both systems for heat removal were used in the firstcatalytic cracking units Model II and type B-1 respectively [4]. This was beingjustified by the larger amounts of coke that resulted when the natural or syntheticcatalysts containing 12% Al2O3 were used.
The system was abandoned as a result of the improvement achieved in the feedpretreatment of the use of more active catalysts.
Various constructors use one or the other of the two systems and sometimeseven both of them in order to remove a larger amount of heat or for a higher degreeof safety in operation.
Figure 7.23 depicts the Kellogg Heavy Oil Cracker unit, which uses a coil asheat recovery system [30].
Figure 7.22 UOP unit with supplementary regenerator for residues processing. (From Ref.
29.)
Copyright © 2003 by Taylor & Francis Group, LLC
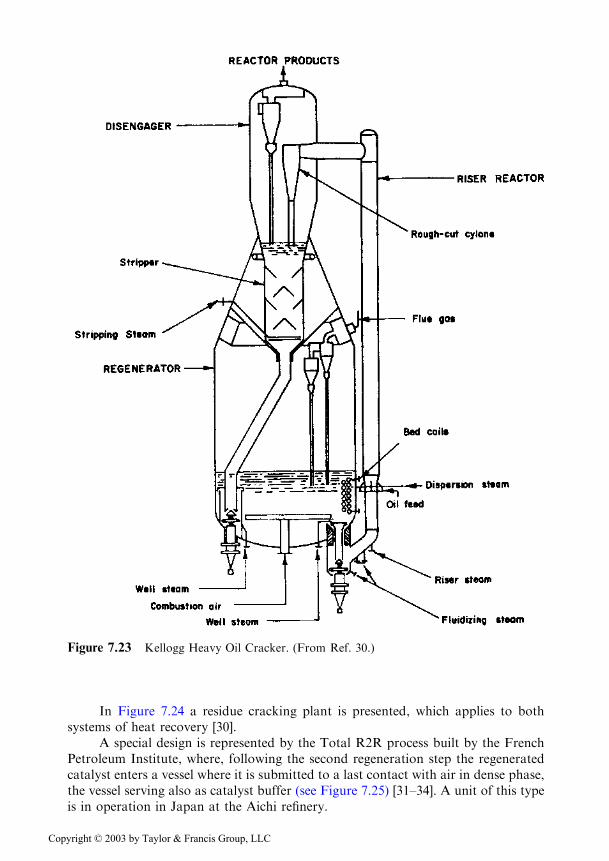
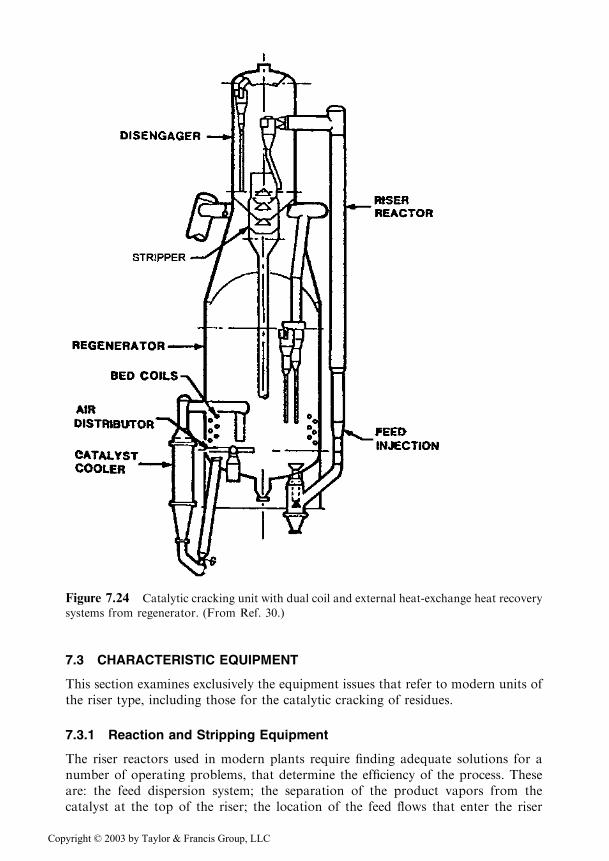
In Figure 7.24 a residue cracking plant is presented, which applies to bothsystems of heat recovery [30].
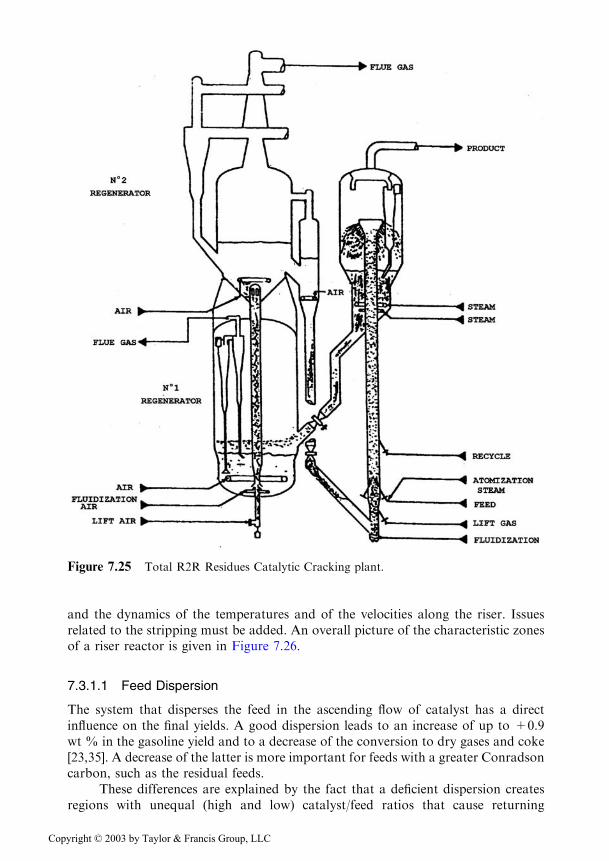
A special design is represented by the Total R2R process built by the FrenchPetroleum Institute, where, following the second regeneration step the regeneratedcatalyst enters a vessel where it is submitted to a last contact with air in dense phase,the vessel serving also as catalyst buffer (see Figure 7.25) [31–34]. A unit of this typeis in operation in Japan at the Aichi refinery.
Figure 7.23 Kellogg Heavy Oil Cracker. (From Ref. 30.)
Copyright © 2003 by Taylor & Francis Group, LLC
7.3 CHARACTERISTIC EQUIPMENT
This section examines exclusively the equipment issues that refer to modern units ofthe riser type, including those for the catalytic cracking of residues.
7.3.1 Reaction and Stripping Equipment
The riser reactors used in modern plants require finding adequate solutions for anumber of operating problems, that determine the efficiency of the process. Theseare: the feed dispersion system; the separation of the product vapors from thecatalyst at the top of the riser; the location of the feed flows that enter the riser
Figure 7.24 Catalytic cracking unit with dual coil and external heat-exchange heat recovery
systems from regenerator. (From Ref. 30.)
Copyright © 2003 by Taylor & Francis Group, LLC
and the dynamics of the temperatures and of the velocities along the riser. Issuesrelated to the stripping must be added. An overall picture of the characteristic zonesof a riser reactor is given in Figure 7.26.
7.3.1.1 Feed Dispersion
The system that disperses the feed in the ascending flow of catalyst has a directinfluence on the final yields. A good dispersion leads to an increase of up to +0.9wt % in the gasoline yield and to a decrease of the conversion to dry gases and coke[23,35]. A decrease of the latter is more important for feeds with a greater Conradsoncarbon, such as the residual feeds.
These differences are explained by the fact that a deficient dispersion createsregions with unequal (high and low) catalyst/feed ratios that cause returning
Figure 7.25 Total R2R Residues Catalytic Cracking plant.
Copyright © 2003 by Taylor & Francis Group, LLC

streams. The returning streams lead to damaging effects similar to those due tobackmixing.
A good injection system must contribute to the creation of as uniform aspossible catalyst to feed ratios. Therefore, the distribution of the catalyst over thecross section of the riser before it comes in contact with the feed must be as uniformas possible, and the bulk density must be as high as possible in order to achieve thecomplete adsorption in the shortest time of the injected feed.
The proper injection system must achieve:
The atomization of the feed in drops as small as possible, having the narrowestpossible size distribution
Uniform feed distribution over the cross section of the riserDrops having sufficient velocity in order to penetrate through the flow of
catalyst, without however exceeding the limits that would lead to erosionof the walls of the riser and the catalyst particles
An intimate mixing of the feed with the injection steamOperation at the lower possible pressure drop
Figure 7.26 Characteristic riser zones. (From Ref. 90.)
Copyright © 2003 by Taylor & Francis Group, LLC
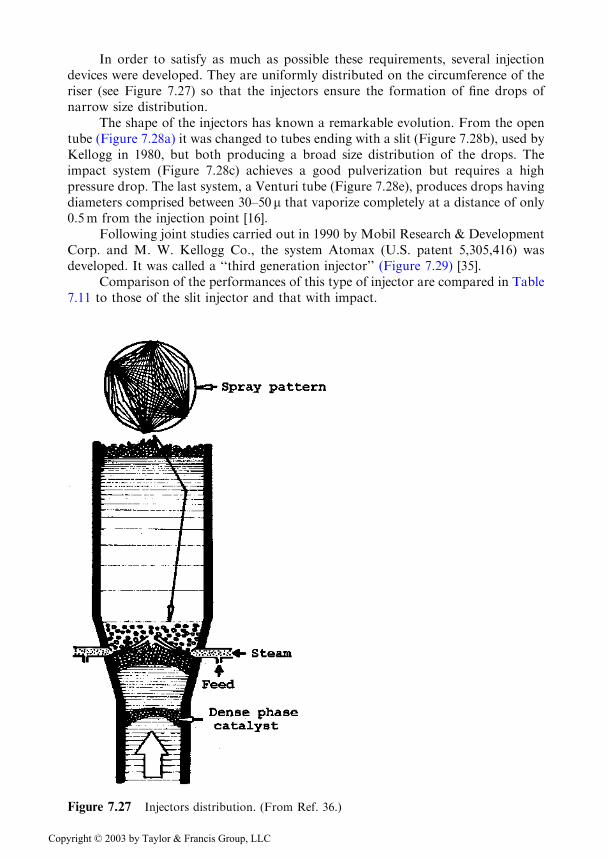
In order to satisfy as much as possible these requirements, several injectiondevices were developed. They are uniformly distributed on the circumference of theriser (see Figure 7.27) so that the injectors ensure the formation of fine drops ofnarrow size distribution.
The shape of the injectors has known a remarkable evolution. From the opentube (Figure 7.28a) it was changed to tubes ending with a slit (Figure 7.28b), used byKellogg in 1980, but both producing a broad size distribution of the drops. Theimpact system (Figure 7.28c) achieves a good pulverization but requires a highpressure drop. The last system, a Venturi tube (Figure 7.28e), produces drops havingdiameters comprised between 30–50 m that vaporize completely at a distance of only0.5m from the injection point [16].
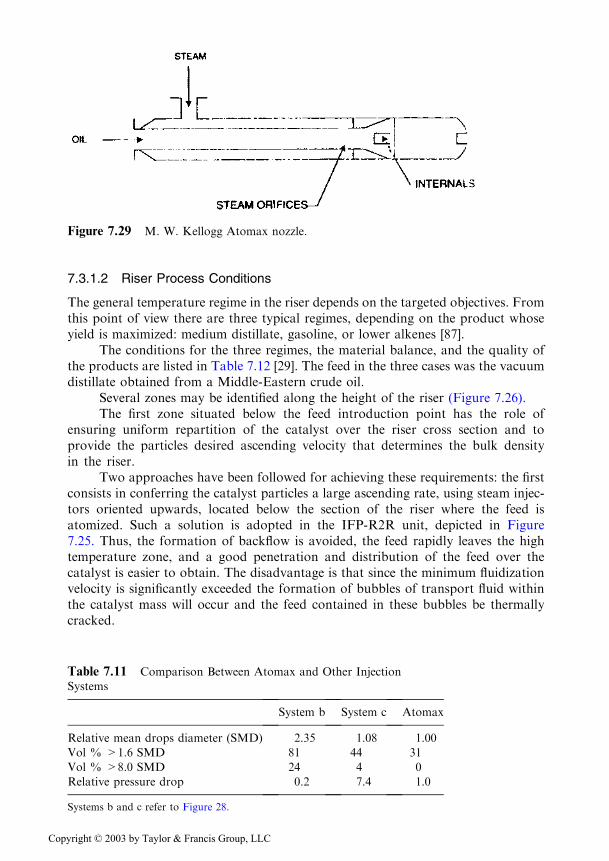
Following joint studies carried out in 1990 by Mobil Research & DevelopmentCorp. and M. W. Kellogg Co., the system Atomax (U.S. patent 5,305,416) wasdeveloped. It was called a ‘‘third generation injector’’ (Figure 7.29) [35].
Comparison of the performances of this type of injector are compared in Table7.11 to those of the slit injector and that with impact.
Figure 7.27 Injectors distribution. (From Ref. 36.)
Copyright © 2003 by Taylor & Francis Group, LLC
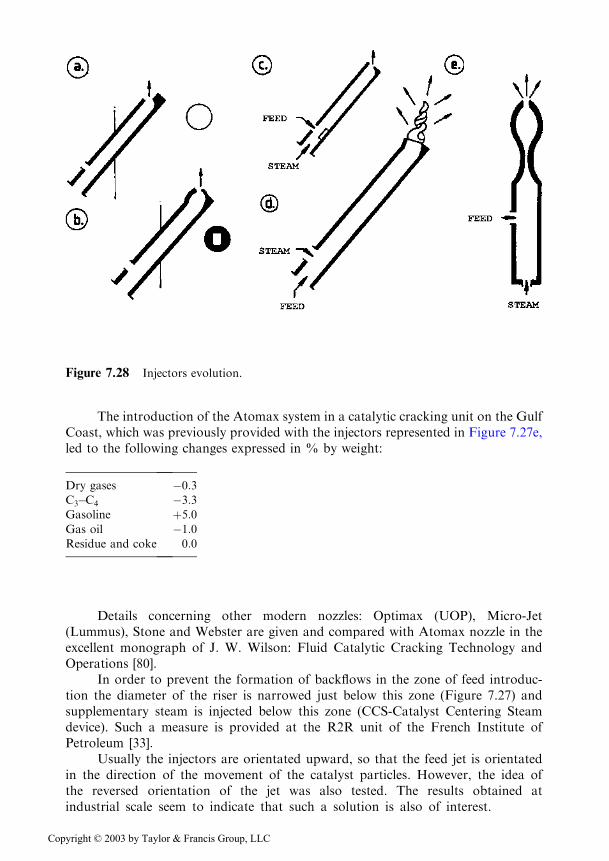
The introduction of the Atomax system in a catalytic cracking unit on the GulfCoast, which was previously provided with the injectors represented in Figure 7.27e,led to the following changes expressed in % by weight:
Dry gases �0:3C3�C4 �3:3Gasoline þ5:0Gas oil �1:0Residue and coke 0:0
Details concerning other modern nozzles: Optimax (UOP), Micro-Jet(Lummus), Stone and Webster are given and compared with Atomax nozzle in theexcellent monograph of J. W. Wilson: Fluid Catalytic Cracking Technology andOperations [80].
In order to prevent the formation of backflows in the zone of feed introduc-tion the diameter of the riser is narrowed just below this zone (Figure 7.27) andsupplementary steam is injected below this zone (CCS-Catalyst Centering Steamdevice). Such a measure is provided at the R2R unit of the French Institute ofPetroleum [33].
Usually the injectors are orientated upward, so that the feed jet is orientatedin the direction of the movement of the catalyst particles. However, the idea ofthe reversed orientation of the jet was also tested. The results obtained atindustrial scale seem to indicate that such a solution is also of interest.
Figure 7.28 Injectors evolution.
Copyright © 2003 by Taylor & Francis Group, LLC
7.3.1.2 Riser Process Conditions
The general temperature regime in the riser depends on the targeted objectives. Fromthis point of view there are three typical regimes, depending on the product whoseyield is maximized: medium distillate, gasoline, or lower alkenes [87].
The conditions for the three regimes, the material balance, and the quality ofthe products are listed in Table 7.12 [29]. The feed in the three cases was the vacuumdistillate obtained from a Middle-Eastern crude oil.
Several zones may be identified along the height of the riser (Figure 7.26).The first zone situated below the feed introduction point has the role of
ensuring uniform repartition of the catalyst over the riser cross section and toprovide the particles desired ascending velocity that determines the bulk densityin the riser.
Two approaches have been followed for achieving these requirements: the firstconsists in conferring the catalyst particles a large ascending rate, using steam injec-tors oriented upwards, located below the section of the riser where the feed isatomized. Such a solution is adopted in the IFP-R2R unit, depicted in Figure7.25. Thus, the formation of backflow is avoided, the feed rapidly leaves the hightemperature zone, and a good penetration and distribution of the feed over thecatalyst is easier to obtain. The disadvantage is that since the minimum fluidizationvelocity is significantly exceeded the formation of bubbles of transport fluid withinthe catalyst mass will occur and the feed contained in these bubbles be thermallycracked.
Figure 7.29 M. W. Kellogg Atomax nozzle.
Table 7.11 Comparison Between Atomax and Other Injection
Systems
System b System c Atomax
Relative mean drops diameter (SMD) 2.35 1.08 1.00
Vol % >1.6 SMD 81 44 31
Vol % >8.0 SMD 24 4 0
Relative pressure drop 0.2 7.4 1.0
Systems b and c refer to Figure 28.
Copyright © 2003 by Taylor & Francis Group, LLC

The second system achieves the catalyst flow to the feed injection points indense phase, eliminating the danger of occurrence of thermal cracking, but makingmore difficult a good repartition of the feed over the mass of flowing catalyst. Sincecracking reactions take place with increased volume, the linear flow velocityincreases and the density of the bed decreases as it flows through the feed introduc-tion section. This second system is sketched in Figure 7.27.
Following the feed dispersion and vaporization section is the reaction section(Figure 7.26). To avoid erosions, the riser must be perfectly vertical, and the flowvelocity should not exceed 18m/s if the inside walls of the riser are not provided with
Table 7.12 The Three Riser Operation Modes
Middle distillate
mode
Gasoline
mode
Light-olefin
mode
Operating conditions
reactor temperature, 8C 449–510 527–538 538–560
residence time <Base Base >Base
catalyst/oil ratio <Base Base >Base
recycle, CFR 1.4 optional optional
(HCO) (HDT LCO) (heavy naphtha)
Catalyst formulation
zeolite type ReY CSDY* USY
zeolite level, wt % 15 30 40
rare earth, wt % 1–2 0.5–1.5 0
Product yields
H2S, wt % 0.7 1.0 1.0
C2-, wt % 2.6 3.2 4.7
C3, LV % 6.9 10.7 16.1
C4, LV % 9.8 15.4 20.5
C5+, Gasoline, LV % 43.4 60.0 55.2
LCO, LV % 37.5 13.9 10.1
CO, LV % 7.6 9.2 7.0
Coke, wt % 4.9 5.0 6.4
Product properties, vol/vol
C3 olefin/saturate 3.4 3.2 3.6
C4 olefin/saturate 1.6 1.8 2.1
Gasoline
ASTM 90% Pt., 8C 193 193 193
RON clear 90.5 93.2 94.8
MON clear 78.8 80.4 82.1
Light cycle oil
ASTM 90% Pt., 8C 350 316 316
viscosity, cSt (508C) 3.7 3.1 3.2
sulfur, wt % 2.9 3.4 3.7
cetane index 34.3 24.3 20.6
Clarified oil
viscosity, cSt (1008C) 10.9 9.0 10.1
sulfur, wt % 5.1 6.0 6.8
�Chemically Stabilized and Dealuminated Y Zeolite.
Source: Ref. 29.
Copyright © 2003 by Taylor & Francis Group, LLC
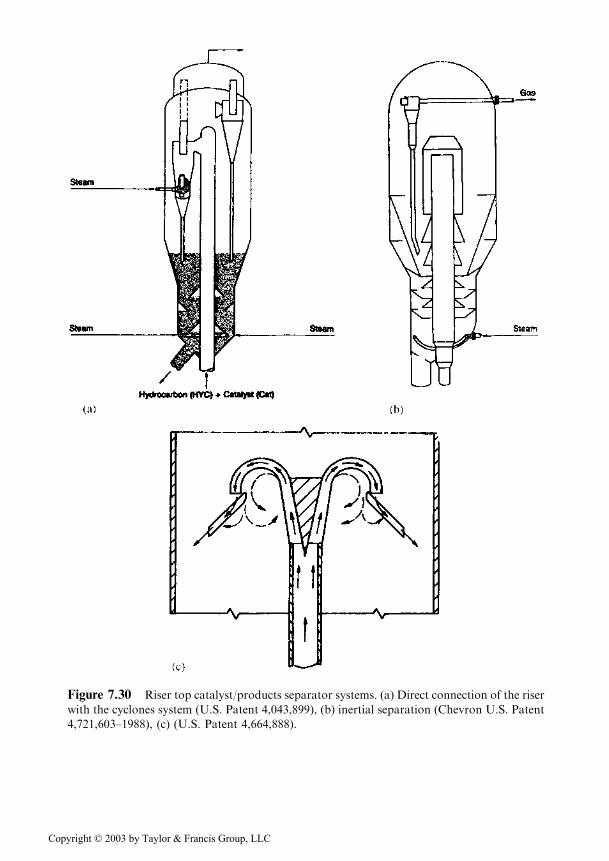
Figure 7.30 Riser top catalyst/products separator systems. (a) Direct connection of the riser
with the cyclones system (U.S. Patent 4,043,899), (b) inertial separation (Chevron U.S. Patent
4,721,603–1988), (c) (U.S. Patent 4,664,888).
Copyright © 2003 by Taylor & Francis Group, LLC
refractory protection. If the walls are lined with refractory material (usually about12 cm thick), the linear velocity may be higher.
In order to control the temperature regime in the riser, recycle material isinjected at a location above the injection zone of the feed at a distance where thefeed is completely vaporized as a result of the contact with the hot catalyst. In thisway, without changing the contact ratio or the inlet temperature of the feed, one cancontrol the operation conditions and severity respectively [81].
7.3.1.3 Catalyst-Product Separation
The rapid separation of the catalyst from the reaction products is necessary in orderto avoid over cracking and thermal cracking due to the high temperatures used in themodern risers. Thermal cracking would cause also a cooling of the effluent after itseparated from the largest portion of the catalyst.
In older systems, the upper part of the riser was of the open type, the mixtureof vapors and catalyst being released into an expansion zone, which was connectedto the cyclone system. Later on, a system was developed where the products left theriser through a side tube, which made the separation of the catalyst easier.Eventually several improved solutions were developed.
The first improved solution consists in the direct connection of the riser withthe cyclone system (Figure 7.30a). The disadvantage is that in this case the wholeamount of catalyst passes through the first step cyclones, the size of which has to besignificantly increased.
The second solution is that of the inertial separation of the catalyst by impos-ing a sudden change of direction to the product and catalyst flow (Figure 7.30b,c).Such systems proved to be very efficient, the separation reaching 98% [82] andbackmixing currents being completely eliminated.
After the separation, but especially in the case of operation at high tempera-tures, a cooling liquid is injected in the stream of products immediately after theseparation of the catalyst. This measure comes mandatory if the temperature exceeds5358C [82].
As seen, special attention during the design and operation of the risers is givento the elimination of backmixing, which leads to decrease of the yields.
It was found that backmixing is absent in the descending portion of the inertialseparators. This led to the idea to use risers with descending circulation, which willbe discussed in Section 7.3.3.
7.3.1.4 Stripping
A rule of thumb is that good stripping must produce a coke containing not morethan 6–9 wt % hydrogen in coke. The stripping is very poor when this percentagereaches or exceeds 10 wt % [37].
In the old plants that used less active catalysts and a high catalyst to feed ratio,the residence time of the catalyst in the stripper was short and the usual steamconsumption was 6 kg per 100 kg circulating catalyst [36]. As a result of successiveimprovements, current steam consumption is 1
4of that value, whole hydrogen content
in coke is only 5–6 wt %.This spectacular increase of stripping efficiency is the result of several construc-
tive measures:
Copyright © 2003 by Taylor & Francis Group, LLC
1. The size of the orifices in the steam distributors was significantly decreasedon the basis of accumulated experience with air distributors in the regenerators. Inthis way, the size of the steam bubbles became much smaller, which favored strippingefficiency.
2. The use of two steam distributors was adopted: one, located near the inletof the catalyst in the stripper is used to eliminate the product vapors from the spacebetween the catalyst particles; the second, near to the outlet from the stripper, inorder to eliminate the vapors from within the catalyst pores or adsorbed on theparticles surface.
3. The size of the baffles was decreased to prevent the accumulation of steam,and their location was reduced to the role of preventing the flow of catalyst along thewalls.
4. A perfect symmetry of the locations of the catalyst inlet to, and outlet fromthe stripper was ensured. This measure is needed for efficient stripping by avoidingformation of stagnant spaces, since the dispersion of the catalyst normal to thedirection of flow is very limited. Otherwise, a higher stripping zone and a significantincrease of the number of baffles would be required.
7.3.2 Equipment for Catalyst Regeneration
The adequate design of the catalyst regeneration equipment provides answers to thefollowing main issues: the design of the injection system for the air and for catalystdistribution; measures for avoiding local superheating within and above the catalystbed; means for removing the excessive heat developed when residues are incorpo-rated in the feed; systems with two regeneration steps used in the catalytic crackingof straight run residues.
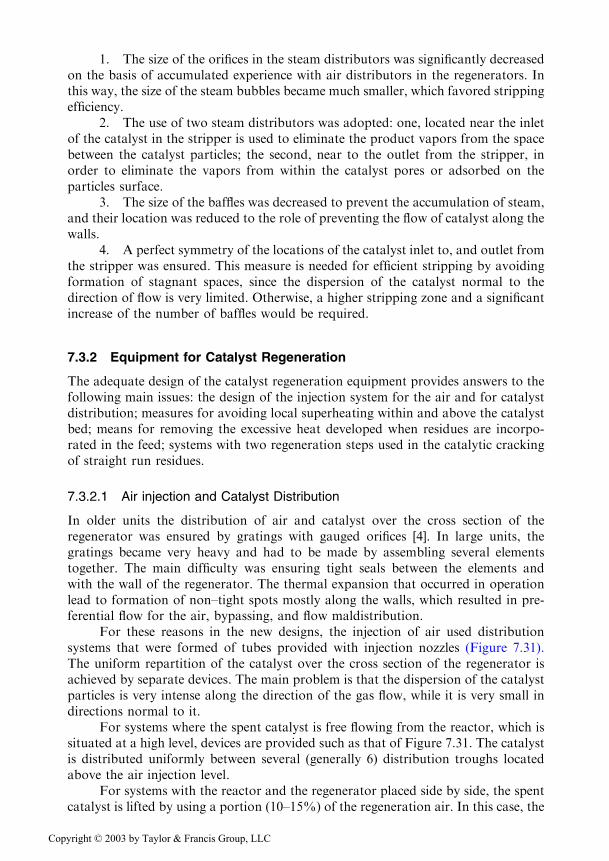
7.3.2.1 Air injection and Catalyst Distribution
In older units the distribution of air and catalyst over the cross section of theregenerator was ensured by gratings with gauged orifices [4]. In large units, thegratings became very heavy and had to be made by assembling several elementstogether. The main difficulty was ensuring tight seals between the elements andwith the wall of the regenerator. The thermal expansion that occurred in operationlead to formation of non–tight spots mostly along the walls, which resulted in pre-ferential flow for the air, bypassing, and flow maldistribution.
For these reasons in the new designs, the injection of air used distributionsystems that were formed of tubes provided with injection nozzles (Figure 7.31).The uniform repartition of the catalyst over the cross section of the regenerator isachieved by separate devices. The main problem is that the dispersion of the catalystparticles is very intense along the direction of the gas flow, while it is very small indirections normal to it.
For systems where the spent catalyst is free flowing from the reactor, which issituated at a high level, devices are provided such as that of Figure 7.31. The catalystis distributed uniformly between several (generally 6) distribution troughs locatedabove the air injection level.
For systems with the reactor and the regenerator placed side by side, the spentcatalyst is lifted by using a portion (10–15%) of the regeneration air. In this case, the
Copyright © 2003 by Taylor & Francis Group, LLC
conical shape of the base of the regenerator ensures a good horizontal repartition ofthe catalyst.
7.3.2.2 Prevention of Overheating
In older units, the excess of oxygen needed for obtaining acceptable values for theresidual coke led in many cases to auto-ignitions of CO in the freeboard of theregenerator. In such cases temperatures above those acceptable for the catalystwere produced and catalyst deactivation followed. Such auto-ignitions were cata-lyzed among others by the nickel deposited on the catalyst.
Several methods were proposed for controlling this phenomenon [4], of whichthe most efficient proved to be the installation of a bypass valve for the regenerationair, which was activated by the temperature above the bed.
Figure 7.31 Air distributor with nozzles. (From Ref. 36.)
Copyright © 2003 by Taylor & Francis Group, LLC
Following the commercial introduction of the zeolite catalysts, which made itpossible to increase the regeneration temperatures up to 7308C and even above thistemperature, it became possible to completely burn CO to CO2 by using promoters.This eliminated the danger of uncontrolled overheating above the bed. Despite thefact that the operation is now carried out without any excess of oxygen beyond theamount necessary for converting the CO to CO2, the residual coke is situated gen-erally below 0.2%.
A special problem is due to local burning that may occur when the total flow offresh air comes in contact with the spent catalyst, strongly loaded with coke, such asin the processing of residual feeds. In such cases, local combustion may take placethat could lead for some catalyst particles to temperature increases of 150–2008Cabove the one in the bed, leading to their deactivation.
In units with the reactor and regenerator placed side by side, the catalyst ispneumatically lifted to the regenerator by means of air. The air used for liftingrepresents 10–15% of the total amount necessary for regeneration and the mildcombustions that take place in the transport line, removing the danger of localoverheating.
In units where the catalyst discharges from the reactor under gravity, designssuch as in the Orthoflow units, model F (Figure 7.18), or of an even simpler con-struction, may be used for achieving a first, mild combustion of the coke with only aportion of the total air.
7.3.2.3 Heat Removal
The possibility of using residue as a component of the feed is dependent on theability to burn a larger amount of coke in the regenerator. Otherwise, the onlypossibility would be to decrease the feedrate of the residue containing feed, so asto maintain the amount of coke burned equal to that prior to addition of residue.
The amount of the burnt coke may be limited by the capacity of the blower orby the excess heat produced in the regenerator. In the second case, debottleneckinginvolves the addition of cooling devices.
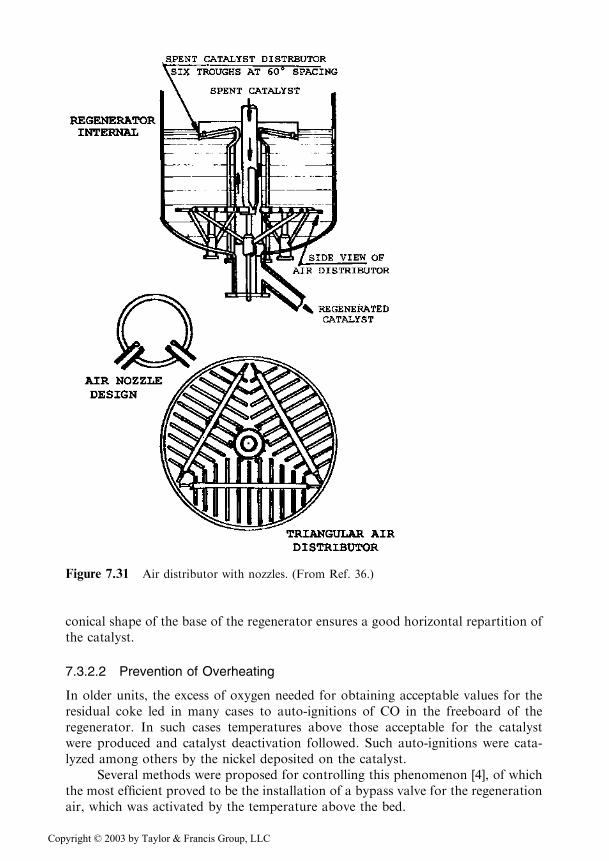
Two systems are practiced for the removal of heat from the regenerator: cool-ing coils which are located inside the bed and tubular heat exchangers, located out-side the regenerator.
The actual construction of the cooling coils placed inside the bed of catalyst isshown in Figure 7.32 [39]. It is a simple design that avoids the presence of joints,branchings, or changes in the diameter etc., which are the locations where intenseerosions appear first. Their design is based on the lengthy experience of using coolingcoils, starting in the years 1942–1948, when the use of the natural catalyst led todeposits of up to 12 wt % coke on the catalyst.
At current practiced densities of the dense phase, of 400–500 kg/m3 and at thelow air velocities in the regenerator of 0.6–0.9m/s, the erosions do not affect theoperation life of the coils.
The second solution is the installation of external coolers (Figures 7.33, 7.24).It is to be observed that the circulation in current coolers is different from that
used in the period 1942–1948, when the ascendant mixture air/catalyst circulatedthrough tubes provoking intense erosions. In current coolers the circulation is des-cendent through the shell side. The catalyst is maintained fluidized by air injection atthe lower end of the cooler. This injection may be also used, within some limits, for
Copyright © 2003 by Taylor & Francis Group, LLC
the control of the heat transfer. An increase of the air flow decreases the catalystdensity but increases the heat transfer.
7.3.2.4 Two-step Regeneration
Catalytic cracking units with two regeneration steps were depicted in Figures 7.19,7.22, and 7.25.
These systems make it possible to reach residual coke concentrations below0.05 wt %, even during the cracking of heavy residues that generate a large percen-tage of coke [33].
The hydrogen present in the coke burns in the first regeneration step.Therefore, in the second step there is no steam present and the temperature can
Figure 7.32 Cooling coil inside regenerator. (From Ref. 39.)
Copyright © 2003 by Taylor & Francis Group, LLC

reach 850–9008C without danger of destroying the catalyst since, in absence ofsteam, the main culprit for catalyst deactivation, vanadic acid, is not formed. Atthese temperatures the reaction rate is increased greatly so that coke burning iscomplete at short contact times in regenerators of the riser type, where the back-mixing is virtually absent (Figure 7.19).
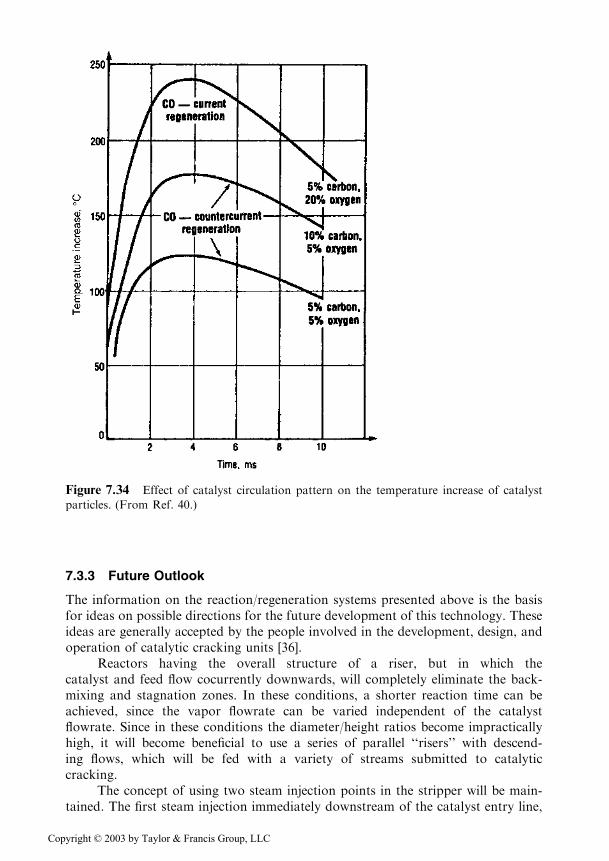
The pattern of catalyst circulation in the regenerator is of importance. In the firstregeneration step, the preferred pattern is one in which the air flows countercurrent todescending catalyst. In this manner, the strongly coked catalyst does not come intocontact directly with the fresh air and thus, local uncontrolled combustion and over-heating of the catalyst particles are prevented. The influence of the flow pattern on theincrease of the temperature of catalyst particles is plotted in Figure 7.34 [40].
Figure 7.33 Regenerator external cooler. (From Ref. 39.)
Copyright © 2003 by Taylor & Francis Group, LLC
7.3.3 Future Outlook
The information on the reaction/regeneration systems presented above is the basisfor ideas on possible directions for the future development of this technology. Theseideas are generally accepted by the people involved in the development, design, andoperation of catalytic cracking units [36].
Reactors having the overall structure of a riser, but in which thecatalyst and feed flow cocurrently downwards, will completely eliminate the back-mixing and stagnation zones. In these conditions, a shorter reaction time can beachieved, since the vapor flowrate can be varied independent of the catalystflowrate. Since in these conditions the diameter/height ratios become impracticallyhigh, it will become beneficial to use a series of parallel ‘‘risers’’ with descend-ing flows, which will be fed with a variety of streams submitted to catalyticcracking.
The concept of using two steam injection points in the stripper will be main-tained. The first steam injection immediately downstream of the catalyst entry line,
Figure 7.34 Effect of catalyst circulation pattern on the temperature increase of catalyst
particles. (From Ref. 40.)
Copyright © 2003 by Taylor & Francis Group, LLC
will displace most of the product vapors between the catalyst particles. The secondsteam, at the exit of the catalyst from the stripper will remove product adsorbed onthe catalyst particles as completely as possible.
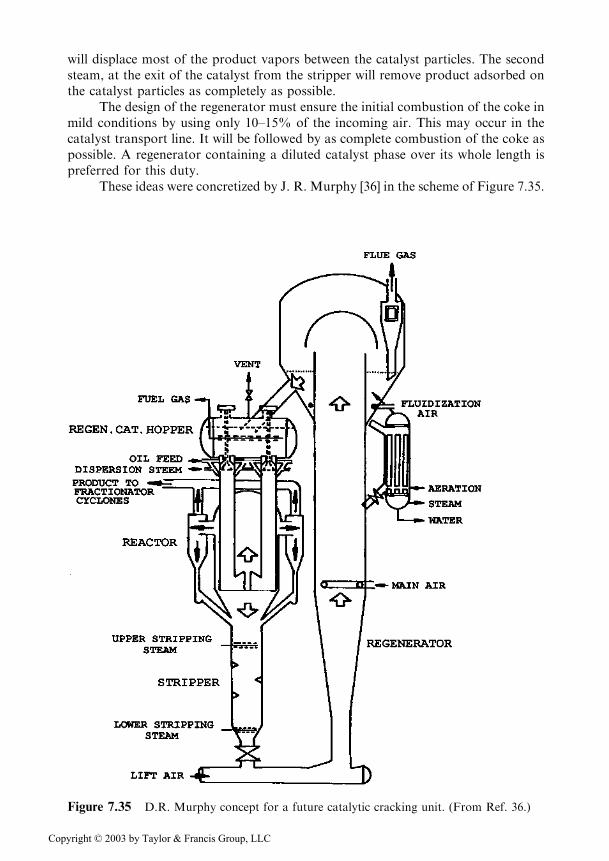
The design of the regenerator must ensure the initial combustion of the coke inmild conditions by using only 10–15% of the incoming air. This may occur in thecatalyst transport line. It will be followed by as complete combustion of the coke aspossible. A regenerator containing a diluted catalyst phase over its whole length ispreferred for this duty.
These ideas were concretized by J. R. Murphy [36] in the scheme of Figure 7.35.
Figure 7.35 D.R. Murphy concept for a future catalytic cracking unit. (From Ref. 36.)
Copyright © 2003 by Taylor & Francis Group, LLC

7.3.4 Energy Recovery from Flue Gases and Emissions Control
The energy recovery from flue gases by the means of expansion turbines requires anadditional stage for the recovery of traces of catalyst situated after the regenerator(Figure 7.36), called the third separation stage.
Today’s popular separator (Figure 7.37) was designed and patented by ShellOil Co., UOP and M. W. Kellogg Co. The main feature of the separator is the tubes,which cause a sudden change of the direction of flow by 1808, thus producing theinertial separation of the gas from the catalyst particles. The number of tubes variesbetween 50 and 150 depending on the size of the unit [42].
Another option is the use of classical cyclones with large diameters. The hightemperature of the flue gases leads to protecting with refractory material the walls ofthe cyclones.
The expansion turbine, which serves as a compressor for the air used in theregeneration, is located following the last separation step. Downstream of the tur-bine are located the heat recovery and the purification of the flue gases prior to theirrelease in the atmosphere.
The operation of the turbine–compressor system are the object of specializedpapers [43]. Their discussion exceeds the framework of this book.
The degree of purity of the flue gases is determined by the regulations imposedin each country for the protection of the environment. Some of the limit concentra-tions are given for several countries in Table 7.13. The table shows that the accept-able concentrations are different in the various countries, but in all the cases thestandards become more restrictive with time.
Chevron [44], Exxon [45] and other refiners have published designs for thepurification of flue gases resulting from catalytic crackers. The latter [45] gives inter-esting details concerning contacting systems for the neutralization of acid gases withNaOH and for the elimination of solid particles. The principle is to use venturi contac-
Figure 7.36 Ultra-Orthoflow. Energy recovery from flue gases. (From Ref. 41.)
Copyright © 2003 by Taylor & Francis Group, LLC
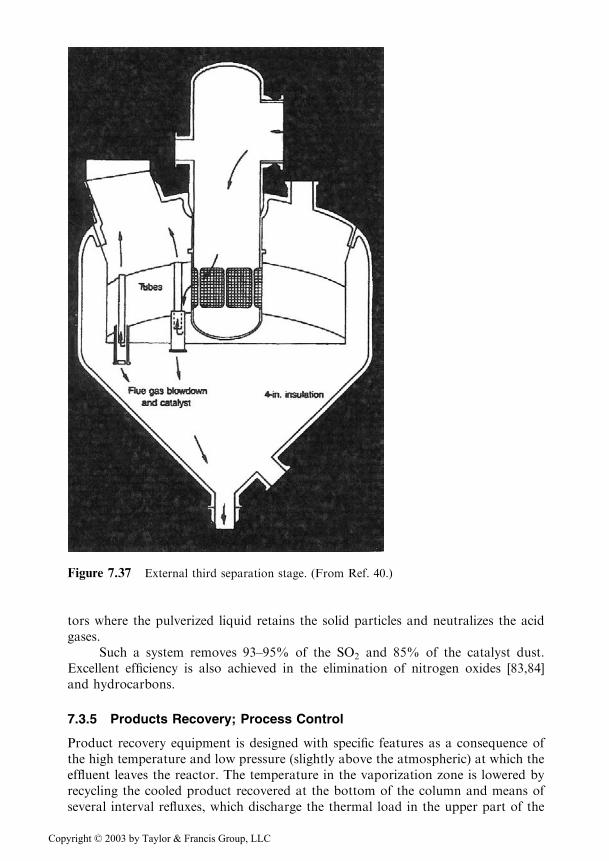
tors where the pulverized liquid retains the solid particles and neutralizes the acidgases.
Such a system removes 93–95% of the SO2 and 85% of the catalyst dust.Excellent efficiency is also achieved in the elimination of nitrogen oxides [83,84]and hydrocarbons.
7.3.5 Products Recovery; Process Control
Product recovery equipment is designed with specific features as a consequence ofthe high temperature and low pressure (slightly above the atmospheric) at which theeffluent leaves the reactor. The temperature in the vaporization zone is lowered byrecycling the cooled product recovered at the bottom of the column and means ofseveral interval refluxes, which discharge the thermal load in the upper part of the
Figure 7.37 External third separation stage. (From Ref. 40.)
Copyright © 2003 by Taylor & Francis Group, LLC

fractionating column [46,47]. The heat of the reactor effluent is best utilized if itenters the fractionation column in its lowest section.
The configuration of a typical fractionating column and that which resultedfollowing its thermal optimization are sketched in Figure 7.38 [47].
The separation of gases is performed by adsorption-fractionating using classi-cal methods.
Much attention is given to the control of the fractionating system in order toensure in all cases the proper processing of all products that leave the reactor [48].This issue, as well as the control of the compression of the air for the regenerator[43], exceed the scope of this book.
In several studies, the operating parameters of the fluid catalytic cracking unitsare correlated with the help of computers, in order to achieve optimization of theprocess [49,50,88]. The problem seems to be extremely complex. Even before acomplete solution was found, several ways were identified for improving the opera-tion of existing units [50].
Of special interest is the processing of the product at the bottom of the frac-tionating column. Normally, it was separated in two layers by settling: the upperlayer of free catalyst particles (the decant oil) was used as a component for hearthfuels or as raw material for the production of carbon black. The lower layer wasrecycled to the reaction system in order to recover the catalyst it contained.
The bottom product has a strong aromatic character and, its recyclingdecreases gasoline yield. To avoid this disadvantage, starting in 1979 the electrostaticseparation of catalyst particles was studied and improved, which eliminated therequirement for recycling [51].
The system is very efficient; two oils with ash contents of 1.22% and 1.89%respectively, after electrostatic separation had ash contents of 46 ppm and 85 ppmrespectively.
The aromatic character of the recovered oil and the significant amounts recov-ered by electrostatic separation suggest that recovered oil could be an excellent rawmaterial for needle coke, either by itself or in a mixture with heavy coking gas oil.
7.4 OPERATION ASPECTS
Three specific aspects related to fluidized bed catalytic cracking will be discussed: themaintenance of catalyst properties, equipment erosion, and the quality of fluidiza-tion.
Table 7.13 Regenerator Flue Gas
Pollution Limits (g/Nm3)
Country SOx NOx Dust
U.S. 1970 4.50 0.00 0.150
U.S. 1990 0.90 0.00 0.100
California 1995 0.06 0.06 0.006
Germany 1991 1.70 0.70 0.050
Germany 1995 0.50 0.50 0.050
Japan 0.90 0.50 0.040
Copyright © 2003 by Taylor & Francis Group, LLC
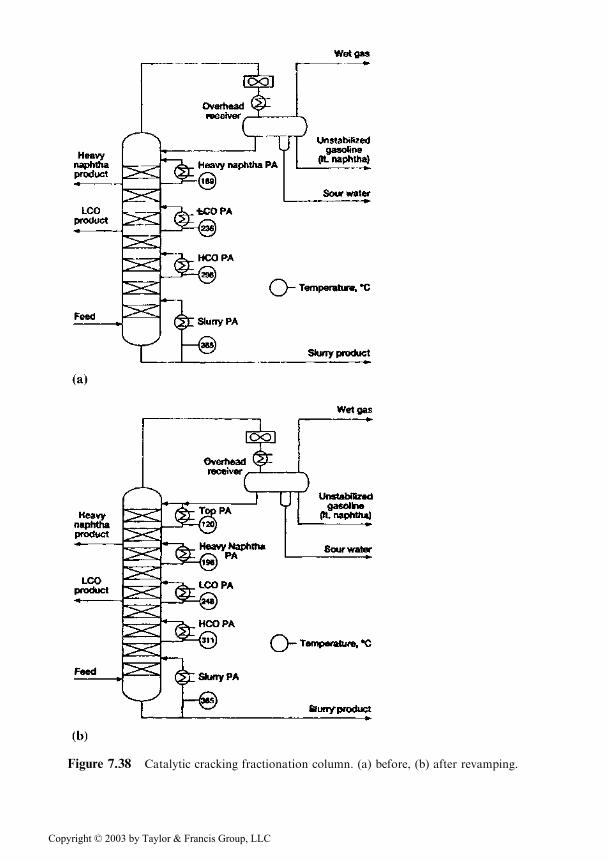
Figure 7.38 Catalytic cracking fractionation column. (a) before, (b) after revamping.
Copyright © 2003 by Taylor & Francis Group, LLC
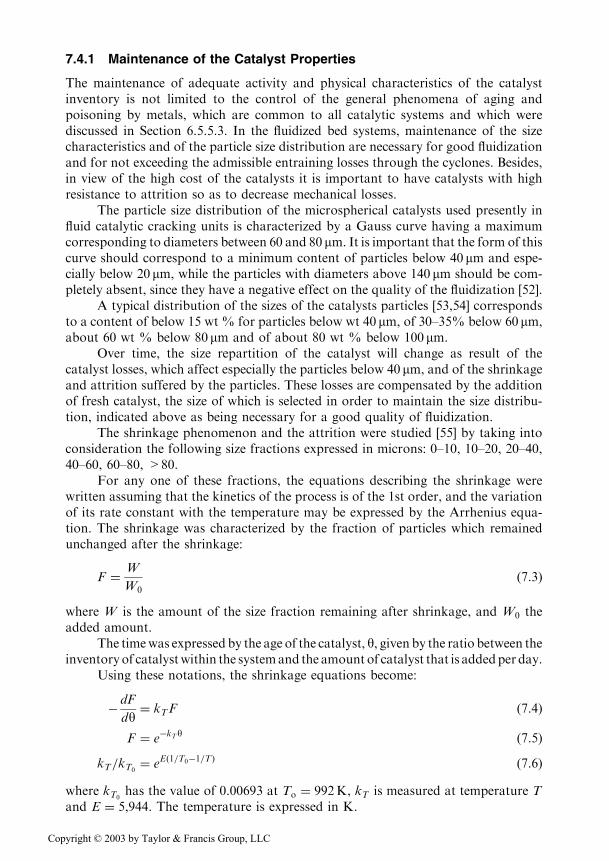
7.4.1 Maintenance of the Catalyst Properties
The maintenance of adequate activity and physical characteristics of the catalystinventory is not limited to the control of the general phenomena of aging andpoisoning by metals, which are common to all catalytic systems and which werediscussed in Section 6.5.5.3. In the fluidized bed systems, maintenance of the sizecharacteristics and of the particle size distribution are necessary for good fluidizationand for not exceeding the admissible entraining losses through the cyclones. Besides,in view of the high cost of the catalysts it is important to have catalysts with highresistance to attrition so as to decrease mechanical losses.
The particle size distribution of the microspherical catalysts used presently influid catalytic cracking units is characterized by a Gauss curve having a maximumcorresponding to diameters between 60 and 80 mm. It is important that the form of thiscurve should correspond to a minimum content of particles below 40 mm and espe-cially below 20 mm, while the particles with diameters above 140 mm should be com-pletely absent, since they have a negative effect on the quality of the fluidization [52].
A typical distribution of the sizes of the catalysts particles [53,54] correspondsto a content of below 15 wt % for particles below wt 40 mm, of 30–35% below 60 mm,about 60 wt % below 80 mm and of about 80 wt % below 100 mm.
Over time, the size repartition of the catalyst will change as result of thecatalyst losses, which affect especially the particles below 40 mm, and of the shrinkageand attrition suffered by the particles. These losses are compensated by the additionof fresh catalyst, the size of which is selected in order to maintain the size distribu-tion, indicated above as being necessary for a good quality of fluidization.
The shrinkage phenomenon and the attrition were studied [55] by taking intoconsideration the following size fractions expressed in microns: 0–10, 10–20, 20–40,40–60, 60–80, >80.
For any one of these fractions, the equations describing the shrinkage werewritten assuming that the kinetics of the process is of the 1st order, and the variationof its rate constant with the temperature may be expressed by the Arrhenius equa-tion. The shrinkage was characterized by the fraction of particles which remainedunchanged after the shrinkage:
F ¼ W
W0
ð7:3Þ
where W is the amount of the size fraction remaining after shrinkage, and W0 theadded amount.
The timewas expressed by the age of the catalyst, y, given by the ratio between theinventoryof catalystwithin the systemand the amount of catalyst that is addedper day.
Using these notations, the shrinkage equations become:
� dF
dy¼ kTF ð7:4Þ
F ¼ e�kTy ð7:5ÞkT=kT0
¼ eEð1=T0�1=TÞ ð7:6Þwhere kT0
has the value of 0.00693 at To ¼ 992K, kT is measured at temperature Tand E ¼ 5,944. The temperature is expressed in K.
Copyright © 2003 by Taylor & Francis Group, LLC
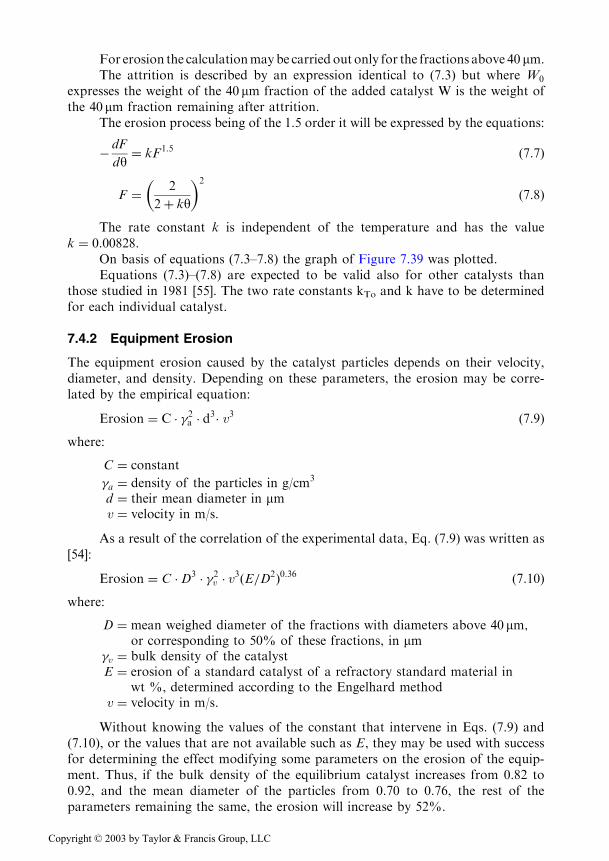
For erosion the calculationmaybe carried out only for the fractions above 40 mm.The attrition is described by an expression identical to (7.3) but where W0
expresses the weight of the 40 mm fraction of the added catalyst W is the weight ofthe 40 mm fraction remaining after attrition.
The erosion process being of the 1.5 order it will be expressed by the equations:
� dF
dy¼ kF1:5 ð7:7Þ
F ¼ 2
2þ ky
� �2
ð7:8Þ
The rate constant k is independent of the temperature and has the valuek ¼ 0:00828.
On basis of equations (7.3–7.8) the graph of Figure 7.39 was plotted.Equations (7.3)–(7.8) are expected to be valid also for other catalysts than
those studied in 1981 [55]. The two rate constants kTo and k have to be determinedfor each individual catalyst.
7.4.2 Equipment Erosion
The equipment erosion caused by the catalyst particles depends on their velocity,diameter, and density. Depending on these parameters, the erosion may be corre-lated by the empirical equation:
Erosion ¼ C � �2a � d3� v3 ð7:9Þwhere:
C ¼ constant
�a ¼ density of the particles in g/cm3
d ¼ their mean diameter in mmv ¼ velocity in m/s.
As a result of the correlation of the experimental data, Eq. (7.9) was written as[54]:
Erosion ¼ C �D3 � �2v � v3ðE=D2Þ0:36 ð7:10Þwhere:
D ¼ mean weighed diameter of the fractions with diameters above 40 mm;or corresponding to 50% of these fractions, in mm
�v ¼ bulk density of the catalystE ¼ erosion of a standard catalyst of a refractory standard material in
wt %, determined according to the Engelhard methodv ¼ velocity in m/s.
Without knowing the values of the constant that intervene in Eqs. (7.9) and(7.10), or the values that are not available such as E, they may be used with successfor determining the effect modifying some parameters on the erosion of the equip-ment. Thus, if the bulk density of the equilibrium catalyst increases from 0.82 to0.92, and the mean diameter of the particles from 0.70 to 0.76, the rest of theparameters remaining the same, the erosion will increase by 52%.
Copyright © 2003 by Taylor & Francis Group, LLC
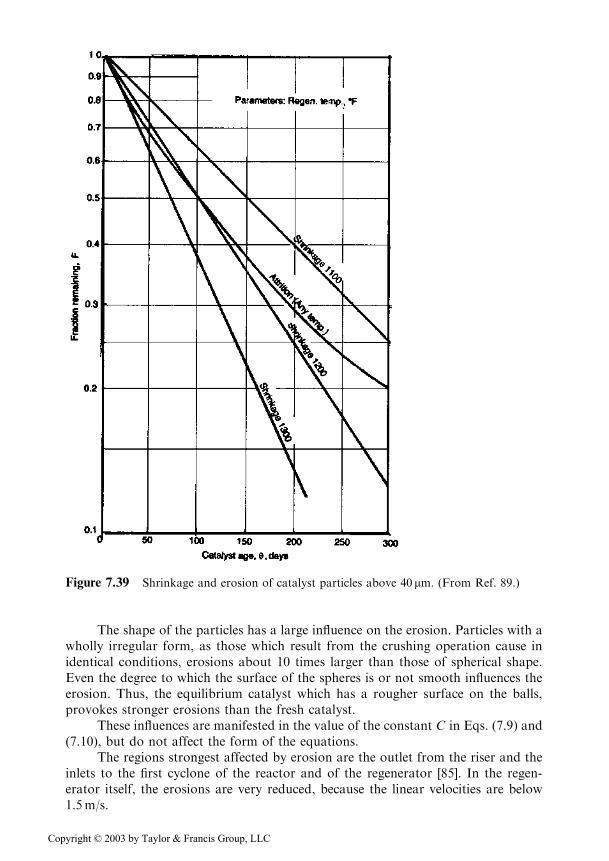
The shape of the particles has a large influence on the erosion. Particles with awholly irregular form, as those which result from the crushing operation cause inidentical conditions, erosions about 10 times larger than those of spherical shape.Even the degree to which the surface of the spheres is or not smooth influences theerosion. Thus, the equilibrium catalyst which has a rougher surface on the balls,provokes stronger erosions than the fresh catalyst.
These influences are manifested in the value of the constant C in Eqs. (7.9) and(7.10), but do not affect the form of the equations.
The regions strongest affected by erosion are the outlet from the riser and theinlets to the first cyclone of the reactor and of the regenerator [85]. In the regen-erator itself, the erosions are very reduced, because the linear velocities are below1.5m/s.
Figure 7.39 Shrinkage and erosion of catalyst particles above 40 mm. (From Ref. 89.)
Copyright © 2003 by Taylor & Francis Group, LLC
In order to avoid erosion, it is recommended [37] that the velocities in the twosteps of the reactor cyclones should not exceed 18m/s, 18.5m/s in the first cyclonestep of the regenerator while in the second step, 23m/s. Similar values are recom-mended in other publications [54]. But also recommendations exist [56] to use highervelocities, of up to 28m/s in the inlet of the cyclones if modern refractory materialsof high resistance are used. While such velocities lead to a more efficient operation ofthe cyclones, the erosions become stronger.
Also, other parts of the equipment of the unit are submitted to erosion, whichimposes the prescription of maximum pressure drops, in those locations whereexceeding them may lead to abnormal erosions. Such prescriptions are:
The control valves for the catalyst flow 41 kPa
The valves for pressure control 103 kPa
The nozzles of the regenerator distributor grate
through which also the catalyst flows 7 kPa
The nozzles of the regenerator distributor grate, when through
them only the air passes 21 kPa
The nozzles of the reactor grill 14 kPa
The pressure drops shown for the grill nozzles do not eliminate the erosion ofthe catalyst particles.
In the case of feeds containing above 0.5% sulfur, the erosion effects arecombined with those of the corrosion, which requires the use of alloyed steels with12% Cr at reduced sulfur content and 18/8 Cr-Ni at higher contents.
The use of the alloyed steels is recommended in the areas where the tempera-ture exceeds 4808C in order to decrease the wear. The austenitic stainless steels,strongly alloyed, become compulsory in the areas where the temperature (in theregenerator) exceeds 6508C.
Details concerning the design of the equipment, the maintenance, and theperiodic revisions are given in the paper of Luckenbach et al. [37].
7.4.3 Quality of Fluidization
A good fluidization is very important for obtaining optimal performances. Fourstates may be distinguished as air or vapors pass upwards through a layer ofsmall catalyst particles: moving dense bed, fluidized bed, bubbling fluidized bed,transported diluted bed.
All these four states are used in the catalytic cracking. It is important to avoidoperating in the intermediary domain between two states, because such a situationcould lead to unstable operation of the unit. Thus, in the descendent pipes an excessiveflow rate of the aeration fluid may produce bubbles which, in their ascending motion,could prevent the descent circulation with the necessary flowrate of the catalyst andeventually could block up the normal operation of the unit. Such blocking could beprovoked also by an insufficient flowrate of the fluid in the ascending pipes.
It is desirable that in the ascending and descending pipes the catalyst particlesshould be in a fluidized state. However, if the aeration is not correct, the pressuredrop in the descending pipes could lead to states close to settling in the lower portionand to the formation of bubbles in the upper portion of the pipe.
Copyright © 2003 by Taylor & Francis Group, LLC
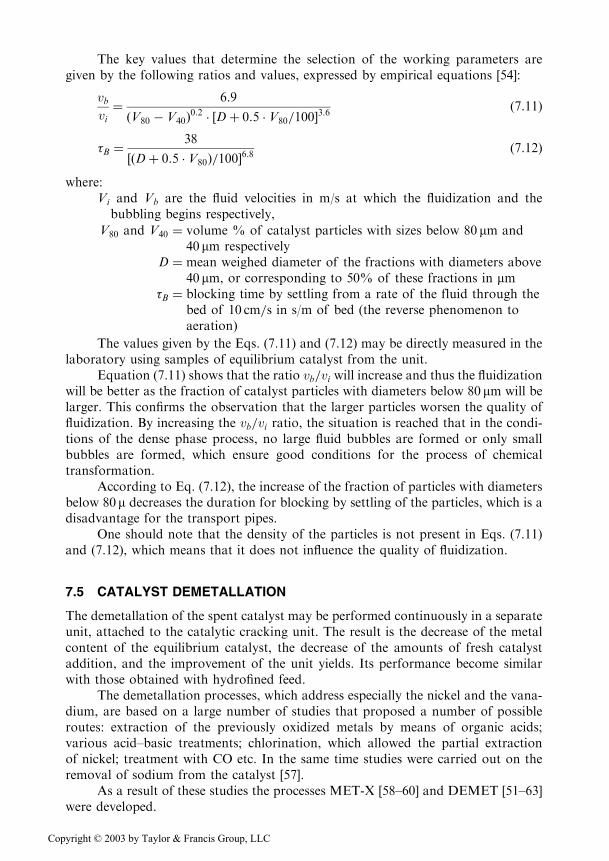
The key values that determine the selection of the working parameters aregiven by the following ratios and values, expressed by empirical equations [54]:
vbvi¼ 6:9
ðV80 � V40Þ0:2 � ½Dþ 0:5 � V80=100�3:6ð7:11Þ
�B ¼38
½ðDþ 0:5 � V80Þ=100�6:8ð7:12Þ
where:Vi and Vb are the fluid velocities in m/s at which the fluidization and the
bubbling begins respectively,
V80 and V40 ¼ volume % of catalyst particles with sizes below 80 mm and40 mm respectively
D ¼ mean weighed diameter of the fractions with diameters above40 mm, or corresponding to 50% of these fractions in mm
�B ¼ blocking time by settling from a rate of the fluid through thebed of 10 cm=s in s/m of bed (the reverse phenomenon toaeration)
The values given by the Eqs. (7.11) and (7.12) may be directly measured in thelaboratory using samples of equilibrium catalyst from the unit.
Equation (7.11) shows that the ratio vb=vi will increase and thus the fluidizationwill be better as the fraction of catalyst particles with diameters below 80 mm will belarger. This confirms the observation that the larger particles worsen the quality offluidization. By increasing the vb=vi ratio, the situation is reached that in the condi-tions of the dense phase process, no large fluid bubbles are formed or only smallbubbles are formed, which ensure good conditions for the process of chemicaltransformation.
According to Eq. (7.12), the increase of the fraction of particles with diametersbelow 80 m decreases the duration for blocking by settling of the particles, which is adisadvantage for the transport pipes.
One should note that the density of the particles is not present in Eqs. (7.11)and (7.12), which means that it does not influence the quality of fluidization.
7.5 CATALYST DEMETALLATION
The demetallation of the spent catalyst may be performed continuously in a separateunit, attached to the catalytic cracking unit. The result is the decrease of the metalcontent of the equilibrium catalyst, the decrease of the amounts of fresh catalystaddition, and the improvement of the unit yields. Its performance become similarwith those obtained with hydrofined feed.
The demetallation processes, which address especially the nickel and the vana-dium, are based on a large number of studies that proposed a number of possibleroutes: extraction of the previously oxidized metals by means of organic acids;various acid–basic treatments; chlorination, which allowed the partial extractionof nickel; treatment with CO etc. In the same time studies were carried out on theremoval of sodium from the catalyst [57].
As a result of these studies the processes MET-X [58–60] and DEMET [51–63]were developed.
Copyright © 2003 by Taylor & Francis Group, LLC
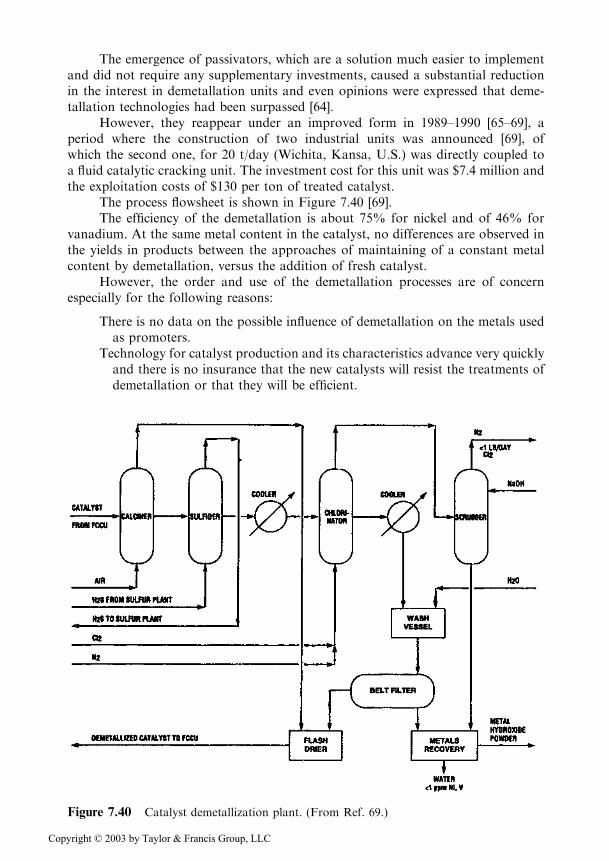
The emergence of passivators, which are a solution much easier to implementand did not require any supplementary investments, caused a substantial reductionin the interest in demetallation units and even opinions were expressed that deme-tallation technologies had been surpassed [64].
However, they reappear under an improved form in 1989–1990 [65–69], aperiod where the construction of two industrial units was announced [69], ofwhich the second one, for 20 t/day (Wichita, Kansa, U.S.) was directly coupled toa fluid catalytic cracking unit. The investment cost for this unit was $7.4 million andthe exploitation costs of $130 per ton of treated catalyst.
The process flowsheet is shown in Figure 7.40 [69].The efficiency of the demetallation is about 75% for nickel and of 46% for
vanadium. At the same metal content in the catalyst, no differences are observed inthe yields in products between the approaches of maintaining of a constant metalcontent by demetallation, versus the addition of fresh catalyst.
However, the order and use of the demetallation processes are of concernespecially for the following reasons:
There is no data on the possible influence of demetallation on the metals usedas promoters.
Technology for catalyst production and its characteristics advance very quicklyand there is no insurance that the new catalysts will resist the treatments ofdemetallation or that they will be efficient.
Figure 7.40 Catalyst demetallization plant. (From Ref. 69.)
Copyright © 2003 by Taylor & Francis Group, LLC
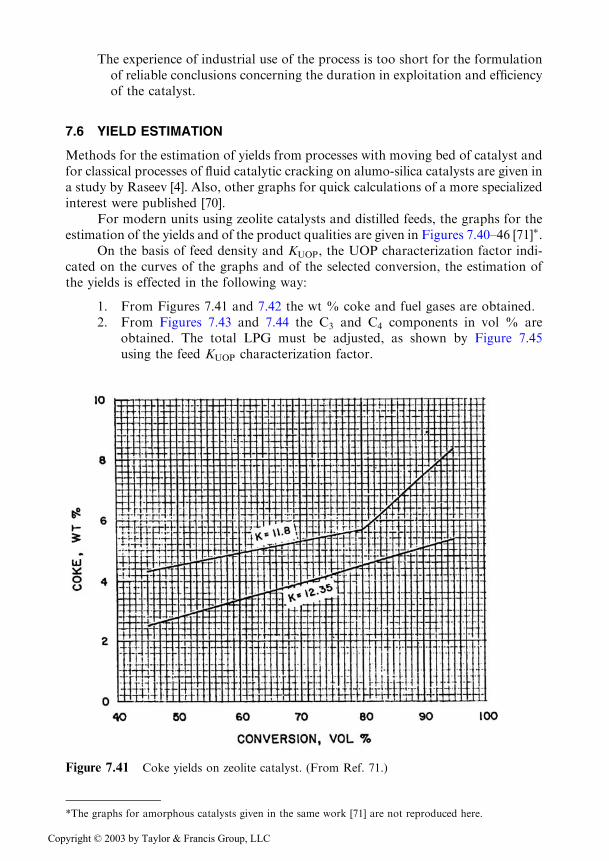
The experience of industrial use of the process is too short for the formulationof reliable conclusions concerning the duration in exploitation and efficiencyof the catalyst.
7.6 YIELD ESTIMATION
Methods for the estimation of yields from processes with moving bed of catalyst andfor classical processes of fluid catalytic cracking on alumo-silica catalysts are given ina study by Raseev [4]. Also, other graphs for quick calculations of a more specializedinterest were published [70].
For modern units using zeolite catalysts and distilled feeds, the graphs for theestimation of the yields and of the product qualities are given in Figures 7.40–46 [71]�.
On the basis of feed density and KUOP, the UOP characterization factor indi-cated on the curves of the graphs and of the selected conversion, the estimation ofthe yields is effected in the following way:
1. From Figures 7.41 and 7.42 the wt % coke and fuel gases are obtained.2. From Figures 7.43 and 7.44 the C3 and C4 components in vol % are
obtained. The total LPG must be adjusted, as shown by Figure 7.45using the feed KUOP characterization factor.
*The graphs for amorphous catalysts given in the same work [71] are not reproduced here.
Figure 7.41 Coke yields on zeolite catalyst. (From Ref. 71.)
Copyright © 2003 by Taylor & Francis Group, LLC
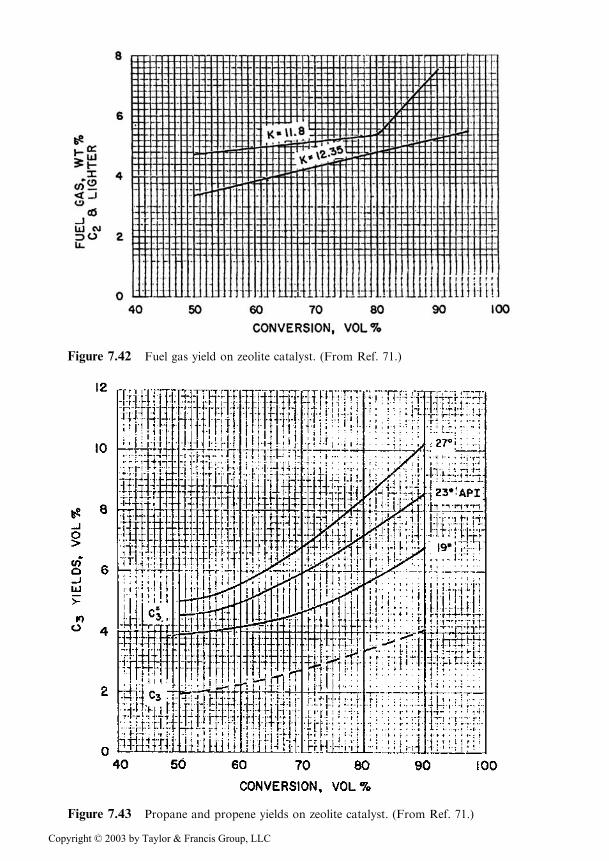
Figure 7.42 Fuel gas yield on zeolite catalyst. (From Ref. 71.)
Figure 7.43 Propane and propene yields on zeolite catalyst. (From Ref. 71.)
Copyright © 2003 by Taylor & Francis Group, LLC
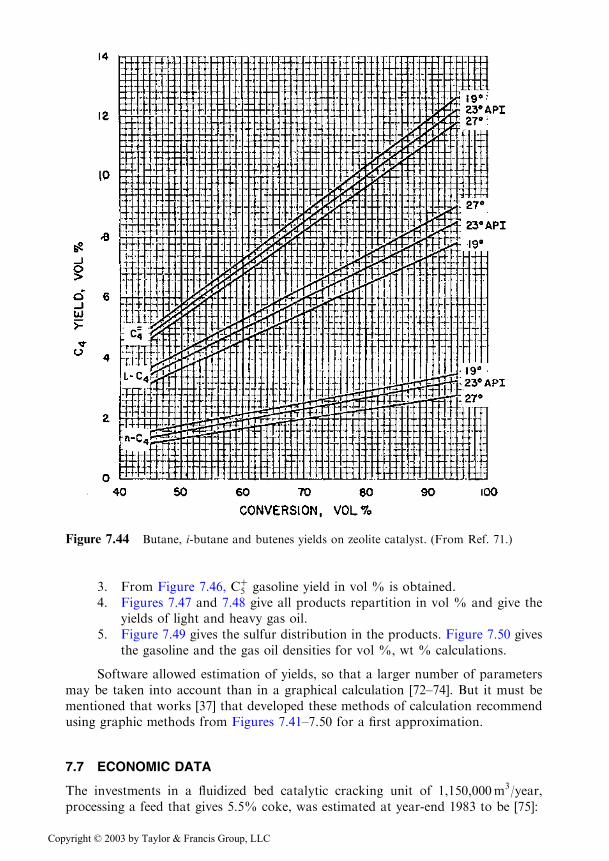
3. From Figure 7.46, Cþ5 gasoline yield in vol % is obtained.4. Figures 7.47 and 7.48 give all products repartition in vol % and give the
yields of light and heavy gas oil.5. Figure 7.49 gives the sulfur distribution in the products. Figure 7.50 gives
the gasoline and the gas oil densities for vol %, wt % calculations.
Software allowed estimation of yields, so that a larger number of parametersmay be taken into account than in a graphical calculation [72–74]. But it must bementioned that works [37] that developed these methods of calculation recommendusing graphic methods from Figures 7.41–7.50 for a first approximation.
7.7 ECONOMIC DATA
The investments in a fluidized bed catalytic cracking unit of 1,150,000m3/year,processing a feed that gives 5.5% coke, was estimated at year-end 1983 to be [75]:
Figure 7.44 Butane, i-butane and butenes yields on zeolite catalyst. (From Ref. 71.)
Copyright © 2003 by Taylor & Francis Group, LLC
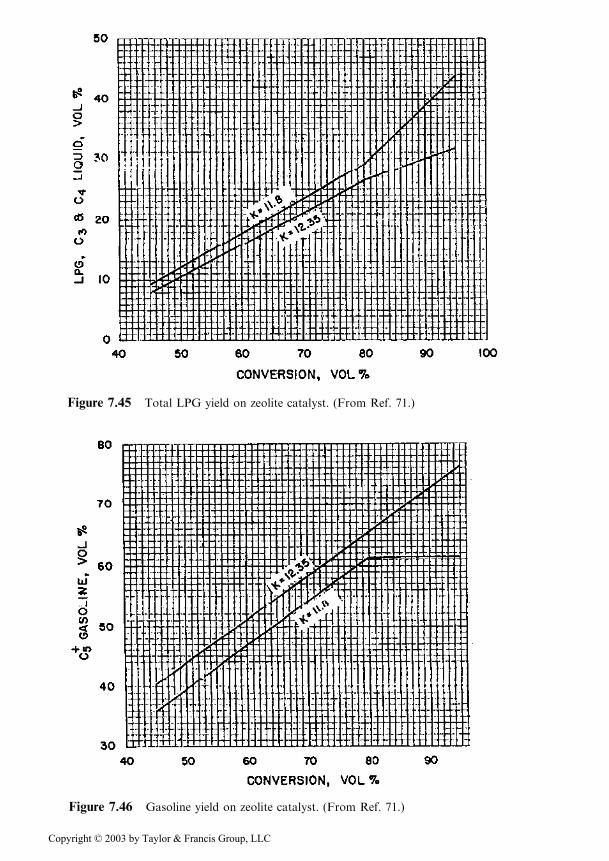
Figure 7.45 Total LPG yield on zeolite catalyst. (From Ref. 71.)
Figure 7.46 Gasoline yield on zeolite catalyst. (From Ref. 71.)
Copyright © 2003 by Taylor & Francis Group, LLC

Catalytic cracking þ gas concentration 31.0 million $
Catalytic cracking þ concentration of gases 37.5 million $
and gases recovery
Catalytic cracking, gas concentration, energy recovery, 38.5 million $
and electrostatic precipitation
The authors estimate that depending on stable conditions the investment couldvary within �30%.
Other authors supplied concurring data in 1992 [71] giving the investmentsdepending on the capacity of the plant (Figure 7.51). The investments from thegraph contain, besides the system reactor–regenerator, also the fractionating ofthe products: the compression of the gases with the recovery of 95% C4 and 80%C3, the heat exchange and the cooling of the products to the surrounding tempera-ture, and the central control system.
The utilities consumption in two alternatives with and without energy recoveryis given in the Table 7.14 [75].
Figure 7.47 Products distribution on zeolite catalyst. Feed KUOP ¼ 11:8. (From Ref. 71.)
Copyright © 2003 by Taylor & Francis Group, LLC
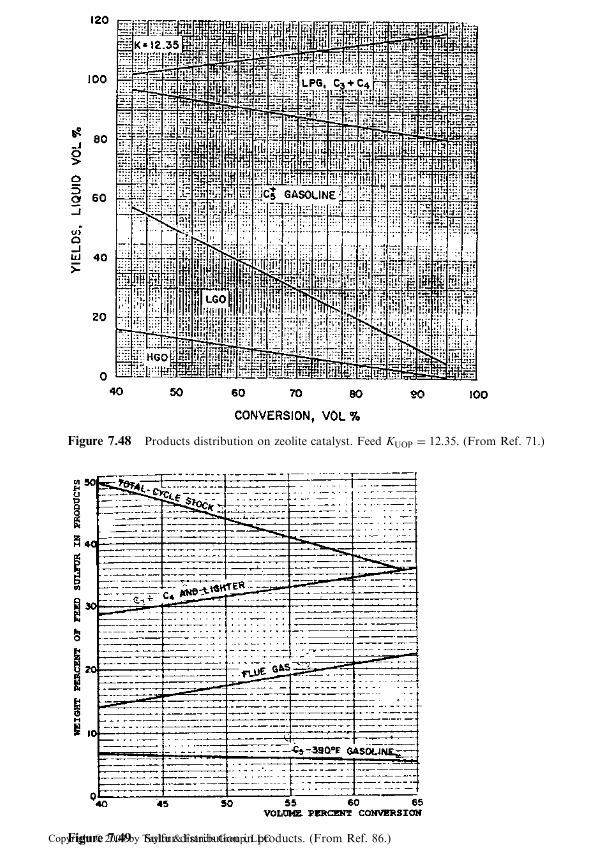
Figure 7.48 Products distribution on zeolite catalyst. Feed KUOP ¼ 12:35. (From Ref. 71.)
Figure 7.49 Sulfur distribution in products. (From Ref. 86.)Copyright © 2003 by Taylor & Francis Group, LLC
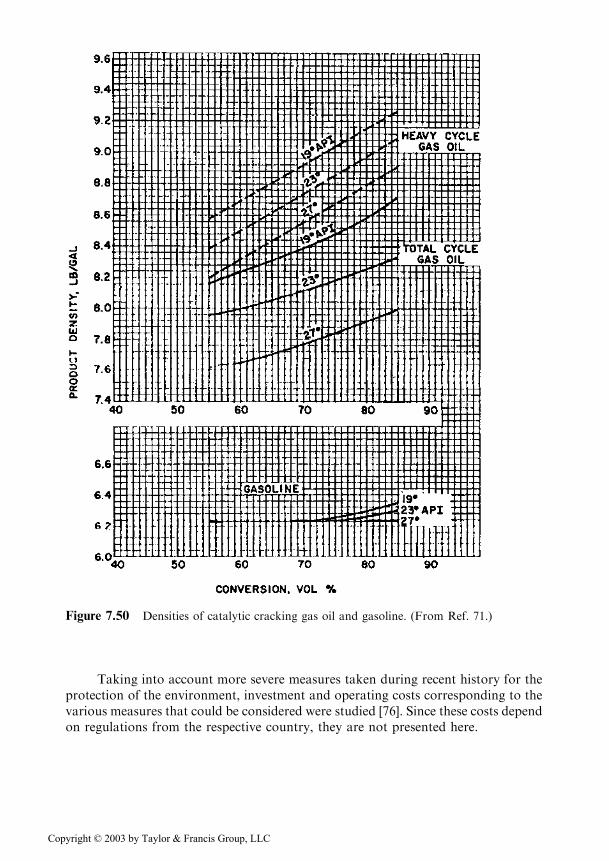
Taking into account more severe measures taken during recent history for theprotection of the environment, investment and operating costs corresponding to thevarious measures that could be considered were studied [76]. Since these costs dependon regulations from the respective country, they are not presented here.
Figure 7.50 Densities of catalytic cracking gas oil and gasoline. (From Ref. 71.)
Copyright © 2003 by Taylor & Francis Group, LLC
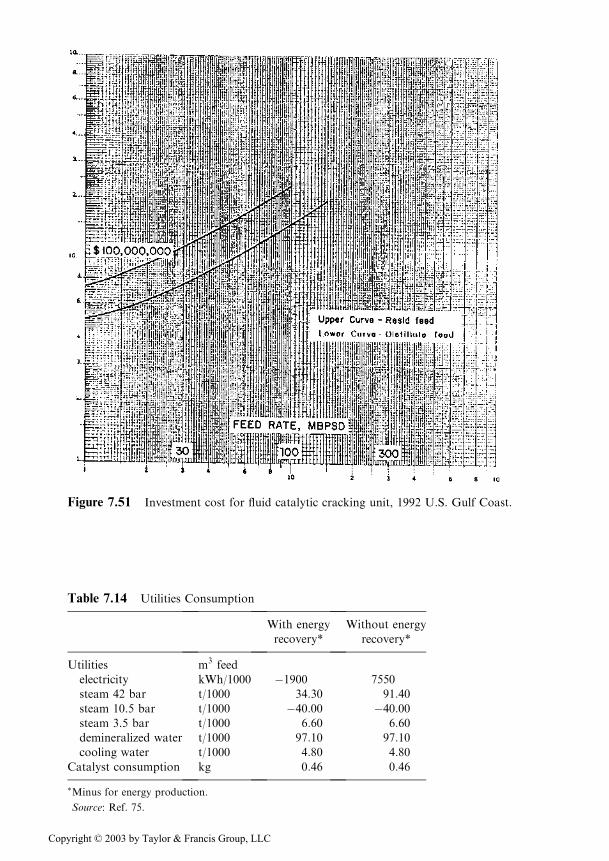
Table 7.14 Utilities Consumption
With energy
recovery*
Without energy
recovery*
Utilities m3 feed
electricity kWh/1000 �1900 7550
steam 42 bar t/1000 34:30 91:40steam 10.5 bar t/1000 �40:00 �40:00steam 3.5 bar t/1000 6:60 6:60demineralized water t/1000 97:10 97:10cooling water t/1000 4:80 4:80
Catalyst consumption kg 0:46 0:46
�Minus for energy production.
Source: Ref. 75.
Figure 7.51 Investment cost for fluid catalytic cracking unit, 1992 U.S. Gulf Coast.
Copyright © 2003 by Taylor & Francis Group, LLC
REFERENCES
1. SV Golden, GR Martin. Hydrocarbon Processing 70: 69–74, Nov. 1991.
2. KV Krikorian, JC Brice. Hydrocarbon Processing 66: 63, Sept. 1987.
3. EC Herthel, EH Reynolds, JH Roe. Oil and Gas J 58: 86, 1960.
4. S Raseev. Procese distructive de prelucrare a titeiului, Editura Tehnica Bucuresti, 1964.
5. JF Le Page, SG Chatila, M Davidson. Raffinage et conversion des produits lourds du
petrole, Technip Paris, 1990.
6. MJ Hunbach, DM Cepla, BW Hedrick, CL Hemler, HJ Niclaes. UOP-Residue
Conversion. 1990.
7. JR Murphy. Katalistiks, Third Annual Fluid Catalytic Cracking Sym., Amsterdam,
1982.
8. GH Dale. Heavy Oil Cracking. In: Proceedings of the 11th World Petroleum Congress,
vol. 4, 83. New York: John Wiley and Sons.
9. GE Weismantel. Heavy Oil Cracking. In: JJ McKetta, ed. Petroleum Processing
Handbook. New York: Marcel Dekker, Inc. 1992.
10. DB Bartholic, RP Haseltine. Development in Catalytic Cracking and Hydrocracking. Oil
and Gas J: 80, 10–13, 1982.
11. S Raseev, V Tescan, D Ivanescu. Bull Inst Petrol, Gaze si Geologie 18, 25, 1971.
12. BE Reynolds, EC Brown, MA Silverman. Hydrocarbon Processing 71: 43, 1992.
13. T Nguyen, M Skripek. Hydrocarbon Technology International. P Harrison, ed. London:
Sterling Publ. Ltd 1993 p. 33–43.
14. GD Hobson. Modern Petroleum Technology. 4th ed. New York: John Wiley & Sons
1973, pp. 288–309.
15. SC Eastwood, CJ Plank, P Weisz. Proceedings of the eighth World Petroleum Congress,
vol. 4. London: Applied Science Publishers, 1971.
16. AA Avidan, E Michael, H Owen. Oil and Gas J 88: 33, 8 Jan. 1990.
17. AD Reichle. Oil and Gas J 90: 41, 18 Mai 1992.
18. AA Murcia. Oil and Gas J 90: 68, 18 Mai 1992.
19. AA Avidan, R Shinnar. Ind Eng Chem 29: 931, 1990.
20. D Decroocq, R Bulle, S Chatila, JP Franck, Y Jacquir. Le craquage catalytique des
coupes lourdes. Technip, Paris 1978.
21. AL Saxton, AC Worley. Oil and Gas J 68: 82, 18 Mai 1970.
22. P Wuithier. Le Petrole-Raffinage et Genie chimique. Technip, Paris 1965.
23. AF Babicov, BZ Soliar, LS Glazov, JM Liberson, RV Basov, TH Melik-Ahnazarov, AV
Elsin, VM Zarubin. Himia Tehnol Topliv Masel 38: 9, 1993.
24. CW Strother, WL Vermilion, AJ Connes. Oil and Gas J. 70: 102, 15 May 1972.
25. FHH Khow, GV Tonks, KW Szetch, ACC Van Els, A Van Hatten. The Shell Residue
Fluid Catalytic Cracking Process. Akzo Catalysis Symposium, Scheveningen,
Netherlands, May 1991.
26. AA Avidan. Oil and Gas J 90: 59, 18 May 1992.
27. CR Santner. Hydrocarbon Processing 69: 75, Dec. 1990.
28. FM Hibbs, O Genis, DA Kauff. Hydrocarbon Technology International 1994, P
Harrison, ed. London: Sterling Publ. Ltd., 1994.
29. DA Lomas, CA Cabrera, DM Cepla, CL Hemler, LL Upson. Controlled Catalytic
Cracking, UOP, 1990.
30. JR Murphy, EL Whittingen. Development of Reduced Crude Catalytic Cracking
Technology. In: Proceedings of the 11th World Petroleum Congress, vol. 4. New
York: John Wiley & Sons, 1990.
31. L Upson. Hydrocarbon Technology International 1987. P Harrison, ed. London:
Gibbons Sterling Publ. Ltd., p. 53.
32. L Upson. Hydrocarbon Processing 66: 67, Sept. 1987.
Copyright © 2003 by Taylor & Francis Group, LLC
33. JL Mauleeon, G Heinrich. Revue de l’Institut Francais du Petrole 49: 509, 1994.
34. K Inai. Revue de l’Institut Francais du Petrole 49: 521, 1994.
35. DL Johnson, AA Avidan, PH Schepper, RB Miller, TE Johnson. Oil and Gas J 92: 80,
24 Oct. 1994.
36. JR Murphy. Oil and Gas J 90: 49, 18 May 1992.
37. EC Luckenbach, AC Worley, AD Reichle, EM Gladrow. Cracking Catalytic. In:
Petroleum Processing Handbook, JJ McKetta, ed. New York: Marcel Dekker, Inc.,
1992.
38. KE Londer, L Kulapaditharom, EJ Juno. Hydrocarbon Processing 64: 80, Sept. 1985.
39. TE Johnson. Hydrocarbon Processing 70: 55, Nov. 1991.
40. JL Mauleon, JB Sigaud. Oil and Gas J 85: 52, 23 Feb. 1987.
41. AD Scheiman. Development in Catalytic Cracking and Hydrocracking. Oil and Gas 53,
60–64, 1982.
42. HL Franzel. Hydrocarbon Processing 64: 51, Jan. 1985.
43. MCMM Campos, PSB Rodrigues. Oil and Gas J 91: 29, Jan. 11, 1985.
44. WA Blanton. Development in Catalytic Cracking and Hydrocracking. Oil and Gas J 53,
1982.
45. JD Cunic, R Diener, GE Ellis. Hydrocarbon Technology International. P Harrison, ed.
London: Sterling Publ. Co., 1994, p. 49.
46. SW Golden, AW Stoley, PB Fleming, S Costanzo. Hydrocarbon Technology
International 1994. P Harrison, ed. 1994, pp. 73–79.
47. SW Golden, AW Stoley, PB Fleming. Hydrocarbon Processing 72: 43, 1993.
48. G Rowlands, A Knouk, F Kleinschrod. Oil and Gas Journal 89: 64, Nov. 25, 1991.
49. H Dhulesia. Refining and Petrochemical Technology Yearbook 1987. Tulsa, Oklahoma:
Penn Wellbooks, 1987, p. 241.
50. SS Elshishini, SSEH Elnashaie. Chemical Engineering Science 45: 553, 1990.
51. GR Fritsche, AF Stegelman. Development of Catalytic Cracking and Hydrocracking.
Oil and Gas Journal 53, 1982.
52. J Scherzer. Octane Enhancing Zeolitic FCC Catalysts. New York: Marcel Dekker, Inc.,
1990.
53. LL Upson. Hydrocarbon Processing 60: 253, 1981.
54. MA Murphy. Oil and Gas Journal 92: 54, Feb. 21, 1994.
55. RB Ewell, G Gadmer, WJ Turk. Hydrocarbon Processing 60: 103, 1981.
56. JL Mauleon. Revamping of FCC Units. Seminar on Fluid Catalytic Cracking, organized
by Engelhard on Sept. 1989 at Brugge.
57. JE Boevink, CE Foster, SR Kumar. Hydrocarbon Processing 60: 123, Sept. 1981.
58. RJ Dilliplane, GP Middlebrooks, RC Hicks, EP Bradley. Oil and Gas Journal 61: 119,
Aug. 5, 1963.
59. PT Atterding, J Hunible. Hydrocarbon Processing and Petroleum Refining 42: 167, Apr.
1963.
60. DH Stormont. Oil and Gas Journal 61: 89, Jan. 14, 1963.
61. RA Sanford, H Erickson, EH Burk, EC Gossett, SC Van Petter. Hydrocarbon
Processing 41: 103, July 1962.
62. NR Adams, MJ Sterba. Hydrocarbon Processing 42: 175, May 1963.
63. NR Edison, JO Somessen, GP Masoligites. Hydrocarbon Processing 55: 133, May 1976.
64. C Marcilly. Revue de l’Institut Francais du Petrole 42(4): 481, 1987.
65. FJ Elvin. Oil and Gas Journal 85: 42, March 2, 1987.
66. FJ Elvin. Hydrocarbon Processing 68: 71, Oct. 1989.
67. FJ Elvin, SK Pavel. Oil and Gas Journal 89: 94, July 22, 1991.
68. FJ Elvin, O Pallotta. Hydrocarbon Technology International 1992, vol 51. P Harrison,
ed. London: Sterling Publ. Int., 1992.
Copyright © 2003 by Taylor & Francis Group, LLC
69. FJ Elvin, SK Pavel. 1993 NPRA Annual Meeting, Sept. 21–23, 1993. Convention Center,
San Antonio, Texas.
70. BP Castiglioni. Hydrocarbon Processing 62: 35, Feb. 1983.
71. JH Gary, GE Handwerk. Petroleum Refining Technology and Economics, 3rd ed. New
York: Marcel Dekker, Inc., 1994.
72. WL Pierce, et al. Hydrocarbon Processing 51: 92, May 1972.
73. EG Wollaston, et al. Oil and Gas Journal 73: 87, Sept. 22, 1975.
74. GWG McDonald. Oil and Gas Journal 87: 80, July 31, 1989.
75. DG Tajb. UOP Fluid Catalytic Cracking Process, published in Handbook of Petroleum
Refining Process, RA Meyers, ed. New York: McGraw-Hill, 1986.
76. MJ Humbarch, DM Cepla, BW Hedrick, CL Hemler, HJ Niclaes. Residue Conversion,
edited by UOP, 1990.
77. CW Stanger, R Fletcher, Jr., C Johnson, TA Reid. Hydroprocessing/FCC Synergy.
Hydrocarbon Processing 75: 89–96, Aug. 1996.
78. SW Shorey, DA Lomas, WH Keesom. Use FCC Feed Pretreating Methods to Remove
Sulfur. Hydrocarbon Processing 78: 43–51, Nov. 1999.
79. JW Wilson. FCC Revamp Improves Operations at Australian Refinery. Oil and Gas
Journal 97: 63–67, Oct. 1999.
80. JW Wilson. Fluid Catalytic Cracking Technology and Operations. Penn Well Books,
1997, pp. 97–100.
81. G de la Puente, G Chiovetta, U Sedran. FCC Operation with Split Feed Injection. Ind
Eng Chem 38: 2, 1999, pp. 368–372.
82. B Jazayeri. Optimize FCC Riser Design. Hydrocarbon Processing 70, May 1991, pp. 93–
94.
83. X Zhao, AW Peters, GW Weatherber. Nitrogen Chemistry and NO2 Control in Fluid
Catalytic Cracking Regenerator. Ind Eng Chem 36(11): 4535–4542, 1997.
84. KL Dishman, PK Doolin, LD Tullock. NO2 Emissions in Fluid Catalytic Cracking
Catalyst Regenerator. Ind Eng Chem 37(12): 4631–4636, 1998.
85. JB McLean. Fluid Catalyst Properties can affect cyclone erosion. Oil and Gas Journal
98: 33–36, Jan 3, 2000.
86. MJ Fowle, RD Bent. Petroleum Refiner 26(11): 719–727, 1947.
87. MJ Fowle, RD Bent. Hydrocarbon Processing 78: 124, March 1999.
88. G Xu, B Chan, X He. Hydrocarbon Processing 80: 81, April 2001.
89. MB Ewell, G Gardmer, WJ Turk. Hydrocarbon Processing 60: 103–112, Sept. 1981.
90. CA Cabrera, D Knepper. Hydrocarbon Technology International 1990/91. P Harrison,
ed. London: Sterling Publ. Int.
91. JE Naber, M Akabar. Shell’s residue fluid catalytical cracking process. Hydrocarbon
Technology International 1989/90. P Harrison, ed. London: Sterling Publ. International,
pp. 37–43.
Copyright © 2003 by Taylor & Francis Group, LLC