industrial noise control manual · industrial noise control projects. it is written for persons who...
TRANSCRIPT

TEnHINJIHAL RFRDRT
INDUSTRIAL NOISE CO NTRO L MANUAL
Revised Edition
'J. 5 TMCNT OT MCA; î H CDVCATI0N. A M r v^l L FARE• ' • i Ih £+#%**
C e r te i for D s e » * etubon»* in it M e fo r O o cu p tfo 'B t Safety m J Hcsltti

INDUSTRIAL NOISE CONTROL MANUAL (Revised Edition)
Paul Jensen Charles R. Jokel Laymon N. Miller
Bolt Beranek and Newman, Inc. Cambridge, Massachusetts 02138
Contract No. 210-76-0149
U.S. DEPARTMENT OF HEALTH, EDUCATION, AND WELFAREPublic Health Service
Center for Disease Control National Institute for Occupational Safety and Health
Division of Physical Sciences and Engineering Cincinnati, OhioDecember 1978
f « »■!* bjr th e S u p e r in te n d e n t o f D o c u m e n t« , U .S . G o v e rn m e n t P r in t in g O f f ic e , W a s h in g to n . D .C . 20402

DISCLAIMERThe contents of this report are reproduced herein as received from the contractor.The opinions, findings, and conclusions expressed herein are not necessarily those of the National Institute for Occupational Safety and Health, nor does mention of company names or products constitute endorsement by the National Institute for Occupational Safety and Health.
NIOSH Project Officer: William N. McKinnery, Jr.
DHEW (NIOSH) Publication No. 79-117
i i

PREFACEEmployer and employee awareness of the problems of Industrial noise has increased notably in the past decade, Industry's concern about noise, especially since the mid-1960s, has been growing steadily.In the early 1970s9 the Occupational Safety and Health Administration (OSHA) established a noise exposure regulation specifically for workplaces. Industry has responded to the new interest in noise reduction, but has encountered difficulties in correcting individual noise problems and implementing company-wide noise reduction programs. Company personnel who may have little or no understanding of the causes or solutions of the problems of noise may be asked to select a noise control method or device, to choose noise control materials, to use noise measuring instruments, or to decide whether to call upon a qualified consultant.In this dilemma, industry's need is clear: practical informationabout noise control, information based on methods that have been tested and found successful — in terms of effectiveness, time, and cost — in achieving an acceptable noise environment in industrial plants. In the mid-1970s, the National Institute for Occupational Safety and Health (NIOSH) contracted for a manual of such practical information. The result was the Industrial Noise Control Manual [HEW Publication No. (NIOSH) 75-183]3 which included essential information about noise control techniques and a collection of case histories of successful noise control projects in industrial plants.In 1977, NIOSH scheduled a revision of the popular Manual to cover work performed between 1975 and 1978. For this edition, previous case histories have been reprinted, new case histories have been added, and additional case histories have been abstracted from current literature. The revised Industrial Noise Control Manual now contains a comprehensive presentation of practical applications of noise control in industry.NIOSH -welcomes industrial noise control case histories for future editions of the Manual. As in this edition, case histories will carry full identification of the persons who do the work and the firms for which the work is done. The preferred form for case histories is:

A. Description of the process, machine, and noise problemB. Noise measurements made and discussion of findingsC. Control approaches — advantages and disadvantagesD. Results in terms of the noise reduction achieved and the
costE. Pitfalls to avoid when implementing the control methodsF. Figures — noise data (e.g., octave-band sound pressure
levels)G. Sketches of area layout, machine/operator relationship,
construction details of noise control devicesH. Photographs of machines before and after modifications —
8 x 10 glossy preferred.Case histories should be sent to:
Physical Agents Control Section, CTRBDivision of Physical Sciences and EngineeringNational Institute for Occupational Safety and Health4676 Columbia ParkwayCincinnati, Ohio 45226
i v
ABSTRACTThis Manual contains basic information on understanding, measuring, and controlling noise, and more than 60 actual case histories of industrial noise control projects. It is written for persons who have had little or no experience in noise control. Included are sections on noise problem analysis, basic methods of noise control, acoustical materials, and the choice of a consultant. An extensive, partially annotated bibliography of books and articles on relevant topics is Included in the Manual, as is an annotated list of sources containing more case histories.
This report was submitted in fulfillment of Contract No. 210-76- 01^9 by Bolt Beranek and Newman Inc., under the sponsorship of the National Institute for Occupational Safety and Health.
v


CONTENTSPreface ............................................................. iiiAbstract ............................................................ vList of Figures and Tables ....................................... viii1. Introduction ................................................... i
What This Manual is About ................................. 1Organization of the Manual ................................ 2
2. Noise Problem Analysis ........................................ 3Does a Noise Problem Exist? ............................... 3OSHA Regulations: Worker Noise Exposures ................ 11How to Measure Sound ....................................... 14How Severe is the Problem? ................................ 20Noise Source Diagnosis ..................................... 24Summary of Diagnostic Approaches ......................... 47
3. Noise Control .................................................. 49Techniques Involving Minimal Equipment Modification .... 49Techniques Requiring Equipment to be Added to
Existing Machinery ....................................... 55Techniques Requiring Equipment Redesign ................... 71Personal Protection Equipment ............................ 72
4. Noise Control Materials ....................................... 75Absorption Materials ....................................... 75Transmission Loss Materials ............................... 77Damping Materials .......................................... 78Vibration Isolators ........................................ 78Material Selection ......................................... 7 9
5. Selecting and Using a Consultant ............................ 82Knowing When a Consultant is Needed .................... 82Selection of a Consultant ................................. 83Guideline Questions ........................................ 84
6. Case Histories ................................................. 89Case History Data ........................................... 89Outline of Complete Procedure for Development of
Noise Control ............................................. 89Techniques That Involve Minimal Equipment Modification . 95Case History 1: Paper Machine, Wet End .................. 96Case History 2: Gas Turbine Test Station ................ 99Case History 3: 800-Ton Blanking Press .................. 101Case History 4: Nail-Making Machine ..................... 105Case History 5: Pneumatic Scrap Handling ............... 107Case History 6: Parts Conveying Chute ................... 110Case History 7 : Plastics Scrap Grinder .................. 112Case History 8: Hopper Noise ............................. 114Case History 9: Electric-Powered Towing Machine ....... 118Case History 10: Blanking Press ........................... 121Case History 11: Spinning Frame ........................... 124Case History 12: Boxboard Sheeter ......................... 127
vii

CONTENTSCase History 13: Carding Machines .................... 130Techniques That Involve Significant Equipment
Modification ........................................... 132Case History 14: Folding Carton Packing Stations,
Air Hammer Noise .................... 134Case History 15: Printing and Cutting Press ......... 138Case History 16: Straight-and-Cut Machines .......... 140Case History 17: Impact Trimming Machines ........... 145Case History 18: Transformer .......................... 148Case History 19: Transformer .......................... 152Case History 20: Surface Grinders .................... 154Case History 21: Printer ............................... 155Case History 22: Metal Citt-Off Saw ................... 157Case History 23: Wood-Planer .......................... 159Case History 24: Punch Press .......................... l6lCase History 25: Punch Press .......................... 162Case History 26: Punch Press .......................... 164Case History 27: Braiding Machine .................... 166Case History 28: Refrigeration Trucks ................ 170Case History 29: Spiral Vibratory Elevator .......... 172Case History 30: Motor Generator Set ................. 175Case History 31: Filling Machines .................... 179Case History 32: Gearbox ............................... 183Case History 33: Steam Generator Feed Pump .......... 185Case History 34: Muffler Shell Noise ................. 189Case History 35: Concrete Block-Making Machines .... 193Case History 36: Jordan Refiners ..................... 203Case History 37: Pneumatic Scrap Handling Ducts .... 207Case History 38: Blood Plasma Centrifuge ............ 209Case History 39: Pneumatic Motors .................... 214Case History 40: Dewatering Vacuum Pump ............. 216Case History 4l: Induced-Draft Fan ................... 218Case History 42: Process Steam Boiler Fans .......... 223Case History 43: Gas Turbine Generator .............. 226Case History 44: Jet Engine Compressor Test Cell ... 229Case History 45: Jet Engine Test Cell ................ 232Case History 46: Pneumatic Grinder ................... 234Equipment Redesign Treatments ......................... 236Case History 47: Wood Planer .......................... 237Case History 48: Textile Braiding Machines .......... 240Case History 49: Steam Line Regulators ............... 242Case History 50: Speed Control Device ................ 243Combinations of Treatments ............................. 246Case History 51: Steel Wire Fabric Machine .......... 247Case History 52: Barley Mill .......................... 251Case History 53: Punch Press .......................... 258Case History 54: Cut-Punch Press ..................... 264Case History 55: Punch Press .......................... 268Case History 56: Newspaper Printing Press ........... 274Case History 57: Letterpress Rotary Printing
Machine .............................. 275
v i i i

Case History 5 8 : Chemical Process Plants ............... 279Case History 59: Vibration Table .................... 283Case History 60: Teletype Machine .................... 287Case History 61: Process Plant Noise Control at the
Plant Design Stage .................. 291Bibliography ...................................................... 296
CONTENTS
i x

FIGURES2.1. Frequency-wavelength chart for sound in air at
normal temperature and pressure ..................... 52.2. Frequency component of musical note ................... 62.3« Frequency composition of two common industrial
sounds ................................................. 72.4. Response characteristics of weighting scales and
of ear at threshold .................................. 102.5. Recommended frequency spectrum for OSHA
noise problems ...».................................... 232.6. Determination of required noise reduction ............ 242.7. Chart for combining decibel levels .................... 262.8. Assumed sound source on a factory floor, surrounded
by an imaginary shell at 1-m distance .............. 322.9. Hypothetical problem situation ......................... 342.10. Location of noise sources relative to property
level position for use in example .................. 352.11. Results of power level extrapolations ............. . 362.12. Sound level distribution in spaces with various
room constants .............................. .......... 423.1- Source-barrier-receiver geometry .................... . 573.2. Examples of partial enclosures ......................... 583 - 3 • Split panels for services .............................. 603.4. Welded angle iron frame ..................... ........... 6l3-5- Enclosure panels secured to frame by quarter-turn
fasteners ........................ .................... 6l3.6. Vibration isolation and toe covering .................. 623.7. Enclosure panel interior treatment .................... 623.8. Door and hatch detail ................................... 633.9« Window detail ............................................ 633.10. Examples of enclosures .................................. 643.11- Effect of enclosure sound leaks on potential
noise reduction ....................................... 653.12. Example of isolating wall .............................. 686.1.1. Paper mill — wet end .................................... 966.1.2. Sound pressure levels at wet end of paper machine ... 986.2.1. Reduced aisle sound levels, as predicted ............. 1006.3.1. Vertical acceleration on pier, before and after
isolation .............................................. 1026.3.2. Horizontal acceleration on pier, before and after
isolation .............................................. 1026.3.3. Quasi-peak levels 4 ft from press foot, before and
after isolation ....................................... 103
x

FIGURES6.4.1. Operator position sound pressure levels, before and
after treatment of nail-making machine ............. 1066.5.1. Scrap handling system for cutting press .............. 1086.6.1. Chute for conveying cartridge cases ................. 1106.6.2. Sound pressure levels measured 3 ft from chute ........ Ill6.7.1- Plastics grinder; range of sound pressure levels
before and after treatment .......................... 1136.8.1. Overall sound pressure level vs time of noise caused
by parts falling into undamped hopper .............. 1156.8.2. Noise reduction from damping ........................... 1166 .9 .1. Green tire storage truck ............................... 1196.10.1. Method used to cover slots in blanking press ram .... 1216.10.2. Quasi-peak readings of blanking press after ram
ringing was contained ................................ 12 36.11.1. Air exhaust vent modification for spinning machine
noise control ......................................... 1256.12.1. Floorplan of sheeter for boxboard ..................... 1276.12.2. Sheeter drive box enclosure ............................ 1286 .1 2 .3 . Layout of sheeter and operators ....................... 1286.13.1. Sound pressure levels at carding machines ............ 1316.14.1. Air hammer stripper and packer line ................... 1356.14.2. Barrier wall theory ..................................... 1366.15.1. Top view of in-line gravure-cut press with sound
barrier curtain ....................................... 1386.15.2. Side view of in-line gravure-cut press with sound
barrier curtain ....................................... 1396.16.1. Straight-and-cut machine: close-in measurement
near west side of clutch cutter mechanism ......... 1416.16.2. Straight-and-cut machine: close-in measurement
near east side of clutch cutter mechanism ......... l4l6 .1 6 .3 . Straight-and-cut machine: operator’s nearfield
exposure ............................................... 1426.16.4. Straight-and-cut machine: operator's farfield
exposure ............................................... 1426.16.5. Barrier wall for straight-and-cut machine ............ 1436.17.1. Knight trim department layout of acoustical
barriers ............................................... 1466.17.2. Result of statistical analysis of noise exposure
at operator station .................................. 1466.18.1. Lat e-nighttime sound pressure levels measured at
community locations .................................. 1516.19.1. Plan view of sound barrier arrangement ................ 1536.22.1. Metal cut-off saw: operator position sound pressure
levels before and after enclosure of saw .......... 1586.25.1. Press framing and location of panels .................. 163
xi

FIGURES6.26.1. Sound levels at the original measurement locations,
which were reduced to a maximum of 88 dBA ........ 1656.27-1. Braider enclosure ...................................... 1686.27.2. Braider enclosure, another view ...................... 1696.29.1. Detail of acoustic enclosure: doors ................ 1736.29.2. Acoustic enclosure around elevators .................. 1746.30.1. Photograph showing the installation of the high--
frequency MG set enclosure ......................... 1766.30.2. Photograph of the installed MG set enclosure ....... 1766.30.3. Cross-sectional sketch of the high-frequency
MG set enclosure ..................................... 1776.30.4. Before, after, and predicted data for motor
generator set ........................................ 1786.31.1. Sound pressure levels in filling machine room
before and after treatment ......................... 1806.31.2. Example of the conceptual design drawings ........... l8l6.31.3. Sound pressure levels in filling machine room ...... 1826.32.1. Engine room sound pressure levels .................... 1846.33.1. Measurements near boiler feed pump ................... 1876.34.1. Vacuum sound pressure levels and residential
criterion ............................................. 1926.35.1. Concrete block manufacturing machine ................. 19 36.35.2. Typical concrete block plant material flow plan .... 1946.35.3. Plant 1: maximum sound level contours ............... 1976.35.4. Plant 2: maximum sound level contours .............. 1986.35.5. Plant 2: maximum sound level contours .............. . 1996.35.6. Plant 3: maximum sound level contours ............... 2006.35.7. Plant 4: maximum sound level contours ....... ........ 2016.35-8. Detail of operatorTs position and maximum
sound levels .......................................... 2026.36.1. Noise reduction lagging for Jordan shell ............ 2066.37.1. Noise levels in scrap duct for corrugated box
industry, before and after covering ............... 2086.38.1. Sketch of one centrifuge ............................... 2096 .3 8 .2 . Sound pressure levels at operator position .......... 2106 .3 8 .3 . Sketch of centrifuge showing locations for close-
in diagnostic readings .............................. 2116.38.4. Motor exhaust muffler .................................. 2136.39.1. Effect of muffler on air exhaust from hoist ......... 2146.40.1. Octave-band analysis of paper mill vacuum
pump noise ............................................ 2176.41.1. Induced draft fan system layout ...................... 2196.41.2. Measurements of fan noise ............................. 2206.41.3. After installation of fan discharge muffler ......... 2216.42.1. Elevation drawings showing how two fans at an
R.J. Reynolds Tobacco Co. plant were quietedby IAC Power-FLOW silencing units ................. 224
x i i

FIGURES6.42.2. Sound pressure levels 3 ft from fans .................. 2256.43.1. Sound pressure levels outside nearest residence
at 300 m ............................................... 2276.43.2. Sound pressure levels inside nearest residence
at 300 m ............................................... 2286.44.1. Octave-band sound pressure levels measured at
business neighbors at approximately 400 m from compressor test cell ................................. 230
6.44.2. Octave-band sound pressure levels measured atresidential neighbors at approximately 1200 mfrom compressor test cell ............................ 230
6.46.1. Muffler shown removed and mounted on pneumatictool ..................................... .............. 235
6.47.1. Before-and-after third-octave-band sound pressurelevels for wood planer ............................... 238
6.47.2. Effect of board length on noise from wood planer ... 2396.48.1. Textile braiding machine: comparison of sound
pressure levels from steel carriers and from polyurethane carriers ................................ 241
6.49.1. Main valve plug with throttling vanes to reducenoise in steam line regulator ....................... 242
6.50.1. Essential features of the speed control system ...... 2446.50.2. Essential features of the muffler ..................... 2446.50.3. Constant A-weighted sound level contours for the
speed control cooling system before and after acoustical treatment as measured 15 ft from the blower housing center ................................ 245
6.51.1. Sound pressure levels at 8-ft fabric machine ......... 2486.51.2. Steel plate barrier with window ........................ 2496.51.3. Lexan barrier in two sections; slides up for access . 2506.52.1. Sound pressure levels at mills, hay shredder, and
operator's chair ...................................... 2516 . 5 2 . 2 . Floor plan of barley mill .............................. 2 526 .5 2 .3 . Sectional view of barley mill .......................... 2536.53.1. Layout of punch press room ............................. 2586.53.2. Ambient sound pressure levels with furnace on, two
Summit, two Bliss, and one Benchmaster presses in operation ...........................................259
6.53.3. Sound pressure levels at Punch I ...................... 2606.53.4. Sound pressure levels at the operator position of
Punch VII .............................................. 2616.53.5. Design of nozzle ......................................... 2626.53-6. Sketch of Plexiglas barrier ............................ 2626.54.1. Cut-punch press operator position sound pressure
levels ..................................................2646.54.2. Cut-punch press, close-in diagnostic data, 14 cm
from gears ............................................. 2656.54.3. Cut-punch close-in data ................................. 265
xiii

267270
270271272273277
278
28l281
282
282
284286288288289
289
290292
293293294
FIGURES
Sketch of hanging barrier for cut-punch press .......Comparison of punch press sound pressure levels
with air ejection and with mechanical ejection .... Comparison of punch press sound pressure levels
with and without a shield between operator andair ejection noise ....................................
Comparison of punch press sound pressure levels:standard die vs slanted die .........................
Sound pressure levels 30 ft from bench press areabefore and after sound absorption treatment .......
Data 30 in. from punch press before and aftertest cardboard enclosure .............................
Floor plan of the rotary pressroom at "Politiken"in Copenhagen . . . .....................................
The octave-band levels measured at Point A in Figure 6-57«l before and after the fitting ofscreens ................................................
Noise reduction achieved by reducing fan speed, using increased blade pitch to offset decreasein speed ...............................................
Compressor discharge noise reduction achieved bylagging expansion joint ..............................
Noise reduction achieved by redesigning pumpby-pass loop ...........................................
Noise reduction achieved by adding silencer toair blower intake .....................................
Results of measurement of operator position soundpressure levels .......................................
Three-phase program of noise control used toquiet vibration table ................................
Teletype and desk where noise reduction was desired .Teletype and installed acoustic booth ................Before-and-after treatment data at desk ..............Unenclosed teletype noise spectra with and without
resilient pad in place ...............................Enclosed teletype noise spectra with and without
resilient pad in place ...............................First iteration A-weighted sound level contours
(dBA) generated for CHD site ................. ......Second iteration A-weighted sound level contours
(dBA) generated for CHD site ........................Third iteration A-weighted sound level contours
(dBA) generated for CHD site ........................A-weighted sound level contours actually measured
at CHD site ............................................
xiv

TABLES2.1. Octave-band frequency characteristics of the A-
weighted sound level meter filter .................. 112.2. Permissible noise exposures ............................ 122.3» Table for obtaining decibel sum of two decibel
levels ........... ..................................... 262.4. Example of decibel addition ............................ 272.5. Calculations for example problem ...................... 372.6. Coefficients of general building materials and
furnishings ............................................ 403-1. Required static deflection for common industrial
speeds or forcing frequencies ....................... 543.2. Transmission loss of common materials ................ 674.1. Sound absorption coefficients of common acoustic
materials .............................................. 766.19.1. Acoustic measurements, SPL ............................. 1526.44.1. Compressor test facility — octave-band sound
pressure levels ....................................... 2296 .5 8 .1. Sources of noise and methods of noise reduction ..... 280
xv


1. INTRODUCTIONWHAT THIS MANUAL IS ABOUTNoise problems abound in industry. They encompass:
• Intrusion of plant noise into nearby residential areasIntrusion of plant noise into adjoining office spacesInterference with speech communication and audible warning sounds by noise in the work areaPermanent hearing loss and other detrimental health effects caused by long-term exposure to excessive plant noise.
The first three problems reflect the "annoyance" effects of noise; the fourth involves actual physiological damage.This Manual can help you, the plant executive, engineer, or staff member, solve all four kinds of problems. In addition, much industrial noise today is subject to Federal regulations, and this Manual will help you meet Federal standards, but the approaches to noise control described in this Manual apply to a l l situations in which noise annoys or harms humans, not just those situations covered by regulations.In the first, or general discussion, part of this Manual, we emphasize approaches to noise control. Why approach and analysis, rather than outright solutions? The reasons are two:
Learning how to approach and analyze the general problem of noise is more valuable than learning the solution to a few specific problems of noise;The sources of industrial noise are so many that a listing of these sources, their uses, and their almost innumerable possible treatments would fill an encyclopedia, not a manual.
We present, therefore, one broad, basic approach, in the form of four short questions.Also, in the first part of this Manual, we discuss noise control techniques in general, rather than in terms of specific applications. The general discussions that appear in the next four
1

sections of this Manual are, we believe, a necessary introduction to the second part: detailed reports of the actual case histories.ORGANIZATION OF THE MANUALAn effective approach to a noise problem can be divided into these four questions:
Is there a problem?How severe is it?What causes it?What can be done to solve it?
The next four sections of this Manual — Noise- Problem Analysis, Noise Control, Noise Control Materials, and Selecting and Choosing a Consultant — discuss these questions and offer answers, or information on which you can base your answers. In the following Case Histories section, more than 60 examples of actual noise control are arranged by treatment category, rather than by machine type, to illustrate approaches to noise control as well as solutions to individual problems.The Manual ends with an extensive, partially annotated bibliography of books and articles on topics discussed throughout the book and an additional annotated list of sources containing more case histories.Note: Metric units are used generally throughout the Manual,though some English units have been retained, particularly in several older case histories.
2

2 . NOISE PROBLEM ANALYSISDOES A NOISE PROBLEM EXIST?Is the level of noise in your plant hazardous? Annoying? To find out, try to talk with someone in the noisy area of the plant. If you can talk comfortably with someone 1 m away, there is probably not enough plant noise at that position to damage hearing. But if you, or others, must shout to be heard or understood at close distances (between 20 to 40 cm), plant noise at that position probably can cause hearing loss, and you should have the sound levels there measured with suitable instruments.How about noise traveling out of the noisy plant area? If person- nel in other parts of the plant complain, you should investigate their complaints, and measure the levels of the sound they hear.If plant neighbors complain, or If local authorities say the sound exceeds applicable noise ordinances, a problem may exist and measurements are called for.Once appropriate, accurate sound level measurements are made, measured values should be compared with the noise regulation or sound level criterion correct for the situation. ("Criterion" here means a target for an acceptable sound level for a specific environment.)When you are seeking compliance with OSHA noise regulations, the sound level regulation is a function of both sound level and daily exposure time. If the measurements reveal an excessive combination of sound levels and exposure times, a noise problem exists.For noise intrusion into other parts of a plant or building, use the same approach. Measure sound levels, compare them with well- authenticated criteria, and determine whether a problem exists and what the solution may be.Even in the absence of complaints from plant neighbors, a local noise ordinance may dictate the allowable sound level limits.(Be aware that a local ordinance may designate different levels for daytime and nighttime plant operation.) When no local ordinance exists and neighbors are saying the sound from the plant is "too loud," your best move is to make sound level measurements in the community — first, when the plant is not operating, second, when it is. If you find that plant noise is well above the "ambient," or background sound in the community, a community noise problem quite
3

probably exists. A sound that causes annoyance or offense may be affected by many factors, all adding to its complexity. A tonal sound, such as the "whine” of a fan, or an intermittent or impulsive sound, such as those made by a jackhammer, a pile driver, a steam vent blowing off, or an outdoor P.A. system, is usually more identifiable — and more objectionable — than a sound that has less noticeable characteristics.A noise problem, then, may manifest itself in one or both of two ways:
By the s u b j e c t i v e response of people who are disturbed by the noiseBy o b j e c t i v e measurements of the sound levels and comparison of those values with noise regulations or noise criteria generally regarded as applicable to the situation.
To understand sound measurements, characteristics, and interpretations, you must have a general knowledge of the theory and terminology used in acoustics and noise control. The next two subsections summarize this material briefly.What Is Sound?Key words:SoundFrequencyWavelengthHertz
Tona IHarmonics
Fundamental Frequency
Broadband Sound
Octave Bands Root-Mean-Square (rms) Sound P r e s s u r e
D e c ib e l sSound P r e s s u r e L ev e l
Pasca l
Sound is a physical occurrence. It is caused by minute pressure variations that are transmitted (invisibly) by wave motion. The propagation of sound is analogous to the disturbance that is transmitted along the length of a long stretched spring (fixed at both ends), when a section of the spring at one end is repeatedly and regularly compressed and released. The compressed and stretched parts of the resulting wave traveling along the spring are like the compressed and rarified parts of a sound wave traveling through the air. The rate at which the spring is periodically compressed and released (or at which the air is compressed) becomes the f r equency of the wave. The spacing between consecutive disturbances on the spring becomes the wavelength.

In the spring, as in air, the speed of travel of the disturbance depends only on properties of the medium through which it travels. Speed, frequency, and wavelength are interrelated by the following equation:
frequency = speed of disturbance t wavelength.Acousticians write this relationship as:
f = c/X. (2.1)Imagine the stretched spring again. With a fast rate of compressing and releasing the spring, there will be only short distances between successive disturbances traveling along the spring. With a low rate of compressing and releasing the spring, there will be relatively long distances between successive disturbances traveling along the spring. In other words, for sound in air (as well as for the spring), high frequencies have short wavelengths and low frequencies have long wavelengths. This fact is borne out by Equation 2.1.Sound moves in air at normal room temperature and pressure at a speed of about 340 m per sec. Frequency is expressed as oscillations or vibrations or events per second, called HertZj abbreviated Hz (formerly identified by the unit "cycles per second" or cps). Wavelength may be quoted in meters, feet, or inches. Figure 2.1 is a wavelength chart.
to 20 50 100 200 500 1000 2000 5000 10,000FREQUENCY-HZ
Figure 2.1. Frequency-wavelength chart for sound in air at normal temperature and pressure.

If you were to hear a sound at a single frequency, it would sound tonal, like the sound of a vibrating tuning fork. Most sounds actually are composites of many frequencies. Notes played on musical instruments, for example, contain not only a dominant "fundamental frequency," but also additional tones having multiples of the fundamental frequency (overtones or harmonics) , For example, "A below middle C" on a piano keyboard has a fundamental frequency of about 440 Hz, but its sound also contains tonal components at 880, 1320, 1760, 2200, 2640 Hz, and so on, as conceptualized in Figure 2.2.
zLJ
UJ>t-<_lUJoc.
Figure 2.2. Frequency component of musical note.Many typical sounds do not have tones at fixed frequencies, i.e., an automobile or truck driving along a street, an air jet or air leak from a compressed air supply, the "bang" of a punch press, or the combustion roar of a furnace. These sounds have short, repeated, random bursts of noise at all frequencies across the full range of human hearing (say 16 Hz to 16,000 Hz, more or less). Such sounds are termed "broadband," but their noise composition can still be broken down into the frequency contents of the noise. Most often, values for the noise contained within adjacent bands of frequencies (called octave bands) are used to display the frequency composition of a sound. Figure 2.3 illustrates the concept. The air leak produces mostly high-frequency "hissy"
6

OCTAVE BAND CENTER FREQUENCY (Hz)Figure 2.3. Frequency composition of two common industrial sounds.sounds; the furnace combustion produces mostly low-frequency "rumbles." Such spectra (frequency breakdowns) are a kind of signature of the noise. Sometimes more detailed spectra are used in noise analysis. The values of the frequency content would then be plotted in one-third octave bands or one-tenth octave bands, for example.The frequency content of noise is very important because hearing damage is related to frequency, and the effectiveness of noise control treatments depends on frequency.Think of the vibrating stretched spring again. The parts of the coil vibrating back and forth move only through short distances. Similarly, in the sound wave, air particles vibrate back and forth only through very short distances (perhaps a few ten- thousandths of a millimeter or a few millionths of an inch) ; the air particles do not travel all the way across the room or across a field. Yet they transmit their energy by setting adjoining air particles into vibration, and those, in turn, pass the vibration on to their neighboring air particles. Air is a nearly perfectly elastic medium, and there is practically no loss of energy as these particles transmit their vibration from one to another across the room at the speed of sound.
7

As the air particles vibrate, momentary tiny fluctuations occur in the atmospheric pressure. It is these pressure changes that our ears detect as sounds or that a microphone responds to. The sound p r e s s u r e changes alternatively positive and negative relative to atmospheric pressure, as the air is compressed and rarified.It is necessary to be able to apply numbers to the pressure changes that occur. The best quantity to use is the average pressure.But if we tried to average the sound pressure changes that occur at a particular point and over a particular time interval, we would find the average always equal to atmospheric pressure — all the positive pressure fluctuations are exactly counterbalanced by the negative ones. Thus, in place of a simple average, the instantaneous pressures are first squared, then square-rooted before making the average. This procedure gives a positive valued quantity to a sound pressure. This is what is meant by the r o o t - mean-square (rms) value of the sound pressure.A very weak sound may have an rms sound pressure that is very small compared to atmospheric pressure; in fact, the rms sound pressure of a barely audible sound at 1000 Hz (in the frequency region where we hear best), in a very quiet environment, is about 0.0000000002 or 2 x 10“ 10 atmosphere, obviously a small pressure.A very loud sound could have an rms sound pressure of over 0.001 atmosphere. These numbers not only represent a large range of possible pressure variation, but also involve some very unwieldy numbers.To simplify the numbers, while relating them to a meaningful scale, rms sound pressures are quoted in terms of d e c i b e l s . (A meaningful scale is one that bears some relation to the apparent "loudness" of the noise.) Decibels are logarithmic values, and they are based on a reference starting point. The starting point, 0 decibels, is the rms sound pressure corresponding to the weakest audible sound mentioned above (0.0000000002 atmosphere). This is the weakest sound that can be heard by a large proportion of people (when tested under ideal listening conditions). All subsequent sound pressures (unless otherwise noted as such) are rms sound pressures and are referred to that standard reference pressure .The decibel (abbreviation: "dB"), is the unit for expressingsound pressure level relative to 2 x 10” 10 atmosphere. In the metric system, this reference pressure is 2 x 10⁻⁵ Newton/m2.The unit "pascal" is defined as 1 N/m2 , so the sound pressure level reference is currently expressed as 2 * 10~5 pascal or 20 micropascal. Thus, to be technically correct, one should say, "The sound pressure level is 75 decibels relative to 20 micro- pascal." Since this is a universally recognized pressure base, it is often not quoted, however, and one usually says, "The sound pressure level is 75 dB."
8

The word l e v e l is used to designate that the rms pressure is relative to the universal base sound pressure. The sound pressure level (SPL) for any measured sound is defined by:
r. , .. , n i n n (rms sound pressure measured)2SPL (in decibels) =» 10 log ------------L---------------------(20 micropascal)2
oron -i _ (rms sound pressure measured)
® (20 micropascal)In practice, a sound level meter is calibrated to read decibels relative to 20 micropascal, so a person is seldom aware of the rms pressure of the actual sound (that Is, how many millionths of an atmosphere it is, or how many Newtons per m 2, or lb per in.2, or dynes per cm2). Yet we are aware that very quiet sounds (a quiet whisper, or the rustling of grass in a very slight breeze) may range from 10 to 20 dB, while very loud sounds (a nearby diesel truck or an overhead aircraft shortly after takeoff or a loud clap of thunder) may range from 85 dB to over 130 dB. Instantaneous sound pressure levels of 160 dB can rupture the eardrum, and the risk of permanent hearing Impairment increases as a function of sound levels above 80 dB."dBA" vs "dB"Key words:Frequency Weighting Networks
A-Weighted Sound b e ve l s
Anyone involved in noise control quickly learns a basic concept: People's re sponse to sound is frequency-dependent. We hear best at frequencies around 500 to 5000 Hz, for example, and perhaps for this reason, we are most annoyed or disturbed by noise in that range. In addition, we know that high sound levels and long exposure times to sounds in this same frequency range contribute to hearing loss. These facts have ramifications on the e f f e c t s of sound, and, consequently, there is usually a need to know about the frequency distribution contained within a given sound being investigated, and also a need to place emphasis on those frequencies having the greatest effects.
9

The typical sound level meter has three different frequency- weighting networks, identified as the A-, B-, and C-scale networks. Their frequency responses are given in Figure 2.4. Extensive studies have shown that the high-frequency noise passed by the A-weighting network correlates well with annoyance effects and hearing damage effects of the noise on people. Consequently, sound pressure levels, as measured with the A-scale filter, are used in various rating systems for judging the annoyance of noise and for evaluating the hearing damage potential of high sound levels and exposures. (The term noise exposure involves both sound levels and the duration of exposure time to those sound levels; it is discussed in more detail later.) The OSHA noise regulation incorporates A-weighted sound levels for this reason. (Note that when weighting factors are applied in determining the level of a noise, the term "pressure” is dropped from the expression ’’sound pressure level.”)
100 1000 10.000 FREQUENCY-«!
Figure 2.4. Response characteristics of weighting scales and of ear at threshold.
The fourth curve in Figure 2.4 shows the approximate relative sensitivity of the average ear (as a function of frequency) when tested for hearing weakest possible sounds ("threshold"), confirming the high-frequency region of highest sensitivity.
1 0

Table 2.1 gives the octave-band frequency response of the A- weighting network, as taken from Figure 2.4. When the sound level meter is switched to the "A" position, the meter gives a singlenumber reading that adjusts the incoming noise at the microphone in accordance with this filter response and then indicates a numerical value of the total sound passed by this filter. The resulting value is called the A-weighted sound level, and it is expressed in units designated dBA . In the literature, Lp is used to denote sound pressure level in dB, and L is used to denote A-weighted sound level in dBA.
Table 2.1. Octave-band frequency characteristics of the A-weighted sound level meter filter.
Octave-bandcenter
frequency(Hz)
Filterresponse
(dB)
31.5 -39-563 -26
125 - 1 6250 - 8.5500 - 3.0
1000 02000 +1.04000 +1.08000 -1.0
OSHA REGULATIONS: WORKER NOISE EXPOSURESKey words:Noise Exposures Dai ly Noise DoseNoise E mi s s i on s Impulse SoundsNoise Dose Peak Sound P r e s s u r e L ev e lP a r t i a l Noise Dose Slow Meter Response
The Occupational Safety and Health Administration (OSHA), by authority granted under the Occupational Safety and Health Act of 1970, has established regulations for worker n o i s e e x p o s u r e s.OSHA regulations state that occupational noise exposures should not exceed 90 dBA for an 8-hr work period. For briefer time periods, higher sound levels are permitted, as shown in Table 2.2. It is quite clear that personnel must be present to hear a sound before the regulation is applicable. Thus, a machine producing 120 dBA
11

Table 2.2. Permissible noise exposures.
Duration per day in hours
Maximum allowable sound level (dBA)
8 906 92k 953 972 1001 105
1/2 110or less 115
is not in violation if no one is around the machine to hear it.Do not confuse measures of sound produced by equipment (noise emissions) with measures of sound received by a worker (noise exposures).In many plant situations, sound levels may vary during the day. Machines may operate in various modes, and the sound levels may change accordingly. Workers may move around their machines or to different parts of the plant. Production sequences and their resulting sound levels may change during the day or workshift.Thus, there is a need to account for time-varying noise in determining noise exposure. The OSHA regulation deals with exposure to changing sound levels by application of the noise "dose” concept. Exposure to any sound level at or above 90 dBA results in the worker incurring a partial (fractional or incremental) dose of noise. The more intense the noise and the greater its duration, the greater the partial dose. The sum of all the partial doses may be calculated to produce the total or daily noise dose, which should not exceed a specified value. Each fractional dose from exposure to a given sound level is equal to:
the time actually spent at the sound level the allowed time for that sound level
The allowed time can be found from Table 2.2 (which is taken from the regulation), or it may be found, from the following equation, for sound levels not listed in the table:
allowed time = 4 8 020.2'(LA-90) ( 2 . 2 )
where is the actual A-weighted sound level at the operator position.
12

The total noise dose for the day is the sum of all partial doses, as in the equation:
c, c, c cD = — + — + — + • • • + —^ > (2.3)T T T T1 2 3 n
where each C is the actual exposure time for each sound level and its corresponding Tn is the allowed exposure time from Table 2.2 or Equation 2.2 for that sound level. With the OSHA limit at 90 dBA for an 8-hr day, the total dose in Equation 2.3 should not exceed 1.00. Note that if the OSHA 8-hr noise limit were changed to some other value N (such as 85 dBA, for example), Equation 2.2 would become
j - **80allowed time = n — tt-- rrv *^0.2 (La -N)
and total noise dose would still be calculated in accordance with Equation 2.3.Under the regulation in effect at the time of publication of this Manual, where 90 dBA is the basic limit, sound levels under 90 dBA are not applicable in computing partial doses. In other words, any length of exposure time at 89 dBA is permitted and is not counted as contributing to the total daily dose.As an example for determining whether a noise exposure is in compliance with the OSHA noise regulation, suppose an operator is exposed to the following daily sound levels:
105 dBA for 15 min 92 dBA for 1.5 hr95 dBA for 2 hr 85 dBA for 4.25 hr
In accordance with the 90-dBA/8-hr limit in effect at the time of publication^of this Manual,
n _ 0-25 , 2 , 1 . 5 . 4.25 D — T “ W ~TT
= 0.25 + 0.5 + 0.25 + 0= 1.0 (at or below 1.00, so it is acceptable).
To determine if the regulation is satisfied, then, a person's mixed exposure to a variety of sound levels must be considered as follows: (1) Sort the exposure into actual time spent at thevarious sound levels, (2) calculate the incremental doses for each sound level, (3 ) sum the incremental doses, and (4) compare thetotal with the allowable total daily noise dose, which is equalto 1.00.
1 3

Clearly, much analysis is required for complex noise exposures, especially for noise exposures that may vary on a day-to-day basis as well as on an hour-to-hour or rainute-to-minute basis. The OSHA regulation is not restrictive as to the method that can be employed to make the noise exposure determination, and some equipment is available that enables the evaluation to be made automatically or semiautomatically. Several exposure evaluation methods are discussed later.The present regulation contains a few additional stipulations:
No exposure may exceed 115 dBA. A violation occurs if any exposure is greater than 115 dBA, regardless of how brief it is.No sound impulses may exceed 140-dB peak sound pressure level. Impulses, ill-defined in the regulation, are considered sounds with peaks occurring at intervals of 1 sec or more. Special equipment is needed to evaluate the peak sound pressure levels, which are unweighted measures of the maximum instantaneous pressure variation, as contrasted with measures of the rms value of the pressure variation.Sound levels are to be determined using a "slow r e s p o n s e" setting on the meter. This reference is to the averaging time of the meter circuitry of the instrument. The smaller the averaging time, the more closely the meter will trace actual pressure fluctuations. Slow response incorporates an averaging time of about 1 sec, and thus peak fluctuations in pressure within a given second become moderated and yield a lower average level.
HOW TO MEASURE SOUNDIn the usual industrial noise situation, there will be two types of measurements:
(1) Compliance measurements, which are made in accordance with some relatively precise set of instructions, usually based on laws or regulations.
(2) Di a g n o s t i c measurements, which are used in engineering control of noise to help locate specific noise sources and determine their magnitudes, and to help select the types of controls needed, their locations, and the amount of reduction sought.In this section, we discuss instrumentation, and procedures for making compliance measurements and in the following sections, we discuss diagnostic measurements.
14

Compliance measurements are made in accordance with some relatively precise set of instructions, usually based on laws and regulations. The purpose is usually to determine the extent of compliance with the limits set forth in the laws or regulations. Thus, in an OSHA noise exposure compliance survey for industrial noise, the basic data will be the slow A-weighted sound levels measured at the ear location of the workers, together with the times spent at the sound levels encountered. From these data, the daily noise dose is calculated by means specified in the regulations.Basic Instruments and Their Use Sound Level Meter—The chief instrument for noise measurements is the sound level meter (SLM), which should be a Type 1 (precision) or 2 (general purpose), made in accordance with American National Standard S I .k (1971), "Specification for Sound Level Meters." The Type 2 instrument has broader tolerances on performance than the Type 1 instrument and is acceptable under the OSHA Occupational Noise Exposure regulations. It is usually less bulky, lighter, and less expensive than the Type 1 SLM. A sound level meter typically consists of a microphone, a calibrated attenuator, a stabilized amplifier, an indicating meter, and the designated weighting networks.All SLMs are sensitive to rough handling and should be treated with care. Microphones, especially, are subject to damage if mishandled. Instruction booklets provided with the units should be read carefully to determine how the instrument should be operated and under what conditions the readings will be valid.The user should learn how to determine when battery power is too low and how to ensure that the instrument is reading the sound environment and not internal electrical noise or an overloaded condition.When the sound levels are known to change very little throughout the working day, a simple SLM reading suffices for characterizing the noise environment. However, the reading must be taken properly. The standard procedure is to locate the microphone at the ear position of concern, but with the worker at least 1 m away. This is the "free-field measurement" that is preferred in American National Standard SI.13-1971, "Methods for the Measurement of Sound Pressure Levels." For a general standing position, the preferred microphone height is 1.5 m, for a seated worker, 1.1 m.When it is necessary to make sound measurements that will withstand scrutiny in the courts, several criteria are important:
15

(1) The data should be obtained by a qualified individual (usually, a disinterested one, to avoid charges of bias).
(2) The instruments and measurement procedures used should conform fully with the applicable American National Standards.NIOSH provides a list of certified Type 2 sound level meters.*
(3) Instruments should be calibrated before and after each significant set of readings. If the calibration is out of tolerance, readings back to the previous calibration must be repeated.
(4) The calibration should be traceable to the National Bureau of Standards.Obtaining reliable data depends on periodic calibration of the instruments. The preferred calibrators deliver an acoustical signal of known frequency and sound pressure level. Some calibrators provide a variety of signals of different frequencies and levels. To ensure that the calibrators are correct, it is advisable to own two units, to make frequent intercomparisons of both units on the same sound level meter, and, annually, to have one of the calibrators recalibrated by the manufacturer or a reliable instrument laboratory, requiring that the calibration can be traceable to the National Bureau of Standards.The manufacturer's instructions for holding the SLM should be followed, as microphone positioning can influence the readings, especially close-in to a noise source. Most U.S.-made instruments are designed to read correctly when the axis of the microphone is at a particular angle to the direction the sound is traveling.Most instruments made in Europe are designed to be correct when the microphone is aimed at the source.To have minimum interference from the body of the observer, position the microphone at least 1 m away from the observer, and position the observer to the side of the microphone (relative to the source of sound).In general, do not spend time reading sound levels to tenths of decibels (even the best field meters are accurate only to ±1 dB). Considerable time can be saved, at virtually no cost to the accuracy of the work involved, by rounding off the meter reading to the nearest whole decibel.Generally, you should first explore the region of interest before obtainining the final sound level for compliance measurements. Directional effects can sometimes change the reading a few decibels
*NIOSH Technical Publication (awaiting clearance). NIOSH Certified Equipment.
16

in a short distance. One example is a noise source that is partially shielded by a machine structure, with the operator in and out of the acoustical shadow. Several readings may be needed to delineate completely the noise in the range of positions used by the worker in question.For most industrial situations, a reading on the slow and A-scale settings is specified for compliance measurements. Despite the averaging properties of the "slow" setting and despite "whole decibel" determinations, industrial noise is often so variable that reading the meter becomes a problem. A suggested sampling method is to take readings, with the SLM set to slow response, every 15 sec for a period of 3 to 5 rain, then calculate an average value.When you are making a meter reading of a rapidly fluctuating noise,obtain the average meter deflection as follows:
If the difference between average minima and average maxima is less than 6 dB, use the average of these two extremes.If the difference is greater than 6 dB, use the reading3 dB below the average maxima.Record the range of readings, if they are over 6 dB, plus your comments on probable cause. Typical causes include machine cycling and very low-frequency pulsation from air handling equipment.
Some general advice applies to using the sound level meter.Wind or air currents can cause false readings. Use a wind screen with the microphone for any measurements when you can feel a wind or air current. The wind screen should be designed for use with the particular microphone.Vibration of the meter can distort readings. Do not hold the meter^directly against a vibrating machine, and do not support a tripod-mounted SLM on a strongly vibrating floor or platform. Instead, hand-hold the meter so that vibration is not transmitted into the instrument.High room humidity or temperature can also be a problem. If condenser-type microphones are used for tests in high-humidity areas, keep a spare microphone in a dry place (a dry storage container) and alternate microphones (between the SLM and the dry storage container) whenever you hear popping sounds (if monitored by head phones) or when erratic needle deflections occur on the SLM.
17

Magnetic distortion of the meter from adjacent power equipment can also cause problems. Magnetic fields usually drop off quickly with distance from a motor or transformer. Move the SLM far enough away from the electric-magnetic equipment to be sure that the needle reading is attributable to the acoustic signal.Barriers or walls can obstruct sound and reduce sound levels or, by reflection, can increase sound levels. Avoid measurement positions where barriers or walls can alter the sound field, unless the position is clearly at the normal location of the operator.Avoid dropping the meter when it is hand-held; keep the safety cord wrapped around your wrist.
The reader is referred to Sound and Vibration*, magazine for an up-to-date listing of suppliers of sound level meters (and other kinds of acoustic measurement instrumentation). Each year, Sound and Vibration devotes an entire issue to instrumentation; an example is the issue of March 1978.Considerable nonacoustical data should be obtained to support the noise exposure information. Such data include plant location and product; pertinent personnel and their positions in the organization; persons present during measurements; time span of measurements; room layout and dimensions; sketches of machines; descriptions of machines and operational data (speed, quantity, and size of produced products); the average daily time that machines are in operation or producing noise; worker and measurement locations; and photographs.Other Means to Determine Noise ExposuresSound level meters may become difficult to use in situations where the noise environment or worker position is constantly changing or when a long time frame is required to gauge a particular exposure adequately. Other instruments and procedures are available for such situations, although they should be used with discretion.Dosimeter—Besides sound level meters, the most widely used instrument for determining a noise exposure is the dosimeter. Dosimeters are considerably simpler to use than SLMs because they automatically compute noise exposures. All dosimeters are portable battery- powered devices, worn by workers being monitored. When they are
*Published by Acoustical Publications, Inc., 27101 E. Oviatt Rd., Bay Village, OH 44140 (216) 835-0101, available free of charge to personnel concerned with noise and vibration control.
18

activated, they read and store the integrated value of all the partial noise dose exposures. At the end of a time period, the devices are deactivated, and the readouts are used as a basis for determining compliance.Although dosimeters appear attractive because of their inherent simplicity, they have some drawbacks. At the time of publication of this Manualy there is no completed national standard covering the performance of dosimeters. Recent studies suggest the dosimeter buyer can expect performance more or less in proportion to the price of the individual units. NIOSH has published a document concerning the performance of several dosimeters and how they were tested.*Be aware that there may be substantial differences (enough to affect determination of whether a situation is in compliance) in results obtained from using the "best" dosimeter and from using other, more traditional, exposure evaluation techniques. Be aware, too, that by deliberately favoring high or low sound level positions, or by physically tampering with the unit (moving the microphone to inside a pocket, blowing on the microphone, rubbing or tapping the microphone, etc.), a dosimeter wearer can influence the indicated dose upward or downward. Periodic observation of the employee wearing the dosimeter may be needed to attest to the normalcy of the situation being measured.A different procedure to determine noise exposure makes use of statistical analysis through an instrument called a "sound integrating meter." Special integrating sound level meters are now available to take a microphone signal or tape-recorded signal of an operators noise exposure and compute statistical measures of the noise, including the noise dose, automatically or semi- automatically.Once again, the reader is referred to Sound and Vibration for a listing of suppliers of dosimeters and other instruments and for more detail on their operation.How Sure Can I Be of My Evaluation?If measurement instructions described in the noise regulation and in the literature of manufacturers of noise measuring instruments are followed closely, results should show, with little room for ambiguity, whether a particular situation is in compliance. However, there are limitations on accuracy that may make assessment of the marginal situation particularly difficult. The limitations include:
Precision of instruments: The best field instruments are designed to read the "true value" to within about 1 dB.Thus, even two of the same model of two properly calibrated Type 1 instruments may yield slightly different readings. Obviously, less precise Type 2 instruments may provide even greater differences.
*NIOSH Technical Publication No. 78-186. A Report on the Performance of Personal Noise Dosimeters.
19

Instrument performance differences: Two different instruments, both meeting laboratory standards for their response, may read field-encountered sounds differently. Thus, depending on microphone directivity and frequency response characteristics and the type of noise signals being analyzed, differences will result. Differences of 1 dB or more are common, and differences of up to about 3 dB are possible, especially for locations having rapidly changing noise conditions or impact-type sounds.Representativeness of the exposure: Perhaps this is the most significant factor affecting variation in readings. Daily noise exposure patterns can vary significantly from day to day. This variation would be especially true in job-shop-type operations. There is no simple way to handle this complexity, as the existing OSHA noise regulation makes no provision for variations in daily noise exposure patterns. To meet this problem, you may have to take several repeat observations to determine a realistic range of exposure values.Sound levels near 90 dBA: The daily noise dose may be very sensitive to exposures close to 90 dBA. Under current regulations, any sound level below 90 dBA is considered not to contribute to the daily noise dose. What happens if the sound level is constant at exactly 90 dBA? One Type 1 instrument may read that sound level as 89 dBA and another as 91 dBA. As a result, the daily noise dose would approach zero when the lower reading instrument was used and 1.1 when the higher reading instrument was used. A 2- or 3-cLB error in instrument precision, even when reading an acceptable 90-dBA noise exposure, could produce a noise dose value ofabout 1.3 to 1.5. Thus, measurement accuracy and precisionare important items in interpreting noise exposures, especially for marginal situations.
Obviously, there are many reasons to be careful in assessing a noise exposure, and these reasons become more critical the closer the situation is to the "just acceptable" or "just unacceptable" noise value.HOW SEVERE IS THE PROBLEM?Once a noise problem is identified, its seriousness must be established. In other words, how severe is it? How much noise reduction is needed? Setting an overall noise control goal is usefulto establish a framework on which to base all subsequent analysis.Once the objective is established, noise reduction goals can be considered for the individual noise sources that cause the problem. Setting the primary goal also puts the noise problem in perspective, and helps you to choose wisely in selecting noise controls.
20

Overall Noise Reduction RequirementsIn the simplest case, the required noise reduction is found directly by subtracting the desired sound level goal from the existing sound level. The goal may be established by regulation, corporate policy, or ambient conditions.For example, a noisy operation may be measured at 87 dBA at the property line of a plant. Local noise regulations may limit the plant noise to no greater than the average sound level in the neighboring community. Suitable measurements (perhaps made at a location in every other way similar to the property line position, but far enough from the plant to mitigate the plant's influence on the measurement), indicate the "not-to-exceed" sound level is 71 dBA. In this case, the overall goal would be a noise reduction of 87 dBA minus 71 dBA, or 16 dB.In an in-plant industrial situation, an individual's noise exposure may be to an essentially continuous sound, as would be the case for a filling machine operator in a bottling plant or a loom operator in a textile plant. Typical sound levels in such environments may be on the order of 100 dBA. In such cases, the noise reduction goal might be 10 dB in order to meet OSHA regulations.For more complex situations, where the sound level is variable, but always above 90 dBA, a single-number noise reduction objective can still be established by converting the worker's daily noise dose into an "equivalent sound level," or, in other words, by determining what continuous sound level would yield the same daily noise dose as the variable sound. To do so, use the following equation, a combination ox* Equations 2.2 and 2.3:
equivalent L. = — D— + 90 . (2.4)0.2 log 2
For example, if the worker's daily noise dose, D, is 2.0, the equivalent L^ f 95 dBA.The difference between 90 dBA and the equivalent sound level represents the noise reduction required to bring the situation into compliance in such cases. Therefore, it can be used to establish an overall noise reduction goal.A variable noise exposure may also reflect the employee's work pattern, which may place him in several different noise environments during the course of a day. He may work for 2 hr in a quiet 72-dBA environment (!)> 4 hr in a 95-dBA environment (2) ̂and 2 hr in a 100-dBA environment (3) . In this case, he would incur partial noise doses according to
21

penvironment (1); — = 0.0
IIenvironment \2)\ = 1.0
2environment (3)\ = 1.0 .
This worker's total noise exposure is 2.0, which exceeds the allowable value of unity. In such situations, you can consider several choices for a noise reduction objective. In the illustrated case, there are three ways to bring the noise exposure into compliance: quieting either environment (2) or environment (3) to below 90 dBA, to eliminate either of the partial doses incurred in those areas, or quieting both environments (2) and (3) by amounts suitable to bring the total of the partial noise doses incurred down to 1.0 or less.The goals in this case could become:
a noise reduction of 6 dB in environment ( 2 ) , ora noise reduction of 11 dB in environment (3) , or
• a noise reduction of about 4 dB in environment ( 2 ) , plusa noise reduction of about 8 dB in environment (3).
In such cases, where there is a variety of goals, you should consider each before choosing a course of action. You will probably decide to analyze the problem further to determine the cause of the various partial noise doses and to determine the possibilities of being able to control the noise from the identified sources.Frequency-by-Frequency Noise Reduction RequirementsIs it useful to apply a frequency analysis to the measurement of existing noise conditions? Yes. The added detail provided by frequency analysis will help both in qualifying the severity of the problem and in diagnosing where the noise comes from. The usefulness of frequency analysis in evaluating the severity of a noise problem is evident when we can pinpoint the frequencies of a noise for which sound pressure levels are excessive. To do so, we must first express the overall noise objective (e.g.,90 dBA) on a frequency basis.In effect, there are a large number of frequency spectra that will produce a particular sound level. ("Frequency spectra" refers to distribution of a complex sound, whether expressed in octave-band sound pressure levels or in some other, narrower, bandwidth evaluation of the total noise.) Figure 2.5 shows a particular spectrum
2 2

OCTAVE BAND CENTER FREQUENCY (Hz)
Figure 2.5. Recommended frequency spectrum for OSHA noise problems.often used for OSHA noise problems. This spectrum has been developed from prior studies of the relation between amplitude and frequency characteristics of industrial noise and exposure time to the hearing damage risk of workers. This spectrum could serve as a target goal for reaching a 90-dBA sound level.How is this spectrum applied? This is the procedure: Measure the frequency distribution (in octave bands) of the sounds at an operator location and plot the octave-band values on a graph already containing the preselected 90-dBA spectrum. Figure 2.6 shows such a plot of a problem noise with a sound level of 94 dBA. Note that the 90-dBA target goal is exceeded only in the 2000-, 4000-, and 8000-Hz octave bands. If you were to reduce the sound pressure levels in those three octave bands by the respective algebraic difference between the levels in the problem noise and in the 90-dBA spectrum, you would be assured of reducing the problem noise to 90 dBA or below.Note the advantage to this approach. You have isolated the noise problem to a part of the overall noise — the higher frequency noise. There is no need to consider the low-frequency noise and, thus, you can concentrate further efforts (if needed) on dealing with the high-frequency noise.
23

OCTAVE BAND CENTER FREQUENCY (Hz)
Figure 2.6. Determination of required noise reduction.But why bother to concentrate on an isolated frequency band? You could have reduced the 94-dBA sound to 90 dBA by reducing each octave band by only 4 dB, as opposed to greater dB reductions indicated by the target goal approach. Would it not be easier to try for a 4-dB across-the-board reduction? The answer is generally no. Almost invariably, it is easier and cheaper to obtain noise reduction in the higher octave bands.Note further that you would not benefit by finding and treating solely those noise sources responsible for the low-frequency components of the problem noises. The sound level is, in fact, dominated by contributions from the higher octave bands and would remain high, no matter what is done to the low-frequency sounds. The 90-dBA spectrum illustrated in Figures 2.5 and 2.6 automatically pinpoints those problem frequencies that contribute most to the sound level; they are, therefore, those that most merit noise control.NOISE SOURCE DIAGNOSISUp to this point, the discussion on noise problem analysis has concentrated on defining overall goals. Now we start to consider more specific objectives, such as how much noise reduction
24

is appropriate for a particular machine, machine component, or process. This aspect of noise problem analysis is closely relatedto identifying where the noise is coming from: the topic of noiseproblem diagnosis. To perform even a simple noise problemdiagnosis, you must be able to add decibels.Decibel AdditionThe calculation involved in decibel addition is fundamental to noise control engineering. Suppose we know the sound levels of two separate sources, and we want to know their total when the two sources are operating simultaneously. We make the basic assumption that the noises are random and that they bear no relationship to each other (that is, they do not have the same strong pure tones). The formula for calculating the combined level, L , of two individual decibel levels L x and L 2, is c
Lc = h 1 + 10 log [10(L2-L i)/10 + 1]. (2.5)
As a practical example, you might have already measured or obtained (at a specified distance or location) the sound levels of two individual sound sources, each operating alone, and you now want to know the sound level (at the same distance) of the two together. For random sounds, the total measured on an SLM would agree (within measurement accuracies of about 1 dB) with the calculated total, using Equation 2.5. Figure 2.7 or Table 2.3 simplifies decibel addition without the formula.An alternative form of decibel addition, which relies on a few simple rules which can be learned (results accurate to ±1 dB) is:
(1) When two decibel levels are equal or within 1 dB of eachother, their sum is 3 dB higher than the higher individual level. For example, 89 dBA + 89 dBA = 92 dBA, 72 dB + 73 dB = 76 dB.
(2) When two decibel levels are 2 or 3 dB apart, their sum is 2 dB higher»than the higher individual level. For example,87 dBA + 89 dBA = 91 dBA, 76 dBA + 79 dBA = 8l dBA.
(3) When two decibel levels are 4 to 9 dB apart, their sumis 1 dB higher than the higher individual level. For example,82 dBA .+ 86 dBA = 87 dBA, 32 dB + 40 dB = 4l dB.
(4) When two decibel levels are 10 or more dB apart, their sum is the same as the higher individual level. For example,82 dB + 92 dB = 92 dB.
25

zUJUJh 7UJm j jt u >O Ü JZ - JUJq;QT LULÜ o
O - I J Û< 5u <2H<
NUMERICAL DIFFERENCE BETWEEN TOTAL AND SMALLER LEVELS
Figure 2.7. Chart for combining decibel levels*.
Table 2.3. Table for obtaining decibel sum of two decibel levels.
DIFFERENCE BETWEEN TWO DECIBEL LEVELS TO BE ADDED (dB)
AMOUNT TO BE ADDED TO LARGER LEVELTO OBTAIN DECIBEL SUM (dB)
0 3 .01 2 .62 2. 13 1.84 1.45 1.26 1.07 0 .88 0 .69 a s
10 0.4I I 0l312 0.2
*From Handbook of Noise Measurement. 7th e d . , A.P.G. Peterson andE.E. Gross, Jr. GenRad, Inc., Concord, MA 01742. This chart is based on one developed by R. Musa. Reprinted by permission of the publisher.

is appropriate for a particular machine, machine component, or process. This aspect of noise problem analysis is closely relatedto identifying where the noise is coming from: the topic of noiseproblem diagnosis. To perform even a simple noise problemdiagnosis, you must be able to add decibels.Decibel AdditionThe calculation involved in decibel addition is fundamental to noise control engineering. Suppose we know the sound levels of two separate sources, and we want to know their total when the two sources are operating simultaneously. We make the basic assumption that the noises are random and that they bear no relationship to each other (that is, they do not have the same strong pure tones). The formula for calculating the combined level, Lc , of two individual decibel levels L x and L 2, is
Lc = Lj + 10 log [1 0 (L2_Li )/10 + 1], (2.5)
As a practical example, you might have already measured or obtained (at a specified distance or location) the sound levels of two individual sound sources, each operating alone, and you now want to know the sound level (at the same distance) of the two together. For random sounds, the total measured on an SLM would agree (within measurement accuracies of about 1 dB) with the calculated total, using Equation 2.5. Figure 2.7 or Table 2.3 simplifies decibel addition without the formula.An alternative form of decibel addition, which relies on a few simple rules which can be learned (results accurate to ±1 dB) is:
(1) When two decibel levels are equal or within 1 dB of eachother, their sum is 3 dB higher than the higher individual level. For example, 89 dBA + 89 dBA = 9 2 dBA, 72 dB + 73 dB = 76 dB.
(2) When two decibel levels are 2 or 3 dB apart, their sumis 2 dB higher»than the higher individual level. For example,87 dBA + 89 dBA = 91 dBA, 76 dBA + 79 dBA = 8l dBA.
(3) When two decibel levels are 4 to 9 dB apart, their sumis 1 dB higher than the higher individual level. For example,82 dBA .+ 86 dBA = 87 dBA, 32 dB + 40 dB = 4l dB.
(4) When two decibel levels are 10 or more dB apart, their sum is the same as the higher individual level. For example,82 dB + 92 dB = 92 dB.
25

NUMERICAL DIFFERENCE BETWEEN TOTAL AND SMALLER LEVELS
Figure 2.7. Chart for combining decibel levels*.
Table 2.3. Table for obtaining decibel sum of two decibel levels.
DIFFERENCE BETWEEN TWO DECIBEL LEVELS TO BE ADDED (dB)
AMOUNT TO BE ADDED TO LARGER LEVEL TO OBTAIN DECIBEL SUM (dB)
0 3 .01 2 .62 2. 13 1.84 1.45 1.26 1.07 0 .88 0 .69 0 i5
10 0 .411 a 312 0.2
*From Handbook of Noise Measurement. 7th ed., A.P.G. Peterson and E.E. Gross, Jr. GenRad, Inc., Concord, MA 01742. This chart is based on one developed by R. Musa. Reprinted by permission of the publisher.

When adding several decibel levels, begin with the two lower levels to find their combined level, and add their sum to the next highest level. Continue until all levels are incorporated.Table 2.4 gives an example of how several levels can be added to find their decibel total.
Table 2.4. Example of decibel addition
Original decibel levels Rearranged
84 + 85 * 88
88 + 87 » 9191 + 90 = 9492 + 93 « 96
94 + 96 = 98
92
91.
90 8490
9392
8793
98
Signals that are not random do not follow any of the addition procedures described above. If two identical sources emit strong pure-tone signals at exactly the same frequency, they would be termed coherent sources, not random sources. Their total could add up to as much as 6 dB above either single signal, if both sources are exactly equal in level and exactly in phase with each other at the measurement position. If the signals are not exactly in phase, they could interfere destructively with each other, and the measured tones could appear to vanish at the specific measurement position. The occurrence of truly coherent sources is so unlikely in practical plant problems that decibel addition of pure tones exactly in phase at one specified location is almost never considered and can be ignored.Identifying Noisy Equipment: Simple CasesAt this point, you are ready to perform some simple evaluations to determine where a noise problem really lies, as a preliminary step in performing noise control. A truly simple, but most illuminating, technique is to turn individual pieces of equipment on and off and to measure and observe the resulting sound levels at the position of interest. Such measurements and observations may reveal the one or two machines that are exceptionally noisy. As an example of how this technique works, assume these measurements are made at an operator position:
27

With all equipment running 92 dBAWith only machine A turned off 92 dBAWith only machine B turned off 89 dBAWith only machine C turned off 88 dBA.
These data reveal that machine A is insignificant relative to the total sound level measured (machine A must contribute less than about 83 dBA, otherwise the 92-dBA level would have changed when it was turned off). Machines B and C dominate the noise exposure; the 92-dBA sound level is fully accounted for by the sum of their contributions (88 dBA + 89 dBA = 92 dBA).When you evaluate noise conditions in this fashion, it is preferable to take octave-band sound pressure level data as well as sound level data. The extra detailed information may be of immediate benefit. Following the above example, you may find the spectra of the 88-dBA and 89-dBA noise to be, respectively, primarily low-frequency and high-frequency in nature. Knowing that high-frequency noise is easier to reduce, you can begin to search for a treatment which will reduce the 89 dBA from machine C by enough so that the contributions from that machine andmachine A would total no more than 86 dBA. (Then, 86 dBA +88 dBA would equal 90 dBA.) You may even estimate a spectrum for the 86-dBA noise which, when combined with the 88-dBA noise spectrum, will produce a 90-dBA total. This can then be used to determine exactly how much noise reduction is required on an octave-band basis. Noise control details can then be considered and designed to enable the reduction to be met.Other simple measurements may be used to pinpoint important noise contributors of a complex machine. In some cases, a machine may be studied in detail during periods of scheduled downtime. The machine could be operated in various modes, possibly revealing noisy aspects of its operation. You might find, for example, that the noise problem disappears when the pneumatic system is deactivated or that the noise problem is alleviated when a particular component is removed.The noise control problem is compounded when it is found that several sound sources (either separate pieces of equipment or different components of one piece of equipment) contribute about equally to the total sound level (e.g., three machines, each contributing 96 dBA to a 101-dBA noise environment). When such a situation is encountered, several design alternatives may occur. For the example of the three 96-dBA machines just cited, assume that you want to reduce the 101-dBA level to 90 dBA, an 11-dBA reduction. First, this reduction could be achieved by reducing the noise emission of each machine by 11 dB. Hence, by decibel addition,
28

85 dBA + 85 dBA + 85 dBA = 90 dBA.Or, two machines could be reduced by 13 dB, and one machine could be reduced only 8 dB. Thus,
83 dBA + 83 dBA + 88 dBA = 90 dBA.Or, one machine could be reduced by 19 dB, one by 12 dB, and one by 7 dB. Thus,
77 dBA + 84 dBA + 89 dBA = 90 dBA.In each case, the result would be 90 dBA for the sum of the three treated machines. Clearly, the amount of noise reduction needed for each machine is not a fixed quantity, and the noise control engineer has some latitude in choosing which equipment to treat and to what degree.General ProcedureIn the previous section, we discussed identification of the source of a problem noise in situations where it is possible to turn production equipment on and off. Often, the noise control engineer is faced with the task of making the necessary identification without the luxury of equipment being operated to his convenience. How does he do it?The noise control engineer will turn to his knowledge of sound fields and sound behavior. (These topics are discussed in detail later.) Essentially, the noise control engineer will couple (1) his knowledge about how sound propagates from one location to another with (2) data obtained at or near a suspected noise contributor to verify whether his suspicions are correct. The sound level around a noise source, if that source is significant, is almost invariably higher near it, or, to put it another way, noise makers are louder close by. You can usually learn something about the strength of the noise source — how much sound it radiates — by measuring the sound field near the source.Source Strength: Sound Power LevelThe amount of sound radiated by a source is determined by its sound power, somewhat analogous to the power rating of electric light bulbs — 40 W, 75 W, 100 W, etc. In fact, sound power is also expressed in units involving watts. To relate sound power to familiar subjects, a mosquito emits a sound power of about 10-11 W, and a clap of thunder radiates a peak instantaneous sound power somewhere over a million watts. The average sound power of human speech at normal voice level is about lQ~h W, a symphony
29

orchestra playing loud passages radiates about 10 W of sound power, and a 4-engine jet airliner during takeoff has a sound power of about 10** W.With such a large range of power for the many commonplace sound sources, it is convenient to use decibels here, too, to compress the range into manageable numbers. The reference sound power base is 10“ 12 W, and the sound power level (Lw , in dB) of a source relative to this base is
The mosquito then has a sound power level of about 10 dB (re 10“ 12 W), and the jet aircraft has a takeoff sound power level of about 160 dB (re 10"12 W ) .Since decibels are used both with sound pressure level and sound power level, it is always necessary to indicate clearly which unit is being used. Because, as mentioned earlier, it is awkward and inconvenient to refer sound pressure levels repeatedly to the sound pressure reference base of 20 micropascals, it is usual to reference the power level base 10” 12 W to assure that sound power levels are being used. Hence, the term "(re 10-12 W)" is used in the expressions above for the sound power levels of the mosquito and the jet.There is another practical reason to reference the quantity 10“ 12 W. Before the United States joined the International Standards Organization in the use of common terminology in acoustics, the sound power level base used in this country was 10 13 W. Before 1963 to 1965» acoustics literature in the United States regularly referred to the 10“ 13 W base for sound power level data. If data from those earlier periods are used in current studies, determine positively the power base of the data. Subtract 10 dB from sound power levels relative to the 10“ 13 W base to convert them to values relative to the 10"12 W base.How can sound power data be used in source diagnosis? The sound power level radiated by an "ideal point source" (a source radiating sound uniformly in all directions) is related to the sound pressure level at a distance r by the following equations:
Lw = 10 log (Power radiated, watts
n n “ 1 2 TJ10 W
L = L + 1 0 log 4irr2, w p & >where r is expressed in meters, or
(2 .6 )
L = L + 1 0 log 4îrr2-10, w p ( 2 . 7 )
30
where r is expressed in feet. For these two equations, the source is assumed to radiate its sound with no nearby reflecting surfaces. This would be known as spherical radiation in a free field, a relationship fundamental to source diagnosis. To preview its use, note that if we measure L at a location close-in to the noise source, we can calculate L for that source and then determine L due to that source at a more distant location, such as at a nearBy residence. In practice, many sound sources do not radiate sound uniformly in all directions, and reflecting surfaces can be nearby.For an ideal point source located on or close to a large-area floor or at or near the ground in a large open area, the sound radiates hemispherically, and the above equations become: for rin meters,
Lw = Lp + 10 log 2-nr2 > (2.8)
and, for r in feet,Lw = Lp + 10 log 27rr2-10. (2.9)
In the more general case, the source Is not a point source; instead, it has finite values of length, width, and height. In this case, sound power and sound pressure levels are interrelated by the equations:
L = L + 1 0 log S (2.10)w pfor S expressed in square meters, or
= Lp + 10 log S - 10 (2.11)
for S expressed in square feet. In these last two equations, Sis the area of an imaginary shell all around the source, and Lpis the sound pressure level that exists at any point on thatimaginary shell.In a further extension of Equations 2.10 and 2.11, suppose that the source does not radiate its sound uniformly through allportions of the shell. Perhaps one part of a large, complexsound source radiates higher sound pressure levels (SPLs) than some other part of the source. For such situations, Equations2.10 and 2.11 must be broken down into several parts, where L is the SPL at one element of area Sj on the shell, L_ is a different SPL at another element of area S2 , and so on over the entire range of L values over the entire area. Then,
31

nL = I
W i = lL + 10 log (for S in m 2) ( 2 . 1 2 )
or
n rl = y l +w p.1 = 1 [ p i10 log S±-10 (for S in ft2) . (2.13)
As an example, Figure 2.8 shows an imaginary shell around a sound source of interest, at a 1-m distance. The source dimensions are 2 m x 3 m x 5 m , as shown in the sketch. The north and south surfaces of the imaginary shell each have an area of 21 m 2 , the
Figure 2.8. Assumed sound source (solid lines) on a factory floor, surrounded by an imaginary shell (dashed lines) at 1-m distance.
east and west ends have an area of 15 m each, and the top of the shell has an area of 35 m 2 . For this simple example, suppose the SPL all over the north surface of the shell is uniform at 98 dB; for the south surface, it is 93 dB; for the east end, it is 88 dB; for the west end, it is 90 dB; and for the top surface, it is 95 dB. The total sound power radiated from this source would be as follows, using Equation 2.3,2:
= (98 + 10 log 21) dB (N)+ (93 + 10 log 21) dB (S)+ (88 + 10 log 15) dB (E)+ (90 + 10 log 15) dB (W)+ (95 + 10 log 35) dB (Top)
32

L = 111.2 + 106.2 + 99.8 + 101.8 + 110.4 w= 114.9 dB or 115 dB re 10” 12 V/.
Calculations can be carried out to 0.1-dB values, but the final value should be rounded off to the nearest whole number.Two practical considerations limit the validity of this example. First, in practice it is unlikely that a uniform sound level would exist over an entire large area of the imaginary shell, so it might be necessary to take several SPL values over each large area of interest and to assign a subdivided area value to each SPL value. Second, when SPL measurements are made close to a relatively large-size source, the sound is not radiating as though it were from a point source in a free field. Instead, the SPL value is taken in the near field of the sound source, where the sound field is distorted and is not necessarily representative of the true total sound power that would be radiated to a large distance out in the free field. As a result, errors of a few decibels may be encountered at these close-in distances from large sources, and it is essentially impossible to predict the amount of error to be expected. Thus, be prepared to have an unknown error (possibly up to 5 to 8 dB for large sources, but fairly negligible for quite small sources).In spite of these drawbacks, the concept of sound power level is very helpful in identifying and diagnosing sound sources. To illustrate this assistance, suppose the microphone of a sound level meter can be brought up to within 5 cm of a small sound source in a large machine, and the sound pressure level is found to be 105 dB in the 1000-Hz octave band. Over another, much larger, area of the machine, the close-in sound level is 95 dB in the 1000-Hz octave band. Estimate the sound power levels of these two sources to determine the controlling source at this frequency. Suppose the 105-dB value is found to exist over an area of about 100 cm * 10 cm, or 1000 cm2 (=0.1 m 2), whereas the95-dB value is found to exist over a surface area of about 2.5 x4 m, or 10 m 2. From Equation 2.10, the approximate sound power level of the small-size source is
Lw = 105 + 10 log 0.1= 95 dB re 10~12 W,
while the approximate sound power level of the large-area source is
These components are to be added by decibel addition. Thus,
33

Lw = 95 + 10 log 10= 105 dB re 10-12 W.
Even if the power level values are in error by a few decibels, this comparison indicates that the large-area source radiates more total sound power than the small-size source, even though the small source has a higher localized sound pressure level.For noise control on that machine, the noise from the large area source must be reduced by about 10 dB before it is necessary to give serious consideration to the small source.For another illustration of how sound power level data are used in source diagnosis, look at Figure 2.9. It shows the noise spectrum found at the property line of a plant and a sound spectrum indicative of a target goal for the situation. Note that the sound pressure levels are excessive in the 125-Hz to 8000-Hz octave bands.
OCTAVE BAND CENTER FREQUENCY ( H z )
Figure 2.9* Hypothetical problem situation.Close-in data, obtained 1 m from each of the three possible sources (Figure 2.10) of the property line noise, were then examined to determine which noise sources should be treated. From Equation 2.10, the power level of each source is obtained, and from Equation 2.8, the expected contribution of each source to the property line measurement is estimated (in this example,
3 4

PROPERTYLINE
Figure 2.10. Location of noise sources (1-3) relative to property level position (4) for use in example on these pages.
each noise source is assumed to radiate hemispherically). Figure2.11 illustrates the results of the computations shown in Table 2.5. The calculations indicate the vent noise is responsible for the 31*5-Hz and 63-Hz octave-band sound pressure levels, the compressor noise is responsible for the 125-Hz to 500-Hz octave- band sound pressure levels and partly responsible for the 1000-Hz and 2000-Hz octave-band sound pressure levels, and that sound coming through the window contributed to or is responsible for sound pressure levels in the 1000-Hz to 8000-Hz bands.Because the 31-5-Hz and 63-Hz octave-band levels are not consequential to the problem, the vent need not be treated. However, both the window and compressor do require treatment, and the
35

OCTA
VE
BAÑO
SO
UND
PRES
SURE
LE
VEL(
dB
re 20
fi Pa)
OCTAVE BANO CENTER FREQUENCY (H z)
Figure 2.11. Results of power level extrapolations for problem shown in Figure 2.9.
36

Table 2.5- Calculations for example problem discussed on previous pages.
Octave Band Center Frequency in Hz DESCRIPTION 31-5 63 125 250 500 1000 2000 ¿1000 8000
Source 1 (window on side of building) 2 m x 4 m; shell surrounding window at 1 m distance has area o f 4 m * 6 m = 2 4 m 2
L of window w = L + 1 0 P log 11-=r(M
P 13.8, say L + 14 Pat 1 m 82 65 66 68 64 61 65 69 71plus 14 14 14 14 14 14 14 14 14
of window 76 79 80 82 78 75 79 83 85Window noise at property line (from Eq. 2.8) L =L -10 log2iir2 ; r=20m
L = L -10 log 2tt20 2 = L -34.0 Pp w wminus 34 34 34 34 34 3^ 34 34 34
Window noise 42 45 46 48 44 41 45 49 51Source 2 (small vent on roof) surface area of sphere centered at vent
radius of 1 m = 4nr2 = 12.56 m 2L of vent w , Lp + 10 log 12.56 = Lp + 10.99, say LP + 11
L at 1 m 84 81 76 74 76 69 62 56 54p plus 11 11 11 11 11 11 11 11 11
L vent w 95 92 87 85 87 80 73 67 65Vent noise at
L = L , - 10 p wproperty line (from Eqlog 2tt222 = L -34.8* w
. 2.8) Lp=Lw-10 say Lw = 35
lo,~27rr2 ; r=22m
minus 35 35 35 35 35 35 35 35 35Vent noise 60 57 52 50 52 45 38 32 30Source 3 (compressor) 2 x 3 n; shell surrounding compressor with
1 m distance = 3 m x 5 r o = 1 5 m z; L compressor = L +10 log 15 =L + 11.8 dB, say L + 12 dB w pP P
L at 1 m 71 77 87 91 84 76 73 66 59P plus 12 12 12 12 12 12 12 12 12
L compressor 83 89 99 103 96 88 85 78 71WCompressor noise at property line (from Eq. 2.8) L =L -10 log27rr2
(r=30 m) Lp=Lw-10 Iog2ir30^ = L^-37.5, say Lw=38 P Wminus 38 38 38 38 38 38 38 38 38
Compressor noise 45 51 61 65 58 50 47 40 33
37

amount of treatment required is indicated by the difference between the estimated levels from the window or compressor and the target goal (in those octaves dominated by the individual source).These examples illustrate the importance of obtaining close-in SPL values near each operating mechanism or component of a source and of estimating the area of that component or the area through which its SPL is radiating. Sound control work should be directed to those components that yield large values of sound power level. It is also necessary to investigate the frequency variation of the component sources as measurements are being carried out. Some components may shift from small-valued sound sources in some frequency regions to high-valued sources in other frequency regions.Influence of Room AcousticsIn the previous section, the sound source was presumed to be located in a large open area, so that nearby reflecting surfaces (other than the floor or ground) would not alter the free-field radiation of the sound. In most indoor plant situations, the confining walls and ceiling of the work space keep much of the sound from escaping to the outdoors. Instead, each ray of sound from the source strikes a solid surface and Is reflected to some other direction inside the room. That same ray may travel 300 m and be reflected a dozen times before its energy is sufficiently dissipated for it to be ignored. In the meantime, other rays of sound are also radiated and reflected all around the room until they are dissipated. In a small room, the sound pressure levels caused by the confinement of sound can be built up to values as much as 15 to 30 dB above the values that would exist at comparable distances outdoors. This build-up of sound can influence the sound level at the operator position of a machine.In fact, a machine that might have an 85-dBA sound level at a2-m distance when tested outdoors in a large, open parking lot could produce a sound level of 95 to 100 dBA at the same distance when it is moved indoors into a small, highly reverberant room.Note that the sound power level of the source didn’t change, but that the acoustic environment made a major difference in the sound levels. To analyze this type of situation, it is necessary to know the influence of the room conditions on the sound field around the machine. This general subject, referred to as "room acoustics," can be almost as important as the sound power of the source In determining sound levels to the machine operator or to other people working in a room where machines are in operation.Room Constant or Room AbsorptionTo work quantitatively in the subject of room acoustics, you should know how to calculate and to use the term room constant, designated by R, or a similar term, room absorption, designated by A. In this Manual> room constant R is used.
38

R = S a +S a +S a +. . .+A +A +... (2.14 )1 1 2 2 3 3 1 2
where S 1 is the area of some surface of a room that has a sound absorption coefficient S 2 is the area of another surface ofthe room having a sound absorption coefficient a 2, and so on, until all surface areas of the soom are added, including all walls, doors, windows, the floor, the ceiling, and any other surfaces that make up the room boundary. The S values may be expressed either in square feet or square meters, and the calculated R value will be in the same unit. The a values are called Sabin sound absorption coefficients and are given in various textbooks for most room finish materials and in the catalogues of manufacturers and suppliers for their sound absorption products, such as glass fiber, mineral wool tiles or panels, or sound-absorbing cellular foam products. A sound absorption coefficient of 0.6 is intended to mean that 60% of the sound energy in a wave will be absorbed (and 40% reflected) each time the sound wave strikes a surface of that material. ASTM C423-66* specifies the method of measurement of the Sabin absorption coefficients. The A la A 2, etc. values of Equation 2.14 are lumped constants of absorption, provided by suppliers for some acoustical products (such as ceiling- hung absorbent baffles) and whose units may be either square feet-Sabins or square meter-Sabins (1 ft2-Sabin = 1 ft2 of perfect absorption; 1 m 2-Sabin = 1 m 2 of perfect absorption). The resulting value of R in Equation 2.14 is in units of ft2-Sabin or m 2-Sabin, consistent with the other area units used in the equation.Table 2.5 gives sound absorption coefficients for several building materials that are not normally regarded as absorptive. Note that the coefficients are quoted for the 6 octave-band center frequencies of 125 Hz to 4000 Hz, and that the coefficients vary with frequency. Thus, the room constant R varies with frequency, and Equation 2.14 must be calculated for each frequency of interest. Sound absorption coefficients are not measured or quoted for 31-5» 63, and 8000 Hz. Relatively few noise sources cause problems at these low and high frequencies.An example of a room constant calculation illustrates the use of Equation 2.14. A room is 40 m long, 10 m wide, and 5 m high. The floor is a thick concrete slab, the two 40-m-long walls are of painted concrete block, the two 10-m-wide walls are made up of gypsum board on 2-in. * 4-in. studs, and the ceiling is the exposed underside of an overhead concrete floor slab. To simplify, ignore two doors in the room. The absorption coefficients of these materials are given in Table 2.6. The room constant calculation at 1000 Hz is:
The room constant for a room is calculated from the equation:
*0r latest version
39

Table 2.6. Coefficients of general building materials and furnishings.
Coeffic ient sMaterials 125 Hz 250 Hz 500 Hz 1000 Hz 2 3 : 0 H- 4 03 3 Hz
Brick, unglazed .03 -03 -03 . 04 -05 • 'J ■Brick, unglazed, painted .01 .01 .02 .02 -02 m j 7Carpet, heavy, on concrete .02 . 0 6 .14 .3? • £ 0Same, on 40 oz hairfelt or foan •rubber . 0 8 .24 -57 . £ ̂ - - ̂ 3
Same, with impermeable latexbacking on 40 oz hairfelt orfoan rubber . 0 8 .27 -33 . 3̂ - ̂ 5 - £ 3
Concrete Block, coarse .36 .44 . 31 • 39 - 25Concrete Block, painted .10 .05 .06 - 0 7 • - 9. , 2 cFabricsLight velour, 10 oz per sq yd,hung straight, in contact with wall .03 .04 . 11 - -L / . 2 ̂ “
Hediun velour, 14 oz per sq yd,draped to half area .07 .31 .4g • 7™
Heavy velour, 18 oz per sq yd,draped to half area .1* -35 -55 - 7 2 * • £ 5
FloorsConcrete or terrazzo .01 .01 ■ 015 0 . 0 7Linoleum, asphalt, rubber or cork
tile on concrete .02 -03 . 0 3 C ^ . 2 3 ♦ 0 2Wood ■ 15 .11 .10 • 2 £Viood parquet in asphalt on concrete .04 .04 .07 £
* 06 - 2 7GlassLarge panes of heavy plate glass . 1 8 .06 .04 ♦ ^ S - OZ . 7 2Ordinary window --lass -35 .25 .13 . I 2 ♦ 7 7 - 7-*
Gypsum Board, 1/2 in. nailed to2 * 4 ’ s in. o. c. .29 .10 r\ £ .04 .37 7* ~
Marble or Glazed Tile .01 .01 .01 .01 .02 ̂?Openings
Stare, depending on furnishings .25 - .75Deep balcony, upholstered seats .50 - 1.00 *Grills, ventilating -15 - .50
Plaster, gypsum or lime, smoothfinish on tile or brick .013 .015 .02 -03 „ 3 ^ r \ r
Plaster, gypsum or lime, rough finishon lath .14 .10 . 06 n — -\ ■
. 0Same, with smooth finish .14 . 10 ! 06 . 0 - . 0 3
Plywood Paneling, 3/8-ln. thick . 28 . 22 -17 0 ̂ 'i 0 . 11Water Surface, as in a swimming pool . 00 8 . 00 8 .013 4 015 . 32C .325Air, ?.2bins per 10 3 0 cu ft. at 50:“ Hi: 2.3 « 2
ABSORPTION OF SEATS AND AUDIENCEValues given are in Sabins p? r s vu a re f o o t cf seat in - ~ v>0 fi - r* r ; !■ -r.i’.
125 Hz 250 Hz 500 Hz 1000 Hz 2330 Hz 4 000 HzAudience, seated in upholstered seats,
per sq ft of floor area . 60 -74 .88 .95 -93 - 35Unoccupied cloth-covered upholsteredseats, per sq ft of floor area .49 .66 . 80 Q 3 . 70
Unoccupied leather-covered upholstered seats, per sq ft of floor area . 54 .60 _ Ç? ~ G .53
Wooden Pews, occupied, per sq ft offloor area .57 .61 • 75 * 85 .91 P-
Chairs, metal or wood seats,each, unoccupied .15 .19 .22 - 39 -32 ■ 33
40

R, = 2 x 4o x 10 x 0.02 (floor, ceiling) 1 0 0 0
+ 2 X 4 0 X 5 X 0.07 (40-m walls)+ 2 x io x 5 x 0.04 (1 0-m walls)
= 1 6 + 2 8 + 4= 4 8 m 2-Sabin . (2.15)
Now, suppose a suspended acoustic tile ceiling is installed under the overhead slab. The ceiling height is reduced to 4.5 m. The sound absorption coefficients of the ceiling are as follows:frequency, Hz 125 250 500 1000 2000 4000coefficient CfTF 0 . 5 0 . 7 2 0 . 9 0 ÜTp" 0.82
The room constant calculation at 1000 Hz is:R = 40 x 10 x 0.02 (floor)
1 0 0 0
+ 40 x 10 x 0.90 (ceiling)+ 2 x 4o x 4.5 * 0 . 0 7 (40-m walls)+ 2 x 10 x 4.5 x 0.04 (1 0-m walls) (
= 8 + 360 + 2 5 . 2 + 3 . 6
= 396.8 m 2-Sabin (2.16)You may wish to calculate the room constants at other frequencies.Two generalizations may be drawn from the room constant discussion and calculations: (1) The room constant value increases as the room volume increases, because the surface areas must increase toaccommodate the larger volume; and (2 ) the relatively high valuesof the Sabin absorption coefficients (at least in the 500- to 4000-Hz frequency region, which is important in terms of A-weighted sound levels) wield strong influences on the room constant when acoustic absorption material is used.Noise Reduction Coefficients (NRC)—This is a term that is used widely as a single-number figure-of- merit of sound-absorbing materials. NRC is the arithmetic average of the sound absorption coefficients of 2 5 0, 500, 1 0 0 0, and 2000 Hz, rounded off to the nearest 0.05. Some sound absorptionmaterials of 1-in. to 3-in. thickness have Sabin absorption coefficients as high as 0.90 to 0.99 in the 1000- to 2000-Hz region, and NRC values of these products range from about O .65 to about 0.90. However, these products may have Sabin coefficients of only about 0.15 to 0.40 in the 125-Hz to 250-Hz region. Larger
41

thicknesses will cause increases in the low-frequency absorption coefficients.Sound Distribution in a Room—Figure 2.12 shows the influence of sound level distribution in a room as a function of the distance from a sound source and the value of room constant. Suppose a worker is 1 m from a sound source in a room whose room constant is 50 m 2-Sabin at 1000 Hz.(In a complete analysis, room constants would be calculated for all octave bands, and the A-weighted sound level would be calculated from the octave-band sound pressure levels.) At that position, the worker experiences a sound pressure level of 93 dB in the 1000-Hz band. Find the point on Figure 2.12 that corresponds to a distance of 1 m and a room constant of 50 m 2-Sabin. The relative sound pressure level value for this point is about -7.5 dB, as read from the vertical scale on the right of the figure. Suppose the worker backs away from that machine to a distance of4 m. The relative SPL drops to about -11 dB, indicating a sound pressure level reduction of about 3.5 dB. This room is so small and reverberant that the sound level remains almost constant throughout the room, except at positions quite close to the source. Next, suppose that with the use of acoustic absorption material, the room constant is increased to 200 m 2-Sabin. At the 1-m distance, the relative SPL is about -10 dB, and at a 4-m distance, the relative SPL is about -17 dB. This finding indicates that sound pressure levels in the room at a distance of 6 or more m from
c/>
10
5CD =3 ?Üj X > " ? 0 LlI_I- ie>U JZt r w D Z if) —LOUJluo: t r < iÛ 2 E Qo< ”
> 1
_ILjJu i i
* 5
“ 10
-15
-20
-25
ROC)MC<DNS z r=50,
OPEN Al = CC - 1 -100
f200
1son.s
- f ” l1,000
" "I I2,000
1 1 5,000-! 1
_ 10,000
^20000
5 _J UJ > Id
■10 -» UJ £TI K15 in UJ £T Û.
■20 û z3 O </>
■25 uj > t l
-30
</)z3O<rUJ2
or<<n
inzUJ2ozUJX5-35 ~
0.1 0.2 0.3 0.4 Q6 081.0 2 3 4 6 8 10 20 30 40 60 80100DISTANCE FROM ACOUSTIC CENTER OF A NONDIRECTIONAL SOURCE
Figure 2.12. Sound level distribution in spaces with various room constants.
42

the sound source could be reduced by about 7 dB at 1000 Hz with this application of sound-absorbing material. Note, however, at very close distances to the sound source, there is less effect from the addition of absorption material. At a 3-m distance, the change is only about 4 dB, and at a 1-m distance, only about 2 dB. This illustration summarizes briefly the value of sound absorption in a room: It can be quite beneficial in reducingsound levels for people located at large distances from a sound source, but it is not very beneficial to an operator who must remain at a position very close to the source. What this example emphasizes, however, is the importance of devising methods for keeping the operator at greater distances from his machine, so that sound absorption in the room can be beneficial.As an exercise in using Figure 2.12, study the sound level changes for workers 1 m and 10 m from a sound source in the room whose room constant was calculated above, with and without an acoustic tile ceiling (see Equations 2.15 and 2.16 for the calculated room constants at 1000 Hz). At a 1-m distance, Figure 2.12 shows a reduction of about 2.5 dB in going from an R = 50 m 2-Sabin room to an R = 400 m 2-Sabin room. At a 10-m distance, 'a reduction of about 10 dB is achieved when the sound absorptive ceiling is added.In a typical plant situation, a machine operator may spend most of the time about 1 to 2 m from the nearest machine, but remain within about 5 to 20 m from a number of other machines in the same room.By methodically working out the decibel sum of all the machine sound levels to that operator for a bare room (with no acoustic absorption) and for a treated room (with sound absorption material added), it is possible to calculate the approximate sound level reduction that would be achieved. For various geometries of room size, machine distances, and number of machines, the benefit can range from 0 dB (no benefit) to as much as 10 to 12 dB. The calculation is inexpensive, and, if the calculations should reveal that a 10- to 12-dB reduction is possible, adding sound absorption material may also be a relatively inexpensive solution to a plant noise problem.Although noise control treatments are discussed in detail elsewhere in this Manual, the noise reduction aspects of the room constant calculations are offered here as a part of the noise problem evaluation.Sound Power Level ApplicationIn previous examples, Figure 2.12 was used to show that a sound pressure level could vary as a function of distance from the source and room constant of the space. This figure can also be used to estimate sound pressure levels when the sound power level of a source is known. The equation is:
43

L = L + REL SPLn „ , (2.17)PD>R w D,R
where 1^ Is the sound power level of the source, in dB re 10” 12 W, REL SPLj) p is the relative sound pressure level taken from Figure2.12 for’the distance D and room constant R, and L is the
PD,Restimated SPL at the distance D in that room. Some manufacturers provide sound power level data for their products.In Equation 2.175 the correct positive or negative sign for relative SPL should be used. For all distances of practical concern, the sign is negative, so that a subtraction of numbers occurs.For example, suppose a source has a sound power level of 110 dB re 10"12 W at the 250-Hz octave band, and you want to determine the sound pressure level for an operator distance of 2 m in a room whose R value is 50 m 2-Sabin. Figure 2.12 shows REL SPL =-10 dB. Thus, Equation 2.17 would give
L = 110 - 10 = 100 dB.^ 2 , 5 0
Critical Distance—The derivation of the curves shown in Figure 2.12 Is based on material presented in room acoustics sections of most textbooks in acoustics and will not be repeated here. However, there is a useful term that may be obtained from that derivation: critical distance, or Dc . The critical distance is defined as the distance from a sound source at which the direct sound pressure level from the source approximately equals the reverberant sound pressure level contributed by the room. In its simplest interpretation, if a machine operator must work closer to the machine than this critical distance, sound absorption In the room will not be very helpful, but for distances larger than the critical distance, sound absorption material can be helpful. The equation for Dc is:
D = o.lil JR, (2.18)cwhere R is the calculated room constant for the particular frequency band of interest and where both Dc and R are in consistentunits. If a room should contain N identical machines, more or less uniformly distributed throughout the room,
D * 0.14 /R7Ñ . (2.19)cThe most interesting and unexpected revelation of these two equations is that the critical distance is related almost entirely to the room constant and is not clearly related to the size of the machine. In practice, because some sources have dimensions that are comparable to this critical distance, there may still be some influence of machine size on the actual D^ value.
4 4

For the room constant calculated in Equations 2.15 and 2.16, D would be about 1.0 m and 2.8 m, respectively, for the bare room and the treated room containing one machine, or about 0.4 m and 1.1 m, respectively, for the bare and treated rooms containing 6 identical machines.Source Directivity—Many sources radiate more sound in some directions than in other directions. This radiation can be a point of consideration in studying the position occupied by a machine operator. Where possible and practical, the nearby operator should try to remain in the quieter region of the sound field most of the time. In the reverberant sound field of the source, the region of possibly lower sound levels will be filled in by the higher sound levels, and the source essentially loses its directivity characteristics. The greater the room constant (the more absorptive the space), the greater the distance from the machine before the quieter regions are filled in by the reverberant stronger levels.In outdoor situations (and in anechoic test chambers), sound sources retain their directivity characteristics, and this retention should be taken into account when orienting directional outdoor sound sources (such as some types of mechanical-draft cooling towers) relative to critical neighbor positions or areas.Using acceleration measurements—Accelerometers are sometimes used to assist noise control engineers in identifying noise sources, especially in difficult situations where the sound field under investigation is relatively uniform and where there are many possible noise sources operating simultaneously.Accelerometers may be used in place of microphones on some of the more sophisticated sound level meters. The meters then serve to amplify and/or filter the accelerometer signal rather than the microphone signal.When properly secured to a vibrating surface (refer to instruction manuals), accelerometers will produce a signal proportional to the accelerations that surface undergoes as it vibrates back and forth. The acceleration levels (in decibels, as read from the meter) are related to the sound pressure levels on the surface, radiating into air approximately by:
SPL = AL + 150 - 20 log f , (2.20)swhere AL = A L 1g.i ALm is the acceleration level as read fromthe meter, A L xg is the acceleration level as read from the meter when the measuring system is subjected to an acceleration of 1 g, and f is the octave-band or third-octave-band center frequency of the vibration.
45

Vibration calibrators are available to ascertain the meter reading when the measuring system is subjected to an acceleration of 1 g, The calibration need only be made at a single frequency.A typical set of octave-band acceleration data and relevant calculations would 1 g = 82 dB):
as follows (for a system calibrated to read
125 250 500 1000 2000 4000 800067 84 77 75 62 62 7282 82 82 82 82 82 82
-15 +2 -5 -7 -20 -20 - 1 6
108 102 96 90 COt—■=r00 7293 104 91 83 64 58 56
Frequency (Hz)AL (dB)mA L l g AL150-20 log f SPLsThe final line above indicates the octave-band sound pressure levels at the surface of the vibrating structure.An approximate relationship between the sound power level of the vibrating surface and the calculated sound pressure levels at the surface of the vibrating structure is:
PWL = SPL + 10 log A . (2.21)s mwhere Am is the area of the vibrating surface in square meters or
PWL = SPLs + 10 log A ft-10 , (2.22)
where Aft is the area of the vibrating surface in square feet. Thus, in the above example, if the vibrating surface had a surface area of 1 m 2, the octave-band PWL of the surface would be equal to the calculated octave-band surface sound pressure levels.Equation 2.20 assumes that the vibrating surface is an efficient radiator of sound. This assumption is not always true. In fact, small surfaces (small compared to the wavelength of the frequency of sound considered) are very inefficient sound radiators. Also, thin materials do not radiate sound efficiently. These aspects are discussed more fully in the technical references given in the bibliography. The reader should be aware, however, that determinations of the octave-band power level of a vibrating surface by the above procedure may be as much as 25 to 30 dB too high for some thin or small vibrating surfaces.
46

Notwithstanding the shortcomings of the calculations involved, acceleration data can serve to eliminate from consideration surfaces which might otherwise be suspected of being significant noise sources and can also serve to help pinpoint surfaces which deserve further study.SUMMARY OF DIAGNOSTIC APPROACHESThis chapter has introduced many of the fundamentals of sound that are not only essential background information for noise control practitioners, but also serve as steps in the identification and diagnosis of noise sources and components. To recapitulate:
Turn machines on and off during sound measurements to determine major and minor sources.Use decibel addition to supplement the sound measurements in determining quantitatively the relative strength of the various contributors to the total noise.Understand and use the A-weighted filter response to emphasize the importance of the sounds that most influence the A- weighted sound levels.Make extensive sound measurements at many close-in positions and at all frequencies of concern to permit suitable study of the internal details of the many potential sources. This is necessary because on the basis of wavelength considerations alone, small-size sources (small compared to the wavelength of sound in air for the frequency of interest) cannot be strong low-frequency sound sources, but they can be important high- frequency sources.Calculate the approximate sound power levels of various source components to rank-order or diagnose the components in terms of their noise output. This is necessary because frequency analysis (in octave bands or even narrower filters) is essential to a proper study of a multitude of sound sources.
• Take room conditions into account when estimating sound levels for equipment in various spaces.Attempt to identify and quantify airborne and structural sources and paths of noise. Different noise control approaches must be used on these two broadly different types of sources.Do not ignore your ears as sensitive and useful instruments. Sometimes, certain sound signals may not be differentiated with sound measurement instruments, whereas your ears can pick up and distinguish unusual signal characteristics that can be attributed uniquely to certain sources.
47

Where possible and practical, obtain and use a separate small microphone and preamplifier with cable connection to the sound level meter. As the microphone is probed carefully around the working parts of the machine, watch the sound level meter (at A-setting or any specific octave band of interest) and look for peaks indicating that the microphone is close to a sound source. Sometimes, microphone movements of only a few centimeters, when held perhaps 1 cm from a complex mechanism, can reveal important close-in sources that deserve special attention.Repeat crucial measurements to guard against errors in readings and to ascertain that the machine is performing consistently.Make detailed notes and sketches to augment the noise data.Be as accurate as time will allow.Take time to think. Do not leave the job without having some specific thoughts on dominant noise sources and possible treatments. Also, consider possible alternatives to those first thoughts. Later data analysis may reveal errors in the initial ideas.Above all, apply thought and ingenuity in planning the measurements, obtaining the data, and analyzing the results.Do not allow yourself to be rushed through an important problem without adequate preparation, study, and analysis.
48

3. NOISE CONTROLOnce you have identified and measured the sources of noise, you are ready to consider what can be done to control the noise. Remember that the sound to be controlled is a form of energy.Your aim, therefore, is to reduce the amount of sound energy released by the noise source, or divert the flow of (sound) energy away from the receiver, or protect the receiver from the (sound) energy reaching him. In other words, all noise controls work at the noise source, along the noise path, or at the receiver.The key to noise control is finding the control that is both effective and economical. You should know not only what controls can work, but also how costly the controls are to design and install. In this section, we present a systematic procedure for choosing among the available options, starting with controls that require the minimum amount of equipment modification and ending with those controls that require the most modification.TECHNIQUES INVOLVING MINIMAL EQUIPMENT MODIFICATIONThe kinds of noise controls listed below can be effective in reducing noise exposures, but do not involve machine or process design changes. The alternatives are not necessarily simple or cheap, but they should be considered first, before exploring more complex solutions. The controls are:
Proper MaintenanceChanging Operating ProceduresReplacing EquipmentApplying Administrative ControlsApplying Room TreatmentsRelocating EquipmentSimple Machine TreatmentsProper Operating Speed.
49

Proper MaintenanceMalfunctioning or poorly maintained equipment makes more noise than properly maintained equipment. Steam leaks, for example, generate high sound levels (and also waste money). Bad bearings, worn gears, slapping belts, improperly balanced rotating parts, or insufficiently lubricated parts can also cause unnecessary noise. Similarly, improperly adjusted linkages or cams or improperly set up machine guards often make unnecessary contact with other parts and result in noise. Missing machine guards can allow noise to escape unnecessarily. These types of noise sources share one characteristic: Their noise emissions can bereadily controlled, though there is no simple way to predict how much noise reduction can be achieved through proper maintenance .Operating ProceduresThe way an operation is performed can cause workers to be overexposed to noise. Some operations are monitored by workers stationed near a noise source. At times, the distance is more critical in terms of noise exposure than operational necessities. In other words, the operator can station himself at some other, quieter location without degrading his work performance. Some operations can be monitored or performed from inside an operator "refuge," a booth or a room. Sometimes, relocation of machine control systems can augment this type of noise control.Noise reduction obtained by relocating operators can be estimated by measuring sound levels at the existing station and the planned new station. If an operator booth is employed, noise reductions can be expected to range from 10 to 30 dB, with the higher value for booths with good windows and doors, and the lower value for booths that are open to the environment on one or two sides.Equipment ReplacementIn some cases, the modification most readily available is quieter equipment that can be used to perform the same task. For example, several major manufacturers now sell quieted electric motors or quieted compressors. Other examples applicable to industry-specific manufacturing equipment also exist or are in various stages of production. Quieted versions of equipment typically sell for some premium over unquieted ones. Certainly, situations will arise when the purchase of different or newer equipment may be appropriate for production purposes, and these situations may be effectively combined with noise considerations. Be aware that new equipment may not necessarily be quieter, just because it1s new. Noise specifications can play a significant role in quieting an environment when an upgrading or expansion program is undertaken, and they will be more important as pressure increases on equipment manufacturers to produce quieter equipment.
50

Administrative ControlsOne possible form of noise control involves administrative control. One form of administrative control is to stretch your production so that the actual noise exposure is kept just below daily acceptable limits rather than allowing exposures to be high one day and low the next. Such noise control, however, is usually a remote possibility.A second possibility is to rotate workers: Exchange thosewho work in noisy areas with those who work in quieter areas.This alternative administrative control has been used on occasion, but, because of different labor skills and wages, as well as worker resistance, the implementation of this form of noise control is not usual. Furthermore, rotating the workers means that more people become exposed to high-level noise. There is a trade-off between exposing few workers to high-level noise for long periods of time and exposing more workers to the high-level noise for briefer periods of time.Room TreatmentsAs described previously, the presence of reflecting surfaces (walls, floors, ceilings, and equipment) in a workspace results in the build-up of sound levels in the reverberant field. By controlling the reflected sound (i.e., by preventing the reflections), reverberant field sound levels can be reduced by several decibels. Generally, the reflections are prevented by use of acoustically absorbent materials applied directly to wall or ceiling surfaces or suspended from the ceiling in the form of hanging baffles. The potential benefit of room treatment ranges anywhere from 0 dB (no benefit) to as much as 12 dB.Equipment LocationThe sound level drops off as one moves away from a noise source. Outdoors (i.e., in an acoustic free field), the sound level can be reduced by as much as 6 dB for every doubling of distance. Indoors, the effect of reverberation may limit the reduction obtainable by relocating equipment, but when workers are stationed close (within a meter) to noisy machines and where space permits, moving the noise sources (or the workers) may be beneficial.This situation is often encountered where manned production equipment is lined up in rows, and where a given operator may receive as much noise exposure from the machine behind him as from his own machine. If there is no room to spread out equipment, a likely alternative solution would be to shield the worker from the sounds around him (see Machine Controls section). Also, reverberant treatment may be of benefit. Refer -to Figure 2.12.
51

Another form of equipment location would be to relocate machine service units that do not need constant attention, such as pumps, fans, drives, hydraulic systems, and air and steam flows, into unoccupied spaces.Simple Machine TreatmentsVibration Isolation—Airborne noise can be produced by any solid vibrating member of a machine. The vibrating member alternately pushes and pulls against the air, creating small pressure changes that tend to radiate in all directions. The vibrating member may be driven into vibration by contact with a primary moving part, or through some intermediate solid linkages in contact with the moving part. In such cases of "forced vibration," techniques of vibration isolation may be applicable. In general, all vibration isolation techniques aim at disassociating the vibrating member from the force causing it to vibrate, generally by interposing a slightly compressed "springy" material between the forces and the member. An example would be supporting a panel on a machine by means of bolts that pass through Neoprene grommets. Essentially, the panel is "suspended" from the machine by the Neoprene.Close-fitted machine-amounted enclosures should be vibrationally isolated to prevent the enclosure panels from becoming important sound radiators.Vibration Control—Vibration control eliminates or reduces vibration at its source. In the discussion on maintenance, several vibration control techniques were mentioned, including the balancing of rotating components and the elimination of unnecessary component contact. Vibration control also includes mounting a vibration source on special supports. This type of vibration control, actually a form of vibration isolation, Is considered separately because it deals with the vibration itself (which could be a motor-pump assembly, part of a machine, or the entire machine). Vibration control systems can employ springs, Neoprene, cork, felt, or glass fiber.Vibration isolators are commercially available. They are selected by specifying the weight to be supported, the deflection required, and the lowest vibratory frequency of the unit to be isolated. They are made from elastomers (compressed or shear, ribbed Neoprene); other compressible materials (cork); fibrous mats (felt, glass fiber); and steel springs.Basic Isolation requires a knowledge of the lowest forcing frequency (f) of the machine to be isolated, as related to the natural frequency (fn ) of the isolator when supporting the machine and the weight on the footing to be isolated. The trans- missibility of vibratory energy is greatest (and should be
52

avoided) when the ratio of f/fn = 1- Isolation begins above f/fn = /2. As a general rule, a machine on a heavy rigid foundation is well isolated when the resonance frequency is less than one-fifth of the lowest operating frequency. The latter is usually that of rotary unbalance in the slowest rotating part.If the machine is on a lightweight floor or is hung from a springy roof, the ratio should preferably be less than one-fifth.Vibrating pipes or suspended fans can be in this category. The isolator plus machine resonance frequency fn is determined from fn - 0.5 /d or fn = 3»13 /l/d, where d is the static deflection of the isolator under load in, respectively, millimeters or inches. This relation holds only when the deflection is strictly proportional to the load (linear systems).To select spring isolators (Bell 1973)*
Establish that part of the total weight that is on the footing in question.Determine the lowest forcing deflection required for degree of transmission percent required (see Table 3.1); 5% is normally adequate.Choose a suitable isolator that will sustain the load and have the proper deflection. Isolator manufacturers often list spring constants (lb/in. deflection).Ensure that the deflection is uniform for each footing.Ensure that the vibration isolation system is not shorted out by rigid connections (electrical conduit, mechanical supports, linkages, or pipe connections, etc.).
The selection of isolator pads follows the same general method, and data from the suppliers as to the recommended grade, material, and thickness are used. Many pads, however, are highly nonlinear and cannot be selected directly on the basis of the above information.A motor mounted on a platform is a typical isolation problem.This problem has a simple solution: Use four properly selectedvibration isolators.
*Bell, L.H. 1973* Fundamentals of Industrial Noise Control. Harmony Publications, Trumbull, Connecticut.
53

Table 3.1 Required static deflection (inches) for common industrial speeds or forcing frequencies (base is assumed immovable).
Speedrpm freq.
Vibration Transmission (percent)0.5* 1. 0% 5.02 10* 25%
3600 60 0.55 0.27 0. 06 0. 03 0.012400 40 1.2 0.62 0.13 0.07 0. 03l800 30 2.2 1.1 0.27 0.12 0.05l600 27 2.8 1.4 0.29 0.15 0.071400 23 3.6 1.8 0 . 3 8 0.20 0.091200 20 4.9 2.5 0.52 0.27 0.121000 17 7.1 3.6 0.74 0.39 0 . 1 8800 13 5.6 1.2 0 . 6 1 0.28600 10 2.1 1.1 0.49400 7 4.6 2.4 1.1
Other vibration problems can be more complex, and knowledgeable suppliers should be consulted. Provide them with the machine weight, operating frequencies, weight distribution on footing, and test measurements, which should include acceleration, velocity, and displacement at machine footings and at other points on the machine, to aid in determining the isolator requirements. For example, machines with low forcing frequencies may require a heavy concrete inertia block, generally 1.5 to 2.0 times the weight of supported equipment. In addition, the inertia block and entire support structure could rest on spring isolators.Another problem is a machine on a limber floor. Such designs and specifications call for special expertise. Complex vibration involving more than one plane requires specialized assistance from the suppliers or a qualified consultant. Under optimum conditions, the reduction in noise level (in dBA) should range from 2 dB for a machine with no vibrating panels, mounted on a very heavy inertia block, to perhaps as much as 14 dB fora heavy machine on a second-story, limber floor.A special problem arises with punch presses or other sources of periodic impulse noise. Here the problem is to reduce the transmission of both the shock and the ensuing vibration. The optimumchoice of vibration isolator is governed by the relation among three time intervals. First is t 15 the effective duration of the exciting shock. Second is t 2, the period (time for one cycle) of motion resulting from resonance between mass of the machine and the effective stiffness of the vibration/shock isolator.Third is t 3> the interval between repetitions of the impulse.The isolator should be chosen so that t 1 < t2 < t to obtain near-optimum results. The value of t x for a punch press or shear is approximately the time between contact of the tool with
54

the workpiece and the completion of the cutting action. This can be determined from machine parameters; direct measurement with an oscilloscope gives more reliable data.Surface Damping—Frequently, lightweight metal (or plastic) parts are set into bell-like vibration by multiple impact (e.g., parts impacting on chutes) or by induced resonances caused by externally applied forces. The resulting "free" vibration can be effectively attenuated by application of externally applied damping materials. Damping treatments include application of specially treated aluminum tapes, application of troweled, painted, or sprayed-on materials, and application of constrained layer "sandwiches" of damping materials. In each case, the damping properties of these materials are dependent on temperature, humidity, and chemical exposure.Other Simple Treatments—At times, minor changes in the structure or functional design of a machine can reduce noise effectively. Prime examples of this technique are eliminating or softening (by padding) impacts at linkages and securing rattling parts. More sophisticated methods include changing the size or shape of main radiating structural components (making them smaller) and providing air "leaks” (perforations) in surfaces to make components less efficient radiators of sound.These and similar modifications should be made only when a part has been clearly established as a main source of noise or vibration and when the ramifications of the proposed changes have been checked thoroughly.TECHNIQUES REQUIRING EQUIPMENT TO BE ADDED TO EXISTING MACHINERYOther forms of noise control may involve some kind of modification to the equipment. Some equipment changes that reduce noise exposure, however, can be accomplished without redesigning the equipment. Such modifications may change the machine noise emissions, may redirect the emissions, or may contain the emissions. In some cases, the noise controls may require some adaptation to new operating procedures — in effect, they may require some "getting used to." Humans, as you know, are reluctant to change everyday habits. You should therefore work closely with the people whom the control will affect. Let the workers say what design features they consider essential, and allow a reasonable time period before you evaluate the effects of the changes on operations.Shields and BarriersAn acoustical shield is a solid piece of material placed between worker and noise source; it is often mounted on a machine. An
55

acoustical barrier is a larger piece of solid material, usually free-standing, on the floor. Both the barrier and the shield function by deflecting the flow of acoustical energy away from the worker. They are most effective when (1) the worker is close to the noise source (positioned in the near field of the noise source), and (2) the smaller dimension of the shield or barrier is at least three times the wavelength contributing most to the noise exposure received, and (3) when the ceiling and other nearby reflecting surfaces are covered with sound absorptive material. Shields or barriers can provide as much as 8 to 10 dB of Improvement under these ideal conditions. The farther the worker is from the noise source, and the smaller the barrier, the less effective is the barrier.Because most common construction materials used in shield and barrier designs provide considerably greater transmission loss than 8 to 10 dB, the treatment material Is generally not critical. Material selection should be based on the (1) need for visual access to the problem equipment and (2) the expense involved. Typical materials used are light-gauge sheet metal, 1/2-in. plywood, 1/4-in. clear plastic, or safety glass.For best results, and to minimize the addition of unwanted reflections, the machine side of a shield/barrier should be at least partly lined with an acoustical absorbent material, preferably oil-resistant and cleanable (see Noise Control Materials section). Handles and, if needed, casters can be provided for ease of moving. Hinged sections can also be incorporated in the design for physical access through the treatment, but care should be taken, in segmenting the treatment, to minimize acoustical leaks. Strips of Neoprene can minimize leaks at joints or hinges.Shields can be used as replacements for less acoustically efficient machine guards in many cases. In such cases, the shield should be fitted carefully to cover all the noise leaks and should be properly vibration-isolated.EnclosuresPartial Enclosures—When a barrier is wrapped around a machine, with its top more or less open, it becomes a partial enclosure. Such an enclosure can be effective in reducing noise to workers nearby. The noise, however, escapes through the top and contributes to the reverberant sound in the workroom. In addition, specular (mirror-like) reflection from the ceiling can contribute reflected-path levels that can become obvious when the direct path is reduced by the enclosure, as shown in Figure 3-1.
56

Figure 3*1- Source-barrier-receiver geometry. The angle into acoustic shadow should be greater than 30° for at least 10-dB attenuation. Ceiling reflection can offset barrier attenuation if ceiling height is less than 1.5 times distance from source to receiver.
These spill-over noise effects can be reduced by covering the inside of the enclosure with acoustically absorbent material. Also, suspended acoustically absorbent baffles may be placed over the openings to reduce the escaping noise. If all other machines in the workroom are qiiieted, the ceiling reflection may become apparent. Such reflections are usually specular, and the patch of ceiling at which the reflection takes place can be located geometrically on building plans. Acoustically absorbent material placed on the ceiling at this location will reduce the reflected sound.Partial (and total) enclosures will usually need access for incoming material, product, scrap removal, operator, maintenance personnel, and vision. Doors, windows, and hatches will handle most access problems, but the usual precautions about avoiding leaks hold strongly at these openings. Hinged or sliding doors can use a gasket for a seal. A convenient material is the closed-cell foamed elastomer weatherstripping sold with a pressure-sensitive adhesive. Special acoustical gaskets, designed specifically for sealing leaks, are also available. For
57

less stringent sealing, the magnetic strip gaskets used on refrigerator doors supply both seal and positive closure. Hatches can be dogged down by quarter-turn latches.Windows for visual access may need internal illumination to make visual monitoring easy. Heat build-up should be no problem with an open top in a partial enclosure. If necessary, ventilation openings (fitted with acoustically lined ducts or mufflers) can be provided through the enclosure walls. Noise reduction may remove acoustic signals that some workers use in evaluating the performance of a machine. Hence, if the reduction is too great, acoustic cues may have to be supplied separately, with a rugged microphone (at the site where the essential information is generated) feeding a small loudspeaker at the worker position.Openings for workpiece, product, and scrap flow can permit noise to escape. Such openings should be in the form of tunnels lined with absorbent material. The length and unobstructed cross section of the tunnel determine the amount of noise attenuation obtainable. In the design, the acoustically absorbent material can be selected for maximum effect on the noise spectrum at that opening. Use of lined tunnels should be accompanied by some degree of automation. Examples of some partial enclosures, which can provide as much as 12 to 15 dB of noise reduction, are shown in Figure 3.2.
partial enclosure partial enclosure
Figure 3.2. Examples of partial enclosures.

Total Enelosure—If more than 12 to 15 dB of noise reduction are required, a total enclosure is needed so that noise is contained more fully.By virtue of their design, total enclosures can cause a heat build-up problem. Heat build-up is handled by adding a ventilating blower, together with silencers for both supply and exhaust air. Some internal ducting may be needed If there are heat- sensitive components in the machine, but these ducts can also selectively supply cooling air and remove hot air. The minimum flow rate of cooling air, Q (in cfm), depends on W, the watts of heat generated, and on AT, the temperature rise permitted (degree F). For air cooling at sea level, Q = 1.76 W/AT. More flow is needed at higher altitudes.A total enclosure may require a change in work habits. The change can be more acceptable if the people most involved — the workers and the foremen — are given the opportunity to enter into the design discussions. Enclosures can also force consideration of modernizing equipment, for example, automatic feed by conveyor, which requires less personal attention to the machine. Such automation may also offset the difficulties that arise from less free access to the machine. In most instances, you will have little difficulty with the acoustical aspects of enclosure design. The chief job is to ensure an industrially viable design, taking account of the requirements for access, minimum change in productivity, and minimum Installed cost. To meet these requirements, you, as the noise control engineer, must work closely with the industrial, plant, and process engineers, with foremen and workers, with maintenance crews, and with management.As a general matter, enclosures should not touch any part of the machine and should be vibration-isolated from the floor. Nevertheless, the enclosure must be pierced for such services as electricity, air, steam, water, oil, or hydraulic power. These services can be regrouped, together with mechanical controls, to a convenient location and passed through a junction box that is later packed and sealed. Cables, pipes, and conduit can pass through cut-outs in metal cover plates for the junction box. If desired, an enclosure panel can be split and adapted for passage of services through the enclosure wall. See Figure 3.3* A resilient acoustical seal can then be made from two ring-shaped pieces of 1/8-in. (or heavier) Neoprene. Slot each piece at the pipe or conduit and overlap the two pieces with the slots facing away from each other. Seal the straight edges with strips of Neoprene or similar oil-resistant, heavy, resilient material.For mechanical controls operating through an arc-shaped hole or slot in a panel, the seal can be of abutting multiple strips of Neoprene. The control lever should be as thin as possible. Where possible, replace the lever with a servo control operated from the outside.
59

Figure 3-3. Split panels for services.
Many of the features of a convenient enclosure design are illustrated in Figures 3.4 through 3-10. The general design is based on panels secured (by quarter-turn captive screws) to an angle iron frame (see Figures 3.4 and 3.5). Thus, rapid access is provided for all types of servicing of the machine. This type of enclosure should be as close as possible to the machine. Up to 20 dB of noise reduction are usually easily obtained. The angle iron frame can be of bolted sections, to permit quick and complete disassembly and removal.Machine vibration may still create a problem by vibrating the floor, which then acts as a resonant sounding board to vibrate the enclosure. This problem is handled by vibration-isolating mounts, using steel springs, or elastomers in shear (Figure 3.6). Special care in design is needed if the exciting force is of short duration but is repeated, as in a punch press. Not all vibration-isolator suppliers recognize the need for careful selection of isolators in this special repeated-impact situation. Be sure that you have enough data on the machines and the isolators to ensure an effective design. You will need data on three time scales: (1) duration of the impact, (2) time betweenimpacts, and (3) the minimum period of oscillation of machine on a suggested isolator.
60

Figure 3*4. Welded angle iron frame. This frame can be welded in segments that are bolted together.
1 / 8 X 1 inch cold-rolled steel stiffener on panel, for panels thinner than 11 gauge
enclosure panel
gasket of closed cell foamed elastomer
edge of angle iron frame
quarter-tum captive screw fastener: space about every 6 to 9 inches. Wing screw fasteners can be used if rapid access is needed without tools.
Figure 3.5. Enclosure panels secured to frame by quarter-turn fasteners.
61

enclosure panel
toe coving, bent 1 /6 X 9 inches cold-rolled steel; 5 inches deep, 4 inches high
vibration isolating mount, elastomer in shear; static deflection at least 1 /4 inch
strip seal to floor, 1 / 8 X 3 inches Neoprene
clearance about 1 /2 inch
Figure 3*6. Vibration isolation and toe covering.
enclosure panel; usually steel
damping sheet; can also be spray, trowel on
absorbent: seat raw edges with paint, main surface to be o il-resistant and cieanable
Figure 3.7. Enclosure panel interior treatment
62

Figure 3*8. Door and hatch detail. Interior of doors and hatches have same acoustical treatment as enclosure panel. Secure doors by vibration-resistant latches or by quarter-turn fasteners. Doors and hatches must make airtight seal to enclosure panel.
Figure 3«9. Window detail.63

complete enclosure
Figure 3-10. Examples of enclosures.
For any machine, the time comes when major repairs are due; additions or changes may also be called for. The enclosure designs suggested in Figures 3,2 through 3.10 afford some flexibility in this regard. The panels can be made separately and fastened in place with a gasket material (such as weatherstripping) to close off leaks. If the panel material is metal, its resonances can be distributed more uniformly in frequency if the panel is reinforced by bolted-on angle irons (bolting adds damping). The stiffeners should be placed so as to divide the panel into smaller areas, no two of which should be the same size and shape. Frames for doors, windows, and hatches can also be used as stiffeners.Windows pose a special problem because they are an acoustical weak spot. Generally, if more than 20 dB of reduction are needed, double glazing must be used. The inside layer should be safety glass, because it must withstand rough handling and cleaning to remove oil, grease, and dirt. All panes should be set into soft elastomer gaskets. Room-temperature-setting silicone rubbers are useful. The visual access that windows provide should be carefully thought out in terms of the information needed by the operator. Glareless lighting of the components to be monitored is helpful. In extreme cases, closed-circuit video monitoring can be used.
64

A special adaptation of the total enclosure for the machine is a total enclosure for the operator when this is the more practical or economical approach. Such enclosures may require air intake and exhaust fans, with noise traps, lighting, heating, or, in some cases, air conditioning. As in machine enclosures, some inside absorption — such as an acoustic tile ceiling — is recommended, and special care must be taken in window and door design to avoid leaks. See Figure 3.11 for effect of leaks.How can an enclosure be acoustically designed? First, establish how much noise reduction is needed for the equipment being enclosed at the location of interest outside the enclosure (typically the closest operator position). See Overall Noise Reduction Requirement and Noise Source Diagnosis sections. This machine-specific objective is termed the required "insertion loss" of the enclosure, and it should be expressed on an octave-band basis. Second, estimate the required "transmission loss" of the isolating wall of the enclosure, again on an octave-band basis.
Figure 3-11. Effect of enclosure sound leaks on potential noise reduction.
6 5

For an enclosure that will be lined with sound-absorbing material, the estimated required transmission loss in each octave band is equal to the insertion loss plus 10 dB. For windows with bare interior walls, the estimated required transmission loss in each octave band is equal to the insertion loss plus 15 dB to 20 dB, depending upon how conservative you wish to be.* Third, find a suitable wall material that can provide the needed transmission loss in each octave band. (See Table 3.2.) Actual octave-band transmission loss information is also provided in advertising literature. There is a well-defined and accepted standard (ASTM E90-61T, or latest version) for measuring transmission loss, and you should verify that reported information is made in accordance with that procedure.A problem occurs in calculating the net transmission loss when the enclosure has panels, doors, hatches, windows, silencers, and leaks, each with its own area S± and associated transmission loss Lt-p A formula, however, that can be used is:
- L , / 1 0Lt = 10 log S - 10 log I S ^ O 1 (3-1)
This formula amounts to adding up all the sound power that escapes and dividing by the total area. As an example, consider a machine control room that has ceiling-high walls that separate it completely from the rest of the shop, where the level is 100 dBA. The design of the wall is shown in Figure 3.12. The objective is to compare the performance of single- and double- glazed windows at a midrange octave band. We assume that there is negligible leakage through the roof and that all leaks have been well sealed.The calculations are shown below for one octave band. In a complete analysis, calculations must be carried out for all bands.
*This estimation procedure is based on allowance for the build-up of sound that will take place inside an enclosure — a phenomenon that depends principally on the amount of absorption inside the enclosure.
^Do not confuse transmission loss data with STC data, a related material performance measure that is often given in addition to or in lieu of transmission loss data in advertising.
66

Table 3.2. Transmission loss of common materials. The reader is referred to Beranek, Noise and Vibration Control, * and NIOSH’s "Compendium of Materials for Noise Control,"^ for general information on the behavior of noise- isolating material and the design of enclosure systems.
lb/sqft
FrequencyMaterial 125 250 500 1000 2000 4000 8000
Lead1/32-in. thick 2 22 24 29 33 40 43 491/64-in. thick 1 19 20 24 27 33 39 43
Plywood3/4-in. thick 2 24 22 27 28 25 27 351/4-in. thick 0.7 17 15 20 24 28 27 25
Lead vinyl 0.5 11 12 15 20 26 32 37Lead vinyl 1.0 15 17 21 28 33 37 43Steel
18-gauge 2.0 15 19 31 32 35 48 5316-gauge 2.5 21 30 34 37 40 47 52Sheet metal(viscoelastic 2 15 25 28 32 39 42 47laminate-core)
Plexiglas1/4-in. thick 1.45 16 17 22 28 33 35 351/2-in. thick 2.9 21 23 26 32 32 37 371-in. thick 5.8 25 28 32 32 34 46 46
Glass1/8-in. thick 1.5 11 17 23 25 26 27 281/4-in. thick 3 17 23 25 27 28 29 30
Double Glassl/4xi/2xl/4-in. 23 24 24 27 28 30 36l/4x6xi/4-in. 25 28 31 37 40 43 47
5/8-in. GypsumOn 2x2-in. stud 23 28 33 43 50 49 50On staggered stud 26 35 42 52 57 55 57
Concrete, 4-in. 48 29 35 37 43 44 50 55thick Concrete block,6 in. 36 33 34 35 38 46 52 55
Panels of 16-gaugesteel, 4-in. ab 25 35 43 48 52 55 56sorbent , 20-gauge steel
♦Beranek, L.L. 1971. Noise and Vibration Control. McGraw-Hill, New York, N.Y.
i*NIOSH Technical Publication No. 75-165. Compendium of Materials for Noise Control.
67

24 feet wide
^ . f o x - , t ~*I ,‘ i 11 ! I ;i w ,
. . 1.* 1 . 1 . ' ^ 1 1 ' Î 1. 1. 1. ' .■ ■ ».j , ,i ,i, », I, I .i*- Lii. r r~T’ 1 ' i l 1 1 r . I _ I 1 i i i . . tI I I T “ 1 T I r r
concrete block areas 3 feet high
glass
z a
door 3 feet wide
©
glass5 feet high
t .* i . i , », 1 1 1 »t i l — i—n —I T — t 1 I 1 I 1 I 1
glass area 105 sq ftdoor and frame 24 sq ftconcrete block 135 sq ft
total 264 sq ft
Figure 3.12. Example of isolating wall.
Si Li-L./10
10Values of S.
Single Glazing
-L./1010DoubleGlazing
Single Glazing 105 31 7.94 x 10“ *1 O.O834 —Double Glazing 105 45 3 . 1 6 x 1 0 - 5 — O.OO332Door 24 31 7.94 x 1 0"* 0 . 0 1 9 1 O.OI9IConcrete Block 135 45 3 . 1 6 x 10"s 0.00427 0.00427
Sums 264 0.1068 0.026710 log 264 = 24.2Lfc (single) = 2 4 . 2 - 1 0 log (0.1068) = 34 dB L (double) = 24.2 - 10 log (0.0267) = 40 dB
Wrapping/LaggingA special form of enclosure treatment is wrapping or lagging.This kind of treatment can be used to insulate already enclosed surfaces (e.g., piping or hoppers). The treatment consists of application of an absorbent material over the radiating or vibrating surface, followed by an outer coating of impervious material, such as sheet metal or flexible mass-loaded vinyl. Such treatments are less subject to problems encountered with hox-type
68

enclosures, but are generally limited to use on regularly shaped surfaces that do not require constant maintenance. Some typical constructions and attenuations* are given below (in dB):
500 Hz 1000 Hz 2000 Hz1-in. glass fiber blanket with 1.5 4.8 1 3 . 8
aluminum foil covering1-in. glass fiber blanket with 5.0 12.0 24. 0
lead-impregnated vinyl2-in. glass fiber blanket with 4.0 13.5 26. 0
lead-impregnated vinylNotes:
Glass fiber is 4 lb/ft3 (64 kg/m3) density. Lead vinvl is 0.87 lb/ft2 (4.25 kg/m2)Note low attenuation at 500 Hz, less at lower frequencies. Good seal at all joints is critical.Two layers of 2-in. glass fiber plus lead impregnated vinyl between layers plus a cover layer of lead impregnated vinyl would increase attenuation.Sheet lead of same weight/area could also be used.Sheet metal, plaster, or gunite (sprayed-on concrete) can be used for greater TL of the covering layer.
SilencersThere are many types of noise control devices that are termed "silencers." Duct silencers, for example, are cylindrical or rectangular structures fitted to the intake or discharge of air moving equipment. These "dissipative" silencers function by absorbing noise otherwise escaping from the intake or discharge. The duct silencers are internally lined with acoustical material.Commercially available duct silencers are specified by the insertion loss (by octave bands) and by other specifications, such as velocity of flow, temperature, and allowable pressure drop. Large industrial silencers are also known as snubbers and are sometimes combined with spark arrestors. There is a great deal of art in silencer design. One difficult problem with dissipative silencers is fouling of the absorbent by particulate matter.
*Dear, T.A. 1972. Noise reduction properties of selected pipe covering configurations. In: the International Conference onNoise Control Engineering. P. 138. Washington, D.C.
6 9

Fans and blowers, when near or part of an operation, can be a major noise source. Fan types used are propeller, axial, and centrifugal. Blades on centrifugal fans may be radial, forward- curved, or backward-curved; backward-curved blades are the quietest. The resulting air noise is a combination of blade-pass frequency and harmonic peaks plus broadband aerodynamic noise and turbulence.Reduced fan speeds will reduce noise, and replacement with lower noise level fans, such as backward-curved blade types, can be considered. If this is not practical or economical, the air flow noise can be reduced by commercial or custom-made silencers. Custom-made silencers, which can be constructed in maintenance shops, include acoustical labyrinths, parallel baffle silencers, acoustic-lined plenums, acoustic-lined ducts, and acoustic-lined bends.If duct walls are lined with an absorbent with absorption coefficient, a, then an estimate of the decibel reduction obtained per foot of lined duct is given by:
AL = 12.6 Pa1 * *Vs ,where AL = Change in sound pressure level
P = Acoustically lined perimeter of duct, inchesS = Cross section open area of duct, square inchesa = Coefficient of absorption (note that this is fre
quency-dependent, so octave-band data will be used to determine required Insertion loss and length of duct to be treated). (3.2)
The above equation is applicable only for low frequencies (duct width/X < 0.1). Beranek, in Boise and Vibration Control3* provides other means for determining muffler performance.Plenum chambers can also be lined with sound-absorbing material. An approximate relation for the reduction in level is:
AL = 10 log (aSp/Sb ),where a = Coefficient of absorption of liner
Sp = Area treated on plenum walls= Discharge area of blower. (3.3)
*Beranek, L.L. 1971. Noise and Vibration Control. McGraw-Hill, New York, N.Y.
70

An absorbent-lined bend should add about 5-dB attenuation, with length of treatment at about five times duct width. Commercial silencers are available for greater attenuation to fit any fan or duct size, and suppliers can give insertion loss at each octave band under varied conditions of flow. Note that noise travels both upstream and downstream, and silencers may thus be needed on both intake and delivery sides of the fan.The "reactive” muffler is another type of silencer used along piping or ductwork systems or at engine exhausts. These devices are designed to reflect pressure disturbances back toward the noise sources, thus functioning in a different fashion than dissipative silencers.Acoustic tunnels, fitted to the infeed or discharge of otherwise enclosed machinery, are another type of silencer. They are simply an acoustically lined passageway, dimensioned to accommodate the product flow. Here, sanitation details are likely to be more important than pressure losses caused by the use of the tunnel. Acoustic labyrinths, such as are used on ventilated enclosures, are a special form of acoustic tunnel.In-line silencers are devices used in piping systems to smooth out pressure disturbances in the piping systems.Two special categories of silencers are those fitted to pneumatic lines at pressure relief valves or exhaust ports on pneumatic equipment (exhaust mufflers) or to air wipes and parts blow-offs (parts ejection mufflers). These devices reduce the turbulence normally associated with the exiting stream of air.* These devices can serve as an inexpensive form of noise control for such frequently encountered noise sources. However, care must be taken to ensure that air flowing through these devices is reasonably clean, because the mufflers have a tendency to clog.TECHNIQUES REQUIRING EQUIPMENT REDESIGNNoise control at the source of the noise is highly desirable in many cases, especially when the need to retrofit or otherwise modify noise exposures is thereby eliminated. Usually, however, the expertise and resources necessary to redesign equipment on a large scale is beyond the means of the end user of a noisy product. Yet certain techniques may be useful to end users and may serve to eliminate the need for other forms of noise control.
*Jet noise is extremely sensitive to the air velocity. Noise reduction may therefore also be attained by simply minimizing supply pressure or increasing the cross section of the jet orifice. A reduction of jet velocity can result in a 20-dB or greater noise reduction.
71

In general, noise emissions caused by impact types of noise sources (e.g., hard parts on hoppers, cans on conveyors, etc.), can be reduced by "softening" or preventing the impacts. Thus, the plant should consider such treatments as:
Placing internal baffles in hoppers to encourage the product to slide, rather than fall, onto hopper surfaces;Machining cam contours to prevent cam follower impacts;Changing chute slopes to encourage sliding rather than bouncing;Using soft material (e.g., Neoprene) or dashpot buffers to reduce mechanical impacts;Replacing metal conveyors at transfer drops with canvas units, or reducing the height of the drops;Lining conveyor sides with plastic railing;Using timing mechanisms to space out conveyor line product flows, thereby preventing product impacts;Applying damping to the underside of conveyors, chutes, hoppers, etc.
In other cases, it is possible to envision the use of alternative mechanisms to quiet noise emissions. Noisy hydraulic motors may be replaced with electric drives. Pneumatic parts ejectors may be replaced with mechanical mechanisms.PERSONAL PROTECTION EQUIPMENTThere are basically three types of hearing protectors:
Ear muffs, which are devices that fit around the ears and are supported either from a hard hat or from a head band that connects the individual muffs;Ear plugs, which are devices that fit within the ear canal;Canal caps, which are devices that rest on the ear canal opening and are supported by a head band.
Ear muffs come in a universal size and are available with foam- or liquid-filled cushions. Some devices fit only in one position (e.g., with the band over the head), while others are multipositioned, and can be worn with the head band over the head, behind the head, or under the chin. Muffs cost more initially, but they are cleanable, and replacement parts are available.
72

Ear plugs come in many varieties. Disposable units (e.g.,Swedish Wool) are worn once and discarded. Reusable units are cleanable. Some devices are made in several sizes to accommodate different-sized ear canals. Other come in one size that can be adapted by their natural expansion when inserted in the canal, or by removing one or more flanges on the unit. Some varieties are custom-molded, and these are supposed to provide the most comfortable and best fit.Canal caps are available in only one size and configuration.The laboratory-measured performance of the many brands and styles of hearing protectors is described in the "List of Personal Hearing Protectors and Attenuation Data," HEW Publication No. (NIOSH) 76-120. The publication also includes a method for determining the in-use performance of any device, on the basis of the frequency-by-frequency lab-measured attenuation and field- measured noise data.Note: OSHA has always regarded use of hearing protectors as asecondary form of noise control, to be used only when engineering or administrative controls are infeasible or as an interim measure while other forms of noise control are being implemented.In industrial plants, encouraging the use of protective equipment for employees and supervisors usually requires an educational program on ear protection. There should be continual follow-up by supervisors to see that the program is accepted and that ear protection is worn when needed. For reminders, place signs in areas where protective equipment is mandatory. Supervisors should be aware that if a plug or muff is uncomfortable, it may not be worn.When they are used properly, hearing protectors can reduce potentially hazardous sound levels to nonharmful at-ear sound levels for most types of industrial noise environments. Laboratory measurements have shown that almost every hearing protector can provide 25 dB or more of attenuation. It should be recognized, however, that there may be significant differences between laboratory-measured performance and actual field performance.Hearing protector performance is highly sensitive to fit of the device being used. Any acoustical leakage around the devices that may result from improper fit, broken seals from eyeglass frames or long hair, loss of pressure on cushions resulting from stretched supports, or improperly maintained cushions can degrade the hearing protector performance to the point that only 10 dB or less of attenuation can be obtained. Unfortunately, workers tend to use hearing protectors improperly because looser fitting devices are more comfortable.
73

To insure hearing protectors serve as intended, they should always be provided as part of a more comprehensive hearing conservation program which includes, at minimum, annual follow-up in the form of audiometric testing of individual hearing levels. Any successful hearing conservation program should also include education of the end users to the proper use of hearing protectors (as well as to the potential hazard of improper use) and should provide(1) professional advice as to proper fit and (2) a wide variety of hearing protectors of all kinds (to account for individual preferences and differences in ear sizes). In addition, the program should be supported by management, to ensure company-wide cooperation. Finally, it is important to be able to dispel some of the myths associated with the use of hearing protectors:
Hearing protectors do not degrade a normal hearing person's ability to hear sounds or understand speech in high-noise environments. In fact, hearing protectors can improve listening conditions. When hearing protectors are worn, all sounds are attenuated, and the signal-to- noise ratio remains the same at each frequency. The only difference is that the intensity of the sounds is reduced. However, since different frequencies are attenuated by different amounts, the user will need to adjust to the alteration in the sounds he hears.Hearing protectors do not appear to cause hygiene problems. Reusable devices can be cleaned and disposable devices replaced as required.
There are certain problems associated with use of hearing protectors that should be acknowledged:
The devices may be uncomfortable, especially when first worn and especially in hot environments, where perspiration can cause ear muffs to slip or to irritate.The devices do make it more difficult to hear in low noise environments (i.e., under 80 dBA) and, in intermittent noise environments, workers will naturally want to remove the devices during quiet periods.Workers with preexisting hearing impairment may lose some ability to hear certain sounds if the preexisting impairment complements the attenuation of the protector.Hearing protectors may make it difficult to localize a particular noise. That is, they can interfere with the ability to discriminate where a sound originates.
7 4

4. NOISE CONTROL MATERIALSIn this chapter, we describe the four types of materials most often used in noise control: absorbers and isolators for airborne sound, and vibration isolators and damping materials for controlling vibration solidborne sound. Guidelines are also given for selecting materials on the basis of nonacoustic considerations.ABSORPTION MATERIALSWith absorption, small amounts of sound energy are changed into correspondingly small amounts of heat energy. Suitable materials are usually fibrous, lightweight, and porous. The fibers should be relatively rigid. If a cellular material is used, the cells must intercommunicate. Foams should be reticulated to the proper degree.Examples of absorbent materials are: acoustical ceiling tile, glass fiber, and foamed elastomers. Physically, the flow resistance of fibrous materials is the most important characteristic.For optimum results, the flow resistance must usually be increased as the thickness of the absorbent decreases, to maintain peak absorption. Absorbent materials are employed in several applications, including muffler linings, wall, ceiling, and enclosure linings, wall fill, and absorbent baffle construction.The flow resistance can be sensed — rather crudely — by attempting to blow through the material. Comparison with an accepted material of the same thickness provides a personal calibration.The effectiveness of an acoustically absorbent material is measured by the absorption coefficient. Ideally, this is the fraction of the sound energy flowing toward the material that enters it and is not reflected; thus, a perfectly absorbent material would "soak up" all the sound incident on it. Industrially useful acoustically absorbent materials have coefficients above 60% in the frequency range from 500 Hz and up.Absorbent materials on room surfaces reduce the amount of reverberant sound in a plant space (see Figure 2.12), and thus reduce the effects of reflected sounds. It is very important to recognize that absorbents do not materially affect the transmission of sound; thus, they should never be used as shields or barriers or enclosure walls. The reduction of reverberant sound pressure levels that could be expected by addition of an absorbent material is given as approximately 10 times the logarithm of the ratio of the room constant obtained after adding the absorbent material, divided by the original room constant. It is relatively simple,
75

then, to estimate the new sound level from the new sound pressure levels. Table 4.1 shows average absorption coefficients of various absorbent materials. Table 2.5 shows absorption coefficients of relatively nonabsorbent construction materials plus those for some special materials.
Table 4.1. Sound absorption coefficients of commonacoustic materials.
Frequency (Hz)Materials* 125 250 500 1000 2000 4000
Fibrous glass(typically 4 lb/cu ft)
hard backing1 inch thick 0.07 0.23 0.48 0.83 0.88 0 . 802 inches 0.20 0.55 0.89 0.97 0.83 0.794 inches thick 0.39 0.91 0.99 0.97 0.94 0.89
Polyurethane foam (open cell)
1/4-inch thick 0.05 0.07 0.10 0.20 0.45 0. 8l1/2-inch thick 0.05 0.12 0.25 0.57 0.89 0.981 inch thick 0.14 0.30 0.63 0.91 0.98 0.912 inches thick 0.35 0.51 0.82 0.98 0.97 0.95
Hairfelt1/2-inch thick 0.05 0.07 0.29 0.63 0.83 0.871 inch thick 0.06 0.31 0.80 0.88 0.87 0.87
*For specific grades, see manufacturer's data; note that the term NCR, when used, is a single-term rating that is the arithmetic average of the absorption coefficients at 250, 500, 1000, and 2000 Hz.
Note that for each doubling in the amount of absorption, you can expect a 3-dB noise reduction in reverberant levels. The first3-dB reduction is therefore relatively cheap to obtain; you must add twice as much material to obtain a second 3-dB reduction.Note, also, that the ultimate noise reduction potential would be limited. You would not be able to reduce the sound level to below that which would be obtained if there were no confining walls present in the workspace.The absorption coefficient depends not only on the material but also on what is in front and back of it. Most coefficients are stated for an unobscured front, but with a rigid impervious backing spaced various distances away from the material. Noise control engineers use designations of the Acoustical and Insulating Materials Association to describe the material mountings:
76

(1) Cemented to backing with about 1/8 in. air space(2) Spaced 3/4 in. away by furring strips(4) Laid directly on surface — very little air space
(7) Suspended 16 in. from the backing.When the mounting is not specified, usually it is N o . 1 or 4.Absorbent materials may have special facings. For resistance to grease and water that would clog pores, a thin plastic film covering is often used. Such films, as well as perforated vinyl or sheet metal facings, tend to produce a maximum in the midfrequency absorption coefficient. Absorbents protected by a film still have exposed edges. These may be sealed by a latex paint that anchors itself to the pores of the absorbent and closes the edges. Some thin construction materials, notably plywood, can show increased low-frequency absorption by panel resonance, if they are not securely fastened down.The standard reverberation room method of measurement of absorption coefficient (ASTM C423-66, or latest version) essentially subjects the absorbent to sound from all angles. Data on absorption coefficients cannot be regarded as useful and meaningful unless they have been obtained in this standard fashion.TRANSMISSION LOSS MATERIALSThe sound isolation properties of materials are stated in terms of transmission loss. As with absorption, the concept of energy flow is used; here it is the energy transmitted through the material, relative to that flowing toward it. Transmission loss is 10 log (incident energy)/(transmitted energy), and it ideally increases with frequency at the rate of about 5 to 6 dB per doubling of frequency. Only a few laboratories in the United States are qualified to make the standard measurement for determining transmission loss (ASTM E90-61T, or latest version). Data on the transmission loss of materials appearing in advertising literature cannot be regarded as meaningful unless they have been determined in this standard manner.As a result of the search for a single number to indicate the aver' age full transmission loss, the concept of sound transmission class (STC) was developed. It is useful specifically in assessing the degree to which intelligible speech is prevented from being transmitted through a wall. Use the STC with caution in industrial work, however, because the noise spectrum can be much different from that of speech. You will need the transmission loss in each octave band for the proper application of isolating materials.
77

DAMPING MATERIALSDamping materials are used to reduce resonance effects in solids. Essentially, damping materials are absorbents for solidborne sound, converting the vibrational energy into heat.Damping materials are used in many applications. If a machine panel (such as a belt guard) is subjected to vibration, it will radiate sound strongly at its resonant frequencies. Damping the panels or guards can reduce this radiated sound. In another application, parts that fall into (and are carried along) metal chutes can excite the chute panels by repeated impact. Installing damping materials along the chute surfaces will reduce the noise, but these materials must be selected with heat resistance and mechanical integrity in mind. Damped stock tubes are available for quieting screw machine operation. Panels for isolating enclosures can transmit large amounts of sound in certain frequency regions. Damping can help retain transmission loss in those regions.There are two types of damping materials: homogeneous and constrained layer. A homogeneous layer material is sprayed or troweled on in a relatively thick coat, depending on the thickness and type of metal to be damped. A constrained layer material consists of a thin layer of the actual damping material with a backing of thin metal or stiff plastic. The mechanical action is one of making the damping layer much more effective than if it were homogeneous. Constrained layer damping materials can be purchased as an adhesive/metal foil tape combination, where the adhesive is selected for its energy loss properties as well as its adhesion. These damping tapes are especially useful on thin panels (1/16-in. steel or less).VIBRATION ISOLATORSVibration isolators act on the same principle as isolators for airborne sound: introducing into the transmission path a materialwhose wave-transmitting properties are as different as possible from the medium carrying the wave. For vibration in solids, such materials are spring-like. Examples include resilient elastomer and metal springs, elastomer pads, and, in extreme cases, air springs. The weaker the spring, usually the greater the isolation. Solid rubber or rubber-fabric pads are not too effective, because the displacement is small and is not proportional to the load.If an isolator is too weak vertically, it may not be laterally stable. Side-restrained metal spring isolators are available to avoid this difficulty. In extreme cases, it may be necessary to use many isolators, all acting along lines that pass through the center of gravity of the machine. Vibration isolators can also be used when the vibration situation is reversed, i.e., when a delicate mechanism is to be protected from external shock and vibrat ion.
78

The proper amount of damping is needed with vibration isolation in many applications. Steel springs alone are highly undamped; if they rest on elastomer pads, there is much improvement.MATERIAL SELECTIONThe most commonly used materials for control of noise in industry are absorbers and transmission loss materials for airborne sound and vibration isolators and dampers for solidborne sound. Selection of materials is governed by factors other than acoustical. These factors may be broadly classified as environmental and regulatory. Environmental factors include:
Moisture, water spray, water immersionOil, grease, dirtVibrationTemperatureErosion by fluid flow.
Regulatory factors include:Lead-bearing material forbidden near food processing linesRestrictions on materials that may be in contact with foods being processed — glass, monel, or stainless steel permittedRequirements for material not to be damaged by disinfectingFirebreak requirements on ducts, pipe runs, shaftsFlamespread rate limits on acoustically absorbing materials
• Fire-endurance limits on acoustically absorbing materialsRestrictions on shedding of fibers in air by acoustically absorbing materialsElimination of uninspectable spaces in which vermin may hideRequirements for secure anchoring of heavy equipmentRestrictions on hold sizes in machine guards (holes can reduce radiated noise of vibrating sheets).
79

A good example of the influence of these factors is seen in the selection of absorbent materials for use inside machine enclosures. It is typical of ordinary maintenance practice to overlubricate rather than to install or service oil or grease seals. Hence, it is common to find oil and grease deposits on machines, often with dirt, metal chips, and other debris. Such deposits greatly degrade the performance of absorptive coatings, which are porous materials that easily wick oil and water. However, absorbent materials are now available with a thin imperforate skin or film covering of Mylar, Saran, or Tedlar, which prevents fluid wicking. Nevertheless, the sheer weight of grease deposits will degrade higher frequency performance even without wicking; fire hazards will also be increased. Therefore, the film must be strong enough that the deposits can be cleaned off with a cloth wet with warm detergent, plus mild rubbing. Such maintenance will be necessary with machine enclosures lined with absorbent materials. The time between cleanings can be greatly lengthened if oil and grease seals are installed or if deflecting shields are used on severeoil spray, such as those from impacting parts in a punch press.Curtain types of isolating materials, such as lead-loaded vinyl, are convenient for constructing an enclosure rapidly. Where leaded materials cannot be used, as in some stages of food processing, a barium-loaded type is available. Monel and stainless steel are the only common metals usually permitted in contact with food.Fibrous absorbing materials in shop-made silencers and mufflers can be eroded by high-speed gas flow, say, above 15 m/s (50 fps). The fibers may pose a health hazard and can also interfere with machine operations. The situation is worsened if vibration is present, as it tends to break and shake out small fibers. The material used should have some bonding agent to hold fibers securely in place. In addition, the absorbent can be covered with wire screen or perforated metal. If the latter is used, the ratio of open to total area should be greater than 0.3. The effective absorption will be decreased if lesser open areas are used. Foamed absorbent materials shed much less than fibrous types, but all need sealing of raw edges by a film-making paint or by a thin plastic cover.Fire resistance is often required by building codes. Absorbent materials are available with several degrees of resistance. With suitable materials, fire breaks are sometimes unnecessary in isolating walls that are filled with absorbent material. Since local building codes may not be applicable to structures that can be described as a part of the machine, prudent language must be used in describing the function of the enclosure.
80

A most important nonacoustical factor in the selection of noise control materials is net cost. You must always be aware of this factor and should design so that labor-plus-materials cost is minimized. A part of the net cost is also the loss in production while a machine is being treated, so time to restore production must be considered. Ease of maintenance must also guide the selection. Achieving a viable design means that material selection cannot be accomplished on a purely acoustical basis.
81

5- SELECTING AND USING A CONSULTANTKNOWING WHEN A CONSULTANT IS NEEDEDHaving read the previous chapters, you know you can deal with some noise problems on your own. If you are still unsure of the solution or if preliminary measures have proved unsatisfactory, it may be time to consider the use of a consultant.A consultant may be needed wnen the machine to be quieted is complex, with many noise sources of approximately equal strength. Locating the sources and obtaining their relative noise strengths will perhaps call for more sophisticated equipment and procedures than you may have. If you find that the A-weighted sound level at all points at a constant distance from the machine (but within the critical distance) covers a range of 5 dB or less, this is likely to be the case.You may also need a consultant for unusual situations. With belt- driven blowers, for example, you may find a slow but considerable variation in sound level. Another is impact noise, as from a punch press, where several events take place in rapid succession. A narrowband analysis of a tape recording is usually called for. Inadvertent tuning of some part of the machine may lead to pure tone ringing that is difficult to locate. For such situations, using a consultant is often the most rapid way of getting results.If you have installed noise control means that don't work, you may (albeit reluctantly) have to use a consultant to correct the situation. Although this may be a painful decision, it will usually occur but once. You should document the situation thoroughly and use the consultant to supply information on what went wrong.Sometimes you may be approaching a lawsuit, where data must be obtained and presented (as an expert witness) by a disinterested third party. Many consultants can provide this complete service.Once you have decided to obtain a consultant, how do you proceed? You should first be warned that currently there is no legal bar to anyone offering services as an "acoustical consultant." Consequently, it is up to you to avoid those who are unsuitable because of lack of training or experience, as well as simple venality or greed.
82

People billing themselves as consultants can be broadly classified according to whether or not they have a special interest in recommending a particular acoustical product or solution. Both types, properly used, have their special advantages and disadvantages. "Special interest consultants" are individuals who vary in their backgrounds from product salesmen to professionals who are quite capable in their line of business. Members of this group, who are most commonly indicated by the degree of their association with manufacturing or retail sales of acoustical products, should be used directly only if, by use of the techniques described in previous chapters, you have satisfied yourself that their solution is applicable to your problem. In this case, you have progressed to the point where the "consulting" aspect consists mainly in soliciting proposals for design and installation. The main problem remaining is to write your contract in such a way that you are guaranteed (to the extent possible) a solution to your problem that is cost effective. The advantage of using this group directly is that you avoid consultant costs. In effect, you are acting as your own consultant.The disadvantage in dealing with a product-oriented consultant is that a costly mistake, out of proportion to the independent consultant's fees, is rendered more likely. Examples abound of cases in which thousands of dollars were spent in implementing a particular solution, only to find that no good was done. (A common mistake is to use acoustical tile in situations where reverberant noise is not the problem.) If there are any doubts in your mind as to the proper method for solving your problem, then an "independent consultant" (one free from ties to a particular line of products) should be called in. Since this "independent consultant" is what is usually meant by the word "consultant," it is this type of professional that will be discussed for the remainder of this chapter. The word "independent" will be dropped.In choosing a consultant, a first step is to inquire of the two organizations in the field that are interested in the qualifications of their members. The most inclusive is the Institute of Noise Control Engineering (INCE), P.O. Box 1758, Poughkeepsie,New York 12601. This group will have as members only those who have passed suitable examinations. Applicants must pass both the Engineer-in-Training examination given for registered professional engineers and a special examination on noise control engineering that was first given in 1974. There will be no grandfathering — the term applied to certification purely on the basis of past activity in the field. It is expected that this certification of noise control engineers will receive approval by and support from the government agencies needing such engineers directly, or in the contract work they support.
SELECTION OF A CONSULTANT
8 3

The second source of information on qualified acoustical consultants is the National Council of Acoustical Consultants (NCAC), 8811 Colesville Road, Suite 225, Silver Spring, Maryland 10910. This group has a rigorous code of ethics requiring (as with all registered professional engineers) that no member be associated with the sale of a product. Consequently, some consultants, otherwise well qualified, are not members because of this association.A membership list is available. Not all the completely classified consultants are yet members.You can also question the prospective consultant yourself. A series of questions is given below. These questions are rather completely presented here, and you may wish to ask only those that are pertinent to your particular task.GUIDELINE QUESTIONSEducation
(1) What schools did you attend?(2) What courses did you take bearing on acoustics?(3 ) What degrees did you receive? When?(4) In what special conferences, seminars, symposia, or
graduate courses in acoustics have you been involved, either as a student or as an instructor?Experience
(1) For how many years have you been professionally active in acoustics?
(2) Please supply a list of recent clients that you have served, preferably in my geographical area, and on problems similar to those in which I am interested.
(3) What teaching or training have you done in acoustics, and to what groups — university, industry, trade associations, civic groups, engineers, symposia?Status.
(1) Are you now an independent consultant? For how many years? Full time or part-time?
(2) If part-time:(2.1) Who is your chief employer or in what other
business ventures are you involved?
84

(2.2) Is your employer aware and does he approve of your part-time activity as an acoustical consultant ?
(2.3) Way we contact your employer concerning you?(2.4) What restrictions does your employer place on you
as a part-time acoustical consultant?(3) Are you associated with the manufacture or sale of a
product that could create a conflict of interest in your activities as an acoustical consultant?Professional Affiliations
(1) Of what engineering or scientific societies or associations are you a member? (Representative ones are the Acoustical Society of America, the Institute of Noise Control Engineering, and the National Council of Acoustical Consultants.)
(2) What is your present grade of membership and length oftime in that grade, for each association?
(3) Have you been accorded any professional honors in these associations, such as offices, committee chairmanships, awards, or prizes?
(4) Are you a registered professional engineer? In whatstates? In what disciplines?
(5) Of what professional engineer associations are you oryour firm a member?
(6) Of what trade associations, chambers of commerce, or similar business groups are you or your firm a member?Special Capabilities
(1) In what areas of acoustics do you specialize?Noise measurement and control Architectural acoustics Hearing conservationShock and vibration measurement and control Nondestructive testing Medical ultrasonics Underwater acoustics
(2) What equipment do you have for conducting acoustical measurements in the field? In the laboratory?
(3) With what national standards do you comply in conducting your acoustical measurements?
85

(4) Are you listed by any governmental or trade association body as an acceptable or certified acoustical test laboratory?
(5) What equipment do you have for the absolute calibration of test apparatus?
(6) Can you serve as an expert witness, either for your client or as a friend of the court? What experience have you had?Business Practice
(1) Please indicate your fee structure. Do you handle this by hourly charges, estimates for total job, retainer charges, or all of these?
(2) If you use a contract form, please supply a sample.(3) In your charges, how do you treat such expenses as travel,
subsistence, shipping, report reproduction, and computer time? (Note: Consultants usually charge to you the time spent during travel for you on Monday through Friday, 8:00 a.m. to 5:00 p.m. There may be a charge for use of highly specialized and expensive equipment.)
(4) What insurance and bonding do you have?(5) Are you operating as an individual, partnership, or
corporation?(6) What statements do you have in your contracts covering
commercial security, liability, patent rights?(7) What restriction is there on the use of your name in
our reports, in litigation, in advertisements?(8) What is the character and extent of reports that you
prepare? Can you give examples?(9) What facilities do you have for producing design shop
drawings on devices that you may develop for the specific purposes of a consulting task?
(10) Where is your principal office? Do you have branch offices? Where?
(11) What size is your staff? What are their qualifications? Who will be working on this project?The ProposalOnce you have selected a consultant, you can arrange to obtain his services in several ways. With most professional people a verbal commitment is sometimes all that is necessary. However, you may
86

wish to request a written proposal that spells out the steps to be taken in the solution of your problem.Often, in a larger job, proposals from several points of view are evaluated and used as one of the bases for the final selection of the consultant. In this case, answers to pertinent questions in the preceding section may be sought in the proposal rather than in the interview. If so> evaluation of the proposal from this point of view is self-evident from the above discussion. If the questions you are interested in are not answered to your satisfaction, donTt hesitate to ask for further clarification. In the discussion below, we are concerned with the section of the proposal that outlines the consultant's approach to your problem.Aside from background qualifications of the consultant, the proposal should answer the questions:
(1) How much is the service going to cost? Smaller jobs are often bid on an hourly basis, with a minimum commonly specified of one-half day's work, plus direct expenses. Larger jobs are usually bid at a fixed amount, based on the work steps described.
(2) What is the consultant going to do? The answer to this question may range all the way from a simple agreement to study the problem to a comprehensive step-by-step plan to solve it.
(3) What will be the end result? The answer to this question is all too often not clearly understood; the result is usually a report that specifies the consultant's recommendation. If you do not want to pay for the preparation of a written report, and a verbal one will do, specify this in advance. Since the recommendations often call for construction to be carried out by others, whose work is not subject to the consultant's control, results usually cannot be guaranteed. Rather, an estimate of the noise reduction to be attained is all that can be expected. If the consultant is to provide drawings from which the contractor will work, you must specify sketches or finished drawings. Generally, sketches are sufficient. If special materials are required, the consultant should agree to specify alternative selections if possible. If you want a guaranteed result, experimental workwill usually be necessary.In the case of a proposal to quiet machine noise, the proposal, if detailed, will probably call out the following steps:
(1) Determine the daily noise dose, so that the amount of reduction required is known.
(2) From diagnostic measurements, determine the location and relative strength of the major noise sources on the machine in question, all other competing noise sources being more than 10 dB below the intended noise.
87

(3) Design preliminary noise control means; discuss design with production people for possible Interference with access to the machine.
(4) Prepare and submit final recommendations in a report, with construction data.
(5) In a post-report conference, resolve any questions or compromises; submit memorandum of conference.
(6) If experimental work is needed, it can be added between(3) and (4) above.Other ServicesIf you wish, the consultant can also, as additional services, provide monitoring of construction to determine compliance with specifications. The consultant can also make post-installation measurements to confirm predictions and supply oral briefings as needed.By working with the consultant during his measurements, you can learn a great deal about how to handle the special situation for which he has been retained. However, he brings to the job an instrument that is most difficult to reproduce: ears trained tolisten and to guide the use of the physical instruments. It takes much practice and not a little aptitude to achieve this condition. This aspect of a consultants expertise is most difficult to replace.If the consultant is to serve as an expert witness for you, you will find that he is not automatically on your side. Rather, he Is more like a friend of the court, devoted to bringing out the facts he has developed, with careful separation of fact from expert opinion. Complete frankness Is needed if you want to avoid unpleasant surprises. For example, the consultant may be asked by the opposing attorney for a copy of his report to you. Thus, this report should be prepared with this eventuality in mind.If the consultant is retained to develop a quieter machine for you, there should be a meeting of minds on handling of patent rights. Ordinarily the patent is assigned to the client, with perhaps a royalty arrangement for the inventor.For many situations, the consultant will need photographs and plans of machines and shop layout to facilitate his evaluation. Permission to obtain these data can be handled in a manner consistent with your industrial security system. A qualified consultant will not have to be told to regard this material as private, not to be divulged to others without your prior consent. If you regard him as the professional person he is, your association can be fruitful to all concerned.
88

6. CASE HISTORIESThe case histories presented here are intended to be useful to production and safety engineers, health personnel, and other factory personnel who are not specialists in noise control. The case histories are examples of engineering tasks that have been completed not only by professional noise control engineers but also by nonacoustical specialists who used common sense to solve their noise problems. Collected here are actual cases on various industrial devices. These devices were typically machines used in a production process; in some cases, they had been cited by safety officials for unsafe high sound levels or by regulatory agencies for violating local noise ordinances.The case histories presented here were chosen primarily because the amount of noise reduction actually achieved was measured.Such engineering results, even if not directly applicable to your situation, illustrate general principles that will point the way to a successful result for your problems. Toward that end, the treatments are described in detail in these case histories .CASE HISTORY DATAThe following outline presents the whole process of accomplishing noise control, viable in both engineering and economic senses.The outline will also serve as a check list to guide you in learning and applying the principles of noise control engineering that have been discussed earlier. The case histories that follow contain the essential data for the simpler problems and somewhat more for the complicated ones.OUTLINE OF COMPLETE PROCEDURE FOR DEVELOPMENT OF NOISE CONTROL1. Plant data
SIC classification of industry Location, address; division Product or process
2. Problem definition Compliance planCompliance measurements, daily noise dose
89

• Diagnostic measurements and source locations• Design of experimental noise control• Design of final noise control• Supervision of construction, installations
Post-installation checkout, performance evaluation Oral briefings
• Preparation of technical paper3t Machine data
3.1 IdentificationMake, model, serial number, factory numberAppearance (drawing or photo); identification of significant parts, functionsLayout drawing of workroom, all machines shownLocation of aisles, vertical clearances; service lines; conveyors; hazard-posted areas
3.2 Operating dataFunctions of machine; relation to others Type of input: gauge, size, shape of stockType of output: shape, sizeType of scrap: how collectedGeneral product flow with respect to other machinesUse of automation: conveyors, robotsServices and ratings: electrical, air, water, fuel,steam, hydraulic, internal combustion engine, vibratorProduction rate (maximum)Downtime: jams, breakdowns; repair, maintenance,set-up; reload, idling; operator at rest room, mealsConstraints on operation: access, both physical andvisual, for worker, input stock, output product, and scrap; access for repair, maintenance, set-up, reload; safety, union regulations, sanitation, special materials for food industries, rodent control; operator need for aural cues; limits on capital and operating expensesSpecial machine features: noise control featuresalready installed; use of vibration isolators; use of air; evidence of overlubrication
90

4. Noise situation data4.1 General observations (ear)
Noise high or low pitchedDirectional location by cupping hands behind ears
• Presence of pure tonesLevel constant, varying slowly or with much impact noiseFeeling of vibration in floorWorkers communicating by word or signUse by workers of aural cues in detecting and evaluating machine performance, jams
4.2 Name, make, model, S/NCalibration data: when; traceable to NBSCheck list for diagnostic acoustical measurements: SLM, octave-band analyzer, 1/2-in. and 1-in. micro*- phones, tripod, extension cord for microphone; windscreens, calibrator and adaptors; accelerometer; control box for acceleration, velocity, displacement; stroboscope; vibrating reed tachometerCheck list for optional equipment for diagnostic acoustical measurements: two-channel tape recorder,connecting cords, microphones for voice channel, blank reel, AC cord, charger; range finder, measuring roller, steel tape (centimeters and inches); flashy light; pressure-sensitive labels; camera with wide- angle lens, flash; spare batteries for all equipment (alkaline only); ear muffs, safety glasses, safety shoes, hard hat, paper towels, handsoap; pliers, diagonal cutters, screwdrivers; circuit tester
4.3 Acoustical measurementsA, C, peak and octave-band readingsMeasure at ear positions of worker, worker absent, if possible, with all machines going, then with machines in question selectively turned offRun machine at different speeds to locate resonance^Run with portions of machine selectively disabledMeasure rpm's with stroboscope, vibrating reed tachometerMeasure at suspected noise sources on machine; photograph the set-ups; locate microphone precisely
91

The following pages contain 61 case histories. Some are prihted in this Manual for the first time; others appeared — in a slightly different format — in the 1975 edition of the Manual. Case histories written for this edition contain the names of the contributors .
9 4

4. Noise situation data4.1 General observations (ear)
Noise high or low pitchedDirectional location by cupping hands behind ears Presence of pure tonesLevel constant, varying slowly or with much impact noiseFeeling of vibration in floorWorkers communicating by word or signUse by workers of aural cues in detecting and evaluating machine performance, jams
4. 2 Name, make, model, S/NCalibration data: when; traceable to NBSCheck list for diagnostic acoustical measurements: SLM, octave-band analyzer, 1/2-in. and 1-in. micro?*- phones, tripod, extension cord for microphone; windscreens, calibrator and adaptors; accelerometer; control box for acceleration, velocity, displacement; stroboscope; vibrating reed tachometerCheck list for optional equipment for diagnostic acoustical measurements: two-channel tape recorder,connecting cords, microphones for voice channel, blank reel, AC cord, charger; range finder, measuring roller, steel tape (centimeters and inches); flashy light; pressure-sensitive labels; camera with wide- angle lens, flash; spare batteries for all equipment (alkaline only); ear muffs, safety glasses, safety shoes, hard hat, paper towels, handsoap; pliers, diagonal cutters, screwdrivers; circuit tester
4. 3 Acoustical measurementsA, C, peak and octave-band readingsMeasure at ear positions of worker, worker absent, if possible, with all machines going, then with machines in question selectively turned offRun machine at different speeds to locate resonance^Run with portions of machine selectively disabledMeasure rpm's with stroboscope, vibrating reed tachometerMeasure at suspected noise sources on machine; photograph the set-ups; locate microphone precisely
91

Set to octave band for which A-weighted spectrum at ear of worker maximizes. Probe around machine to locate sources.Locate around machine an imaginary box that touches all major surfaces; record the dimensions; at 1 m away from box, obtain sound levels for calculating total sound power.
• On slow A-scale, obtain contours of equal sound level around machine, others off; locate paths of workers among contours. Repeat with all machines on.
4.4 Vibration measurementsC, peak and octave-band readingsProbe over the surface (pickup coupled so it is not rattling) for acceleration levelsCalculate velocity and power levels for selected surfacesRun machine at different speeds to locate resonant excitation of vibrationSelectively disable parts of machine to locate exciting sources
4.5 Auxiliary dataData per (3.2)Unusual conditions: breakdowns; machine with badbearing, gears, loose partsTape recordings of noise situations that are shortlived or nonrepetitive, together with calibration signal; also useful for later narrowband analysis, judging rpm, pure tonesPhotographs of all pertinent parts of machine, including close-ups of name plateNames, position, and possibly addresses of operating, supervisory, and management personnel concernedTime of entry to plant, time spent at each machine, time left plant
5. Development of noise control5.1 Preliminary report
Data, raw and reduced; evaluation, interpretationPreliminary noise control recommendations, taking full account of constraints in (3*2) above
92

Preliminary estimate of noise reduction expectedPreliminary estimate of capitalized installed costPreliminary estimate of possible change in productivity and change in piece part cost
• Recommendations on use of automationConference to discuss implications of report
5.2 Development of revised recommendationsRemeasure as neededRe-estimate noise reduction, costsPrepare recommended experimental program if problem sufficiently unusualPrepare sketches showing acoustically essential features of the noise control devices; if required, prepare drawingsRecommend special materials; provide alternate suppliersEstimate construction, installation costs
5.3 Installation, useMonitor construction and installation for adherence to acoustical specificationsIntroduce corrective measures for improperly installed devicesEvaluate emergency alternate materialsMeasure installed performance; correct deficienciesMeasure daily noise dose to applicable workers
6. New workRecommend improvements if similar noise control is to be applied to other machines of the same classRecommend action on problems remainingProvide briefings on results to technical and management peoplePrepare paper for publicationHelp prepare formal compliance reports
93

The following pages contain 61 case histories. Some are printed in this Manual for the first time; others appeared — in a slightly different format — in the 1975 edition of the Manual. Case histories written for this edition contain the names of the contributors .
94

TECHNIQUES THAT INVOLVE MINIMAL EQUIPMENT MODIFICATIONOperator Booth Treatments (see Operating rrocedures
Total Enclosures)Case History 1: Paper Machine, Wet End
Room Treatments (see room treatments)Case History 2: Gas Turbine Test Station
Vibration Isolation Treatments (see Vibration Control)Case History 3: 800-Ton Blanking PressCase History 4: Nail-Making Machine
Damping Treatments (see Surface Damping)Case History 5 Case History 6 Case History 7 Case History 8 Case History 9
Pneumatic Scrap Handling Parts Conveying Chute Plastics Scrap Grinder Hopper NoiseElectric-Powered Towing Machine
Simple Machine Treatments (see Simple Machine Treatments)Case History 10 Case History 11 Case History 12 Case History 13
Blanking Press Ram Spinning Frame Boxboard Sheeter Carding Machines
95

CASE HISTORY 1: PAPER MACHINE, WET END(OSHA Noise Problem)
Problem DescriptionThe major noise sources of the wet end of this paper machine were the couch roll suction air movement, the pumps, and the whipper roll. The whipper roll supplies a beating action on the felt of the paper machine to provide continual web felt cleaning.Problem AnalysisThe sound level at the wet end is 92 to 94 dBA in the operator aisle. Higher readings of more than 100 dBA were obtained close to the couch roll. See Figure 6.1.1 for a sketch of the area.
Figure 6.1.1. Paper mill — wet end.

Paper machine manufacturers have developed a quieter couch roll in which the suction holes in the drum are in a staggered, ratherthan a regular, pattern. However, the replacement cost of acouch roll is high, and it will probably be used only on mill expansion projects or new mill construction.An alternative method to reduce the operator noise exposure was construction of a personnel booth to house the operator and the operating controls during most of the operating shift. The wet end paper machine operator spent an hour or less making couch roll adjustments during a typical operating day. If the balance of each day were 92- to 94-dBA exposures in the mill operating aisle, the resulting exposure would exceed the OSHA limits. However, if the operator spent the 1 hr at 100 dBA (couch roll adjustments), 2 hr on general observations near machine at 92 dBA, and the balance of the shift in areas under 90 dBA, includinga personnel booth, his daily noise dose would be:
1 hr actual 2 hr actual _ n2 hr allowed 6 hr allowed(100 dBA) (92 dBA)
Since this dose is less than 1.0, it is within the allowable noiseexposure of the present OSHA regulation.Control DescriptionThe recommendation for the wet end of the machine (couch roll and whipper noise exposure) was to provide an operator enclosure with operating controls and instruments, and with viewing windows to observe machine operation.Calculations indicated that the required 15-dB attenuation could be attained with a simple structure consisting of 2 x 4-in. framing with 1/2-in. plywood walls inside and out, plus one solid door and two windows 3 x 5 ft each, double glazed. The ceiling and upper half of walls were covered with acoustic tile to reduce reverberant noise. The room was provided with light, heat, and air conditioning for worker comfort. In-plant construction cost was $2,50 0.ResultsResults achieved by the enclosure are shown in Figure 6.1.2. Inside sound level was reduced to 75 dBA, from outside levels of 92 to 94 dBA.Greater attenuation can be obtained by purchasing special acoustic shelters or by using more elaborate (from acoustic standpoint) construction such as concrete block walls, double windows, or interior sound absorption.
97

no
? tooCD•oUJ>UJg 90O)V)UJtrCLootooZ<1CD
£ TO<1HUO60315 63 125 250 500 1000 2000 4000 8000
OCTAVE BANDCENTER FREQUENCY (H z l
Figure 6.1,2. Sound pressure levels at wet end of paper machine.
CommentsMost of the difficulties to be avoided are nonacoustical. It is essential that the operator has no interference with visual monitoring of machine operation. This consideration fixes the booth location and window placement.
98

CASE HISTORY 2: GAS TURBINE TEST STATION(Hearing Conservation and Speech Communication Noise Problem)
Walt Jezowski General Electric Company Gas Turbine Division Building 53-303 Schenectady, New York 12345 (518) 385-7544Problem DescriptionOperations of a gas turbine test stand at the General Electric Company*s Schenectady, New York plant involve fabrication and assembly workers on the 128,000-ft workfloor surrounding the test area. In particular, sound between 90 and 95 dBA was at times present in the vicinity of the test stand where some 40 employees work for varying periods of time.Problem AnalysisThe test station responsible for the high sound levels is partially treated; the test stand Is surrounded by a 14-ft-high acoustically lined, open-topped barrier. Noise is emitted over the top of the partially enclosed test area, which remains open for crane accessibility. Alternatives for reducing the sound levels in the area surrounding the stand narrowed to treating the room surfaces to reduce the effects of reverberation. Hanging baffles, wall and ceiling blanket linings, and spray-on materials were investigated, the latter eventually being selected for implementation. Prior to installation, estimates of the expected acoustical benefit were made on the basis of calculations of the existing and modified room constants.Control DescriptionThe selected treatment consisted of a 1-in.-thick layer of sprayed-on cellulose-fiber-based material called K-13, available from National Cellulose. The material is applied directly to the surface to be coated, where it forms a permanent thermal and acoustic lining. In this installation, approximately 28,000 ft2 of ceiling and wall area were coated at a cost of about $1.10/ft2.ResultsAisle sound levels were reduced, as predicted, from 95 dBA to 90 dBA, as shown in Figure 6.2.1. The manned area surrounding the test stand with above-90-dBA sound levels has been eliminated.
99

OCTAVE BAND CENTER FREQUENCY (Hz)
Figure 6.2.1. Reduced aisle sound levels, as predicted.
CommentsIn addition to having improved the acoustic environment. General Electric also achieved added thermal insulation. Annual savings of about 1 3$/ft2 are estimated in heating costs for the treatment — one of the major reasons for selecting a surface-applied material. Additional benefits include lower maintenance costs (there is no longer the need to paint the 65-ft-high ceiling and wall areas) and improved light reflection and diffusion.
1 0 0

Problem DescriptionThe 800-ton Verson press is a massive unit weighing about 275,000 lb, and mounted on four footings set on heavy concrete piers. Production on this press was automobile chassis steel sections of 1/4-in. steel about 10 in. wide and 8 to 10 ft long. Normal operating speed was 30 strokes/min. Steel stock was fed to the press from a reel. Noise levels were about 120 dB on impact,105 dB at quasi-peak, and 94.5 dBA at operator location, whichwas about 4 ft in front of the press.Problem AnalysisAs a starting point to the total solution of the noise problem, it was decided to vibration-isolate the press and determine the attenuation gained before working on other noise sources, which are not part of this case history.The press was operated in a single shot mode. Hence, quasi-peakreadings for each octave band were more meaningful for ear effect than rms readings (slow A-scale). The peak value is the maximum level reached by the noise, whereas quasi-peak is a continously indicating measure of the average (over 600 msec) of the high levels reached just before the time of indication and is thus lower than the actual peak, but greater than slow A-scale values.Vibration data were recorded for the support foundation, floor near press, adjacent building column, and press structure at the press feet, before and after installation of the isolators.Control DescriptionFrom the data supplied on strokes per minute and press weight, the isolators were specified to be Vibration Dynamics Corporation (of La Grange, Illinois) series BFM micro/level isolators, under the press feet. No price lists are available because each isolation problem is specifically engineered and quoted. Cost was about $2,000 for the isolators, and installation by in-plant labor was probably about $1,000.ResultsAdding isolating pads reduced the vertical acceleration at the pier by 9.5 dB, as shown in Figure 6.3.1» Most of the reduction occurred in the 2-, 4-, and 8-kHz bands. The vertical foot-to- pier acceleration reduction was 30 dB.Figure 6.3.2 shows the horizontal acceleration at the pier.Adding isolation effected a 12-dB reduction in acceleration. The
CASE HISTORY 3: 800-T0N BLANKING PRESS(OSHA Noise Problem)
1 0 1

Figure
Figure
(DTJ
UJ
O5a:UJou<az<ODUJ>
— 1— 1— ■ i I i i »— r 1 ! - — i— r I 1 —T— 1—
^ B O .TED J
\ \\ \
yISOLATI 0 \
<//✓
V I\ \" \>
f/
— *— i __ i__ i__ i i — i— i __1__ 1__ __1__1__ __1__ 1__ i I31.5 63 125 250 500 1000 2000 4000 8000
OCTAVE BAND CENTER FREQUENCY (Hz)
6.3-1* Vertical acceleration on pier, before and after isolation.
mTJin- jUi>UJ-Jzop«ItcUJou«SoZCD
OO
1 1— I 1 1 1 1 1 1 I 1 1 1 I I r “t
EI0LTEDV
/ / ✓
//
X X N.X 1h
\i
/
/ ■ X **
/✓/*/►
/ISO L AT
/ \ED \
>
//
//
— J— •
XN *
i i
SSt
1 i_ __1__ 1__ \— i i I i > i i3i.5 63 125 250 500 1000 2000 4000 8000
OCTAVE BAND CENTER FREQUENCY (Hz)
6.3.2. Horizontal acceleration on pier, before and after isolation.
102

horizontal foot-to-pier acceleration was reduced 36 dB by the isolating pads. Note that it is the vertical motion that is responsible for most of the sound radiated by the floor.Figure 6.3.3 compares the sound pressure level readings at 4 ft before and after isolation (quasi-peak readings, single shot operation). The calculated dBA levels show a reduction of 6 .5 dB in the sound level.Isolators reduced vibration in support foundation, floor, building, column, and pressure structure. It has been found that a primary cause of background, or ambient, noise is the vibration in the building structure, which Is presumed to be caused by the anchor bolt after-shock.Calculation here shows that there was a 105-dBA quasi-peak sound level before Isolation and a 98.5-dBA level after isolation.With a relationship of about 10 dB quasi-peak to rms, a reduction in level from 9^.5 dBA to 88 dBA at operator location has been made. Additional presses will add their own noise and will increase levels to above 90 dBA. Other operational noise sources in the press must be controlled separately.
OCTAVE BAND CENTER FREQUENCY (Hz)
Figure 6.3.3. Quasi-peak levels 4 ft from press foot, before andafter isolation.
103 /

CommentsThe major pitfall of this approach is that airborne sound level reduction from vibration isolation is almost impossible to predict. However, a serious noise control program in such operations should include isolation devices for all presses.A reward is that the die life and maintenance of such machines is significantly increased for presses that are vibration- isolated. Isolators improve operation and maintenance by reducing failures of anchor bolts, foundation failure, or breaking of press feet.
\1 0 4

Problem DescriptionA nail-making machine was operating under conditions causing severe impacts. The vibration was solidly transmitted to a weak concrete floor, which radiated considerable noise. There were 10 machines, operating at 300 strokes/min. Operator sound level was 103.5 dBA.Control DescriptionIt was decided to use vibration-isolating mounts to reduce floor- radiated noise. Because of the repeated shock situation, selection of the isolator followed these rules:
(1) The natural period of isolator plus machine should be much greater than the shock pulse duration(10 msec).
(2) The natural period of isolator plus machine should be less than the time between pulses (200 msec).
Elastomer-type isolators were used, which had a static deflection of 0.1 in. under machine load. This corresponds to a natural period of 100 msec, thus fulfilling the design conditions.ResultsFigure 6.4.1 shows octave-band spectra at the operator’s position after all machines had been vibration-isolated. The sound levels have been reduced about 8.5 dB to 95 dBA, a level still in excess of permitted levels. Additional noise control is needed.CommentsTo maintain the isolation, maintenance people should be warned not to short-circuit the isolators by any solid connection from machine to floor. This short-circuiting can also occur when dirt and grease are allowed to build up around the pods.As a reduction to a sound level of 95 dBA is not considered satisfactory for full-day operator exposure, additional noise reduction could be obtained by the design of a barrier between the major noise source in the machine and the operator. Depending on the needs for vision through the barrier, plywood, lead-loaded vinyl curtain, or Plexiglas could be used. Such a barrier should yield
*From Crocker, M.J. and Hamilton, J.F. 1971- Vibration isolation for machine noise reduction. Sound and Vibration 5 (11): 30.
CASE HISTORY 4: NAIL-MAKING MACHINE*(OSHA Noise Problem)
105

110Q.AOpj? 100
CD
UJ>a.toinLUtraoz13Oi/loz<mLÜ><3.t—Oo
90
80
70
T T 1 - " " I 1 ---- 1 1 “ I ■ T— ----1— T- '•
_ BEFORE
■‘ I '1
.TREATM
- 1 1—
-NT (103.;
“ 1— 1—
dBA)
-------------m
AFTEF
>y
ys
! TREATM ENT (95 di>3AÌ A
V\
V\
>
___ 1___ 1___ -1— i i i t —i— i i — i— i . j ____l—3i.5 63 125 250 500 1000 2000 4000 8000
OCTAVE BAN0CENTER FREQUENCY (H i)
Figure 6.4.1. Operator position sound pressure levels, before and after treatment of nail-making machine.
a reduction of 5 to 8 dB at the operator position. (For calculated design parameters, see Case History 52 and for rule-of- thumb parameters, see Case History 14.) This noise reduction should result in lowering of the sound level to 87 to 90 dBA.Where there is a series of machines, additional reduction of several decibels could be obtained by added room absorption, either in the form of spray-on acoustic absorbent on ceilings and walls or in the form of hanging absorbent baffles from the ceilings.
106

Problem DescriptionIn the folding carton industry, printed sheets are cut on Bobst and similar cutting presses equipped with automatic strippers for removal of waste material between cartons. When the press is operated and is in good mechanical adjustment, there is no serious noise problem. Often, however, noise from the scrap disposal system results in sound levels above 90 dBA on the pressman platform.This popular scrap disposal system (see Figure 6.5.1) uses a horizontal air vane conveyor to move the scrap from under the stripping station to the intake of a centrifugal fan that pushes the scrap to a baler or to bins at a baler in a remote location.The noise problem arises from the pieces of paper scrap striking the sides of the intake conveyor under the press stripper, the sides of the intake hood to the fan, and the fan and outlet ducts. All these contributed noise that resulted in sound levels of over 90 dBA at the pressman station. Depending on amount of scrap and size of pieces, the sound level reached 95 dBA on each stroke of the press, normally making the noise almost continuous.Problem AnalysisIn this type of problem, it was not considered necessary to make octave-band measurements when simple direct sound level readings would tell the story of the obvious problem before and the results after damping. Octave-band sound pressure levels aid in determination of the noise source, but in this case the noise source was known and before-and-after levels could be expressed in dBA.Control DescriptionThe sheet metal of the stripper intake, fan intake from horizontal air vane, the fan, and outlet ducts were all damped (and transmission loss improved) by gluing a layer of lead sheeting to the outside surfaces, using a resin glue recommended by the supplier of the sheeting. Sheeting used was 1/32-in. thick, 2 lb/ft .Other sheet damping materials that are on the market could have been used as effectively, as discussed below.ResultsThe damping of the sheet metal reduced the sound level at the pressman platform to 88 to 90 dBA.
CASE HISTORY 5: PNEUMATIC SCRAP HANDLING(OSHA Noise Problem)
107

topview
vertical discharge duct8 inch diameterdamped to 10 feet from floor
sideview
Figure 6.5.1. Scrap handling system for cutting press.
108

The concept of using sheet lead to damp the sheet metal ducts came from supplier literature citing successful sheet metal damping on ducts and fans and other surfaces. (Cost is about $0.90/ft2.)For less damping, a 1 lb/ft2 material may be used at $0.46/ft2.For minimum damping, stiff roofing felt may do. For even greater damping, there are many products on the market in sheet form and tape form. Suppliers can be consulted on specific problems; prices range from $1 . 5 0 to $3 .50/ft2.For very high vibration and sound levels, a further duct treatment step would be lagging, which is a spring-absorber-mass combination of 1 to 3 in. of resilient acoustic absorbing material (glass fiber or polyurethane) with a heavy cover sound barrier of sheet lead or lead-loaded vinyl sheeting over the entire surface.
109

This case was taken from published data,* because of the importance of illustrating the method for other applications.Problem DescriptionChutes for conveying small parts can radiate much noise from the impact of parts on the sheet metal of the chute. The noise (for a given part) can be reduced by keeping to a minimum the distance the part must fall to the chute. For reducing the remaining noise, the chute can be stiffened and damped.Control DescriptionConstrained layer damping is used, in which the treatment can be placed on either the parts side or the underside of the chute.If placed on the parts side, the metal layer should be wear- resistant to the impacting parts. In this example, 30-caliber cartridge cases were carried in the chute shown in Figure 6.6.1.
CASE HISTORY 6 : PARTS CONVEYING CHUTE(OSHA N o i s e P r o b l e m )
Figure 6.6.1. Chute for conveying cartridge cases.
The bottom of the chute was 14-gauge steel, which was lined with 0.035-in. cardboard and then covered with a wear plate of 20- gauge galvanized steel. Rubber deflector plates were positioned to funnel parts to the center of the chute, so that they would not hit the untreated sides of the chute.ResultsFigure 6.6.2 shows the spectra measured 3 ft to one side of the chute. The sound level has been reduced from 88 dBA to 78 dBA, a decrease of 10 dB. Greater reduction could have been obtained
*Cudworth, A.L. 1959» Field and laboratory example of industrial noise control. Noise Control 5 (1): 39-
110

oQ.4.OOJCDTJ- iID>Ul—)OJtrz>tototxJQ:q.ozotooz<CDÜJ
Oo
31.5 63 125 250 500 1000 2000 4000 8000OCTAVE BAND CENTER FREQUENCY (Hz)
Figure 6.6.2. Sound pressure levels measured 3 ft from chute(converted from old octave-band designations).
if multiple layers of thinner cardboard were used (in solid contact with the cover sheet). Still better would be replacement of the cardboard by commercially available damping materials specifically formulated for constrained layer use.CommentsMuch noise still comes out of the top of the conveyor. A cover over it, lined with absorbent, should reduce the noise an additional 5 to 10 dB. Prior to any noise control effort, the relative amounts of noise from top and bottom should be determined.
— 1— 1— 1 T 1 1 ' 1 1'
UNTREA'
I I—
r E D ^
I 1 " ! I 1 I
V
XS
*
\
---------- - — <TREATE: d
V\
\\
__ 1__ 1__ __ 1__i___ 1 1 i i 1 —L i _ i i l i i.
I l l

Problem DescriptionIn the molding room, primary noise sources are scrap grinders and plastic granulators. The noise has increased during the past few years because of the growth in the number of grinders and increasing toughness of the newer plastics.Problem AnalysisSound level maxima of 125 dBA in the initial grinding phase have been recorded, and 100 dBA is common.Control DescriptionAlthough the optimum mechanical conditions of the plastics scrap grinder, such as sharp blades, proper screen size, blade-to-screen clearance, and proper feeding procedures, help reduce grinder noise on existing equipment, this alone could not bring the unit within acceptable noise limits. Much of the noise came from resonant excitation of metal panels.A damping material was applied to all surfaces; hopper, interiors of pedestals, stands, and covers. In general, a 1/4-in. coating has been satisfactory for most grinders from bench models to 18- x 30-in. throat grinders.ResultsThe before-and-after results of the treatment, shown in Figure6.7.1 (each for one load of 4 lb of polycarbonate), bring sound levels down to the OSHA criterion, reducing the maximum sound level from 100 dBA to a range of 88 dBA to 90 dBA.CommentSome manufacturers now offer quieted versions of plastics pelletizers for sale.
CASE HISTORY 7: PLASTICS SCRAP GRINDER*(OSHA Noise Problem)
*Morse, A.R. July 19 6 8. Plastic Technology.

OCT
AVE
BAND
SO
UND
PRES
SUR
E LE
VEL
(dB
re 2
0 ̂
Pa)
OCTAVE B A N D C E N TE R FREQUENCY ( H z )
Figure 6.7.1. Plastics grinder; range óf sound pressure levelsbefore and after treatment.
113

Elliott H. Berger E-A-R® Corporation 7911 Zionsville Road Indianapolis, Indiana 46268 (317) 293-1111This case history describes noise control efforts for a source of industrial noise common to many industries — that of assembly components being dropped into steel plate hoppers.Problem DescriptionThe hoppers in this case were open-topped and a little over 63 in. long x 40 in. wide x 21 in. high on one long side, sloping down to 38 in. high on the other long side. Hopper panels are 1/4-in. steel, except for the lower 17 in. of the widest long side, where 1/2-in. steel doors are employed to enable an operator to remove parts. The operator works at a product assembly station positioned between two hoppers, each of which is a meter away from the operator1s ears. - In this case, the project sponsor sought to reduce the operator noise exposure, although no specific noise reduction objective was stated.Problem AnalysisThe hopper noise, clearly associated with impacts of metal parts onto the hopper surfaces, can only be generated by hopper metals and assembly parts being set into vibration for the force of the impacts. The E-A-R ® Corporation, a manufacturer of damping materials, was called upon to evaluate the potential benefit of treating the hopper panels with damping materials. The subsequent investigation consisted of making noise measurements on an untreated and a treated hopper. Figure 6.8.1 shows the time history of the untreated hopper noise at the operatorfs position. Here, the unweighted sound pressure is displayed, and the pen tracing corresponds approximately to what a sound level meter set to fast response would indicate. Because the noise occurrence is brief, tape recordings were made for detailed laboratory analysis.The tape recordings were reduced in a laboratory to obtain narrowband analyses of the noise emissions of the treated and untreated hoppers for purposes of comparison.Control DescriptionTreatment consisted of covering the exterior of one hopper with a layer of 3/l6-in. E-A-R ® C-2003 damping material that, in turn, was covered with an outer layer of 1/8-in. steel. Bostik adhesive was used to bond the damping material to both steel surfaces. The outer perimeter of the steel cover plate, which
CASE HISTORY 8: HOPPER NOISE(OSHA N o i s e P r o b l e m )
1 1 4

Figure 6.8.1. Overall sound pressure level vs time of noisecaused by parts falling into undamped hopper No. 10471.
slightly overhung the damping layer, was welded around the edges to the base plate. The entire sandwich-like treatment constituted what is called a constrained layer damping system — an efficient system for dissipating vibrational energy. One side of the hopper — the side with the door — was left entirely untreated.ResultsMeasured noise reduction varied according to frequency but amounted to a 9-dB reduction of the sound level _ from 122 dBA to 113 dBA during the 2-sec interval of maximum noise output. Figure 6.8.2 shows the reductions obtained in 1/3- octave bands. The measured reduction is limited mainly by sounds of vibrating parts escaping into the’ area from the open hopper t o p .
CommentsApplication of sheets of damping material constrained by an outer layer similar to the base structure material can be an effective noise control in numerous other situations where products strike structures and excite vibrations. For example, products are
115

5 0 fc * " - 1 ■■ ■ l l —25 100 IK 10 K 20K
ONE-THIRD OCTAVE BAND FREQUENCY (Hz)
Figure 6.8.2. Noise reduction from damping.
often transported through plants by conveyors. Sheet metal deflectors, bucket elevators, chutes, and other components of the conveyance system are likely candidates for damping treatments.Extensional damping, where the damping material is bonded to the base structure but is not covered by a constraining layer, may also be effective and is simpler to apply. More damping material would be required, however, and the damping material would be left exposed (a possible source of concern to industries such as food processors).*Noise reduction obtainable by such treatment can be predicted by measurement of the "loss factor" of the untreated surface and by estimation of the "loss factor" of the treated surface. The former is accomplished by measuring the decay in acceleration levels of the noise-radiating surface and the latter by using the treated surface materials 1 dynamic properties and the appropriate theory.Other treatments that might have equal benefit to damping in special situations include:
Minimizing the force of impacts by reducing free-fall distance of the parts causing impact;
•Generally, a layer of damping material at least as thick as the base structure is used.

Minimizing the force of impacts by "padding” the struck surfaces, wear factors permitting;Reducing the noise-radiating area of the impacted structure,e.g., by using perforated or expanded sheet metal instead ofsolid sheets.
Damping materials alter the after-the-fact vibrational response of a system to an externally applied force. ThUs, application of damping material will reduce the tendency of a surface to ring after it is struck or will retard the propagation of a disturbance travelling away from its point of origin. Damping materials are useful in quieting the ringing of impacted surfaces or in minimizing the area of noise radiation. Note, however, that damping materials have only a small effect on the during-the-fact vibrations response of a system to an externally applied force. If, then, your noise problem is caused by a "forced" vibration of asurface (e.g., vibration of a pipe wall caused by turbulence ofthe contained fluid), damping materials are inappropriate as a remedy and you should look for other ways to ameliorate the problem (e.g., improve the transmission loss of the pipe wall by wrapping it) (pp. 68-69).
117

Robert C. Niles Uniroyal, Inc.Oxford Management, and Research Center Middlebury, Connecticut 067^9 (203) 573-2000Problem DescriptionAt the Uniroyal tire manufacturing facility, in Opelika, Alabama, noise to which a "Green Tire Truck Tugger" operator is exposed was measured and found excessive under OSHA regulations. The employee operates a "stand-up" electric-powered towing machine that moves green tires from the tire building machines to the spray machine and returns with empty trucks from the curing process.Problem AnalysisThe problem is the noise caused by hauling the empty trucks. The "truck" that carries the tires consists of a metal frame withhollow metal elliptical prongs that hold the green tires (Figure6.9*1). When the "truck" is empty, the prongs vibrate and act like a sounding drum, emitting a loud noise. The loudest noises occurred on concrete floors because of unevenness caused by globs of rubber on the floor. Metal plate aisles were quieter.Noise at the operatorrs ear measured 100 dBA when he was towingthe empty trucks — a sound level that exceeds the OSHA allowable limit. In addition to the operator exposure, adjacent employees are subjected without warning to a loud intermittent noise, which is motivationally depressant.Control DescriptionThe prongs were filled with a rigid foam, developed by Rubicon at Naugatuck through the cooperation of Mr. Thomas Haggerty.It is an MDI, polyurethane foam, formula RIA Nos. 553A and 553B. The product is shipped as liquid foam in two parts, which are combined on the job. Cost is estimated at about $1 per kilogram, depending upon quantity and comes to about $10 per truck.As a company, Uniroyal does not furnish the material directly.For the supplier nearest the use point, please contact Mr.Thomas Haggerty at the Uniroyal Naugatuck Plant, Phone: (203)729-52^1, extension 225. The formula is fireproof and nontoxic.ResultsThe original and after-treatment noise data were taken by riding the tugger next to the operator. Both sets of data were taken in
CASE HISTORY 9: ELECTRIC-POWERED TOWING MACHINE(OSHA Noise Problem)
118

Figure 6.9-1- Green tire storage truck.

a warehouse in order to ensure low ambient noise conditions. The same tugger, same route, and ambient sound levels were used for both the "before" and "after" tests.The noise abatement program of filling the prongs with a rigid foam resulted in a 10-dB reduction, adequate to alleviate the noise problem as defined by OSHA.
120

Problem DescriptionIn forming operations, large blanking presses are used. The ram, which is like a connecting rod in a reciprocating engine, is hollow. The forming die runs in grooves on the side of the press, like a piston In the cylinder of a reciprocating engine, and completely closes off the end of the hollow ram. There are slots in the ram that are used normally when the press is used in blanking operations to extricate the work from the die, similar to removal of a cookie from a cookie cutter. These slots are in the side of the ram (see Figure 6.10.1). When the press is
CASE HISTORY 10: BLANKING PRESS(OSHA Noise Problem)
ram slot cover ptate
weatherstripping '< cementXram plate (typical)
Figure 6.10.1. Method used to cover slots in blanking press ram.
1 2 1

being used in the forming mode, these slots are not required, and when the die "snaps through," it cuts off the work. This gives rise to high sound levels.Problem AnalysisIn a vibration-isolated forming press, operator position sound levels were La = 94 dBA, Lq = 100 dBC in the "slow" reading position. An octave-band measurement disclosed that sound pressure levels in the 250-, 500-, 1000-, and 2000-Hz bands were much higher than in other bands. This ringing noise, which hada maximum near 2 kHz, was easily discernible by ear. By carefullistening, it was determined that the source was radiation from the slots in the ram.The technical conclusion was that the hollow ram interior, with the slots, was essentially behaving as a shock-excited Helmholtz resonator. A Helmholtz resonator is a closed volume of air connected by a tube to the outside air; it resonates at various frequencies (as when air is blown across a glass jug opening).The one approach that would obviously work would be to fill the cavity in the ram with rubber-like material. Another approach would be simply to plug the slots, thus keeping the noise inside the ram. The second approach was chosen because it was easy to try, inexpensive to test, and allowed the machine to be reconverted easily to a blanking operation.Control DescriptionThe ram slots were each covered with a plywood plate sealed with a Neoprene gasket, as shown in Figure 6.10.1. Weatherstripping (nonhardening sealant) was used to prevent small leaks. These control measures were easily installed.ResultsThe first attempt was satisfactory and achieved a 6-dB reduction of quasi-peak sound level from 99 to 93 dBA. See Figure 6.10.2. Applying this to the observed slow A-reading of 95 dBA yields the observed 88 dBA.This case history demonstrates both the simplicity (the solution) and the complexity (the resonator) of noise control. It also demonstrates a more subtle feature: Simple solutions areworth trying if there is a good physical reason for them.CommentsThe obvious pitfall here would be to apply this solution to a press that had not first been vibration-isolated. If the press
122

OCTAVE BAND CENTER FREQUENCY (Hz)
Figure 6.10.2. Quasi-peak readings of blanking press after ramringing was contained.
were on other than piers isolated from the building, or had sheet metal guards, one would probably not have been able to measure any improvement. Filling the ram cavity would have been another pitfall. It would have accomplished the noise reduction, but would have prevented easy reconversion of the press to blanking operation.
123

Problem DescriptionCord manufacturers use a machine called a spinning frame to convert yarn to cord. In the process of spinning this yarn into cord or thread, lint or small pieces of yarn fall away. At each spinning station along the frame, air suction removes this lint by a system that works essentially like a vacuum cleaner. This system requires a rather large air-moving system for each spinning frame, and the noise created by these air-moving systems causes the ambient sound levels to range from 88 to 93 dBA at the work stations throughout this system. This unit was a Whitins Model M-2.Problem AnalysisMeasurements were made with a Type 2 sound level meter. At about1 in. from the air exhaust of the lint scavenger system, the sound levels were: La = 100 dBA, Lq = 100 dBC. The major noisesource was unquestionably the air escaping from the lint removal system, as was verified by the fact that La = Lc» This problem is common in high-velocity air systems.Control DescriptionThe obvious solution to a problem of this nature is to use a muffler or an acoustical isolator. However, a more fundamental approach considered was to slow the escaping air at the scavenger exhaust. This slowing could be accomplished by simply giving the exhaust vent a bigger open area, as shown in Figure 6.11.1. The velocity of the escaping air was estimated to be 115 ft/sec (the fan moved 1800 cfm through an area of about 37 in.2).Simply to open the fan cover was not practical, since the air must be directed upward.The reason this control approach is a good one to consider can be best summarized in the following relationship:
X - 10 l o g 10 ( v 0/ v n ) 5 ,where X is the reduction in decibels, V 0 is the original air velocity, and Vn is the new air velocity.This equation is widely used by noise control engineers to estimate the relative noise reduction if air stream slowdown is possible.
CASE HISTORY 1 1 : SPINNING FRAME(OSHA N o i s e P r o b l e m )
1 2 4

Figure 6.11.1. Air exhaust vent modification for spinning machinenoise control.
125

The design increased the area through which the air exhausted by a factor of 10: from 0.26 ft2 to 2.6 ft2. Because the flow ispractically imcompressible, V /Vn = 10~l and X = 50 dB reduction. However, the net noise reduction will ordinarily be less because other noise’sources are still present. A rule-of-thumb is to expect a useful reduction of, at most, 10 dB if a major source is completed removed. The chief exception to this rule is the intense and often high-frequency pure-tone single source, such as a whistle, steam vent, or automatic control valve.ResuitsThe noise was measured, with all but one fan cover unchanged; it was = 93 dBA and Lc - 94 dBC, a reduction of 7 dB. It is thought that this reduction fairly well represents the background level without this fan running.CommentsThe most common pitfall in a treatment of this kind is to attempt to do a makeshift or sloppy final job. Care must be taken for the final result to be effective. A professional metal shop can fabricate the device shown in Figure 6.11.1 easily, in quantity, and possibly less expensively than it could be fabricated in your plant. The rubber gaskets and sealant are both important to the overall effectiveness of the job.
126

Problem DescriptionThe sheeter, starting from large rolls of boxboard about 6 ft in diameter, cuts the web to length with a rotary knife that can be adjusted to rotary speed, and therefore sheet length, by means of variable speed drive (Reeves Drive). The cut sheets are delivered to pallet. The speed is about 700 ft/min.Problem AnalysisAt the operator control station near the sheeter (see Figure 6.12.1), the sound level was found to be 93 dBA. Close-in probe
CASE HISTORY 12: BOXBOARD SHEETER(OSHA Noise Problem)
Figure 6.12.1. Floorplan of sheeter for boxboard.readings at the variable speed drive were high, indicating that the drive is a major noise source. Readings were as follows:
96 dBA close to front drive guard, in aisle98 dBA close to front drive guard, in aisle 3105—107 dBA close to front drive vent openings.
The drive box enclosure was a steel shell 6 ft high, 3-5 ft wide, and 3.5 ft deep, having two vent openings in the side for natural air cooling (see Figure 6.12.2).Other operator locations that were far from the drive were checked:
90 dBA: operator at delivery88 dBA: operator at rollstand in feed (see Figure 6.12,3
for general layout).
1 2 ?

Figure 6.12.2. Sheeter drive box enclosure.
Figure 6.12.3. Layout of sheeter and operators.
From the close-in readings, the drive was determined to be the major noise source and not the roll unwind stands, rotary cutter, or delivery belts to finished pallet of boxboard.Control DescriptionTo reduce the drive noise within the steel box enclosure, it was decided to line the interior walls with an acoustic absorbing
128

polyurethane foam with a layer of 0.017-in.-thick sheet lead to provide damping of the steel surface panels. To reduce the noise coming out of the air vents, an acoustic trap was designed to absorb the noise at the vents but allow full normal air circulation. This acoustic trap is shown in Figure 6.12.2.ResultsThe sound level at the operator control panel near the drive unit was found to be 89 dBA, reduced from 93 dBA. In addition, some reduction was obtained in other operator positions:
86—87 from 90 dBA, operator at delivery86 dBA from 88 dBA, operator at roll stand.
Sound levels close-in to the vents were reduced to 94 dBA from 105 dBA; this is not an operator position.Sound-absorbing polyurethane foam with a. lead septum designed for combined damping and absorption is available from various suppliers at less than $4/ft; material cost was about $400, and in- house labor to glue in place and fabricate a holder for the sound trap was about another $400; total cost was about $800.CommentsWithout close-in reading to locate the drive unit as the major noise source, the conclusion could have been that the entire sheeter, including the drive unit, must be installed in an acoustic enclosure, and a great deal more money would have been spent for the solution.This kind of noise reduction is typically not as satisfactory as one would like. The major problem that can arise is the existence of other direct sound paths from the knives to the operator.Another pitfall for sheeters is the knife design. Some of the older models have straight knives instead of an angular striking or cutting edge. Straight knife sheeters will probably require an acoustic-absorbent-lined metal or wood hood over the knife assembly and perhaps under the knife assembly.
129

Rene Boisvert Biddeford Textile Company2 Main Street Biddeford, Maine 04005 (207) 282-3376Problem DescriptionCarding machines are used in the textile industry in the process of making thread from bulk cotton or wool. The cleaned raw material is fed into the carding machine, which first combs the material to orient the fibers properly, forming a weak sheet of material in the process. The sheet is then condensed into filament form by the action of close-fitting, horizontal counter- reciprocating beds called aprons.It is the mechanism driving the aprons that causes the noise problem here: A vertical eccentric drive shaft moves the severaltiers of aprons back and forth, much as the crankshaft of an automobile engine drives pistons back and forth. In this case, however, there are numerous mechanical impacts — all making noise — that occur at the linkages and supports between the drive- shaft and the aprons, where metal washers are employed as spacer elements. Operators work all around the carding machines, each operator tending several, making sure they function smoothly, supplying raw material, removing product, and keeping the area clean.Problem AnalysisAnalysis of the time history of individual operator noise exposures revealed (1) that OSHA time-weighted noise exposures were marginally exceeding allowable limits and (2) that the greater part of the noise exposure occurred at the discharge ends, where sound levels range from about 91 dBA at mid-aisle positions to about 96 dBA at operator positions nearest the drive- shafts. Noise conditions there were audibly dominated by the mechanical clacking at the apron drive mechanism. Close-In to the drive mechanism, sound pressure levels, shown and compared with mid-aisle data and a 90-dBA criterion curve in Figure6.13.1, verified that conclusion. Although sheet metal guarding, providing physical protection from the drive mechanism, surrounded three sides of the drive, the guarding provided little in the way of containment of the clacking sounds; most of the sound energy simply reflected from the guard surfaces and thence contributed to the reverberant sound field (near the
CASE HISTORY 13: CARDING MACHINES(OSHA Noise Problem)
130

OCTAVE BAND CENTER FREQUENCY (Hz)
Figure 6.13.1. Sound pressure levels at carding machines.
guarding and on the operator's side, the sheet metal acted as a sound shield, but it is the reverberant energy that is important here).Although a quieter drive mechanism might have been developed, Biddeford Textile also knew that the original equipment spacers provided much quieter, machine operation. The problem was that the original equipment spacers were no longer available. Biddeford Textile opted for finding a suitable softer replacement washer. After experimenting with nylon and Teflon washers that did not stand up to service requirements, the company found a fiber washer available from B&S Machine Co., 2420 N. Chester St., Gastonia, NC 28052, (704) 864-6796, that provided the necessary properties.ResultsSound levels at operator positions nearest the driveshaft after installation of the fiber washers are now no higher than 87 dBA, and operator noise exposures are well within OSHA-stipulated limits.
131
TECHNIQUES THAT INVOLVE SIGNIFICANT EQUIPMENT MODIFICATIONBarrier Treatments (see Shields and Barriers)
Case History I k : Folding Carton Packing Stations,Air Hammer Noise
Case History 15 Printing and Cutting PressCase History 16 Straight-and-Cut MachineCase History 17 Impact Trimming MachineCase History 18 TransformerCase History 19 TransformerCase History 20 Surface GrinderCase History 21 Printer
Enclosure Treatments (see Enclosures)Case History 22 Metal Cut-off SawCase History 23 Wood PlanerCase History 2k Punch PressCase History 25 Punch PressCase History 26 Punch PressCase History 27 Braiding MachineCase History 28 Refrigeration TrucksCase History 29 Spiral Vibratory ElevatorCase History 30 Motor Generator SetCase History 31 Filling MachineCase History 32 GearboxCase History 33 Steam Generator Feed PumpCase History 3k Muffler Shell NoiseCase History 35 Concrete Block-Making Machine
132

Case History 37- Pneumatic Scrap Handling Ducts Muffler Treatments (see Silencers)
Wrapping/Lagging Treatments (see Wrapping/Lagging)Case History 36: Jordan Refiners
Case History 38: Blood Plasma CentrifugeCase History 39: Pneumatic MotorsCase History 40: Dewatering PumpCase History 41: Induced-Draft FanCase History 42: Process Steam Boiler FansCase History 43: Gas Turbine GeneratorCase History 44: Jet Engine CompressorCase History 45: Jet Engine Test CellCase History 46: Pneumatic Grinder
133

CASE HISTORY 14: FOLDING CARTON PACKING STATIONS, AIR HAMMERNOISE(OSHA Noise Problem)
Problem DescriptionIn the manufacture of folding cartons, the individual cartons are cut, and the cut sheets are stacked by the cutting press on a pallet. To deliver the multiple sheets from the press, the cartons are held together with a nick or uncut portion. When stacked, the individual cartons are separated by stripping with an air-driven chisel which breaks the nicks and frees an entire stack. When no additional operations are needed, these stacks are packed in cases for shipment.Air hammers/chisels produce noise that has not yet been eliminated by equipment manufacturers. Currently available air hammer mufflers do not reduce the noise to an acceptable level. The air hammer operator therefore must wear ear protection. The problem in this case was to protect other workers (packers) from the air hammer noise. A typical production air hammer stripping and packing set-up is shown in Figure 6.14.1.The production sequence for this operation is for the stripper to air hammer a stack of cartons (precounted by the cutting press) and place them on the conveyor at Point C. The packer, at the end of conveyor E, prepares the case, packs the stacks of cartons, seals, labels, and stacks the finished pack on a delivery skid.Two packers are required to handle the output from one stripper. The stripper is actually using the air hammer about 50$ of his time, with the balance of the time used in stacking or preparing the load. Thus, he can get some relief from continuous use of his ear muffs by hanging them around his neck while not actually using the hammer. It is easier to promote the use of ear muffs when needed if the operator can get some relief when muffs are not needed.Problem AnalysisAs frequency analysis is not critical in this problem, no octave- band readings were made; all data were based on A and C scale readings from an acceptable Type 2 sound level meter.Control DescriptionIt was decided to protect the packers from the air hammer stripping noise by using a barrier wall. A convenient rule-of-thumb is that useful protection is afforded by the barrier wall beyond 30 degrees into the acoustical shadow. Note that in Figure6.14.1, the packers behind a wall 10 ft long and 6 ft high are within this protected zone in both top view and side view of the operation.
13^

packers
ceiling
> 30° packer ear levelstripper
Figure 6.14.1. Air hammer stripper and packer line.
The barrier will need be no better acoustically than the attenuation afforded around the sides and top of the wall. Therefore, the wall was fabricated with a 2- x 4-in. frame faced on both sides by 1/4-in. plywood for a simple sturdy barrier wall.If there had been any reason to reduce noise reflections from the noise source side, this side could have been faced with sound- absorbing acoustic materials.The rule-of-thumb of aiming for the packer to be well within the 30-degree line from the acoustic shadow line was used in this case. Other means of estimating the attenuation of barrier walls are covered by Beranek* in Noise and Vibration Control, p. 178, and illustrated in Figure 6.14.2. The attenuation calculated for this barrier wall ranges from 10 to 15-dB, depending on the
*Beranek, L.L. 1971. Noise and Vibration Control. McGraw-Hill, New York, N.Y.
135

&<o'/: /
/
/
msource
/
® ~ 10 feet
A40 ^ 1 - -
barrier wall
N = ^ (A + B — D)
N = | ( 5 .5 + 10 -14 )
N -i
250 Hz 500 Hz 1000 Hz 2000 Hz
X 4.8 2.4 1.2 0.6
N 0.625 1.25 2.5 5
dB 10 11 13 15
Source: Beranek, Noise and Vibration Control, page 178.
Figure 6.14.2. Barrier wall theory.
wavelength. This agreed with the measured attenuation of 7 to 12 dB and the noise reduction from the 92- to 97-dBA range to about the 85-dBA average measured at the packers ear level.The barrier -costs were:
1/4-in. plywood, 2 sides, 5 sheets, 4x8; 160 ft2 $30.002x4 in. framing; 60 ft 10.00In-plant labor 60.00Approximate total $100.00
CommentsIn this installation, there were, fortunately, no low ceilings, which would have established a serious sound reflection problem and defeated the barrier wall. Barrier walls will not give good results in a highly reverberant, low-ceilinged room. If there had been a low ceiling, useful noise reduction would still have been possible by adding sound-absorbing material at the reflecting portion on the ceiling (about 12 ft over the barrier wall and the noise source). The amount of attenuation gained is easily estimated by using the ratio of absorption of new material
136

to that of the existing ceiling. Ceiling reflection is a major pitfall of the use of barrier walls Indoors. The design of the wall alone Is based on freefield conditions.
137

CASE HISTORY 15: PRINTING AND CUTTING PRESS(OSHA Noise Problem)
Problem DescriptionIn the manufacture of folding car’tons, one method is to print the cartons in a web, using multiple gravure color stations and feeding the printed web into a reciprocation cutting press.The reciprocation cutting press, using a rule die, cuts the cartons and delivers cut cartons to a delivery belt. The rotary printing operation was not noisy, but the cutting press noise from the cutting head was in the range of 93 to 95 dBA at the normal operator position. The take-off operators were far enough from the noise source so that noise at their station was below 90 dBA.Control DescriptionFigure 6.15.1 shows the operator location, control station, cutting head, and carton delivery. To reduce the noise of the cutter head at the operator position, a barrier wall was used. As access to the unit for job changes and maintenance was important, the barrier wall was specified to be lead-loaded vinyl sound stopper curtain material, available on a made-to-order basis and designed tô be portable.The curtain unit ordered was 7 ft high and 8 ft long, with a 10- x 20-in. viewing port, since the attenuation required for OSHA compliance was only about 5 dB minimum.
take-off
skids
\OO
drive
[cut head
delivery
> 3 0 °
' f i :pressman
noise source
console
sound barrier curtain, 7 feet high, 8 feet long
Figure 6.15.1- Top view of in-line gravure-cut press with soundbarrier curtain.
138

ResultsThe noise at the operator control console was reduced from the 93- to 95-dBA range to an 86- to 87-dBA range. The operator performed inspection and adjustment at the cutter head for a few hours daily, as required, hut was still within the time exposure limits.Total cost, using a lead-loaded vinyl curtain at about $4/ft2, was about $300, including hanging fasteners, viewing window in curtain, and pipe supports.CommentsTo get any attenuation from barrier walls, the receiver must be located with respect to the noise source so as to be beyond 30 degrees into the acoustical shadow line, as a rule-of-thumb.Note that in the top view, Figure 6.15.1, the pressman is just within this line. In Figure 6.15-2, showing over-the-wall vertical plane limitations of this same rule-of-thumb, the pressman is well within this limiting area. The curtain met the objective, since only a small attenuation of about 5 to 6 dB was required and the actual real attenuation was 7 to 8 dB.More attenuation would require a larger curtain.A design pitfall in barrier walls Is that if room conditions are too reverberant and the ceiling is too low, the barrier wall is bypassed. Low ceiling reflections can be overcome by adding an absorbent to the reflecting area of the ceiling over the barrier wall.In Case History 16, a relatively permanent wood construction wall was used. This case required a different treatment because regular access was required to the cutter head between the console and the press. The freestanding, easily movable curtain wall provided both protection during operation and easy access to the press for set up.
noise source
barrier
ressman ear level
Figure 6.15.2. Side view of in-line gravure-cut press with soundbarrier curtain.

Problem DescriptionThe straight-and-cut machine straightens heavy-gauge wire in an in-feed to a cutoff unit set to cut repeat lengths, resulting in sound levels of 92 dBA at the operator position. Tne client in this case sought to reduce the sound level to a maximum of 85 dBA at the operator position.Problem AnalysisFigures 6.16.1 and 6.16.2 are close-in octave-band analyses of the diagnostic measurements made in front of the clutch mechanism. In Figure 6.16.1, curve A shows peak cutting levels, and curve B is the slow response of the same cutting sound pressure levels (wide separation indicates impact noise). Curve C is the idling, noncutting machine sound level. The differences indicate dominance of the total spectrum by the cutting noise.In Figure 6.16.2, curves D and E exceed curves A and B, indicating some directionality of the cutting noise.Figures 6.16.3 and 6.16.4 are octave-band analyses made at the operator position. Most of the operator time is represented by Figure 6.16.3» with the cutting cycle sound level at 92 dBA (idling cycle at only 83 dBA), indicating that the dominant noise source of the clutch cutter mechanism is the same form as in the close-in diagnostic measurements. Comparison of the measured sound pressure levels with the 90-dBA criterion indicates the required attenuation is between 5 and 11 dB in the 1000- to 8000-Hz octave bands.Control DescriptionOn the basis of discussions with management, it was determined that noise control should take the form of a barrier wall that would block the sound path from the cutting assembly to the operator, rather than machine redesign.Barrier materials for obtaining the required attenuation were 1/4-in. plywood, with 1/8- to 1/4-in. Plexiglas for viewing ports where necessary. The barrier wall was extended 26 in. past the extremities of the area encompassed by the cutter and was close to the cutter, about 6 to 8 in. away. The barrier was hung in place, supported by chains from overhead. In addition, an absorbent layer was hooked to the barrier on both sides. To prevent clogging of absorbent, the 1-in. polyurethane foam absorbent was supplied with Mylar facing. See Figure 6.16.5-
CASE HISTORY 16: STRAIGHT-AND-CUT MACHINES(OSHA Noise Problem)

OCT
AVE
BAND
SO
UND
PRES
SUR
E LE
VEL
(dB
re 20
m
Pa)
OCTAVE BANDCENTER FREQUENCY (Hz)
Figure 6.16.1. Straight-and-cut machine: close-in measurementnear west side of clutch cutter mechanism (1.2 m above floor, 0.5 m from cutter).
OCTAVE BAN0CENT£R FREQUENCY (H j )
Figure 6.16.2. Straight-and-cut machine: close-in measurementnear east side of clutch cutter mechanism (1.2 m above floor, 0.5 m from cutter).
1 4 1

Figure
Figure
OCTAVE BAND CENTER FREQUENCY ( H i )
6.16.3- Straight-and-cut machine: operator’s nearfieldexposure.ItO
aoCVJ ? 100 a)
£ 90 3 if)IS)LUaaa§ 80 o(Aa
<3CD
5 T O•Q*-<-)o
— i— r i i i i ! " T 1 1 ! 1 1 "I ! —1—
rriNG (89 d B A I *
\ 1
r
JNG (83 dBA) r / / i
X*
— i i i i i i — L 1 i i __1__1__ — L 1 i i31.5 63 125 250 500 1000 2000 4000 8000
OCTAVE BAND CENTER FREQUENCY (H z )
6,16.4. Straight-and-cut machine: operator’s farfieldexposure.
1 4 2

Figure 6.16.5. Barrier wall for straight-and-cut machine.
Normally, the noise absorbent for barriers is used only on the machine noise source side. In this case, however, noise absorbent was used on the operator side of the barrier as well, to reduce sound field build-up in the space between barriers. With the barrier close to the cutter, the operator would be within the safe sound shadow area — the area beyond a line at least 30 degrees from the edge of the acoustical shadow line.As the barrier was built in-plant, no actual costs are available, but material costs are estimated at about $100.ResultsThe cutting cycle sound levels at the operator location were reduced from 92 dBA to 85 dBA, a 7-dB reduction in sound level. Idle cycle sound level was reduced from 83 dBA to 76 dBA.CommentsBarriers are easy to remove by the operator for many reasons, real and imaginary, and use must be maintained by supervision.
143

Location of an effective portable barrier must be standardized so that the barrier is not bypassed. Barriers can be bypassed by noise reflections from a low ceiling. If this problem had existed in this case, a section of the ceiling above and about 4 ft on each side of the barrier could have been treated with absorbing material.
144

Paul Jennings Bellofram Corporation Blanchard RoadBurlington, Massachusetts 01803 ( 617) 272-2100Problem DescriptionEight George Knight air impact trimming machines, located close together In a large production area, performed the trimming function once every 5 to 6 sec. An operator sat directly in front of each machine, and the sound level at each operator’s station varied between 80 and 99 dBA.The trimming machines cut fabric-reinforced diaphragms to specified configurations. An air-actuated ram accelerates a cutting blade against a fixed anvil (the blade and anvil are constrained in a die set with metal stops so that the blade and anvil just make contact), creating a nipping action that trims the diaphragm at impact.Since the eight workers were located in close proximity to each other, they received noise not only from their own machines (up to 97 dBA) but also from their neighbors' machines (up to 95 dBA). Equivalent daily exposures (time-averaged sound levels) for individual operators were found to be 91 to 92 dBA, marginally exceeding what is allowed under the OSHA regulation and indicating that only a small noise reduction was required.Problem AnalysisNo detailed measurements were performed because it was evident that the noise was being generated by the impacts of each of the trimming machines.Examination of the situation revealed that the dominant portion of the noise exposure incurred by each operator was sound radiated directly to him from each machine. Since the amount of noise reduction required was small, it was clear that some redirecting of the machine-generated sound would be beneficial.Control DescriptionThe solution implemented consisted partly of partitions constructed around each work station, as shown in Figure 6.17.1* The partitions were about 8 ft high and were made of 3/4-in. plywood covered on both sides with 1-in.-thick glass fiber boards faced with open-weave burlap. In addition to the partitions, see- through safety shields were placed between the contact point of each machine and the operator.
CASE HISTORY 17: IMPACT TRIMMING MACHINES(OSHA Noise Problem)
1 4 5

MACHINES
OPERATOR̂ f ja !11j
j \ .̂ OPERATOR! D11l_
c ! 11[d11
< a i \!! BARRIER. _______ , 1
<D|i*
i n »111 BARRIER WALLFigure 6.17.1. Knight trim department layout of acoustical
barriers.
ResultsMeasurements made subsequent to the final installation showed that the average sound level at operator stations was reduced from 91/92 dBA to 8 5 / 8 6 dBA. Maximum sound levels are now no more than 94 dBA. Figure 6.17.2 shows a statistical analysis of the present noise exposure.
% OFTOTAL
Figure 6.17.2. Result of statistical analysis of noise exposureat operator station (Knight trimming machine).
146

CommentsIn this case, acceptance by the workers of the noise controls presented the major problem. Large amounts of engineering and management time were used to discuss the project with workers in an attempt to convince them that the installation was for their own good. Workers were most upset at not being able to see neighboring machine operators. The workers also showed great resistance to wearing personal protective equipment throughout the project.
147

Eric W. WoodBolt Beranek and Newman Inc.50 Moulton StreetCambridge, Massachusetts 02138(617) 491-1850This case history discusses noise control treatments that were included in the design of a new electric station and evaluates their effectivness.Problem DescriptionA 345/115-kilowatt substation, designed for an 11-acre site located in a mixed commercial/residential area in New England, was to include two 300 MVA 0A/F0A/F0A autotransformers and anoil-to-air heat exchanger for the underground 345-kilowatt line. Standard National Electrical Manufacturers* Association (NEMA) sound levels for transformers of this class are 84/86/87 dBA.The heat exchanger contains two 8-ft-diameter, 4-bladed, propeller-type fans, driven at 364 rpm by one 1-hp motor per fan. The fans are rated at 0.135 in. of water static pressure and 51,700 actual cfm air flow.The nearest neighboring buildings, which are along the site property line, include an office building, a restaurant, and retail stores. Farther from the site, but within 1500 ft, are a motel, several high-rise apartment buildings, and other office buildings. In addition, a hospital and infirmary are within 3000 ft of the site.The power company wanted to avoid (1) noise complaints from its new neighbors and (2) noise-related delays during the application hearings pending before various regulatory agencies. A study by Bolt Beranek and Newman Inc., submitted by the power company to the regulatory agencies in the form of a report, established appropriate sound level criteria, provided detailed noise control design, and estimated the community noise impact from station operation.Various acoustic criteria were established for the station to meet the city and state sound level regulations. However, the power company’s own criterion was the most stringent: Anuisance or probable-complaint condition must not be created by noise from the operating facility. From this criterion, an engineering design goal was chosen to limit the transformer tonal noise to within about 5 dB of the nighttime ambient residual sound levels measured in octave bands at nearby noise- sensitive locations.
CASE HISTORY 18: TRANSFORMER(Community Noise Problem)
148

There are several sources of transformer noise. Energized transformers produce a characteristic tonal sound, the frequency of which is proportional to the supply frequency. The cooling fans produce a broadband noise when in operation. Oil-circulating pumps, like the cooling fans, are a source of noise when used.When air-blast circuit breakers are used, they are a source of high-level, short-duration, infrequent noise.Transformer tonal noise is comprised of harmonically related frequencies that are even multiples of line frequency. In the United States, the line frequency is 60 Hz, and transformers radiate tonal sounds at 120, 240, 360, 480...Hz. In almost all cases of transformer noise complaints, it is the tonal noise that causes problems.Residual ambient sound pressure level measurements were made at nearby noise-sensitive areas during the day, evening, and nighttime periods. The late-night ambient sound levels were used to establish the transformer noise design goal.Several alternative noise control treatments can be considered for transformers. These include:
Specification of sound levels lower than those set by NEMABarrier walls or partial enclosuresComplete enclosuresPurchase of additional real estate or noise easements as buffer zones
• Relocation to an area without noise-sensitive neighbors.A complete enclosure can pose ventilation and maintenance problems and was not considered necessary. The purchase of additional real estate and relocation were not feasible. For this project, the first two noise control treatments listed above were selected.Control DescriptionBoth transformers were purchased from the manufacturer with sound levels specified to be 9 dB less than the NEMA standard. The lower-than-standard sound levels for this transformer were 75/77/ 78 dBA. This reduction is accomplished in the design of the transformer by providing a large core reducing the magnetostrictive forces, which, in turn, reduce the noise radiated by the tank wall.
Problem Analysis
149

A partial enclosure was also provided along three sides of the transformer. Noise-sensitive areas were positioned in three directions from the site. There were no noise-sensitive land uses in the remaining direction, and therefore an increase in noise level could be tolerated. The open side of the enclosure was, of course, aligned toward the direction that was not noise- sensitive .The size and location of the partial enclosure relative to the transformer was designed to provide adequate insertion loss without restricting ventilation or maintenance. The enclosure walls were constructed from patented concrete blocks with sound absorption on the transformer side of the walls provided by slots leading into the interior cavities of the blocks. Sound absorption on the interior surfaces of the walls was necessary to minimize the build-up of sound within the enclosure. The masonry walls also served as fire protection between the two transformers.ResultsMeasurements made after the station was operating show the sound level design goal was achieved. The transformer tonal noise is usually masked by ambient sounds and is therefore seldom audible at nearby sensitive areas.* Figure 6.18.1 shows the results of sound pressure level measurements before and after the transformers were energized. These measurements were obtained during the late nighttime hours, when the potential for station audibility was greatest. It should also be noted that no complaints have been received after three years of operation.
*The late-night ambient sound levels are occasionally lower than those used in the design goal and, hence, the transformer noise can occasionally be heard in the community. If it were appropriate to eliminate completely the possibility of a noise source from being heard, even more stringent design goals could be established (e.g., 5 to 10 dB lower than the expected sound level of the masking ambient). In this case, such extreme measures were inappropriate.
150

OCTA
VE
BAND
SOUN
D PR
ESSU
Rt
L6VE
L(dB
re20
/i Po
)
Figure
60
10 ------------- -------------- -------------- -------------- ----------------------------- -------------- --------------315 63 125 2 5 0 5 0 0 1000 2 0 0 0 4 0 0 0 8 0 0 0
OCTAVE BAND CENTER FREQUENCY (Hz )
6.18.1. Late-nighttime sound pressure levels measured at community locations.
151

Industrial Acoustics Company 1160 Commerce Avenue Bronx, New York 10462 ( 212) 931-8000Problem DescriptionA transformer at the Puerto Rico Water Resources Authority, Santa Maria Substation, Ponce, Puerto Rico, is located just 22 ft from a neighboring home. The people living next to the substation complained about the noise radiated by the transformer.Problem AnalysisA sound survey conducted by PRWRA confirmed that the sound levels resulting from the transformer operation exceeded the ambient noise levels in the area. From the data obtained, the degree of noise control required was ascertained. From Table 6.19.1, it is clear that a minimum of 9 dB of noise reduction is required in sound level. Low frequencies are involved in the problem, as seen from the large differences between A- and C-scale readings.
CASE HISTORY 19: TRANSFORMER(Community Noise Problem)
Table 6.19.1 Acoustic measurements, SPLOverall Readings, dB
Measurement at Complaint Area A-Scale C-ScaleLowest ambient level, substation not operating 48 58Substation in operation, no barrier 57 66Substation in operation, with barrier 48 58
Control DescriptionAn 18-ft-high barrier was chosen as the^ontrol here. The barrier design incorporated IAC Noishield prefabricated panels. Such units are easy to install 2 nd provide flexibility in erection or relocation. The overall configuration of the barrier design is shown in Figure 6.19.1.
152

PORCH 1
tPO
'01<N
SOUND ABSORBING PANELS
TOP V I E W TRANSFORMER NOISE BARRIER
Figure 6.19.1. Plan view of sound barrier arrangement.
ResultsOverall ambient sound pressure levels, together with levels measured in the complaint area before and after installation of the barrier, are shown in Table 6.19.1.The noise reductions noted in Table 6.19.1 indicate that, after the barrier was installed, the sound levels at the neighboring home were no longer controlled by the transformer, but by the existing ambient levels. Consequently, complaints concerning the substation transformer ceased.
153

Thomas E. FranklinIBM Corporation5600 Cottle RoadSan Jose, California 95109Problem DescriptionOperation of three Brown & Sharpe surface grinders caused sound levels in the mid-70-dBA range in an 8-m by 8-m office area located about 7 m away. Grinding sounds reach the offices over the 4-m gap above the 2-m-high office partitioning. The grinder sounds were severe enough to interfere with the typical activities — telephone conversations, business meetings, etc. — that took place in the office.Problem AnalysisThe grinders were clearly the source of the noise problem, since the sound level dropped to between 63 dBA to 66 dBA when the grinders were shut down. Management considered the following remedial treatments:
Extend the existing drywall to the true ceilingExtend the existing wall to the true ceiling by adding a lead-impregnated vinyl curtainImmediately move the office to a quieter location.
In this case, partly because management knew the office would eventually be moved to a new location, the second alternative was implemented. The curtain material was also selected to minimize problems of construction, where the treatment had to be routed through a support truss.ResultsSound levels in the office areas were reduced 11 dB, to a maximum of 63 dBA. Office workers commented that the environment was much improved.CommentsEven though the curtain material is relatively easy to handle, lead sheeting — an even more easily handled product — had to be employed at the truss area.
CASE HISTORY 20: SURFACE GRINDERS(Office Noise Problem)
154

Richard C. PotterBolt Beranek and Newman Inc.50 Moulton StreetCambridge, Massachusetts 02138(617) 491-1850Problem DescriptionA small catalog and brochure mail-order company operated with a printing press, cutter, collator, envelope stuffer, and mail- room operation in a building basement. The eight employees were subjected to high levels of noise from the printing operation, particularly the cutter, on the order of 80 to 85 dBA for up to 90$ of the time on each 8-hr shift. These workers complained about this noise exposure to the company owner. In addition, the printing machine operator was exposed to a daily noise dose of 92 dBA/8-hr equivalent, in excess of the limits allowed by Section 1910.95 of the Occupational Safety and Health Administration Regulations and Standards.Problem AnalysisBolt Beranek and Newman Inc. was asked to study the problem and make recommendations for alleviating the complaints. Observation indicated that the printing machine and cutter were the general sources of the noise problem. By a series of close-in measurements, the cutter, various gear trains, and the paper ’’snap" were noted as specific sources of noise. The distributed nature of the sources of the machine, arranged along one wall of the basement, made reduction of the noise at the source difficult. This approach was also clearly beyond the capabilities and resources of the staff of this small operation. No retrofit parts were available for the commercially produced printer and cutter.Control DescriptionThe first part of the proposed solution was to isolate the printer and cutter machinery from all workers in the basement, other than the direct operator, by construction of a floor-to- ceiling barrier. The barrier was open at the ends to allow access for paper rolls at the input and the product conveyor at the output. Acoustic curtains were suggested for the openings to provide the maximum relief of the workers away from the printer.
CASE HISTORY 21: PRINTER(Worker Annoyance Problem)
155

The inside of the acoustically solid barrier was to be lined with acoustic absorbent material, as was the far wall beyond the barrier, to reduce the reverberant build-up of sound within the newly constructed printer "corridor." An acoustical-absorbent- lined open-fronted booth, opposite the quietest part of the printer and cutter machinery, was proposed as a refuge for the printer operator, where he was encouraged to spend as much time as necessary monitoring the operation. A desk-shelf for conducting paperwork was proposed to encourage the use of this booth.ResultsThe barrier was built of sheetrock on 2- * 4-in. stud, sealed to the floor and ceiling, and 4-in.-thick glass fiber batts were used as acoustic absorbent material. The noise outside the barrier was reduced to sound levels that allowed easy conversation among all workers, which led to a more relaxed and acceptable work situation. The noise exposure of the printer operator remained just in excess of the OSHA limits, since the owner chose not to build the booth immediately.
156

Problem DescriptionA common problem in industry is that of protecting workers from noise produced by machines that the worker must guide or manipulate directly. An example is a cut-off saw used on metal shapes. Noise comes from two main vibrating sources: the saw blade itself and the workpiece. The saw itself is actuated downward and into the work by a lever attached to the hinged and counterbalanced (or spring-loaded) saw and motor.The worker must visually monitor the cutting operation. In addition, the vibration and opposing force transmitted to him through the lever arm furnish useful cues on the progress of the cutting operation. The problem is to reduce the noise he receives, without undue interference with work flow, with visibility, and with the use of the lever arm.Control DescriptionThe solution was an enclosure covering the whole saw. Workpieces pass transversely through slots in the enclosure. Flaps of lead-loaded vinyl close off the opening and reduce to a small amount the unavoidable leakage area when a workpiece is present. The front, above saw bed height, Is closed by two doors whose surface is mostly 1/4-in. clear plastic (polymethylmethacrylate). This plastic provides very good vision. The doors close with a gap the width of the control lever. Each door has a flap of lead-loaded vinyl about 3 in. wide to close the gap. The lever pushes aside the flaps only where it protrudes. Thus, the leakage toward the worker is greatly reduced.ResultsFigure 6.22.1 shows the sound pressure levels at the worker position before and after the enclosure was installed. The decrease in sound level is 13 dB. The standard panels used in the enclosure are very much better than indicated by the reduction measure, illustrating again the importance of leaks in determining the performance of enclosures.CommentsSeveral features of the design could be improved. The ears of the workers are very close to the leak at the door flaps. It should
CASE HISTORY 22: METAL CUT-OFF SAW*(OSHA Noise Problem)
*Handley, J.M. 1973. Noise — the third pollution. IAC Bulletin 6.0011.0.
157

31.5 63 125 2 5 0 5 0 0 1000 2 0 0 0 4 0 0 0 8 0 0 0
OCTAVE BAND CENTER FREQUENCY (H z l
Figure 6.22.1. Metal cut-off saw: operator position soundpressure levels before and after enclosure of saw.
be relatively simple to offset the saw feed lever to the right (for the right-handed worker). This change has several advantages: (1) it places his right hand in a more comfortable position, (2) with the door gap and flaps moved to the right, his vision is greatly improved, and (3) the noise leak is moved farther from his ears. A nonacoustical improvement would be to have the doors slide open, rather than open out, which can be a safety hazard.
158

Problem DescriptionWood planers in the forest products industry produce sound levels of 102 to 108 dBA at the operator (feeder) work stations. Sound levels are 103 dBA at the grading station and trimmer and 95 dBA elsewhere in the planing mill.Control DescriptionIn the area cited in the article, enclosures were installed on 30 large planers. Out of the general program, the following specific guidelines for viable enclosures were developed by experience:
(1) Walls and roof should be from 8 to 10 ft high, using staggered studs, thus keeping the inside wall independent from the outside wall with separate sills and headers. Wall structure should be isolated from floor with felt or mastic. Space between walls should be filled with rock groove or equivalent plywood. Additional acoustical board was used on upper two- thirds of walls and ceilings for noise absorption. Removable wall or roof sections should be installed as needed for major machine repairs.
(2) Floors are usually adequate as constructed for a normal planer installation, but if the planer is elevated on piers, the enclosure walls should be extended to the main floor or acoustical floor similar to the walls constructed between piers.
(3) Doors should be refrigeration-type, with beveled or stepped edges. They should open out, so that suction from blowers keeps them closed. Doors or jambs should be sealed with weather- stripping. Heavy duty hinges should be used. Alternatively, standard acoustical doors may be purchased.
(b) Windows should be as small as practical, using double- glazed shatterproof or screened glass with an air space between.
(5) Infeed and outf'eed openings should be as small as possible. A tunnel-type opening provides room for vertical multiple layers of old conveyor belt or lead-filled vinyl to block the noise path. Belt should be slit at intervals to accommodate various board widths, keeping the unused portion of the tunnel width blocked. The outfeed tunnel should be at least as long as the longest boards fed through the planer, so that noise caused
CASE HISTORY 23: WOOD-PLANER*(OSHA Noise Problem)
*From Pease, D.A. March 1972. Forest Industries.
159

by the vibrating board is confined inside. Funnel-shaped metal facing should be installed inside to guide the stock into the tunnel opening.
(6) Opening for ducts and pipes should be just enough overside to permit packing the annular space with insulation.
(7) Make-up air openings, to compensate for air exhausted by the blower system of the planer, must be constructed as a silencer to control noise leakage. The chimney should be several feet high, with baffles arranged inside so that incoming air must follow a zigzag path; baffles should be lined with acoustic material. Another method is a snooth-wall chimney with a "weather cap” baffle lined with acoustic material at the top.ResultsThe article states that sound levels were reduced to less than 90 dBA, to comply with OSHA regulations.CommentsWhen large amounts of noise reduction are needed, acoustical leaks can be critical; openings or enclosures should be kept to the minimum.The absorbent used should be covered by a plastic film to avoid fouling by the dust. In addition, because lumber is not always fed in straight, the absorbent should be protected by a heavy, galvanized, open-mesh screen.The feed tunnels should be long enough to hold the whole board, or else there should be positive hold-down to prevent board vibration.
1 6 0

Problem DescriptionTwo Minster model P2-2000, 200-ton straightside presses were running over 2 5 0 strokes/min when stamping out laminations for a particular motor model. The press is located in a metal- construction building. Dies are changed often.Sound level at the operator station was 104 dBA, and the general plant sound level was 92 dBA.Control DescriptionPanels forming a total enclosure were constructed with:
1 layer absorbent polyurethane acoustical foam 1 layer 1/64-in. sheet lead 1 layer 3-in. fiberglass TIW blanket1 layer fiberglass cloth to withstand industrial solvents.
The enclosure used was circular, 1 7 6 in. in diameter, 16 ft high, with top of domed construction. Access doors allow for maintenance, and there is a stock feed opening. Finished parts leave the enclosure by means of two under-floor part guides. Supply lines were rerouted under floor, using flexible conduits. A 3500- cfm heat exhaust system with a silencer was added to each dome.The operator is outside the enclosure except to change dies, change feed reels, or make adjustments.ResultsTotal enclosures reduced sound level for operator to 83 dBA and general plant sound level (with other equipment) to 87 dBA.
CASE HISTORY 24: PUNCH PRESS(OSHA Noise Problem)
161

H. Blair Ward, Jr.Talon, Division of Textron 626 Arch StreetMeadville, Pennsylvania 16335 (814) 3 3 7 - 1 2 8 1
Problem DescriptionThis case history concerns high-speed (approximately 1200 strokes/ min) Bruderer punch presses which are centrally located in a 20-m by 30-m steel building. Operation of the 40- and 70- ton presses causes OSHA noise overexposures of the three workers in the general area around the press, as well as of the two press operators.Problem AnalysisThe presses were clearly identified as the cause of the noise problem because sound levels were low when the presses were not operating and between 95 dBA and 100 dBA, depending on proximity to the units, when they were in operation. Action was initiated because management became aware that the press room was extremely noisy in comparison to other plant operations.Octave-band readings showed most of the sound energy from the presses was in the higher frequency bands, indicating a simple enclosure around the presses could be effective. Because the press operation is automated, a 4-sided enclosure with penetrations for stock feed and parts discharge was deemed acceptable, and plans for the treatment were made u p .Control DescriptionThe press enclosure design called for formed steel angles to be used as structural members to support removable enclosure panels — the concept is shown in Figure 6.25.1. The ultimate panel system employed (see comments below) consisted of 1/ 2-in. plywood framed on one side with 1 * 3's tacked on. Expanded sheet metal formed a backing on the framed side of the 2-ft-wide panels. Foamed-in- place foam was then applied to the backing. The panels were hung by clips to cross members on the framing. Each panel was thus easily removable for press screening.ResultsSound levels at the closest worker position to either press — the operator who sits 2 ft away from the die — are now in the 88- to 90-dBA range. Treatment interference with the operation is nil, and productivity is unaffected. Total cost for the two press enclosures was in the $ 1 0 0 0 to $ 1 5 0 0 range.
CASE HISTORY 25: PUNCH PRESS(OSHA Noise Problem)
162

FORMED STEEL ANGLE 3x3x3/16 AS VERTICAL CORNER POSTS S CROSS TEES
Figure 6.25*1. Press framing and location of panels.
CommentsInitial panel designs were found unacceptable: Panels of 16-gaugegalvanized steel backed with 1-in.-thick glass fiber duct insulation were found to rattle, and the glass fiber became pulverized by vibration and became unglued.The implemented treatment is clearly acceptable. It reduces noise exposure to compliance levels for minimum cost and impact on operation. However, better performance could have been obtained (at added expense) by using standard acoustical panels or larger plywood sections to minimize acoustical leaks at the many joints. The open top could also be sealed.The expanded foam adds little to treatment performance, since its acoustical properties are nil. Acoustical foam, held in place with expanded metal, would probably improve the enclosure performance.
163

Keith Walker U.S. Gypsum Company P.O. Box 460Round Lake, Illinois 60073 Problem DescriptionThis case history concerns noise emissions caused by operation of a high-speed 290-ton stamping press. Sound levels in the vicinity of the press were high enough to contribute to OSHA noise over- exposures of workers near the press as well as of the press operator.Problem AnalysisSound levels were found to be in the 95-dBA to 101-dBA continuous slow meter response, at distances of 15 to 25 ft from the operating press when it was the only noise source operating .jL. The U.S. Gypsum Company decided to install their Acoustisorber (jjy Industrial Sound Control Panel System around the press, to determine how effective the system would be in reducing sound levels in the shielded positions. (Operator position noise exposures were studied separately and are not discussed in this case history.)Control DescriptionThe panel system employed consists of 2-ft x 8-ft modules made of hardboard on one face, expanded and flattened metal on the other side, with a mineral fiber absorbent sandwiched in between. The absorbent is fully wrapped with a thin heat-shrunk plastic film. Individual panels are joined tog;ether by light steel framing to form enclosure walls. The two long walls in this example were suspended on an overhead roller track for access to the press. The installation is open-topped and about 24 ft x 32 ft in size. Walls are 16 ft high, except at one short end where the height was dropped to 8 ft to allow for overhead crane clearance. Material feed and discharge are through openings cut into the short sides of the walls.
Material costs were approximately $1600.ResultsSound levels at the original measurement locations were reduced by7 to 14 dB to a maximum of 88 dBA at those locations. (See Figure 6.26.1.) Enclosure systems need not always be elaborate
CASE HISTORY 26: PUNCH PRESS(OSHA Noise Problem)
•Distances chosen to represent possible nearby worker locations.
164

when moderate amounts of noise reduction are needed, and relatively inexpensive materials can be used. The panels provide more than enough transmission loss, mainly from the hardboard backing, to reduce sound levels by the amount needed. The key is making sure that spillover sound, escaping over the top of the enclosure, through joint leaks, etc., does not short-circuit the transmission loss potential. The absorbent material on the inner surface of the walls minimizes that effect here.
Figure 6.26.1. Sound levels at the original measurementlocations, which were reduced to a maximum of 88 dBA.
165

I.D.E. Processes Corporation Noise Control Division 106 8lst Avenue Kew Gardens, New York 11415 (212) 5^4-1177Problem DescriptionBraiding machines are used in the textile industry to combine several filaments of material into a single braided strand. The braiding process is accomplished mechanically by having many individual material "carriers" move simultaneously around the periphery of a table in such a fashion that the carriers crisscross each other as they move. The material strands, fed from the carriers, are thus formed into a braid. The whole process is similar to the interweaving of ribbons on a Maypole. In this situation, however, considerable noise is generated by the gearing and the impacts associated with the carriers as they constantly change direction. Typically, many braiding machines are assembled in multiple rows and operate simultaneously, tended by operators who make sure the machines are functioning properly.For the project involved in this case history, I.D.E. Processes Corporation, Noise Control Division, was called in to help a manufacturer of medical sutures bring worker noise exposures of his braider operators down to an equivalent of 85 dBA or less when a bank of machines was operated. Because of funding limitations, I.D.E. was aSked to work on a prototype installation that would be evaluated after normal working hours, when the treated equipment could be run Independently of other untreated machines in the area.Problem AnalysisIn this problem, the client specifically asked for an enclosure control to be installed after other equipment modifications had been tried and rejected, including replacing metal components with their nylon equivalents. Sound levels were measured at aisle positions, 2/3 in in front of the untreated equipment, first, with just the bank of machines to be enclosed running and, second, with all equipment turned off. The sound level was 101 dBA (with peak frequencies 2000 to 4000 Hz) with the bank of 26 braiders running and 57 dBA maximum with the machines turned off, indicating that the problem noise originated at the braiding machines.The enclosure design had to provide a minimum of 16 dB of noise reduction on a dBA scale, to achieve 85 dBA guaranteed. In addition to the acoustical requirements, the client specified that the control would have to be robust and sanitary (a medical
CASE HISTORY 27: BRAIDING MACHINE(OSHA Noise Problem)
166

product was involved) and could not cause any significant worker inconvenience.Control DescriptionThe custom-designed I.D.E. enclosure constructed for this problem is shown in Figures 6.27.1 and 6.27.2. From the photographs, it is easy to see that the operators retain good visibility of their machines. Several aspects are not revealed by the pictures: Thewindows slide on roller bearing, making worker accessibility relatively easy and fast. Panels on the bottom of the enclosure also slide. All windows and the bottom panels are removable for maintenance. Gravity ventilation sufficient for these machines is furnished via the silenced vent openings visible below the bottom panels. The outer skin of the enclosure panels is made of corrosion-resistant steel. The inner skin of the panels is of perforated sheet metal that covers an acoustical fill material, thereby making the inner surface acoustically absorbent and thereby minimizing any build-up of sound inside the enclosure.A layer of woven glass fiber fabric protects the inner fill from working out of the perforated sheet metal.ResultSound levels at the aisle positions have been reduced by 18 dB to 83 dBA when only the treated bank of machines is running.It should be noted that the achieved noise reduction is not a characteristic reduction of I.D.E. acoustic panels but rather an overall reduction of the entire system, consisting of approximately 50% glazed area of the total enclosure surface. The gravity ventilation is acoustically treated and compatible with the enclosure attenuation.Operators are exposed to higher sound levels only for short periods of time, when opening one of the windows to work on a particular machine. Under these circumstances, the machine being worked on is typically shut off, and the worker is exposed to noise coming from more distant machines. Measurements taken at the enclosure at a position occupied by an operator tending a machine, while the other 25 machines are running, confirmed that such an exposure would contribute only a small fraction to his overall noise exposure — the sound level was 92 dBA under these conditions.Since the enclosure, when installed in an existing plant, reduces aisle clearance between adjacent rows of equipment, some braiding equipment users may find it necessary to move their equipment in order to accommodate the 10- to 20-cm loss of clearance caused by the treatment. New plant layouts, of course, can accommodate required walkway clearances.
167

Figure 6.27*1. Braider enclosure.
168

Figure 6.27.2. Braider enclosure, another view.
169

Richard C. PotterBolt Beranek and Newman Inc.50 Moulton StreetCambridge, Massachusetts 02138(617) 491-1850Problem Description
After loading at a frozen food department, 12 refrigeration trucks were left at the loading dock overnight for early morning deliveries. A neighbor complained to state officials about the noise of the refrigeration unit compressor motors running intermittently. The refrigeration trucks were visible from the complainant’s property. As a result, notice was served to the owner to reduce the sound levels at the boundary of the property to less than 44 dBA.Problem AnalysisBolt Beranek and Newman Inc. was called in to study the problem.Two techniques to reduce the radiated sound level were developed and offered to the client for his consideration. The first involved lining the loading dock roof with acoustic absorbent panels and driving the trucks out of the dock, turning them, and driving them head first into the dock for the overnight stay. The bodies of the trucks would then shield the refrigeration units from direct radiation, and the close-fitting absorptive material would absorb the reflective sound passing over the trucks. Another condition was that the dock would be kept full of trucks to restrict reflective sound around the side of the trucks.An alternative solution was to enclose the loading dock fully with acoustic roll-up doors and to fit an air circulation system to remove the heat generated by the refrigeration units in hot weather.Control DescriptionWhile the truck-turning and acoustic treatment of the roof were considered to be sufficient to provide the required reduction in radiated sound, the fact that little visible effort had been taken would probably influence the attitude of the neighbors.Hence, the second approach was selected, even though it was more expensive, because the visual aspect of the problem was considered important. With the roll-up doors, the trucks would be out of sight of the neighbors, and their sound could not be heard. The action taken by the company in response to the community's complaints would be readily apparent.
CASE HISTORY 28: REFRIGERATION TRUCKS(Community Noise Problem)
170

The doors chosen were thermal insulation doors with a positive seal to provide the necessary acoustic transmission loss and proper acoustic seal. Two quiet 500-cfn units were roof-mounted to provide exhaust and make-up air, respectively.ResultsThe installation was approved, built, examined by state authorities, and pronounced acceptable.CommentsIn community noise problems, and especially when the problem is annoyance from low-level sound sources, it is important that other-than-acoustic aspects be considered. Often, the fact that someone is aware of, and is constructively trying to solve, the annoying condition is more important than eliminating the problem. Consultation with all parties and the visibility of controls can be effective tools in dealing with annoyance problems, as in this case, where the sound level of the annoying source was much less than that caused by traffic, but was also apparent as a continuous noise from a stationary source.
171

Industrial Acoustics Co.Il60 Commerce Avenue Bronx, New York 10462 ( 212) 931-8000Problem DescriptionSpiral vibratory elevators are used as part of the handling equipment to cool hot processed ingredients while lifting them from one level to another 6 m higher at the Melton Mowbray factory of Pedigree Petfoods Ltd. The sound level in the immediate vicinity of the elevators is 104 dBA. Plant management aimed at reducing elevator noise to below that of the existing workshop ambient level of 84 dBA.Problem AnalysisA reduction of the elevator noise of at least 30 dB was required in tnis situation. Because the operation is automated, consideration was given to enclosing the two units involved. Such a treatment would normally be considered routine. In this case, however, because a food processing facility is involved, there are rigid requirements to prevent contamination of the food products from acoustic infill particles used in the construction of the enclosure panels.In addition, the enclosure had to accommodate product heat loss.Control DescriptionIAC designed an acoustic enclosure to surround both elevators,
(t m ^using their 100-mm-thick modular Noishieldv— ^ panels (see Figures 6.29.1 and 6.29.2). Acoustic tunnels were incorporated in the design at the feed conveyor inlets to the elevators. A forced ventilation system was also incorporated in the design to supply a flow of air sufficient for process and machinery cooling. TwoIAC Power-FLOW^-^ silencer units were included at the intake and discharge points of the system to ensure that there would be no leakage of elevator noise through the ventilation system.Access to the interior of the acoustic enclosure, mainly for machinery maintenance, was afforded by a double-leaf acoustic door having a clear opening of 2000 mm x 1530 mm. An acoustic observation window of double safety glass was provided on each side of the access door.
CASE HISTORY 29: SPIRAL VIBRATORY ELEVATOR(Hearing Conservation Noise Problem)
The sanitation problem was met by the inclusion of a polyethylenemembrane between the acoustic infill and the perforated skin ofthe interior side of the panels.
172

ResultsAfter the erection of the enclosure was completed, a noise survey determined that the planned minimum noise reduction had been comfortably achieved and that, at a distance of 10 ft from the acoustic structure, the elevator noise could not be distinguished above the general shop sound level, 84 dBA.
Figure 6.29.1. Detail of acoustic enclosure: doors.
173

Figure 6.29-2. Acoustic enclosure around elevators.
174

J.B. MorelandWestinghouse Electric Corp.Research and Development Center1310 Beulah RoadPittsburgh, Pennsylvania 15235Problem DescriptionOperation of a motor generator set caused a 94-dBA sound level at a position 5 ft from the unit, giving rise to complaints from nearby workers.Problem AnalysisNo detailed control selection analysis was attempted here, as the solution is relatively straightforward. However, estimates of the expected benefit of the selected control — an enclosure — were made, based on calculations such as discussed previously in this ManuaI.Control DesignThe enclosure was built of 3/4-in. plywood lined on the inside with 1/2-in.-thick glass fiber, such as is used for lining ducts. Figures 6.30.1 and 6.30.2 show the motor generator set enclosure near and surrounding the noisy equipment and Figure 6 .30.3 shows a cross section of the enclosure. Note the acoustical duct at the base of the enclosure, which allows for air supply.ResultsFigure 6.30.4 shows before, after, and predicted data. A 10-dB reduction in sound level was achieved here.
CASE HISTORY 30: MOTOR GENERATOR SET
175

Figure 6.30.1. Photograph showing the installation of thehigh-frequency MG set enclosure.
Figure 6.30.2. Photograph of the installed MG set enclosure.
176

Outlet Air
Figure 6.30.3. Cross-sectional sketch of the high-frequency MG set enclosure.
177

OCTA
VE
BAND
SO
UND
PRES
SURE
LE
VEL
UB
re 20̂
Pa
)
31.5 63 125 2 5 0 5 0 0 1000 2 0 0 0 4 0 0 0 8 0 0 0
OCTAVE B A N D C E N TE R FREQUENCY (H z )
Figure 6-30.4. Before, after, and predicted datafor motor generator set.
178

Dr. Walter W. CareyThe Nestlé' Enterprises, Inc.100 Bloomingdale Road White Plains, New York 10605 (914) 6 8 2 - 6 7 1 6
Problem DescriptionTwo Nalbach filling machines used to fill freeze-dried coffee in glass jars were located in a 65 ft x 23 ft x 10 ft room at the Nestlé” Companyfs Sunbury, Ohio plant.There are two fixed worker stations for each machine. An operator station is directly in front of the filling machine, and an inspection station is located downstream of the machine discharge conveyor. A roving worker also works in this area. The filler operator maintains a steady flow of bottles into the filling machine and checks and adjusts the filled weight of spilled product as required. The inspectorrs function is to ensure that each jar is properly filled and that lids are securely fastened to the jars. The roving worker fills the lid bins with lids and maintains cleanliness in the area.Problem AnalysisThe Nestle" Company retained Bolt Beranek and Newman Inc. as consultants to evaluate the noise environment and recommend controls to ensure that all noise exposures in the area met OSHA limits.The highest worker noise exposure occurred at the filling machine operator location, where the sound level varied between 94 and 96 dBA. The sound level was at or above 92 dBA elsewhere throughout the space, because of the highly reverberant nature of the room (typical for food processing facilities where easy-to-clean, hard surfaces are required by FDA regulations). The filling machines were most responsible for the above-90 dBA sound levels, as the sound level dropped to 74 dBA when both filling machines were stopped.To determine what part of the machines radiated noise, measurements were made close-in to suspected important noise sources. Observation of the operation indicated that likely candidates were the constant jar-to-jar contact at the infeed to the filling machine, the vibrations developed by the feed mechanism in the filling machine, and gear noise. Measurements were taken near each of these sources.The data obtained appeared to confirm the significance of the suspected source. For example, the octave-band spectrum measured 6 in. from the filling machine inlet indicated that the sounds generated in that area were largely responsible for the octave-band
CASE HISTORY 31: FILLING MACHINES(OSHA Noise Problem)
179

sound pressure levels measured at the operator’s ear, at least for those octave bands that penetrated the 90-dBA criterion curve appropriate for this situation. Figure 6.31-1 summarizes these findings. Note the similarity in spectral shape between the upper two curves. Other close-in measurements indicated that openings in the bottom part of the filler structure were important contributors to the overall noise environment relative to the 90-dBA criterion, but were of lesser significance than noise sources on the filler table itself.The analysis suggested that the most significant noise was generated by jar-to-jar and jar-to-machine impacts. Clearly, a possible remedial solution would be to minimize or eliminate the force of these impacts. However, an equally acceptable acoustical treatment would be to contain the sounds. In view of the problems inherent in redesigning the machine feed mechanism to yield softer impacts, strong consideration was given to noise containment. In fact, the solution attempted was a cover for the infeed and discharge parts of the machinea combined with a closure for the bottom parts of the machine.
OCTAVE BAND CENTER FREQUENCY (H*1
Figure 6 .3 1 .1 . Sound pressure levels in filling machine roombefore and after treatment.
1 8 0

Because of the intricate design of these machines, the selected noise control was not attempted until after a careful analysis had been made of the possibility of rotating filler-associated personnel with workers in other departments who were exposed to equivalent sound levels lower than 90 dBA. However, such rotation was discarded as totally infeasible.The major problem associated with this project was the amount of design work needed. Mr. John Meyer, the design engineer, spent approximately 3 weeks on-site before sufficient details were gathered and design concepts fully developed. The design phase was also extended because of the constraints of sanitation, maintenance, and operator access.Figure 6.31-2 is an example of the conceptual design drawings that were developed in connection with this project. The treatments were fabricated by the E.A. Kaestner Company of Baltimore,Maryland.Excluding engineering design costs but including material and fabrication cost, the treatment for the two filling machines was $16 , 300.
/-S O U N D /E A S E INSULATED / &EMOM8L E SHEET
Control Description
METAL COVER ( 3 ) PLACES
Figure 6.31.2. Example of the conceptual design drawings.
181

ResultsBefore treatment, the sound level at the filling machines was 94 to 96 dBA, when both fillers were running. Although after- treatment octave-band measurements were not available for the identical running modes, they exist for the condition with one filler running. For the one-filler-running mode, the sound level has decreased to 85 dBA. Figure 6.31.3 shows octave-band spectra of the measured before-and-after situations and an estimate of the maximum expected sound pressure levels for the two-filler-running mode. All operators are now exposed to sound levels less than the 8-hr 90-dBA level allowed by OSHA.Operators and plant management indicate complete satisfaction with the controls, as sound levels have been reduced with no perceptible effect on productivity or product quality.CommentDr. Carey discusses the conflict; between FDA sanitation and OSHA noise reduction requirements in the July 1978 issue of Sound and V ib r a t io n in an article entitled "The Ramifications of Noise Control in Food Plants."
Figure 6.31.3 - Sound pressure levels in fillingmachine room.
182

Industrial Acoustics Co.Il60 Commerce Ave.Bronx, New York 10462 ( 212) 931-8000Problem DescriptionIn this case history, the problem concerned engine room noise aboard the Matson Navigation Companyfs vessel Hawaiian Queen.At full power, the 9000-shp steam turbine used aboard the ship causes sound levels exceeding 120 dBA in the engine room.Problem AnalysisInvestigation of the noise problem showed the cause of the high levels to be the primary stage of a nested-type double reduction gear unit. Sound levels are considerably lower when this unit is not operated. Although consideration was given to replacing gearing, that alternative was rejected because of the expense involved, in favor of enclosing the reduction gear casing. An enclosure design was sought to bring the engine room noise environment down to ambient levels measured when the gear unit was inoperative. The required noise reduction is indicated in Figure6.32.1, which also compares sound pressure levels measured in the engine room with and without the gear unit in operation. The required noise reduction is the algebraic difference between the two curves.Control Description
(t m }IAC Modular'*—* acoustic panels were used as the basis for the enclosure because of the high transmission loss properties. A notable feature of this enclosure is the use of a split commercial silencer at the propeller shaft penetration into the enclosure, to attenuate sounds that would otherwise escape around the shaft. Penetrations for thermocouples, lubricating oil lines, and other pipes were cut in the enclosure and provided with seals. Materials for a similar enclosure would cost about $9000 today.ResultsThe actual effectiveness of the enclosure is not measurable because after the enclosure was put in place, the engine room noise environment decreased to the ambient levels. However, it is clear that the enclosure met design objectives.The major problem with the enclosure was rearrangement of piping necessitated by close tolerances between the gearbox casing and the enclosure walls.
CASE HISTORY 32: GEARBOX(Hearing Conservation Noise Problem)
133

OCTAVE BAND CENTER FREQUENCY (Hz)Figure 6.32.1. Engine room sound pressure levels.
The operating temperature of the gearbox did not change as a result of its enclosure.Note that in most cases of enclosure construction, achieved noise reduction obtained probably will not reach the amount indicated by the given laboratory-determined transmission loss of the enclosure walls. The reason is that when an enclosure is made, noise is confined, resulting in a build-up of sound levels inside the enclosure. This effect is predictable when the principles of room acoustics, described in Noise Control Analysis, are used.In this case, however, the use of nonreflective panels for the enclosure walls minimized the effect.
184

Eric W. WoodBolt Beranek and Newman Inc.50 Moulton StreetCambridge, Massachusetts 02138(617) 491-1850Steam generator feed pumps are generally considered to be one of the principal sources of high sound levels inside electric power plants. This case history describes the noise control work associated with two boiler feed pumps at a coal-fired electric power plant. This work was a part of an overall program to reduce employee noise exposure throughout the plant.Problem DescriptionEmployees at electric power plants sometimes work near machinery that produces high levels of noise. An electric utility retained Bolt Beranek and Newman Inc. to study the employee noise exposure in one of the utility’s large fossil-fueled power plants. As a result of this study, several major noise sources were identified. Noise control treatments were designed for these sources to reduce sound levels to less than 90 dBA in the frequently occupied areas of the plant. The problem described in the following case history is that of designing and installing acceptable enclosures for the boiler feed pumps.The two boiler feed pumps for this station are located on the operating level of the turbine building. The pumps’ design load at 5600 rpm is 7000 gpm with a discharge pressure of 4400 psig and water temperature of 330°F. Each pump is driven by a 21,000- hp steam turbine.The pumps produced a high level of tonal noise. The pump tone was within the 1000-Hz octave band and, because of its high level (100 to 105 dB near the pump), it controlled the A-weighted sound level throughout the turbine hall.Problem AnalysisThe owner of this plant had decided to study the feasibility of reducing plant sound levels to less than 90 dBA in all frequently occupied areas and to adopt this sound level as a design goal for noise control treatments. The turbine hall is a frequently occupied area of the plant and, because of the boiler feed pump, the sound levels varied from about 92 to 98 dBA.Other noise sources in the turbine hall — beside the boiler feed pumps — included the pumps1 drive turbines, the main turbine, the main generator, and the exciter. Narrowband analysis of the noise throughout the turbine hall indicated that the boiler feed pump
CASE HISTORY 33: STEAM GENERATOR FEED PUMP(OSHA Noise Problem)
185

tone controlled the A-weighted sound level at almost all locations. Further analysis indicated that if the level of pump noise and its tone could be adequately reduced, the sound levels throughout the turbine hall would be about 90 dBA or less.On the basis of a careful analysis of the narrowband data and a subjective analysis (listening to the sound in the turbine hall), it was determined that only the boiler feed pumps required treatment. Many close-in measurements and tape recordings were made near the pump. Analysis of these data indicated that the tonal noise was radiating strongly from much of the pump surface.Three types of noise control treatments could be considered for this pump :
(1) Acoustical lagging applied to the exterior surface ofthe pump. This treatment has been applied to boiler feed pumpswith some limited success. It has been found difficult, however,to design and construct a well-isolated complete lagging treatment that can be easily removed and replaced during pump maintenance .
(2) Modification of the pump flow path was considered a possible alternative. Discussions with the pump manufacturer indicated that a reduction of 6 dB to 10 dB might be obtained and that the manufacturer could perform the necessary machine workon the impeller at their shop. The owner was somewhat concerned about modifying his pump because of a potential reduction in pump performance and also because of required down time. (Outages at a power plant can cost up to $100,000 per day.)
(3) Enclosures for the puiaps could provide the necessary insertion loss. Difficulties related to this approach included the safety of personnel inspecting the pump inside the enclosure, ventilation of the enclosure, and easy removal/replacement during pump maintenance.Control DescriptionA complete enclosure was designed for each pump. The enclosures are about 19 ft * 19 ft x 10 ft high and include several sections easily removed by the existing overhead crane. Three gasketed doors, each with a window, are included to ensure that a worker would not be trapped if a high-pressure steam leak developed while he was inside the enclosure. The walls and roof are constructed of 16-gauge sheet steel outer surface, 4-in.-thick glass fiber insulation, and 22-gauge perforated sheet steel inner surface. Several penetrations of the enclosure were necessary for lines, drive shaft, etc. The penetrations were small, and they were sealed where possible. Interior lighting was provided, as was a temperature monitor.
186

Ventilation of the enclosure was also provided to reduce the build up of heat. Some difficulties have been experienced in this area. During the summer months, the temperature within the enclosure reached 125°F. While this heat does not affect the pump, it is uncomfortable for a worker inspecting the pump. It is expected that a modification of the ventilation system will correct this heat build-up problem.ResultsThe owner is pleased with the results obtained with the enclosures for these two pumps. Sound levels throughout the turbine hall have been reduced from the previous levels of 92 to 98 dBA down to the present levels of 88 to 89 dBA. The sound in the turbine hall is generally broadband and controlled by other sources. Octave-band sound pressure levels measured several feet from the enclosure are shown in Figure 6.33.1 and are compared to measurements made before the enclosure was installed. The enclosure insertion loss is at least 19 dB in the 1000-Hz octave band that contained the pump tone. The measured insertion loss shown in this figure is limited by noise from other sources. It is clearly shown that the tonal character of the sound has been reduced, the A-weighted sound level has been reduced to less than 90 dBA, and the speech intelligibility for this area has been improved.
315 63 125 2 5 0 5 0 0 1000 2 0 0 0 4 0 0 0 8 0 0 0
OCTAVE BAND CENTER FREQUENCY (H z l
Figure 6.33*1. Measurements near boiler feed pump.
187

Plant workers were somewhat concerned about the effects this enclosure would have on pump accessibility during maintenance work. Since installation, however, the enclosure has been removed twice and reinstalled without difficulty. Removal time in both cases was less than 20 min.It is often Important to contact the equipment manufacturer prior to enclosing his equipment. His advice and experience can lead to improved designs. Discussions with in-house maintenance, safety, and operating personnel are essential.
1 8 8

Richard C. PotterBolt Beranek and Newman Inc.50 Moulton StreetCambridge, Massachusetts 02138(617) 491-1850Mufflers for equipment such as internal combustion engines, compressors, and vacuum pumps can effectively reduce inlet and exhaust noise. However, the muffler shell and associated ducts can themselves be effective radiators of noise and may require additional treatment so that the muffler can perform up to its potential. This case history discusses a complete enclosure built around a vacuum system exhaust muffler to reduce sound levels in the nearby community.Problem DescriptionFourteen vacuum pumps are used to extract exhaust gases from an engine test cell when experiments are to be conducted at low- pressure conditions. These pumps discharge to a common 48-in. duct that leads to three low-frequency mufflers connected in parallel and grouped together outside the test facility building. When the vacuum pumps are operating, a distinctive tonal noise can be heard beside the mufflers and at some distance from the facility. The amplitude of this tonal noise varied slowly in level with a fairly regular period of about 10 sec. These pumps were operated only while other noisy sources were also operating. However, the distinctive character of the pump noise was helpful in determining its contribution to total plant noise in the community.Each muffler was cylindrical in shape, 16 ft long and 5 ft in diameter, and thus had a large surface area to radiate sound.The mufflers were also on a nearly direct line-of-sight to the community near the plant. Each muffler also had a single 30-in. vertical discharge duct that extended to a position 35 ft above ground elevation.The purpose of the overall noise control program was to reduce the plant sound levels to less than that stipulated by the city ordinance. For the vacuum pump discharge, it was necessary to determine (1) its contribution to the total noise from the plant,(2) the required insertion loss, and (3) whether the required insertion loss could be obtained by treating only the muffler discharge or only the muffler shell, or both together.Problem AnalysisThe city noise ordinance limits nighttime industrial noise to 55 dBA at residential boundaries. Continuous measurements of the
CASE HISTORY 3^: MUFFLER SHELL NOISE(Community Noise Problem)
189

ambient sound at the nearest residential boundary (i.e., with the plant shut down) indicated that the ambient sound was often greater than 55 dBA. It was less than 55 dBA only about 30% of the time, during the quietest periods between 1 a.m. and 6 a.m. and without the plant operating. Because test rigs were planned to be operated later than 1 a.m., It was considered necessary to establish a plant design goal even more stringent than the ordinance, to avoid any possibility of community complaints.An octave-band sound pressure level design goal is far more useful than a single-number sound level goal because the performance of noise control treatments is frequency-dependent. The octave-band sound pressure level design goal was chosen to have a shape similar to the spectrum of the plant noise and a sound level equivalent of 55 dBA. The design goal for the vacuum pump discharge system and the other plant sources investigated was then chosen to be 5 dB lower to account for simultaneous operation of several sources.Measurements made near the muffler shell and near the discharge opening showed similar levels of noise. Vibration measurements made on the muffler shell and large intake duct showed high levels of vibration. A narrowband analysis of the shell vibration and farfield noise showed very similar tonal content — a fundamental frequency at 88 Hz and harmonics of this frequency up to 1000 Hz. The strong tone and its harmonics were the result of the 12 pump vanes rotating at a frequency of 435 rpm.The interior of the muffler was inspected visually to confirm that no mechanical damage had occurred. On the basis of this inspection and the investigative measurements discussed above, it was concluded that the principal radiating area was the muffler shell — not the muffler discharge opening.The sound pressure levels near the muffler and in the community are shown in Figure 6.34.1 and are compared to the plant design goal. The required reduction in sound levels is the amount by which the residential sound levels exceed the goal, plus an additional 5 dB to account for other sources. The reduction is 22 to 26 dB in the 63- and 125-Hz octave bands and 7 to 10 dB in the 250- to 1000-Hz octave bands.Control DescriptionThree alternative noise control treatments were considered to provide the significant reduction required in the lower frequency octave bands:
(1) Lagging the muffler shells and intake duct with a thick isolation material and a heavy metal outer surface;
(2) Enclosing the mufflers and intake duct with a concrete wall lined with a sound-absorptive material;
190

(3) Enclosing the mufflers and intake duct with a staggered stud double wall with interior sound-absorptive material.A lagging treatment was rejected in favor of an enclosure because of the inherent difficulties associated with providing adequate isolation and adequate support of the outer metal cover. The plant owner selected the double wall design rather than the concrete wall because of construction details at his plant.The final construction design included a 24-gauge corrugated steel siding bonded to 1/2-in.-thick gypsum board supported on steel studs. The inner wall is separately supported on steel studs 5 in. from the outer wall. The inner vrall consists of 1/2-in.-thick gypsum board and 4-in.-thick, 4 lb/ft3 glass fiber board spaced out 2 in. from the inner wall. The 4-in.-thick glass fiber lining is provided as a sound-absorptive material to prevent the build-up of a sound within the enclosure. A fully gasketed acoustical-type8 ft x 8 ft door is provided for access into the enclosure.ResultsThe insertion loss of this enclosure has not been measured. The plant owner has, however, indicated that the vacuum pump system discharge is now nearly inaudible at a distance from the new enclosure. The pump system noise has been reduced to the point where it is masked in the community by other sources at the plant. The overall plant noise reduction program is still underway — the vacuum pump exhaust system was one of the first plant sources to be treated.
191

OCTA
VE
BAND
SO
UND
PRES
SURE
LE
VE
UdB
re
20 p.
Po)
OCTAVE BAND CENTER FREQUENCY (Hz)
Figure 6.34.1. Vacuum sound pressure levels and residentialcriterion.192

Richard J. Peppin Jack Faucett Associates 5^54 Wisconsin Avenue Suite 1150Chevy Chase, Maryland 20015 (301) 657-8223This case history compares four separately designed and installed enclosures for concrete block-making machines from the standpoint of acoustical performance, maintenance, and production. This work illustrates several important considerations in enclosure design.Problem DescriptionFigure 6.35.1 shows a typical mechanical block machine. The machine accepts raw material in the form of water, binder, sand, etc. from a hopper above the machine and forces it into a mold while the molding is vibrating, until the mixture is of the proper
CASE HISTORY 35: CONCRETE BLOCK-MAKING MACHINES(OSHA Noise Problem)
Figure 6.35-1. Typical concrete block manufacturing machine.
193

volume and consistency. The mold is then withdrawn, and the finished concrete block leaves the machine.The blocks are formed on 1/4-in.-thick steel rectangular pallets that transport the uncured blocks to a rack system, by which they are stacked for curing and later storage. Depending on the operation of the facility, the blocks and pallets are carried to curing kilns by either automated or manual* transfer. After a sufficient time, the blocks and pallets are removed from the kilns and placed on another rack system. This system separates the blocks from the pallets, returning the pallets to the machine to be cleaned and reused for new blocks, while sending the blocks to the cubing area, where they are stacked for yard storage and eventual use in construction. Figure 6.35.2 shows the typical material flow paths for a block machine. If there is more than one machine in a plant, each machine has its own similar material flow path.
Figure 6.35.2. Typical concrete block plant material flow plan.
Operators work close to their machines to observe the machine functions and to make quick corrections as needed and, usually, because the control panel is integral to the machine. Operators1 noise exposure is governed by the following sources:
^Usually by a forklift truck.
194

(1) The vibrations operations mode: Eccentric weights,attached to the mold, vibrate the mold to provide the proper compaction of the concrete mix. The mold vibrates against the steel pallets and produces cyclical sound levels with a maximum of about 115 dBA measured at about a meter from the mold.The vibration mode occurs only when the mix is being molded. As the block leaves the machine, the vibration ceases. Vibration lasts for about 6 sec during each 10-sec cycle. The timing of the cycling is highly dependent on the operating condition and production of the machine.
(2) The pallet cleaning operation: As the pallets are returned to the machine, an accumulation of dried concrete must be removed from the pallet surface by brushing and scraping the pallet. The frictional force of the scraping blade on the pallet produces a high-pitched noise, clearly audible and probably more annoying than the higher level, broadband vibration noise.
(3) The pallet impact noise: Pallets are stacked withinthe machine, so that the supply to the block machine is sufficient. When the pallets are returned, they must change direction (usually by a sharp-right-angle, discontinuous conveyor) and stack up. The stack-up and direction change are locations for metal impact. These impact sound levels are relatively high and of short duration. The frequency of impact depends on the production rate.There are other noise sources in the plant, although they are of minor concern in relation to the block machine. Three common secondary sources are:
(1) The cuber machine, which stacks the blocks mechanically or hydraulically
(2) The hydraulic pumps, which are used to operate the hydraulic block machines
(3) The rack motion, which produces a high-pitched noise caused by friction with the guide rails.(It should be noted that the block machine enclosure does nothing to reduce these secondary noise sources.)Problem AnalysisThe work reported on here was done as the first phase of an extensive study to determine if enclosures could be effective as a means of noise control for concrete block manufacturing machines. Concrete block manufacturers have recognized that these machines are responsible for OSHA noise overexposures, and thus the work
195
reported on here did not include any detailed noise source analysis, nor were baseline data, reported. However, design considerations were detailed as follows.Ideally, the acoustical enclosure should be designed to surround the block machine completely. The noise reduction would then depend basically on the material of the enclosure's construction. In practice, at least four enclosure penetrations are required:
An entrance for raw material inputA discharge for the block and palletAn entrance for the palletVentilation paths.
This type of machine requires additional constraints in the enclosure design which, in general, subtract from its ideal acoustical performance:
The major design consideration is safety; the enclosure should not promote any unsafe conditions which may be caused by a worker1s inability to see impending danger or by his difficulty in moving away from a hazardous situation.To maintain equipment at proper working temperature and to remove possibly toxic fumes, an adequate ventilation system must be provided.When the block machines need maintenance and/or overhaul, the enclosure should allow access to the machines with minimum effort.As the concrete mix pours into the mold and during molding, the mix falls from various sections of the machine. Hence, the machine and the area in the vicinity of the machine are constantly being sprayed by this concrete mix. This mix builds up and hardens quite rapidly, and it must be removed frequently. Removal is usually by hand, and thus easy access to the machine must be provided for clean-up.
Control Descriptions and ResultsPlant 1Figure 6.35*3 shows the maximum sound level contours produced by the enclosed block machine. The enclosure construction consists of 1/16-in. sheet steel with 1-in. thick to 2-in. thick open-cell foam lining the interior. Single-light, 1/4-in. glass
196

Figure 6.35.3* Plant 1: maximum sound level contours.
is used for the viewing ports. Hard rubber flaps are used as panel gasketing. Doors on two sides provide access without necessitating dismantling of the enclosure, although lack of clearance between the machine and enclosure walls makes working space very tight. By mounting three sides of the enclosure on rollers, the enclosure can be easily opened for machine access and cleaning. However, the easy access offered by this method also allows the enclosure to be damaged easily because it is often opened. Because of the poor fit after much use and also because of the hard-rubber, nonyielding gasket, air leaks exist at almost every joint. Thus, in practice, the enclosure is relatively inefficient compared to its potential acoustical effectiveness. Furthermore, noise "flows" out of the large material entry and exit ports. This leakage is not important in this case, because other leaks are as predominant a flanking path as the material ports.Although the contours show that the sound level of the plant is, at times, above 90 dBA, the enclosure is effective since the plant personnel exposure does not exceed the OSHA-allowable criterion. The sound levels inside the machine are about 110 to 115 dBA. The cost of the enclosure was $10,000 to $12,000* in 1972.
*This cost does not include time for plant personnel, product iondelays, etc.
197

Plant 2Plant 2 has two block machines, and only one machine is enclosed. The enclosure in Plant 2 is constructed of 1/2-in. plywood with an interior surface of 3-1/2-in. loose fill and 2 1/2 in. of glass fiber batting. The windows are gasketed Plexiglas. The total enclosure cost about $15,000* in 1973. Figure 6.35.4 shows the A-weighted sound level contours with the only enclosed block machine in operation.Acoustically, the enclosure is effective although very inefficient. The noise reduction could be significantly increased if the access doors were gasketed. Further improvements can be gained by providing acoustically lined ducts for block/pallet output and pallet input. Practically, however, the enclosure is unsatisfactory; accessibility to the machine is difficult, heat build-up is high, the Plexiglas windows are so scratched that they are almost opaque, cull (scrap) production has increased, and production has decreased significantly. The heat build-up is so high the enclosure door is left open to ensure adequate ventilation. These drawbacks led management to the decision not to enclose the second machine until a better enclosure (or other means of reducing employee noise exposure) is
Figure 6.35.4. Plant 2: maximum sound level contours.
*This cost does not include time for plant personnel, productiondelays, etc.
198

designed. Figure 6.35.5 shows the contours with both machines operating. The operation of the unenclosed machine makes the enclosure completely ineffective except at the cuber area, where the enclosure acts as a noise barrier.
Figure 6.35.5. Plant 2: maximum sound level contours(enclosed machine operating).
Plant 3This plant has a hydraulic block machine. The enclosure consisted of 1/16-in. sheet steel with 1/4-in. foam/l-lb/ft2 sheet lead/ 1-in. foam interior. The doors are well gasketed and sealed with refrigerator-type locks. The five viewing ports are doublelight (1/8-in. glass/approximately 3-in. airspace/l/8-in. glass), well-gasketed glass. Although there are penetrations of the enclosure, the small clearances between the material and the enclosure shell provide minimum noise leakage. The heat build-up problem is reduced by the addition of a 21,000-BTU air conditioner. The enclosure cost between $20,000 and $40,000* in 1973.
*This cost does not include time for plant personnel, productiondelays, etc.
199

The hydraulic pumps used to power the block machine are away from the machine and are partially enclosed with a plywood and lead/ foam-lined shell which extends over the top and halfway down the sides.Figure 6.35.6 shows the maximum sound level contours in the plant. This is an acoustically effective enclosure. In addition, employees have only minor problems in day-to-day operation of the machine with the enclosure. Access doors to the machine and clearance inside allow two or three people in the enclosure to repair or adjust the machine. Clean-up also is relatively simple.
Figure 6.35.6. Plant 3: maximum sound level contours.
Plant 4Plant 4 has two enclosed mechanicail block machines. Both enclosures consist of 1/16-in.-thick sheet steel with interior surfaces lined with 1/4-in. foam/l-lb/ft2 sheet lead/l-lb foam.The small viewing ports are gasketed Plexiglas and are used only for adjusting the timing of the machine. The sides and front
2 0 0

slide up on guide rails to provide machine access and allow for clean-up and mold change. Double gasketing Is used throughout. The clearances between the material and the enclosure are small at each enclosure penetration. In addition, the block/pallet exit port consists of a small lined duct. Each enclosure cost approximately $30,000* in 1 9 7 3 -Figure 6.35-7 shows the maximum sound levels produced during the vibration cycle with one enclosed machine operating. In this plant, there are other major noise sources: bin vibratorsand pallet impacts. Figure 6.35-7 also shows sound levels, at selected locations in the plant, caused by the bin vibrator. Figure 6.35*8 shows a detail of the operatorTs station. The increase in sound levels from the other noise sources is noted and is apparent.The employees felt the enclosure was beneficial: It did notdecrease production and made the plant significantly quieter.
Figure 6.35-7. Plant 4: maximum sound level contours.
*This cost does not include time for plant personnel, productiondelays, etc.
201

Figure 6.35-8. Detail of operator's position and maximumsound levels.
2 02

Problem DescriptionIn a boxboard waste paper mill, Jordans are used to refine the waterborne pulp. A Jordan consists of a conical shell and rotating conical plug, both with steel blades on their mating surfaces. The refining action can be adjusted by decreasing the spacing of the revolving cone to the stationary cone within the limits of power available from the drive motor. In this case, drive motor power is 500 hp.The action of the Jordan refiner results in high sound levels.With maximum refining power, the sound level was found to be 97 dBA at the aisle (102 dBA 1 ft from Jordan surface) during start-up with only one Jordan in operation. As normal operation required 6 of the 8 Jordans in operation with varied power settings, depending on degree of refining required, the operating sound level in the aisle was often at about 100 dBA. Although the paper maker did not have to be In the area continuously during the shift, he was required topmake periodic adjustments, which took more time than the maximum exposure of 2 hr at 100 dBA permitted by current regulations. Some noise reduction was therefore required.Problem AnalysisIt was determined from vibration measurements that the major vibration surfaces were the conical shell, end cover plate, and outlet box. Shell acceleration measurements were made with a hand-held pickup attachment to the sound level meter to determine the major vibration surfaces as summarized below:
CASE HISTORY 36: JORDAN REFINERS(OSHA Noise Problem)
VibrationAreas selected for treatment (g)
Shell surface, large end 15.9Shell surface, rib 20Flange face 10Shell surface, center 15-9Shell surface, rib 11.2Shell surface, small end 5Outlet box 7.9
203

VibrationAreas not to be treated L&l
Bearing support 2.5Overhead piping 1Drive motor and bell (1) 0.9Drive motor and bell (2) 1.4
Only sound level readings were obtained because octave-band data would not have added any information for these purposes.
■>
Control Approaches ConsideredTwo possible solutions were considered: (1) complete enclosureand (2) partial lagging of the Jordan shell. Total enclosure of each Jordan was possible but was not considered as practical as lagging. There were 8 Jordans near each other; adjustment and maintenance would create problems, and sound absorption material inside the enclosures would not be compatible with the wet conditions of this paper mill. Partial lagging was chosen since it could be installed on the major vibrating surfaces producing the noise. Separation of lagging could be designed to allow for maintenance dismantling of the front face and plug. The sound- absorbing material of the lagging could be covered with layers of sheet lead, taped to form a water-resistant surface that would withstand cleaning normal to paper mills.The lagging consisted of a resilient (and absorbing) layer of 3~in. Fiberglas grade TIW, covered by an impervious and heavy layer of lead sheeting to serve as the mass element and to contain the noise. In theory, a 1-lb/ft2 lead sheeting, perfectly covering the area, would give an attenuation of 24 dB at 500 Hz and 28 dB at 1000 Hz. From a practical standpoint of making a more impervious continuous barrier for both noise and water from cleaning hoses, two layers of lead were used, each layer taped for tightest j oints.Alternate materials could be considered: The absorbing layercould be polyurethane foam, and the barrier layers could be lead- loaded vinyl. However, the Fiberglas is much more resilient, and thus preferred.In another paper mill, a third method was chosen: enclosure forthe operators. As the time actually spent in making the adjustments during the shift was small, the daily noise exposure index would be at or below the allowable 1.0 if 1-1/2 to 2 hr exposures at 100 dBA were balanced with the remainder of the shift in a protected area below sound levels of 90 dBA.
204

Since this reduction would require only a minimum shelter for 15-dBA attenuation, a simple construction could be used consisting of 1/2-in. plywood, on both sides of a 2- * 4-in. framing, with one door and a viewing window plus lighting. Because of paper mill conditions, the enclosure was heated and air conditioned for worker comfort. Recordkeeping could be done inside the enclosure.The sound level was 77 dBA inside the control room and 97 dBA outside. Lowering the sound level inside the enclosure would require wall construction with a higher transmission loss material (such as concrete block).Control DescriptionA sketch was made following the lagging design parameters discussed above, requiring 3-in. Fiberglas grade TIW, plus two top layers of 1/64-in. lead sheeting, all held to the surface by "stik-klips" glued to the surface (normal method of acoustic application in buildings). Each layer of the lead was waterproof- taped to protect the absorbing layer from water. Two layers were used to get best waterproofing.Shafts, bearing boxes, and the drive motor were not lagged because vibration readings did not justify the noise control treatment as noted above.The sketch shown in Figure 6.36.1 was used by an acoustic contractor for estimating and installation purposes. Cost was $600 per Jordan, averaged over all 6. Total enclosure cost would have been at least $4,000 for each Jordan, based on a quotation from an enclosure supplier; thus, lagging achieved a net savings of $3,400 per machine.ResultsFor a single Jordan paper-pulp refiner, the sound level at the operator station was reduced by 11 dB, from 97 dBA to 86 dBA.With all 8 Jordan refiners similarly lagged and running at normal production, the aisle sound level ranged from 88 to 91 dBA. Even for unusually high production in the fastest mode, these same sound levels ranged from 92 to 94 dBA. This lagging produced acceptable daily noise exposures of less than unity.CommentsPaper mill conditions should be studied carefully because the sound-absorbing material performance can suffer because of wet conditions in a paper mill. Maintenance methods were reviewed before design, leading to a separation of the lagging at the front flange so that it could be removed for maintenance.
205

n o
foundationCover shaded area with 3-inch Fiberglas TIW plus 2 of l/64-inch sheet lead. Tape for water resistant Fasten stik-klips and caps.
Figure 6.36.1. Noise reduction lagging for Jordan shell
206

Problem DescriptionIn a corrugated box factory, slit side-trim is removed from the conveyor by air. Trim blower fans with extra heavy blades cut the trim while conveying it via ducts to bins and balers. The12-in. ducts are suspended from the ceiling about 10 ft from the floor, crossing a 40-ft-long work room en route to the bins and baler room. The trim is carried along in the ducts by the air, which normally moves about 6000 ft/min. The trim often strikes the duct walls (mainly at bends), causing noise.In the case described here, ear-level sound level was 93 dBA.Noise reduction was desired to improve worker communication for operations under ducts and to meet the requirements for OSHA compliance.Problem AnalysisOctave-band data were collected because this case required not only a reduction of a few decibels to comply with minimum regulations, but noise reduction for safety reasons, to control speech interference. Octave-band data provide a truer measure of speech interference than a single-number dBA reading. For the minimum compliance data, the dBA reading would have been adequate.Control DescriptionThe solution chosen was to wrap the problem duct locations with2 in. of mineral wool building insulation to furnish a resilient and absorbing layer. Over this insulation were placed two impervious layers of heavy tar paper, spirally wrapped with 5 0 % overlap.ResultNoise was reduced considerably in the problem area: The soundlevel changed from 9 3 dBA to 72 dBA, a reduction of 21 dB. To the ear, the noise could hardly be heard above other noise.The octave-band comparison is shown in Figure 6.37.1. Although the standard materials used were very economical, special acoustic absorber pipe coverings with lead-filled vinyl sheeting could also have been used and may have given even more attenuation. This was not needed here.There are no detailed costs for this case history. However, since the materials are inexpensive, the major cost must have been labor. The job was probably done for less than $200.
CASE HISTORY 37: PNEUMATIC SCRAP HANDLING DUCTS(OSHA Noise Problem; Speech Interference Problem)
207

OCTAVE BAND CENTER FREQUENCY (H i)
Figure 6.37.1. Noise levels in scrap duct for corrugated boxindustry, before and after covering.
If less attenuation had been required for OSHA compliance only, the sheet metal ducts could have been damped and transmission loss improved by gluing 1/32-in. sheet lead to the duct outer surface. Comparison with the experience at other installations indicated that a 5-dB attenuation would probably have been attained. (See Case History 5 for other methods.)CommentsUse the most economical methods to attain the attenuation required. The building insulation plus roofing paper used here is a very economical solution.Note that a large overlap was used; lack of overlap on any wrapping will cause leaks and reduce attenuation.
208

Problem DescriptionThis plasma production room has two parallel banks of centrifuges, 15 to a bank, plus refrigeration units. A sketch of one centrifuge is shown in Figure 6 .38.1 . Centrifuge spinning frequency is 13,000 rpm (217 Hz). Though centrifuges appeared to be the major noise source, refrigeration units were also evaluated. The same refrigeration units without centrifuges are used in a separate reconstituting room.
CASE HISTORY 38: BLOOD PLASMA CENTRIFUGE(OSHA Noise Problem)
Figure 6 .38.I. Sketch of one centrifuge (front view).
Problem AnalysisOperator sound level was 97 dBA with one bank in operation; 100 dBA was predicted with both banks operating. Figure 6.38.2 shows the measured sound pressure levels at the operator positions in both the centrifuge and refrigeration rooms and also a 90-dBA criterion spectrum.
209

OCTAVE BANDCENTER FREQUENCY (Hz)
Figure 6.38.2. Sound pressure levels at operator position.
Close-in diagnostic readings were made around the centrifuges at the locations shown in Figure 6 .38.3.A comparison between the operator position spectrum in the centrifuge room and the 90-dBA criterion curve indicates that the 500- to 4000-Hz bands merit the most attention. The fact that the operator position spectrum in the refrigeration room is considerably lower in level in all octave bands suggests that the refrigeration unit noise is not a significant contributor to the noise exposure in the centrifuge room.Close-in data show that the maximum sound pressure levels in the 500- to 4000-Hz octave bands occur close to the motor exhaust and near the pulley guard surface. The pulley guard surface was presumed not to be an important noise source; it was reasoned that the sound pressure levels measured near the pulley resulted from motor exhaust and other sounds being reflected from the highly reflective pulley guard surfaces.Results of the measurements indicated an unacceptable exposure when the operator was exposed for 4 hr to both centrifuge banks (predicted level at 100 dBA). Under these conditions, the operator’s daily dose was 2.0, which thus exceeded the acceptable exposure of 1.0, as specified by OSHA noise regulations.
210

Figure 6 .38.3. Sketch of centrifuge showing locations for close-in diagnostic readings.
211

There are three general locations for controlling noise: at thesource, along the transmission path, or at the receiver. Two could be used in this case. A properly designed and constructed muffler or partial enclosure for the centrifuge motor exhaust would provide the necessary source control, using materials and geometric configuration that have effective attenuation in the octave bands of interest. Such a control measure would provide an expected 3- to 7-dB attenuation.Noise control measures can also be used along the path of transmission. The paths of airborne noise transmission were from direct and reverberant fields such as walls, floor, and ceiling, which supply very little sound absorption.For direct field reduction, barriers with the proper transmission loss, dimensions, and orientation may be used. The reverberant field can be controlled by the addition of absorbent materials. These combined measures would reduce operator exposure 5 to 15 dB.Control DescriptionIn this case, after discussion, two of the possible control methods were eliminated. The hard and impervious walls had to remain because of the need for daily sterilization by high-pressure steam and water hosing and hand scrubbing. A porous absorbent surface would provide areas for bacterial growth and would not withstand the rigorous daily cleaning. A barrier to shield the operator from the centrifuge motor noise was eliminated from consideration because it would block the proper flow of refrigerated air. Even a small warming of the plasma would produce an unusable product.It was decided to try the motor exhaust muffler and see how much noise reduction could be achieved.The muffler was designed with a stainless steel outer skin, lined with acoustical absorbent spaced 2 in. from the inside of the steel shell, with small blocks. The 2-in. air space allows absorption since it reflects from the inner steel surface and back through the absorbent. The muffler has one 90° bend, as shown in the sketch in Figure 6.38.4. In-house shop cost was estimated at $300.ResultsNoise at the operator’s position was reduced from 97 dBA to 92 dBA, satisfactory for a 4-hr exposure. The motors of both centrifuges must be treated if they operate together.
Control Approaches Considered
212

18 inches
"FT
6 inches
12 inches
12 inches
Cross section of muffler I showing absorbent, bend,[ and dimensions. Absorbent ! is 2 in. from surfaces.
J l
Figure 6.38.4. Motor exhaust muffler.
CommentsAn airtight seal at the junction of muffler and motor is very important; resilient caulking compound was used as a sealant.An air leak with an area of no more than 10% of the muffler cross section would produce as much noise as if the muffler were not there at all. An intake muffler would probably also help, but noise from other sources would then become prominent.Effectiveness of noise control is reduced if the path of vibration transmission is not held to minimum. Accordingly, it was very important to use as few absorbent spacers as possible. In so doing, the steel skin vibration was kept small. The spacers can be made of damping material to reduce resonant vibration of the skin.Although one main control solution would satisfy the noise control requirements, alternatives should be discussed with company representatives, as they are able to specify important operating, maintenance, and production constraints that may limit the ideal noise control treatment.
213

CASE HISTORY 39: PNEUMATIC MOTORS(OSHA Noise Problem)
Problem DescriptionAir-operated motor hoists are a noise source in many industries that make extensive use of materials-handling systems.Control DescriptionAs the noise source is the exhaust air, this exhaust can be muffled by using off-the-shelf mufflers selected for the air pressure and delivery of the exhaust.ResultsA typical octave-band analysis, before and after installation of an exhaust muffler, is shown in Figure 6.39-1- Note the rising spectrum that is characteristic of freely escaping high-pressure gas. Another case showed the following A-weighted sound levels at the floor for a 1-ton air hoist:
OCTAVE BAND CENTER FREQUENCY ( H z )
Figure 6 .3 9 .1 . Effect of muffler on air exhaust from hoist.
214

No Muffler With MufflerUp - no load 98 85Up - 600 lb 96 84Down - no load 102 88Down - 600 lb 100 86
Air exhaust from other tools can be similarly muffled, designs Include mufflers, which should be specified at
215
Newer purchase.

Problem DescriptionIn paper manufacturing, a fine-grained mineral slurry is dewatered by a suction press and a vacuum pump. The mixture of air and water discharges into a drain; slugs of water make the discharge pulsate irregularly. Although nc workers stay long in the discharge area, the levels are high even at considerable distances from the discharge pipe. In one instance, the pipe was inadvertently tuned to the pump pulse frequency, thus compounding the problem.Control DescriptionThe solution is a special combination muffler and water/air separator called a snubber. Besides use of the snubber, the line length should be changed to detune the system.ResultsFigure 6.40.1 shows the effect of adding a snubber and the greater effect of two snubbers. The low-frequency resonances are greatly reduced by this direct scheme. Sound-levels close to the discharge pipe were changed from 112 dBA to 103 dBA with one snubber .and 93 dBA with two snubbers. Some of the low-frequency reduction is probably due to the detuning effect of the change in the acoustic length that the snubbers introduce.
CASE HISTORY 40: DEWATERING VACUUM PUMP*(OSHA Noise Problem)
*Young, R.L. 1958. Practical examples of industrial noise control, Noise Control 4 (2): 11.

OCT
AVE
BANP
SO
UND
PRES
SUR
E LE
VEL
(dB
re
20
>iP
o)
Figure 6
31.5 63 12 5 250 5 00 10 0 0 200 0 400 0 6 0 00OCTAVE BAND CENTER FREQUENCY (Hz)
40.1. Octave-band analysis of paper mill vacuum pump noise (converted from old octave-band designation).
217

Robert M. Hoover Eric W. WoodBolt Beranek and Newman Inc.50 Moulton StreetCambridge, Massachusetts 02138(617) 491-1850The use of large induced-draft fans (greater than 5000 hp) , common in new fossil-fueled electric power plants, may cause noise problems in communities near the plant. In the following case history, a successful noise control treatment for an electric power plant induced-draft fan system is described.Problem DescriptionTwo oil-fired units, each capable of generating 600 Megawatts (MW) of electricity, were constructed within 1500 ft of a suburban community in the northeastern section of the United States. A serious community noise problem, caused by plant noise radiating into the community, became evident shortly after the first generating unit became operational. Verbal and written complaints were received by the utility, adverse letters and articles were published in the local newspapers, and threats of legal action were received.Bolt Beranek and Newman Inc. consultants were retained to study the problem and recommend appropriate noise control treatments.They determined that the plant noise heard in the community was generated by the induced-draft fans and was radiated primarily from the top of the dischrage stack and secondarily from the fan discharge breeching.The fans involved are two backwardly inclined, 12-bladed, centrifugal units, each of which delivers about 800,000 ft3/min at 19 in. of water static pressure at a gas temperature of about 300°F. They are driven by 5000-hp, 900-rpm, single-speed electric motors. The induced-draft fan system layout of Figure 6.41.1 is similar to the layout described in this case history.Problem AnalysisOctave-band and tape-recorded measurements were made of the noise in the community, late at night and early in the morning, with and without the plant operating. These data provided the maximum amount by which the plant noise exceeded the residual ambient sounds and helped to establish the noise reduction goal. The goal was to reduce the continuous plant noise to approximately the level of the residual ambient in the community prior to plant operations.
CASE HISTORY 4l: INDUCED-DRAFT FAN(Community Noise Problem)
218

Figure 6.41.1. Induced draft fan system layout.
To identify the plant noise sources that contributed to the sounds measured in the community, data were obtained close to possible noise sources and used to estimate their contribution to the levels measured in the community. For example, Figure 6.41.2 illustrates octave-band sound pressure level measurements of the fan noise that were obtained on the boiler house roof, about 200 ft from the stack opening and just below the top of the stack. This position is in the far field of the stack opening, but not
219

Figure 6.41.2. Measurements of fan noise.
so distant that sound measurements are complicated by varying sound propagation conditions. Also shown in Figure 6.41.2 is a measurement made in the community. The differences between the close-in and community position sound pressure levels are (except in the high-frequency range where ambient sounds influenced the community measurements) consistent with the assumption that community noise is dominated by sounds Radiated by and hemi- spherically spreading from the sound measured — the stack opening. Of course, sound radiating from the stack originates within the fan itself. Similar close-in measurements indicated that the ductwork between the fan and the stack was a contributing source.It was concluded that a suitably designed muffler, inserted in the fan discharge duct near the fan discharge, could solve the noise problem. The muffler would attenuate the fan sounds before they propagated into the ductwork and thus would control the emissions from both identified important noise sources (the ductwork and the stack opening).Control DescriptionTo alleviate the community noise complaints from the first operational unit and to avoid complaints about the second unit, a parallel baffle absorptive muffler was designed. The muffler
220

design incorporated adequate insertion loss to ensure that the fan sounds would be nearly inaudible in the community and considered structural requirements, aerodynamic pressure losses, corrosion, erosion, clogging from contaminated gas, self-noise, and available space for inspection. The muffler was installed in the discharge ducts of both fans, approximately as shown in Figure 6.41.1.ResultsThe results achieved after installation of the fan discharge muffler are shown in Figure 6.41.3. The upper curve, from Figure6.41.2, indicates the unmuffled sound pressure levels measured in the community. The lower solid curve shows the sound pressure levels measured at the same location after the fans were muffled. The cross-hatched range shows the lower ambient levels measured during the day and the night. As can be seen, the muffled fan sound pressure levels are close to the community ambient. Complaints about noise from these fans have ceased. On the basis of the success of the mufflers in the first generating units, similar mufflers were installed in the second unit while it was being constructed.
OCTAVE BAND CENTER FREQUENCY (Hi)
Figure 6.41.3. After installation of fan discharge muffler.
221

Information on fan noise prediction can be found in Graham (1972*) and muffler design information is available in Beranek (1971^). Clogging of muffler elements by contaminated flue gas can be a significant problem for absorptive mufflers installed in induced- draft fan systems, and recent information about this potential problem is given in Vér, Biker, and Patel (1978**). Miller, Wood, et al. (1978^*^) provide further information about the control of exterior noise from power plants and their fan systems.
♦Graham, J.B. May 1972. How to estimate fan noise. Sound and Vibration, pp. 24-27.
+ # Beranek, L.L., ed. 1971. Noise and Vibration Control. Ch. 12. McGraw-Hill, New York, NY.
**Ver, I.L., Biker, W.E., Patel, D.K., 1978. Design of a Tuned Muffler for Large Induced-Draft Fans. Proc. Inter-Noise 78,Noise Control Foundation, Poughkeepsie, N Y .Miller, L.N., Wood, E.W., et al. Electric Power Plant Environmental Noise Guide. To be published by Edison Electric Institute,1978.
i*
222

Industrial Acoustics Co.1160 Commerce Avenue Bronx, New York 10462 (212) 931-8000Problem DescriptionAt several of their outdoor process steam boilers in Winston-Salem, N.C., staff members of the R.J. Reynolds Company found that excessive noise was being generated by the fans supplying air to the boilers and the blowers feeding air to the firing units.Problem Analysis and Control DescriptionThe use of silencers to minimize the fan and blower noise at the inlets to this equipment was considered, as was the effect of the silencer on available pressure head. A careful analysis of the system determined that at the peak operating condition the centrifugal fan could sustain a total additional loss of 0.9 in. of water, and the head loss available for the overfire air fan was 0.25 in. of water.Next, it was necessary to select a silencer configuration that was compatible with the air inlets to the fan and blower as well as the surrounding equipment. An IAC Model 3PL 24-in. * 72-in. rectangular Power-FLOW silencer was chosen for the centrifugal fan. This silencer provides required acoustical performance at a satisfactory pressure loss. The cross section of this particular Power-FLOW silencer is readily mated with the fan inlet duct.A tubular Power-FLOW silencer, Model 16 PCL 36, was chosen for use with the overfire air fan, as the round shape was easily adapted to match the blower inlet. The acoustical and aerodynamic performance requirements of the silencer were closely examined in selecting the required silencers.Placement of the silencers is shown in Figure 6.42.1. At current prices, the two silencers would cost approximately $3000.ResultsSilencers for one boiler system were installed and an acoustical test conducted. With the silencers installed, there was no change in the sound levels measured with or without the boiler in operation. As a result of these tests, silencers were installed on three other boiler systems. Figure 6.42.2 shows the sound pressure levels measured 3 ft from the fans before and after the IAC
CASE HISTORY 42: PROCESS STEAM BOILER FANS(OSHA Noise Problem)
223

TO BOILER
I.A.C. TUBULAR POWER FLOW
Figure 6.42.1. Elevation drawings showing how two fans at anR.J. Reynolds Tobacco Co. plant in Winston- Salem, North Carolina were quieted by IAC tubular and rectangular Power-FLOW silencing units.
224

Power-FLOW silencers were installed. Because of extraneous noise sources, it was not possible to measure the full effectiveness of the silencers. The residual sound pressure levels measured during boiler operation are therefore indicative of sounds from both the silenced boiler and the ambient noise sources.
OCTAVE BAND CENTER FREQUENCY (Hz)
Figure 6.42.2. Sound pressure levels 3 ft from fans (convertedfrom old octave-band designations).
225

Robert M. Hoover Eric W. WoodBolt Beranek and Newman Inc.50 Moulton StreetCambridge, Massachusetts 02138(617) 491-1850Gas TurbineGas turbine (also called combustion turbine) generators are used to supply emergency reserve capacity and peaking power for electric utility systems. When they are located near residential areas, they can cause community noise complaints unless adequate noise control treatments are provided. This case history is a discussion of the installation of additional exhaust mufflers at a gas turbine installation to alleviate community complaints about low-frequency exhaust noise.Problem DescriptionThree gas turbine units capable of generating 60 MW of electricity were installed in a rural/suburban area of New England. Each generating unit had a single generator driven by four aircraft- type jet engines; each pair of engines shared a common exhaust. Each generating unit was originally installed with two muffled exhaust stacks approximately 4 m in diameter and 15 m tall.The owner of the generating station received complaints about low-frequency noise from neighbors living about 300 m from the station.Problem AnalysisThe owner's acoustical consultant, Bolt Beranek and Newman Inc., was asked to investigate the generating station noise problems and to recommend corrective actions. Octave-band sound pressure level measurements and tape recordings were made at the station, at the nearest residential area, and at various intermediate locations during several station operating conditions. Measurements were also made along the stack wall and at the top of the stack. In addition, ambient measurements were obtained without the station oeprating.Measurements obtained outside a neighbor’s house are summarized in Figure 6.43.1. The lower frequency station sounds exceeded the ambient by at least 10 to 20 dB. In addition, the sound in the 31*5-Hz octave band exceeded 75 dB, a level at which complaints are sometimes made about vibration in a house. A
CASE HISTORY 43: GAS TURBINE GENERATOR(Community Noise Problem)
226

a.4.9— 6 0
SPL* OUTSIDE NEAREST RESIDENCE HALF TO FULL. LOAD AT STATION
SUGGESTED NOISE CONTROL GOAL FOR DAYTIME OPERATION
DAYTIME AMBIENT RANGE AT NEAREST RESIDENCE
2 0*— 1— 1125 2 5 0 5 0 0 tOOO 2 0 0 0
OCTAVE BAND CENTER FREQUENCY ( H z )4 0 0 0 8 0 0 0
Figure 6.43.1. Sound pressure levels outside nearest residenceat 300 m.
suggested noise control goal for daytime operation is also shown in Figure 6.43.1. Reductions of 10 to 13 dB in the 31.5- and 63-Hz octave bands are suggested to alleviate the community complaint problem.Similar data obtained inside the nearest residence, 300 m from the station, are shown in Figure 6.43.2. These data are plotted with NC curves, which can be used to rate or judge an acoustic environment for various activities.Narrowband analysis of the data tape-recorded at the station and at the nearest house indicated that the sound energy leading to the complaint was contained primarily in the range of about 18 to 75 Hz. To reduce this low-frequency noise, a tuned dissipative muffler was designed and added to each of the existing muffled stacks.Control DescriptionThe dominant radiation path for the low-frequency noise was from the open top of the six exhaust stacks. An initial concept design was prepared of a tuned dissipative muffler section to be inserted in the lower end of the stacks. Acoustic model tests were performed of numerous configurations to optimize the muffler's insertion loss in the frequency range of interest. Aerodynamic
227

OCTAVE BAND CENTER FREQUENCY (Hz)
Figure 6.43.2. Sound pressure levels inside nearest residence at300 m.
model tests were also conducted to ensure that the additional pressure losses through the new muffler section would not be excessive (high-pressure losses would reduce the generating capacity of the gas turbine unit.) Other considerations included fabrication cost and time, installation cost, aesthetics, selfnoise, structural integrity, and weight.As a result of these investigations, a prototype exhaust muffler was designed, fabricated, and installed. The muffler, 5 m in diameter and 8 m long, was installed at the lower section of the existing stack. The original stack was reinstalled above the new muffler. Field measurements were conducted to evaluate the muffler's low-frequency insertion loss, and five additional mufflers were subsequently fabricated and installed.ResultSound pressure level measurements near an exhaust stack with and without the new muffler section indicated an insertion loss of 11 and 12 dB in the 31-5- and 63-Hz octave bands. Outside and inside the nearest residence, the measured insertion loss was 8 to 9 dB in the 31.5-Hz octave band and 7 to 11 dB in the 6 3-Hz octave band. These favorable results indicate the success of this noise control project.
228

Richard C. PotterBolt Beranek and Newman, Inc.50 Moulton StreetCambridge, Massachusetts 02138(617) 491-1850Problem DescriptionComplaints about noise were received during testing of jet engine compressors at a research facility. With the rig at full power, the sound level in the residential neighborhood located across a body of water at a distance of approximately 1200 m was 66 dBA. In addition, a business neighbor at approximately 400 m was subjected to noise as high as 93 dBA. Most of the complaints were received during the occasions when testing had to be continued into the evening. An average ambient sound level of 53 dBA was measured in the residential neighborhood, due to traffic, wind, and surf noise.The compressor test cell consists of a turbine drive unit to which the compressor under test is connected, a filtered inlet to provide air into the test cell, and three exhausts, located on the roof, into which the compressor discharges pressurized air.Problem AnalysisOctave-band sound pressure level and A-weighted sound level measurements were conducted both close-in to the compressor test cell and at representative receiver locations. Equipment used to obtain acoustic data consisted of a precision sound level meter with an octave-band filter set, and a tape recorder. Later analysis of recorded data was performed using a narrowband real-time analyzer.From the close-in measurements, it was determined that the compressor noise came from the roof exhausts and the test cell inlet, with the noise from the exhausts dominant. It was determined that the inlet noise was not a problem because the strong 2620-Hz compressor tone at the inlet was not identifiable in the community, using a narrowband analyzer.Figures 6.44.1 and 6.44.2 show the octave-band sound pressure levels of noise measured in the community at 400 and 1200 m from the rig, respectively, prior to the installation of noise control, in comparison to the measured ambient sound levels.
CASE HISTORY 44: JET ENGINE COMPRESSOR TEST CELL(Community Noise Problem)
229

OCTAVE BANC CENTER FREQUENCY I H il
Figure 6.44.1. Octave-band sound pressure levels measured at business neighbors at approximately 400 m from compressor test cell.
OCTAVE BANDCENTERFREOUENCY (Hz)
Figure 6.44.2 Octave-band sound pressure levels measured atresidential neighbors at approximately 1200 m from compressor test cell.
230

The noise control goal was to reduce the noise to within 10 dBA of the ambient at the business neighbor location and such as to eliminate the complaints from the residential neighbors.Control DescriptionRecommendations for noise control for this test cell were to muffle all exhausts with parallel baffle dissipative-type mufflers. Off-the-shelf-type mufflers were bought and installed on exhausts.ResultsThe sound levels after the installation of the mufflers, Figures 6.44.1 and 6.44.2, were reduced significantly. The goal of reducing the noise to within 10 dBA of the ambient at the business neighbor location was achieved.At the residential neighbor location, the sound of the rig could just be distinguished and it was measured to be below the design ambient. No further complaints of the noise of this rig were received.CommentsAmbient noise is often used as the design goal for community noise problems. However, care is needed when the ambient noise can change because of the irregularity of the dominant sources controlling the ambient noise. In this case the measured noise of the test rig, following the installation of the mufflers, was less than the initially chosen design ambient sound levels. Only by conducting a major noise measurement exercise can a full description of the ambient noise be obtained.The noise control engineer has the choise of using the lowest ambient or some statistical measure, such as the level exceeded 90# of the time, 50% of the time, etc., when proposing a criterion. Although generalizations are difficult to make, "the lowest ambient" is best used in critical situations, while statistical measures can be used when some degree of intrusive noise is acceptable.
231

Richard C. PotterBolt Beranek and Newman Inc.50 Moulton StreetCambridge, Massachusetts 02138(617) 491-1850This case history describes noise control efforts for a production test bed for small helicopter gas turbine jet engines.Problem DescriptionA production test cell used for small turbo-jet engines was producing high exhaust sound levels In the vicinity of the cell and disturbing workers and other passers-by. The test cell is enclosed except for a muffled air inlet and a 15-m-tall exhaust pipe. The exhaust pipe is made significantly higher than the inlet to avoid reingestion of exhaust gas. Exterior sound levels were on the order of 85 dBA.Problem AnalysisBolt Beranek and Newman Inc. was called in to analyze the problem. Measurements near the exhaust and the muffled intake indicated that the noise was suitably muffled at the inlet and that the exhaust noise of the engine was the problem. A reduction of at least 20 dB was required.Control DescriptionBecause of the available space in the long exhaust duct, a two- stage exhaust muffler was designed. A lined section some 5 m long with a 1-m-diameter open center path was arranged at the bottom of the exhaust pipe, and a set of 3-1/2-m-long, 10-cm-thick absorbent splitters on 25-cm centers was set in the top of the exhaust stack. In this way, a very wide band absorber was designed.ResultsAfter installation, the noise of the engine running could not be distinguished above the sounds of other test functions and traffic.CommentsThe noise had been a problem because of the long daily usage of the cell. In this case, a required structure — the tall exhaust stack — could be used to provide the maximum sound reduction. The two- stage muffler gave noise reduction over a wide frequency range.
CASE HISTORY 45: JET ENGINE TEST CELL(Community and Hearing Conservation NoiseProblem)
2 3 2

The muffler was designed to ensure that the backpressure was not excessive. The self-noise of the muffler, especially the splitters, was checked to determine that it did not become the critical sound.
233

Austin E. Morgan Berkmont Industries, Inc.Unicast Division, Union Mfg. Division Box 527Boyertown, Pennsylvania 19512 (215) 367-2116Douglas H. MartinDouglas Martin & Associates, Inc.119 Heather Drive R.D. No. 7 Allentown, Pennsylvania 02138 (215) 435-2400Problem DescriptionThis case history concerns operation of hand-held penumatic grinders, devices often used throughout industry to clean, smooth, or otherwise improve surface features of metal parts. In this operation, the air tool noise was cited, in part, for contributing to OSHA noise overexposures In a gray iron foundry.Problem AnalysisAnalysis of the problem indicated that the tool was a major continuing noise source. Sound levels measured at the operators ear ranged between 100 dBA and 10 9 dBA when the various tools were held in the free-spinning mode. Close-in measurements indicated most noise originated at the tool exhaust, and hence an exhaust muffler was considered to alleviate the problem.Metal prototypes of the muffler were designed and evaluated. Eventually, rubber mufflers were developed.Control DescriptionThe muffler, shown removed and mounted on a pneumatic tool in Figure 6.46.1, is essentially a "rubber band" that fits over the tool exhaust parts. Porous muffler stuffing slows the air stream and dissipates the energy of the moving air before it is exhausted. The muffler is commercially available from Allentown Minerals, Inc., P.O. Box 3214, Allentown, Pa., (215) 437-7177.ResultsSound levels at the operator's ear are reduced to the 84-dBA to 88-dBA range for the free-spinning tool, depending on the tool tested. The tool treatment, coupled with other noise controls currently being implemented in the plant, will reduce noise exposures to levels in compliance with OSHA standards.
CASE HISTORY 46: PNEUMATIC GRINDER(OSHA Noise Problem)
234

Figure 6.46.1. Muffler shown removed and mounted on pneumatictool.
CommentsIn many cases of pneumatic tool usage, tool noise dominates the noise exposures. In other cases, especially when light structures are worked on, workpiece-induced vibrations become more important than tool noise. In the latter situation, mufflers such as described above should be considered only partial treatment and should be coupled with enclosure (using glove-box-type controls), covering (using a heavy "blanket”), or other forms of noise control.Note that tool manufacturers' claims for quieted air tools should be examined carefully. Although their quieted tools are indeed less noisy than original models, ANSI measurement standards specify a 1-m distance from the tool for making the measurement. In practice, an operator's ear may be closer than 1 m to the tool and, hence, his noise exposure higher than would be expected on the basis of tool manufacturers1 promotional literature.
235

EQUIPMENT REDESIGN TREATMENTS (see Techniques Requiring EquipmentRedesign)
Case History 47: Wood PlanerCase History 48: Textile Braiding MachineCase History 49: Steam Line RegulatorCase History 50: Speed Control Device
236

Problem DescriptionWood planers use a high-speed rotating cutter head to produce lumber with a finished surface. Sound levels near the operator are high.There are apparently many noise sources for investigation:
(1) The board, excited by cutter knife impacts;(2) The heavy structure under the cutter head, excited by
vibration transmitted through the board;(3) Modulation of air flow by cutter knife chopping at the
chip collector air stream;(4) Motor windage, hum;(5) Dust collector blower, vibration noise;(6) Machine surfaces excited by impacts.
Problem AnalysisAnalysis resulted in the following possibilities for control of planer noise:
(1) Restrain the board from vibrating. Feed belts on both sides can be used with considerable backup mass and pressure. This would require a radical machine design change.
(2) Contact the board by means that add damping, to reduce resonant vibration. If this is done as an add-on, it must occur beyond the feed and delivery ports of the planer. Thus it would be helpful only for long lengths of board.
(3) Use a helical knife cutter head, which will also reduce idling noise. A helix angle larger than is commonly available would be desirable.
(4) Enclose the planer and board. This is a brute force method that depends for its success on controlling the amount of sound that escapes from the feed and delivery areas; most of the acoustic energy contributing to the sound level is between 500 and 5000 Hz.
CASE HISTORY 47: WOOD PLANER*(OSHA Noise Problem)
»Steward, J.S. and Hart, F.D. 1972. Analysis and control of wood planer noise. Sound and Vibration 6 (3): 24.
237

ResultsThe result achieved by the helical knife cutter head is shown in Figure 6.47-1* reduction from 106 dBA to 93 dBA. Figure 6.47-2 shows the operator sound level related to length of board planed, comparing the helical knife cutter with the straight knife cutter. The helical knife is by far the quieter.CommentsTo meet OSHA operator sound levels for full-day operation, the plant would need a further sound level reduction, perhaps by the design of a total enclosure with an acoustic lined tunnel for the infeed and outfeed. This should not be tried until is has indeed been determined that the openings are the chief sources.In many mills, however, the planer is not operated on a fulltime basis, thus allowing a higher sound level for the shorter time period that an operator is present. At 93 dBA, 5-3 hr are permitted.
31.5 63 125 250 500 1000 2000 4000 8000ONE-THIRDOCTAVEBANOCENTER FREQUENCY (H z )
Figure 6.47-1- Before-and-after third-octave-band sound pressurelevels for wood planer.

OPE
RATO
R EX
POSU
RE
- dB
A
BOARD LENGTH - FEET
Figure 6.47.2. Effect of board length on noise from wood planer.
239

Problem DescriptionIn braiding operations, a bobbin of thread is rotated on a carrier base in a special slotted cam. This cam revolves as it is rotated around the machine, with several other carriers and cams. The carriers are thrown from one cam to another. With steel carriers, the major source of the intense noise present is the resulting metal-to-metal impact. The manufacturer was willing to consider machine modifications to reduce noise in the case history reported here.
CASE HISTORY 48: TEXTILE BRAIDING MACHINES*(OSHA Noise Problem)
Problem Analysis and Control DescriptionIn a laboratory study, the metal-to-metal contact was easily identified as the chief noise source. It was recognized that a carrier with inherent damping properties should reduce the noise. Replacement of the carrier by a nonmetallic one was thus considered. Of the several materials tried, the material that provided the best combination of strength, light weight, and damping was an injection moldable polyurethane.ResultThe carriers were installed in a 13-carrier braider operating at a handle speed of 3^0 rpm. With the microphone 10 in. above the top plate of the braider and 18 in. out, the sound pressure levels were as shown in Figure 6.48.1. A reduction of 11 dB was obtainedThe above results were obtained in the laboratory. For an in- plant test, a row of 84 braiders was converted to plastic carriers. The adjacent row was left with steel carriers; other rows of braiders were operating. The microphone was 3 ft from the centerline between the test rows, and 3 ft above the floor. The sound levels for various combinations of machines are shown below (an x Indicates on).
Sound Level, dBA 97 97 90 85Steel test row x xPlastic test row x xAll other x x x x
Residual noise from the motor cooling system remained and limited the noise reduction to the 7 dB achieved in this production test.
*Cudworth, A.L. and Stahl, J.E. 1972. Noise control in the textile industry. Proc. Inter-Noise. 72:177.
240
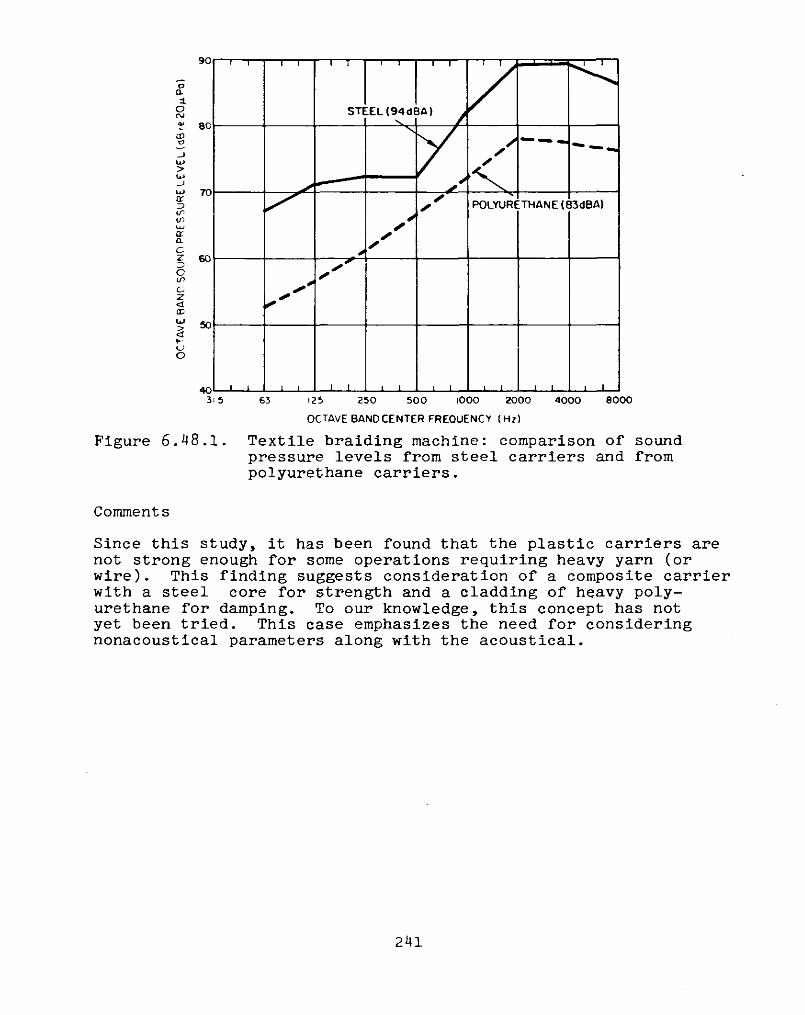
90
aa.AOr\Jt 80
- iLU>UJpIPl/lLlJaacc(/)c.r<iCD
O403i.5 63 12 5 250 500 1000 2000 4000 8000
OCTAVE BAND CENTER FREQUENCY (H z)
Figure 6.48.1. Textile braiding machine: comparison of soundpressure levels from steel carriers and from polyurethane carriers.
CommentsSince this study, it has been found that the plastic carriers are not strong enough for some operations requiring heavy yarn (or wire). This finding suggests consideration of a composite carrier with a steel core for strength and a cladding of heavy polyurethane for damping. To our knowledge, this concept has not yet been tried. This case emphasizes the need for considering nonacoustical parameters along with the acoustical.
241

Problem DescriptionSteam lines with regulators are used in many industries and can be a problem noise source if they are in an area occupied by employees,Control DescriptionThe method used here, which can also be used to regulate other gas flows, was to modify the design of the main valve plug. The redesigned valve plug has throttling vanes, as shown in Figure 6.49.1» to reduce the noise source — the turbulence of the steam flowing through the space between the regulator's main valve and its valve seat.
CASE HISTORY 49: STEAM LINE REGULATORS*(OSHA Noise Problem)
For a 2-1/2-in. steam line handling 50,000 lb/hr through a reduction of 555 to 100 psig, the redesigned valve reduced pipe line noise from 97 dBA to 85 dBA.
Figure 6.49.1. Main valve plug with throttling vanes to reducenoise in steam line regulator.
*From Electrical World. January 1973«
Results
242

CASE HISTORY 50: SPEED CONTROL DEVICE
J .B . MorelandWestinghouse Electric Corp.Research and Development Center1310 Beulah RoadPittsburgh, Pennsylvania 15235Problem DescriptionThe speed control for a rapid transit system controls the train speed by electronically varying the voltage delivered to the traction motor. Basically, the speed control (illustrated in Figure 6.50.1) consists of a main box that houses the electronic components: a scrubber blower that is used as part of the aircleaning system, and a fan-cooled motor that is used to drive the main blower.Problem AnalysisIn general, the operational noise of the speed control is predominantly the aerodynamic noise caused by the -fans, determined by measuring the noise with the fans inoperative. Noise control considerations included source redesign, since the noise-making equipment was made by the investigators on this project. The major noise reduction was accomplished by (1) using a smaller main blower impeller since, for a given speed, smaller impellers are quieter than larger ones, (2) removing the scrubber blower and using a static air cleaning device, and (3) installing a specially designed muffler at the main blower inlet. Figure 6.50.2 shows the essential features of the treatments.ResultsThe cumulative effect on the noise is shown in the polar plot of Figure 6.50.3. An average sound level reduction of 7 dB was achieved.
243

Figure 6.50.1. Essential features of the speed control system.
Figure 6.50.2. Essential features of the muffler.
244

Figure 6.50.3* Constant A-weighted sound level contours for thespeed control cooling system before and after acoustical treatment as measured 15 ft from the blower housing center.
245

COMBINATIONS OF TREATMENTSCase History 51: Steel Wire Fabric MachineCase History 52: Barley MillCase History 53: Punch PressCase History 54: Cut-Punch PressCase History 55: Punch PressCase History 56: Newspaper Printing PressCase History 57: Letterpress Rotary Printing MachinesCase History 58: Chemical Process PlantsCase History 59: Vibration TabléCase History 60: Teletype Machine .Case History 61: Process Plant Noise Control at the
Plant Design Stage
2 4 6

Problem DescriptionThis 8-ft fabric machine manufactures wire netting spaced at 6- in. spacings, starting with individual wires from large spools that run through the length of the machine. A perpendicular wire, known as staywire, is fed across at 6-in. intervals and spot-welded at each intersection. This staywire is then cut off at the left-hand side of the machine. The long wires are then moved through the machine another 6 in. , and the staywire operation is repeated. This machine produces 6 * 6 in. No. 8 or No.10 wire netting, which is used as concrete reinforcement in the home building industry. The machine is made by Keystone Steel and Wire Company.Problem AnalysisAt the operator position, the sound level was found to be 99 dBA and 102 dBC, indicating low-frequency components. This kind of noise (L^-L^ = 3) is very unpleasant.The daily noise dose was found to be 2.5; the acceptable level is 1.0.Criteria were established to reduce the noise exposure to 1.0 or less, a level equivalent to 90 dBA or less.The octave-band sound pressure level measurements made at the main drive gear, at the operator station, and at the wire spool area (Figure 6.51-1) showed that noise sources included (1) general mechanical noise because of needed maintenance, (2) the wire wrapper, a ratchet-action machine operated from main drive gears and found to cause 1000-Hz peak noise, and (3) mechanical sources within the machines, which could lend themselves to isolation.Control DescriptionIn addition to the direct noise corrections implied above, another solution could have been to construct a noise shelter for the operator. This solution was dropped in favor of working on specific noise sources. A program was established to:
(1) Overhaul the machine: replace bearings, reduce metal-to- metal banging, replace worn gears, and so on.
(2) Replace ratchet-type drive on wire wrapper with chain drive. (This device pulled the long wires through the fabric machine.)
CASE HISTORY 51: STEEL WIRE FABRIC MACHINE(OSHA Noise Problem)
247

OCTAVE BAND CENTER FREQUENCY (Hz)
Figure 6.51-1« Sound pressure levels at 8-ft fabric machine.
(3) Add steel plates (10 lb/ft2) to the frame of the machine.These plates were welded to the frame to block direct air pathnoise to the operator from gears. The machine frame casting had many openings, which were covered by these steel plates, as shown in Figure 6.51.2.ResultsThe sound level at the operator station was reduced from 99 dBA to 93 dBA (93 dBC). With this reduction, an additional source was noted and determined to be the staywire lifter arms. These were covered with a 3/8-in.-thick piece of Lexan (see Figure 6.51.3) for the full length of the operator position, hinged so that it could be easily removed for maintenance.The sound level was reduced to 89 dBA at the operator station andOSHA compliance was achieved.Costs were mainly internal plant labor for machine overhaul, plus the cost of the steel barrier plates welded to the frame (estimated at less than $100), plus the cost of the piece of Lexan at $5-00/ft2, or about $50 plus installation labor.
248

Figure 6.51*2. Steel plate barrier with window (stop sign hungon it).
249

Figure 6.51-3* Lexan barrier in two sections; slides up foraccess.
CommentsA shelter could have solved the problem, but, where possible, attack on direct noise is recommended. When major noise sources are reduced, the contribution of other noise sources can be better determined and corrected. By replacing the ratchet-type drive on the wrapper with a chain drive, the production rate was increased by 50?.A major pitfall in this kind of approach is moving too fast. Testing each technique under actual conditions is far better than moving rapidly into failure. From beginning to end, this solution took two years to develop.
250

Problem DescriptionExcessive sound levels existed around the Moorspeed and Ross barley mills (rolls 8-in.-diameter, 15-in.-long), a hay shredder, and a control operator's chair in a cattle feed grinding mill.The objective was to reduce the sound level at the operator's position for OSHA compliance.Problem AnalysisA- and C-weighted sound levels and octave-band sound pressure level measurements were made between the Moorspeed and the Ross mills and at the hay shredder with both mills in normal continuous operation. With - 9 dB, excessive low-frequency soundlevels were predicted. These were confirmed by octave-band sound pressure level measurements. Octave-band sound pressure level measurements at the control operator's chair, the mills, and at the hay shredder are shown in Figure 6.52.1. Figure 6.52.2 is a sketch of the room, showing the relative location of the equipment .
CASE HISTORY 52: BARLEY MILL(OSHA Noise Problem)
31.5 63 125 250 500 1000 2000 4000 8000OCTAVE BAND CENTER FREQUENCY (Hz)
Figure 6.52.1. Sound pressure levels at mills, hay shredder, andoperator1s chair.
251

27
\\ 23’
, \
J Moorspeec/ Rosslead - viny l curtainw IV i ___ test 7 ___
. □ ° t D17’
\ I9'
I
9'
T27
42’
operator
roof 77' at walis, 26’ at i
door
70'
Figure 6.52.2. Floor plan of barley mill.
Roller crushing actions produced high sound levels, and correction by machine redesign was believed to be too costly a method for solving this problem. When the source is too difficult or uneconomical to attempt to correct, working on the noise path will often result in a more economical solution. Therefore, a partial enclosure, open at the top, was chosen.Control Description and DesignAlthough walls can be of solid construction with a minimum of access doors, in this case access was needed for adjustment, maintenance, repair, and roll replacement. For roll replacement, a forklift truck entry was required. For ease of quick access, a fixed barrier wall was discarded in favor of a lead-vinyl curtain wall extending, if required, up to the 17-ft height of the roof support beams. All three noise sources could be enclosed by two curtain walls at the corner of the building, as shown in Figure 6.52.2. The curtains run on rails for easy sliding back and are held together by Velcro closures.Figure 6.52.1 shows that, if the sound pressure levels from 250 Hz up are reduced by at least 14 dB, the resulting A-weighted sound level readings would be less than 90 dBA for compliance outside the curtain walls.
252

Barrier wall attenuation is limited in three ways: (1) directtransmission loss in each octave band, (2) noise over the wall, and (3) room absorption, noise-source side.
(1) Direct transmission loss (TL): The manufacturer of lead-vinyl fiberglass curtains, 0.75 lb/ft2, was chosen. Manufacture r ^ literature gave the transmission less in each octave bandas follows :
125 Hz 250 Hz 500 Hz 1000 Hz 2000 HzTL = 11 dB 16 dB 20 dB 26 dB 31 dB
It is seen that the transmission loss is not a limiting factor.(2) Noise over wall: Barrier wall attenuation can be esti
mated from data in Beranek (1971*) using the dimensions from Figure 6.52.2 and from the sectional view in Figure 6.52.3*
Figure 6 .52.3 . Sectional view of barley mill.
N = | (A + B - D) = j (16.6 + 16.6 - 18)30 4N = — r-— (Fresnel number)
*Beranek, L.L. 1971. Noise and Vibration Control, McGraw-Hill, New York, N.Y. p. 178.
253

125 Hz 250 Hz 500 Hz 1000 Hz 2000 HzA = 9.6 ft 4.8 2.4 1.2 0.6N = 3.2 6.3 12.6 25.2 50.4Attenuation lJ( lg lg 2Q 2Q
(Beranek, 1971, graph on page 178). In practical situations, the attenuation is limited to about 20 dB.By a rough first approximation procedure, we can obtain an estimate of the reduction afforded by the curtain walls. In the listing below, we start with the worst-case octave-band sound pressure levels of Figure 6.52.1 and then list the transmission loss and barrier effects just calculated. Subtracting the minimum of these two reduction mechanisms yields a tentative spectrum of the resulting sound in the room. After A-weighting and combining of sound pressure levels, the predicted reduced room sound level is 85 dBA.
Octave bands 125 250 500 1000 2000Noise source 106 101 98 97 90Direct TL 11 16 10 26 31Over wall 14 15 18 20 20Reduced sound pressure levelsA-weightingA-weighted
95 85 80 79 70-16 -9 -3 0 179 76 77 77 71
A-weighted sound level 84 dBA
For visual access, the enclosure can have 10- x 20-in. plastic windows placed to order; use only the minimal number. To reduce leaks, the curtains should be long enough to drag a bit on the floor. Some rerouting of power, steam, and air lines may be required.The approximate 1973 costs were: $4.00/ft2 for curtains made to order with grommets; Velcro fasteners, $3.00/ft; track, $1.50/ft; rollers (one per grommet), about $2.50 each; windows, $25.00 each; total cost about $4,000.
254

The preceding simplified treatment neglects an important fact:We have not gotten rid of the noise, but have merely redistributed it. Thus, the total sound power from the machines escapes from the topless enclosure and spreads throughout the room. Close to the curtains, there should be some reduction, but very little farther away. Absorption is required for actual reduction of the sound power. This was considered next.
(3) Absorption, noise-source side of wall: When noisesources are confined to a space with less absorption than before, they may build up higher sound levels because of reverberation.The sound barrier curtain material can be obtained with sections of sound absorbent on the inside, to counteract this effect. In the barley mill, however, this choice was not recommended as the porous open material could easily become dust-clogged. Shortly after this noise control job was completed, absorbents covered with a plastic film became available. At the time, the recommendation was for an easily installed and maintained material, Owens- Corning Fiberglas Noise Stop Baffles.* These are 23 * 48 * 1.5- in. baffles, which comprise an absorbent board wrapped in a washable, noncombustible plastic film; each baffle is supplied with two wires through the 2 3-in. dimension. These wires terminate in hooks; to install, stretch wires, 3 ft on center, parallel to the line joining the two mills and about flush with the top of the enclosure rails.The enclosure developed by the curtain walls is, in effect, a separate small room, and the noise reduction can be estimated from the relationship of total absorption before and after adding the sound absorption panels. This relationship is
dB Attenuation - 10 log A2/Ai5where: A 2 is new total absorption
A is original absorption(from Bibliography: Harris, Handbook of Noise Control, pages 18-19 + ).
*These are no longer sold by OCF, but can be readily fabricated from acoustical insulation board.
"^Harris, C.M., ed. 1951. Handbook of Noise Control, McGraw-Hill, New York, N.Y.
255

Original absorption, A 1:
Long wall 32 ft * 17 ft * 2 * 0.02 22End wall 17 ft x 17 ft x 2 x 0.02 11Roof 17 ft x 20 ft x 1 x 0.02 7
W ft2-SabinAbsorption by adding 100 panels 2 x 4 ft100 x 2 ft x ij ft x 2 sides x 0.8 (average A-weighted absorption
coefficient of panel) = 1280Original absorption 40New total absorption 1320 ft2-Sabin
A2 i ^ p ndB attenuation - 10 log j — - 10 log —jj-Q - = 15.2 dB
Resultant level = measured level - reduction = 86 dBA.ResultThe measured final sound level was 87 dBA, a reduction of 7 dB. This level was 3 dB lower than the maximum desired sound level, and was the result of paying careful attention to elimination of leaks. The room formed by the curtain did not realize such a reduction, but since these machines required no attention while running, the noise exposure of personnel was significantly reduced below unity. The major remaining path is reflection from the ceiling.CommentsBarrier walls of various heights can often be used between a noise source and a machine operator. A major pitfall is that, in a room with a high level of reverberant noise, the partial barrier will be short-circuited by the reflected noises from walls, ceilings, and other surfaces. In such cases, attenuation based on the partial wall theory will not be obtained, and the result may often be no attenuation at all in highly reverberant rooms. Curtain walls must be kept closed to get attenuation. Sound-absorbing units must be kept clean to be efficient.
Area Coefficient = Absorption (Sabins)
256

Even in a semireverberant room, a reduced barrier height can be used. In this case, a 7-ft barrier should ideally reduce the level to 89 dBA at the receiving location. However, since the semireverberant conditions will introduce more reflected sound with the lower barrier, the high wall used in this case history is recommended because the added absorption within the barrier area has, in effect, made a separate small room and created the condition on which the barrier wall theory was based.
257

Problem DescriptionPunc.h presses in use in this shop were Summit, Bliss Diamond, and Benchmaster. Within the room were four large presses and four small punches. One of the Summit presses was chosen as representative of the large press group, and the Benchmaster was chosen as representative of the small press group. The general room layout is shown in Figure 6.53-1.
CASE HISTORY 53: PUNCH PRESS(OSHA Noise Problem)
Figure 6.53*1* Layout of punch press room.Problem AnalysisOctave-band sound pressure level measurements were made of the ambient when all the presses and nearby furnaces were shut down. Readings were taken near the central supervisor's desk. The A-weighted sound level was a very low 58 dBA, indicating that there were no other serious noise sources. Also noted was the difference in sound level with and without the furnaces. With the furnace on, the sound level increased to 69 dBA, still quite low for most industrial situations. Thus, the furnace was also eliminated as an irritant noise source.
258

Figure 6-53-2 is an octave-band analysis taken from the center desk with two Summit presses, two Bliss punches, and one Bench- master in operation. The sound level at the desk is 97 dBA, a definite overexposure condition.
Figure 6.53-2. Ambient sound pressure levels with furnace on,two Summit, two Bliss, and one Benchmaster presses in operation (microphone 1.5 m above floor, directly above desk chair).
The Summit punch, Location I in Figure 6.53.1, was chosen as a typical large press. Operator sound levels, shown in Figure6.53.3, were 106 dBA during the operating cycle and 90 dBA during preparation with Punch I off. At 106 dBA, the permitted exposure time is 0.87 hr. The octave-band analysis showed that important noise contributions came from the 500-Hz and higher bands.Figure 6.53-3 also shows the spectrum of noise from operation with nothing in the die. Although a reduction was noted in the 500- Hz band and a small reduction in the 250-Hz and 1000-Hz bands, the 2000- to 8000-Hz bands, which were main contributors to the A-weighted sound level, remained the same as with the full operation. The 2000- to 8000-Hz bands were apparently due to the effect of air exhaust noise from jets for removing parts and pushing them into the collection chute. For these higher frequencies and short wavelengths, barriers are efficient. Close-in diagnostic measurements were made behind the press, but no new noise sources were noted except the directionality of some of the air ejection noise.
259

OCTAVE BANDCENTER FREQUENCY (Hz)
Figure 6.53.3« Sound pressure levels at Punch I.
The reduction sought was from 106 dBA to 86 dBA, with 90 dBA acceptable. This level required reductions of about:
13 dB in 500-Hz band20 dB in 1000-Hz band26 dB in 2000-Hz band28 dB in 4000-Hz band31 dB in 8000-Hz band.
For a separate study of a typical small press, the Benchmaster (Punch VII) was chosen. The operator’s position octave-band analysis in Figure 6.53*4 shows somewhat less noise than the large press; it has the same general configuration and air jet noise source. Figure 6.53.4 also shows the sound levels with no stock in the press, and with the press in punching operation with no stock and no air ejection. Again, data were very similar to those for the larger press.The recommendations were: Reduce air noise along path by installing a barrier between noise source and operator, and reducenoise from air ejection at the source. The latter was consideredfirst.
260

Figure 6.53.4. Sound pressure levels at the operator position ofPunch VII.
Noise caused by high air velocity can be reduced by decreasing the linear flow velocity by increasing the nozzle opening, for same air mass flow. If the diameter of the nozzle is doubled, in a constant volume velocity system, flow velocity is reduced to one- fourth, and noise level is reduced nearly 30 dB (noise of air jet varies approximately as fifth power of velocity). However, thrust would also be reduced to one-fourth of original value. For proper ejection, the nozzle should be aimed more accurately and more efficiently toward the target. Experiments should be conducted to determine the maximum thrust required for minimum noise.A barrier between source and operator can add to the attenuation obtained. The barrier could be box-shaped around the die (with far side and bottom missing). This barrier replaces the present guard, and handles both mechanical and acoustical guard functions. Materials suggested include 1/4-in. plywood, 1/4-in. Plexiglas or Lexan, made with airtight corner joints. Noise-absorbent material, Mylar-faced for dirt and oil protection, was added inside the box; it must be kept clean during normal operations.Control DescriptionBased on suggested possible methods of nozzle construction, a quiet nozzle cover was made. The design of this nozzle is shown in Figure 6.53*5* Air pressure, controlled by a reducing valve,
261

was reduced to the minimum to do the ejection job. (Low-noise air jets are also available commercially.)
outletFigure 6.53.5. Design of nozzle.
A sketch of the barrier is shown in Figure 6.53.6. To afford visual access, the material chosen for the barrier was 1/4-in. Plexiglas. The three-sided barrier was locally designed, aiming to have minimum leakage at bottom of barrier (toward the operator).
262

For absorption, 1-in. acoustical (fully reticulated) polyurethane, with Mylar film covering for ease of cleaning, was glued to the inside surface, leaving a minimum uncovered portion for operator viewing of punch action.Accurate costs were not available for this in-plant effort; however, the materials were less than $100 and labor was estimated at $250.ResultsAfter experiments with reduced jet velocity and with the barriers described, the following sound levels were attained:
Large punch press reduced from 106 dBA to 85 dBA;Small punch press reduced from 99-5 dBA to 82.5 dBA.
CommentsThe major pitfall for barriers will be to see that they are used.Also, when used, the bottom opening or noise leak toward theoperator should be kept at a minimum. Another pitfall to continued efficiency will be allowing the Mylar-covered noise absorbent to become dirt- and grease-laden; periodic cleaning is needed.A pitfall associated with air volume reduction is the tendency of operators to increase pressure or remove the nozzle.Attenuation will depend on the success of air velocity reduction in maintaining the needed thrust for ejection in conjunction with noise reduction of barrier. Unless these experiments involved the operators, they may not accept the alterations.If a mechanical method could be developed to replace air jet part ejection, this would be the best alternative.
263

CASE HISTORY 54: CUT-PUNCH PRESS(OSHA Noise Problem)
Problem DescriptionThis punch press had been modified to produce metal stampings out to a predetermined size. This machine was the first stage of a stamping operation in which the metal was sized and roughly shaped. In two following stages, each part was finished.Problem AnalysisFigure 6.54.1 gives the octave-band analysis of the operator exposure, which is 102 dBA while punching and 88 dBA during idling Figure 6.54.2 shows close-in octave-band data for gear noise, illustrating the continuous nonpunching noise source in the gear mechanism. Figure 6.54.3 shows close-in measurements of the dog and flywheel noise and similar close-in measurements of noise from piston-collar impact on the air cylinder.Clearly, punching noise is the critical part of this noise problem, yet it requires a large amount of noise reduction if one desires to bring maximum operator position sound levels down to no more than 90 dBA. The idling noise aggravates the problem.
oCL
4O(M•> 100ODTJ
_lUJ>UJ
UJ 90iroif>COUJtcaoz BOotooz<mUJ> 70•at-oo
— i— r 1 I -1 | - 1 ! ! !
B
- -■
X
A
m
9 0 dBA CRITERI
/ON
\\
\\
i -J— I « « « 1 1 __ I__ I__ i l 1 131.5
Figure 6.54.1
63 125 250 500 1000 2000 4000 8000OCTAVE BAND CENTER FREQUENCY (Hz)
Cut-punch press operator position sound pressure levels. A , idling; B, punching.
264

OCTAVE BAND CENTER FREQUENCY (Hz)
Figure 6.54.2. Cut-punch press, close-in diagnostic data, 14 cmfrom gears.
OCTAVE BAND CENTER FREQUENCY (Hz)
Figure 6.54.3- Cut-punch close-in data.
265

Recalling the principles of decibel addition, if we were to reduce punching noise to 90 dBA, idling noise would have to contribute no more than 8l dBA to enable the sound level to remain at 90 dBA. In this case, it was decided to aim for a 12-dB reduction in sound level in punching noise, together with a 7-dB reduction in sound level in idling noise, rather than for the 16-dB reduction in sound level in punching noise that would be required if the idling noise were left unchanged.As machine change was not practical, changes had to be made in the noise transmission path to the operator on two of these noise sources. The other source, piston-collar impact on the air cylinder, was modified at the source by adding washers made from Unisorb Type D pad between the piston stop and the collar to reduce metal-to-metal impact noise.Control Descript ionThe gear noise and dog-flywheel impact noises were attenuated by constructing an extended barrier about these noise sources. To obtain the attenuation required, 1-in. plywood was used. The enclosure was attached to the right side of the press (as the operator looks at press) and extended upward to the top of the press, downward to operator chest level, and outward several inches past the flywheel guard. The top, bottom, and right-hand edges had a small 6-in. extension at the barrier extending 90° away from the operator, as shown in Figure 6.54.4.An absorbent was added to both sides of enclosure, of Mylar covered with 1-in. acoustical foam absorbent, available from several suppliers. The joint between the enclosure and the right- hand side of the press was sealed to prevent noise leakage; a 2- in.-wide strip of closed cell foam weatherstripping was specified.Normally, absorbing material is used only on the noise source side of a barrier wall; however, if other noise sources might reflect from the barrier wall to the operator, absorbing materials on the operator side will reduce this noise component.ResultsSound levels during idling were reduced from 88 dBA to 8l dBA. Punch operational sound levels were reduced from 102 dBA to 88 dBA, thus bringing the entire operation into compliance.Though not recorded, costs are estimated at less than $200 for plywood, polyurethane foam, and the labor for attachment.
266

o operator
267

Problem DescriptionPunch presses constitute a most troublesome source of industrial noise, both because of their number and because of their high noise output.Problem AnalysisProm various papers on the subject of punch presses, the following list of noise sources has been gathered. These may not all be present on any one press but are listed as a guide to specific press noise source analysis.
(1) Shock excitation of the workpiece, machine guards, floor and building
(2) Gears, drive, bearings, and components, such as clutch and brake mechanism and drive shaft;
(3) Plunger resonance;(4) Air ejection, air jet cleaning, and air cylinder exhausts;(5) Die design;(6) Stripper plate design;(7) Ejection of parts leaving press on chute or bin;
CASE HISTORY 55: PUNCH PRESS*(OSHA Noise Problem)
*American Industrial Hygiene Association. 1966. Industrial Noise Manual. AJHA, Detroit, Michigan. Examples 11.C, 11.EE.Allen, C.H., and Ison, R.C. 1974. A practical approach to punch press quieting. Noise Control Eng. 3 (1): 18.Bruce, R.D. 1971. Noise control of metal stamping operations. Sound and Vibration 5 (11): 41.Shinaishin, O.A. 1972. On punch press diagnostics and noise control. Proc. Inter-Noise 72: 243.Shinaishin, O.A. 1974. Sources and control of noise in punch presses. Proc. Purdue University Conference on Reduction of Machine Noise, p. 240.Stewart, N.D., Daggerbart, J.A., and Bailey, J.R. 1974. Identification and reduction of punch press noise. Proc. Inter-Noise 74: 225.
2 6 8

(8) Vibration of sheet metal being fed to the press;(9) Start and stop of automatic feed to the press;
(10) Building acoustics.Control DescriptionShock excitation of surrounding structures: This effect can beminimized by properly designed vibration mounts for the entire press to reduce excitation of floors, walls, and other equipment.As an example of this minimization, see Case History 3.Drives, etc.: Good maintenance can contribute to noise reduction.The noise of drive gears can be reduced by damping the gear body, improving gear surface quality and tolerances, precision installation and bearings, better lubrication, and/or changing gear material for a better damped material. On existing equipment, many of the above aids cannot be added at reasonable expense, but gear drives are often enclosed in a box-like structure whose surfaces radiate noise. These surfaces can be damped with off- the-shelf materials, or the drive unit, if space is available, can be enclosed, fully or partially. Heat dissipation should be considered. Solid metal or plastic guards can be changed to expanded metal or wire mesh for less noise, or the guard surface can be vibration damped. The entire guard, if solid, should be vibration- isolated from the vibrating machine.Plunger resonance: If a hollow plunger or ram is a Helmholtzresonant type of noise source, its noise radiation can often be reduced by covering the hole in the plunger. See Case History 10.Air ejection of punched parts: If possible, substitute mechanicalejection to eliminate a large noise source. One comparison, shown in Figure 6.55*1* (AIHA 1966), resulted in an 8-dB reduction in sound level. Multiple jet nozzles are also available for reduced noise. Reduce the air velocity used for ejection to a minimum (since sound level is related to velocity) by reducing the air pressure available. Achieve better air jet efficiency by accurate setting and aiming where needed.Shield the area of punch-air ejection from the operator. An example of the result of this method, in Figure 6.55*2, shows the sound levels of a press with and without a 24- x 48-in. shield to protect operator from air ejection noise.Die design: Changes in die design can reduce noise by spreadingthe punching action, slanting the blanking punch or die, or other means of promoting consecutive shear action instead of instant
269

Figure 6.55-1* Comparison of punch press sound pressure levelswith air ejection and with mechanical ejection.
OCTAVE BAND CENTER FREQUENCY (H z )
Figure 6.55*2. Comparison of punch press sound pressure levelswith and without a shield between operator and air ejection noise.
270

action. Shinaishin reported the results of a slanted die, as shown in Figure 6.55.3- Changes in die materials can reduce noise. As presses produce sound energy from vibration of metal plates upon impact, the velocity of impact can be reduced by using hard rubber mounts (snubbers). Another possibility is a laminated and more massive plate, reducing the size of the plate and radiating area.
ON E TH IR D OCTAVE BAN D C E N TE R FR E Q U E N C Y (H z)
Figure 6.55.3. Comparison of punch press sound pressure levels:standard die vs slanted die.
A change of work stock material from steel to a lead-steel com- position has also reduced impact noise; Shinaishin reported a 14-dB reduction with this test method. Noise radiation can be lessened by reducing plate area by cutting out surface areas that perform no function.These comments emphasize that the tool engineer must now consider designing for noise reduction as well as for mechanical performance. Within such a general framework as outlined, any improvements in sound level will come by experiment and testing results.Stripper plates: Stripper plates in some dies contribute tosound levels because of metal-to-metal contact, which could be changed to plastic or elastomeric contact with better damping and reduced noise.
271

Ejection of parts to chute or bin: Sound levels can be reducedby damping metal chutes, using damping materials on the market or making a constrained layer design. See Case History 6 .Vibration of sheet metal being fed to press: Sound levels can bereduced by preventing vibration, such as by adding a hold-down conveyor. The noise can also be constrained by using an acoustic tunnel infeed, or the operator can be shielded by properly designed barriers.Start and stop feed mechanisms: Noise can be reduced by redesign:Substitute with plastic contact areas where possible; enclose the noise source partially; or add barriers between noise source and operator.Building acoustics: In a room with many noise sources, the operator may be in the reverberant field. Such noise can be reduced by adding absorption. Prom Bruce, an example of use of absorption to reduce noise in a press room is shown in Figure 6.55*4, 30 ft from presses. Closer to presses, noise reduction would be less — with probably no more than 2 to 3 dB at the operator position.The press area can also be enclosed or walled off from the rest of the plant.
OCTAVE BAND CENTER FREQUENCY (H * )
Figure 6.55*4. Sound pressure levels 30 ft from bench press areabefore and after sound absorption treatment.
272

Result sAllen and Ison (1974), p. 18, reported a partial enclosure of ram, die, infeed, and ejection on a 50-ton test press. A sound level reduction of 13 dB was obtained for an enclosure; see Figure 6.55*5. The model enclosure was made of cardboard, 1/2 lb/ft2, lined with 1 in. of polyurethane foam. Later a steel enclosure was installed, for durability.
Figure 6.55*5* Data 30 in. from punch press before and after testcardboard enclosure.
Total enclosures with opening via an acoustic tunnel may be required.Comment sThe remaining radiation came chiefly from the flywheel cover, which was neither damped nor vibration-isolated. Diagnostic measurements should indicate the relative contributions from each source, so that the residual noise will be known.
273

Problem DescriptionThis pressroom is equipped with five double 3-to-2 Hoe folders and four double 2-to-l Hoe folders with a complement of 45 Colormatic press units.Control DescriptionThe following methods were used for noise reduction:Enclosures for folders reduced noise from 111 to 101 dBA.In the reel room, all openings in the floor or deck plates between the pressroom level and the reel room were sealed and isolated. The opening in the arch of the press was closed to the smallest dimension that would still allow paper to feed through to the unit. On the basis of dosimeter data, the noise exposure was reduced to acceptable levels.On the pressroom floor, an existing folder enclosure was retained and improved. A control booth was constructed for noise isolation. An 8-ft wall was added on the pressroom floor as a noise barrier, plus a 4-ft panel at the top of the wall, angled upward and toward the press. Wall surfaces were lined with 2-in. absorbent polyurethane. The 8-ft wall was constructed of: 26-gaugemetal, 1/8-in. masonite, 3/4-in. airspace, and 3/8-in. plywood.The panel was 2-in. polyurethane, 1/2-in. plywood, and 26-gauge metal.Sound traps were made at the tops of ladders at catwalk level.No isolation of the stairs, from reel room to pressroom, was necessary, as they are outside the press enclosures and not affected by the high sound levels of the press. Wall panels are easily removed for maintenance.Pressmen going inside the enclosure for adjustments on a short- time basis wear ear protection.Materials used for sound absorption were flame resistant and approved by insurance inspection.ResultSound levels were reduced to comply with OSHA standard.
CASE HISTORY 56: NEWSPAPER PRINTING PRESS*(OSHA Noise Problem)
*From Editor & Publisher, November 10, 1973 •
274

Kjell Lundin IFM Akustikbyran AB Warfvinges vag 26 S-112 51 Stockholm, Sweden ( 0 8 ) 131220Problem DescriptionThis case history concerns a "Nohab-Ampress Colormatic” letterpress rotary machine, a machine that prints, cuts, combines, and folds newspapers. Printing is done by five rotary units, and other operations are carried out by a folder unit. Operators work all around the 15-m-long machine, but spend most of their time near the folder and at the control console. At a production level of 50,000 copies/hr, sound levels at the various operator positions range between 95 and 105 dBA during press operation. Noise exposure is limited to approximately 2 hr during which the machine is run. An ultimate goal of no more than 85 dBA at all operator positions was established by the printing house for this problem.Problem AnalysisPrinting press sounds are typically dominated by noise emissions from the folders. This case revealed the dominance of folder noise through sound level measurements of the folders and the press units, which were run one at a time. Sound levels were indeed up to 10 dB higher by the folder than at other comparable positions near the press units. Noise reached the operators primarily by airborne radiation; vibration measurements on structural panels indicated the panel vibration did not materially contribute to operator noise exposures. These facts suggested that containment of press sound would be an effective noise control.Sound-proofed control rooms were considered as a possible solution for this problem, but they were rejected because of the need to work directly on the printing units. Also considered was the possibility of utilizing wall and ceiling surface linings to reduce reverberation, but they would have been only a partial solution, because only 3 to 4 dB of improvement could be expected from such treatment alone. The possibility of reducing the noise at its source was rejected because of the complexity of doing so.Control DescriptionThe solution consisted of installation of a series of screens and doors along the open control side of the machine. They effectively contain sounds emitted by the press and the folder. The
CASE HISTORY 57: LETTERPRESS ROTARY PRINTING MACHINES(Hearing Conservation Noise Problem)
275
screens and doors are supplemented by a specially designed tunnel at the folder discharge (the delivery point for completed copies of the newspaper) and by acoustical absorption strategically placed on the walls and ceiling near the machine. (See Figure 6.57.1 for treatment locations.)Designing the controls called for several constraints. They included:
Sturdiness of the components (to enable the control to stand up to expected demands of day-to-day operations)Accessibility to the crosswalks between operating units for routine adjustments and repairsLimited interference with material flow around the pressMaintenance of access to the walkways for proper machine operation as well as for safety (to prevent workers from being trapped unseen in the walkways).
All elements of the treatments were constructed with sturdy sheet steel and profiled steel sections to ensure treatment strength compatible with the strength of the machine itself. All doors were designed to open 180° to eliminate aisle congestion.All doors were made extra high and were carefully fitted to eliminate the need for sills that would otherwise interfere with material flow. As a precaution against acoustical leaks at the door bottoms, an inverted U-profile was fitted to the door bottoms, filled with sound-absorbent material, and covered with perforated steel plate. This treatment acted as an acoustically lined duct at this potential source of leaks.All doors and screens were designed to be supported entirely by peripheral framework attached to the press or folder structure, to eliminate any obstructing frames when elements were removed for servicing the machine. All elements can be readily disassembled, as no more than four bolts secure each one in place.Screens and door elements were designed with large window areas to give operators a good view into the press. Windows were made of laminated glass for the sake of safety and of minimizing abrasion from cleaning. All screens and doors were gasketed with rubber seals to minimize acoustical leaks.The acoustical tunnel at the folder discharge helps prevent sounds from escaping out the discharge opening. The tunnel is designed to function as a step when it is in place, making the area safer than before, when the original sideframes at the delivery served as steps.The wall and ceiling absorption prevent reverberant sounds from short-circuiting the effectiveness of the acoustical shields.
276

O 1 2m
Figure 6.57.1- Floor plan of the rotary pressroom at "Politiken"in Copenhagen. The sound levels in dBA measured before and after the fitting of noise reduction materials are shown beside the printing units (1) and folders (2) of the three Nohab-Ampress "Colormatic" letterpress rotary machines (earlier figures in parentheses). The wall areas marked with a wave line (3) have been lined with sound-absorbent materials. 4 = control console,5 = screens.
277

ResultsSound levels, after installation of the screens, were up to 11 dB lower than before. Figure 6.57.2 shows a typical before-and- after spectrum of aisle position sound pressure levels. Press crews are satisfied with the control measures and always keep the doors closed during printing. Accessibility is still considered good, and service and maintenance work can proceed as before.The controls described in this case history reduced sound levels at the operator position by amounts within 2 dB of predicted values. Additional noise control is now being planned to achieve a maximum sound level of 85 dBA.
100
a * oCVJ? 90m>LU _»UJ 80<r oCO in UJtrCLo= > 7 0o(/■>oz<xm£ 60<3t-Oo
1 1 ! r
/
■"V 1 " 1 1
y✓
r —i—».X X X X
“ 7 'T 1 T '
97 dBA
r i 1
X ' / /
/ /
///✓r
//
/
87 dBA *
__1__ 1__ __ 1__ L__ t I i I i i __L. 1 .. i i i i31.5 63 125 250 500 1000 2000 4000 0000OCTAVE BAND CENTER FREQUENCY (H z )
Figure 6.57.2. The octave-band levels measured at Point A inFigure 6.57.1 before (---) and after (--- ) thefitting of screens.
278

Problem DescriptionExisting chemical process plant noise reduction requires source analysis to determine the method of noise reduction.Problem Analysis and Control DescriptionAs a result of this study, a list of noise sources is shown in Table 6.58.1, with recommended methods of noise reduction. Some specific examples and results obtained by each noise control method are cited in Figures 6.58.1 through 6.58.4. The attenuation attained is shown in each figure.
CASE HISTORY 58: CHEMICAL PROCESS PLANTS*(OSHA Noise Problem)
*From Judd, S.H. January 11, 1971- Noise abatement in process plants. Chemical Engineering.

Table 6.58.1 Sources of noise and methods of noise reduction.
Equipment Source of noise Method of noise reduction
Heaters Combustion at burners
Inspiration of premix a ir at burnersDraft fansDucts
Acoustic plenum* (10 Bwg. plate) Seals around control rods and over
sight holes Inspirating intake silencer Intake s il encer or acoustic plenum Lagging
Motors TEFC cooling a ir fan
WP II cooling system Mechanical and el ectrical
Intake silencer Undirectional fan Absorbent duct liners Enclosure
A irf in coolers Fan
Speed changer Motors
Fan shroud
Decrease rpm (increasing pitch)T ip and hub seals Increase number of blades**Decrease static pressure drop**Add more fin tubes*'Belts in place of gears Quiet motor Slower motor Streamline airflowStiffening and damping (reducing vibration)
Compressors Discharge piping and expansion jo in t Antisurge bypass
Intake piping and suction drum A ir intake Discharge to air Timing gears (axial)
Speed changers
Inline silencer and/or lagging Use quiet valves and enlarge and stream*
line piping**Lag valves and pipingInline silencersLagging
Si lencerSilencerEnclosure (or constrained damping on case) Silencers on discharge and lagging Enclosure (or constrained damping on case)
Engines Exhaust A ir intake Cooling fan
Silencer (muffler)SilencerEnclose intake or discharge or both Use quieter fan
Miscellaneous Turbine steam discharge A ir and steam vents
EductorsPiping
Valves
Pumps
Silencer Silencer Use quiet valve LaggingL im it velocitiesAvoid abrupt changes in size and direction LaggingLim it pressure drops and velocities L im it mass flowUse constant velocity or other quiet valveDivide pressure dropSize adequately for total flowSize for control rangeEnclosure
* If o il fired, provide for drainage of o il leaks and inspection. ** Usually lim ited to replacement or new fa c ilit ie s .
280
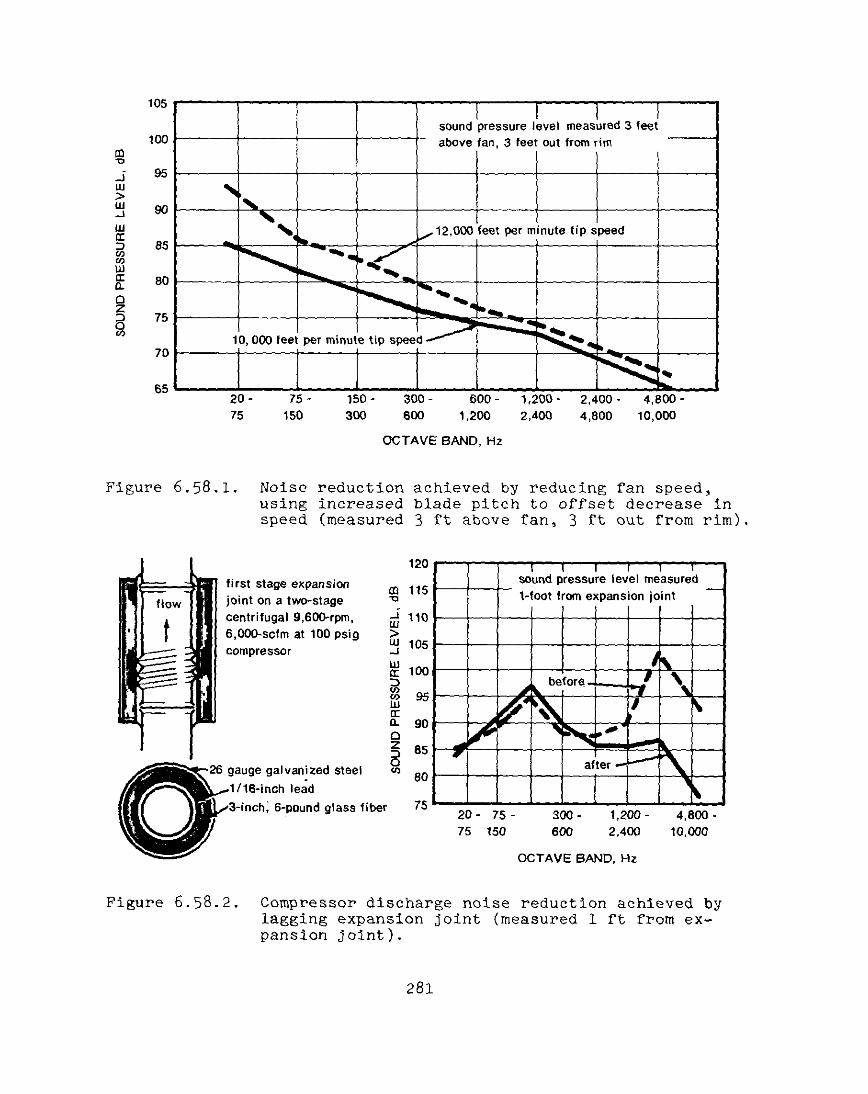
SOUN
D PR
ESSU
RE
LE
VE
L,
dB
75 150 300 600 1,200 2,400 4,800 10,000
O C TA V E BAND, H2
Figure 6.58*1. Noise reduction achieved by reducing fan speed, using increased blade pitch to offset decrease in speed (measured 3 ft above fan, 3 ft out from rim)
first stage expansion jo int on a two-stage centrifugal 9,600-rpm, 6,000-scfm at 100 psig compressor
26 gauge galvanized steel
1/16-inch lead
3-inch^ 6-pound glass fiber
ffi*oJU1>LU-JUJCLz>COCOLU0CQ.Q2DOCO
120
115
110
105
10095
90
85
80
75
sound pressure level measured1- foot from expans ion jo int
/ \be fore -1-
r j/►
Vw
after —1
2 0 - 75 75 150
300600
1,2002,400
4,80010,000
O C TAVE BAND, H z
Figure 6.58.2. Compressor discharge noise reduction achieved bylagging expansion joint (measured 1 ft from expansion joint).
281

in
I s 1pump #2 / 1L — pump #1d isch arg ed line |
out
new 10-inch loop
[10-inch x 6-inch taper10-inch x 8-inch taper
new 10-inch loop
¥8-inch by 6-inch taperi
original 8-inch "jump over”
pum pTI pump #2inlet psi 35 580outlet psi 580 8408 volute impellers 4 2rpm 3,600 3,600gpm 2,100 2,100
115
110CD"D_ILU>WUJtrDCOCOLUccQ.OzDOCO
105
10095
90
>85
80
75
70
-----sounfrom
Id pres #2 pu
-----»sure mp d
------levelschar
I "meas
ge lip
rurede
—10-inc
-----hes
//
\ ____c►rigirìi'jump
a! 8-ii over
ich
/ , " v\
1 i) f \Vi s \
f n<¡w 10 -inch loop-
20 -
7575 - 150
300 - 600
1,200 -
2,4004.800 - 10,000
O C TAVE BAND, Hz
Figure 6.58.3 Noise reduction achieved by redesigning pump bypass loop (measured 10 in. from No. 2 pump discharge line).
1-inch expanded metal
section through intake silencer on a 17-psig centrifugal blower
1 1 i l i 1 sound pressure level measured
. . . . 1 . . r6 tee t rrorr1 a ir 1ntake slot
1%►
\^ w it h original
X>
_ vwith
4 silerPuls
icer (co sui mask«
it ion1id) I
— \
nated i'w ithout masking-.-.J .L l . „
20 -
7575 - 150
3 0 0 -600
1,200 -
2,4002 ,4 0 0 -4,800
O C TA V E BAND, Hz
Figure 6.58.4. Noise reduction achieved by adding silencer to airblower intake (measured 6 ft from air intake slot)
2 82

Lars Holmberg IPM Akustikbyran AB Warfvinges vâg 26 S-112 51 Stockholm, Sweden ( 08 ) 131220
Problem DescriptionProduct compaction is a necessity in the manufacture of prefabricated concrete building elements. In certain cases, the compaction can be achieved only by external application of vibrations to the molds. This case history concerns vibration tables used in the production of a product called well rings. Sound levels as high as 104 dBA, containing a strong low-frequency tone, were measured at operator stations, approximately 1 m from the approximately 2-m diameter mold, during vibration. Vibration table noise takes place intermittently about 4 hr a day, and operators can also be exposed to noise from several other machines10 to 40 m away. The operators control the filling of the molds.Problem AnalysisThis problem was analyzed by measuring and plotting operator position sound pressure levels during mold vibration on octave- band graph paper that included five curves, each representing maximum recommended daily exposure time in accordance with International Standards Organization guidelines for industrial noise exposure. Results, shown in Figure 6.59.1, indicate the 4 hr of daily exposure are greater than indicated by the penetrated curve on the plot. (Note that our OSHA regulation would allow between 1 and 2 hr/day of exposure to 104-dBA sounds.) A noise reduction of approximately 10 dB is called for in this case.Although detailed analysis of noise-producing mechanisms would be desirable to identify quantitatively the relative contributions of the table vibrator, table vibrations, and mold vibrations, such data were not obtained. However, some qualitative determinations were made, based on observations.Low-frequency emissions from the vibrator and broader band emissions from resonances induced in the mold structure and the table were identified as the major noise sources. The rattle of the loose parts of the molds also contributed to the overall noise environment.Several possibilities exist for reducing noise exposures in this type of process:
CASE HISTORY 59: VIBRATION TABLE(Hearing Conservation Noise Problem)
283

140
»30S.o' t\j • 120 a>UJ>tr3intoUJtra.ozZ)Otooz«1mUJ5
110
100
90
80
70
1 r 1 [ 1 1 1 1 1 r~ 1 1 ” i 1 ■ 1 1
\ 3 ^
\ 5
\ 2\ \ l \ j
s . UN TR EATED 104 dB A
II1 '
r\ ^
\ \* V \ V
V
I 1]
7m w im 1n c M iM C .n 1 1
I W ITH TR EATM EN T 1+2 f WITH TR EATM EN T 1+2+ j SEE TE X T FOR TREATV
1 1 1 1 1 1 1 1 t
dB A -1— 97dBA —3 8 8 dBA-| ENTDESC :r ip t i o n
— 1 - i — i 1 _
recommendedm a x im u mdailyEXPOSURE CURVE
5 -8 h 12 -5 h 21-2 h 3< 20m 4< 5m 5
31.5 63 125 250 5 0 0 1000 2000
OCTAVE BAND CENTER FREQUENCY (H z )
400 0 80 0 0
Figure 6.59.1. Results of measurement of operator positionsound pressure levels.
Reducing the vibrated surface area (i.e., by vibration of the bottom of the mold instead of the sides, or damped mold sides);Using alternative methods of compaction;Optimizing vibration components (frequency, amplitude, time) according to properties of the concrete used (e.g., initiating vibration after the mold is partly filled, adjusting vibration amplitude and/or frequency to obtain maximum compaction for minimal noise emission);Eliminating unnecessary impacts between the vibration table and the mold;Containing noise emissions by use of shields or enclosure
284

Prior studies had revealed that some of these possibilities have yielded good results:
Elimination of rattles provided between 3 and 10 dB of noise reduction.Vibration isolation of the mold from the table had provided up to 20 dB of noise reduction, at the expense of requiring additional vibration time.Other methods of compaction are considerably quieter. In particular, internal vibration (using devices that can be held in place inside the mold) produces sound levels in the 85-dBA to 95-dBA range at a distance of 1 m.
Because alternative methods of compaction would be too costly to install and because several of the remaining noise control possibilities require considerable experimentation and study, it was decided, first, to implement vibration isolation of the mold and then, if necessary, containment of the generated sounds.Control DescriptionA vibration table was quieted with the three-phase program of noise control depicted in Figure 6.59*2.
(1) A rubber ring was mounted on the table below the guide ring.
(2) A rubber ring was mounted between the guide ring and the mold.
(3) A screen was constructed around the mold.Rings were made of 4-mm rubber. The screen that encloses the 6-ft- diameter mold was constructed of 3-mm steel (outside) and perforated steel plate (inside), sandwiching 100-mm mineral wool. Rubber sheeting completed a seal at floor level.ResultsNoise at the vibration table was reduced to 97 dBA after installation of the first two phases of noise control and to 88 dBA when all three phases were completed. Figure 6.59.2 summarizes the reductions obtained.
285

MOLD
Tnnzijjp
G U ID E R IN G ( U N D E R M O L D )
sniuuw p 3 m m S T E E L
. 1 0 0 m m M IN E R A L W O O L
P E R F O R A T E D S T E E L P L A T E
■ R U B B E R S E A L
4 m m R U B B E R B E T W E E N G U ID E R IN G 8 (2) M O L D 6 B E T W E E N T A B L E A N D G U IO E R IN G
C I R C L E D N U M B E R S I N D I C A T E P H A S E O F T R E A T M E N T - S E E T E X T
• V IB R A T IO N T A B L E
Figure 6.59.2. Three-phase program of noise control used toquiet vibration table.
286

J.B. MorelandWestinghouse Electric Corporation Research and Development Center 1310 Beulah Road Pittsburgh, Pennsylvania 15235Problem DescriptionThis case history concerns operation of a teletype machine, which disturbed office workers located near the unit. Figure 6.60.1 shows the teletype machine with one of the affected worker locations in the background.Problem AnalysisNo detailed noise control solution or design analysis was performed here, as the control was straightforward. A five-sided acoustical booth was chosen to alleviate the problem.Control DescriptionThe booth (Figure 6.60.2) was constructed from 1-in.-thick Micarta-faced compressed fiberboard, lined on the inside with 1-in.-thick compressed glass fiberboard.ResultsFigure 6.60.3 compares before-and-after treatment data at the desk portion. The sound pressure levels have been reduced by about 7 dB in the 500-Hz to 8000-Hz octave band, much in agreement with what would be anticipated on the basis of the reduction in sound power afforded to the enclosure (neglecting directional effects, the enclosure "contains" about 4/5 of the sound energy radiated from the teletype; 10 log 1/5 equals -7 dB).CommentsThe desk top on which the teletype rests is itself a noise source, since it is drawn into vibration by the teletype. The data given in Figure 6.60.3 were measured with a resilient pad, used as vibration isolation, placed under the machine. The teletype noise spectra with and without the enclosure are also shown in Figures 6.60.4 and 6.60.5, for the condition with and without the resilient pad in place. The latter figures clearly indicate the value of the vibration isolation.
CASE HISTORY 60: TELETYPE MACHINE(Office Noise Problem)
287

Figure 6.60.1. Teletype and desk where noise reduction wasdesired.
Figure 6.60.2. Teletype and installed acoustic booth.
288

OCTAVE BAND CENTER FREQUENCY (H z )
Figure 6.60.3. Before-and-after treatment data at desk.
OCTAVE BAND CENTER FREQUENCY (H z )
Figure 6.60.4. Unenclosed teletype noise spectra with and without resilient pad in place.
289

OC
TAVE
BA
ND
SO
UN
D
PR
ES
SU
RE
LE
VE
L{dB
re
20^
Pa)
Figure 6OCTAVE BAND CENTER FREQUENCY IH z)
60.5. Enclosed teletype noise spectra with and without resilient pad in place.
2 90

CASE HISTORY 61: PROCESS PLANT NOISE CONTROL AT THE PLANTDESIGN STAGE(Hearing Conservation Noise Problem)
F.W. BuehnerArthur G. McKee & Company 6200 Oak Tree Blvd.Cleveland, Ohio 44131 (216) 524-9300This case history is unique in that it incorporates noise control considerations for an industrial plant that had not yet been built. This case history demonstrates that industrial noise environments can be predicted and the information gleaned from the predictions used to identify potential problem areas. Of course, early identification of problem areas allows for remedial techniques for those problems to be integrated most conveniently into construction plans.The case history described herein is for a catalytic hydrode- sulfurizing (CHD) facility designed to process about 70,000 barrels/day.Problem AnalysisEquipment noise emission data, obtained mainly from equipment vendors and supplemented with an Arthur G. McKee Company data base, formed the basis for generating estimates of the afterinstallation noise environment around the CHD facility while the facility was in the design stage. The noise data for each piece of equipment were used to delineate the acoustic field surrounding each piece of equipment, and, with help from a computer program, the emissions from the individual equipment were summed at preselected grid points covering the entire facility location. Contours of the anticipated noise environment (in 5-dB-wide intervals, beginning at 85 dBA) were then generated from the predicted grid data.The predicted sound level contour plots were then compared with the design objective (85 dBA maximum at normal work stations;87 dBA maximum in passageways and maintenance areas) to highlight possible problem areas. The problem areas were then reviewed to determine which of the noise emitters contributes significantly to the problem.Once the problem equipment was identified, noise control treatments were conceptualized and new iterations of the sound level contour generated (on the basis of expected new values of noise emissions of treated equipment) to help determine the appropriateness of the anticipated treatments.
291

ResultsFigure 6.61.1 shows the first iteration contours for this case history, generated with vendor-guaranteed noise data for 78 pieces of as-purchased equipment and simplified assumptions as to on-site noise source location and noise propagation. The figure clearly shows areas of potential concern. These areas were studied in detail, and the main problem noise sources delineated.
>► N
Figure 6.61.1. First iteration A-weighted sound level contours (dBA) generated for CHD site.Note: Contour lines are labeled on the
decreasing side.
Simple treatment, consisting mainly of equipment repositioning, was considered and noise contours recomputed. Problem areas were still evidenced (Figure 6.61.2). Standard and off-the-shelf noise controls were assumed applied to the problem equipment, and a third profile developed. The third iteration (Figure 6.61.3 ) indicated application of the treatments considered would bring about compliance regarding overall plant noise.Subsequently, the plant was built following noise control recommendations assumed in the prediction scheme, and an operational
292

N
Figure 6.61.2. Second iteration A-weighted sound level contours (dBA) generated for ÇHD site.Note: Contour lines are labeled on the decreasing side.
------------► N
Figure 6.61.3* Third iteration A-weighted sound level contours (dBA) generated for CHD site.Note: Contour lines are labeled on thedecreasing side.
293

noise test for the unit was performed. Figure 6.61.4 shows the measured contours. Comparison between predicted and measured contours indicates general similarity, especially for the contours nearest the site boundary, but significant departures from prediction at close-in locations.
N
Figure 6.61.4. A-weighted sound level contours actually measured at CHD site.
The variations between predicted and actual contours were traced to several noise sources: an unexpectedly noisy stripper bottoms pump, two valves which were improperly insulated, and an unexpectedly noisy coupling which dominated as a noise source in the western portion of the plant.It was relatively easy to treat these few remaining noise sources, once the plant was operational.CommentsThe above outline of the procedure employed in this problem analysis suggests the methodology is straightforward. In practice, however, the noise control engineer should anticipate
294

certain complications. The most frustrating of the possible difficulties is obtaining baseline noise emission data for the equipment to be installed. Not all equipment suppliers have, or have resources to obtain immediately, noise emission information. Gaps in the data base have to be filled, by using educated guesses or conservative assumptions or a data base developed from previous work.Also, when noise data are provided, the noise control engineer may find the information ill-defined, nonstandard, and otherwise difficult to use directly. Fortunately, the latter problem is gradually being alleviated because of a greater awareness about noise and willingness to provide information on the part of equipment vendors, as well as by development of national standards to measure noise emissions. An example of vendor awareness is the stripper off gas compressor coupling In this case history. Continuous tube coupling guards are now available for dry couplings, because of owner-vendor resolution of the noise problem.Aside from raw baseline data, other complications can arise. Equipment trains purchased as a package unit and guaranteed as such may have noncompliance items included that must be separated and investigated individually. Piping insulation specifications may not allow insulation of flanges and valve bodies in process stream service; these gaps often produce an unacceptable acoustical system. In addition, fibrous acoustical insulation may also be disallowed by specification for piping systems. Explanation of the mechanisms of fibrous vs hard (calcium silicate) insulation and their acoustical absorption properties is usually required. Simple assumptions about noise propagation may be inappropriate; shielding effects from nearby structures and terrain, directional patterns of noise radiation, and other influences may each be significant. All these factors can be integrated into the programming used to generate the contours, or considered separately, but it certainly takes additional work to do so. Another difficulty that becomes apparent, as decisions are made about input data for the computer program, is what operating modes should be considered. Certain combinations always operate simultaneously. Some equipment may emit noise intermittently. Decisions must be made there that are dependent, in part, on the nature of the overall program objectives.
295

BIBLIOGRAPHYReferences on Noise Control: General Texts, Handbooks,
and ManualsGeneral ArticlesIndustry SpecificEquipment SpecificCase HistoriesNew InstallationsSpecificationsMaterials
References on Noise Control Treatments: By TypeReferences on Noise Problem Measurement, Analytical Procedures, and Problem-Solving AidesReferences on Noise Control Program Management: Articles ofGeneral Interest to Managers of Noise Control ProjectsReferences on Hearing Protectors: General
Effects of UseReferences on Hearing Conservation Programs
296

Control of Noise, 3rd ed. Des Plaines, IL: American Foundrymen'sSociety, 1972.The engineering section of this manual was prepared by an experienced consultant. It is written without equations, but with many charts, graphs, and tables. Although the many examples are taken from foundry technology, the control techniques are quite general in application. There are many compact case histories, together with data on the noise reductions obtained. The point of view is very practical.Fundamentals of Industrial Noise Control, L.H. Bell. Trumbull,CT: Harmony Publications, 1973.This practical book is written from the point of view of the practicing noise control engineer/consultant. A minimum amount of mathematics is used; many examples and exercises are given.The chapters on enclosures, fans, gears, silencers, and vibration control are quite useful. A feature of the book is the compact case histories, for which photographs and drawings amply describe the techniques used.Guidelines to Noise, Amer. Petrol. Inst., Washington, D.C.:Medical Research Report EA 7301, 1973.This commissioned report summarizes measurement instruments and procedures, explicit noise reduction techniques, new plant design for low noise, and source characteristics. The appendices have detailed information on noise control materials, levels from machinery, and addresses of suppliers of noise control materials.Handbook of Acoustic Noise Control, W.A. Rosenblith and K.N. Stevens. WAD Tech. Publ. No. 52-204, 1953.Handbook of Noise Control, C.M. Harris, ed. New York, NY: McGraw-Hill, 1957-Although old, this is still the fundamental reference handbook for the noise control engineer. Of particular interest are these sections: 13, vibration isolation; 14, vibration damping;21, acoustical filters and mufflers; 23, gear noise; 24, bearing noise; 25, fan noise; 26, noise in water and steam systems;27, heating and ventilating system noise; and 30, electric motor and generator noise. Of course, recent developments in acoustical materials and measuring equipment are missing, but the fundamentals are unchanged.Handbook of Noise Measurement, 7th ed., A.P.G. Peterson and E.E. Gross. Concord, MA: GenRad, Inc., 1972.
NOISE CONTROL: GENERAL TEXTS, HANDBOOKS, AND MANUALS
297

This book is an excellent source of data on measurement of sound pressure and calculation of sound power levels. Valuable details are given on sound analysis techniques, characteristics of many types of acoustical instruments, and a summary of noise reduction procedures. An especially useful section covers precautions to be observed to ensure that valid data are required.Industrial Noise Control Handbook, P.N. and P.P. Cheremisinoff. eds. Ann Arbor.: Ann Arbor Science Pub., Inc. 1977-This book is a practical guide to industrial noise and vibration control. The text is well illustrated and discusses the important topics with a minimum of mathematical treatment. The text suffers a bit from imbalance — some topics are discussed only briefly, whereas others are discussed in depth. Information contained in the detailed sections, particularly those on the use of glass and lead materials, contains a good deal of valuable data. The reader will benefit from the discussions on noise legislation and personal safety devices. This book also contains a number of illustrative case histories pertaining to, for example, electric utility and refinery noise, paper rewinders, jet engine test cells, and several other common noise problems.Industrial Noise Manual, 2nd ed. Detroit: Amer. Ind. Hyg. Assoc., 1966.Although the instrument section is outdated, the described measurement techniques are still applicable. Considerable data are given on ear plugs and muffs. The chapter on engineering control is very practical; it is copiously illustrated and describes many useful techniques. A most valuable section on examples presents compact, illustrated case histories in which the noise reduction obtained is given, usually with octave-band spectra.Machinery Acoustics, G.M. Diehl. New York, NY: John Wiley & Sons, 1973.The chief contribution of this book is a detailed description of practical techniques, backed by analysis; for the "in situ" measurements required for calculating sound power. Every professional noise control engineer should be aware of these techniques. The sections on noise sources and reduction procedures have a great deal of directly useful information, especially for enclosure design.Noise Control, R. Taylor, ed. Rupert Taylor and Partners Ltd.,114 Westbourne Grove, London, W2 4UP, England.Noise Control Approaches, M.V. Crocker. Proc. Inter-Noise 72 Tutorial (1972).Excellent summary of procedures.
298

This reprint of very readable 1973 articles summarizes characteristics of machine noise sources and noise control techniques.It will provide a general background to the problems.Noise and Vibration Control, L.L. Beranek, ed. New York, NY: McGraw-Hill, 1971.This is the major modern reference source for the noise control engineer. The treatment is often mathematical, but there are plenty of illustrative worked-out problems. Especially useful are the treatments of transmission loss of simple and complex panels; mufflers and silencers; sound in rooms; vibration isolation; and sound power measurement.Noise and Vibration Control for Industrialists. S.A. Petrusewicz and D.K. Longmore, eds. New York: Amer. Elsevier Publishing Co.Inc., 1974.This book contains a good deal of technical information on acoustics, noise control, and especially vibration and vibration control. However, there is also much clearly written practical advice in the text on principles of noise and vibration control and measurement techniques. Readers may find the sections on criteria and hearing conservation particularly enlightening and useful. A case history for new plant installation is included as the final section of the text.Secrets of Noise Control, A. Thumann and R.K. Miller. Atlanta: Fairmont Press, 1974.This book presents much practical noise control information in graphs and tables, with a minimum of mathematics. Especially useful are data on cost estimating, a listing of suppliers of noise control products, means of source location, silencers, and check lists for management of noise control. There are many useful worked-out problems. A comprehensive list is supplied for all the standard methods of measurement that a professional noise control engineer should use.Sound, Noise, and Vibration Control, L.F. Yerges. New York,NY: Van Nostrand Reinhold, 1969*This practical book has almost no mathematics and relies almost completely on tables, charts, and graphs for its data. The author, an experienced acoustical consultant, provides a great deal of directly useful information on materials selection, noise characteristics of machinery, design of noise control means, and translation of subjective reactions to noise into causes and solutions.What to Do About Noise, T.J. Schultz. Washington, D.C.: U.S. Department of Housing and Urban Development, 1973* Also,
Noise and Its Control, Pollut. Eng.
299
1

Report No. 2549, Bolt Beranek and Newman Inc., 50 Moulton Street, Cambridge, MA 02138.Criteria for a Recommended Standard: Occupational Exposure toNoise, Department of Health Education and Welfare, NIOSH No. 73-11001, August 14, 1972.
300

"Acoustic Materials," W.G. Hyzer. Res./Develop., February 1977, pp. 74-79."Acoustical Treatment of Plant Facilities," H.G. Peters. Proc. Noise-Con '73, 15-17 October 1973, Washington, D.C., pp. 338-342."A Maintenance Guide to Solving Major Noise Problems," J.W.Storment and H.K. Pelton. Maintenance Eng., pp. 18-22."Basic Concepts of Plant Noise Control," C.H. Allen and R.C. Ison. Plant Eng., 21 August 1975, pp. 73-75."Consider Composites to Cut and Control Cacophony," K.H. Miska. Mater. Eng., September 1975, pp. 82-84."Control of Environmental Noise," P. Jensen. Air Pollution Control Assoc., December 1973s PP« 1028-1034."Controlling Industrial Noise, Part 3: Energy Controls," C.H.Wick. Manufactur. Eng. and Manage., May 1973, pp. 35-39."Controlling Industrial Noise, Part 4: Acoustic Materials andEnclosures," Manufactur. Eng. and Manage., June 1973, pp. 30-33-"Controlling In-Plant Noise," Automation, April 1974, pp. 86-90."Controlling Noise in Future Building Construction," W.H.Brueggeman and C.L. Meteer. SPE NATEC 1972, Plastics in Building Construction, pp. 192-203-"Controlling Plant Noise Using Isolation and Absorption Techniques," E.A. Wetherill. Western Manufacturing, March 1971, pp. 20-22."Cost-Effectiveness Approach to Machinery Noise Control," L.F. Yerges. Sound and Vib., July 1974, pp. 30-32."Downing the Plants Din," Chem. Eng., 24 December 1973 , PP* 30-32."Engineering a Quiet Plant," S.C. Lou. Amer. Petrol. Inst., Div. of Refining: Midyear Meeting, TX. Rep. No. 08-70, 13 May 1970."Environmental Effects on Machine Noise in Food Processing Industries," G.M. Diehl. Compressed Air Mag., April 1976, pp. 6-9-"Foreign Noise Research in Machinery/Construction Equipment."Office of Noise Abatement and Control, USEPA, Washington, D.C., December 1977."Four Ways Materials Combat Noise Pollution," K.H. Miska. Mater. Eng., June 1974.
NOISE CONTROL: GENERAL ARTICLES
301

"Fundamentals of Noise Control," L.N. Miller. Paper No. 45d at the 74th Nat. Mtg. Amer. Instit. Chem. Engs., 3 March 1973,New Orleans, LA."Guidelines for Noise and Vibration Control," L.F. Yerges. Sound and Vib., August 1973, pp. 18-21."How to Control Industrial Noise," A.M. Teplitzky. Automation, March 1970, pp. 70-74."Industrial Noise Control: Past, Present, and Future," W.S.Gatley, Mech. Eng., April 1971, pp. 29-37."Interdisciplinary Plant Noise Control," A. Thumann. Chem. Eng., August 1974, pp. 120-124."Machine Enclosures Versus Personnel Shelters," J.R. Yerges and A.J. Morris. Sound and Vib., May 1975, pp. 36-38."Machine Noise Analysis and Reduction," T.D. Miller. Sound and Vib., March 1967, pp. 8-14."Mechanical Engineering Noise and Vibration Control," L.F. Yerges."Materials and Methods for Noise Control," P.N. Cheremisinoff. Pollut. Eng., October 1974, pp. 22-30."Noise and Control," R.L. Lowery, Mech. Eng., June 1975, pp. 26-31-"Noise and Its Control," Environmental handbook series reprinted and available from Pollut. Eng."Noise and OSHA — Part 1," H. C. Lawrence. Design News, 3 March 1975, pp. 59-74."Noise and OSHA — Part 2," H.C. Lawrence. Design News, 17 March 1975, pp. 61-64."Noise Abatement Engineering Design for 90 dBA," F.S. Jana.ASME *73 IPWR-7."Noise Abatement at the Job Site: A Guide to Do-It-YourselfAction," A.W. Lowe. CM&E, April 1975-"Noise Control Materials," P.N. Cheremisinoff. Pollut. Eng., November 1975, pp. 22-28."Noise Control: Programs in Place of Rhetoric." Occup. Hazards,July 1971, pp. 39-^3."Noise Reduction by Design — An Alternative to Machinery Noise Control," R.H. Lyon, Proc. Inter-Noise 78, Noise Control Foundation, Poughkeepsie, NY, 1978.
302

"Noise Reduction in Machinery," G.J. Sanders. Noise Contr., November 1957, pp. 29-37."Noise — The Third Pollution,” J.M. Handley. Ind. Acoust. Co. Bulletin No. 6.0011.0, Bronx, NY."Noise in the Workplace," B. Lincoln. Pollut. Monitor."Practical Design of Machinery Foundations for Vibration and Noise Control," H.T. Miller, G.E. Warnaka, and J.M. Zalas.Proc. Inter-Noise '72, Noise Control Foundation, Poughkeepsie,NY, 1972."Prescription for Plant Environment; Detect, Measure, and Control," Occup. Hazards Exec. Rep., Spring 1974, pp. 35-^2."Put Your Noise Problems in a Box," V. Pace. Calif. Ind.,July 1972."Relating Work Place Noise to Machinery, Noise Emission Levels,"D.R. Pejaver. Nat. Conf. on Power Trans., 1976. pp. 263-282."Solutions to Solving Noise Problems," Maintenance Eng., June 1973, pp. 28-35."Stop Plant Noise at the Source or Along the Way," C.L. Meteer. Automation, July 1974, pp. 58-61."The ASF Handbook: Noise Control Principles and Applications,"Stig Ingemansson, Proc. Inter-Noise 78, Noise Control Foundation, Poughkeepsie, NY, 1978."Techniques for Control of Machine Tool Noise," H. Tipton.Pollut. Eng., March 1976."Techniques for Reducing Machinery Noise," T.D. Agne. Pollut.Eng., September/October 1971."The Languages of Acoustic Materials," J. Duda. Ind. Acoust. Co. Bulletin No. 60012.0, Bronx, NY."Turn the Noise Down!" L.F. Yerges. Oil and Gas J., 8 January1973."Vibration-Structureborne Noise Control," L.L. Eberhart. ASHRAE, May 1966."What You Should Know About Industrial Noise," N.R. Dotti. Pollut. Eng. Yrbk. and Prod. Ref. Guide 1976, pp. 140-143."When OSHA Calls, Will Your Plant Be Quiet?" C.L. Meteer. Plastics World, February 197^.
303

"What You Must Do About Controlling Noise," Mod. Mater. Handling, February 1974, pp. 44-49."You Can Reduce Plant Noise," R.K. Miller. Food Eng., March 1972.
304

Chemical and Process Industry"Criteria and Design Specifications for Plant Noise Control,"J.L. DeBiase. Sound and Vib., Vol. 6, No. 9, September 1972.Good listing of sources, control procedures. Also where to measure OSHA levels."Environmental Noise Control in the Petroleum Industry," R.J.Davis, Stitching Concave, March 1968, The Hague, Netherlands."Noise Abatement in Process Plants," S.H. Judd. Chem. Eng.,11 January 1971, pp. 139-145."Noise Control Design for Process Plants," S.C. Lou. Chem. Eng.,26 November 1973, PP• 77-82."Noise Control in the Chemical Industry," J. Erskine. IEEE Acoustic Noise and Its Control, 1967-"Noise Control in the Petroleum and Chemical Industries,"R.D. Bruce and R.E. Werchan, Chemical Engineering Progress,August 1975, pp. 56-59."Noise Control of High Volume Gas Handling Plants," V.H. Hill.AIHAJ, February 1974, pp. 107-111."Noise Control: Problem Plant Noise Can be Controlled," R.E.Werchan and R.D. Bruce, Chemical Engineering Progress, October1973, PP. 51-55."Noise — How to Reduce the Noise Hazard," R. Douglas, SIAS.Mech. Eng., October 1969, pp. 26-29-
r"Noise Troublemakers are Identified in Refining," J.G. Seebold.Oil and Gas J., 15 January 1973-"Process Plant Noise Control," J.G. Seebold. Sound and Vib.,June 1973, pp. 16-19*"Refinery Auxiliary Stack Redesign to Eliminate Induced Resonant Tone," A.S. Hersh et al. Proc. Noise-Con ’73: 441.Many small changes, Including avoiding turbulence, are described.Food Processing Industry"American Can Company 1s 'Close-InT Noise Control Enclosure Program," W.H. Croasdale, Proc. Inter-Noise 78, Noise Control Foundation, Poughkeepsie, NY, 1978.
NOISE CONTROL: INDUSTRY SPECIFIC
305

"Coors Container Noise Control Program," W.A. Sedgeley, Proc. Inter-Noise 78, Noise Control Foundation, Poughkeepsie, NY, 1978."Noise Abatement in Food Industry," H. Elvhammar, Proc. Inter- Noise 78, Noise Control Foundation, Poughkeepsie, NY, 1978.Noise Control Design Guide for the Chocolate Manufacturers Assoc. C.R. Jokel, P. Jensen, to be published in 1978. Also, Report No. 3725, Bolt Beranek and Newman Inc., Cambridge, MA 02138.Noise Control Design Guide for Food Processors, B.A. Kugler,K. Niemic, L .D. Pope, J .W. Wilby. Northwest Food Processors Assoc. Portland, OR, 1975-Noise Control Solutions for the Food Products Industry, R.K.Miller and Associates, Inc. Prepared for the Southeast Acoustics Institute. 1977 Engineering Report Series 882. Rhodes Haverty Building, Atlanta, GA 30303-Text provides overview of particular details of noise control of concern to food processors (e.g., sanitary requirements) and data and solutions to specific noise problems for the various kinds of food processing industry. Scattered throughout the text are useful notes on acoustic principles and sources of noise control products. The report includes results of a literature search on noise control in food plants in Ch. 5 .Foundry Industry"Controlling Foundry Noise," G. Warnaka. Foundry M&T, December1974."Divide and Conquer Your Noise Problems," W.M. Ihde. Foundry M&T."Foundry Noise Control," R. Hounsome. Noise Contr. and Insulation, Vol. 8, No. 3? March 1977-"Noise Control of Forging Plant," M. Matsui, Proc. Inter-Noise 78, Noise Control Foundation, Poughkeepsie, NY, 1978."Noisy Foundry Operations Quieted by Careful Engineering," J. Volante. Pollut. Eng., Vol. 9, No. 4, April 1977, pp. 36-37.Metal Working IndustryWorkshop on the Control of Metal Sawing Noise in the Aluminum Industry, the Aluminum Assoc. Inc. from Metal Sawing Noise Control, Chicago, IL. June 9-10, 1976."Noise in Stamping," R.D. Bruce. Stamping/Diemaking, November/ December, 1970, pp. 64-69-
306

Mining Industry"Noise Control,” Proc. of Bureau of Mines Technology Transfer Seminar, Information Circular 8686, Pittsburgh, PA, 22 June 1975.Power Industry"Community Noise Emissions from Enclosed Electric Power Plant,"A.M. Teplitzky. Noise Contr. Eng., Vol. 6, No. 1, January/February 1976.Electric Power Plant Environmental Noise Guide, L.N. Miller,E.W. Wood, R.M. Hoover, A.R. Thompson, to be published by Edison Electric Institute, 1978."Noise Control and Hearing Conservation in Large Steam-Electric Generating Stations," G.F. Stone, T.W. Freman, and R.L. Craig.AIHAJ, Vol. 32, No. 2, February 1971, pp. 123-130."Noise Control in Power Plants," R.C. Rittenhouse. Power,July 1976."Noise Control of Gas Turbine Power Plants," R.B. Tatge. Sound and Vib., June 1973, pp. 23-27-Power Plant Acoustics, L.N. Miller. Army Tech. Manual TM5-805-9, 1968.
Ships"A Systems Approach to Shipboard Noise Control," G.E. Warnaka,H.T. Miller, and S.A. Farabaugh, Jr. Libr. of Vib. Shock and Noise Control, No. 55."Noise Control Program in Ship-Building Industry," R. Nilsson.Proc. Inter-Noise 78, Noise Control Institute, Poughkeepsie, NY, 1978.Steel Industry"Engineering Noise Control in the Steel Industry," W. Simpson and E.H. Toothman. Iron and Steel Engineer. June 1978, pp. 36-42.Textile Industry"Cutting Out Noise from the Whole Cloth," A.L. Cudworth. Noise Contr. Eng., Vol. 1, No. 1, Summer 1973-"Gin Noise: How Much? Where? What to Do?," W.S. Anthony andO.L. McCaskill. Texas Cotton Ginners Journal and Yearbook,April 1977."Guidelines for Textile Industry Noise Controls," J .R . Bailey and C.M. Brown, ASME, 1973-
307

"Noise Abatement in Textile Industry,” B. Wadmark, Proc. Inter- Noise 78, Noise Control Foundation, Poughkeepsie, NY, 1978."Noise Abatement in Textile Mills," P.H.R. Waldron. Mod. Textiles Mag., July 1969, pp. 49-50."Noise-Control in the Textile Industry,” A.L. Cudworth and J.E. Stahl. Proc. Inter-Noise f72, Noise Control Foundation, Poughkeepsie, NY, 1972."Noise Reduction in the Textile Industry," H.P. Stout. Textile Inst, and Ind., May 1971, pp. 129-130."Some Aspects of Noise Control in the Textile Industry,” P.D. Emerson. Amer. Assoc, of Textile Chems. and Colorists Symposium: "The Textile Ind. and the Environment — 1972,"22-24 May 1973, Washington, D.C."Textile Machinery Noise Control," Textile Ind., September 1977, pp. 167-170.Other Industries"Noise Abatement in the Stone Processing Industry,” 0. Backteman. Proc. Inter-Noise 78, Noise Control Foundation, Poughkeepsie,NY, 1978."Noise Abatement in Sawmills," H. Elvhammar, Proc. Inter-Noise 78, Noise Control Foundation, Poughkeepsie, NY, 1978."Noise Abatement within the Pulp and Paper Industry," B. Wadmark, Proc. Inter-Noise 78, Noise Control Foundation, Poughkeepsie, NY, 1978."Noise Control in the Concrete Prefab Industry," L. Holmberg and 0. Backteman, Proc. Inter-Noise 78, Noise Control Foundation, Poughkeepsie, NY, 1978."Noise Control in the Graphic Arts Industry," K. Lundin, Proc. Inter-Noise 78, Noise Control Foundation, Poughkeepsie, NY, 1978."Noise Control in the Mechanical Industry," P.-A. Berg, Proc. Inter-Noise 78, Noise Control Foundation, Poughkeepsie, NY, 1978.Noise Control Design Guide for Moulding and Millwork Plants, B.A. Kugler, K. Niemiec, L.D. Pope, Western Wood Moulding and Millwork Producers, Portland, OR, 1973* Also, BBN Report No. 2436, Bolt Beranek and Newman Inc., Cambridge, MA 02138."Reducing the Noise Emission From a Forest Industry," L. Landstrom and H. Elvhammar, Proc. Inter-Noise 78, Noise Control Foundation, Poughkeepsie, NY, 1978.
308

Sawmill Noise Control Engineering Guide, B.A. Kugler, K. Niemiec, Southern Forest Products Assoc., Southern Hardwood Lumber Manuf. Assoc., Western Wood Products Assoc., 1976. Also, BBN Report No. 32 85, Bolt Beranek and Newman Inc., Cambridge, MA 02138.
309

Air Moving; EquipmentAmerican Society of Heating, Air-Conditioning and Refrigerating Engineers Handbook. Ch. 33, "Sound and Vibration," 1970.The definitive treatment of air conditioning noise."Applying Condenser Fans for Low Noise," W.J. Clauss. Building Sys. Design, Vol. 69, April 1972, pp. 24-27-"Controlling Air System and Mechanical Equipment Noise," L.N. Miller. Heating, Piping, and Air Condition., February 1971, pp. 73-60."Controlling Noise in Compressed Gas Systems," E.R. Cunningham. Plant Eng., 15 April 1976."Control of Noise from Vents and Blowdowns," S.G. Paddock.Pollut. Eng., Vol. 8, No. 9, September 1976, pp. 50-52."Design of a Tuned Muffler for Large Induced-Draft Fans,"I.L. Ver, W.E. Biker, D.K. Patel. Proc. Inter-Noise 78, Noise Control Foundation, Poughkeepsie, NY, 1978."Designers1 Guide to Quieter Air-Moving Appliances," Appliance Manufactur., October 1972, pp. 111-112."Designing for Plenums in Air-Distribution Equipment," W.M.Harmon. Plant Eng., 21 July 1977, pp. 159-161."Fan Sound Control," Publication VS 306, April 1963, Woods of Colchester, Ltd., Braiswick Works, Colchester, Essex, England."Noise and Vibration Control of Large Ventilation Plant," D.A. Richardson. Noise Contr. and Insulation, March 1977, pp. 84-86."Noise Control in Air-Handling Systems," G. Sanders. Sound and Vib., Vol. 1, No. 2 , February 1967-Descriptive. Covers concepts of noise control in air conditioning, cooling towers, gas turbines, blowers, internal combustion engines, jet engines."Noise Control of High-Volume Gas Handling Plants," V.H. Hill.AIHAJ, Vol. 35, February 1974, pp. 107-111."Noise Reduction in Centrifugal Fans by Means of an Acoustically Lined Casing," M. Bartenwerfer et al. Noise Contr. Eng., Vol. 8, No. 3, 1977.
NOISE CONTROL: EQUIPMENT SPECIFIC
310

"Noise Reduction of Miniature Fans Using Blade Treatment," G.G. Tseo. Proc. Inter-Noise f72, Noise Control Foundation, Poughkeepsie, NY, 1972."Reducing Noise from Air Ejectors," S.O. Emilson. Pollut. Eng., May 1978, pp. 75-76."Removing the Roar: In-Duct Noise Treatment," R.H. Dean, HeatingPiping and Air Condition., February 1975-"Selection of Minimum Noise Fans for Given Pumping Requirements," R.C. Mellin. Noise Contr. Eng., Vol. 4, No. 1, 1975."Silence Reduces Noise of Tip Driven Fan," R.F. Stengel. Design News, 18 February 1974."Silencing a Roots Blower," S. Berndtsson and L. Landstrom. Proc. Inter-Noise 77, Noise Control Foundation. Poughkeepsie, NY, 1977-"Sound and the Centrifugal Fan." 1969-This engineering guide provides alignment charts for estimating octave-band levels from centrifugal fans."Suppression of Ventilating Noise," M.J. Kodaras. Noise Contr., Vol. 2, No. 2, 1958.Treatment of ducts, mechanical rooms."Think Quiet," G.M. Diehl. Compressed Air Mag. Reprint of set of articles, 1971.This is a forerunner of the author's book on machinery noise. The emphasis is on air moving machinery.Compressors"Controlling Centrifugal Compressor Noise," T.J. Quinn. Plant Eng., 4 April 1974, pp. 111-113."How to Control Compressor Noise," G.M. Diehl. Hydrocarbon Process., July 1975, pp. 157-159-"Noise Control: Diesel Compressors," F. Oran. Nat. Safety News,August 1975, pp. 67-71."Noise Control of Air Compressors," F.M. Oran. Env. Sci. andTechnol., Vol. 9, No. 12, November 1975-"Portable Air Compressor Noise Diagnosis and Control," W.N.Patterson. Proc. Inter-Noise 74, Noise Control Foundation, Poughkeepsie, NY, 1974.
311

"Preventing Vibration Problems in Reciprocating Compressor Foundation,11 W. H. Kauffman. Plant. Eng. , 17 April 1978, pp. 99-101."Quieting Portable Air Compressors," W.N. Patterson. Noise Contr. Eng., Vol. 5, No. 1, 1975-"Resonance in Centrifugal Compressor Piping," J.C. Seebold. Oil and Gas J., 4 December 1972."Stationary and Portable Air Compressors," G.M. Diehl. Proc. Inter-Noise 72, Noise Control Foundation, Poughkeepsie, NY, 1972.The chief noise sources are discussed thoroughly, and a few noise control suggestions are offered.Cooling Towers"Cooling Tower Acoustics: Sources and Solutions," B.E. Murrayand E.W. Wood. Specifying Eng., November 1977, pp. 66-70."Cooling Tower Noise," I. Dyer and L.N. Miller. Noise Contr.,May 1959-Most of noise from fans. Estimation procedures given. No noise control suggestions."What to Do About Cooling-Tower Noise," H. Seelbach, Jr. andF.M. Oran. Sound, Vol. 2, No. 5, September/October 1963.Describes characteristics of the noise, gives a detailed estimating procedure, and describes effect of intake and discharge silencers.Drives and Transmissions"Don’t Overlook the Merits of Silent Chain Drives," P.G. Hermeling. Plant. Eng., 4 April 1974, pp. 108-110."Trouble Shooting Roller Chain Drives," R.W. Ebly. Constr. Maintenance and Equip., January 1975*Electrical Equipment"The Measurement and Suppression of Noise," A.J. King. London: Chapman and Hall, 1965.This British book is devoted chiefly to noise from electrical machinery. Much attention is paid to the design of duct silencers.
312

Engines"Compact Muffler Hushes IC Engine Noise,” R.F. Stengel. Design News, Vol. 29, No. 11, 3 June 1974.Noise Control for Reciprocating and Turbine Engines Driven by Natural Gas and Liquid Fuel, L.N. Miller. Amer. Gas Assoc.,Cat. No. S20069, December 1969-"Rooftop Concrete Block Houses for Muffling of Large Internal Combustion Engines,” W.B. Dibol, D.K. Ross, and J. Killebrew.Proc. Inter-Noise 72, Noise Control Foundation, Poughkeepsie,NY, 1972.Gears"Gear Noise Source Identification and Reduction," R.F. MacWhorter. AIHAJ, September 1974, pp..581-585-"Gear Sound and Noise: Significance, Measurement, and Control,Part 1. Sound and Noise: Physiological and Psychological,”E.J. Willauer. Form 710701, August 1971, The Falk Corp., Milwaukee, WI."Gear Sound and Noise: Significance, Measurement, and Control,Part 2. Gear Unit Sound Generation, Transmission, and Noise Control," E.J. Willauer and R.A. Schunck. Form 7204111, June1972, The Falk Corp., Milwaukee, WI."Quiet! Nylon Gears at Work," K. Reisch. Plant Eng., 20 March1975, pp. 127-130."Sources and Control of Gear Noise, Part 1: Conventional DesignApproaches," C. George. Pollut. Eng., February 1975, PP- 40-43."Sources and Control of Gear Noise, Part 2: Contemporary DesignApproaches," C. George. Pollut. Eng., March 1975, PP■ 40-41.Grinders"Reducing Noise from Plastics Grinders," A.R. Morse. Pollut.Eng., July/August 1970.Heaters, Furnaces, and Flares"Combustion Noise in Industrial Burners," A.A. Putnam. Noise Contr. Eng., Vol. 7, No. 13 8 July 1976."Heater Air and Noise Pollution," W.H. Marchant, Oil and Gas J., January 1973-
313

’’Noise Control for Heaters and Furnaces," R.H. Bruggink and J.R. Shadley. Paper No. 46a presented at the 74th Nat. Meeting of the Amer. Inst, of Chem. Eng., 15 May 1973, New Orleans, LA."Noise Emission of Forced-Draft Refinery Furnaces," L.A. Bijl.Noise Contr. Eng., Vol. 5, No. 3, 12 November 1975."Pulsating Combustion in Elevated Floors Caused by Seal Drum Sloshing," J.G. Seebold. Noise Contr. Eng., Vol. 3, No. 1,8 July 1974."Solving Flare-Noise Problems," J.F. Straitz, Proc. Inter-Noise 78, Noise Control Foundation, Poughkeepsie, NY, 1978.Hydraulic Equipment"Controlling Noise in Fluid Pumping Stations," J.R. Brennan.Plant Eng., 21 February 1974, pp. 89-93«"Finding — and Fixing — Hydraulic Noise Sources," J.S. Stecki and P. Dransfield. Mach. Design."First Aid for Hydraulic System Noises," H.W. Wojda. Pollut.Eng., April 1975, PP- 38-40."Hydraulically Operated Machine Noise," R.J. Becker and S.J. Skaistis. Environ. Sci. and Technol."Muffling Hydraulic Systems," S.J. Skaistis and R.J. Becker.Mach. Design, 21 October 1976, pp. 124-128."Quieter Fluid Power Systems as Achieved with Empirical Techniques." Prod. Eng., September 1973*"Reducing Fluid-Transfer Noise," G.F. Stiles. Mach. Design,31 October 1974, pp. 62-67."Reducing the Operating Noise of Industrial Hydraulic Systems." Parker Hannifin Co., 1972.Exhaustive and informative treatment, with excellent list of noise reduction techniques."Silencing the Noisy Hydraulic System," J.E. Miller. Mach.Design, 14 June 1973, PP- 138-143."Stopping Hydraulic System Noise," H.W. Wojda. Plant. Eng.,26 July 1973, PP- 74-75-"Techniques for Reducing Noise in Industrial Hydraulic Systems,"P.A. Kamis. Pollut. Eng., May 1975, PP- 46-49-
314

"A Noise Reduction Technique for Centrifugal Water Chiller,"W.D. Wilken, R.C. Chanaud, and W. Soedel. Noise Contr. Eng.,Vol. 3, No. 3-"Chiller Noise: Its Impact on Building Design," W.E. Blazier,Jr. ASHRAE, May 1972, pp. 44-50."Controlling Mechanical Equipment Noise Vibration in Buildings," L.N. Miller. Architect, and Eng. News, Vol. 6, No. 3, pp* 50-54.Noise Control for Mechanical Equipment, L.N. Miller. Dept. ArmyTech. Manual TM5-805-4, 1970.Metal Working Equipment"Noise Control of Metal Stamping Operations," R.D. Bruce. Sound and Vib., Vol. 5, No. 11, November 1971.Absorption, partial and total enclosures are discussed. Control at the source is also considered."Silent Stock Tube and Automatic Screw Machines," B.V. Schweitzer. Noise Contr., Vol. 2, No. 2, March 1956.Describes development use of stock tubes with damping.Pneumatic Tools"A Practical Approach to the Exhaust Silencing of the Pneumatic Rock Drill," W.S. Gatley and M.G. Barth. Proc. Inter-Noise 72, Noise Control Foundation, Poughkeepsie, NY, 1972."Muffling Techniques for Reducing Pneumatic Tool Noise," R.A. Willoughby and E. Parker. Plant Eng., 6 September 1973*"Noise Abatement of Pneumatic Rock Drill," BOM Rep. of Invest./1974, Ri 7998."Pavement Breaker/Rock Drill Noise Control Methods," F.M. Kessler, Proc. Inter-Noise 78, Noise Control Foundation, Poughkeepsie,NY, 1978."Progress in Suppressing the Noise of Pneumatic Rock Drill,"J.W. Jensen and A. Visnapun. Proc. Inter-Noise 72, Noise Control Foundation, Poughkeepsie, NY, 1972.Power Plant Equipment"Control of Power Plant Fan-Generated Duct-Wall Radiated Noise with Acoustical Insulation," J.E. Shahan, Proc. Inter-Noise 78, Noise Control Foundation, Poughkeepsie, NY, 1978.
Mechanical Equipment
315

"Low Frequency Noise Problems from Gas Turbine Power Stations,"L.A. Challis and A.M. Challis, Proc. Inter-Noise 78, Noise Control Foundation, Poughkeepsie, NY, 1978."Power Transformer Noise — Prediction and Control," C.G. Gordon, Proc. Inter-Noise 78, Noise Control Foundation, Poughkeepsie, NY, 1978.Pulp and Paper Equipment"Noise Reduction Techniques for Paper Converting Machinery."J. of the Tech. Assoc, of the P & P Ind., Vol. 56, No. 6,June 1973, pp. 65-68."Riveting Hammer and Paper Shredder," J.F. Engstron. Noise Contr., Vol. 2, No. 2, March 1956.Case histories on riveting hammer, paper shredder.Pumps"Avoid Noisy Pumps — Watch Installation Factors," H.O. Franz.Plant Eng., November 1967, pp* 170-172."Control of Vibration and Noise from Centrifugal Pumps," L.M.Evans. Noise Contr., Vol. 4, No. 1, January 1958.Emphasizes selection and proper operating point."Source of Noise in Power Plant Centrifugal Pumps, with Considerations for Noise Reduction," N. Meyerson. Noise Contr. Eng.,Vol. 2, No. 2, Spring 1974.Punch Presses and Other Impact Equipment"A Practical Approach to Punch Press Quieting," C.H. Allen and R.C. Ison. Noise Contr. Eng., Vol. 3, No. 1, 8 July 1974."A Review of Noise and Vibration Control for Impact Machines,"R.D. Bruce. Proc. Inter-Noise 72, Noise Control Foundation, Poughkeepsie, NY, 1972."A Systems Approach for Control of Punch Press Noise," J.R. Bailey, J.A. Daggerhart, and N.D. Stewart. ASME 75-DET-49."Noise Reduction by Covers," J.R. Engstrom. Noise Contr., Vol. 1, No. 2, March 1955.Case histories on multiside punch-press riveting machine."On Punch Press Diagnostics and Noise Control," O.A. Shinaishin. Proc. Inter-Noise 72, Noise Control Foundation, Poughkeepsie,NY, 1978.
316

’’Origins of Punch Press and Air Nozzle Noise,” S. Sahlin and R. Langhe. Noise Contr. Eng., 12 November 1974.’’Punch Press Diagnostics and Noise Control," O.A. Shinaishin.Proc. Inter-Noise 72, Noise Control Foundation, Poughkeepsie,NY, 1972.Suggests changes in die, stock, snubbers, perforated plates, enclosures.Textile Industry Equipment"Drawtwister Spindle Noise Reduction," R.W. Timbie and F.J. Howe. ASME, August 1973."Guidelines for Designing Quieter Equipment,” C.H. Allen. ASME, 1969."How to Quiet the Noise Issue," Textile World, May 1972, pp. 39-^4."Noise Abatement of Big Shuttle Looms," B. Wadmark, Proc. Inter- Noise 78, Noise Control Foundation, Poughkeepsie, NY, 1978."Noise Control for a Textile Machine,” R.D. Bruce and N.F. Gubi- tose. Sound and Vib., May 1971, pp. 20-24."Ring Twister Noise Level Control," B.R. Farmer. Textile Ind., October 1972, pp. 117-119.Turbines"Beware Low Frequency Gas-Turbine Noise,” R.N. Hoover. Power,May 1973."Noise Control of Gas Turbine Power Plants," R.B. Tatge. Sound and Vib., Vol. 7, No. 6, June 1973.Defines NEMA noise limit curves, noise reduction for regenerator equipment, use of silencers.Valves and Regulators"Control Valve and Regulator Noise Generation, Propagation, and Reduction," G. Reethof. Noise Contr. Eng., Vol. 8, No. 2, 10 September 1977."Control Valve Noise and Its Reduction: State of the Art," G.Reethoff and A.V. Karvelis. Proc. Inter-Noise 72, Noise ControlFoundation, Poughkeepsie, NY, 1978."Control Valve Noise: Treat the Source or the Path," W.E.McGinnis. Oil and Gas J., 16 April 1973.
317

"Controlling On-Steam Valve Noise." Noise Contr. Eng., September1972, pp. 42-44."Guide to Control Noise," J.A. Dollon. Instrum. and Contr. Syst., September 1974."Hydrodynamic Control of Valve Noise," A.C. Casciato. Pollut. Eng., Vol. 5, No. 9, September 1973."Hydrodynamic Control Valve Noise: Prediction/TreatmentTechniques," A.C. Casciato. Heating, Piping, and Air Condition., April 1973, pp. 76-80.Woodworking Equipment"Analysis and Control of Wood Planer Noise," J.S. Stewart andF.D. Hart, Sound and Vib., March 1972, pp. 24-27."A Practical Approach to Chain Saw Noise Control," W. Soedel,B.R.C. Mutyala, and R. Cohen. Inter-Noise 77, Noise Control Foundation, Poughkeepsie, NY, 197 7*"Low Cost Acoustical Enclosure for Wood Planer," T.L. Walker and K.T. Feldman, Sound and Vib., November 1973, pp. 34-38."Quieting Circular Saws," A.L. Cudworth. Noise Contr., January/ February I960."Vibration Damper for Circular Saws," C.H. Allen. Paper W7 at ASA Meeting, 17 November 1976, San Diego, California.Miscellaneous"Control of Office Noise," H. Routson. Pollut. Eng., June 1973, pp. 36-37."Noise Control at Construction Sites," H.G. Poertner."Noise Control for Data Processing Systems," R.E. Wise. Noise Contr. Eng., Vol. 5, No. 2, 10 September 1975."Noise Generating and Prediction on Automated Bottling Lines,”T.H. Melling and B.R. Wood. Noise Contr. Eng., Vol. 3, No. 2,10 September 1974."Noise Problems by Turning in Lathes," P.-A. Berg and H. Elvahammar. Proc. Inter-Noise 77, Noise Control Foundation, Poughkeepsie, NY, 1977."Performance of an Acoustically Designed Herf Cropping Machine,"S. Vajapyee and M.M. Sadek. Proc. Inter-Noise 77, Noise Control Foundation, Poughkeepsie, NY, 1977-
318

"Reduction of Noise from Construction Machine with Particular Reference to Cooling Systems,” N.J. Stephenson and I.D.A. Thomas. Soc. of Auto. Eng., 10-13 September 1973*"Results of Noise Control Efforts on Cigarette Filter Making Machines,” C.E. Scott III and R.E. Dotz. Noise Contr. Eng.,Vol. 3, No. 3, 12 November 1974."Steam Piping Noise,” Environ. Design, Summer 1974, pp. 6-7.
319

"Field and Laboratory Examples of Industrial Noise Control,11 A.L. Cudworth, Noise Contr., Vol. 5, No. 1, January 1959.Case histories on ejector chutes, tote boxes, chipping hammer, air nozzles, and air compressors."Kentucky Bottler Solves Noise Problem with New Clear Acoustical Covering," Mid-Continent Bottler, June/July 1977.Describes results and barrier treatment for bottle filling lines that had been causing an OSHA noise problem."Methods of Noise Control for Machinery Already Installed,"L.F. Yerges. Proc. Inter-Noise 78, Noise Control Foundation, Poughkeepsie, NY, 1978.Excellent and compact summary of procedures, costs. Case histories on grinders, automatic screw machines."Noise Reduction by Covers," J.R. Engstrom. Noise Cont., Vol. 1, No. 2, March 1955.Case histories on multislide punch press, riveting machine.Noise — The Third Pollution, J.M. Handley. IAC Bull. 6.0011.0.1973.Case histories from industrial acoustics on cutoff saw, looms, punch press, power transformer, process steamboiler."Riveting Hammer and Paper Shredder," J.R. Engstrom. Noise Contr., Vol. 2, No. 2, 18 March 1956.Case histories on riveting hammer, paper shredder."The Application of Engineering Noise Control Measures," W.M.Ihde. Nat. Safety News., Vol. 107, No. 6, June 1973.This article provides an intensely practical summary of characteristics of a wide variety of noise sources and of procedures for noise control. There are many illustrations and examples.
NOISE CONTROL: CASE HISTORIES
320

NOISE CONTROL: NEW INSTALLATIONS"Acoustical Considerations for the Selection of Fans for New Facilities," J.B. Graham. Proc. Inter-Noise 73, Noise Control Foundation, Poughkeepsie, NY, 1973»Gives data on effect of noise of fan type, variable inlet vanes, blade angle, and operating point on fan characteristics."Approach to Noise Control in New Facilities," R.D. Bruce and C.H. Allen. Proc. Inter-Noise 73, Noise Control Foundation, Poughkeepsie, NY, 1973-"Building a Quiet Plant from Initial Concept to Onstream Operation," S.L. Dryden and S.H. Judd. Pres. 37th Meeting Amer. Petrol. Inst. Div. of Refinery, 10 May 1972, New York, NY."Noise Control in New Facilities for Petroleum Production and Distribution," W.R. Thornton. Proc. Inter-Noise 73, Noise Control Foundation, Poughkeepsie, NY, 1973*"Organizing for Noise Control in a New Manufacturing Facility," A.H. Phelps. Proc. Inter-Noise 73, Noise Control Foundation, Poughkeepsie, NY, 1973.

"Noise Level Specifications for Machinery and Equipment,"C. Ebbing and P.B. Ostergaard. Sound and Vib., Vol. 7, January1973."Specifying Machinery Noise Levels, "A. Thumann. Pollut. Eng., Vol. 6, No. 3, 1974.
NOISE CONTROL: SPECIFICATIONS
322

"Acoustical Materials for the Food Processing Industry," R.K, Miller. Proc. Inter-Noise 73 > Noise Control Foundation, Poughkeepsie, NY, 1973-Gives noise levels, sanitary constraints on absorption materials, and isolator selection."Composite Materials for Noise Reduction," W.V. Cavanaugh. Proc. Inter-Noise 72, Noise Control Foundation, Poughkeepsie, NY, 1972.Discussion of many materials, advantages and shortcomings."Elastomer Terminology," Lord Kinetmatics, Lord. Corp., 1635 W. 12th St., Erie, PA."Lead Proves a Heavy Favorite as Sound Control Material." Prod. Eng., November 1973*"Materials for Noise Reduction in Food Processing Environments." Appl. Acoust., No. 11, 1978.Compendium of Materials for Noise Control. HEW Publication No. (NIOSH) 75-165.
NOISE CONTROL: MATERIALS
323

NOISE CONTROL TREATMENTS: BY TYPEBarriers"Barriers, " J.N. MacDuff. Mech. Eng., August 1974, pp. 26-31."Modular Partitions and Barriers for Industrial Noise Control Applications," A. Eckel. Pollut. Eng., July 1977, pp. 41-43.Noise Barriers: Design and Evaluation, T.J. Schultz. HUDHandbook. Also Report No. 2250, Bolt Beranek and Newman Inc., Cambridge, MA 02138, 1973-"Predicting Acoustical Attenuation of Barriers," J. Polhemus. Pollut. Eng., September 1975, pp. 56-57."Roll-Away Acoustic Barriers for Isolating Machinery Noise,"S.G. Paddock. Pollut. Eng., September 1974, pp. 49-50."Sound Attenuation by Barrier," V.L. Kurze and G.S. Anderson.Appl. Acoust., April 1971, pp. 33-35*"The Performance of Acoustic Barriers," J.B. Moreland and R.S. Musa. Noise Contr. Eng., Vol. 1, No. 2, Autumn 1973.Enclosures"Acoustic Hood Design in Theory and Practice," M.J. Hine.Proc. Inter-Noise 72, Noise Control Foundation, Poughkeepsie,NY, 1972."Attenuation of Nonmetallic Panels,” K.S. Norby. Proc. Inter- Noise 72, Noise Control Foundation, Poughkeepsie, NY, 197 2.For moderate amounts of transmission loss, lightweight panels can suffice. Paper describes characteristics of plastics, foams, aluminum, and safety glass."Designing Acoustical Enclosures," S.G. Tetorka. Pollut. Eng., October 1976, pp. 61-62."Facts about Noise Enclosures," T.F. Mimhold. Plant Eng.,16 September 1976, pp. 120-125-"Effective Use of Acoustical Enclosures and Barriers," J.K. Floyd Proc. Inter-Noise 78, Noise Control Foundation, Poughkeepsie, NY, 1978.Mufflers"An Evaluation of Mufflers to Reduce Punch Press Air Exhaust Noise," J.A. Onggerhart and E. Berger. Noise Contr. Eng.,Vol. 4, No. 3, 6 May 1975.
324

"Design Criteria for Industrial Mufflers," F.P. Mechel. Proc. Inter-Noise 75, Noise Control Foundation, Poughkeepsie, NY, 1975-"Design Optimization of Gas Turbine Silencers, I.L. Ver. Proc. Inter-Noise 75, Noise Control Foundation, Poughkeepsie, NY, 1975."Duct System Combines Flexibility with Sound Attenuation," R.A. Young. Pollut. Eng., May 1976."Evaluation of Pneumatic Silencers for Exhaust Valves and Parts Ejectors," H.W. Lord, H.A. Evenson, and R.J. Stein. Proc. Noise Expo '76, Noise Control Foundation, Poughkeepsie, NY, 1976."Exhaust Vent Silencer Design," C.L. Meador and J.J. Allan III.J. Eng. For Ind. Trans, of ASME, November 1972, pp. 1007-1019-"High Thrust, Low Noise Level Nozzle," A. Frochaux. Proc. Noise Expo '75, Noise Control Foundation, Poughkeepsie, NY, 1975-"Measured Absorption Characteristics of Resonant Absorbers Employing Perforated Panel Facings," E.E. Mikeska and R.N. Lane.J. Acoust. Soc. Amer., Vol. 28, September 1956.Gives results for many different configurations, tuning from 100 to 800 Hz-"Pneumatic Silencers for Exhaust Valves and Parts Ejectors,"H.W. Lord, H.A. Evensen, and R.J. Stein. Sound and Vib.,Vol. 11, No. 5-"Quiet Bagging." Compressed Air Mag., July 1974, pp. 8-9-"Selecting Silencers to Suppress Plant Noise," T.E. McLarty.Chem. Eng., 12 April 1976, pp. 104-105*"Silencers: Their Design and Applications," G.J. Sanders. Soundand Vib., Vol. 2, No. 2, February 1968.Describes types and attenuation frequency characteristics. Useful data on materials resistant to high temperatures, flow velocities.Operator Booths"Acoustic Shelters Meet Needs as Noise Pollution Grows," N.P. Chironis. Prod. Eng., 27 April 1970, pp. l60-l6l.Processor Modifications"Tension Control Bolt Eliminates Shop Noise." Met. Fabr. News,4 March 1977-
325

"Absorption as a Noise Control Measure in an Industrial Plant,"C.L. Coyne. Noise Contr. Eng., March 1958, pp. 47-52."Controlling Industrial Noise by Means of Room Boundary Absorption," J.B. Moreland. Noise Contr. Eng., Vol. 7, No. 3 12 November1976."Materials for Noise Absorption,” E.G. Shippee. Pollut. Eng», January 1-73, pp. 37-38."Noise Management by Reverberation Control," P.R. Weihsmann.Pollut. Eng. Part 1: February 1978, pp. 56-57- Part 2: March1978, pp. 55-59."The Acoustics of Externally Insulated Sheet Metal Roofs," R. Friberg. Swedish Research Summaries, Summary of Rep. R18, 1975-"The Use of Acoustical Absorbents in Industrial Noise Control,"L.F. Yerges, Sound and Vib., September 1972, pp. 31-32.Lagging/Wrapping"Noise Reduction Properties of Selected Pipe Covering Configurations," T.A. Dear. Proc. Inter-Noise 72, Noise Control Foundation, Poughkeepsie, NY, 1972.Exhaustive study of many pipe lagging systems for reducing radiating noise, under controlled conditions. Excellent reference.Vibration Isolation"Practical Design of Machinery Foundations for Vibration and Noise Control," H.T. Miller et al. Prcc. Inter-Noise 72, Noise Control Foundation, Poughkeepsie, NY, 1972.Discusses real-life parameters that must be considered.Damping"Steel-Viscoelastic Composites," R.C. Miles, Sound and Vib.,Vol. 7, No. 7, July 1973.Describes a panel of two layers of steel bonded by a lossy adhesive. Excellent damping is obtained."Structural Damping as a Technique for Industrial Noise Control,"G.E. Warnaka, et al. Reprint from J. Am. Indust. Hyg. Assoc., January 1972.Comparison of noise radiated from damped and undamped machine surfaces.
Room Treatment
326

NOISE PROBLEM MEASUREMENT, ANALYTICAL PROCEDURES, AND PROBLEMSOLVING AIDS"Acoustic Impact Assessment Procedures Used in Industrial Plant Site Selection," F. McKessler. Noise Control Eng., Vol. 6,No. 1. 1976."Analyzing the Sounds of Trouble," R.E. Herzog. Mach. Design,6 September 1973, pp. 128-134."A New Generation of Microprocessor Based Noise Analyzers,"J.J. Earshen, Proc. Inter-Noise 78, Noise Control Foundation, Poughkeepsie, NY, 1978."Application of B&K Equipment of Acoustic Noise Measurements,"J.T. Broch. 2nd ed., October 1971."Application of B&K Equipment to Mechanical Vibrations and Shock Measurements," J.T. Broch."Assessing Noise Impact on the Environment," F.L. Cross,Jr., Pollut. Eng."Audio Dosimeters: A Simple Way to Measure Noise Exposure,"P.A. Sonntag. Plant Eng., 30 March 1978, pp. 265-267."Audio Dosimeters: Shortcut to Measuring Noise Exposure," G.C.Groushore, Jr., Plant Eng., 30 September 1976, pp. 101-103-"A Wearable Noise Dosimeter," A.P. Singh. Noise Contr. and Vib. Reduction, 12 November 1973, PP- 250-254."Calculating Combined Noise Levels," F. Caplan. Plant Eng.,10 June 1976."Calculating OSHA Noise Compliance," T.A. Dean. Pollut. Eng., January 1973, PP• 43-44."Characterization of Transformer Noise Emissions, Vol. 1, Technical Report and Volume 2, Substation Siting Guide," I.L. Ver,D.W. Anderson, and M.M. Myles. Empire State Electric Energy Research Corporation, July 1977-"Choosing Basic Instruments to Analyze Noise Problems," W.G. Hyzer. Res./Develop., October 1975, PP• 42-47.Community Noise Ratings, T.J.' Schultz. Applied Science Publishers, Ltd., London (1972)."Controlling Industrial Noise, Part 1: Analysis and Measurement,"C.H. Wick. Manufactur. Eng. and Manage., March 1973-
327

"Correlation of Machine Structure Surface Vibration and Radiated Noise," C.M.P. Chan and D. Anderson. Proc. Inter-Noise 72, Noise Control Foundation, Poughkeepsie, NY, 1972.Mean square velocity of acceleration correlates well with sound power."Design and Evaluation of Dissipative Silencers,” J.S. Wang, Proc. Inter-Noise 78, Noise Control Foundation, Poughkeepsie, NY, 1978."Design Charts for Noise Reduction," J.T. Weissenburger. Pollut. Eng., July 1974, pp. 78-80."Diagnostic Tests for Locating Noise Source," T.H. Hodgson, Proc. Noise-Con 73, Noise Control Foundation, Poughkeepsie, NY, 1973*Uses damped, absorbent-lined tube in front of sound level meter to reduce pickup of undesired sound for close-in measurements."Dosimeter Response to Impulsive Noise — Measurement Errors and Their Consequences," J. Svensson, Proc. Inter-Noise 78, Noise Control Foundation, Poughkeepsie, NY, 1978."Estimating Noise from Control Valves," N.P. Cheremisinoff.Pollut. Eng., June 1977, pp. 48-50."Evaluation of Commercial Integrating-Type Noise Exposure Meters," W.A. Leasure, Jr., R.L. Fisher, and M.A. Cadoff. NBSIR 73-417,EPA 550/9-73-0007, December 1973."How to Estimate Fan Noise," J.B. Graham. Sound and Vib.,May 1972, pp. 24-27."How to Estimate Sound Levels in Industrial Environments, " R.A. DiRita and D.L. George, Sound and Vib., September 1972, pp. 33-35-"How to Use Sound-Level Meters," W.G. Hyzer. Res./Develop.,August 1975."Identification of Noise Sources," P.K. Baade. Proc. Inter-Noise 72, Noise Control Foundation, Poughkeepsie, NY, 1972.Valuable and practical information on techniques for locating noise sources."Industry Builds Arsenal to Combat Illegal Noise," B.D. Wakefield. Iron Age, 13 January 1975a pp. 31-38."Machine Noise Analysis and Reduction," T.D. Miller. Sound and Vib., Vol. 1, No. 2, March 1967-Uses rotational periodicity to locate sources in bearings, electrical equipment, fans. Briefly considers control means.
328

"Masoneilan Noise Control Manual," Bulletin No. 340E, 3rd Ed., Masoneilan Int. Inc., Norwood, KA 02062."Measurement of Noise," R.D. Bruce. IEEE Transactions on Geoscience Electronics, Vol. GE-8, No. 3, July 1970."Measuring and Analyzing Noise," J.T. Weissenburger. Plant Eng., 1 November 1973, PP• 80-84."Method for Determining Complex Operator Noise Exposures," P.W. Hess and P. Jensen. Amer. Ind. Hygiene Conf., 22-27 May 1977,New Orleans, LA."Noise Exposure Sampling: Use with Caution," F.D. Mellott,Proc. Inter-Noise 78, Noise Control Foundation, Poughkeepsie,NY, 1978."Noise Measurements," G. Rasmussen, Proc. Inter-Noise 78, Noise Control Foundation, Poughkeepsie, NY, 1978."On the Measurement of Source Strength of Large Industrial Sources," T. ten Wolde, Proc. Inter-Noise 78, Noise Control Foundation, Poughkeepsie, NY, 1978."Origins of Noise," L.D. Mitchell and G.A. Lynch. Mach. Design,1 May 1969*"Personal Noise Dosimetry in Refinery and Chemical Plants,"A.H. Diserens. J. of Occupational Med., April 1974, pp. 255-257."Pinpointing Noise with Sound-Level Meters," R.E. Herzog. Mach. Design, 5 April 1973, pp. 108-113-"Pipewall Vibrations Reveal Valve-Generated Noise Levels,"A.C. Fagerlund. Pollut. Eng., October 1977, pp. 56-58."Pneumatic Muffler Noise," A.L. Cudworth, W.J. Hanson, and W. Vuisting, Proc. Inter-Noise 78, Noise Control Foundation, Poughkeepsie, NY, 1978."Portable Instrument for Locating Noise Sources in Mechanical Equipment," D.A. Gilbrech and R.C. Bender. J. Acous. Soc. Am., Vol. 30, No. 842, September 1958.Two microphones correlated by a multiplier allow the direction of a sound source to be found."Power Station Design Due to Inconsistent Predictions of Fan Noise," F.A. Moritz, Proc. Inter-Noise 78, Noise Control Foundation, Poughkeepsie, NY, 1978."Predict Approximate Sound Level for Axial Fans," W. Sisson. Pollut. Eng., March 1977, pp. 47-48.
329

"Predicting Noise Levels for New Equipment Installations,"S.I. Roth. Plant Eng., 18 September 1975, pp• 147-148."Procedures for the Prediction of the Core Noise of Power Transformers/1 by C.G. Gordon, A .G . Piersol, and E.G. Wilby, Bonneville Power Administration, January 1978."Put Noise Criteria to Work for Your Plant," J.D. Constance. Power, April 1973«"Some Considerations on the Measurement of the Sound Absorption Coefficient in Reverberation Rooms," H. Myncke and A. Cops, Proc. Inter-Noise 78, Noise Control Foundation, Poughkeepsie, NY, 1978."Sound Power Measurements on Large Machinery Installed Indoors,"G.M. Diehl, Proc. Noise Expo, September 1973*"Technical Evaluation of Pneumatic Tool Noise," P.C.L. Lin,W.N. McKinnery, and M.K. Klein, Proc. Inter-Noise 78, Noise Control Foundation, Poughkeepsie, NY, 1978."Techniques for Identifying Noise Control," J. Polthemus.Pollut. Eng., August 1976, pp. 36-77*"Techniques for Industrial Noise Measurement: Choosing theInstrumentation," R.A. Boole. Plant Eng., 7 February 1974, pp. 105-107*"The Uses of Sound Power Levels in Designing for Noise Control," P.K. Baade, Proc. Inter-Noise 78, Noise Control Foundation, Poughkeepsie, NY, 1978."Sound Level Meter and Dosimeter Response to Unsteady Noise Levels," R.B. Wilkinson. Noise Contr. Eng., 4 March, 1975s pp. 68-75*"Sound Power Determination of Machines In Situ," G. Huebner,Proc. Inter-Noise 72, Noise Control Foundation, Poughkeepsie,NY, 1972.Discusses errors from being in near field, from finite number of measurements, from measurement error, and from room reflections. Latter are unimportant if area ratio (total absorption in room)/ (area of measuring surfaces) is greater than 10."Sound Power Levels of Small Hand-Held Tools," G.M. Diehl. Compressed Air Mag., October 1977, pp- 16-19*"Sound Power Measurements," T. Ketcham. B&K Technical Note,B&K Instruments, Inc., Cleveland, Ohio."Sound Power Measurements in Large Machinery Installations,"G.M. Diehl. Sound and Vib., May 1974.
330

"Sound Power Measurements in Large Machinery Installed Indoors," Compressed Air Mag«, January 1974.
331

NOISE CONTROL PROGRAM MANAGEMENT: ARTICLES OP GENE R A L INTERESTTO MANAGERS OF NOISE CONTROL PROJECTS
"An Example of Industrial Noise R e d u c t i o n in Japan," M.A. Seaman, Proc. Inter-Noise 78, Noise Control Foundation, Poughkeepsie,NY, 1978.
" Assigning Priorities to Noise R e d u c t i o n Projects," A.L. Weiser. Pollut. Eng., October 1975, pp. 33-34.
"Basic Procedures for Eval u a t i n g Noise Control Project Costs,"A. Thumann. Plant Eng., 11 Nove m b e r 1976, pp. 156-157.
"Boundary Abso r p t i o n Versus Source Noise Control in Factories,"S. Dahlstedt and S. Aim, Proc. Inter-Noise 78, Noise Control Foundation, Poughkeepsie, NY, 1978.
"Contour M a p p i n g Applied to OSHA Noise Problems," T.H. Rockwell. Noise Contr. E n g . , Vol. 7, No. 1, 1976.
"Controlling Plant Noise Levels," R.E. Nisbet. Plant Eng.,24 June 1976, pp. 127-129-
"Coordinating and M a n a g i n g Noise Problems in Textile Operations, Parts 1 and 2," I. Bull. Ctr. for Acoust. Stud., School of Energy, North Carolina State University.
" Cost-Effective Noise Control in Industry," R.S. Skinner. Noise Contr. Vib. and Isolation, January .1978, pp. 13-15-
"Engineering Solutions for Noise Control at GM," J.R. Hofmesiter- Sound and V i b . 9 May 1975, pp. 39-^3-
" F e a s i b i l i t y : the Uncertainty F a c t o r in Noise Control," P.D.Emerson. Amer. Textile Rep./Bull., Septe m b e r 1974, pp. 60-62.
"Foundry Mounts a Successful Assault on Noise," T. Breen.Occup. Hazards, July 1976, pp. 31-33*
"Great N o r t h e r n Launches an Attack on Noise in Its M a i n Paper Mills." Pulp and Paper, Novem b e r 1977, pp. 156-158-
"GM's Noise Control P r o g r a m ,” W.L. V a n Tifflin. Sound and Vib. Novem b e r 1973, pp* 29-31.
"How to Get Star t e d on Noise Control," Textile World, June 1970, pp. 51-55.
"Noise — OSHA, and What Do We Do About It," B.R. Schroeder. The M a n u f a c t u r i n g Confectioner, Nove m b e r 1974.
"Planning and E n g i n e e r i n g for Noise Control — A Case History of a M a j o r Refinery Project," J.G. Seebold. Proc. Inter-Noise 78, Noise Control Foundation, Poughkeepsie, NY, 1978.
332

"Planning and Organizing an Effective Noise Abatement Program,"J .T. Weissenburger. Plant E n g . , 20 February 1975, P P • 93-96.
"Practical Noise Control in a Large M a n u f a c t u r i n g Plant," J.W. Storment and H.K. Pelton. Sound and Vib., May 1976.
"Standards and Criteria for Noise Control," K.M. Eldred, Proc. Inter-Noise 78, Noise Control Foundation, Poughkeepsie, NY,1978.
"Study of Community Noise Complaints Caused by Electric Power Plant Operations," R.M. Hoover. Noise Contr. Eng., Vol. 6,No. 2, 1976.
"Techniques for Noise Exposure Control in Existing Power Plants," R.A. Popeck. ASME Paper No. 75-WA/PWR-6.
"The High Cost of Keeping Quiet," C.W.B. Compressed Air Mag.,May 1977, pp. 8-11.
3 33

"About Those Hearing Protectors," T.F. Meinhold. Plant Eng.,4 September 1975, PP- 68-73-
"Controlling Industrial Noise, Part 5: Admi n i s t r a t i v e Controlsand Hearing Protection," C.H. Wick. Manufact. Eng. and Manage., July 1973, pp. 32-35.
"Control of Industrial Noise through Personal Protection,"R. R.A. Coles. In: "Noise as a Public Health H a z a r d ,” W.D.Ward and J.E. Fricke, e d s . P r o c . Conf. Amer. Speech and Hearing Assoc., Rep. No. 4, Washington, D.C., June 1968.
"Ear Protectors — Their Characteristics and Uses," J.H. Botsford. Sound and Vib., Novem b e r 1972, pp. 24-29-
"Methods of Noise Control — Personal Protection," P.S. Vanek- Lasen. Noise C o n t r . , Vol. 1, No. 5, September 1955.
"Personal H e a ring Protection Devices," P.L. C h e r e m i s i n o f f .Pollut. Eng., December 1972, pp. 29-31.
"Pointers on Sele c t i n g Hear i n g Protectors," B.M. Routson.Pollut. Eng., Decem b e r 1973, pp. 36-37.
HEARING PROTECTORS: GENERAL

HEARING PROTECTORS: EFFECTS OF USE
P erformance
"dBA Attenuation of Ear Protectors," R. Waugh. J. Acoust. Soc. Amer., Vol. 53, No. 2 (1973) pp. 440-447.
"Ear Plug Performance in Industrial Field Conditions," M.Padilla. Sound and Vib., May 1976, pp. 33-36.
•
"Ear Protector Ratings," J.V. Tobias and F.M. Irons. FAA Civil Aero M e d ical Inst., December 1973, Oklahoma City, OK.
"I n vestigation of Sound L e vel Conversion as a Means of Rating Ear Protector Performance," R. Waugh. Amer. Ind. Hyg. Assoc. J., April 1976, pp. 23-24.
"Simplified Methods for Estim a t i n g Hearing Protector Performance," D.L. J o h nson and C.W. Nixon. Sound and Vib., June 1974, pp.20-27.
Speech Communication
"Speech Communications Effects and Temporary Threshold Shift R e duction Provided by V 51R and S electone-K Earplugs under C o n ditions of High Intensity Noise," R.R.A. Coles and C.G. Rice.J. Sound Vib., Vol. 4, No. 2, pp. 156-171.
"Value of Ear Defenders for M e ntal Work during Intermittent Noise," M.M. Woodhead. J. Acoust. Soc. Amer., Vol. 32, No. 6 (June I960), pp. 682-684.
Bibliographies
"Bibliography on Ear Protection," Royal Aircraft Establishment, January 1973* Distributed by: NTIS, U.S. Dept, of Commerce.
"Environmental Pollution: Noise Pollution — Ear Protectors."Defense Doc. Ctr., Defense Supply Agency, Cameron Station, Alexandria, VA.
Hearing Conservation Programs
"A Guide to Industrial Hear i n g Conservation," W.F. Carver.Chicago: Beltone Electron. Corp., 4201 W. Vict o r i a St., Chicago,IL.
"A Model Hearing Conserva ti on Program," L.E. M i ne r and K.R.Peters. Job Safety and Health, February 1977, pp. 15-19.
"A Recom m e n d e d Noise Compliance Plan for Evaluation by Industry in Devel o p i n g an Effective Hear i n g Conservation Program," W.C. Creel and L.H. Royster. Ind. Ext. Serv. Newslett., School of Eng., North Carolina State University.
335

"Establishing an Effective Hearing C onservation Program," J.A. Zatek. Plant Eng., 30 October 1975, PP- 59-61.
"Hearing Conse r v a t i o n — A Call for Action," G.R. Bearce. Sound and Vib., January 1975, pp. 24-28.
"About Those Hearing Protectors," T.F. Meinhold. Plant Eng.,4 Se pt em be r 1975, pp. 68-73.
"Industrial Hear i n g Conservation," C.W. Nixon. Audiology and Hearing E d u c ., April/May 19?6, pp. 33-41.
"Industrial Noise and H e a ring Protection." Wassau: Safety andHealth Services, Employers Insurance of Wausau, N.Y.
"Medical Prevention of Deafness from Noise (in a Swedish Machine Industry)," C.A. Heijbel. Reprinted from: W o r k - E n v i r o n .-HealthVol. 7, No. 1, 1970, Inst. Occup. Health, Helsinki, Finland.
"Practical Experience of Hearing C onservation in Industry,"C.A. Heijbel. Lecture he l d Indust. Noise C o n f ., London,December 1961, G. Mineraiull, ed.
"Survey of Hear i n g Conservation Programs in Industry," M.E. Schmidek, M.A. Layne, B.L. Lempert, and R.M. Fleming. U.S.Dept, of HEW, Public Health Serv., Ctr. for Disease Contr.NIOSH, Div. of Lab. and Criteria Develop., June 1975, Cincinnati OH.
"The Challenge of H e a ring Protection," R. Mars. Ind. Med., Vol. 39, No. 3, M a rch 1970.
336 ir B S GOWMCKT HNHTIK o m c f 1 W 6 5 7 - 0 6 1 / 1 8 8 8