industrial partner legrand - us department … · legrand is installing submeters in its 14 u.s....
TRANSCRIPT
INDUSTRIAL PARTNER
LEGRAND
Implementation Model: Submetering Initiative and Energy Dashboards ORGANIZATION TYPE Electrical equipment and components manufacturer BARRIER Lack of detailed energy use data to drive organizational change SOLUTION Installation of submeters and energy dashboards to collect and communicate facility-wide energy use data OUTCOME Employees empowered to pursue newly visible energy efficiency opportunities
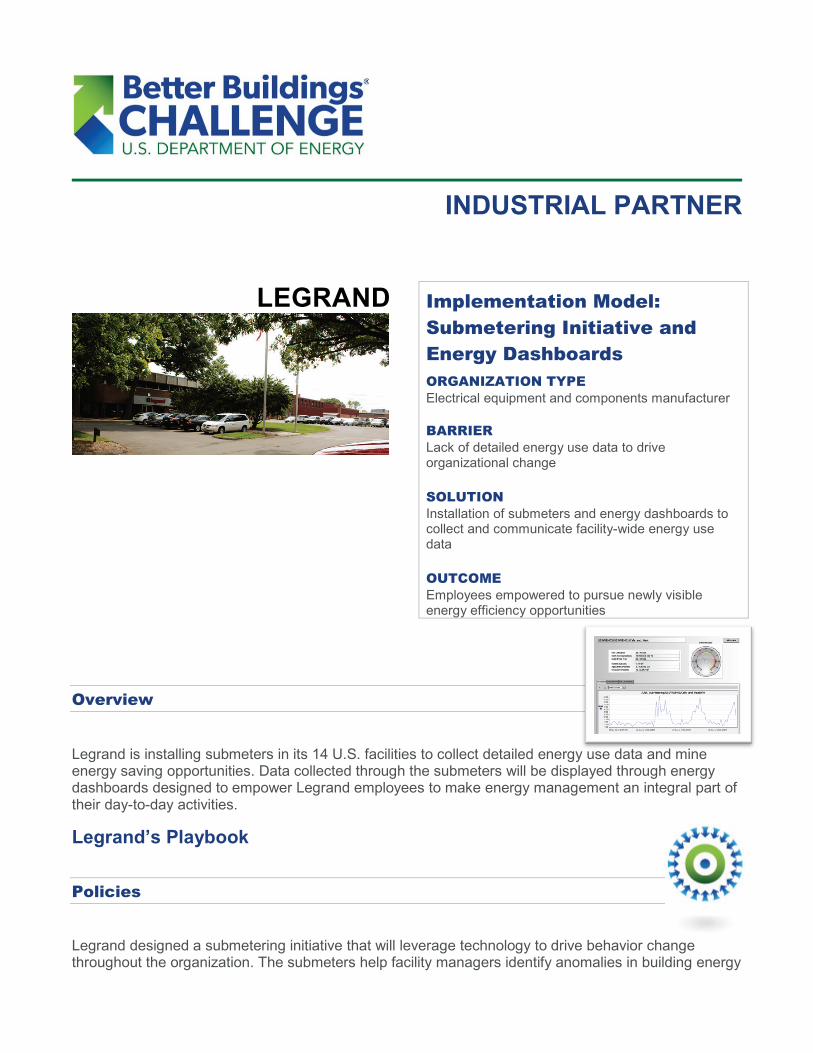
Overview Legrand is installing submeters in its 14 U.S. facilities to collect detailed energy use data and mine energy saving opportunities. Data collected through the submeters will be displayed through energy dashboards designed to empower Legrand employees to make energy management an integral part of their day-to-day activities.
Legrand’s Playbook
Policies
Legrand designed a submetering initiative that will leverage technology to drive behavior change throughout the organization. The submeters help facility managers identify anomalies in building energy

use and uncover hidden opportunities. The initiative will also feed into a broader effort to educate employees and encourage them to act on energy saving opportunities.
Legrand is following these five steps to implement its initiative:
1. Design and install submeters to collect granular energy use data at all 14 U.S. facilities, which include both manufacturing and non-manufacturing buildings
Legrand site energy managers worked with the company’s project lead to design the installation of submeters at their sites and order equipment. Legrand selected submeters that can monitor eight different electrical inputs plus two pulse inputs—usually water or natural gas—and offer interoperability with existing data systems. The main considerations made in the design of the systems included:
Monitor total facility power: At some sites there are four and five utility meters serving the facility. At other sites, total power is not monitored, but all power from the main distribution panel is monitored through individual submeters. To simplify efforts to monitor a facility’s total power, submeters are installed at all service points or electricity meters to capture the total amount of electricity used.
Prioritized placement of submeter sensors to monitor largest electrical users or efficiency projects: To efficiently deploy the meters, site energy managers prioritize measurement of electrical lines with larger magnitudes of power over smaller lines. Sensor placement is flexible and their locations can be changed at a later date as needs and conditions at the facility change. Sensors are also placed where energy efficiency projects are needed or have been completed to measure the total impact of the projects.
The placement of submeters and their sensors varies among manufacturing facilities and commercial buildings, due to differences in the composition of their base loads. Manufacturing plant managers have larger base loads with many more significant variables (e.g., changing use of machinery) so they must measure the effects of various pieces of equipment to determine opportunities for energy savings. Commercial building managers will track changes to smaller and more consistent base loads where the most significant variable is outside temperature.
2. Design of information systems networks and servers
It is imperative that Information Technology (IT) teams be involved throughout the submetering system’s installation and configuration process. The main issues that need to be addressed include:
Security of data: IT teams define where the submetering data is housed, how it is accessed, and who has access to each site’s data.
Network design: Submeter data is part of the managed network and is not kept separate from other managed data.
Routing of data: The submetering data is interpreted from one type of code to another before it can be transmitted over the internet and is usable to readers.
Storage and backup of data: IT teams define where current and old data is housed and implement a regular backup schedule.
Analysis of data: IT teams implement programming that allows readers to predict peak loads both in demand and consumption and make operational changes in real time to avoid peak pricing.
3. Create energy manager tools

Energy manager tools provide users with the ability to look at single or multiple meters over selectable time periods. These tools can also compare data from one meter over different time intervals. Legrand is using Tridium tools to build capabilities that allow users to “drag and drop” meter points on to charting tools for evaluation.
4. Design dashboards at each site that will communicate energy data to employees
In tandem with submeter installations, the Legrand project lead is working with an internal computer application engineer to develop an energy dashboard for each site. The dashboard will provide users with facility-wide energy information as well as submeter-specific information designed to show users how, where, and when energy consumption occurs within the facility (see Figures 1, 2, and 3 for examples of dashboard displays).
The dashboards will utilize a visualization tool that is capable of displaying data from multiple sources on a screen—including non-energy information such as a stock ticker and weather conditions.
Dashboards can be equipped with an alarm console to signal when:
Any HVAC unit is operated on both cooling and heating in the past 120 minutes.
Any HVAC unit that is operating in one mode (heat/cool) while another is operated in a different mode within 60 minutes.
A unit is running in cooling mode below 60O outside air temperature (OAT).
A unit is operating in heating mode above 65O.
Lighting power density in any area is above 1.2 watts per foot.
Figure 1: Building power draw over 4 days (Sun – Wed) is shown in the figure. Such information can provide insight into: energy use during non-business hours, improper shutdown of equipment or processes, and excess base load power. It can also help identify times of peak usage, patterns in energy use, and other characteristics of facility power draw. For example, a nearly 10 kW increase in demand occurs around midnight the two weeknights shown in the figure. This could be attributed to the energy used for cleaning or another routine activity occurring every weeknight. This information can help facility managers predict periods of high energy consumption based on historical patterns, schedule operations to minimize energy costs, develop energy use protocols, and identify areas and processes that require further investigation.
Figure 2: The data in the figure shows the energy use for a Legrand laboratory. Through the morning, there are three spikes in kW demand. The laboratory also shows a general ramping up of power consumption throughout the morning. As the laboratory is part of the main meter, the energy consumption in the lab will contribute to the total building peak demand. Therefore, the facility manager manually eliminates discretionary loads to minimize the impact on the building’s peak demand, which usually occurs between 12-5 pm. The base line represents the average demand during this period.

Plug Load density is above 200 watts in any office.
5. Integrate data into a broader employee awareness campaign designed to empower all employees to become energy managers
During the first phase of the project, the primary audience for facility energy dashboards is energy managers, who can access site-specific dashboards from a company website. During the next phase of the project, Legrand anticipates displaying site-specific dashboards via TV monitors in common areas such as break rooms, cafeterias, and lobbies to make the information available to all employees in a facility.
Tools:
– “Metering Best Practices: A Guide to Achieving Utility Resource Efficiency,” Federal Energy Management Program (Release 2.0)
Process A member of the Legrand Energy Technology & Finance Council independently investigated the application of submetering at his site and developed a proposal for corporate-wide deployment of submeters. The council member received support from the Council and the Vice President of Sustainability to present the proposal to the Legrand Executive Team.
Approximately two months later, at a monthly Executive Team meeting, the council member presented the submetering initiative and the following objectives: 1. Increase transparency of energy use to allow energy managers to identify anomalies within
buildings’ energy consumption and capture energy savings. 2. Design energy dashboards that can be used as tangible tools to educate employees about
the everyday impacts of energy consumption. 3. Empower all employees to become energy managers, thereby driving corporate-wide
behavior change to reduce energy intensity. The Executive Team approved the proposal, provided a capital allocation of $192,500 for the installation of submeters at Legrand’s 14 U.S. sites, and designated the council member as the Project Lead.
Figure 3: As a benefit of submetering, the factors contributing to building demand can be better understood. In the figure, the building demand for one day is compared to the cafeteria demand on the same day to help explain the contributing factors to the building peak demand. The 20 kW increase in building demand at 1 pm (which represents the peak for the day) corresponds to a 20 kW spike in cafeteria energy use at the same time when many employees are taking lunch. Information like this can help Legrand lower its demand and associated charges.

One of the first sites to receive submeters was Legrand’s corporate headquarters in West Hartford, CT. The company encountered a few barriers while installing the meters there, including: Staff initially struggled with installing submeters in the 100-year old facility due to aging
infrastructure. By consulting technical experts and ordering additional electrical components, the submeter hardware was successfully installed. In addition, the site energy manager created an implementation template to guide future submeter installations at that location.
Due to the physical location of the seven submeters, two separate power shutdowns of 8 to 12 hours were required, resulting in attendant costs. Utility engineers, Legrand’s facility engineers, and electrical engineers were all required to be present during the installation. To reduce costs, Legrand installed multiple submeters during each shutdown.
In addition to the logistical difficulties at Legrand’s headquarters site, installation teams across Legrand have faced IT obstacles. The most significant barrier has been obtaining an additional server to house data collected from the submeters. The Project Lead submitted a request to Legrand Group to add a server to the Legrand network. The Project Lead is utilizing an existing server as he waits for approval of the new server. At the local level, energy managers have found it difficult to secure sufficient time from IT personnel to assign IP addresses for submeters and navigate firewalls to allow submeters to send data to the temporary server. While waiting for the energy dashboard development, energy managers have not utilized the submetering data due to the cumbersome nature of accessing the data through the temporary server and then analyzing the abundance of raw data. Despite these barriers, Legrand continues to install submeters at its 14 locations. Since the autumn of 2011, Legrand has fully installed submeters at 12 sites with two more site installations planned in 2013. Tools:
– “Submetering and Reporting System Proposal” Presentation to Legrand Senior Management
– “Making the Case for Energy Metering,” ASHRAE Journal
Outreach Legrand has not rolled out energy dashboards yet, but has made a concerted effort in 2012 to educate its employees on personal and work-related energy use; including steps Legrand has taken at individual sites to reduce energy intensity. These communications occur two times per month and are broadcast via email, posters, and TV slides and through the CEO’s quarterly webcast on Legrand’s progress. Legrand has utilized educational charts on residential and commercial energy use provided by the U.S. Department of Energy and some of its monthly success stories can be found on the Legrand website.

The goal of this initiative is to increase energy and dollar savings. The submetering program considers the utilization of power (demand) and energy (consumption) while remaining aware of how these impact costs.
Two variables Legrand asks its facilities to monitor are the kWh / kW ratio (where kWh is equal to the monthly consumption, and kW is the utility billing demand for the month) and the daily Minimum kW / Maximum kW ratio.
kWh / kW Ratio. Using this formula leaves the variable “hours” (kWh/kW = H). This monthly formula approximates the number of hours the facility operates during a billing period. For most commercial spaces, Legrand expects an hour range of 250 – 300; for multiple shift operations, it expects higher numbers because the consumption of energy, or the numerator, is greater. If the number of hours produced by the ratio changes, the facility manager should understand what is happening in the facility to cause the change.
For example, a commercial office’s ratio can be calculated by multiplying operating hours per billing cycle: 50 hours per week and 4.3 weeks per month results in a ratio around 250 (50 x 4.3 = 212, plus miscellaneous nighttime loads). If this facility had an actual ratio of 400, it could indicate excessive loads running at night. On the other hand, ratios less than 250 could indicate excessively high demand, and higher energy costs to match.
Minimum kW / Maximum kW Ratio. The other Key Performance Indicator (KPI) Legrand’s energy managers are watching is the daily kW minimum / kW maximum ratio. This may be a seasonal figure that can change during different heating and cooling cycles, but in general Legrand aims for a ratio of 20% or below. (See Figure 4 for an example of how the kW minimum load / kW maximum load ratio is displayed in a dashboard.)
This ratio helps energy managers identify and eliminate energy waste by focusing on a building’s unoccupied hours. Based on 50 hours per week and 50 weeks per year, a building is actively running 2,500 hours per year. However, the building carries a base load for close to 8,760 hours per year (24 hours x 365 days) and if a building is operating with a minimum kW / maximum kW ratio of 40%, as in Figure 4, it is wasting 20% of energy for 6,260 hours or over three-quarters of the year.
To better understand the impacts of the kW minimum and kW maximum on this ratio, assume a building has a kW minimum of 20 and a kW maximum of 100 (20/100 = 20%). While increasing peak demand would lower the ratio (20 kW minimum / 105 kW maximum = 19%), Legrand’s efforts are focused on lowering the kW minimum to produce a lower ratio (15 kW minimum / 100 kW maximum = 15%). Ideally, energy managers should work to reduce both the kW minimum
Measuring Success
Figure 4: The power demand (kW) for an entire facility for one day is displayed in this graph. Legrand uses the daily kW minimum load / kW maximum load as a KPI to help characterize how effectively the facility uses energy. Legrand has set a goal to keep this ratio below 20%. In this facility, the ratio is 43% (134/310 = 0.43) with the kW minimum at an unnecessarily high level. The data in the chart allows facility managers at Legrand to monitor this KPI and take action when necessary.

and kW maximum (15 kW minimum / 95 kW maximum = 15.8%). In some cases, this effort may yield a slightly higher ratio, but it will have a more positive impact on the company’s overall energy management strategy.
While telling, these variables are not the end game for Legrand’s energy managers; they are KPIs that can be used to understand how effectively the company is using energy on a daily and monthly interval for each metered point. It is important that the facility as well as the metered devices are understood by the energy manager.
Outcomes The submetering initiative began in fall 2011. Where devices have been fully installed, results have been promising. Many of the Legrand sites are finding that equipment that was scheduled to be off, either manually or by an automation system, may not be shutting down completely as expected. One site found no scheduled shut off of the mechanical systems while another found that the lighting was on during unoccupied periods. At Legrand’s corporate headquarters, data from the submeters in one facility were used to modify the HVAC schedule and alter the building’s occupancy sensors. These changes reduced base load power use from 18.5% of peak load to 4.5% in three months.
Although the submetering initiative is still in its early stages, similar opportunities are expected to be uncovered as Legrand finishes installing submeters at the rest of its facilities by the end of 2013.
Legrand has written a white paper that summarizes the lessons learned through its submetering effort.
Tools: – “Becoming Smarter about Energy: A Guide to Submeter Development and Greater
Energy Management Insights”