industrial pollution still threatens american waterways · help bay staters make their voices heard...
TRANSCRIPT

Troubled WatersIndustrial Pollution Still Threatens
American Waterways

Elizabeth Berg and Hye-Jin Kim, Frontier Group
John Rumpler, Environment America Research and Policy Center
Troubled Waters Industrial Pollution Still Threatens
American Waterways
Spring 2018

The Environment Massachusetts Research & Policy Center is a 501(c)(3) organiza-tion. We are dedicated to protecting Massachusetts’ air, water and open spaces. We investigate problems, craft solutions, educate the public and decision-makers, and
help Bay Staters make their voices heard in local, state and national debates over the quality of our envi-ronment and our lives. For more information about Environment Massachusetts Research & Policy Center or for additional copies of this report, please visit www.environmentmassachusettscenter.org.
Environment Massachusetts Research & Policy Center thanks Kenneth Kopocis, former Deputy Assistant Administrator in the Office of Water, U.S. Environmental Protection Agency; Josh Galperin, Director of the Yale Law School Environment Protection Clinic; Susan Kraham, Senior Staff Attorney at the Columbia Law School Environmental Law Clinic; and Josh Kratka, Senior Attorney at the National Environmental Law Center for their review of drafts of this document, as well as their insights and suggestions. Thanks also to Tony Dutzik and Elizabeth Ridlington of Frontier Group for editorial support. Additional thanks to the numerous staff at state environmental protection agencies across the country for reviewing the data for accuracy.
Environment Massachusetts Research & Policy Center thanks the Park Foundation and the Water Foun-dation for helping to make this report possible. The authors bear responsibility for any factual errors. The recommendations are those of Environment Massachusetts Research & Policy Center. The views expressed in this report are those of the authors and do not necessarily reflect the views of our funders or those who provided review.
2018 Environment Massachusetts Research & Policy Center. Some Rights Reserved. This work is licensed under a Creative Commons Attribution Non-Commercial No Derivatives 3.0 Unported License. To view the terms of this license, visit creativecommons.org/licenses/by-nc-nd/3.0.
Frontier Group provides information and ideas to help citizens build a cleaner, healthier and more demo-cratic America. Our experts and writers deliver timely research and analysis that is accessible to the public, applying insights gleaned from a variety of disciplines to arrive at new ideas for solving pressing prob-lems. For more information about Frontier Group, please visit www.frontiergroup.org.
Layout: To The Point Collaborative, tothepointcollaborative.com
Cover photo: NOAA via Flickr, CC BY-SA 2.0
Acknowledgments

Table of ContentsExecutive Summary . . . . . . . . . . . . . . . . . . . . . . . . . . . . . . . . . . . . . . . . . . . . . . . . . . . . . 4
Introduction . . . . . . . . . . . . . . . . . . . . . . . . . . . . . . . . . . . . . . . . . . . . . . . . . . . . . . . . . . . 7
The Clean Water Act Limits Pollution of Our Waterways . . . . . . . . . . . . . . . . . . . . . 9
Direct Pollution of Waterways Is Illegal Without a Permit . . . . . . . . . . . . . . . . . . . . . . . . . . . . . . . . .9
Both State and Federal Authorities Must Enforce the Clean Water Act . . . . . . . . . 10Clean Water Permits Are Intended to Restore Waterways to Health . . . . . . . . . . . . . . . . . . . . . . .11
Compliance with the Clean Water Act Is Reported in Publicly Available Databases . . . . . . . . . . . . . . . . . . . . . . . . . . . . . . . . . . . . . . . . . . 12
Publicly Accessible Reporting Is an Essential Tool for Enforcement . . . . . . . . . . . . . . . . . . . . . . . .13
Not All States Fully or Accurately Report Enforcement Data to the EPA . . . . . . . . . . . . . . . . . . . . .13
Industrial Facilities Exceeded Pollution Limits 8,100 Times from January 2016 through September 2017 . . . . . . . . . . . . . . . . . . . . . . . . . . . . . . . . . . . . . . . . . . . . . . . . 15
Discharge Exceedances by State . . . . . . . . . . . . . . . . . . . . . . . . . . . . . . . . . . . . . . . . . . . . . . . . . . . .15
Exceedances per Major Industrial Facility . . . . . . . . . . . . . . . . . . . . . . . . . . . . . . . . . . . . . . . . . . . . .15
Exceedances in Impaired Waters . . . . . . . . . . . . . . . . . . . . . . . . . . . . . . . . . . . . . . . . . . . . . . . . . . . . 17
Percentage of Major Industrial Facilities with Exceedances . . . . . . . . . . . . . . . . . . . . . . . . . . . . . . 17
Major Industrial Facilities with Repeated Exceedances . . . . . . . . . . . . . . . . . . . . . . . . . . . . . . . . . .18
Severity of Exceedances . . . . . . . . . . . . . . . . . . . . . . . . . . . . . . . . . . . . . . . . . . . . . . . . . . . . . . . . . . .19
Clean Water Act Enforcement Is Often Weak. . . . . . . . . . . . . . . . . . . . . . . . . . . . . . . 20America’s Poor Track Record of Clean Water Compliance and Enforcement . . . . . . . . . . . . . . . . .21
Clean Water Enforcement Is Declining under the Trump Administration . . . . . . . . . . . . . . . . . . . .21
The Trump Administration Is Proposing to Further Erode Clean Water Protections . . . . . . . . . . . . . . . . . . . . . . . . . . . . . . . . . . . . . . . . . . . . . . . . 24
Trump Administration Undermines the Clean Water Act Itself . . . . . . . . . . . . . . . . . . . . . . . . . . . .25
Policy Recommendations. . . . . . . . . . . . . . . . . . . . . . . . . . . . . . . . . . . . . . . . . . . . . . . . 27
Methodology . . . . . . . . . . . . . . . . . . . . . . . . . . . . . . . . . . . . . . . . . . . . . . . . . . . . . . . . . . 28Compliance Analysis . . . . . . . . . . . . . . . . . . . . . . . . . . . . . . . . . . . . . . . . . . . . . . . . . . . . . . . . . . . . . .28
Enforcement and Inspection Analysis . . . . . . . . . . . . . . . . . . . . . . . . . . . . . . . . . . . . . . . . . . . . . . . .29
Appendix . . . . . . . . . . . . . . . . . . . . . . . . . . . . . . . . . . . . . . . . . . . . . . . . . . . . . . . . . . . . . 30
Notes . . . . . . . . . . . . . . . . . . . . . . . . . . . . . . . . . . . . . . . . . . . . . . . . . . . . . . . . . . . . . . . . . 64
4 Troubled Waters
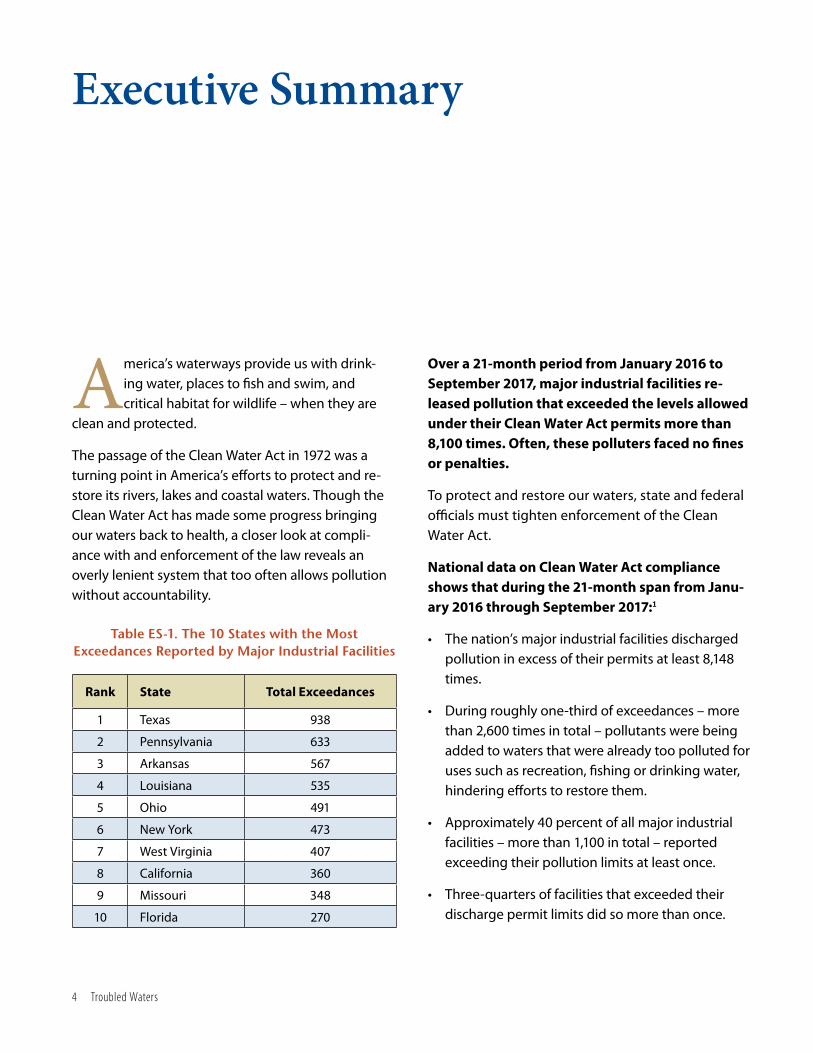
Table ES-1. The 10 States with the Most Exceedances Reported by Major Industrial Facilities
Executive Summary
America’s waterways provide us with drink-ing water, places to fish and swim, and critical habitat for wildlife – when they are
clean and protected.
The passage of the Clean Water Act in 1972 was a turning point in America’s efforts to protect and re-store its rivers, lakes and coastal waters. Though the Clean Water Act has made some progress bringing our waters back to health, a closer look at compli-ance with and enforcement of the law reveals an overly lenient system that too often allows pollution without accountability.
Over a 21-month period from January 2016 to September 2017, major industrial facilities re-leased pollution that exceeded the levels allowed under their Clean Water Act permits more than 8,100 times. Often, these polluters faced no fines or penalties.
To protect and restore our waters, state and federal officials must tighten enforcement of the Clean Water Act.
National data on Clean Water Act compliance shows that during the 21-month span from Janu-ary 2016 through September 2017:1
• The nation’s major industrial facilities discharged pollution in excess of their permits at least 8,148 times.
• During roughly one-third of exceedances – more than 2,600 times in total – pollutants were being added to waters that were already too polluted for uses such as recreation, fishing or drinking water, hindering efforts to restore them.
• Approximately 40 percent of all major industrial facilities – more than 1,100 in total – reported exceeding their pollution limits at least once.
• Three-quarters of facilities that exceeded their discharge permit limits did so more than once.
Rank State Total Exceedances
1 Texas 938
2 Pennsylvania 633
3 Arkansas 567
4 Louisiana 535
5 Ohio 491
6 New York 473
7 West Virginia 407
8 California 360
9 Missouri 348
10 Florida 270

Executive Summary 5
Not only did many major industrial facilities exceed their permit limits – sometimes frequently – but some of those exceedances were particularly severe, with facilities releasing multiple times the amount of pollution permitted under their Clean Water Act permits.
State and federal agencies are failing to take strong enforcement action to stop these rampant excess discharges of pollution into America’s waters.
• Numerous studies by the EPA Inspector General and others highlight a history of lackluster enforcement of the Clean Water Act by state environmental agencies.
• The number of inspections of major industrial facilities was on pace to be lower in 2017 than in any of the previous five years, according to Integrated Compliance Information System (ICIS) records (Figure ES-1).
• Many violations go unpunished. Each year from 2011 to 2017, an average of 27,849 facilities were non-compliant across the U.S., while an average of 13,076 – less than half – faced any EPA or state enforcement action.2
• Even when fines are issued, they are often too low to deter polluters. In 2017, the median fine issued by the EPA was lower than it had been in any year since 2011.3
The Trump administration’s proposed cuts to the Environmental Protection Agency’s budget and re-duced emphasis on enforcement threaten to open the door for more illegal pollution of our water-ways. For fiscal year 2019, the current administration plans to cut the EPA’s budget for civil enforcement of environmental protection programs, including the Clean Water Act, by $30.4 million.4 Funding for state grants to improve the permitting process and enforcement of the Clean Water Act is slated for
Figure ES-1. Federal and State Inspections of Industrial Facilities by Year
2,127
1,849 1,9071,722 1,660
1,431
0
500
1,000
1,500
2,000
2,500
2012 2013 2014 2015 2016 2017(projected)
Num
ber o
f ins
pect
ions
6 Troubled Waters
cuts as well; this program’s proposed budget is lower than the amount allotted in total grants for at least the previous seven years.5
To protect the rivers, streams and lakes that are criti-cal for the health of our wildlife and our communities, states and the federal government need to take strong action to enforce our core environmental laws. To strengthen compliance with clean water regu-lations, policymakers should:
• Ensure that the Clean Water Act applies to all our waterways, so that there is nowhere polluters can dump with impunity.
• Strengthen permits with enforceable, numeric limits on pollution that are ratcheted down over time as technology allows or water quality demands.
• Restore – and increase – funding for state and federal enforcement, such as water pollution control grants, so that states have the resources to improve the efficacy of their clean water programs.
• Issue timely penalties that are sufficiently high to deter companies from polluting our waters.
• Boost compliance and enforcement by increasing the number of on-site inspections at major facili-ties.
• Guard against any weakening of citizens’ ability to enforce pollution limits in court when state and federal authorities fail to halt illegal dumping.
In addition:
• States that repeatedly fail to enforce the Clean Water Act should face consequences for their inaction – including loss of federal funding and/or primary enforcement authority.
• Companies should reduce their use of toxic chemi-cals and adopt other innovations to minimize the generation of pollution in the first place.

Introduction 7
In 1969, Cleveland’s Cuyahoga River caught fire – an event that helped catalyze the passage of the Clean Water Act three years later.
But it wasn’t the first time the Cuyahoga had burned. The 1969 incident – one that charred two bridges and left $340,000 in damages – barely made the local papers.7 The local fire chief de-scribed it as a “run of the mill fire,” under control within 30 minutes.8 No known photos of those flames exist.9
But when Time magazine covered the 1969 inci-dent, it accompanied the story with a photo of a much bigger fire on the Cuyahoga from 1952.10 This image of a fire-fighting tugboat engulfed in billow-ing smoke while hoses onshore sprayed the burn-ing slick branded America’s consciousness.
What changed between 1952 and 1969? Among other things, the American people had awakened to the problems of water pollution, and decided that they would no longer accept flaming rivers, sewage-choked streams and dead lakes as the price of unfettered industrial production. America’s
Introduction
frustration with the abuse of their waterways had bubbled over. On October 17, 1972, Congress passed the Clean Water Act into law.11
“Unfortunately, our affluent society has also been an effluent society.”
– Hubert H. Humphrey (Vice President to Lyndon B. Johnson, 1965-1969 and U.S. Senator from Minnesota for 22 years), in a speech on October 11, 1966, at Gannon College6
Fires on Cleveland’s Cuyahoga River in 1952 (depicted here) and 1969 spread awareness about pollution in American waterways.
Photo: U.S. EPA via Creative Commons

8 Troubled Waters
The Clean Water Act brought about progress in restoring and protecting America’s waterways. By 2001, more than 60 percent of lakes and 55 percent of rivers assessed met water quality standards under the Clean Water Act – not nearly the level of progress envisioned in 1972, but still a great improvement.12 There is much work left to do: the nation has yet to meet the Clean Water Act’s original goal of eliminat-ing discharges to waterways, which the program aimed to achieve by 1985.13 Furthermore, some types of pollution, like runoff from paved roads and agri-cultural fields, don’t require a Clean Water Act permit at all.14 Even among regulated facilities, polluters too often ignore the terms of their discharge permits by releasing levels of pollution that can put our water-ways and our health at risk.
Currently, several Trump administration policies threaten to worsen these water pollution problems. Massive proposed EPA budget cuts, coupled with a hands-off approach to environmental enforce-
ment and the proposed repeal of the 2015 Clean Water Rule, threaten to jeopardize the future of American waters.15 Reduced funding and attention to enforcement at the federal level also puts more of the burden on states, which often have primary responsibility for making sure that polluters adhere to environmental laws. Unfortunately, many state governments either lack the resources or the political will to crack down on polluters.
In this report, we find both compliance with and enforcement of the Clean Water Act to be lackluster .
Industrial facilities around the country are releasing excessive amounts of pollution into our waterways with little legal consequence. Without a strong Clean Water Act, we face the risk of returning to the “bad old days” of flaming rivers and unchecked pollu-tion in our waterways. To protect and restore our waterways, states and the federal government must prioritize the enforcement of our bedrock clean water protections.

The Clean Water Act Limits Pollution of Our Waterways 9
Among other things, the 1972 Clean Water Act set up a national framework for en-forceable limits on “point source” pollution
– that is, pollutants discharged from such sources as factories, sewer systems and animal feedlots. While limiting such pollution had previously been primarily a state responsibility, the Clean Water Act recognized that the effects of water pollution often transcend state borders and that a strong federal role would be crucial to ensuring clean water for all Americans. By requiring facilities to publicly apply for permission to dump pollution into waterways and establishing systems for monitoring discharges and enforcing the law, the Clean Water Act created a framework that enabled a dramatic reduction of industrial pollution to the nation’s waterways.
Direct Pollution of Waterways Is Illegal Without a PermitThe National Pollutant Discharge Elimination System (NPDES) permit program, authorized by the Clean Water Act, regulates “point sources” – specific locations like discharge pipes, as opposed to “non-point sources” like runoff that occur over a broad area – that release pollutants into waters of the United States.16 The Clean Water Act prohib-its any facility from discharging pollutants from a
The Clean Water Act Limits Pollution of Our Waterways
point source into a waterway unless it has a NPDES permit.17 If granted, a permit contains limits on what the facility can discharge, as well as requirements for how the facility must monitor and report its releases.18
The NPDES permitting program is mainly geared toward the regulation of “direct” dischargers. Direct sources discharge wastewater directly into water-ways, whereas indirect sources send wastewater to a sewage treatment plant, which then discharges into a waterway. NPDES permits are issued only to direct point source dischargers and must be renewed every five years.19
Many direct dischargers are industrial and com-mercial facilities, such as factories, oil refineries and large-scale animal farms.20 The other main group of direct dischargers is water treatment plants. These public sources receive primarily domestic sewage from residential and commercial customers. Larger sewage treatment plants may also treat wastewater from industrial facilities connected to the sewage system. According to the U.S. EPA NPDES Permit Writ-ers’ Manual, “the types of raw materials, production processes, treatment technologies used and pollut-ants discharged at industrial facilities vary widely” depending on the facility and its industry sector.21

10 Troubled Waters
Both State and Federal Authorities Must Enforce the Clean Water Act
Under the Clean Water Act, the EPA is authorized to implement and enforce the NPDES program.22 However, states can
be authorized to implement all or part of the NP-DES program by establishing the legal framework and necessary institutions to do so.23
A state’s authorization to enforce the Clean Water Act is conditional and can be revoked by the EPA. Furthermore, if the state cannot address a viola-tion of the law in “a timely and appropriate” man-
ner or if it is a major event of national concern, the EPA can pursue these pollution cases in a process called overfiling.25
The public may also petition to withdraw the state’s enforcement authority if its program fails to meet the requirements of the Clean Water Act.26 The first withdrawal petition was filed against Kansas in 1989 and 48 others have been filed since, though none have succeeded in re-voking state authority.27
Federal vs. State Roles in NPDES Permit Process24
IN NON-AUTHORIZED STATES:
• EPA issues permits
• EPA conducts compliance monitoring
• EPA enforces permits
• State reviews permits
IN AUTHORIZED STATES:
• EPA ensures state program meets federal requirements
• EPA offers NPDES program training
• State issues permits
• State conducts compliance monitoring
• State enforces permits
• EPA oversees and, if necessary, assumes permit enforcement if state fails to act

Both State and Federal Authorities Must Enforce the Clean Water Act 11
Today, 46 states and the U.S. Virgin Islands are au-thorized to run their NPDES programs.28 In states without an authorized NPDES program, the EPA administers the NPDES program through EPA re-gional offices, with help from the respective state environmental agencies. Currently, there are four states that don’t oversee any part of the NPDES program: Idaho, Massachusetts, New Hampshire and New Mexico, as well as the jurisdiction of Washington, D.C.29
Clean Water Permits Are Intended to Restore Waterways to HealthThe Clean Water Act envisioned that water pol-lution permits would be part of an overarching strategy for protecting and restoring American waterways. Water pollution permits are supposed to ensure that waterways become and stay clean enough to support their designated use – whether as a source of drinking water or as a setting for swimming and fishing – and that polluters are using the best technology to reduce their environ-mental impact. Minimally, facilities that discharge into waterways are required to meet technol-ogy-based effluent limitations, which require a minimum level of treatment based on available treatment technologies.30 For industrial facilities, technology-based effluent limits are set by EPA guidelines and standards.31 As national standards for some pollutants have not yet been estab-lished, these discharge limits are set on a case-by-case basis or under the permitting agency’s “best professional judgment.”32
All pollution limits should be driven by the need to protect water quality. Every state is required by the Clean Water Act to maintain a list of “impaired waters” – waterways that fail to meet water quality standards, even after point sources install pollution control technology.33 The law requires that the authority running the program prioritize these waterways and develop a “pollu-tion diet” to bring impaired waters back to the
point where they can support their “designated uses” (e.g., drinking water, wildlife, recreation).34 To develop the constraints of the “pollution diet,” reg-ulators calculate a maximum daily amount for each pollutant to protect the waterway – this is called the total maximum daily load (TMDL).35 Once the TMDL is calculated, pollution reductions are al-located among various sources to get the pollution levels down below that level. This will often require reducing enforceable discharge limits in NPDES permits for point sources and halting the issuance of any new NPDES permits that would allow any additional discharge of the pollutants causing the impairment of these waters.
In many cases, states and the EPA set pollution levels for both polluters and waterways that are too lax and do not meet the Clean Water Act’s require-ments for protecting and restoring waterways. Many polluted waterways do not yet have a TMDL to drive pollution reductions in NPDES permits. Moreover, existing TMDLs are often weak. Accord-ing to a 2013 survey of 25 TMDLs by the Govern-ment Accountability Office, most did not contain “all features key to attaining water quality standards.”36 Nearly half lacked a basic outline to solve water quality woes, such as naming actions and assigning necessary actions. Fifteen of these 25 TMDLs also did not require future revisions of pollutant limits.37 Given that some NPDES permits are calculated from TMDLs, the insufficiency of TMDLs suggests that discharge permits under the Clean Water Act are too lax to protect the health of our waterways to begin with, even before noncompliance is factored in.
In short, weak permitting allows many polluters to release unhealthy levels of pollution into waterways, while remaining in technical compliance with the law. For all polluters, complying with the NPDES program – reporting discharges to waterways in an accurate and timely way and limiting discharges to only those levels included in their permits – is the bare minimum expected. Despite these lax require-ments, many facilities are noncompliant.
12 Troubled Waters
Compliance with the Clean Water Act Is Reported in Publicly Available Databases
States and the EPA use a variety of methods – from automated reporting to in-person inspec-tions – to enforce Clean Water Act requirements
and report the results of these efforts to the public. However, the requirements for reporting differ by the size of the facility and type of violation.
States and EPA regions are required to report viola-tions by “major” dischargers, such as those that are permitted to release more than a million gallons per day, to the EPA.38 In 2015, the EPA adopted a new reporting rule that requires all states to electroni-cally file discharge monitoring reports (DMRs) – the reports of discharge levels submitted by regulated polluters – and report enforcement actions to the EPA’s Enforcement and Compliance History Online (ECHO) database.39 These facilities and the envi-ronmental agencies in their states were required to have started submitting DMRs online, along with data on inspections and enforcement actions for major facilities, by December 2016.40 All NPDES reports, not just DMRs, are scheduled to be filed electronically by 2020.41
Once filed with the EPA, discharge monitoring reports are compared with permit conditions, generating automated reports of violations that are stored in the EPA’s Integrated Compliance Informa-tion System (ICIS) database. There are three types
of NPDES violations automatically generated in the ICIS database:
• DMR non-receipt violations are generated when facilities have missing, late or incomplete DMRs.42
• Compliance schedule violations are generated when facilities fail to achieve or report actions that are required in their NPDES permits.43
• Effluent violations are generated when releases reported in DMRs are greater than the permit’s limit.44 The exceedance percentages are automat-ically calculated via ICIS where possible.45
In addition to violations that are reported through the automated system, ICIS also includes many single event violations, which are entered into the system manually. These include violations discovered during on-site inspections or those that arise from citizen complaints.46 States are required to enter single event violations by major facilities into national databases, but an EPA review of state reporting found inconsistent compliance by state.47 As a result, single event violations are not included in our report, which only looks at effluent violations.
When polluters violate their permits, they may face enforcement from the EPA or authorized state agen-cies. Federal and state response typically begins

Compliance with the Clean Water Act Is Reported in Publicly Available Databases 13
with informal actions, escalating when polluters don’t respond to initial warnings.48 While informal actions under the Clean Water Act are not explic-itly defined, they are administrative in nature and include inspections, warning letters and notices of violation that give facilities an opportunity to correct a problem before stronger enforcement ac-tion takes place. If facilities continue to violate their permits, the EPA or the authorized state agency has the option to take more serious enforcement action, including issuing administrative compliance orders – requirements for facilities to correct their viola-tions, upgrade infrastructure, and sometimes pay an agency-assessed fine – and filing formal lawsuits seeking corrective actions and court-assessed civil or criminal penalties.49
Publicly Accessible Reporting Is an Essential Tool for EnforcementPublicly accessible reporting of Clean Water Act vio-lations is essential both for preserving the public’s right to know about environmental conditions in their communities and as a tool for citizen enforce-ment of the law when state or federal officials fail to act. According to the EPA website, “if any member of the general public finds that a facility is violating its NPDES permit, that member can independently start a legal action,” as long as a previous enforce-ment action hasn’t addressed the problem.50
The Clean Water Act’s citizen suit provision has been used many times to enforce the law. As a recent example, in November 2017, the nonprofit advocacy groups Environment Florida and Sierra Club, rep-resented by the nonprofit National Environmental Law Center, settled a $1.4 million suit against chicken producer Pilgrim’s Pride for dumping pollutants in excess of its permit limits into Florida’s Suwannee River.51 In Indiana, Surfrider Foundation, an environ-mental watchdog group, recently filed a case against U.S. Steel for repeated dumping of toxic chromium into Lake Michigan.52 For the Clean Water Act’s citizen suit provision to remain effective, as with these recent
examples, the public needs easy access to accurate information about pollution and enforcement.
Not All States Fully or Accurately Report Enforcement Data to the EPAClean Water Act enforcement depends on full participation and accurate reporting by the states. However, several of the 46 authorized states lag in reporting full and accurate data to the EPA.
New Jersey, for example, has failed to report data to the online ICIS database since 2012 and is currently working with the EPA to upload missing records by early 2018.53 According to the EPA website, Arizona, Kansas, Missouri, New Jersey, North Carolina, Ver-mont, Virginia, Washington and Wyoming have known data reporting issues regarding their NPDES programs as well.54 For some NPDES programs, facil-ities themselves are responsible for reporting their DMRs directly to the EPA – with little state oversight in catching and correcting mistakes or omissions.55
The analysis in this report further shows how fre-quently the records in the ICIS database are incom-plete. New Jersey was entirely excluded from this report because their records from our monitoring periods of interest were still missing from the EPA’s database at the time of this analysis. For the other 49 states, researchers contacted state environmen-tal agencies to verify the records pulled from the ICIS database related to effluent violations, identify-ing a number of discrepancies between the federal and state records. Overall, representatives from 42 states replied to this request: seven declined to review the ICIS records, eight initially agreed to review the ICIS records but never replied with com-plete results, and 27 either reviewed their state’s ICIS records themselves or provided their own data to compare with ICIS records. In more than half of these 27 cases (15 total), the state review identified records that were either inaccurately labeled in ICIS, or exceedances that were missing from the federal database entirely.

14 Troubled Waters
The Clean Water Act established a system to restore and maintain healthy waterways by requiring specific limits on the amount of pollu-tion that can be released into our rivers, streams and lakes. The EPA and the states are respon-sible for enforcing those limits and providing information to the public related to compliance with the law.
“Violation” vs. “Exceedance”: What’s the Difference?
For some NPDES permits, limits are set based on weekly, monthly or even annual pollutant discharges. However, when a facility files a discharge monitoring report (DMR), it might list a
point-in-time measurement of pollutants in that sample, rather than a running average within the permit’s time frame. After DMRs are submitted, the ICIS system automatically compares reported releases to the facility’s permit limits, and flags any discharge in excess of a permit limit as a violation, without accounting for the permit’s time frame restrictions. As a result, DMRs may sometimes register as permit violations even when they were simply a temporary exceedance of permit levels, because the facility’s releases were not high enough throughout the entire monitoring period to violate its permit.56
To acknowledge this scenario and avoid mislabeling any records as violations, instances reported as effluent violations in the EPA database are described in this report as “exceedances.” In any event, discharges that severely or repeatedly exceed permit limits threaten both our waterways and the integrity of Clean Water Act enforcement.
Historically, however, many polluters have com-mitted repeated, egregious violations of these pollution limits, sometimes with no penalty for years after the illegal discharge. A review of the EPA’s Clean Water Act enforcement data shows that many polluters continue to regularly violate the terms of their permits, to the detriment of our waterways and our health.

Industrial Facilities Exceeded Pollution Limits 8,100 Times from January 2016 through September 2017 15
Industrial Facilities Exceeded Pollution Limits 8,100 Times from January 2016 through September 2017
According to EPA compliance data, roughly 40 percent of the nation’s 2,772 major industrial facilities with Clean Water Act discharge
permits released pollution in excess of their NPDES permits from January 1, 2016 to September 30, 2017 – committing more than 8,100 exceedances in total. About one in three of these exceedances polluted waterways that were already designated by state agencies as “impaired” for uses such as wildlife pro-tection, recreation or drinking water.57
Discharge Exceedances by StateTexas’ industrial facilities ranked first for total num-ber of permit exceedances (938) for the monitoring periods between January 2016 and September 2017. Pennsylvania, with 633 exceedances, had the second-most. (See Table 1.) Unsurprisingly, states with fewer industrial facilities also had fewer permit exceedanc-es; South Dakota, with six major industrial facilities, and Vermont, with two, each had just two exceed-ances during the study period.
Exceedances per Major Industrial FacilityNationally, the average major facility committed just under three exceedances of its clean water permit during this 21-month period. This varied widely
facility to facility and state to state. The five worst facilities each had more than 100 exceedances over less than two years. In the five states with the fewest exceedances per facility – South Dakota, Vermont, Wisconsin, Florida and Kansas – there was an average of 0.7 exceedances per facility, while in the five worst states – West Virginia, Iowa, Missouri, Colorado and Ohio – the typical facility had more than 6.5 exceedances over the study period.62
Table 1. The 10 States with the Most Exceedances Reported by Major Industrial Facilities
Rank State Total Exceedances
1 Texas 938
2 Pennsylvania 633
3 Arkansas 567
4 Louisiana 535
5 Ohio 491
6 New York 473
7 West Virginia 407
8 California 360
9 Missouri 348
10 Florida 270
16 Troubled Waters
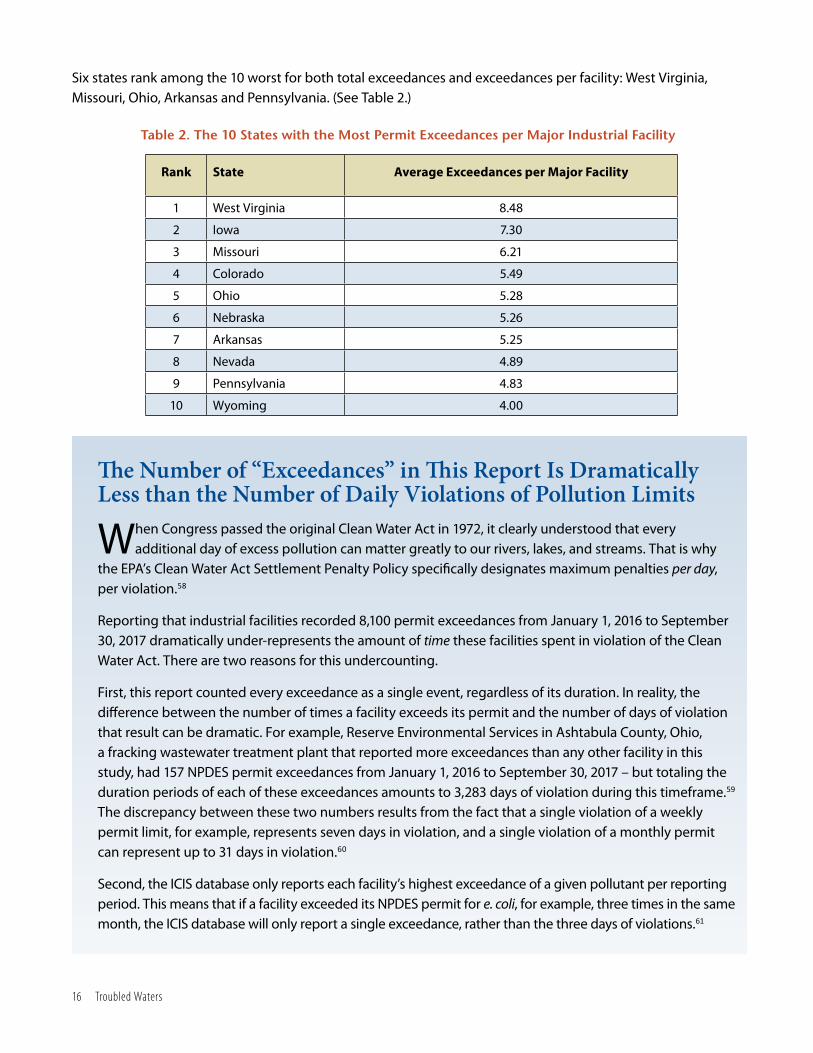
Six states rank among the 10 worst for both total exceedances and exceedances per facility: West Virginia, Missouri, Ohio, Arkansas and Pennsylvania. (See Table 2.)
The Number of “Exceedances” in This Report Is Dramatically Less than the Number of Daily Violations of Pollution Limits
When Congress passed the original Clean Water Act in 1972, it clearly understood that every additional day of excess pollution can matter greatly to our rivers, lakes, and streams. That is why
the EPA’s Clean Water Act Settlement Penalty Policy specifically designates maximum penalties per day, per violation.58
Reporting that industrial facilities recorded 8,100 permit exceedances from January 1, 2016 to September 30, 2017 dramatically under-represents the amount of time these facilities spent in violation of the Clean Water Act. There are two reasons for this undercounting.
First, this report counted every exceedance as a single event, regardless of its duration. In reality, the difference between the number of times a facility exceeds its permit and the number of days of violation that result can be dramatic. For example, Reserve Environmental Services in Ashtabula County, Ohio, a fracking wastewater treatment plant that reported more exceedances than any other facility in this study, had 157 NPDES permit exceedances from January 1, 2016 to September 30, 2017 – but totaling the duration periods of each of these exceedances amounts to 3,283 days of violation during this timeframe.59 The discrepancy between these two numbers results from the fact that a single violation of a weekly permit limit, for example, represents seven days in violation, and a single violation of a monthly permit can represent up to 31 days in violation.60
Second, the ICIS database only reports each facility’s highest exceedance of a given pollutant per reporting period. This means that if a facility exceeded its NPDES permit for e. coli, for example, three times in the same month, the ICIS database will only report a single exceedance, rather than the three days of violations.61
Rank State Average Exceedances per Major Facility
1 West Virginia 8.48
2 Iowa 7.30
3 Missouri 6.21
4 Colorado 5.49
5 Ohio 5.28
6 Nebraska 5.26
7 Arkansas 5.25
8 Nevada 4.89
9 Pennsylvania 4.83
10 Wyoming 4.00
Table 2. The 10 States with the Most Permit Exceedances per Major Industrial Facility

Industrial Facilities Exceeded Pollution Limits 8,100 Times from January 2016 through September 2017 17
Exceedances in Impaired WatersOf the 8,148 exceedances reported by major industrial facilities, 2,663 represented excessive discharges into waterways that have already been designated “impaired” by states or the EPA. (See Table 3.) This designation indicates that a body of water is too polluted to support its state-designated usage, which could include pro-viding drinking water, serving as a wildlife habitat, or being used for activities like fishing and swimming.63
Percentage of Major Industrial Facilities with ExceedancesRoughly 40 percent of all major industrial facilities in the U.S. (again excluding New Jersey) recorded one or more exceedances of effluent discharge limits during 2016 and the first three quarters of 2017. In 11 states, more than half of all major facilities exceeded permit limits during this timeframe. (See Table 4.)
Rank State Total Exceedances in Impaired Waters
1 Arkansas 423
2 West Virginia 348
3 Texas 304
4 California 301
5 Pennsylvania 182
6 Florida 103
7 Alabama 100
8 Louisiana 92
9 Connecticut 84
10 Massachusetts 69
Table 3. The 10 States with the Most Exceedances into Impaired Waters
Rank State Percent of Facilities with Exceedances
Number of Major Industrial Facilities
1 Iowa 77.8% 27
2 North Dakota 75.0% 8
3 West Virginia 70.8% 48
4 Pennsylvania 59.5% 131
5 Oklahoma 59.5% 37
6 Washington 56.3% 32
7 Delaware 54.5% 11
8 Massachusetts 53.5% 43
9 New York 52.9% 119
10 Illinois 52.3% 65
Table 4. The 10 States with the Worst Facility Exceedance Rates

18 Troubled Waters
Of these facilities that reported multiple exceedances, some surpassed their permit limits an average of at least once per quarter during the 21-month period. This was most common in West Virginia, where almost one-third of the state’s 48 major industrial facilities recorded at least seven exceedances during the study period. (See Table 6.)
Major Industrial Facilities with Repeated ExceedancesThree-quarters of major industrial facilities that exceeded their discharge permit limits from January 2016 through September 2017 did so more than once. In North Dakota and West Virginia, nearly two-thirds of all major facilities in the state reported more than one effluent exceedance during this 21-month span. (See Table 5.)
Table 6. States with the Most Facilities Averaging At Least One Exceedance per Quarter
Rank State Facilities with at Least Seven Exceedances
Percent of Major Facilities with at Least Seven Exceedances
1 Texas 39 14.5%
2 Pennsylvania 27 20.6%
3 Louisiana 23 9.4%
4 New York 19 16.0%
5 West Virginia 15 31.3%
6 Missouri 15 26.8%
7 Ohio 15 16.1%
8 California 14 14.4%
9 Indiana 12 18.2%
10 Florida 11 3.4%
Rank State Facilities with Multiple Exceedances
Percent of Major Facilities with Multiple Exceedances
1 Texas 96 35.7%
2 Louisiana 63 25.7%
3 Pennsylvania 58 44.3%
4 New York 48 40.3%
5 Ohio 36 38.7%
6 Florida 35 10.8%
7 West Virginia 30 62.5%
8 Indiana 29 43.9%
9 Alabama 26 37.7%
10 Illinois 26 40.0%
Table 5. The 10 States with the Most Facilities with Multiple Exceedances

Industrial Facilities Exceeded Pollution Limits 8,100 Times from January 2016 through September 2017 19
Rank State Percent of Facilities with Exceedances Greater than 500% of Permit Limit
Number of Facilities with Exceedances Greater than 500% of Permit Limit
1 West Virginia 31.3% 15
2 Wyoming 28.6% 2
3 Iowa 22.2% 6
4 Missouri 17.9% 10
5 Nebraska 17.4% 4
6 Rhode Island 16.7% 1
7 Oklahoma 16.2% 6
8 California 15.5% 15
9 Texas 14.9% 40
10 New Mexico 14.3% 2
Table 8. States with the Highest Percentage of Facilities Exceeding 500 Percent of Their Permit Limit
Rank State Percent of Facilities with Exceedances Greater than 100% of Permit Limit
Number of Facilities with Exceedances Greater than 100% of Permit Limit
1 West Virginia 54.2% 26
2 Hawaii 38.9% 7
3 Iowa 37.0% 10
4 Missouri 35.7% 20
5 New Mexico 35.7% 5
6 Indiana 31.8% 21
7 New York 31.1% 37
8 California 29.9% 29
9 Oklahoma 29.7% 11
10 Illinois 29.2% 19
Table 7. States with the Highest Percentage of Facilities Exceeding 100 Percent of Their Permit Limit
Severity of ExceedancesNot only do many major industrial facilities exceed their permit limits – sometimes frequently – but some of those exceedances are also particularly severe, with facilities releasing many times the amount of pollution per-mitted under the Clean Water Act. Overall, about one in five major industrial facilities exceeded their permit limit by more than 100 percent at least once during the study period. (See Table 7.)
These severe exceedances are particularly concerning when they happen repeatedly, in impaired waters, or at extreme levels. Roughly one-third of all facilities with severe, repeated exceedances of their clean water permit limits discharged into impaired waters. Additionally, 249 facilities around the country released pollutants at levels five times greater than their permit allowed at least once during the study period. (See Table 8.)

20 Troubled Waters
In order to ensure that polluters comply with the discharge limits of their Clean Water Act permits, penalties must be swift, certain and
severe enough that it does not pay to pollute.
Unfortunately, weak and delayed enforcement of the Clean Water Act is common across the country, as documented both in the EPA’s enforcement data and in multiple studies over the course of recent decades.
According to EPA records, the majority of viola-tors go unpunished. Each year from 2011 to 2017, an average of 27,849 facilities were non-compliant across the U.S., while an average of 13,076 – less than half – faced any EPA or state enforcement ac-tion.64 Of those that did face enforcement, roughly one-quarter were issued informal EPA actions. Infor-mal actions are administrative in nature and include inspections, warning letters and notices of violation that give facilities an opportunity to correct the problem before stronger enforcement action takes place. Formal enforcement actions include admin-istrative compliance orders that require facilities to correct their violations, pay for infrastructure upgrades, and pay additional fines levied by the agency or imposed by the courts.
Many facilities’ records are never reviewed to even identify violations in the first place, further contrib-uting to the inconsistent enforcement of the Clean Water Act. An EPA study of permit non-compliance among non-major facilities found that less than 15
Clean Water Act Enforcement Is Often Weak
Despite high levels of nitrate pollution in the Des Moines River, Iowa’s governor opposed federal inspections of nearby polluting facilities in 2013.
Photo: Matt Reed via Flickr, CC BY-NC-ND 2.0

Clean Water Act Enforcement Is Often Weak 21
percent of states reviewed all their non-major facili-ties in 2015.65 Two states – Louisiana and Tennes-see – reviewed records from less than half of their non-major facilities.66
America’s Poor Track Record of Clean Water Compliance and EnforcementAmerica’s track record of enforcing clean water laws falls short of what is needed to protect and enhance the quality of our waters. In 2007, the EPA Inspector General published a report on the state of Clean Water Act enforcement.67 In reviewing 56 ma-jor facilities that were in long-term and significant noncompliance with their permits between July 2002 and June 2005, the report found that the EPA and states had failed to take suitable enforcement actions at 21 of these facilities, including eight that faced no enforcement whatsoever.68 In a review of the remaining 35 facilities, none of the enforcement actions that the Inspector General’s office assessed had been taken in a timely manner, allowing facili-ties to continue violating their permits for extended periods of time.69
A 2012 EPA investigation in Iowa found the state’s environmental agency failed to issue discharge per-mits to some Iowa factory farms that were required to have one under the Clean Water Act.
And despite record nitrate levels in the Des Moines River, Iowa’s governor signed a letter in 2013 urg-ing the EPA to back off its oversight, opposing any further EPA inspection of its thousands of factory farms or federal involvement in fixing the state’s clean water program.71
Similar stories can be found across the country. For example:
• Washington: In 2012, Oregon Public Broadcast-ing highlighted a Seattle-area metal plant that had violated its pollution limits multiple times
over the previous four years. Despite the numerous violations, this facility, the Seattle Iron and Metals Corp., never faced any enforce-ment actions. Instead, Washington’s statewide environmental protection agency tried to encourage Clean Water Act compliance by increasing the facility’s pollution limits, rather than working with them to better protect water quality.72
• Kentucky: In Kentucky, a coal mine that had been violating its permit did eventually face a fine – but not until five years after a nearby resident first flagged the issue to the state’s Department of Environmental Protection.73
• Tennessee: An EPA audit of the Tennessee Department of Environment and Conserva-tion in 2016 found that statewide water pollu-tion enforcement plummeted dramatically with the appointment of a new department Commissioner in 2011. While the state had been taking an average of 183 enforcement actions per year prior to 2011, only 19 enforce-ment orders were issued in 2015. This lack of action included one facility that had received five warnings over a seven-month period without ever facing a formal penalty.74
Clean Water Enforcement Is Declining under the Trump AdministrationAmerica’s already poor track record of clean water enforcement appears to have further declined under the Trump administration. Through the first three quarters of the year, 2017 was on track to be the weakest year for formal enforcement for all major facilities (both industrial and public water treatment plants) since at least 2012. From January 1 through September 30, penalties assessed for all

22 Troubled Waters
violations in current or previous years totaled just $24 million. (See Figure 1.) If that trend continued for the remainder of 2017, it would represent the
$0
$20
$40
$60
$80
$100
$120
2012* 2013 2014 2015 2016 2017(through
9/30)
Pena
lties
(mill
ions
of d
olla
rs)
Federal Penalties State Penalties
Figure 1. Total Penalties Assessed for All Clean Water Act Violations75
* A $3.3 billion federal settlement in 2012 against British Petroleum (BP) for the 2010 Deepwater Horizon spill was excluded as an outlier case.
Figure 2. Median Penalty Assessed for All Clean Water Violations77
$-
$5,000
$10,000
$15,000
$20,000
$25,000
$30,000
$35,000
$40,000
$45,000
$50,000
2011 2012 2013 2014 2015 2016 2017
Med
ian
pent
aly
EPA penalties State penalties
lowest total amount of penalties assessed and the lowest average penalty amount in at least the past five years.

Clean Water Act Enforcement Is Often Weak 23
In addition to the decline in total fines collected, the median penalties assessed by the EPA in 2017 were lower than they had been any year since 2011. As of December 2017, the median EPA-issued penalty for the first year of the Trump administration was $20,250. In comparison, the median penalty in 2014 was $45,500.76
Challenges to enforcement can also be seen in the EPA’s recent track record of civil enforce-ment against polluters. According to a recent analysis by the Environmental Integrity Project, the Trump administration has filed fewer cases for environmental violations (including, but
Table 9. Environmental Cases Lodged by Administration (in first 266 days)81
not limited to, Clean Water Act violations) than have previous administrations.78 In addition, the Trump administration’s EPA collected 60 percent less in total civil penalties compared to previous administrations within their first six months.79
The New York Times recently found that within the first 266 days, the Trump administration, with Scott Pruitt as head of the EPA, lodged a thousand fewer environmental cases and obtained just over one-eighth the amount in repairs and penalties as the Obama administra-tion had over the same period of time.80
Administration Number of Cases82 Total Size of Cases
Bush 2,600 $2.6 billion
Obama 2,900 $10.1 billion
Trump 1,900 $1.3 billion

24 Troubled Waters
The poor track record of clean water enforce-ment by state and federal agencies suggests that America should be investing more resourc-
es in enforcing and tightening standards for polluting facilities. The Trump administration, however, threatens to move in the opposite direction – slashing resources for environmental enforcement and leaving the states, many of which have already underfunded or neglected their enforcement activities, to fend for themselves. Without adequate funding for enforcement at both the state and federal level, it will be harder for regulators to pursue strong cases against polluters that result in effec-tive enforcement action.
The current administration plans to cut the EPA’s budget for civil enforcement of environmental protection pro-
The Trump Administration Is Proposing to Further Erode Clean Water Protections
grams, including the Clean Water Act, by $30.4 million.83 Additionally, funding for Section 106 grants, the program that allows the EPA to assist states in preventing and con-trolling water pollution, is slated to be cut by more than $75 million, a decrease of almost 33 percent.84 Over the past five years, these grants have provided more than $1 billion in funding to authorized states to improve their NPDES permitting process, develop better water quality standards, monitor and assess water quality, check facili-ties for violations, and enforce the law against violators.85 The Section 106 grant program’s 2019 budget is slated to be lower than it has been for at least the previous seven years (Figure 3).86
These cuts would also occur against a backdrop of declining inspections by federal and state officials
Figure 3. Funding for State Water Pollution Grants in 2012-2018 and Trump Administration Proposal for 201987
$0
$50
$100
$150
$200
$250
Tota
l allo
tted
Sec.
106
fund
s (m
illio
ns o
f dol
lars
)

The Trump Administration Is Proposing to Further Erode Clean Water Protections 25
2,127
1,849 1,9071,722 1,660
1,431
0
500
1,000
1,500
2,000
2,500
2012 2013 2014 2015 2016 2017(projected)
Num
ber o
f ins
pect
ions
(Figure 4). Even though facilities conduct their own monitoring, inspections help regulatory agencies verify that facilities are following proper protocol and taking accurate samples.88 From January through September 2017, there were 1,073 inspections of ma-jor facilities (other than public wastewater treatment plants), according to ICIS records.89 Assuming this rate of inspections continued through the last quarter of 2017, the EPA and state agencies will have conducted the smallest number of inspections of industrial facilities since at least 2012. Proposed cuts to the EPA budget would limit other federal grants available to state water agencies, making it even more difficult to carry out necessary inspections and properly enforce clean water laws in the years to come.
Trump Administration Undermines the Clean Water Act ItselfIn addition to cutting environmental protection budgets and conducting fewer inspections, the current administration plans to roll back protections for wetlands and streams and loosen regulations on pollution from coal-fired power plants, which rep-
resent “the largest industrial source of toxics water pollution” according to the Environmental Integrity Project.91 By increasing the amount of toxic pollut-ants that can legally be discharged from industrial facilities, the burden of cleaning up polluted waters will likely fall on public and private treatment plants downstream. These proposed actions by the current EPA force taxpayers to pay for polluters’ misconduct, according to Betsy Southerland, former Director of the Office of Science and Technology in the EPA Of-fice of Water. (See text box.)
Specifically, the EPA under Trump administrator Scott Pruitt has rolled back key rules that protect our wa-ters, including the Clean Water Rule and the nation’s first comprehensive federal discharge limit for steam electric power plants, the Steam Electric Effluent Limitation Guidelines (ELG).93
The Clean Water Rule, issued jointly by the EPA and the Army Corps of Engineers in 2015, restored Clean Water Act protections to some of the nation’s vulner-able marshes and streams, including to streams that provide drinking water for one in three Americans.94
Figure 4. Federal and State Inspections of Industrial Facilities by Year90

26 Troubled Waters
This rule was supported by more than 1,200 scientific studies and wide public support, including more than 800,000 comments from local officials, health experts, business owners, watershed experts, and other Americans concerned with clean water.95
Since taking office, the Trump administration has been working to repeal the Clean Water Rule.96 Within a month of taking office, President Trump ordered the EPA to replace the rule with much more permissive regulations.97 As of February 28, 2018, Scott Pruitt’s EPA has delayed the effective date of the Clean Water Rule for two years, while it writes a newer, weaker rule to replace it.98
“Now the public, not the polluter, will have to pay to clean the water. And it is much cheaper to prevent
pollution than to clean it up after the fact.” 92
The ELG rule, also issued in 2015, intended to further limit the amount of water pollution from steam electric power plants.99 These power plants discharge several toxic pollutants into our rivers and lakes, including arsenic, mercury, selenium and lead, and overall, they are responsible for approximately 30 percent of all toxic releases into surface waters from industries regu-lated under the Clean Water Act.100 The ELG rule would have reduced this pollution by 1.4 billion pounds each year.101 The ELG rule initially stated that power plants needed to achieve compliance “as soon as possible beginning November 1, 2018,” but in September 2017, Pruitt issued a ruling that postponed the earliest com-pliance date to November 2020.102
– Betsy Southerland, former Director of the Office of Science and Technology in the EPA Office of Water

Policy Recommendations 27
Ideally, operators of industrial facilities would all voluntarily reduce – and ultimately eliminate – their pollutant discharges so that our rivers, lakes and
streams would all be clean and healthy. But, because history has shown otherwise, the very premise underly-ing the Clean Water Act is that stringent science-based permits, coupled with tough enforcement, are indis-pensable to securing clean water for America.
Unfortunately, thousands of industrial facilities still violate the pollution limits in their permits. From Jan-uary 2016 through the third quarter of 2017, we found industrial facilities reported exceeding their clean water permits 8,148 times, threatening the safety of our waterways for public use and wildlife.
All too often, the enforcement response has been weak to non-existent. Making matters worse, the Trump administration is moving to slash the already inadequate resources for enforcement and to un-dermine key aspects of the Clean Water Act that are essential to reducing pollution.
To discourage more industrial pollution, we must reverse this trend. State and federal elected officials should:
• Ensure that the Clean Water Act applies to all our waterways, as laid out in the Clean Water Rule, so that there is nowhere that polluters can dump with impunity.
Policy Recommendations
• Strengthen permits with enforceable, numeric limits on pollution that are ratcheted down over time as technology allows or water quality demands – moving the nation closer to achieving the Clean Water Act’s original “zero discharge” goal.
• Restore – and increase – funding for state and feder-al enforcement, such as water pollution control grants, so that states have the resources to improve the efficacy of their clean water programs.
• Issue timely penalties that are sufficiently high to deter companies from polluting our waters.
• Boost compliance and enforcement by increasing the number of on-site inspections at major facilities.
• Guard against any weakening of citizens’ ability to enforce pollution limits in court when state and federal authorities fail to halt illegal dumping.
In addition:
• States that repeatedly fail to enforce the Clean Water Act should face consequences for their inaction – including loss of federal funding and/or primary enforcement authority.
• Companies should reduce their use of toxic chemi-cals and use other innovations to minimize the generation of pollution to be discharged in the first place.

28 Troubled Waters
This report evaluates data from monitoring periods from January 1, 2016, through Sep-tember 30, 2017. The bulk of the data for this
analysis comes from the EPA’s Integrated Compliance Information System (ICIS), downloaded on October 25, 2017, and cross-checked with state agency records when possible.
Compliance AnalysisThe ICIS dataset identifies instances in which facilities released more pollution than their NPDES permit limits (effluent violations). Effluent violations are identified through an automated comparison of releases report-ed via discharge monitoring reports (DMRs) submit-ted by facilities with permit limits stored in the EPA’s records (coded as E90 under VIOLATION_CODES field). Each record of a facility releasing more pollution than its permit allows was recorded as a single exceedance, regardless of the number of days of violation.
The exceedance percentage for E90 violations is recorded under the EXCEEDENCE_PCT field. Any EXCEEDENCE_PCT that is listed as 99999, 2147483650 or 214748350 was interpreted as “exceedance per-centage unknown.” These records were counted as exceedances but excluded from the counts of facilities with exceedances greater than 100 percent or 500 percent of their permit limits. The corrected data provided by the Iowa state officials included the reported discharge and permit limit, but not the
Methodology
percent exceedance. Instead, the percent exceedance was calculated by subtracting the reported permit limit from the reported discharge and dividing by the reported permit limit.
The ICIS dataset is available by region and as a na-tional aggregate and periodically updated at the end of each monitoring period on a monthly basis. We downloaded each ICIS file by state and filtered each file to remove all records other than those that were inside the monitoring periods of interest (January 1, 2016 – September 30, 2017), coded as effluent (E90) violations, from major facilities, and not from publicly owned treatment works (POTWs). The EPA’s online DMR loading tool describes all non-POTW facilities as “industrial point sources.” We categorized the facili-ties in this report in the same way.
For the exceedance tables, the denominator in per-centage calculations was the total number of non-POTW major facilities in the state. This number was calculated from ICIS-NPDES data on major discharge permits and confirmed with state agencies, when possible.
The EPA’s ECHO/ICIS website reports that New Jersey data is “frozen” and missing effluent records from our monitoring periods of interest. Missouri, North Carolina and Washington state are also listed as work-ing with the EPA to complete their data reporting. In Ohio, permit limits may be set to an annual average
Methodology 29
rather than a monthly or daily exceedance. Because effluent violations are automatically generated based on submitted DMRs and some discharges are sampled daily, some facilities may be flagged by ICIS for single violations on their DMRs even if they meet their permit limit’s annual or monthly average.
We contacted each state agency – except in jurisdic-tions where the EPA administers the NPDES program – and offered them an opportunity to review their violations data for accuracy. The following states did not review any of the water quality data, failing to respond to repeated requests: Alaska, Arkansas, Delaware, Maryland, Michigan, Mississippi, New York, Oregon and Utah.
Missouri, Pennsylvania and Nebraska referred to their own e-reporting website as a more accurate source of violation records than federal records. The rest of the states either informed us that the EPA numbers were accurate, sent notes on which specific records to correct, or sent an entirely new file to use instead.
Enforcement and Inspection AnalysisFor the enforcement actions analysis, we relied on both the ICIS-NPDES record of formal enforcement actions filtered by settlement date for each calendar year, and enforcement actions matched to just the 2016 effluent violations derived as described above for all U.S. states and territories. We omitted viola-tions from 2017 in this part of the analysis based on a reasonable lag in the settlement of enforcement actions. We also acknowledge that some states might not be fully compliant with 40 CFR 127, an e-reporting rule that requires states to file enforce-ment actions with the EPA on an ongoing basis.
For the inspection analysis, we analyzed the ICIS_NPDES file of inspections, filtered to reflect the last monitoring period of interest in this report (30 September 2017), that were filed on or after January 1, 2012. Data from 49 states (all but New Jersey) and D.C. were used in this part of the analysis.

30 Troubled Waters
Appendix
Table A-1. Major Industrial Facilities by State and Exceedance Characteristics
State Major industrial facilities
Facilities with
exceedances
Facilities with
exceedances in impaired
waters
Facilities with
multiple exceedances
Facilities with
multiple exceedances in impaired
waters
Facilities with >6
exceedances
Facilities with
exceedances >100%
permit limit
Facilities with
exceedances >500%
permit limit
Alabama 69 26 12 26 12 10 13 4
Alaska 54 11 0 11 0 2 5 1
Arizona 28 7 1 4 1 2 4 2
Arkansas 108 25 8 18 6 10 14 7
California 97 36 23 25 15 14 29 15
Colorado 39 17 6 11 3 7 10 5
Connecticut 35 13 9 12 8 5 6 2
Delaware 11 6 2 4 2 2 3 1
District of Columbia
2 2 2 2 2 1 2 2
Florida 325 49 18 35 11 11 18 9
Georgia 40 16 1 13 1 5 11 3
Hawaii 18 8 0 7 0 4 7 2
Idaho 28 6 1 3 1 1 1 0
Illinois 65 34 2 26 2 7 19 6
Indiana 66 33 5 29 5 12 21 9
Iowa 27 21 0 15 0 8 10 6
Kansas 16 6 0 5 0 0 4 1
Kentucky 49 18 12 11 6 3 8 5
Louisiana 245 90 16 63 11 23 46 14
Maine 13 6 0 4 0 1 2 0
Maryland 40 15 10 8 4 4 9 4
Massachusetts 43 23 18 18 13 5 6 1
Michigan 77 32 0 20 0 9 12 4
Minnesota 28 13 2 10 1 0 7 2
Mississippi 29 13 2 6 1 1 2 1
Continued on page 31

Appendices 31
Missouri 56 27 1 24 1 15 20 10
Montana 16 4 3 3 2 1 2 2
Nebraska 23 10 0 9 0 4 6 4
Nevada 9 1 0 1 0 1 1 0
New Hampshire
18 7 2 4 1 3 3 1
New Mexico 14 5 3 4 2 2 5 2
New York 119 63 13 48 8 19 37 16
North Carolina 71 20 6 16 5 3 13 7
North Dakota 8 6 3 5 3 1 2 1
Ohio 93 46 10 36 6 15 26 8
Oklahoma 37 22 8 15 7 8 11 6
Oregon 20 7 0 3 0 2 2 0
Pennsylvania 131 78 24 58 19 27 36 12
Rhode Island 6 1 1 1 1 1 1 1
South Carolina 67 31 2 21 1 3 11 2
South Dakota 6 1 0 1 0 0 0 0
Tennessee 46 16 8 11 6 4 6 3
Texas 269 132 45 96 39 39 72 40
Utah 15 6 2 5 2 1 3 2
Vermont 5 1 0 1 0 0 0 0
Virginia 61 25 0 22 0 2 8 3
Washington 32 18 1 14 0 3 8 3
West Virginia 48 34 32 30 28 15 26 15
Wisconsin 43 15 8 7 2 0 5 3
Wyoming 7 3 1 3 1 2 2 2
State Major industrial facilities
Facilities with
exceedances
Facilities with
exceedances in impaired
waters
Facilities with
multiple exceedances
Facilities with
multiple exceedances in impaired
waters
Facilities with >6
exceedances
Facilities with
exceedances >100%
permit limit
Facilities with
exceedances >500%
permit limit
Continued from page 30

32 Troubled Waters
Table A-2. Exceedances by State and Exceedance Characteristics
State Total exceedances Exceedances in impaired waters
Exceedances >100% of permit limit
Exceedances >500% of permit limit
Alabama 242 100 62 8
Alaska 76 0 32 4
Arizona 42 23 22 6
Arkansas 567 423 275 75
California 360 301 181 57
Colorado 214 38 117 75
Connecticut 108 84 35 14
Delaware 34 11 15 4
District of Columbia 22 22 12 7
Florida 270 103 69 16
Georgia 85 6 32 6
Hawaii 49 0 16 4
Idaho 33 24 6 0
Illinois 149 8 38 12
Indiana 211 30 54 17
Iowa 197 0 52 27
Kansas 18 0 8 2
Kentucky 91 27 43 19
Louisiana 535 92 122 26
Maine 22 0 2 0
Maryland 60 36 28 11
Massachusetts 124 69 18 1
Michigan 196 0 70 19
Minnesota 35 5 10 2
Mississippi 47 28 11 1
Missouri 348 24 126 41
Montana 62 6 40 24
Nebraska 121 0 61 32
Nevada 44 0 1 0
New Hampshire 44 20 8 1
New Mexico 48 34 17 4
New York 473 62 167 51
North Carolina 90 28 28 10
North Dakota 23 10 7 3
Ohio 491 51 177 51
Oklahoma 134 68 33 7
Continued on page 33

Appendices 33
Oregon 23 0 4 0
Pennsylvania 633 182 203 32
Rhode Island 12 12 5 1
South Carolina 113 3 19 3
South Dakota 2 0 0 0
Tennessee 118 50 34 7
Texas 938 304 303 108
Utah 44 7 9 5
Vermont 2 0 0 0
Virginia 75 0 15 4
Washington 59 1 13 4
West Virginia 407 348 202 59
Wisconsin 29 11 8 6
Wyoming 28 12 16 9
State Total exceedances Exceedances in impaired waters
Exceedances >100% of permit limit
Exceedances >500% of permit limit
Continued from page 32
34 Troubled Waters
ExCEEDANCES
Facility ID Facility name, county Total >100% permit
limit
>500% permit
limit
Types of exceedances Receiving Waterbody
Receiving Water
Impaired?
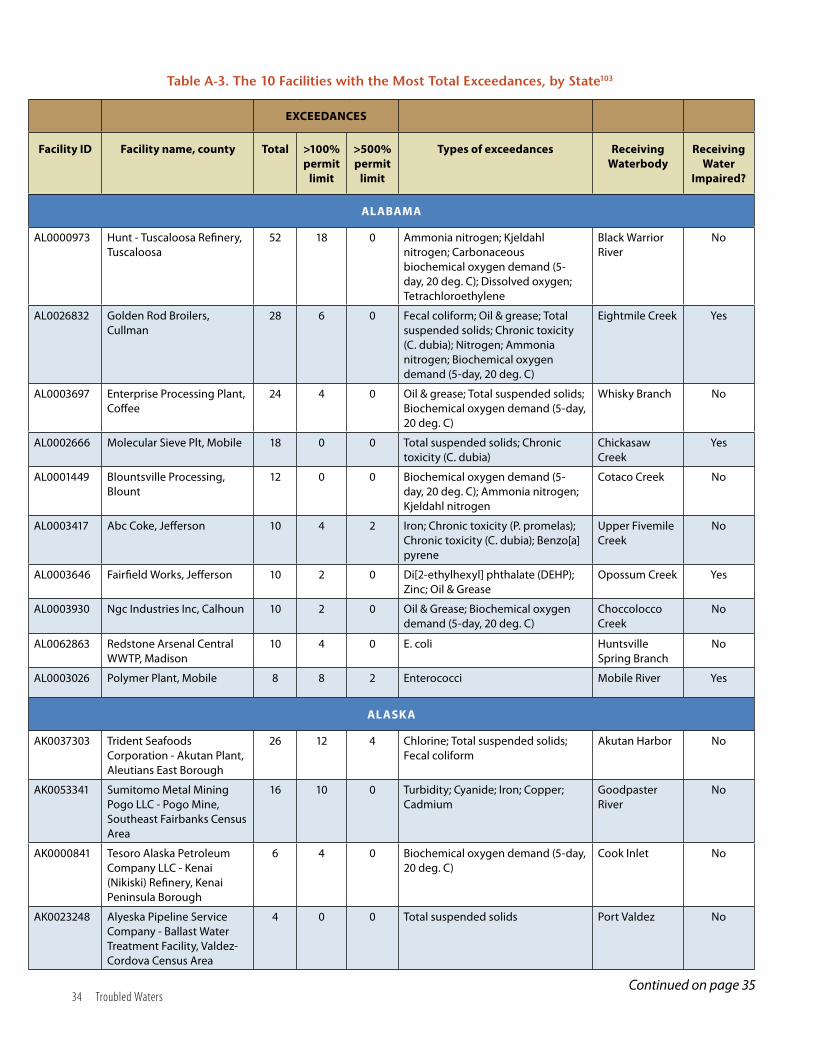
ALABAMA
AL0000973 Hunt - Tuscaloosa Refinery, Tuscaloosa
52 18 0 Ammonia nitrogen; Kjeldahl nitrogen; Carbonaceous biochemical oxygen demand (5-day, 20 deg. C); Dissolved oxygen; Tetrachloroethylene
Black Warrior River
No
AL0026832 Golden Rod Broilers, Cullman
28 6 0 Fecal coliform; Oil & grease; Total suspended solids; Chronic toxicity (C. dubia); Nitrogen; Ammonia nitrogen; Biochemical oxygen demand (5-day, 20 deg. C)
Eightmile Creek Yes
AL0003697 Enterprise Processing Plant, Coffee
24 4 0 Oil & grease; Total suspended solids; Biochemical oxygen demand (5-day, 20 deg. C)
Whisky Branch No
AL0002666 Molecular Sieve Plt, Mobile 18 0 0 Total suspended solids; Chronic toxicity (C. dubia)
Chickasaw Creek
Yes
AL0001449 Blountsville Processing, Blount
12 0 0 Biochemical oxygen demand (5-day, 20 deg. C); Ammonia nitrogen; Kjeldahl nitrogen
Cotaco Creek No
AL0003417 Abc Coke, Jefferson 10 4 2 Iron; Chronic toxicity (P. promelas); Chronic toxicity (C. dubia); Benzo[a]pyrene
Upper Fivemile Creek
No
AL0003646 Fairfield Works, Jefferson 10 2 0 Di[2-ethylhexyl] phthalate (DEHP); Zinc; Oil & Grease
Opossum Creek Yes
AL0003930 Ngc Industries Inc, Calhoun 10 2 0 Oil & Grease; Biochemical oxygen demand (5-day, 20 deg. C)
Choccolocco Creek
No
AL0062863 Redstone Arsenal Central WWTP, Madison
10 4 0 E. coli Huntsville Spring Branch
No
AL0003026 Polymer Plant, Mobile 8 8 2 Enterococci Mobile River Yes
ALASKA
AK0037303 Trident Seafoods Corporation - Akutan Plant, Aleutians East Borough
26 12 4 Chlorine; Total suspended solids; Fecal coliform
Akutan Harbor No
AK0053341 Sumitomo Metal Mining Pogo LLC - Pogo Mine, Southeast Fairbanks Census Area
16 10 0 Turbidity; Cyanide; Iron; Copper; Cadmium
Goodpaster River
No
AK0000841 Tesoro Alaska Petroleum Company LLC - Kenai (Nikiski) Refinery, Kenai Peninsula Borough
6 4 0 Biochemical oxygen demand (5-day, 20 deg. C)
Cook Inlet No
AK0023248 Alyeska Pipeline Service Company - Ballast Water Treatment Facility, Valdez-Cordova Census Area
4 0 0 Total suspended solids Port Valdez No
Table A-3. The 10 Facilities with the Most Total Exceedances, by State103
Continued on page 35

Appendices 35
AK0038661 Endicott Waterflood Operations, North Slope Borough
4 0 0 Biochemical oxygen demand (5-day, % removal); Fecal coliform
Beaufort Sea; Stefansson Sound
No
AK0040649 Teck Alaska Inc - Red Dog Port Site, Northwest Arctic Borough
4 2 0 Zinc; Fecal coliform Chukchi Sea No
AK0050571 Kensington Gold Mine-Coeur Alaska Inc, Juneau City and Borough
4 0 0 Sulfate, total [as SO4]; Sulfate Sherman And Camp Creeks; Lynn Canal
No
AK0053643 Fort Knox Mine-Fairbanks Gold Mining Inc, Fairbanks North Star Borough
4 4 0 Cyanide Old Fish Creek Channel
No
AKG315002 Hilcorp Alaska, Inc. - Trading Bay Treatment Facility, Kenai Peninsula Borough
4 0 0 Copper; pH Cook Inlet No
AK0043206 Hecla Greens Creek Mining Company, Juneau City and Borough
2 0 0 pH Greens Creek No
AKG528493 Ocean Beauty Seafoods LLC, Kodiak Island Borough
2 0 0 pH St Paul Harbor No
ARIZONA
AZ0000035 Asarco Ray Mine Operations, Pinal
23 15 5 Copper; Selenium Mineral Creek Yes
AZ0025607 Nogales International Wastewater Treatment Plant, Santa Cruz
8 3 0 Chronic toxicity (7-day C. dubia); Chronic toxicity (4-day R. subcapitata); Nickel
Badger Creek No
AZ0025071 Palo Verde Utilities Co - WRF, Pinal
6 2 0 E. coli; Cyanide Rincon Basin-Little Colorado River Subwatershed
No
AZ0026107 Agua Nueva WRF, Pima 2 2 1 Chlorine Salt River - Tempe Town Lake Subwatershed
No
AZ0023558 SRP - Santan Generating Station, Maricopa
1 0 0 Total suspended solids Town of Hilltop Subwatershed
No
AZ0026077 City of Bisbee - San Jose WWTP, Cochise
1 0 0 E. coli Middle Tanque Verde Creek Subwatershed
No
AZ0110221 USAF - Luke AFB - Litchfield Park WWTP, Maricopa
1 0 0 pH Yuma Valley Subwatershed
No
ExCEEDANCES
Facility ID Facility name, county Total >100% permit
limit
>500% permit
limit
Types of exceedances Receiving Waterbody
Receiving Water
Impaired?
Continued from page 34
Continued on page 36

36 Troubled Waters
ARKANSAS
AR0000752 El Dorado Chemical Co., Inc., Union
129 67 8 Zinc; Total dissolved solids; Lead; Total suspended solids; Fecal coliform; Carbonaceous biochemical oxygen demand (5-day, 20 deg. C)
Haynes Creek Subwatershed
Yes
AR0049794 Magcobar Mine Site, Hot Spring
115 90 53 Total dissolved solids; Total sulfate; Chloride
Chamberlain Creek; Cove Creek; Ouachita River
Yes
AR0001163 Remington Arms Company, LLC, Lonoke
110 59 4 Lead; Fecal coliform; Copper; Total suspended solids; Whole effluent toxicity; Zinc; pH; Antimony; Biochemical oxygen demand (5-day, 20 deg. C)
Bayou Meto; Arkansas River
Yes
AR0001171 Great Lakes Chemical Corporation-Central Plant, Union
70 13 2 pH; Chloride; Total dissolved solids; Carbonaceous biochemical oxygen demand (5-day, 20 deg. C); Ammonia nitrogen
Bayou De Loutre; Little Cornie Bayou; Ouachita River
No
AR0000591 Martin Operating Partnership, L.P., Union
33 7 0 Carbonaceous biochemical oxygen demand (5-day, 20 deg. C); Ammonia nitrogen; Oil & Grease
Smackover Creek; Ouachita River
Yes
AR0000647 Lion Oil Co-El Dorado Refinery, Union
26 17 5 pH; Lead; Zinc; Total suspended solids; Ammonia nitrogen; Carbonaceous biochemical oxygen demand (5-day, 20 deg. C)
Loutre Creek; Ouachita River
No
AR0045977 Nucor Steel - Arkansas, Division of Nucor Corporation Hickman Mill, Mississippi
24 9 0 Nickel Crooked Lake Bayou; Pemiscot Bayou
Yes
AR0049255 AECC-Harry L. Oswald Generating Station, Pulaski
14 5 1 Total suspended solids; Oil & Grease; Zinc; pH
Arkansas River No
AR0037770 BASF Corporation, Crittenden
10 2 0 pH; Biochemical oxygen demand (5-day, 20 deg. C); Fecal coliform; Acrylonitrile; Toluene
Mississippi River
Yes
AR0000523 Evraz Stratcor, Inc., Garland 8 1 0 Whole effluent toxicity; Copper Oachita River No
CALIFORNIA
CA0030210 Lehigh Permanente Plant, Santa Clara
85 46 15 Selenium; Nickel; Hexavalent chromium; Total dissolved solids; pH; Mercury; Settleable solids; Total suspended solids
Permanente Creek
Yes
CA0059188 William E. Warne Power Plant, Los Angeles
44 14 5 Chloride; Zinc; Copper; Dibromochloromethane; pH; Dissolved oxygen; Turbidity; Chronic toxicity (7-day C. dubia); Biochemical oxygen demand (5-day, 20 deg. C); Lead; Dichlorobromomethane
Pyramid Lake Yes
ExCEEDANCES
Facility ID Facility name, county Total >100% permit
limit
>500% permit
limit
Types of exceedances Receiving Waterbody
Receiving Water
Impaired?
Continued on page 37
Continued from page 35

Appendices 37
CA0064157 New Dock Street Pump Station, Los Angeles
33 16 4 Lead; Hydrocarbons, petroleum; Enterococci; Copper; Fecal coliform; Zinc; General coliform
Cerritos Channel
Yes
CA0055824 Castaic Power Plant, Los Angeles
32 8 0 Turbidity; Chloride; Copper; Biochemical oxygen demand (5-day, 20 deg. C); Total suspended solids; Di[2-ethylhexyl] phthalate (DEHP); Total nitrite + nitrate
Elderberry Forebay
Yes
CA0001139 Alamitos Generating Station, Los Angeles
23 13 5 Enterococci; Settleable solids; Total suspended solids; Chronic toxicity (7-day Atherinops affinis); Temp.; Copper; pH
San Gabriel River Estuary, Los Cerritos Channel
Yes
CA0003352 Six Flags Magic Mountain, Los Angeles
17 13 5 Copper; Fecal coliform; E. coli; Chlorine; pH; Chloride
Santa Clara River
Yes
CA0109282 San Onofre Nuclear Generating Station, Orange
16 14 1 Mercury; Temp.; Copper Pacific Ocean No
CA0001309 Boeing Santa Susana Field Laboratory, Los Angeles
11 1 1 TCDD equivalents; Lead; pH Bell Creek, Arroyo Simi
Yes
CA0005789 Shell Martinez Refinery, Contra Costa
11 3 1 pH; Total suspended solids; Mercury; Selenium
Carquinez Strait; Peyton Slough; Peyton Creek
Yes
CA0005550 Valero Benicia Refinery, Solano
10 4 2 Oil & grease; Selenium; Chromium; Mercury; pH; Total suspended solids
Suisun Bay; Carquinez Strait; Sulphur Springs Creek
Yes
COLORADO
CO0041351 Fort Morgan Facility, Morgan
91 70 65 Biochemical oxygen demand (5-day, 20 deg. C); Fecal coliform; pH; Chronic toxicity (7-day C. dubia); Flow; Ammonia nitrogen; Sulfide-hydrogen sulfide (undissociated); Chronic toxicity (7-day P. promelas)
South Platte River
No
CO0038334 London Water Tunnel, Park 45 32 6 Zinc; Cadmium; Oil & grease South Mosquito Creek
No
CO0048445 Erie North Water Reclamation Facility, Weld
29 3 0 Ammonia nitrogen; Copper; Flow Boulder Creek Yes
CO0027707 Swift Beef - Lone Tree, Weld 9 2 1 Chronic toxicity (7-day C. dubia); Fecal coliform; Total suspended solids; pH
Lone Tree Creek No
CO0000591 Black Cloud Mine, Lake 7 3 1 Zinc; Flow; Lead; Sulfide-hydrogen sulfide (undissociated); Cadmium
Arkansas River No
CO0001163 Millercoors Golden Facility, Jefferson
7 1 0 Biochemical oxygen demand (5-day, 20 deg. C); pH; Total suspended solids; Fluoride; E. coli (thermotol, MF, MTEC)
Clear Creek; Croke Canal
No
ExCEEDANCES
Facility ID Facility name, county Total >100% permit
limit
>500% permit
limit
Types of exceedances Receiving Waterbody
Receiving Water
Impaired?
Continued from page 36
Continued on page 38

38 Troubled Waters
CO0042064 Treatment, Storage & Disposal WWTF, Adams
7 2 0 Benzoic acids; Cyanide; Iron; Ammonia nitrogen; Aniline; Biochemical oxygen demand (5-day, 20 deg. C)
Beaver Creek No
CO0020974 USAF Academy, El Paso 4 2 2 Inorganic nitrogen; Carbonaceous biochemical oxygen demand (% removal); Solids, suspended percent removal
Monument Creek
Yes
COG500082 Pueblo East Pit, Pueblo 4 0 0 Total suspended solids Arkansas River No
CO0048275 Sage Creek Mine Complex, Routt
3 0 0 Iron; Total suspended solids Grassy Creek No
CONNECTICUT
CT0025305 Unimetal Surface Finishing LLC, Litchfield
41 8 0 Acute toxicity (48-Hr D. pulex %surv); Acute toxicity (48-Hr P. promelas NOAEL); Nitrogen; Zinc; Acute toxicity (48-Hr D. pulex NOAEL); Cyanide; Acute toxicity (48-Hr P. promelas %surv); Copper; Fluoride; Biochemical oxygen demand (5-day, 20 deg. C)
Naugatuck River
Yes
CT0026808 Seidel Inc, New Haven 14 10 6 Total suspended solids; Phosphorus; Acute toxicity (48-Hr P. promelas); Acute toxicity (48-Hr C. dubia)
Naugatuck River
No
CT0030180 Bridgeport Energy LLC, Fairfield
12 0 0 pH; Temp.; Temp. diff. between intake and discharge
Bridgeport Harbor
Yes
CT0003115 NRG Montville Operations Inc, New London
9 8 8 Flow rate; Temp. Thames River Yes
CT0003921 Naval Sub Base New London, New London
9 4 0 Oil & Grease; Flow; pH; Flow (max in 24 hr period); Acute toxicity (96-Hr menidia); Acute toxicity (48-Hr M. bahia)
Thames River Yes
CT0000086 Allnex USA Incorporated, New Haven
4 3 0 Ammonia nitrogen; Chronic toxicity (7-day C. dubia NOEC sub-lethal); Total suspended solids
Quinnipiac River
Yes
CT0001180 Summit Corporation of America, Litchfield
4 0 0 Silver; Acute toxicity (48-Hr D. pulex noael); Acute toxicity (48-Hr D. pulex)
Naugatuck River
No
CT0002968 Ansonia Copper & Brass Inc., New Haven
4 2 0 Copper; Zinc; Acute toxicity (48-Hr D. Pulex)
Naugatuck River
Yes
CT0003212 Kimberly-Clark Corporation, Litchfield
4 0 0 Acute toxicity (48-Hr D. pulex NOAEL); pH; Phosphorus
Housatonic River
No
CT0000434 Ahlstrom Nonwovens LLC, Hartford
2 0 0 Acute toxicity (48-Hr Pimephales); Acute toxicity (48-Hr D. Pulex)
Connecticut River
No
CT0002127 Dunn Paper - East Hartford, LLC, Hartford
2 0 0 pH; Acute toxicity (48-Hr D. Pulex) Hockanum River
Yes
CT0003824 Electric Boat Corporation, New London
2 0 0 Flow (max in 24 hr period); pH Thames River Yes
ExCEEDANCES
Facility ID Facility name, county Total >100% permit
limit
>500% permit
limit
Types of exceedances Receiving Waterbody
Receiving Water
Impaired?
Continued on page 39
Continued from page 37

Appendices 39
DELAWARE
DE0000299 Allen Harim Foods LLC, Sussex
19 12 4 Total suspended solids; Ammonia nitrogen; Phosphorus; Enterococci (group D, MF trans, M-E, EIA)
Beaverdam Creek
No
DE0000051 Chemours Edge Moor Plant, New Castle
9 1 0 pH; pH (monthly accum) Shellpot Creek Yes
DE0000035 Invista S.A.R.L., Sussex 2 2 0 Biochemical oxygen demand (5-day, 20 deg. C)
Nanticoke River No
DE0000558 Calpine Mid-Atlantic, New Castle
2 0 0 Temp.; Total suspended solids Shellpot Creek Yes
DE0000469 Perdue Foods, LLC., Sussex 1 0 0 Total suspended solids Savannah Ditch No
DE0000612 Formosa Plastics Corporation, New Castle
1 0 0 Chloroform Red Lion Creek - Delaware River Subwatershed
No
DISTRICT OF COLUMBIA
DC0000094 Pepco - Benning, District of Columbia
20 11 6 Iron; Total suspended solids; Zinc; Copper
Anacostia River Yes
DC0000019 Washington Aqueduct, District of Columbia
2 1 1 Chlorine Potomac River Yes
FLORIDA
FL0001465 Pilgrim’s Pride Processing Plant, Suwannee
28 8 0 Nitrogen; Specific conductance; Carbonaceous biochemical oxygen demand (5-day, 20 deg. C); Dissolved oxygen; Oil & Grease; Chronic toxicity (7-day C. dubia)
Suwannee River Yes
FL0025755 Siesta Key Utilities Authority, Sarasota
27 11 1 Phosphorus; Carbonaceous biochemical oxygen demand (5-day, 20 deg. C); Nitrogen; Chronic toxicity (7-day M. bahia); Total suspended solids; Fecal coliform
Grand Canal on Siesta Key
No
FL0000809 H L Culbreath Bayside Power Plant, Hillsborough
24 12 0 Flow; Iron Hillsborough Bay
Yes
FL0000477 Coca Cola North America, Pinellas
19 6 0 Phosphorus; Copper; Total suspended solids; Carbonaceous biochemical oxygen demand (5-day, 20 deg. C); Nitrogen
Clearwater Harbor
No
FL0000051 The Chemours Company Tt LLC - Florida Mine - Trail Ridge, Bradford
15 0 0 Chronic toxicity (7-day C. dubia); Flow; Zinc; Iron; Acute toxicity (96-hour C. dubia); Acute toxicity (96-hr cyprinella leedsi)
Alligator Creek; Blue Pond
Yes
FL0002763 Georgia-Pacific Consumer Operations LLC, Putnam
15 6 2 Fecal coliform; Color [PT-CO units]; Total suspended solids; pH; Chronic toxicity (7-day C. dubia); Turbidity
Lower St Johns River
No
ExCEEDANCES
Facility ID Facility name, county Total >100% permit
limit
>500% permit
limit
Types of exceedances Receiving Waterbody
Receiving Water
Impaired?
Continued from page 38
Continued on page 40

40 Troubled Waters
FL0000922 US Naval Station Mayport, Duval
12 2 1 Peracetic Acid; Fecal coliform; Nickel; Oil & Grease; Chronic toxicity (7-day M. bahia); Enterococci (group D, MF trans, M-E, EIA); Copper
St Johns River No
FL0036498 Seminoles Units 1 & 2, Putnam
9 9 7 Total suspended solids; Fecal coliform
St Johns River No
FL0132381 Cytec Industries, Inc - Brewster Plant, Polk
9 0 0 Alpha, gross particle activity; pH; Chronic toxicity (7-day P. promelas)
South Prong Alafia River
No
FL0000761 Mosaic Fertilizer LLC - Riverview Facility, Hillsborough
8 3 1 Chronic toxicity (7-day M. bahia); Copper; Nickel; Iron; Zinc; Ammonia nitrogen
Alafia River Yes
FL0043869 Tampa Electric Company - Polk Power Plant, Polk
8 0 0 pH; Chronic toxicity (7-day C. dubia); Iron
Little Payne Creek
No
GEORGIA
GA0003280 King America Finishing, Inc., Screven
24 10 1 Acute toxicity (96-Hr C. dubia); Fecal coliform; Formaldehyde; Total suspended solids
Jackson Branch No
GA0003590 Interstate Paper, LLC, Liberty
10 2 0 Biochemical oxygen demand (5-day, 20 deg. C)
North Newport River
No
GA0000281 Chemical Products Corporation, Bartow
8 2 0 Sulfide; Acute toxicity (96-Hr C. dubia); Total suspended solids; Acute toxicity (96-Hr pimephales)
Etowah River No
GA0002852 USAF Robins AFB, Houston 8 3 0 Biochemical oxygen demand (5-day, 20 deg. C); Total suspended solids; Copper; Chem. Oxygen Demand
Horse Creek Tributary; Ocmulgee River
No
GA0001201 Georgia Pacific Cedar Springs LLC, Early
7 6 4 Fecal coliform; Total suspended solids
Chattahoochee River
No
GA0003735 Pinova, Inc., Glynn 6 2 1 Enterococci; Dissolved oxygen; pH; Toxaphene; Copper
Dupree Creek Yes
GA0002071 Pcs Nitrogen Fertilizer, L.P. (Augusta), Richmond
5 3 0 Nitrate; Nitrogen; Ammonia nitrogen; Organic nitrogen
Savannah River No
GA0001708 Geo Specialty Chemicals, Polk
3 0 0 Biochemical oxygen demand (5-day, 20 deg. C); Ultimate oxygen demand
Dry Creek Subwatershed
No
GA0002160 DSM Chemicals Augusta, Inc., Richmond
3 1 0 pH; Phenol Savannah River No
GA0001449 Georgia Power Plant Bowen, Bartow
2 0 0 pH Etowah River No
GA0002798 International Paper - Port Wentworth, Chatham
2 1 0 Biochemical oxygen demand (5-day, 20 deg. C)
Savannah River; Front River
No
GA0027588 US Army Hunter Army Airfield, Chatham
2 1 0 Biochemical oxygen demand (5-day, 20 deg. C)
Pipemaker Canal Subwatershed
No
GA0032620 Westrock Southeast, LLC, Laurens
2 1 0 Total suspended solids; Biochemical oxygen demand (5-day, 20 deg. C)
Oconee River; Shaddock Creek
No
ExCEEDANCES
Facility ID Facility name, county Total >100% permit
limit
>500% permit
limit
Types of exceedances Receiving Waterbody
Receiving Water
Impaired?
Continued on page 41
Continued from page 39

Appendices 41
HAWAII
HI0000094 Kahului Generating Station, Maui
12 1 0 Total nitrite + nitrate; Nickel Pacific Ocean No
HI0000353 Port Allen Generating Station, Kauai
10 6 0 Temp.; Copper; Ammonia nitrogen Hanapepe Bay No
HI0000329 IES Downstream, LLC Hawaii Refinery, Honolulu
7 2 0 Phosphorus; pH Pacific Ocean No
HI0000604 Heco Waiau Generating Station, Honolulu
7 3 2 Copper; Ammonia nitrogen; pH Pearl Harbor - East Loch
No
HI0020303 East Honolulu Wastewater Treatment Plant, Honolulu
5 1 0 Cyanide; Total suspended solids; Solids, suspended percent removal
Pacific Ocean No
HI0000019 Kahe Generating Station (1), Honolulu
4 2 2 pH; Copper Pacific Ocean No
HI0110086 Navfac Hawaii Wastewater Treatment Plant, Honolulu
3 1 0 Cadmium; Oil & grease Pacific Ocean No
HI0021296 C&Ch Kailua Regional WWTP, Honolulu
1 0 0 Ammonia nitrogen Pacific Ocean No
IDAHO
ID0000027 U.S. Silver Corporation - Idaho Inc (Coeur And Galena Mines), Shoshone
24 6 0 Lead; Total suspended solids; pH; Cadmium
Lake Creek Yes
ID0000663 Burley, City Of - Burley-Heyburn Industrial Park, Cassia
3 0 0 Total suspended solids; Phosphorus Snake River No
ID0001163 Clearwater Paper Corporation, Nez Perce
3 0 0 Chloroform Snake River No
ID0025402 Thompson Creek Mining Company - Thompson Creek Mine, Custer
1 0 0 Selenium Thompson Creek; Squaw Creek; Salmon River
No
IDG130004 Hagerman National Fish Hatchery, Gooding
1 0 0 Total suspended solids Riley Creek, Snake River
No
IDG130020 White Springs Trout Farm, Gooding
1 0 0 Phosphorus Snake River No
IL0004421 Honeywell International Inc - Metropolis Works Facility, Massac
15 7 5 Fecal coliform; Total suspended solids; E. coli; E. coli (% samples exceeding limit)
Ohio River No
IL0000205 Wood River Refinery, Madison
14 2 0 Mercury; Coliform, fecal - % samples exceeding limit; Fecal coliform; pH
Mississippi River
No
IL0000108 Coffeen Power Station, Montgomery
13 3 0 Total suspended solids; Temp. Coffeen Lake No
IL0024074 Baxter Healthcare Corporation, Lake
12 0 0 Biochemical oxygen demand (5-day, 20 deg. C); Total suspended solids
Unnamed Ditch Tributary to Squaw Creek
No
ExCEEDANCES
Facility ID Facility name, county Total >100% permit
limit
>500% permit
limit
Types of exceedances Receiving Waterbody
Receiving Water
Impaired?
Continued from page 40
Continued on page 42

42 Troubled Waters
IL0001392 Emerald Polymer Additives LLC, Marshall
9 2 2 Fecal coliform; Total suspended solids; Biochemical oxygen demand (5-day, 20 deg. C)
Illinois River No
IL0004120 Amerenenergy Medina Cogen LLC, Crawford
8 3 0 Total suspended solids Wabash River No
IL0026859 Scott Air Force Base, St. Clair 7 3 0 Carbonaceous biochemical oxygen demand (5-day, 20 deg. C); Total suspended solids; Biochemical oxygen demand (5-day, 20 deg. C)
Unnamed Tributary to Silver Creek
No
IL0000612 Alton Steel Inc, Madison 6 0 0 Total suspended solids; Iron Mississippi River
No
IL0002861 Exxonmobil Oil Corporation, Will
6 1 1 Total dissolved solids; Oil & grease; Benzene
Des Plaines River
Yes
IL0024767 Springfield CWLP, Sangamon
6 0 0 pH; Boron; Total suspended solids Lake Springfield
No
INDIANA
IN0003573 General Motors LLC - Cet Bedford, Lawrence
18 6 0 Biochemical oxygen demand (5-day, 20 deg. C); Ammonia nitrogen; Polychlorinated biphenyls (PCBs)
Salt Creek Via Pleasant Run Creek
No
IN0001601 Taghleef Industries, Vigo 17 1 0 Acute toxicity (48-Hr D. magna); Acute toxicity (96-Hr P. promelas); Acute toxicity (96-Hr C. dubia); Acute toxicity (96-Hr Pimephales); Chlorine; Acute toxicity (48-Hr C. dubia); Acute toxicity (48-Hr static D. magna)
Wabash River Via Spring Creek
No
IN0000175 Arcelormittal Burns Harbor LLC, Porter
16 0 0 Ammonia nitrogen; Chronic toxicity (7-day C. dubia); Chronic toxicity (C. dubia); Temp.; Phenolics
Little Calumet River and Burns Harbor
No
IN0053201 Nipsco - R M Schahfer Gen Station, Jasper
16 1 1 Total suspended solids; pH; E. coli; Carbonaceous biochemical oxygen demand (5-day, 20 deg. C)
Kankakee River & Stauhlbaum Ditch
No
IN0000337 U.S. Steel Corp, Midwest Plant, Porter
11 4 3 Hexavalent dissolved chromium; Temp.; Chromium
Burns Ditch to Lake Michigan
Yes
IN0002887 Ipalco - Petersburg Gen Station, Pike
10 8 4 Selenium; Boron; Total suspended solids; Iron; Copper
West Fork White River & Lick Creek
No
IN0030651 South Haven Sewer Works Inc WWTP, Porter
9 2 0 Ammonia nitrogen; Mercury; E. coli Lt Calumet River Via Salt Creek
No
IN0050296 Hoosier Energy - Merom Generating Station, Sullivan
9 1 0 pH; Temp.; Iron Wabash River Via Turtle Creek Reservoir
No
IN0000205 Arcelormittal Indiana Harbor LLC - Indiana Harbor West, Lake
8 0 0 Mercury; Oil & grease; Zinc; Ammonia nitrogen
Indiana Harbor Canal
No
ExCEEDANCES
Facility ID Facility name, county Total >100%permit
limit
>500%permit
limit
Types of exceedances Receiving Waterbody
Receiving Water
Impaired?
Continued on page 43
Continued from page 41

Appendices 43
IN0043273 Carriage Estates WWTP, Tippecanoe
8 3 2 Chlorine; pH Indian Creek No
IN0052191 Vectren Corp - Sigeco A. B. Brown Gen. Station, Posey
8 3 2 Total suspended solids; Biochemical oxygen demand (5-day, 20 deg. C); pH; Total residual oxidants
Ohio River Yes
IOWA
IA0003620 Archer Daniels Midland Corn Processing, Clinton
51 15 15 pH; Temp.; Toxicity (C. dubia); Toxicity (P. promelas)
Beaver Slough No
IA0052166 Iowa Fertilizer Company, Lee
43 18 3 Iron; Sulfate; Biochemical oxygen demand (5-day); Ammonia nitrogen; TRC
Spillman Creek - Mississippi River Subwatershed
No
IA0003441 Grain Processing Corporation, Muscatine
23 3 2 pH; Temp.; Biochemical oxygen demand (5-day)
Mississippi River
No
IA0063762 Cargill, Inc., Mahaska 15 0 0 Flow Bluff Creek, Brown Creek-Des Moines River
No
IA0002089 Tyson Fresh Meats, Inc. - Perry, Dallas
10 3 0 Ammonia nitrogen; TRC; Colif North Raccoon River
No
IA0003727 Nextera Energy Duane Arnold, LLC, Linn
10 1 0 Oil & grease; Total suspended solids; TRC
Nelson Creek - Cedar River Subwatershed
No
IA0060569 JBS Pork, Wapello 10 6 4 E. coli; Total suspended solids; Biochemical oxygen demand (5-day); Ammonia nitrogen
Des Moines River
No
IA0003361 Tyson Fresh Meats, Inc. - Columbus Junction, Louisa
7 3 2 Total suspended solids; TRC; Ammonia nitrogen
Cedar River No
IA0000205 Monsanto Company, Muscatine
5 1 0 Biochemical oxygen demand (5-day); Total suspended solids; Alachlo
Mississippi River
No
IA0000191 Equistar Chemicals, Lp, Clinton
4 0 0 Biochemical oxygen demand (5-day); Acphen
Mississippi River
No
IA0004413 Gelita USA, Inc., Woodbury 4 0 0 Ammonia nitrogen; Biochemical oxygen demand (5-day)
Missouri River No
KANSAS
KS0003204 Futamura USA, Inc. Melissa Weide, Shawnee
6 3 0 Biochemical oxygen demand (5-day, 20 deg. C); Total suspended solids
Kansas River No
KS0042722 Topeka Oakland Wastewater Plant Sylvan Coles, Shawnee
4 3 2 E. coli; pH Kansas River No
KS0000248 Coffeyville Resources Refining Environmental Manager, Montgomery
3 0 0 Total suspended solids Verdigris River No
ExCEEDANCES
Facility ID Facility name, county Total >100% permit
limit
>500% permit
limit
Types of exceedances Receiving Waterbody
Receiving Water
Impaired?
Continued from page 42
Continued on page 44

44 Troubled Waters
KS0094561 Augusta Wastewater Plant Environmental Manager, Butler
2 1 0 Total suspended solids Walnut River No
KS0100269 MGP Ingredients, Inc. Phil Rindom, Atchison
2 1 0 Biochemical oxygen demand (5-day, 20 deg. C)
Missouri River Via White Clay Creek
No
KS0095681 Wichita #3 Wastewater Plant Jamie G. Belden, Sedgwick
1 0 0 Ammonia nitrogen Cowskin Creek No
KENTUCKY
KY0001431 PMC Organometallix Inc, Carroll
40 29 14 Biochemical oxygen demand (5-day, 20 deg. C); Chem. oxygen demand; Total suspended solids; Toxicity; Oil & grease
Ohio River No
KY0003701 ISP Chemicals Inc, Marshall 10 1 0 Total suspended solids; Temp.; Biochemical oxygen demand (5-day, 20 deg. C); Toxicity
Tennessee River No
KY0000329 Huntington Alloys Corp, Boyd
7 3 1 Nickel; Total suspended solids; Copper
Big Sandy River Yes
KY0004278 Century Aluminum of Kentucky LLC - Sebree, Henderson
5 0 0 Total suspended solids; Iron; Oil & grease
Green River No
KY0000388 Catlettsburg Refining LLC, Boyd
4 1 0 Total suspended solids; Chloride Big Sandy River Yes
KY0002666 Aleris Rolled Products Inc, Hancock
4 1 0 Chlorine; Aluminum; Total suspended solids
Thrasher Creek No
KY0004049 Fluor Federal Services Inc - Paducah Gaseous Diffusion Plant, McCracken
4 3 2 Toxicity Big & Little Bayou Creeks
Yes
KY0095192 Kimberly-Clark Corp, Daviess
4 4 1 Total suspended solids; E. coli Ohio River; Green River
No
KY0072630 Logan Aluminum Inc, Logan 2 0 0 Toxicity; E. coli Austin Creek Yes
KY0092118 Precoat Metals, Hancock 2 0 0 Toxicity Ohio River Yes
KY0102083 Fluor Federal Services Inc - Paducah Gaseous Diffusion Plant, Ballard
2 1 1 Toxicity; Carbonaceous biochemical oxygen demand (5-day, 20 deg. C)
Big & Little Bayou Creeks
Yes
LOUISIANA
LA0007684 Westrock Cp, LLC - Hodge Louisiana Mill, Jackson Parish
64 2 0 Whole effluent toxicity (C. dubia); Whole effluent toxicity (P. promelas)
Little Dugdemona River
No
LA0000418 CF Industries Nitrogen. LLC - Donaldsonville Nitrogen Complex, Ascension Parish
26 0 0 Organic nitrogen; pH Mississippi River
No
ExCEEDANCES
Facility ID Facility name, county Total >100% permit
limit
>500% permit
limit
Types of exceedances Receiving Waterbody
Receiving Water
Impaired?
Continued on page 45
Continued from page 43

Appendices 45
KS0094561 Augusta Wastewater Plant Environmental Manager, Butler
2 1 0 Total suspended solids Walnut River No
KS0100269 MGP Ingredients, Inc. Phil Rindom, Atchison
2 1 0 Biochemical oxygen demand (5-day, 20 deg. C)
Missouri River Via White Clay Creek
No
KS0095681 Wichita #3 Wastewater Plant Jamie G. Belden, Sedgwick
1 0 0 Ammonia nitrogen Cowskin Creek No
KENTUCKY
KY0001431 PMC Organometallix Inc, Carroll
40 29 14 Biochemical oxygen demand (5-day, 20 deg. C); Chem. oxygen demand; Total suspended solids; Toxicity; Oil & grease
Ohio River No
KY0003701 ISP Chemicals Inc, Marshall 10 1 0 Total suspended solids; Temp.; Biochemical oxygen demand (5-day, 20 deg. C); Toxicity
Tennessee River No
KY0000329 Huntington Alloys Corp, Boyd
7 3 1 Nickel; Total suspended solids; Copper
Big Sandy River Yes
KY0004278 Century Aluminum of Kentucky LLC - Sebree, Henderson
5 0 0 Total suspended solids; Iron; Oil & grease
Green River No
KY0000388 Catlettsburg Refining LLC, Boyd
4 1 0 Total suspended solids; Chloride Big Sandy River Yes
KY0002666 Aleris Rolled Products Inc, Hancock
4 1 0 Chlorine; Aluminum; Total suspended solids
Thrasher Creek No
KY0004049 Fluor Federal Services Inc - Paducah Gaseous Diffusion Plant, McCracken
4 3 2 Toxicity Big & Little Bayou Creeks
Yes
KY0095192 Kimberly-Clark Corp, Daviess
4 4 1 Total suspended solids; E. coli Ohio River; Green River
No
KY0072630 Logan Aluminum Inc, Logan 2 0 0 Toxicity; E. coli Austin Creek Yes
KY0092118 Precoat Metals, Hancock 2 0 0 Toxicity Ohio River Yes
KY0102083 Fluor Federal Services Inc - Paducah Gaseous Diffusion Plant, Ballard
2 1 1 Toxicity; Carbonaceous biochemical oxygen demand (5-day, 20 deg. C)
Big & Little Bayou Creeks
Yes
LOUISIANA
LA0007684 Westrock Cp, LLC - Hodge Louisiana Mill, Jackson Parish
64 2 0 Whole effluent toxicity (C. dubia); Whole effluent toxicity (P. promelas)
Little Dugdemona River
No
LA0000418 CF Industries Nitrogen. LLC - Donaldsonville Nitrogen Complex, Ascension Parish
26 0 0 Organic nitrogen; pH Mississippi River
No
LA0032417 Calumet Shreveport Lubricants and Waxes, LLC- Shreveport Refinery, Caddo Parish
25 4 0 Total suspended solids; Ammonia nitrogen; Whole effluent toxicity (P. promelas); pH (monthly accum); Oil & grease; pH, > 60 minutes
Brush Bayou No
LA0054178 Pilgrim’s Pride Corporation- Natchitoches Processing Plant, Natchitoches Parish
24 15 3 Total suspended solids; Ammonia and unionized ammonia; Biochemical oxygen demand (5-day, 20 deg. C); Whole effluent toxicity (C. dubia)
Old River No
LA0002844 House of Raeford Farms of LA., Bienville Parish
23 9 3 Whole effluent toxicity; Total dissolved solids; Whole effluent toxicity (C. dubia); Fecal coliform; Ammonia nitrogen; Whole effluent toxicity (P. promelas)
Red River No
LA0068730 H2O Systems, Inc.- Greenleaves Treatment Facility, St. Tammany Parish
20 5 2 Copper; Cyanide; Chlorine; Fecal coliform; Dissolved oxygen; Ammonia nitrogen; Mercury; Zinc; Total suspended solids
Bayou Chinchuba
No
LA0005606 Almatis Burnside LLC, Ascension Parish
19 3 0 pH (monthly accum); pH, > 60 minutes; Whole effluent toxicity (C. dubia); Whole effluent toxicity
Mississippi River
No
LA0007501 Arclin U.S.A., LLC.- Dodson Facility, Winn Parish
18 2 0 Whole effluent toxicity Port De Luce Creek; Brushy Creek
No
LA0003026 Phillips 66 Company - Lake Charles Refinery, Calcasieu Parish
16 6 1 Total suspended solids; pH; Sulfide Calcasieu River & Bayou Verdine
Yes
LA0069612 Williams Olefins, LLC, Ascension Parish
16 2 0 Biochemical oxygen demand (5-day, 20 deg. C); Total suspended solids; Oil & grease; pH
Mississippi River; Bayou Manchac
No
MAINE
ME0002160 Bucksport Mill LLC, Hancock 10 1 0 pH; Total suspended solids; Zinc Penobscot River
No
ME0002321 S D Warren Company - Westbrook, Cumberland
5 0 0 Thermal Discharge; Total suspended solids
Presumpscot River
No
ME0002054 Catalyst Paper Operations Inc, Oxford
3 0 0 Biochemical oxygen demand (5-day, 20 deg. C); pH
Androscoggin River
No
ME0001872 Woodland Pulp LLC, Washington
2 1 0 Zinc; Copper St Croix River No
ME0000167 GNP-West, Inc, Penobscot 1 0 0 pH Millinocket Stream
No
ME0002020 MFGR LLC, Penobscot 1 0 0 Biochemical oxygen demand (5-day, 20 deg. C)
Penobscot River
No
ExCEEDANCES
Facility ID Facility name, county Total >100% permit
limit
>500% permit
limit
Types of exceedances Receiving Waterbody
Receiving Water
Impaired?
Continued from page 44
Continued on page 46

46 Troubled Waters
MARYLAND
MD0070629 Casselman Mine, Garrett 14 9 0 Flow Casselman River
Yes
MD0000345 Eastman Specialties Corporation, Kent
11 3 0 Biochemical oxygen demand (5-day, 20 deg. C)
Morgan Creek No
MD0000060 Perdue Farms, Inc., Wicomico
9 6 5 Total dissolved solids; Fecal coliform Peggy Branch Yes
MD0021229 Aberdeen Proving Ground Edgewood Area, Edgewood, Harford
8 0 0 Biochemical oxygen demand (5-day, 20 deg. C)
Bush River No
MD0023957 Maryland Correctional Institution, Washington
4 4 4 Chlorine Upper Potomac River
Yes
MD0002640 Genon - Dickerson Generating, Montgomery
3 1 0 pH; Nitrogen Potomac River Yes
MD0001775 Erachem Comilog, Inc, Baltimore city
2 2 0 Manganese Patapsco River No
MD0020877 Fort Detrick WWTP, Frederick
2 1 0 Kjeldahl nitrogen Upper Monocacy River
No
MD0002399 Calvert Cliffs Nuclear Power Plant, LLC, Calvert
1 0 0 Biochemical oxygen demand (5-day, 20 deg. C)
West Chesapeake Bay
Yes
MD0002658 NRG Chalk Point Generating Station, Prince George’s
1 1 1 Nitrogen Patuxent River Yes
MD0002674 Genon- Mid-Atlantic LLC (Morgantown Station), Charles
1 0 0 Nitrogen Potomac River No
MD0003158 Naval Support Facility, Indian Head, Charles
1 0 0 pH Potomac River; Mattawoman Creek
Yes
MD0020885 Naval Support Facility, Charles
1 0 0 E. coli Lower Potomac River
Yes
MD0021237 Aberdeen Proving Ground, Aberdeen Area WWTP, Harford
1 0 0 Ammonia nitrogen Spesutie Narrows
Yes
MD0021687 Upper Potomac River Comm STP, Allegany
1 1 1 Nitrogen North Branch Potomac River
Yes
MASSACHUSETTS
MA0101567 Warren W W T F, Worcester 27 5 0 pH; Copper Quaboag River No
MA0001791 Texas Instruments, Inc., Bristol
13 7 1 Trichloroethene; Trichloroethylene; pH
Coopers Pond Yes
MA0004341 Wyman-Gordon Company, Worcester
13 0 0 pH Quinsigamond and Flint Pond
No
MA0002241 Taunton Municipal Lighting, Bristol
11 0 0 pH; Temp.; Flow Taunton River Yes
ExCEEDANCES
Facility ID Facility name, county Total >100% permit
limit
>500% permit
limit
Types of exceedances Receiving Waterbody
Receiving Water
Impaired?
Continued on page 47
Continued from page 45

Appendices 47
MA0030244 Emerald Square Mall, Bristol 7 1 0 Oil & Grease; pH; Zinc Wetland to Seven Mile River
No
MA0004006 Sunoco Logistics East Boston Terminal, Suffolk
6 0 0 pH Chelsea River Yes
MA0004936 Patriot Beverages LLC, Middlesex
5 1 0 Biochemical oxygen demand (5-day, 20 deg. C); Total suspended solids
Reedy Meadow Brook
Yes
MA0101192 Boston Water and Sewer Comm, CSO, Suffolk
5 0 0 pH Boston Harbor Yes
MA0000671 Crane & Co Inc WWTP, Berkshire
4 0 0 Total suspended solids; Aluminum; Biochemical oxygen demand (5-day, 20 deg. C)
Housatonic River, East Branch
Yes
MA0004561 Hollingsworth & Vose, Middlesex
4 3 0 Zinc; pH Squannacook River
Yes
MA0004928 NRG Canal, LLC, Barnstable 4 0 0 Temp. Cape Cod Canal No
MA0005011 Southworth Co. Turners Fall, Franklin
4 1 0 Biochemical oxygen demand (5-day, 20 deg. C)
Connecticut River
Yes
MA0031551 Clean Harbors of Braintree Inc, Norfolk
4 0 0 Total suspended solids; pH; Lead Weymouth Fore River
No
MICHIGAN
MI0044491 Great Lakes Aggregate-Sylvania, Monroe
52 39 15 Hydrogen peroxide; Hydrogen sulfide; pH
Huron River & Laudenschlager Drain
No
MI0003166 Up Paper LLC, Schoolcraft 23 8 2 Biochemical oxygen demand (5-day, 20 deg. C); Total suspended solids; Chlorine
Manistique River
No
MI0001953 Deco-Sibley Quarry, Wayne 17 8 1 Hydrogen sulfide Huntington Creek - Frontal Lake Erie Subwatershed
No
MI0000728 Grand Haven Bl&P-J B Sims, Ottawa
13 1 0 Oil & Grease; Mercury; Total suspended solids
Grand River No
MI0004821 Stoneco Inc-Maybee, Monroe
10 0 0 Strontium Ross Drain No
MI0001091 Mich Sugar Co-Bay City, Bay 9 0 0 Phosphorus; Fecal coliform; pH; Temp.
Saginaw River No
MI0002542 Mich Sugar Co-Croswell, Sanilac
9 2 0 Chronic toxicity (48-Hr P. promelas); Acute toxicity (C. dubia); Toxicity, choice of species; Phosphorus
Black River No
MI0004464 Lansing BWL-Eckert Station, Ingham
8 0 0 Oil & Grease; Total suspended solids Grand River No
MI0026786 U.S. Steel-Gl-Zug Island, Wayne
8 2 0 Ammonia nitrogen; Phenols; Zinc; Total residual oxidants
Detroit River No
ExCEEDANCES
Facility ID Facility name, county Total >100%permit
limit
>500%permit
limit
Types of exceedances ReceivingWaterbody
ReceivingWater
Impaired?
ExCEEDANCES
Facility ID Facility name, county Total >100%permit
limit
>500% permit
limit
Types of exceedances Receiving Waterbody
Receiving Water
Impaired?
Continued from page 46
Continued on page 48

48 Troubled Waters
MI0001988 Lafarge-Alpena, Alpena 5 0 0 Mercury Grass Creek - Frontal Lake Huron Subwatershed
No
MI0003093 French Paper Co, Berrien 5 0 0 Copper Saint Joseph River
No
MI0037451 Hillshire Brands-Zeeland, Ottawa
5 4 1 Fecal coliform; Total suspended solids
Headwaters Pigeon River Subwatershed
No
MINNESOTA
MN0002208 Minnesota Power - Taconite Harbor Energy Center, Cook
6 2 0 Total suspended solids Lake Superior No
MN0001643 Boise White Paper LLC - Intl Falls, Koochiching
5 2 0 pH; Biochemical oxygen demand (5-day, 20 deg. C)
Rainy River No
MN0001945 American Crystal Sugar - Moorhead, Clay
4 0 0 Biochemical oxygen demand (5-day, 20 deg. C); Total suspended solids
Red River of the North
Yes
MN0000256 Saint Paul Park Refining Co LLC, Washington
3 1 0 Mercury; Total suspended solids Mississippi River
No
MN0040665 Southern Minnesota Beet Sugar Coop, Renville
3 0 0 Total suspended solids; Temp. West Fork Beaver Creek
No
MN0055301 Northshore Mining - Silver Bay, Lake
3 0 0 Amphibole asbestos Beaver River No
MN0000990 Minnesota Power - Laskin Energy Center, St. Louis
2 1 0 Mercury Colby Lake and Partridge River
No
MN0001449 3M - Cottage Grove, Washington
2 2 1 Mercury; Chlorine Mississippi River
No
MN0001929 American Crystal Sugar - Crookston, Polk
2 1 1 Total suspended solids; Coliform (fecal MPN + membrane ftl 44.5 C)
Red Lake River No
MN0046981 Northshore Mining Co - Babbitt, St. Louis
2 0 0 Chlorine Partridge River No
MISSISSIPPI
MS0003115 Mississippi Phosphates Corporation, Jackson
27 10 0 Phosphorus; pH; pH (monthly accum); Total suspended solids
Bayou Casotte Yes
MS0001261 Entergy Miss. Inc, Gerald Andrus Plant, Washington
3 0 0 Total suspended solids Mississippi River
No
MS0002941 Georgia Pacific Monticello LLC, Lawrence
3 0 0 Fecal coliform Pearl River No
MS0002950 Omega Protein, Inc, Jackson 3 0 0 pH Escatawpa River
No
MS0002925 Mississippi Power Co, Plant Jack Watson, Harrison
2 0 0 Total suspended solids; pH Big Lake & Fritz Creek
No
MS0059838 MSARNG, Camp Shelby Joint Forces Training Center, Forrest
2 0 0 Flow Leaf River No
ExCEEDANCES
Facility ID Facility name, county Total >100% permit
limit
>500% permit
limit
Types of exceedances Receiving Waterbody
Receiving Water
Impaired?
Continued on page 49
Continued from page 47

Appendices 49
MS0000574 CF Industries Nitrogen LLC, Yazoo
1 1 1 Fecal coliform Yazoo River No
MS0000833 Baxter Healthcare Corporation, Bolivar
1 0 0 Copper Unnamed Tributary to Lead Bayou
No
MS0000931 Gerdau Macsteel Inc, Union 1 0 0 Dissolved oxygen Jasper Creek Yes
MS0001481 Chevron Products Company, Jackson
1 0 0 Total suspended solids Mississippi Sound
No
MS0021521 Escatawpa WWTP, Jackson 1 0 0 Ammonia nitrogen Escatawpa River
No
MS0036412 International Paper, Columbus Mill, Lowndes
1 0 0 Total suspended solids Tennessee-Tombigbee Waterway
No
MS0061271 Johnson Creek WWTF, DeSoto
1 0 0 Flow Johnson Creek No
MISSOURI
MO0036773 Simmons Foods, Inc., McDonald
43 1 0 Carbonaceous biochemical oxygen demand (5-day, ammonia nitrogen); Ammonia + unionized ammonia
Cave Springs Branch
No
MO0100218 Doe Run Co, West Fork, Reynolds
42 22 4 Copper; Zinc; Lead; Cadmium; Chronic toxicity (C. dubia); Total suspended solids
West Fork Black River
No
MO0000086 Doe Run/Viburnum Operations, Crawford
39 17 5 Lead; Cadmium; Zinc; Copper; Total suspended solids; pH; Chronic toxicity (C. dubia)
Indian Creek No
MO0098752 Anschutz - Madison Mine, Madison
39 27 13 Nickel; Acute toxicity (48-Hr C. dubia); Copper; Cobalt
Saline Cr. No
MO0000337 Buick Resource Recycling Facility, Dent
26 11 10 Lead; Cadmium; Total suspended solids; Acute toxicity (48-Hr P. promelas); pH; Acute toxicity (48-Hr C. dubia); Copper; Arsenic; Ammonia nitrogen; Zinc; Antimony
Crooked Creek No
MO0001856 Doe Run, Fletcher Mine/Mill, Reynolds
24 8 1 Lead; Zinc; Copper; Cadmium Bee Fork Yes
MO0001881 Doe Run Co. Sweetwater, Reynolds
21 8 2 Lead; Chronic toxicity (C. dubia); Cadmium; Total suspended solids; Zinc
Adair Creek No
MO0100226 Doe Run, Viburnum Mine #35 Casteel, Iron
21 7 1 Cadmium; Lead; Zinc; Total suspended solids; Chronic toxicity (C. dubia)
Crooked Creek No
MO0001180 SRG Global Inc. - Portageville, New Madrid
12 2 0 Total suspended solids; Cadmium; Chemical oxygen demand; pH
Portage Open Bay
No
MO0001121 Doe Run, Glover Facility, Iron
11 3 0 Thallium; E. coli; Cadmium; pH; Zinc Big Creek No
MO0002348 Eagle-Picher Technologies, LLC, Jasper
11 3 0 Cadmium; Zinc; Copper Turkey Creek No
ExCEEDANCES
Facility ID Facility name, county Total >100% permit
limit
>500% permit
limit
Types of exceedances Receiving Waterbody
Receiving Water
Impaired?
Continued from page 48
Continued on page 50

50 Troubled Waters
MONTANA
MT0000281 Western Sugar Cooperative, Yellowstone
56 37 21 Biochemical oxygen demand (5-day, 20 deg. C); Specific conductance; Ammonia nitrogen; E. coli (MTEC-MF); Fecal coliform
Yellowstone River
No
MT0023965 Western Energy Co - Rosebud Mine, Rosebud
3 3 3 Iron; Settleable solids Several Streams and Creeks
Yes
MT0000477 Exxonmobil Refining & Supply, Yellowstone
2 0 0 Biochemical oxygen demand (5-day, 20 deg. C); Sulfide
Yellowstone River
Yes
MT0000302 MDU - Lewis & Clark Plant, Richland
1 0 0 pH Yellowstone River
Yes
NEBRASKA
NE0111686 Western Sugar Cooperative, Scotts Bluff
67 49 25 Biochemical oxygen demand (5-day, 20 deg. C); Fecal coliform; Total suspended solids; Temp.; pH
North Platte River
No
NE0000795 Cargill Meats Solutions Corp., Colfax
19 0 0 Acute toxicity (C. dubia); Chloride; Nitrogen; Ammonia nitrogen
Shonka Ditch No
NE0032191 Farmland Foods Inc, Saline 8 3 0 Acute toxicity (C. dubia); pH; Ammonia nitrogen; Chlorine; Biochemical oxygen demand (5-day, 20 deg. C); Total suspended solids
Big Blue River No
NE0001392 Tyson Fresh Meats, Inc, Dakota
7 3 2 Fecal coliform; Chlorine; Ammonia nitrogen
Missouri River No
NE0000647 Behlen Manufacturing Company, Platte
5 4 4 Copper; Zinc Headwaters Lost Creek Subwatershed
No
NE0111287 Nucor Steel - Norfolk, Madison
4 0 0 Zinc Spring Creek No
NE0123501 Tyson Fresh Meats - Lexington, Dawson
4 1 0 Chloride; Fecal coliform Platte River No
NE0130141 Archer Daniels Midland Corn Division, Platte
4 0 0 Acute toxicity (C. dubia); Temp. Loup River No
NE0000060 Koch Fertilizer Beatrice, LLC, Gage
2 0 0 pH Big Blue River No
NE0000116 Nestle Purina Petcare Company, Saline
1 1 1 E. coli (MTEC-MF) Big Blue River No
NEVADA
NV0000060 Titanium Metals Corporation, Clark
44 1 0 pH; Ammonia nitrogen; Copper; Phosphorus
City of Henderson - Las Vegas Wash Subwatershed
No
ExCEEDANCES
Facility ID Facility name, county Total >100% permit
limit
>500% permit
limit
Types of exceedances Receiving Waterbody
Receiving Water
Impaired?
Continued on page 51
Continued from page 49

Appendices 51
NEW HAMPSHIRE
NH0090000 Pease Wastewater Treatment Facility, Rockingham
19 3 1 pH; Surfactants (MBAS); Fecal coliform; Chlorine; Total suspended solids; Biochemical oxygen demand (5-day, 20 deg. C)
Great Bay Yes
NH0100013 Berlin Pollution Control Facility, Coos
11 4 0 E. coli (thermotol, MF, MTEC); pH; Biochemical oxygen demand (5-day, % removal)
Androscoggin River
No
NH0022055 Envirosystems Incorporated, Rockingham
8 1 0 pH; Total suspended solids; Flow Taylor River No
NH0023361 Newington Power Facility, Rockingham
3 0 0 Total suspended solids; Priority pollutants
Piscataqua River
No
NH0000230 Monadnock Paper Mills, Inc., Hillsborough
1 0 0 pH Contoocook River
Yes
NH0001023 PCC Structurals Inc, Merrimack
1 0 0 Temp. Winnipesaukee River
No
NH0020338 Nextera Energy Seabrook LLC, Rockingham
1 0 0 Total residual oxidants Atlantic Ocean & Browns River
No
NEW MExICO
NM0020168 Aztec, City of - WWTP, San Juan
30 10 1 Phosphorus; Nitrogen; Total suspended solids; Solids, suspended percent removal
Animas River Yes
NM0020672 Gallup, City of, McKinley 12 3 3 Chlorine; E. coli; Whole effluent toxicity; Copper
Puerco River No
NM0028355 University of California, Los Alamos
3 2 0 Polychlorinated biphenyls (PCBs); pH Sandia Canyon, Rio Grande Basin
Yes
NM0022306 Chevron Mining Inc., Taos 2 1 0 Total suspended solids Red River; Rio Grande Basin
No
NM0020141 Los Alamos Pud-Bayo WWTP, Los Alamos
1 1 0 Chlorine Los Alamos Canyon Subwatershed
Yes
NEW YORK
NY0005037 Lafarge Ravena Plant, Albany
136 75 25 Settleable solids; Aluminum; Total suspended solids; pH; Temp. diff. between up/down stream deg. F; Chlorine; Dissolved oxygen
Coeyman’s Creek
No
NY0003042 Apc Paper of NY, St. Lawrence
53 18 1 Chronic toxicity (C. dubia); Biochemical oxygen demand (5-day, 20 deg. C); Oil & Grease; Chronic toxicity (P. promelas); Settleable solids
Raquette River No
ExCEEDANCES
Facility ID Facility name, county Total >100% permit
limit
>500% permit
limit
Types of exceedances Receiving Waterbody
Receiving Water
Impaired?
Continued from page 50
Continued on page 52

52 Troubled Waters
NY0000957 Knowlton Technologies, LLC, Jefferson
15 2 0 pH; Total suspended solids; Biochemical oxygen demand (5-day, 20 deg. C)
Black River Yes
NY0006912 Mohawk Fine Papers, Inc, Saratoga
12 1 0 Biochemical oxygen demand (5-day, 20 deg. C); Total suspended solids; pH
Mohawk River No
NY0008231 Roseton Generating Station, Orange
12 1 0 Vanadium; Temp.; Oil & grease; Iron; Temp. diff. between samp. & upstrm deg. F; Waste heat rejection rate; pH
Hudson River No
NY0200867 Fresh Kills Landfill LTP, Richmond
12 3 0 Total suspended solids; pH; Zinc; Oil & grease; Sulfide
Arthur Kill Yes
NY0000400 Life Technologies Corp, Erie 11 2 0 Carbonaceous biochemical oxygen demand (5-day, 20 deg. C); Surfactants (MBAS); Copper; Sulfite; Di[2-ethylhexyl] phthalate (DEHP)
Unnamed Tributary to Big Six Mile Creek
Yes
NY0001201 Islechem Business Center, Erie
11 4 1 Biochemical oxygen demand (5-day, 20 deg. C); Total suspended solids; Fecal coliform
Niagara River East Branch
No
NY0001643 Red-Rochester LLC @ Eastman Business Park, Monroe
11 7 6 Settleable solids; Octachlorodibenzo-p-dioxin; Lead
Genesee River No
NY0001732 Massena Operations, St. Lawrence
11 0 0 Chloroform; Settleable solids; Benzo[a]pyrene; PCB-1242; Fluoride; Aluminum; Fecal coliform
Grasse River No
NORTH CAROLINA
NC0004961 Riverbend Steam Station, Gaston
18 2 0 Hardness; Arsenic Catawba River No
NC0001881 Phillips Plating Company, Craven
9 3 0 Nickel; Chromium Mills Branch Yes
NC0003816 Cherry Point WWTP, Craven 8 3 1 Biochemical oxygen demand (5-day, 20 deg. C); Enterococci; Ammonia nitrogen; Chlorine; Total suspended solids
Mill Creek No
NC0000272 Canton Mill, Haywood 6 3 1 Fecal coliform; Total suspended solids; Biochemical oxygen demand (5-day, 20 deg. C)
Pigeon River; Bowen Branch
Yes
NC0007064 Brunswick Steam Electric Plant, Brunswick
6 0 0 Flow Frying Pan Shoals - Cape Fear River Subwatershed
No
NC0078344 Tarheel Plant, Bladen 6 1 1 Dissolved oxygen; Biochemical oxygen demand (5-day, 20 deg. C)
Lake Wheeler - Swift Creek Subwatershed
No
NC0003468 Dan River Combined Cycle, Rockingham
5 4 2 Iron; Fecal coliform Dan River Yes
NC0004812 Pharr Yarns Industrial WWTP, Gaston
5 1 0 pH; Biochemical oxygen demand (5-day, 20 deg. C); Fecal coliform
South Fork Catawba River
Yes
ExCEEDANCES
Facility ID Facility name, county Total >100% permit
limit
>500% permit
limit
Types of exceedances Receiving Waterbody
Receiving Water
Impaired?
Continued on page 53
Continued from page 51

Appendices 53
NC0006564 Baxter Healthcare Corporation, McDowell
5 4 3 Biochemical oxygen demand (5-day, 20 deg. C); Chem. Oxygen Demand; Fecal coliform
North Fork Catawba River
No
NC0001422 Sutton Steam Electric Plant, New Hanover
3 1 1 Oil & grease; Flow Indian Creek - Cape Fear River Watershed
No
NC0003191 New Bern Cellulose Fibers, Craven
3 0 0 Dissolved oxygen Neuse River No
NC0003719 Cedar Creek Site, Cumberland
3 2 0 Total suspended solids; Biochemical oxygen demand (5-day, 20 deg. C)
Cape Fear River No
NC0043320 Richmond Plant, Richmond 3 2 0 pH; Fecal coliform; Dissolved oxygen Hitchcock Creek
No
NORTH DAKOTA
ND0000248 Andeavor Refining Mandan, Morton
9 3 0 Total suspended solids; Biochemical oxygen demand (5-day, 20 deg. C); Sulfide; pH; Phenolic compounds, unchlorinated
Painted Woods-Square Butte
No
ND0000094 American Crystal Sugar Drayton, Pembina
5 4 3 Fecal coliform; Total suspended solids
Middle Red River
Yes
ND0024279 American Crystal Sugar Hillsboro, Traill
3 0 0 Total suspended solids Goose No
ND0024368 Minn Dak Farmers Cooperative, Richland
3 0 0 Chronic toxicity (7-day C. dubia); Chronic toxicity (7-day static renewal P. promelas)
Bois De Sioux Yes
ND0026000 Cargill Corn Milling (Progold), Richland
2 0 0 Biochemical oxygen demand (5-day, 20 deg. C)
Upper Red Yes
ND0000370 Minnkota Power Cooperative, Oliver
1 0 0 Total suspended solids Square Butte Creek
No
OHIO
OH0098540 Reserve Environmental Services, Ashtabula
157 68 23 Fecal coliform; Zinc; Total suspended solids; Nickel; Tot filterable residue (dried at 105 C); Mercury; Tin; Ammonia nitrogen; Cobalt; Barium; Carbonaceous biochemical oxygen demand (5-day, 20 deg. C); Vanadium; Chronic toxicity (C. dubia); pH
Lake Erie No
OH0001562 Republic Steel - Lorain Plant, Lorain
38 25 14 Chlorine; Mercury; Oil & grease; pH; Thermal discharge
Black River No
OH0003298 Campbell Soup Supply Co LLC, Henry
31 8 3 Ammonia nitrogen; Carbonaceous biochemical oxygen demand (5-day, 20 deg. C); Phosphorus; E. coli (MTEC-MF); Total suspended solids; pH; Dissolved oxygen
Maumee River No
ExCEEDANCES
Facility ID Facility name, county Total >100% permit
limit
>500% permit
limit
Types of exceedances Receiving Waterbody
Receiving Water
Impaired?
Continued from page 52
Continued on page 54

54 Troubled Waters
OH0004316 Dayton Power & Light Co JM Stuart Station, Brown
26 10 2 Chlorine; Mercury; Total residual oxidants; Total suspended solids; Ammonia nitrogen; pH; Zinc
Little Threemile Creek
No
OH0029149 Gabriel Performance Products LLC, Ashtabula
23 10 2 Biochemical oxygen demand (5-day, 20 deg. C); Total suspended solids; Carbon tetrachloride; pH; Zinc; Mercury; Fecal coliform
Fields Brook No
OH0006092 Fluor - B&W Portsmouth LLC, Pike
19 4 0 Temp.; pH; E. coli (MTEC-MF); Mercury; Chlorine; Copper; Carbonaceous biochemical oxygen demand (5-day, 20 deg. C)
Little Beaver Creek and Scioto River
No
OH0122271 Worthington Steel Co, Fulton
18 3 0 Acute toxicity (C. dubia); Dissolved oxygen; Chlorine; Copper; Acute toxicity (P. promelas)
Maumee River No
OH0005487 Case Farms of Ohio - Winesburg Rendering Plant, Holmes
17 2 0 Chlorine; E. coli (MTEC-MF); Total suspended solids; Ammonia nitrogen; pH; Fecal coliform
Indian Trail Creek
No
OH0007391 Altivia Petrochemicals LLC, Scioto
16 5 4 Copper; Oil & grease; E. coli (MTEC-MF); Phenol; Biochemical oxygen demand (5-day, 20 deg. C)
Ohio River Yes
OH0011550 Hannibal Development Partners, Monroe
16 4 0 Cyanide (free-water plus wastewaters); Total suspended solids; pH; Copper; Fecal coliform
Ohio River Yes
OKLAHOMA
OK0035149 Grand River Dam Auth- Chouteau, Mayes
18 2 0 Iron; Total suspended solids; pH; Total residual oxidants
Neosho River Yes
OK0040827 Kimberly-Clark Corp-Jenks Fac, Tulsa
16 4 0 Total suspended solids; Whole effluent toxicity; pH
Posey Creek Yes
OK0000809 Tinker AFB, Oklahoma 14 6 2 Cadmium; Copper; Zinc; pH; Total suspended solids; Chlorine; Chem. oxygen demand
Soldier Creek Yes
OK0000825 Wynnewood Refining Company, Garvin
13 6 1 Biochemical oxygen demand (5-day, 20 deg. C); Lead; Chem. oxygen demand
Washita River No
OK0000876 Hollyfrontier Tulsa Refining LLC (West), Tulsa
13 0 0 pH; Whole effluent toxicity Arkansas River Yes
OK0038849 Heavener UA-Industrial WTP, Le Flore
11 0 0 Oil & grease; Ammonia nitrogen; Carbonaceous biochemical oxygen demand (5-day, 20 deg. C); Total suspended solids
Morris Creek No
OK0044504 CP Kelco US, Inc.-Okmulgee, Okmulgee
8 3 1 Flow; Carbonaceous biochemical oxygen demand (5-day, 20 deg. C); Whole effluent toxicity
Deep Fork of Canadian River
No
OK0000744 International Paper Co. - Valliant, McCurtain
7 5 0 E. coli Clear Creek No
OK0000442 Okla Gas & Elec -Horseshoe Lk, Oklahoma
6 0 0 Copper; Total suspended solids North Canadian River & Horseshoe Lake
No
ExCEEDANCES
Facility ID Facility name, county Total >100% permit
limit
>500% permit
limit
Types of exceedances Receiving Waterbody
Receiving Water
Impaired?
Continued on page 55
Continued from page 53

Appendices 55
OK0000256 Phillips 66 Company-Ponca City Refinery, Kay
5 1 1 Oil & grease; pH Arkansas River No
OK0001295 Valero Ardmore Refinery, Carter
5 2 1 Biochemical oxygen demand (5-day, 20 deg. C); Total suspended solids
Sand Creek No
OK0036161 Terra International (Oklahoma) Inc-Woodward, Woodward
5 2 0 Carbonaceous biochemical oxygen demand (5-day, 20 deg. C); Dissolved oxygen
North Canadian River
No
OREGON
OR0000141 Tillamook Creamery, Tillamook
9 3 0 Total suspended solids; Biochemical oxygen demand (5-day, 20 deg. C); E. coli
Wilson River No
OR0000787 West Linn Paper Company, Clackamas
8 0 0 Turbidity; pH; pH Willamette River
No
OR0001635 Dyno Nobel Inc., Columbia 2 0 0 Temp. Columbia River No
OR0000795 Georgia -Pacific - Wauna Mill, Clatsop
1 0 0 pH Columbia River No
OR0001708 The Dalles Cast, Wasco 1 0 0 Aluminum Columbia River No
OR0002402 Kraft Heinz Foods Company, Malheur
1 0 0 pH Snake River No
OR0020834 St. Helens STP/Boise Cascade, Columbia
1 1 0 E. coli Columbia River No
PENNSYLVANIA
PA0054186 Sci Graterford STP, Montgomery
80 45 7 Ammonia nitrogen; Iron; Total suspended solids; Fecal coliform
Unnamed Tributary to Perkiomen Creek
No
PA0000507 Eastman Chemical Resins Inc, Allegheny
72 36 10 Zinc; Aluminum; Total nitrite + nitrate; Styrene; Xylene (mix of m+o+p)
Monongahela River
No
PA0002674 Amer Ref Group Bradford, McKean
36 16 0 Benzo[a]anthracene; pH; Biochemical oxygen demand (5-day, 20 deg. C); Oil & grease; Benzo[a]pyrene; Total suspended solids; Sulfide; Benzo[k]fluoranthene; Dibenz[a,h]anthracene; Fecal coliform
Tunungwant Creek
Yes
PA0012637 Trainer Refinery, Delaware 34 5 0 Carbonaceous biochemical oxygen demand (20-day, % removal); Total suspended solids; Phenolics; Temp.; Total dissolved solids; Biochemical oxygen demand (5-day, 20 deg. C); pH; Carbonaceous biochemical oxygen demand (20-day, 20 deg C); Organic carbon
Stoney Creek No
ExCEEDANCES
Facility ID Facility name, county Total >100% permit
limit
>500% permit
limit
Types of exceedances Receiving Waterbody
Receiving Water
Impaired?
Continued from page 54
Continued on page 56

56 Troubled Waters
PA0027715 Max Env Tech Inc Yukon Fac, Westmoreland
23 1 0 Phenolics; Total suspended solids; Ammonia nitrogen; Carbonaceous biochemical oxygen demand (5-day, 20 deg. C)
Sewickley Creek
No
PA0002941 Hatfields Ferry Power Sta, Fayette
21 8 2 Total dissolved solids; Cadmium; Manganese
Monongahela River
No
PA0000566 Leetsdale Plt, Allegheny 20 8 0 pH; Copper Big Sewickley Creek
No
PA0008869 P H Glatfelter, York 20 8 0 Temp. diff. between samp. & upstrm deg. F; Temp.; Biochemical oxygen demand (5-day, 20 deg. C); 2,3,7,8-Tetrachlorodibenzo-p-dioxin
Codorus Creek Yes
PA0013463 U.S. Steel Fairless Hills Facility, Bucks
20 5 1 Biochemical oxygen demand (5-day, % removal); Biochemical oxygen demand (5-day, 20 deg. C); Carbonaceous biochemical oxygen demand (20-day, 20 deg C); pH
Delaware River Yes
PA0044326 Max Env Tech Inc, Washington
17 6 0 Aluminum; Oil & grease; Nickel; Total suspended solids
Racoon Creek, Little Racoon Run
Yes
RHODE ISLAND
RI0000191 Kenyon Industries, Inc, Washington
12 5 1 Chromium; Aluminum; Phenols; pH Pawcatuck River
Yes
SOUTH CAROLINA
SC0003441 Sun Chemical Corp/Bushy Park, Berkeley
22 3 0 Total suspended solids; Ultimate oxygen demand; Biochemical oxygen demand (5-day, 20 deg. C); Dissolved oxygen
Cooper River No
SC0003042 Sonoco Products/Hartsville, Darlington
16 0 0 Biochemical oxygen demand (5-day, 20 deg. C); Total suspended solids; Temp.
Black Creek No
SC0001180 Si Group Inc/Orangeburg, Orangeburg
9 3 0 Biochemical oxygen demand (5-day, 20 deg. C); Fecal coliform
Edisto River No
SC0000353 Sage Auto Interiors/Abbeville, Abbeville
5 1 0 Chronic toxicity (7-day C. dubia); Copper
Blue Hill Creek No
SC0000795 Pilgrims Pride Corp/Sumter Sc Proc Plt, Sumter
5 1 0 Chronic toxicity (7-day C. dubia); Total suspended solids; Fecal coliform
Pocotaligo River
No
SC0048950 Dupont/Cooper River Plant, Berkeley
5 1 0 Acute toxicity (48-Hr C. dubia); Biochemical oxygen demand (5-day, 20 deg. C); Total suspended solids
Cooper River No
SC0000477 Milliken/Pendleton Plant, Anderson
4 0 0 Biochemical oxygen demand (5-day, 20 deg. C)
Eighteen Mile Creek; Lake Hartwell
No
ExCEEDANCES
Facility ID Facility name, county Total >100%permit
limit
>500%permit
limit
Types of exceedances Receiving Waterbody
Receiving Water
Impaired?
Continued on page 57
Continued from page 55

Appendices 57
SC0028584 BP Amoco Chemicals Cooper Rive, Berkeley
4 0 0 Ultimate oxygen demand; Biochemical oxygen demand (5-day, 20 deg. C)
Cooper River No
SC0038229 Celanese Ltd/Enoree Plant, Spartanburg
4 4 0 Biochemical oxygen demand (5-day, 20 deg. C)
Enoree River No
SC0000868 International Paper/Georgetown, Georgetown
3 0 0 Duration of discharge; Time Sampit River to Winyah Bay
No
SC0001759 Kapstone Charleston Kraft LLC, Charleston
3 0 0 Ultimate oxygen demand Cooper River No
SC0003191 Milliken/Enterprise Plant, Greenville
3 0 0 E. coli South Saluda River
No
SC0003883 Scgenco/A M Williams Station, Berkeley
3 0 0 Total suspended solids; pH Cooper River No
SC0036111 3V Inc, Georgetown 3 0 0 Total suspended solids; Biochemical oxygen demand (5-day, 20 deg. C)
Sampit River No
SOUTH DAKOTA
SD0000281 USAF - Ellsworth AFB, Meade
2 0 0 Floating solids, waste or visible foam-visual
Box Elder Creek; Elk Creek
No
TENNESSEE
TN0068187 Lowland Industrial Complex, Inc. & Waste Industries of Morristown, Hamblen
38 18 4 Ammonia nitrogen; Chloroform; Phenol
Nolicyhucky River
No
TN0003671 Bae Systems Ordnance Systems Inc. Holston Army Ammunition Plant, Sullivan
27 5 1 Biochemical oxygen demand (5-day, 20 deg. C); RDX, total; Total suspended solids; Ammonia nitrogen
Holston River Yes
TN0004227 Nyrstar Tennessee Mines - Gordonsville, LLC (Elmwood Mine), Smith
20 5 0 Total suspended solids; Zinc Caney Fork No
TN0002941 USDOE-ORNL, Roane 10 3 0 Carbonaceous biochemical oxygen demand (5-day, 20 deg. C); E. coli (MTEC-MF); Ammonia nitrogen
Tributary to Melton Branch
Yes
TN0067415 Cytec Industries Inc, Maury 4 1 0 Phosphorus Big Bigby Creek Yes
TN0002844 Kordsa Inc., Hamilton 3 0 0 Ammonia nitrogen; Total suspended solids
Tennessee River Yes
TN0061468 Nyrstar Tennessee Mines-Strawberry Plains, Jefferson
3 0 0 Chronic toxicity (7-day C. dubia) Hodges Lake No
TN0001465 The Chemours Company Fc LLC - Johnsonville Plant / Occidental Chemical Corp., Humphreys
2 0 0 pH Kentucky Lake No
ExCEEDANCES
Facility ID Facility name, county Total >100% permit
limit
>500% permit
limit
Types of exceedances Receiving Waterbody
Receiving Water
Impaired?
Continued from page 56
Continued on page 58

58 Troubled Waters
TN0001732 Coy Mine, Jefferson 2 0 0 Total suspended solids Mossy Creek Yes
TN0002968 USDOE-Oak Ridge Y12 Plt, Anderson
2 2 2 Chlorine Oxier Creek Yes
TN0003751 Arnold Engineering Development Complex, Coffee
2 0 0 pH; Dissolved oxygen Crumpton Creek Subwatershed
No
TExAS
TX0134694 Buckeye Texas Processing LLC, Nueces
66 42 5 Flow; Total suspended solids; pH; Biochemical oxygen demand (5-day, 20 deg. C); Oil & grease; Organic Carbon
Corpus Christi Inner Harbor
No
TX0005070 Huntsman Petrochemical LLC, Huntsman International Fuels LLC, Huntsman Propylene, Jefferson
57 16 2 Dissolved oxygen; pH; Carbonaceous biochemical oxygen demand (5-day, 20 deg. C); Ammonia nitrogen; Zinc; Total suspended solids; Copper; Organic carbon; Flow
Via Plant Conduits and Drainage Ditch
No
TX0132802 Donna, City of, Hidalgo 57 8 2 Carbonaceous biochemical oxygen demand (5-day, 20 deg. C); E. coli; Flow; Chlorine; Dissolved oxygen; Ammonia nitrogen
Llano Grande Lake - Arroyo Colorado Subwatershed
No
TX0119792 Equistar Chemicals, LP And Lyondellbasell Acetyls, LLC, Harris
41 7 0 Biochemical oxygen demand (5-day, 20 deg. C); Total suspended solids; E. coli; Ammonia nitrogen; Copper; Oil & grease; Aluminum; Chlorine; Flow
Unnamed Ditch, San Jacinto Bay
Yes
TX0102326 Enterprise Products Operating, Chambers
40 12 6 Total suspended solids; Organic carbon; pH, > 60 minutes; pH (monthly accum); Oil & grease; Flow; pH; Copper; Aluminum; Zinc; Chloroform
Unnamed Tributary of Cedar Bayou
No
TX0003891 Westrock Texas, LP, Jasper 32 28 22 E. coli; Total suspended solids; Enterococci; Flow
Neches River No
TX0105481 Markwest Javelina Company LLC, Nueces
29 4 0 Copper; Zinc; Total suspended solids; Sulfide
Unnamed Drainage Ditch
No
TX0004669 Lucite International, Inc., Jefferson
27 8 1 Copper; Chem. oxygen demand; Zinc; Total suspended solids; pH; Biochemical oxygen demand (5-day, 20 deg. C); E. coli
Neches River Basin
No
TX0007421 Total Petrochemicals & Refining USA Inc, Harris
26 2 1 Flow; Enterococci; Total suspended solids; Biochemical oxygen demand (5-day, 20 deg. C); Temp.
Tucker Bayou Yes
TX0004863 Shell Oil Company, Harris 24 4 1 Biochemical oxygen demand (5-day, 20 deg. C); Enterococci; Nickel; Oil & grease; Calcium
Patrick Bayou Yes
ExCEEDANCES
Facility ID Facility name, county Total >100% permit
limit
>500% permit
limit
Types of exceedances Receiving Waterbody
Receiving Water
Impaired?
Continued on page 59
Continued from page 57

Appendices 59
UTAH
UT0020222 Moroni Feed, Sanpete 30 5 2 Ammonia nitrogen; Acute toxicity (48-Hr C. dubia); Biochemical oxygen demand (5-day, 20 deg. C); Acute toxicity (96-Hr P. promelas); Dissolved oxygen
San Pitch River and Rock Dam Irrigation Canal
No
UT0000175 Chevron USA, Inc., Salt Lake 5 1 0 Biochemical oxygen demand (5-day, 20 deg. C); Chem. oxygen demand
Oil Drain Canal to The Great Salt Lake
Yes
UT0000051 Kennecott Utah Copper, LLC, Salt Lake
3 3 3 Flow Butterfield Creek
No
UT0000281 Swift Beef Company, Cache 3 0 0 Total dissolved solids; Fecal coliform; Total suspended solids
Hyrum Slough No
UT0000361 Anderson Geneva Development, Utah
2 0 0 Total dissolved solids Utah Lake Yes
UT0023540 Canyon Fuel Co., LLC - Skyline, Carbon
1 0 0 Total suspended solids Eccles Creek to Price River
No
VERMONT
VT0000469 Rock-Tenn, Franklin 2 0 0 Turbidity Missisquoi River No
VIRGINIA
VA0003077 Dupont Teijin Films, Chesterfield
10 2 1 Total suspended solids; Biochemical oxygen demand (5-day, 20 deg. C); Carbonaceous biochemical oxygen demand (5-day, 20 deg. C)
James River; Turkey Island Creek; Fourmile Creek
No
VA0000248 US Army - Radford Army Ammunition Plant, Montgomery
9 0 0 Total suspended solids; pH; Biochemical oxygen demand (5-day, 20 deg. C)
Stroubles Creek No
VA0001589 Res Dba Steel Dynamics Roanoke Bar Division, Roanoke
5 2 0 Total suspended solids; Length of longest pH excursion
Roanoke River; Mason Creek
No
VA0003433 Solenis LLC, Southampton 4 1 0 Temp.; Biochemical oxygen demand (5-day, 20 deg. C); Toxicity
Lower Nottoway River; Mill Creek
No
VA0004804 Huntington Ingalls Incorporated - NN Shipbldg Div, Newport News
4 0 0 pH; Total suspended solids; Temp.; Chlorine
James River; Pagan River; Warwick River; Chuckatuck Creek
No
VA0005291 Advansix Resins & Chemicals LLC, Chesterfield
4 0 0 pH; Organic carbon James River; Powell Creek; West Run; Bailey Creek
No
ExCEEDANCES
Facility ID Facility name, county Total >100% permit
limit
>500% permit
limit
Types of exceedances Receiving Waterbody
Receiving Water
Impaired?
Continued from page 58
Continued on page 60

60 Troubled Waters
VA0081264 HRSD - Chesapeake-Elizabeth Sewage Treatment Plant, Virginia Beach
4 0 0 Biochemical oxygen demand (5-day, 20 deg. C); Total suspended solids
Chesapeake Bay; Back River; Poquoson River
No
VA0001015 American Electric Power - Clinch River Plant, Russell
3 0 0 Copper; Iron; Chloride Clinch River; Little Stony Creek
No
VA0005312 Advansix Resins and Chemicals LLC - Chesterfield, Chesterfield
3 3 1 Organic carbon James River; Turkey Island Creek; Fourmile Creek
No
VA0000299 Celanese Acetate LLC, Giles 2 0 0 pH New River; East River
No
VA0002160 Invista - Waynesboro, Waynesboro
2 2 2 Oil & grease Lower South River
No
VA0003026 Gp Big Island LLC, Bedford 2 0 0 pH James River; Reed Creek
No
VA0003646 Westrock Virginia Corporation - Covington, Alleghany
2 0 0 Chronic toxicity (7-day C. dubia); Biochemical oxygen demand (5-day, 20 deg. C)
Jackson River; Falling Spring Creek
No
VA0003808 Perdue Foods LLC - Accomack, Accomack
2 2 0 Fecal coliform Metomkin Bay; Burtons Bay
No
VA0004090 Surry Power Station and Gravel Neck, Surry
2 2 0 Biochemical oxygen demand (5-day, 20 deg. C)
James River; Powhatan Creek; Grays Creek; College Run
No
VA0004669 E I Du Pont De Nemours And Company - Spruance Plt, Chesterfield
2 0 0 Carbonaceous biochemical oxygen demand (5-day, 20 deg. C)
James River; Falling Creek; Proctors Creek
No
VA0004677 Mohawk Industries Inc, Rockbridge
2 0 0 Total suspended solids; Sulfide Lower Maury River; Poague Run
No
VA0006408 Greif Riverville LLC - Fibre Plant, Amherst
2 0 0 Biochemical oxygen demand (5-day, 20 deg. C)
James River; Beaver Creek; Back Creek
No
VA0024724 Virginia American Water Prince William - Section 1, Prince William
2 0 0 Phosphorus Potomac River; Lower Occoquan River; Neabsco Creek
No
VA0083135 Farmville Advanced WWTP, Prince Edward
2 1 0 Total suspended solids Upper Appomattox River
No
VA0090263 Town of Broadway Regional WWTF, Rockingham
2 0 0 Chronic toxicity (7-day C. dubia); Nitrogen
North Fork Shenandoah River; Holmans Creek
No
ExCEEDANCES
Facility ID Facility name, county Total >100% permit
limit
>500% permit
limit
Types of exceedances Receiving Waterbody
Receiving Water
Impaired?
Continued on page 61
Continued from page 59

Appendices 61
ExCEEDANCES
Facility ID Facility name, county Total >100% permit
limit
>500% permit
limit
Types of exceedances Receiving Waterbody
Receiving Water
Impaired?
VA0090905 Tenaska Virginia Generating Station, Albemarle
2 0 0 pH Lower Rivanna River; Ballinger Creek
No
WASHINGTON
WA0000809 Cosmo Specialty Fibers, Inc., Grays Harbor
8 1 0 Daily excursion time; Biochemical oxygen demand (5-day, 20 deg. C); Total suspended solids
Chehalis River No
WA0002062 Us Navy - Puget Sound Naval Shipyard, Kitsap
8 4 0 Copper Sinclair Inlet No
WA0000124 Nippon Dynawave Packaging Company Longview, Cowlitz
7 1 0 Total suspended solids; Biochemical oxygen demand (5-day, 20 deg. C)
Columbia River No
WA0021954 Joint Base Lewis-McChord - JBLM Solo Point WWTP, Pierce
6 1 1 Chlorine; Biochemical oxygen demand (5-day, % removal); pH
Puget Sound No
WA0037338 Transalta Centralia Mining LLC, Lewis
5 0 0 Total suspended solids; Dissolved oxygen; pH; Temp.
Packwood Creek; Snyder Creek
No
WA0000825 Inland Empire Paper Co, Spokane
3 0 0 Biochemical oxygen demand (5-day, 20 deg. C)
Spokane River No
WA0000922 Port Townsend Paper Corporation, Jefferson
3 0 0 Biochemical oxygen demand (5-day, 20 deg. C); Total suspended solids
Puget Sound Subwatershed
No
WA0002984 Phillips 66 Company Ferndale Refinery, Whatcom
3 0 0 Fecal coliform; Sulfide Lummi Bay No
WA0000078 Longview Fibre Paper & Packaging, Inc. (DBA Kapstone Kraft Paper), Cowlitz
2 0 0 Biochemical oxygen demand (5-day, 20 deg. C)
Columbia River No
WA0000761 Tesoro Refining & Marketing Company LLC, Skagit
2 2 2 Fecal coliform Fidalgo Island - Frontal Padilla Bay Subwatershed
No
WA0000884 Sonoco Products Company, Pierce
2 1 0 Total suspended solids; Ammonia nitrogen
White River No
WA0002925 McKinley Paper Company, Clallam
2 2 1 Duration Discovery Bay - Strait of Juan De Fuca Subwatershed
No
WA0002941 Shell Oil Products Us Puget Sound Refining Company, Skagit
2 1 0 Fecal coliform Padilla Bay - Strait of Georgia Subwatershed
No
WA0040851 Steelscape Washington LLC, Cowlitz
2 0 0 Nickel Columbia River No
Continued from page 60
Continued on page 62

62 Troubled Waters
WEST VIRGINIA
WV0004707 Anmoore Facility, Harrison 56 24 2 Temp.; Iron; Chloride; Iron; Total suspended solids; Oil & grease; pH
Anmoore Run No
WV0004511 Beech Bottom Plant, Brooke 52 28 9 Copper; Zinc; Phenolics; Chloride; Acute Toxicity (C. dubia); Iron; Lead; Aluminum; Manganese
Ohio River Yes
WV0004359 Natrium Plant, Marshall 51 38 17 .alpha.-BHC; Mercury; Copper; .beta.-BHC; Chloroform; Iron; pH, > 60 minutes; Chloride
Ohio River Yes
WV0000787 Cytec Industries, Inc., Pleasants
38 15 1 Chronic toxicity (P. promelas); Temp.; Aluminum; Toluene; Chronic toxicity (C. dubia); Color [PT-CO units]; Nitrite
Ohio River Yes
WV0023230 Wheeling City Of, Ohio 27 6 0 Fecal coliform; Total suspended solids; Mercury; Copper; Chlorine; Solids, suspended percent removal, dry; Biochemical oxygen demand (5-day, 20 deg. C); Biochemical oxygen demand (5-day % removal, dry)
Ohio River Yes
WV0005339 Harrison Power Station, Harrison
23 16 10 Zinc; Iron; Aluminum West Fork River Yes
WV0004499 Ak Steel Corp, Brooke 18 10 1 Selenium; Fecal coliform Ohio River Yes
WV0004740 Addivant USA LLC-North Plant Operations, Monongalia
16 7 2 1,2-Dichloroethane; pH; Iron; Biochemical oxygen demand (5-day, 20 deg. C); Aluminum; Total suspended solids
Monongahela River
Yes
WV0004502 Wheeling-Nisshin Inc, Brooke
14 7 4 Acute toxicity (C. dubia); Oil & grease; Lead; Total suspended solids; pH
Ohio River Yes
WV0000086 Institute Plant, Kanawha 13 6 1 Zinc; pH (monthly accum); Methyl chloride; pH, > 60 minutes; Cadmium; Total suspended solids; Temp.
Kanawha River Yes
WISCONSIN
WI0037842 Neenah Paper Inc Neenah Mill, Winnebago
5 0 0 Copper Fox River Via Neenah
No
WI0001040 Tyco Safety Products - Ansul, Marinette
4 1 0 Arsenic; pH; Total suspended solids Menomonee River
No
WI0000531 St Paper LLC, Oconto 3 0 0 Total suspended solids; Biochemical oxygen demand (5-day, 20 deg. C)
Oconto River No
WI0042765 WI Public Serv Corp Weston 3, Marathon
3 3 3 Chlorine (dsg. time); Chlorine Wisconsin River Yes
WI0000931 Wisconsin Electric Power Company Valley Power Plant, Milwaukee
2 2 2 Chlorine Menomonee Canal
No
ExCEEDANCES
Facility ID Facility name, county Total >100% permit
limit
>500% permit
limit
Types of exceedances Receiving Waterbody
Receiving Water
Impaired?
Continued on page 63
Continued from page 61

Appendices 63
WI0001848 Georgia-Pacific Consumer Products, Brown
2 0 0 Copper Fox River No
WI0037991 Newpage Corporation - Water Quality Center, Wood
2 1 0 Copper Wisconsin River Yes
WI0000957 Nextera Energy Point Beach LLC, Manitowoc
1 0 0 Total suspended solids Lake Michigan Yes
WI0000973 Green Bay Packaging Inc Mill D, Brown
1 0 0 Mercury Fox River No
WI0003026 Expera Specialty Solutions, LLC-Rhinelander, Oneida
1 0 0 pH, > 60 minutes Wisconsin River Yes
WI0003085 Calumet Superior LLC, Douglas
1 0 0 Mercury Allouez Bay Yes
WI0003239 Dairyland Power Cooperative Genoa, Vernon
1 1 1 Total suspended solids Mississippi River
No
WI0003468 Verso Minnesota Wisconsin LLC - Water Renewal Center, Portage
1 0 0 pH Wisconsin River Yes
WI0003620 Domtar - Nekoosa, Wood 1 0 0 Temp. Wisconsin River Yes
WI0003671 Expera Specialty Solutions, LLC-Mosinee, Marathon
1 0 0 Temp. Wisconsin River Yes
WYOMING
WY0000418 Lovell Plant, Big Horn 12 9 8 E. coli; Flow; Temp.; Biochemical oxygen demand (5-day, 20 deg. C)
Peterson Creek - Shoshone River Subwatershed
No
WY0000442 Frontier Oil Refinery, Laramie
12 7 1 Ammonia nitrogen; Aluminum; Iron; Lead; Sulfide; Selenium
Diamond Creek - Crow Creek Subwatershed
Yes
WY0003115 Dave Johnston Power Plant, Converse
4 0 0 Iron; Total suspended solids North Platte River
No
ExCEEDANCES
Facility ID Facility name, county Total >100% permit
limit
>500% permit
limit
Types of exceedances Receiving Waterbody
Receiving Water
Impaired?
Continued from page 62

64 Troubled Waters
1. This analysis excludes the state of New Jersey be-
cause its data are not in the federal Integrated Compliance
Information System database.
2. The annual number of non-compliant facilities was
found by adding non-compliant minor facilities and non-
compliant major facilities for each year, then averaging the
total, and the annual number of EPA and state enforcement
actions was found by adding EPA formal actions, EPA infor-
mal actions, state formal actions and state informal actions
for each year, then averaging the total. Data downloaded
from the EPA ECHO State Water Dashboard, accessed 21
February 2018 at https://echo.epa.gov/trends/compara-
tive-maps-dashboards/state-water-dashboard .
3. Data downloaded from the EPA ECHO State Water
Dashboard, accessed 3 February 2018 at https://echo.epa.
gov/trends/comparative-maps-dashboards/state-water-
dashboard .
4. U.S. Environmental Protection Agency, FY 2019 EPA
Budget in Brief, February 2018, available at https://www.
epa.gov/sites/production/files/2017-05/documents/fy-
2018-budget-in-brief.pdf, 83.
5. 2018 proposal: U.S. Environmental Protection
Agency, FY 2018 EPA Budget in Brief, May 2017, available
at https://www.epa.gov/sites/production/files/2017-05/
documents/fy-2018-budget-in-brief.pdf, 69; allotment in
prior years: downloaded from U.S. Environmental Protec-
tion Agency, Water Pollution Control (Section 106) Grants
Funding History, accessed 3 February 2018 at https://www.
epa.gov/water-pollution-control-section-106-grants/water-
pollution-control-section-106-grants-funding.
6. Zygmunt J.B. Plater et al., Environmental Law and
Policy: Nature, Law and Society (5th edition), (New York, NY:
Wolters Kluwer, 2006).
7. Damages estimate: Jonathan H. Adler, Case Western
Reserve University School of Law, Fables of the Cuyahoga:
Reconstructing a History of Environmental Protection, 2002;
Dollars inflation adjustment: Saving.org, Value of $1 in 1969,
accessed 28 February 2018, archived at http://web.archive.
org/web/20180301035250/https://www.saving.org/infla-
tion/inflation.php?amount=1&year=1969; Local papers: Jen-
nifer Latson, “The Burning River That Sparked a Revolution,”
Time Magazine, 22 June 2015.
8. Fire chief quote: Tony Long, “June 22, 1969: Umm, The
Cuyahoga River’s on Fire… Again,” Wired Magazine, 22 June
2011; Under control within 30 minutes: “Oil Slick Fire Dam-
ages 2 Rivers Spans,” Cleveland Plain Dealer, 23 June 1969,
archived at http://web.archive.org/web/20180301035414/
http://blog.cleveland.com/pdextra/2009/01/oil_slick_fire_
damages_2_river.html.
9. Jonathan H. Adler, “The Fable of the Burning River, 45
Years Later,” The Washington Post, 22 June 2014.
10. “America’s Sewage System and the Price of Opti-
mism,” Time Magazine, 1 August 1969, archived at http://
web.archive.org/web/20180301035527/https://content.time.
com/time/subscriber/article/0,33009,901182-1,00.html .
11. GovTrack, To Override the Presidential Veto of S. 2770
Proposed Federal Water Pollution Control Act Amendments
of 1972, accessed 15 February 2018, archived at http://web.
archive.org/web/20180215163136/https://www.govtrack.
us/congress/votes/92-1972/s955.
Notes

Notes 65
12. 111th U.S. Congress, Report 111-361: Clean Water
Restoration Act, 10 December 2010, archived at http://web.
archive.org/web/20180301035710/https://www.congress.
gov/111/crpt/srpt361/CRPT-111srpt361.pdf.
13 . Federal Water Pollution Control Act [as Amended
through P.L. 107-303], 33 U.S.C. 1251, 27 November 2002,
archived at http://web.archive.org/web/20180301035744/
https://www.epa.gov/sites/production/files/2017-08/docu-
ments/federal-water-pollution-control-act-508full.pdf .
14. U.S. Environmental Protection Agency, Clean
Water Act Section 404 and Agriculture, 20 November 2017,
archived at http://web.archive.org/web/20180221175356/
https://www.epa.gov/cwa-404/clean-water-act-section-
404-and-agriculture .
15. Scott Pruitt: Alex Guillen and Emily Holden, “What
EPA Chief Scott Pruitt Promised – and What He’s Done”,
Politico, 19 November 2017, archived at http://web.archive.
org/web/20180301035950/https://www.politico.com/
interactives/2017/scott-pruitt-promises/; EPA budget cuts:
U.S. Environmental Protection Agency, FY 2018 EPA Budget
in Brief, May 2017, available at https://www.epa.gov/sites/
production/files/2017-05/documents/fy-2018-budget-in-
brief.pdf; Ongoing repeal of 2015 Clean Water Rule: Ariel
Wittenberg, “Worried about High Court, Trump Admin
Wants to Delay WOTUS,” E&E Newswire, 6 November 2017,
archived at http://web.archive.org/web/20180301040200/
https://www.eenews.net/stories/1060065765/.
16. U.S. Environmental Protection Agency, NPDES Per-
mit Basics, accessed 2 December 2017, archived at https://
web.archive.org/web/20171113113100/https://www.epa.
gov/npdes/npdes-permit-basics .
17. Ibid.
18. Ibid.
19. Ibid.
20. U.S. Environmental Protection Agency, Clean
Water Act (CWA) Compliance Monitoring, accessed on
2 December 2017, archived at https://web.archive.org/
web/20171201163857/https://www.epa.gov/compliance/
clean-water-act-cwa-compliance-monitoring .
21. U.S. Environmental Protection Agency, NPDES
Permit Writers’ Manual, September 2010, archived at
http://web.archive.org/web/20180301040554/https://
www.epa.gov/sites/production/files/2015-09/documents/
pwm_2010.pdf .
22. Ibid.
23. U.S. Environmental Protection Agency website, NP-
DES State Program Information, accessed 2 December 2017,
archived at https://web.archive.org/web/20171119174753/
https://www.epa.gov/npdes/npdes-state-program-infor-
mation .
24. Ibid.
25. Robert Esworthy, Congressional Research Ser-
vice, Federal Pollution Control Laws: How Are They En-
forced? 7 October 2014, archived at http://web.archive.
org/web/20180301040406/https://fas.org/sgp/crs/misc/
RL34384.pdf.
26. See note 23.
27. Ibid.
28. Ibid.
29. Ibid.
30. U.S. Environmental Protection Agency, NPDES Per-
mit Limits, accessed 2 December 2017, archived at https://
web.archive.org/web/20171018045737/https://www.epa.
gov/npdes/npdes-permit-limits .
31. Ibid.
32. Ibid.
33. See note 21.
34. Ibid.
35. Ibid.

66 Troubled Waters
36. U.S. Government Accountability Office, Clean
Water Act: Changes Needed if Key EPA Program Is to
Help Fulfill the Nation’s Water Quality Goals, 5 De-
cember 2013, archived at https://web.archive.org/
web/20171013120048/https://www.gao.gov/products/
GAO-14-80 .
37. Ibid.
38. U.S. Environmental Protection Agency, ICIS-
NPDES Download Summary and Data Element Diction-
ary, accessed 2 December 2017, archived at https://web.
archive.org/web/20170514072343/https://echo.epa.gov/
tools/data-downloads/icis-npdes-download-summary .
39. U.S. Environmental Protection Agency, CWA-NP-
DES Electronic Reporting, accessed 2 December 2017, ar-
chived at https://web.archive.org/web/20171201184729/
https://www.epa.gov/compliance/npdes-ereporting.
40. Ibid.
41. Ibid.
42. See note 38.
43. Ibid.
44. Ibid.
45. Christy Leavitt, U.S. PIRG Education Fund,
Troubled Waters: An Analysis of 2005 Clean Water Act
Compliance, October 2007.
46. U.S. Environmental Protection Agency, Single
Event Violation Data Entry Guide for ICIS-NPDES, 15 Octo-
ber 2008, available at https://www.epa.gov/sites/produc-
tion/files/2013-11/documents/npdes-sevguidance.pdf .
47. U.S. Environmental Protection Agency, Environ-
mental Compliance and History Online database (ECHO),
State Review Framework Tracker Recommendations
Results, accessed 6 December 2017, archived at https://
web.archive.org/web/20170514152235/https://echo.epa.
gov/oversight/state-review-framework/tracker-recom-
mendations/results .
48. See note 21, 11-25.
49. Ibid.
50. See note 16.
51. Jamie Wachter, “Pilgrim’s Pride Settles Water Pollu-
tion Lawsuit,” Suwannee Democrat, 16 November 2017.
52. Michael Hawthorne, “U.S. Steel Dumps More Toxic
Chromium Near Lake Michigan, Faces Lawsuit,” The Chi-
cago Tribune, 15 November 2017.
53. U.S. Environmental Protection Agency, PCS-ICIS
Search User Guide, 7 March 2017, archived at http://web.
archive.org/web/20180204023012/https://www.epa.gov/
enviro/pcs-icis-search-user-guide.
54. U.S. Environmental Protection Agency, Known Data
Problems: Clean Water Act (CWA) Primary Data Alerts,
1 August 20117, archived at https://web.archive.org/
web/20170804043837/https://echo.epa.gov/resources/
echo-data/known-data-problems .
55. Tim Davis, Administrator of Water Quality Division,
Montana Department of Environmental Quality, personal
communication, 21 November 2017.
56. Erich Brandstetter and Aron Borok, Oregon Depart-
ment of Environmental Quality, NPDES Waste Discharge
Permit Evaluation Report, accessed 3 February 2018,
archived at http://web.archive.org/web/20180204022830/
http://www.deq.state.or.us/wq/stormwater/
docs/1200aAnalysis.pdf, 28.
57. This analysis excludes New Jersey, which has not
uploaded NPDES discharge reports to the ICIS online data-
base since 2012. Definition of “impaired”: U.S. Environmen-
tal Protection Agency, Impaired Waters and TMDLs: Statute
and Regulations, 3 January 2018, archived at http://web.
archive.org/web/20180202224017/https://www.epa.gov/
tmdl/impaired-waters-and-tmdls-statute-and-regulations.
58. U.S. Environmental Protection Agency, Interim
Clean Water Act Settlement Penalty Policy, 1 March 1995,
archived at http://web.archive.org/web/20180217000336/

Notes 67
https://www.epa.gov/sites/production/files/documents/
cwapol.pdf, 4.
59. Type of facility: RES Water, About Us: Water Stor-
age and Treatment Facilities Custom Made for Your Busi-
ness Needs, accessed 16 February 2018, archived at http://
web.archive.org/web/20180216234534/http://reswater.
com/about/; Exceedances and days in exceedance: num-
bers taken from Reserve Environmental Services’ ECHO
Effluent Limit Exceedances Report, with the report date
range set from January 2016 to September 2017. Data ac-
cessed 16 February 2018 at https://echo.epa.gov/trends/
loading-tool/reports/effluent-exceedances/?permit_
id=OH0098540.
60. U.S. Environmental Protection Agency, Enforce-
ment and Compliance History Online, Effluent Limit Exceed-
ances Report Help, 28 December 2017, archived at http://
web.archive.org/web/20180216231311/https://echo.epa.
gov/help/loading-tool/reports/effluent-exceedance-report-
help.
61. Ibid.
62. Washington, D.C., actually had the highest number
of exceedances per facility (11). However, because D.C. is
not a state and because it has only two major facilities,
it was not included in any of the tables or state-specific
rankings in this report. Information about D.C.’s industrial
facilities and exceedances is included in all national totals
and the report appendix.
63. U.S. Environmental Protection Agency, Im-
paired Waters and TMDLs: Statute and Regulations,
3 January 2018, archived at http://web.archive.org/
web/20180202224017/https://www.epa.gov/tmdl/im-
paired-waters-and-tmdls-statute-and-regulations.
64. See note 2.
65. U.S. Environmental Protection Agency, Office of En-
forcement and Compliance Assurance, U.S. Environmental
Protection Agency Annual Noncompliance Report (ANCR):
Calendar Year 2015, August 2016, 8.
66. Ibid., 9.
67. George Golliday et al., Environmental Protection
Agency, Better Enforcement Oversight Needed for Major
Facilities with Water Discharge Permits in Long-Term Sig-
nificant Noncompliance, 14 May 2007, archived at http://
web.archive.org/web/20180202234314/https://www.epa.
gov/sites/production/files/2015-11/documents/20070514-
2007-p-00023.pdf.
68. Wade T. Najjum, U.S. Environmental Protection
Agency, The Clean Water Act after 37 Years: Recommitting
to the Protection of the Nation’s Waters, 15 October 2009,
archived at http://web.archive.org/web/20180301042402/
https://www.epa.gov/sites/production/files/2015-07/docu-
ments/finalstatementofwadenajjum-epaoig.pdf.
69. Ibid.
70. Environmental Integrity Project, EPA FOIA Docu-
ments Reveal Branstad Interference Is Undermining
Prospects for Badly Needed Clean Water Act Reforms,
16 July 2013, archived at https://web.archive.org/
web/20170412082712/http://www.environmentalintegrity.
org/news/epa-foia-documents-reveal-branstad-interfer-
ence-is-undermining-prospects-for-badly-needed-clean-
water-act-reforms/.
71. Ibid.
72. Bonnie Stewart, Ashley Ahearn and Jason Alcorn,
“Clean Water Act’s Anti-Pollution Goals Prove Elusive,” Or-
egon Public Broadcasting, 17 July 2012, archived at http://
web.archive.org/web/20180204012510/https://www.opb.
org/news/article/anti-pollution-goals-elude-clean-water-
act-enforce/.
73. Erica Peterson, “With Enforcement Lax, Ken-
tucky Waterways Appear More Polluted,” WFPL, 10
November 2015, archived at http://web.archive.org/
web/20180204013143/http://wfpl.org/enforcement-lax-
kentucky-waterways-polluted/.
74. Mike Reicher, “EPA Faults Tennessee for Lax Water
Quality Enforcement,” Tennessean, 24 October 2016,
available at https://www.tennessean.com/story/news/
environment/2016/10/24/epa-faults-tennessee-lax-water-
quality-enforcement/92680732/.

68 Troubled Waters
75. While the rest of this reports focuses on violations
by major industrial facilities, this chart includes penalties
assessed for all CWA violations.
76. See note 3.
77. Ibid.
78. Eric Schaeffer and Keene Kelderman, Environmen-
tal Integrity Project, Environmental Enforcement Under
Trump, 10 August 2017.
79. Ibid.
80. Eric Lipton and Danielle Ivory, “Under Trump, E.P.A.
has Slowed Actions Against Polluters, and Put Limits on
Enforcement Officers,” The New York Times, 10 December
2017 .
81. Ibid.
82. This analysis was limited to civil cases, but excluded
civil cases related to Superfund sites.
83. See note 4.
84. Ibid., 85.
85. U.S. Environmental Protection Agency, Learn About
the Water Pollution Control (Section 106) Grant Program,
accessed on 6 December 2017, archived at http://web.
archive.org/web/20180301043112/https://www.epa.gov/
water-pollution-control-section-106-grants/learn-about-
water-pollution-control-section-106-grant.
86. 2018 budget and 2019 proposal: U.S. Environ-
mental Protection Agency, FY 2019 EPA Budget in Brief,
February 2018, available at https://www.epa.gov/sites/pro-
duction/files/2017-05/documents/fy-2018-budget-in-brief.
pdf, 85; allotment in prior years: downloaded from U.S.
Environmental Protection Agency, Water Pollution Control
(Section 106) Grants Funding History, accessed 3 February
2018 at https://www.epa.gov/water-pollution-control-
section-106-grants/water-pollution-control-section-
106-grants-funding.
87. The 2012-2017 totals represent the total funding
allotted for Section 106 grants in those years. The 2018
total represents the amount budgeted for Section 106
grants, since grant allotments will not be finalized until
the end of the year. The 2019 total comes from the pro-
posed FY 2019 EPA budget. Data sources: See note 86.
88. U.S. Environmental Protection Agency, Office of
Enforcement and Compliance Assurance, NPDES Compli-
ance Inspection Manual, July 2004, archived at https://
www.epa.gov/sites/production/files/2013-09/docu-
ments/npdesinspect_0.pdf, 1-1.
89. Calculated from NPDES_INSPECTIONS.csv,
downloaded from U.S. Environmental Protection Agency,
National Enforcement and Compliance History Online
Data Downloads, available at https://echo.epa.gov/tools/
data-downloads#downloads.
90. Ibid.
91. Environmental Integrity Project, “EPA Decides to
Roll Back Limits on the Largest Industrial Source of Toxic
Water Pollution in the U.S.,” 15 August 2017, archived at
https://web.archive.org/web/20171203001511/http://
www.environmentalintegrity.org/news/epa-to-roll-back-
elg-rule/ .
92. Ibid.
93. Clean Water Rule: Environmental Integrity
Project, “EPA Decides to Roll Back Limits on the Largest
Industrial Source of Toxic Water Pollution in the U.S.,”
15 August 2017, archived at https://web.archive.org/
web/20171203001511/http://www.environmentalintegri-
ty.org/news/epa-to-roll-back-elg-rule/; ELG: U.S. Environ-
mental Protection Agency, EPA Finalizes Rule to Postpone
Steam Electric Power Plant Effluent Guidelines Rule (press
release), 13 September 2017, archived at http://web.
archive.org/web/20180215230859/https://www.epa.
gov/newsreleases/epa-finalizes-rule-postpone-steam-
electric-power-plant-effluent-guidelines-rule.
Notes 69
94. Issuing timeline: Amanda Reilly and Ariel Witten-
berg, “Clean Water Rule: Supreme Court Ruling Compli-
cates Next Steps on WOTUS,” E&E News, 22 January 2018,
archived at http://web.archive.org/web/20180206221202/
https://www.eenews.net/stories/1060071583; Drinking
water for one in three Americans: U.S. Environmental Pro-
tection Agency, Geographic Information Systems Analysis
of the Surface Drinking Water Provided by Intermittent,
Ephemeral and Headwater Streams in the U.S.: Performed
by U.S. EPA July, 2009, accessed 6 February 2018, ar-
chived at http://web.archive.org/web/20180206221628/
https://19january2017snapshot.epa.gov/sites/production/
files/2015-04/documents/2009_12_28_wetlands_science_
surface_drinking_water_surface_drinking_water_study_
summary.pdf.
95. 1,200 studies: U.S. Environmental Protection
Agency, What the Clean Water Rule Does, 10 April 2017,
archived at http://web.archive.org/web/20180228170253/
https://archive.epa.gov/epa/cleanwaterrule/what-clean-
water-rule-does.html; 800,000 comments: John Rumpler,
Environment America, Attack on Clean Water Rule (press
release), 28 February 2017, archived at http://web.archive.
org/web/20180228170451/https://environmentamerica.
org/news/ame/attack-clean-water-rule.
96. Timothy Cama, “EPA Moves to Repeal Obama
Rule,” The Hill, 27 June 2017, archived at http://web.ar-
chive.org/web/20180206222439/http://thehill.com/policy/
energy-environment/339691-epa-seeks-to-repeal-obama-
water-rule.
97. Ibid.
98. Coral Davenport, “E.P.A. Blocks Obama-Era Clean
Water Rule,” New York Times, 31 January 2018, archived
at http://web.archive.org/web/20180206225138/https://
www.nytimes.com/2018/01/31/climate/trump-water-
wotus.html.
99. U.S. Environmental Protection Agency, Benefit
and Cost Analysis for the Effluent Limitation Guidelines and
Standards for the Steam Electric Power Generating Point
Source Category, September 2015, available at https://
www.epa.gov/sites/production/files/2015-10/documents/
steam-electric_benefit-cost-analysis_09-29-2015.pdf.
100. U.S. Environmental Protection Agency, Final
Effluent Limitations Guidelines and Standards for the
Steam Electric Power Generating Industry (factsheet),
September 2015, archived at http://web.archive.org/
web/20180228173427/https://www.epa.gov/sites/produc-
tion/files/2015-10/documents/steam-electric-final-rule-
factsheet_10-01-2015.pdf.
101. Ibid.
102. U.S. Environmental Protection Agency, Post-
ponement of Certain Compliance Dates for the Ef-
fluent Limitations Guidelines and Standards for the
Steam Electric Generating Point Source Category, 18
September 2017, archived at http://web.archive.org/
web/20180228174522/https://www.federalregister.gov/
documents/2017/09/18/2017-19821/postponement-of-
certain-compliance-dates-for-the-effluent-limitations-
guidelines-and-standards-for.
103. When multiple facilities in a state tied for tenth
place, all were included in the chart.