industry leading provider of outsourced semiconductor ...€¦ · november, 2017 industry leading...
TRANSCRIPT

November, 2017
Industry Leading Provider of Outsourced Semiconductor
Assembly, Test & Bumping Services
Q3’17 Results Conference

2 2
Safe Harbor Notice
This presentation contains certain forward-looking statements. These
forward-looking statements may be identified by words such as ‘believes,’
‘expects,’ ‘anticipates,’ ‘projects,’ ‘intends,’ ‘should,’ ‘seeks,’ ‘estimates,’
‘future’ or similar expressions or by discussion of, among other things,
strategy, goals, plans or intentions. These statements include financial
projections and estimates and their underlying assumptions, statements
regarding plans, objectives and expectations with respect to future
operations, products and services, and statements regarding future
performance. Actual results may differ materially in the future from those
reflected in forward-looking statements contained in this document, due to
various factors. Actual results may differ materially in the future from those
reflected in forward-looking statements contained in this document, due to
various factors. Further information regarding these risks, uncertainties and
other factors are included in the Company’s most recent Annual Report on
Form 20-F filed with the U.S. Securities and Exchange commission (the
“SEC”) and in the Company’s other filings with the SEC.

Agenda
Welcome S.J. Cheng
Q3’17 Operating Results Silvia Su
Q4’17 Business Outlook S.J. Cheng
Q&A
3

4
Q3’17 Operating Results

(NT $ Millions)
Net Revenue 4,431.1 4,541.2 4,769.0
Profit Attributable to the Company 162.0 321.4 255.1
EPS Attributable to the Company- Diluted
(NT$)0.19 0.38 0.29
Earnings per ADS equivalent- Diluted(1)(4)
(US$)0.13 0.25 0.20
Depreciation & Amortization 744.5 709.3 806.8
CAPEX 1,118.8 1,395.3 979.9
EBITDA(2) 1,146.7 1,157.9 1,365.3
Return on Equity(%)(3) 4.7% 7.1% 5.9%
Note:(1) The ADS was issued in Q4'16
(2) EBITDA = Operating Profit + Depreciation & Amortization
(3) Annualized return on equity to the Company for the quarter
(4) The exchange rate was NT$30.33 against to US$1.00
Q3'17 Q2'17 Q3'16
Consolidated Operating Results Summary (unaudited)
5

(NT $ Millions)
Net Revenue 4,431.1 4,541.2 -2.4% 4,769.0 -7.1%
Gross Profit 760.8 910.4 -16.4% 966.4 -21.3%
Gross Margin 17.2% 20.1% -2.9ppts 20.3% -3.1ppts
Operating Expenses -386.3 -493.5 21.7% -425.3 9.2%
Operating Profit 402.2 448.6 -10.3% 558.5 -28.0%
Operating Profit Margin 9.1% 9.9% -0.8ppts 11.7% -2.6ppts
Non-operating Income (Expenses) -114.1 -56.4 -102.3% -250.5 54.5%
Profit Attributable to the Company 162.0 321.4 -49.6% 255.1 -36.5%
EPS Attributable to the Company- Basic (NT$) 0.19 0.38 -50.0% 0.30 -36.7%
Weighted Average Shares Outstanding(in
thousands)- Basic846,840 845,206 0.2% 851,980 -0.6%
EPS Attributable to the Company - Diluted (NT$) 0.19 0.38 -50.0% 0.29 -34.5%
Weighted Average Shares Outstanding(in
thousands)- Diluted853,644 852,649 0.1% 858,968 -0.6%
Q3'17 Q2'17
Q3'17
over
Q2'17
Q3'16
Q3'17
over
Q3'16
Consolidated Statements of Comprehensive Income (unaudited)
6

Package Test15.6%
Wafer Sort11.0%
Assembly27.3%
LCD Driver27.2%
Bumping (incl. RDL/MEMS/PM)
18.9%
0
200
400
600
800
1,000
Q2'17 Q3'17
Bumping (incl. RDL/MEMS/PM) ( NT$ M)
Q3’17 Revenue Breakdown By Segment (unaudited)
7
By Manufacturing Segments
0
200
400
600
800
1,000
1,200
1,400
Q2'17 Q3'17
LCD Driver
QoQ 6.7% ( NT$ M)
0
200
400
600
800
1,000
1,200
1,400
1,600
Q2'17 Q3'17
Assembly ( NT$ M)
0
200
400
600
800
Q2'17 Q3'17
Wafer Sort ( NT$ M)
0
200
400
600
800
1,000
Q2'17 Q3'17
Package Test ( NT$ M)
QoQ 22.5% QoQ -17.5% QoQ -5.8% QoQ -7.1%

Q3’17 Revenue Breakdown By Product (unaudited)
8
By Products
Niche DRAM
13.7%
Commodity
DRAM8.0%
Flash
20.1%
SRAM
0.9%
Logic/Mixed Signal
10.7%
DDIC
28.1%
Au Bumping
(incl. RDL)18.5%
0
200
400
600
800
1,000
Q2'17 Q3'17
Au Bumping (Incl. RDL) ( NT$ M)
0
500
1,000
1,500
Q2'17 Q3'17
DDIC
QoQ 7.1% ( NT$ M)
0
100
200
300
400
500
600
Q2'17 Q3'17
Logic/Mixed Signal
QoQ -6.3% ( NT$ M)
0
10
20
30
40
50
Q2'17 Q3'17
SRAM
QoQ -9.7% ( NT$ M)
0
200
400
600
800
1,000
Q2'17 Q3'17
Flash
QoQ 6.6% ( NT$ M)
0
200
400
600
800
Q2'17 Q3'17
Niche DRAM
QoQ -16.5% ( NT$ M)
0
100
200
300
400
500
600
700
Q2'17 Q3'17
Commodity DRAM
QoQ -40.7% ( NT$ M)
QoQ 22.6%
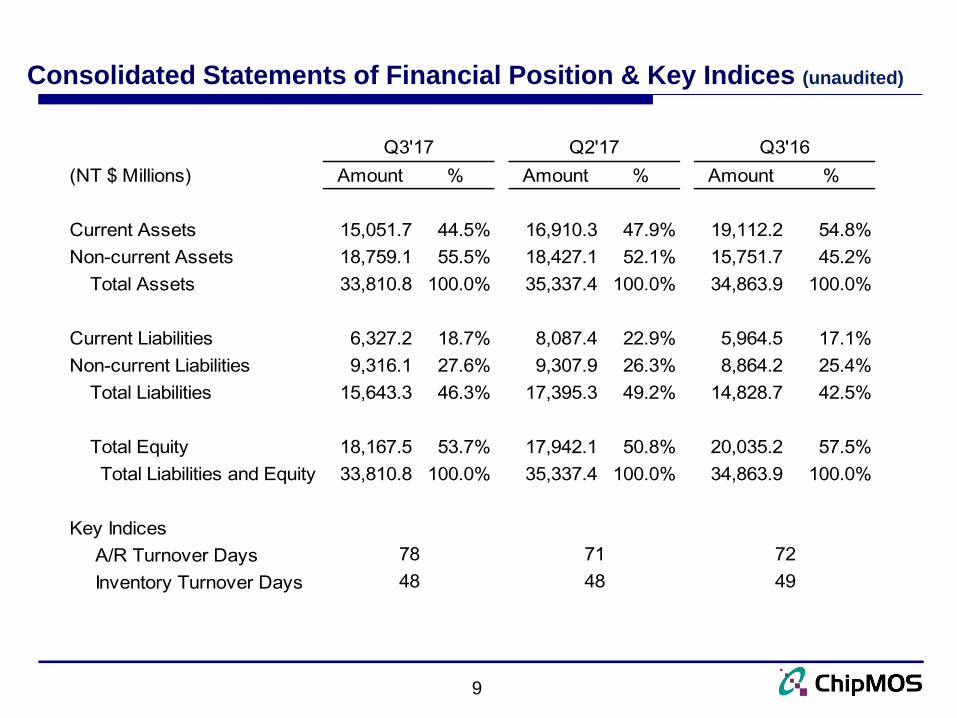
Consolidated Statements of Financial Position & Key Indices (unaudited)
9
(NT $ Millions) Amount % Amount % Amount %
Current Assets 15,051.7 44.5% 16,910.3 47.9% 19,112.2 54.8%
Non-current Assets 18,759.1 55.5% 18,427.1 52.1% 15,751.7 45.2%
Total Assets 33,810.8 100.0% 35,337.4 100.0% 34,863.9 100.0%
Current Liabilities 6,327.2 18.7% 8,087.4 22.9% 5,964.5 17.1%
Non-current Liabilities 9,316.1 27.6% 9,307.9 26.3% 8,864.2 25.4%
Total Liabilities 15,643.3 46.3% 17,395.3 49.2% 14,828.7 42.5%
Total Equity 18,167.5 53.7% 17,942.1 50.8% 20,035.2 57.5%
Total Liabilities and Equity 33,810.8 100.0% 35,337.4 100.0% 34,863.9 100.0%
Key Indices
A/R Turnover Days
Inventory Turnover Days
72
49
Q3'17
78
48
Q2'17
71
48
Q3'16
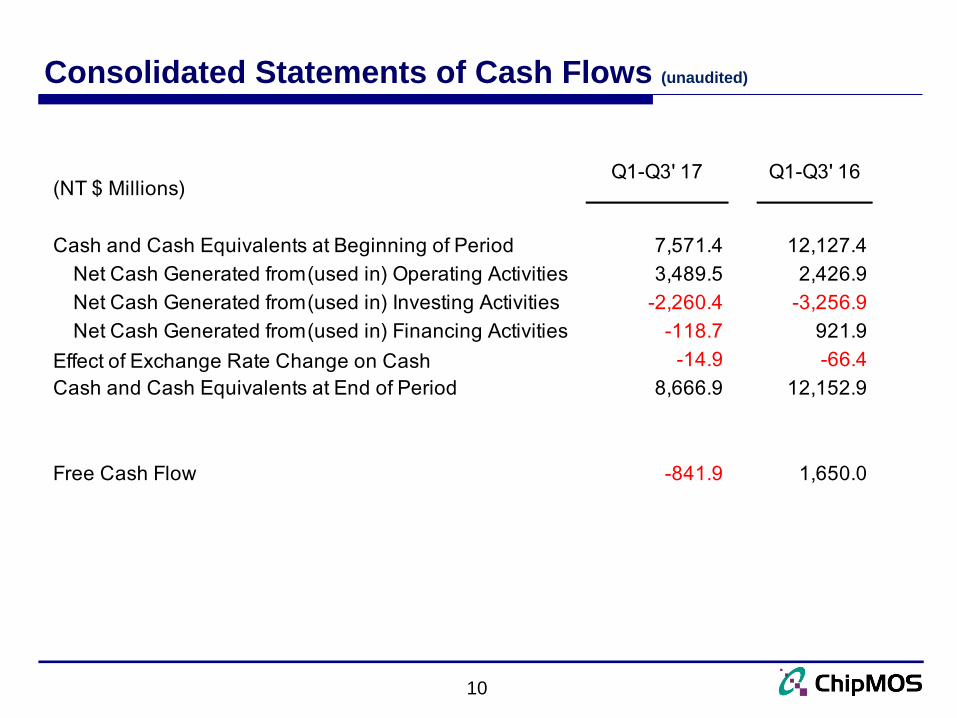
Consolidated Statements of Cash Flows (unaudited)
10
(NT $ Millions)
Cash and Cash Equivalents at Beginning of Period 7,571.4 12,127.4
Net Cash Generated from(used in) Operating Activities 3,489.5 2,426.9
Net Cash Generated from(used in) Investing Activities -2,260.4 -3,256.9
Net Cash Generated from(used in) Financing Activities -118.7 921.9
Effect of Exchange Rate Change on Cash -14.9 -66.4
Cash and Cash Equivalents at End of Period 8,666.9 12,152.9
Free Cash Flow -841.9 1,650.0
Q1-Q3' 17 Q1-Q3' 16

Test17.3%
Assembly12.0%
LCD Driver63.1%
Bumping7.6%
Q3’17 Capital Expenditures (unaudited)
11
CapEx
3,644.6
3,123.3
3,648.7
979.9 1,118.8
0
500
1,000
1,500
2,000
2,500
3,000
3,500
4,000
2015 2016 Q1-Q3' 17 Q3'16 Q3'17
( NT$ M)
Q3’17 CapEx Breakdown

74% 76% 77% 76%
0%
20%
40%
60%
80%
100%
Q3'16 Q3'17 Q2'17 Q3'17
Q3’17 Capacity Utilization
12
Utilization Rate
82% 75%
0%
20%
40%
60%
80%
100%
Q2'17 Q3'17
Test
73% 63%
0%
20%
40%
60%
80%
100%
Q2'17 Q3'17
Assembly
87% 87%
0%
20%
40%
60%
80%
100%
Q2'17 Q3'17
LCD Driver
63%
77%
0%
20%
40%
60%
80%
100%
Q2'17 Q3'17
Bumping

13
Q4’17 Business Outlook

14

Company website
15
http://www.chipmos.com