inflation report august 2010. costs and prices chart 4.1 measures of consumer prices (a) (a) data...
TRANSCRIPT
Inflation Report Inflation Report August 2010August 2010

Costs and pricesCosts and prices
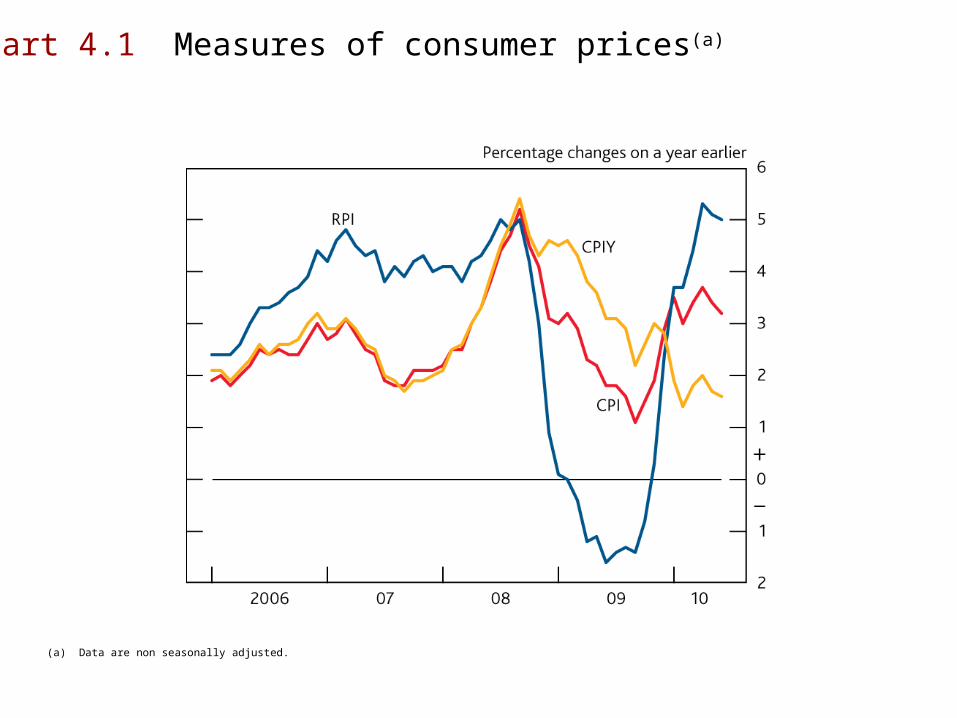
Chart 4.1 Measures of consumer prices(a)
(a) Data are non seasonally adjusted.
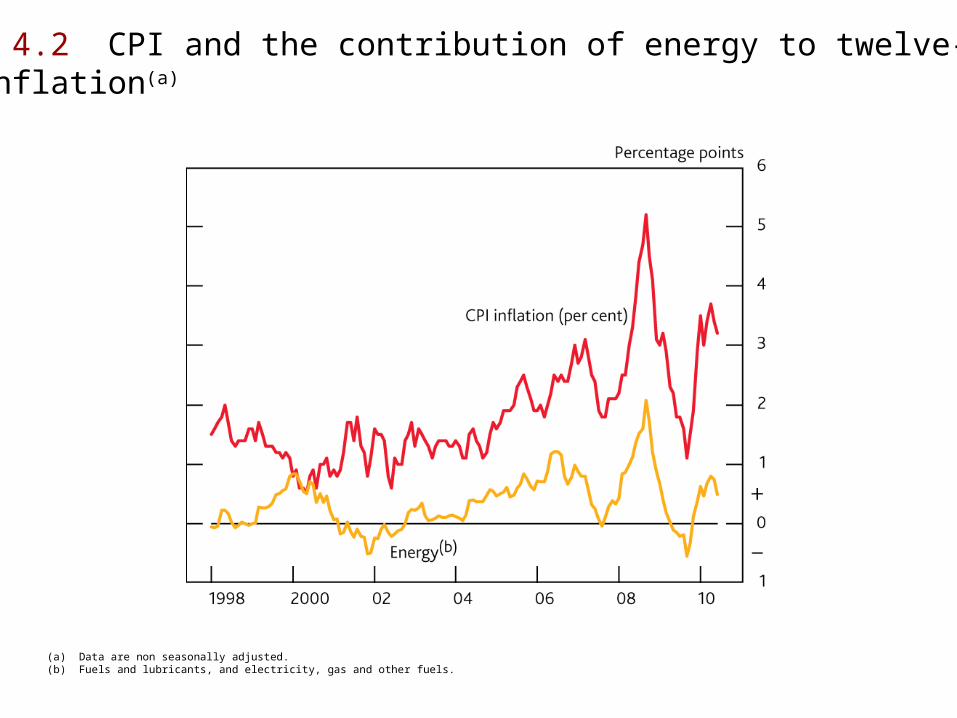
Chart 4.2 CPI and the contribution of energy to twelve-monthCPI inflation(a)
(a) Data are non seasonally adjusted.(b) Fuels and lubricants, and electricity, gas and other fuels.

Chart 4.3 Stylised illustrations of the contribution of changes in VAT to twelve-month CPI inflation(a)
Sources: ONS and Bank calculations.
(a) Data are shown at a quarterly frequency.(b)Past changes in VAT are as follows: cut from 17.5% to 15% in December 2008; and rise from 15% to 17.5% in January 2010. The share of prices subject to VAT is based on the 2009 CPI basket. The examples make the simplifying assumption that companies only adjust their prices in the months in which VAT was changed.(c)Forthcoming VAT rise is from 17.5% to 20% in January 2011. The share of prices subject to VAT is based on the 2010 CPI basket. The examples make the assumption that one third of affected companies raise their prices pre-emptively by the end of 2010.(d) All prices subject to the standard rate of VAT vary in response to the changes in VAT.(e) The prices of half of the CPI basket subject to the standard rate of VAT vary in response to the changes in VAT.

Chart 4.4 CPI and the household consumption deflator
(a) Seasonally adjusted by Bank staff. The latest observation is 2010 Q2.(b) At market prices, excluding non-profit institutions serving households. The latest observation is 2010 Q1.
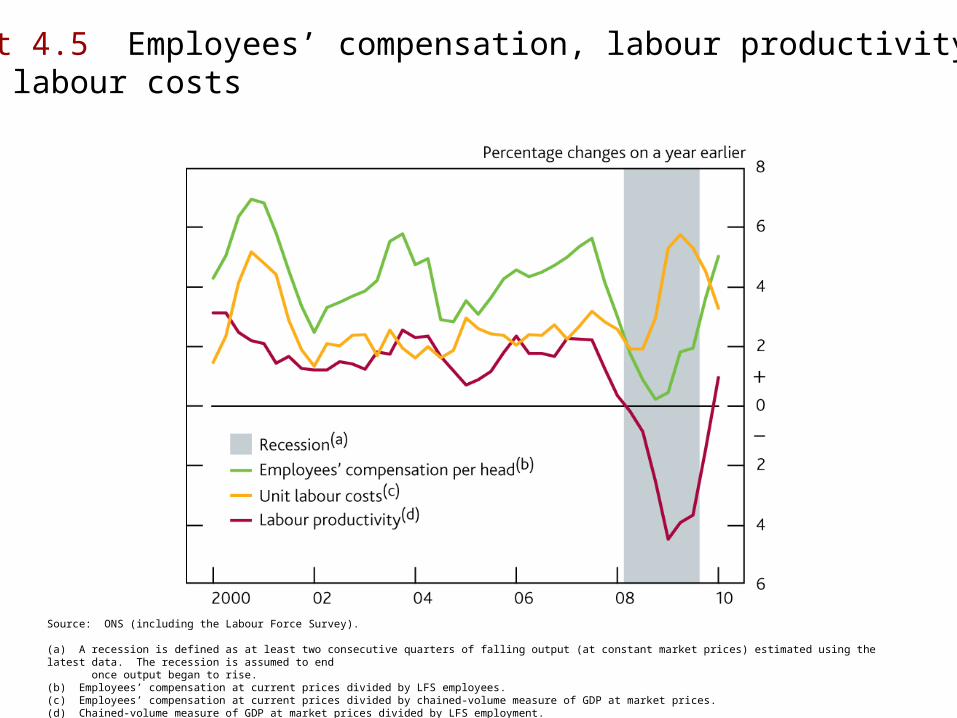
Chart 4.5 Employees’ compensation, labour productivity andunit labour costs
Source: ONS (including the Labour Force Survey).
(a) A recession is defined as at least two consecutive quarters of falling output (at constant market prices) estimated using the latest data. The recession is assumed to end once output began to rise.(b) Employees’ compensation at current prices divided by LFS employees.(c) Employees’ compensation at current prices divided by chained-volume measure of GDP at market prices.(d) Chained-volume measure of GDP at market prices divided by LFS employment.

Chart 4.6 Private sector regular pay drift and average hours
Sources: Bank of England, Incomes Data Services, Industrial Relations Services, the Labour Research Department and ONS (including the Labour Force Survey).
(a) Calculated as the difference between AWE regular pay growth (latest three months on a year earlier) and pay settlements (averaged over the past twelve months).(b) Rolling three-month measure.
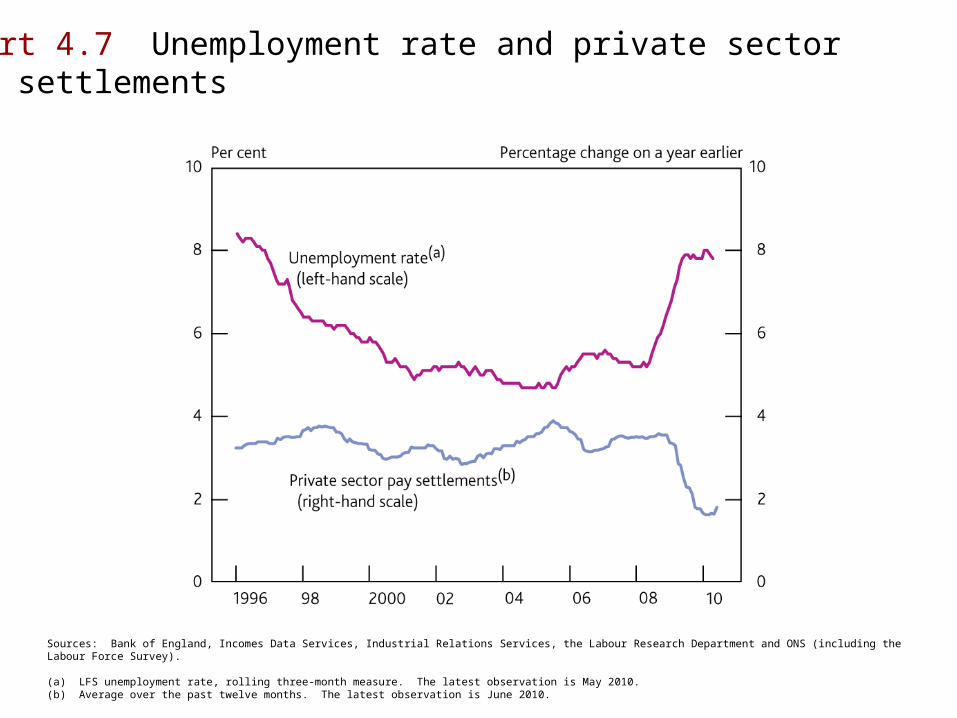
Chart 4.7 Unemployment rate and private sector pay settlements
Sources: Bank of England, Incomes Data Services, Industrial Relations Services, the Labour Research Department and ONS (including the Labour Force Survey).
(a) LFS unemployment rate, rolling three-month measure. The latest observation is May 2010.(b) Average over the past twelve months. The latest observation is June 2010.

Chart 4.8 Oil prices(a)
Source: Bloomberg.
(a) Futures prices for May and August are averages during the fifteen working days to 7 May and 4 August respectively.(b) Brent forward price for delivery in 10–21 days’ time.

Chart 4.9 Wholesale gas prices(a)
Sources: Bloomberg and Thomson Reuters Datastream.
(a) Futures prices for May and August are averages during the fifteen working days to 7 May and 4 August respectively.(b) One-day forward price of UK natural gas.
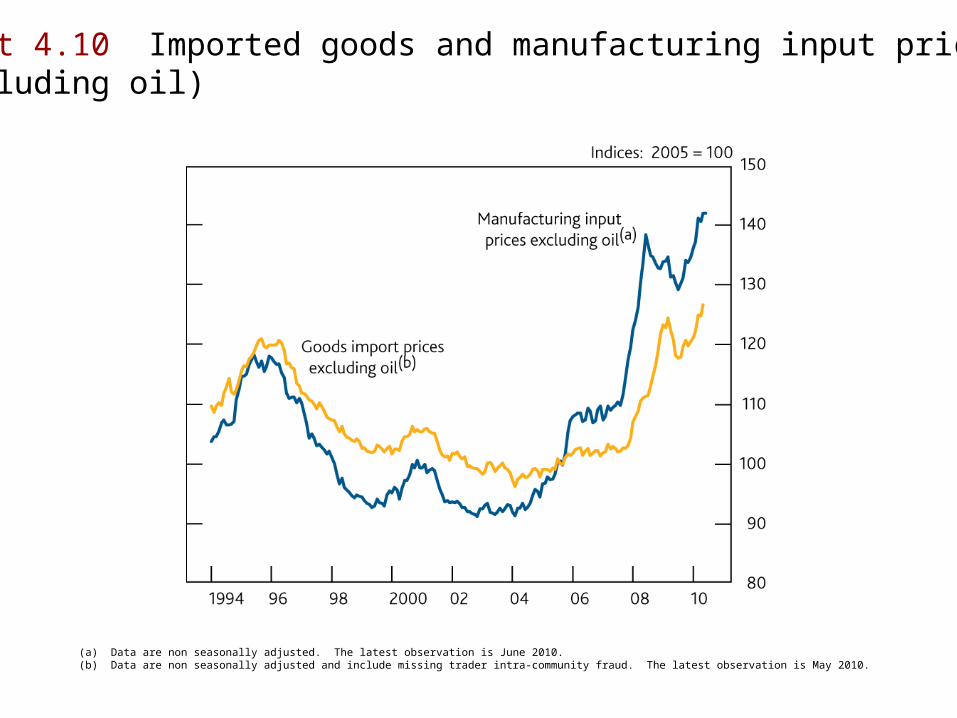
Chart 4.10 Imported goods and manufacturing input prices(excluding oil)
(a) Data are non seasonally adjusted. The latest observation is June 2010.(b) Data are non seasonally adjusted and include missing trader intra-community fraud. The latest observation is May 2010.

Chart 4.11 CPI inflation and survey measure of businesses’concerns about inflation
Sources: BCC and ONS.
(a) Quarterly data.(b) Companies are asked: ‘Is inflation more of a concern to your business than three months ago?’. Manufacturing and service sector responses are weighted together using shares in nominal value added. Data are non seasonally adjusted.

Chart 4.12 Weight on high and low RPI inflation outturnsimplied by options(a)
Sources: Bloomberg, Royal Bank of Scotland and Bank calculations.
(a) Probability that RPI inflation will be below zero or greater than 5% based on the average probability distribution of annual RPI outturns for six to seven years ahead implied by options.
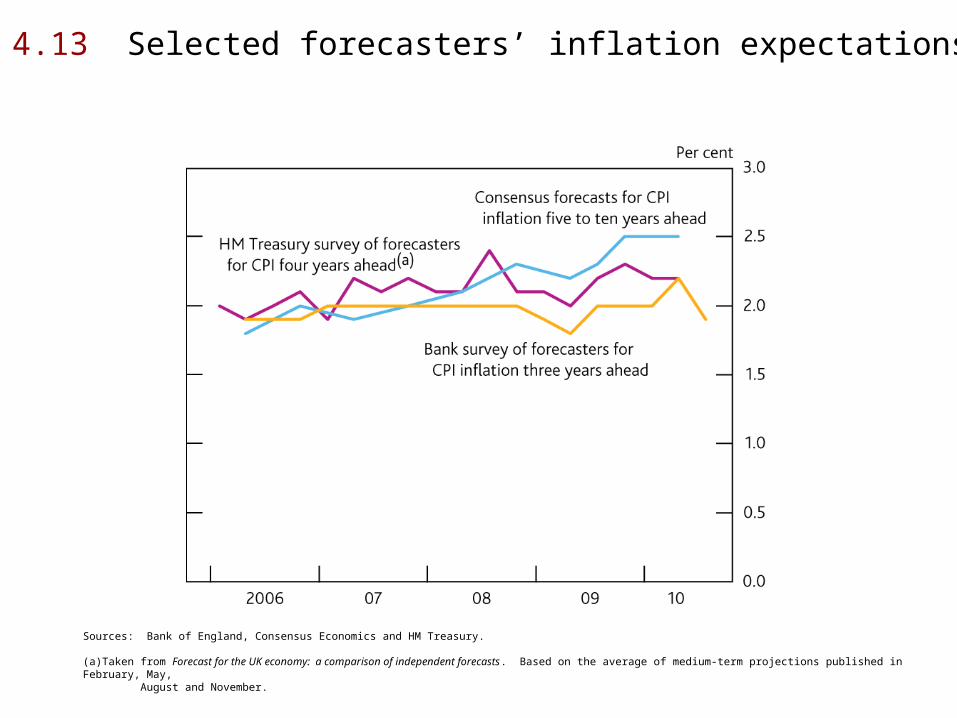
Chart 4.13 Selected forecasters’ inflation expectations
Sources: Bank of England, Consensus Economics and HM Treasury.
(a)Taken from Forecast for the UK economy: a comparison of independent forecasts. Based on the average of medium-term projections published in February, May, August and November.

TablesTables
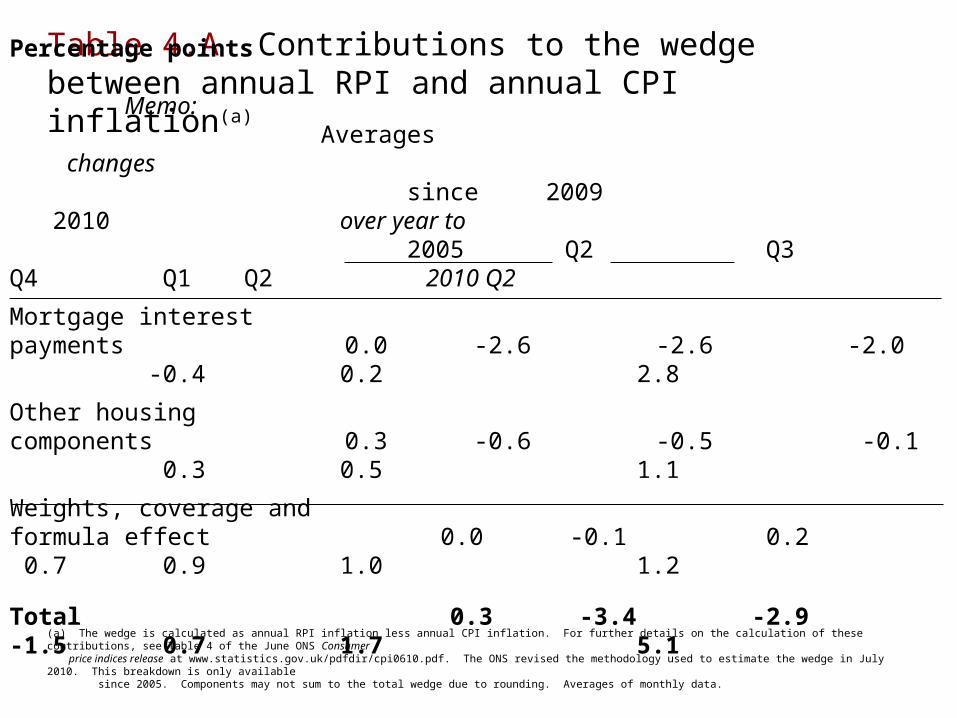
Table 4.A Contributions to the wedge between annual RPI and annual CPI inflation(a)
(a) The wedge is calculated as annual RPI inflation less annual CPI inflation. For further details on the calculation of these contributions, see Table 4 of the June ONS Consumer price indices release at www.statistics.gov.uk/pdfdir/cpi0610.pdf. The ONS revised the methodology used to estimate the wedge in July 2010. This breakdown is only available since 2005. Components may not sum to the total wedge due to rounding. Averages of monthly data.
Percentage points Memo:
Averages changes since 2009 2010 over year to 2005 Q2 Q3 Q4 Q1 Q2 2010 Q2
Mortgage interestpayments 0.0 -2.6 -2.6 -2.0 -0.4 0.2 2.8
Other housingcomponents 0.3 -0.6 -0.5 -0.1 0.3 0.5 1.1
Weights, coverage andformula effect 0.0 -0.1 0.2 0.7 0.9 1.0 1.2
Total 0.3 -3.4 -2.9 -1.5 0.7 1.7 5.1
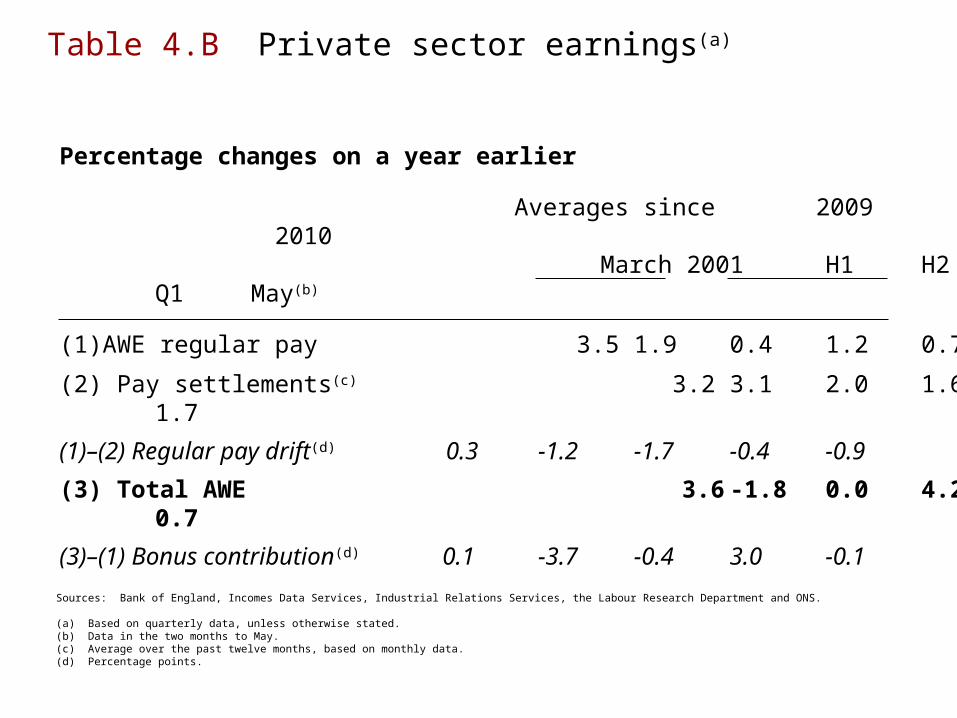
Table 4.B Private sector earnings(a)
Sources: Bank of England, Incomes Data Services, Industrial Relations Services, the Labour Research Department and ONS.
(a) Based on quarterly data, unless otherwise stated.(b) Data in the two months to May.(c) Average over the past twelve months, based on monthly data.(d) Percentage points.
Percentage changes on a year earlier
Averages since 2009 2010 March 2001 H1 H2 Q1 May(b)
(1)AWE regular pay 3.5 1.9 0.4 1.2 0.7
(2) Pay settlements(c) 3.2 3.1 2.0 1.6 1.7
(1)–(2) Regular pay drift(d) 0.3 -1.2 -1.7 -0.4 -0.9
(3) Total AWE 3.6 -1.8 0.0 4.2 0.7
(3)–(1) Bonus contribution(d) 0.1 -3.7 -0.4 3.0 -0.1

Table 4.C Goods and services prices(a)
Sources: ONS and Bank calculations.
(a) Averages are based on quarterly data. Data have been seasonally adjusted by Bank staff.(b) CPI goods excluding food, non-alcoholic beverages and tobacco, fuels and lubricants, and electricity, gas and other fuels.(c) Based on the Services Producer Price Index, which is an experimental index and is not classified as a National Statistic.
Percentage changes on a quarter earlier
Averages 2010 1998–2007 2008 2009 Q1 Q2
CPI
Non-energy industrial goods(b) -0.5 -0.6 0.5 0.5 0.2
Services 0.9 1.1 0.6 1.3 1.0
Output prices
Manufacturing excluding petroland food products 0.2 1.3 0.7 1.1 1.6
Services(c) 0.5 0.7 -0.1 0.7 n.a.
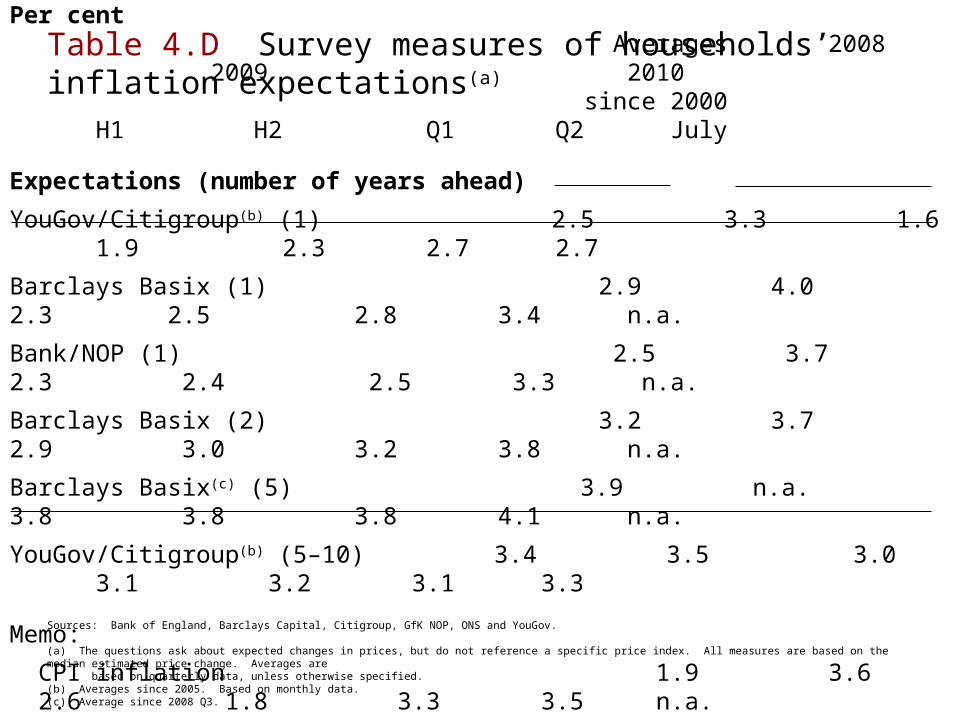
Table 4.D Survey measures of households’ inflation expectations(a)
Sources: Bank of England, Barclays Capital, Citigroup, GfK NOP, ONS and YouGov.
(a) The questions ask about expected changes in prices, but do not reference a specific price index. All measures are based on the median estimated price change. Averages are based on quarterly data, unless otherwise specified.(b) Averages since 2005. Based on monthly data.(c) Average since 2008 Q3.
Per cent Averages 2008 2009 2010 since 2000 H1 H2 Q1 Q2 July
Expectations (number of years ahead)
YouGov/Citigroup(b) (1) 2.5 3.3 1.6 1.9 2.3 2.7 2.7
Barclays Basix (1) 2.9 4.0 2.3 2.5 2.8 3.4 n.a.
Bank/NOP (1) 2.5 3.7 2.3 2.4 2.5 3.3 n.a.
Barclays Basix (2) 3.2 3.7 2.9 3.0 3.2 3.8 n.a.
Barclays Basix(c) (5) 3.9 n.a. 3.8 3.8 3.8 4.1 n.a.
YouGov/Citigroup(b) (5–10) 3.4 3.5 3.0 3.1 3.2 3.1 3.3
Memo:
CPI inflation 1.9 3.6 2.6 1.8 3.3 3.5 n.a.