benson economic outlook 2012. gross domestic product seasonally adjusted annual rate
TRANSCRIPT

Benson Economic Outlook 2012

GROSS DOMESTIC PRODUCT
I 2004
II III IV I 2005
II III IV I 2006
II III IV I 2007
II III IV I 2008
II III IV I 2009
II III IV I 2010
II III IV I 2011
II III IV I 2012
-10
-8
-6
-4
-2
0
2
4
6Seasonally Adjusted Annual Rate

INFLATION (CPI)
Jan 2007
Mar
May
Jul
Sep
Nov
Jan 2008
Mar
May
Jul
Sep
Nov
Jan 2009
Mar
May
Jul
Sep
Nov
Jan 2010
Mar
May
Jul
Sep
Nov
Jan 2011
Mar
May
Jul
Sep
Nov
Jan 2012
Mar
May
-3%
-2%
-1%
0%
1%
2%
3%
4%
5%
6% Chart Title
Compared to same month previous year

NATIONAL OUTLOOK
• Continued slow economic growth
• Labor market generally improving
• Short- and long-run inflation threat remains

GDP BY STATE

THE LOCAL ECONOMY
Cochise County & Benson

COCHISE COUNTY RETAIL SALES GROWTH
Jan
20
07
Ma
r
Ma
y
Jul
Se
p
No
v
Jan
20
08
Ma
r
Ma
y
Jul
Se
p
No
v
Jan
20
09
Ma
r
Ma
y
Jul
Se
p
No
v
Jan
20
10
Ma
r
Ma
y
Jul
Se
p
No
v
Jan
20
11
Ma
r
Ma
y
Jul
Se
p
No
v
Jan
20
12
Ma
r
-30%
-20%
-10%
0%
10%
20%
30%
40%
50%
Inflation adjusted; compared to same month previous year

BENSON RETAIL SALES TAX REVENUE GROWTH
-20%
-10%
0%
10%
20%
30%
40%
50%
60%
70%
Jan 2
007
Mar
May
Jul
Sep
Nov
Jan 2
008
Mar
May
Jul
Sep
Nov
Jan 2
009
Mar
May
Jul
Sep
Nov
Jan 2
010
Mar
May
Jul
Sep
Nov
Jan 2
011
Mar
May
Jul
Sep
Nov
Jan 2
012
Mar
Compared to same month previous year; unadjusted

•Cochise County• 2012: 1.3% *• 2011: -1.2%• 2010: -4.8% • 2009: -4.2%• 2008: -6.5%• 2007: -1.3%
•Benson (Retail Sales Tax Revenue)
• 2012: -2.4% *• 2011: -5.6% • 2010: -0.4%• 2009: -4.8%• 2008: 0.6%• 2007: 38.2%
RETAIL SALES RECENT ACTIVITY
* Jan-Apr only; comparison to same period the previous year

RESTAURANT AND BAR SALES GROWTH
Jan 2007
Mar
May
Jul
Sep
Nov
Jan 2008
Mar
May
Jul
Sep
Nov
Jan 2009
Mar
May
Jul
Sep
Nov
Jan 2010
Mar
May
Jul
Sep
Nov
Jan 2011
Mar
May
Jul
Sep
Nov
Jan 2012
Mar
-40%
-30%
-20%
-10%
0%
10%
20%
30%
40%
50%
Cochise County Benson
Inflation adjusted; compared to same month previous year

•Cochise County
• 2012: -3.3% *
• 2011: -0.2%
• 2010: 0.0%
• 2009: 0.3%
• 2008: 0.2%
• 2007: 0.1%
•Benson
• 2012: -9.6% *
• 2011: -11.1%
• 2010: -3.7%
• 2009: 9.1%
• 2008: -0.6%
• 2007: -3.1%
RESTAURANT & BAR SALES RECENT ACTIVITY
* Jan-Apr only; comparison to same period the previous year
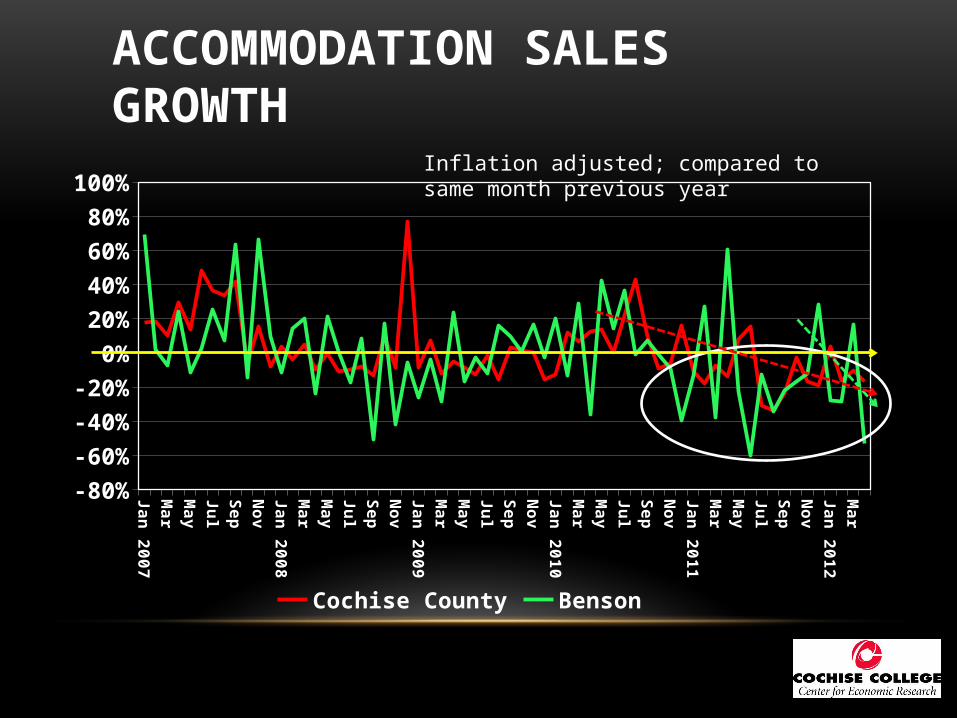
ACCOMMODATION SALES GROWTH
Jan 2
007
Mar
May
Jul
Sep
Nov
Jan 2
008
Mar
May
Jul
Sep
Nov
Jan 2
009
Mar
May
Jul
Sep
Nov
Jan 2
010
Mar
May
Jul
Sep
Nov
Jan 2
011
Mar
May
Jul
Sep
Nov
Jan 2
012
Mar
-80%
-60%
-40%
-20%
0%
20%
40%
60%
80%
100%
Cochise County Benson
Inflation adjusted; compared to same month previous year

• Cochise County• 2012: -11.0% *
• 2011: -13.1%
• 2010: 8.3%
• 2009: -9.0%
• 2008: 1.0%
• 2007: 19.7%
• Benson• 2012: -25.6% *• 2011: -6.1% • 2010: 1.0% • 2009: -5.5%
• 2008: -7.5%
• 2007: 17.6%
ACCOMMODATION SALES RECENT ACTIVITY
* Jan-Apr only; comparison to same period the previous year

SALES OUTLOOK
• Modest retail sales growth (countywide); slight decline (city)
• Restaurant and bar and accommodation sales trending downward (city & countywide)
• I-10 construction, gas prices, and potential defense cuts

EMPLOYMENT

UNEMPLOYMENT RATES
2001 2002 2003 2004 2005 2006 2007 2008 2009 2010 2011 2012*2%
4%
6%
8%
10%
12%
14%
16%
United States Arizona Cochise County Benson
* Jan-May only; seasonally adjusted

MONTHLY UNEMPLOYMENT RATES
Jan 2011
Feb
Mar
Ap
r
May
Jun
Jul
Au
g
Sep
Oct
No
v
Dec
Jan 2012
Feb
Mar
Ap
r
May
6.0%
8.0%
10.0%
12.0%
14.0%
16.0%
18.0%
United States Arizona Cochise County Benson
Seasonally adjusted

COCHISE COUNTY NONFARM JOB GROWTH
Jan 2008FebM
arA
prM
ayJunJulA
ugS
epO
ctN
ovD
ecJan 2009FebM
arA
prM
ayJunJulA
ugS
epO
ctN
ovD
ecJan 2010FebM
arA
prM
ayJunJulA
ugS
epO
ctN
ovD
ecJan 2011FebM
arA
prM
ayJunJulA
ugS
epO
ctN
ovD
ecJan 2012FebM
arA
prM
ay
-5.0%
-4.0%
-3.0%
-2.0%
-1.0%
0.0%
1.0%
2.0%
3.0%
4.0% Chart TitleCompared to same month previous year

COCHISE COUNTYJOB GAINS/LOSSES BY INDUSTRY
State and Local Government
Construction*
Federal Government
Financial Activities
Manufacturing
Trade, Transportation, and Utilities
Leisure and Hospitality
Other Services
Educational and Health Services
Information
Professional and Business Services
-50 -30 -10 10 30 50 70 90 110 130 150
125
75
75
50
25
25
25
25
0
-25
-25
Chart Title
12 months ended May 2012
* Includes mining

COCHISE COUNTYJOB GROWTH RATE BY INDUSTRY
Financial Activities
Construction*
Manufacturing
Other Services
State and Local Government
Federal Government
Leisure and Hospitality
Trade, Transportation, and Utilities
Educational and Health Services
Professional and Business Services
Information
-10% -5% 0% 5% 10%
5.6%
5.5%
4.8%
2.7%
1.8%
1.3%
0.6%
0.4%
0.0%
-0.5%
-3.8%
Chart Title
12 months ended May 2012
* Includes mining

EMPLOYMENT OUTLOOK
• Local labor market generally improving• Sustained improvement likely through
2012-2013

HOUSING AND REAL ESTATE

NEW HOME CONSTRUCTIONSingle Family Residential Building Permits
2003 2004 2005 2006 2007 2008 2009 2010 20110
200
400
600
800
1,000
1,200
0
20
40
60
80
100
120
Cochise County Benson
Co
ch
ise
Co
un
ty
Be
ns
on
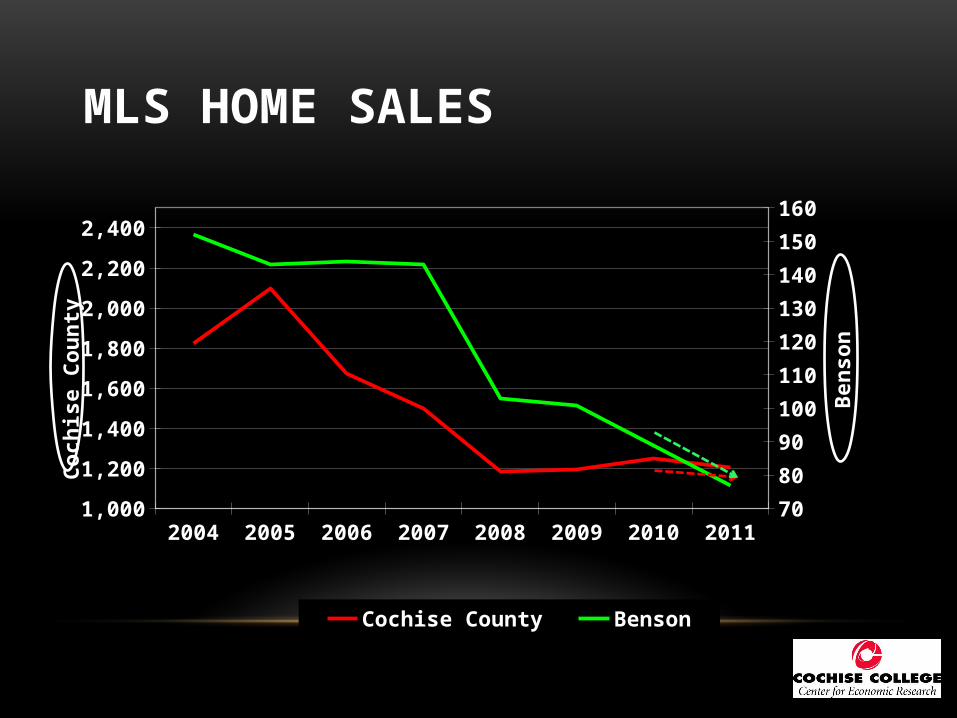
MLS HOME SALES
2004 2005 2006 2007 2008 2009 2010 20111,000
1,200
1,400
1,600
1,800
2,000
2,200
2,400
70
80
90
100
110
120
130
140
150
160
Cochise County Benson
Coch
ise C
ount
y
Bens
on

MEDIAN HOME PRICE
2004 2005 2006 2007 2008 2009 2010 2011 2012*$60,000
$80,000
$100,000
$120,000
$140,000
$160,000
$180,000
$200,000
$220,000
$139,900
$173,900
$192,569 $195,000
$184,000 $182,500
$173,172
$142,145
$119,000
$80,250
$100,000
$128,950
$160,000
$145,000
$155,000
$125,000
$106,000
$69,000
Cochise County Benson * 1st Quarter only

OUTLOOK• New residential construction picking up
countywide
• Benson new construction down, but above historical levels (pre-2006)
• Boost from foreclosures/lower prices/lower interest rates
• 2012 median price likely to increase from 1st quarter

CONCLUSION• Moving in the right direction, but slowly
• Sales locally continue to struggle, especially hospitality
• Defense spending and I-10 construction
• Labor market improvement will give boost
• Construction and home sales picking up
• Long-term inflation threat

