influence of landscape features on the microgeographic
TRANSCRIPT
ORIGINAL ARTICLE
Influence of landscape features on the microgeographicgenetic structure of a resident songbird
RV Adams1, SE Lazerte2, KA Otter2 and TM Burg1
Landscape features influence individual dispersal and as a result can affect both gene flow and genetic variation within andbetween populations. The landscape of British Columbia, Canada, is already highly heterogeneous because of natural ecologicaland geological transitions, but disturbance from human-mediated processes has further fragmented continuous habitat,particularly in the central plateau region. In this study, we evaluated the effects of landscape heterogeneity on the geneticstructure of a common resident songbird, the black-capped chickadee (Poecile atricapillus). Previous work revealed significantpopulation structuring in British Columbia that could not be explained by physical barriers, so our aim was to assess the patternof genetic structure at a microgeographic scale and determine the effect of different landscape features on geneticdifferentiation. A total of 399 individuals from 15 populations were genotyped for fourteen microsatellite loci revealingsignificant population structuring in this species. Individual- and population-based analyses revealed as many as nine geneticclusters with isolation in the north, the central plateau and the south. Moreover, a mixed modelling approach that accounted fornon-independence of pairwise distance values revealed a significant effect of land cover and elevation resistance on geneticdifferentiation. These results suggest that barriers in the landscape influence dispersal which has led to the unexpectedly highlevels of population isolation. Our study demonstrates the importance of incorporating landscape features when interpretingpatterns of population differentiation. Despite taking a microgeographic approach, our results have opened up additionalquestions concerning the processes influencing dispersal and gene flow at the local scale.Heredity (2016) 117, 63–72; doi:10.1038/hdy.2016.12; published online 24 February 2016
INTRODUCTION
Dispersal and gene flow are crucial for maintaining populationconnectivity and species persistence while also preventing populationdifferentiation and species divergence. The heterogeneity and patchi-ness of landscapes can influence the ability of an individual to dispersebetween populations. If dispersal is restricted by barriers in thelandscape, the resulting decrease in population connectivity can leadto discrete, isolated groups. Over time, these isolated groups mayexperience reduced genetic diversity and become genetically distinct(Baguette and Van Dyck, 2007). Landscape genetics offers newapproaches to explicitly test the influence of landscape elements ongenetic structure to identify barriers corresponding to structuredpopulations (Manel et al., 2003; Holderegger and Wagner, 2008;Sork and Waits, 2010; Manel and Holderegger, 2013).Large physical structures (for example, mountain ranges and large
water bodies) as well as stretches of unsuitable habitat are obviousbarriers to dispersal and subsequent gene flow. The influence ofbarriers can vary within and among species, and hence it is importantto be able to identify the specific factors influencing geneticdifferentiation of target groups before implementing managementstrategies (With et al., 1997). For example, using a landscape geneticsapproach, Frantz et al. (2012) found that motorways influencedgenetic structuring in red deer (Cervus elaphus), but not wild boars(Sus scrofa); as a result, considering fragmentation effects of
motorways would be primarily targeted at conservation efforts ononly the former species. The effects of landscape features can also varyacross a species range, as in the ornate dragon lizard (Ctenophorusornatus), where land clearing was associated with genetic differentia-tion in one area, but not another (Levy et al., 2012). Smaller, lessconspicuous structures or environmental variables, such as micro-climate, may also influence gene flow. Through landscape genetics,effects of multiple factors on contemporary patterns of geneticstructure can be examined across different spatial scales and acrossspecies with varying dispersal capabilities, allowing us to betterunderstand how organisms interact with their environment, andhow they may respond to future environmental change.In current landscapes, habitat fragmentation from natural and
human-mediated processes can influence the potential for animals todisperse and thus affect the spatial distribution of genetic variation atboth large and small geographical scales. Contemporary factors such asinsect outbreaks (for example, mountain pine beetle Dendroctonusponderosae) and habitat degradation (for example, forestry operations,agricultural conversion) have reduced population connectivity byremoving suitable breeding/dispersal habitat (Martin et al., 2006).For instance, a combination of the already-restricted range of thenorthern spotted owl (Strix occidentalis caurina) in the Pacific NorthWest coupled with the removal of dense, late successional forest has
1Department of Biological Sciences, University of Lethbridge, Lethbridge, Alberta, Canada and 2Natural Resources and Environmental Studies, University of Northern BritishColumbia, Prince George, British Columbia, CanadaCorrespondence: Dr RV Adams, Department of Biological Sciences, University of Lethbridge, 4401 University Drive, Lethbridge, Alberta T1K 3M4, Canada.E-mail: [email protected] 22 July 2015; revised 16 January 2016; accepted 18 January 2016; published online 24 February 2016
Heredity (2016) 117, 63–72& 2016 Macmillan Publishers Limited All rights reserved 0018-067X/16www.nature.com/hdy

left the species federally threatened (Blackburn and Godwin, 2003;Yezerinac and Moola, 2006; COSEWIC, 2008).British Columbia (Canada) has a complex climatic and vegetation
history following the Last Glacial Maximum (26.5–19 thousand yearsago). When this is combined with broad-scale climatic gradients (thatis, moisture, temperature and topography; Meidinger and Pojar, 1991)in the province, the result is major regional transitions that create richand heterogeneous landscapes (Gavin and Hu, 2013; Figure 1). Theprovince contains 6 ecozones and 14 biogeoclimatic zones (see Figure10 in Meidinger and Pojar, 1991). A major longitudinal moisturegradient formed by the Coastal Mountains is characterised bydominant maritime moist conifer forest in the west, transitioning tosagebush steppe in the rain shadow of the south central interior, tomixed conifer and pine forest in the east. The interior regions arefurther influenced by a latitudinal gradient with increasing summermoisture from south to north. This results in desert steppe in thesouth transitioning to subboreal and boreal spruce forest in the north.This natural heterogeneity is further increased by high levels of habitatfragmentation resulting from current forestry and agricultural prac-tices occurring within the province.To determine how these natural and anthropogenic factors influ-
ence population structure, we conducted a microgeographic landscapegenetic assessment of a common resident songbird, the black-cappedchickadee (Poecile atricapillus) in British Columbia. Our previous workidentified population genetic structuring in central British Columbia,but the sampling regime and range-wide scale of the study meant thatsmaller geographical barriers were less noticeable (Adams and Burg,2015). Here, a fine-scale transect sampling approach allowed for amore detailed examination of the landscape patterns and processesinfluencing population genetic structuring and a larger number of
microsatellite markers were used to better capture the spatialdistribution of genetic variation (Runde and Capen, 1987; Selkoeand Toonen, 2006). The study area comprises a number of differenthabitats and environmental conditions, so studying genetic variabilityin a nonmigratory species with limited dispersal potential will allow usto investigate the role of habitat heterogeneity on the ecology andevolution of populations. The aims of the study were to identify wherethe genetic breaks occur and to evaluate the processes drivingdifferentiation. This led to three main hypotheses: (1) fine-scalepopulation genetic differentiation will be evident in the black-capped chickadee due to the inclusion of additional sampled popula-tions and microsatellite loci; (2) given the level of topographical andclimatic variability found within the province, dispersal and gene floware influenced by landscape features and environmental variables; and(3) habitat fragmentation resulting from anthropogenic disturbance(for example, forestry and agriculture) isolates populations in centraland southern British Columbia.
MATERIALS AND METHODS
Study speciesThe black-capped chickadee is a resident songbird, common throughout mostof North America with a range that covers a large and complex geographicalarea. Black-capped chickadees are an important study species because they aregeneralists and thrive in a variety of environmental conditions, although theyprefer mixed deciduous and coniferous woodland (Smith, 1993). If specificlandscape processes are found to have a negative impact on chickadees, thiswould indicate that other species (particularly specialists) may also be affected.As primary cavity nesters, chickadees are dependent on advanced decaying treesor snags in mature forests. Their diet requirements also vary seasonally with apreference for mixed berries, seeds and insects in the winter in comparison witha completely insectivorous diet during the breeding season (Runde and Capen,1987). Although chickadees do reside and breed in disturbed areas, studies have
Figure 1 Sampling locations of the black-capped chickadee (Poecile atricapillus) in British Columbia (see Table 1 for abbreviations) with inferred clustersfrom GENELAND (K=9) denoted by the patterned circles (and colours in the online version). The nine genetic clusters are (1) NWBC, (2) NBC, (3) FtStJ1,(4) PG, (5) CLU, (6) HAZ, HOU, FF, FrL and FtStJ2, (7) BCR, (8) VAN and KEL and (9) SAB1 and SAB2.
Microgeographic genetic structure of chickadeesRV Adams et al
64
Heredity

found these low-quality habitats negatively affect reproduction (Fort and Otter,2004a), territoriality (Fort and Otter, 2004b), song output (van Oort et al.,2006), song consistency and perception (Grava et al., 2013a) and song structure(Grava et al., 2013b) in this species. Elevation and the presence of otherchickadee species (for example, mountain chickadees) can also influence theirdistribution and habitat preference (Campbell et al., 1997). Collectively, thisinformation highlights the importance of a number of factors related to habitatquality (for example, mature, dense woodland) on species persistence.
Sample collectionWe included samples from seven populations collected as part of our previousstudy (that is, FtStJ1, PG, NWBC, NBC, BCR, SAB1 and SAB2; Table 1; Adamsand Burg, 2015). We collected additional samples during the 2012 breedingseason using a transect-based approach along HWY 16, the main east–westcorridor in north-central British Columbia. Birds were captured using mist netsand call playback, and samples of blood (o100 μl from the brachial vein) and/or feathers were obtained from each individual. This resulted in ∼ 20 individualbirds sampled from each of an additional 6 locations (that is, HAZ, HOU, FF,FrL, CLU and FtStJ2; Table 1). Where possible, sampling sites were confined toa 10 km radius. Feather samples were also obtained from two more popula-tions: Vancouver (VAN) and Kelowna (KEL). With all individuals combined,sampling took place over ten breeding seasons (2003–2010, 2012 and 2013) anda total of 405 individuals from 15 populations were collected (Figure 1, Table 1and Supplementary Table S1). Each bird was banded with a numbered metalband to prevent resampling and all blood/ feather samples were stored in 95%ethanol and, on return to the laboratory, stored at − 80 °C.
DNA extraction and microsatellite genotypingDNA was extracted from blood ethanol mix (10 μl) or feather samples using amodified Chelex protocol (Walsh et al., 1991). Each individual was genotypedfor 14 polymorphic microsatellite loci (Supplementary Table S2) and DNA wasamplified for all loci (including new loci Pij02, VeCr05 and CTC101) using thesame two-step annealing PCR conditions outlined in Adams and Burg (2015);the exception was for Pij02, where the two-step annealing temperatures wereadjusted from 50 and 52 °C to 52 and 54 °C. All procedures following DNAamplification were conducted as in Adams and Burg (2015).Most individuals were successfully genotyped for all 14 variable microsatellite
loci. Seven populations were missing genotypes for locus PmanTAGAn45, fourpopulations for Ppi2, two populations for Titgata02 and two populations forPij02. All analyses were carried out with and without these four loci todetermine whether missing data influenced levels of observed populationdifferentiation. In addition, we conducted analyses with and without thefeather-sampled populations (KEL and VAN) as the DNA extracted from
feathers were of lower quality that resulted in missing data and created thepotential for genotyping errors from low amplification success for some loci.
Genetic analysesGenetic diversity. A total of 399 individuals remained after removing thosegenotyped for ⩽ 5 loci. Errors within the data (that is, input errors, allelicdropout, stutter and null alleles) were assessed in MICRO-CHECKER v2.2 (vanOosterhout et al., 2004). Allelic richness was calculated in FSTAT v2.9.2.3(Goudet, 2001) and tests for deviations from Hardy–Weinberg equilibrium andlinkage disequilibrium (LD) were performed in GENEPOP v4.0.10 (Raymondand Rousset, 1995; Rousset, 2008) using default Markov chain parameters (100batches, 1000 iterations and 1000 dememorisation steps). Both observed andexpected heterozygosities were calculated in GenAlEx v6.5 (Peakall and Smouse,2012) to determine the levels of population genetic diversity. Lastly, levels ofsignificance were adjusted using the modified false discovery rate correction(Benjamini and Yekutieli, 2001).
Population genetic structure. We used multiple approaches to gain insight intothe genetic structure of the black-capped chickadee. We used two clusteringmethods: GENELAND v4.0.0 (Guillot et al., 2005a) and STRUCTURE v2.3.4.(Pritchard et al., 2000). Both of these methods use Bayesian models to assignindividuals to genetic clusters by maximising Hardy–Weinberg equilibrium andminimising LD, but differ in the way they use spatial information. STRUC-TURE relies solely on genetic data (with the option of predefining populationswith location priors), whereas GENELAND incorporates individual spatialcoordinates.
Implemented in the program R v3.1.3 (R Development Core Team, 2015),GENELAND was run in two steps following the recommended protocol ofGuillot et al. (2005a, b). First, we ran the program for 10 replicates for each K(1–10) using the correlated allele frequencies and null allele models and 100 000Markov chain Monte Carlo iterations, a thinning interval of 100 and amaximum rate of Poisson process of 399 (equal to the sample size). Theuncertainty attached to spatial coordinates was fixed to 20 km (that is, theprecision of our sample locations; 10 km radius) and the maximum number ofnuclei in the Poisson–Voronoi tessellation was fixed to 1197 (three times thesample size). The number of clusters (K) was inferred from the modal K andthe run with the highest mean posterior probability. A second run was thenconducted with the inferred K fixed and all parameters left unchanged to allowindividuals to be assigned to clusters. To determine the robustness of thismodel, GENELAND was run multiple times with different parameters (forexample, with and without the correlated allele frequencies and null allelemodels; and 50 000, 100 000 and 200 000 Markov chain Monte Carloiterations).
Table 1 Sampling location information including site abbreviation (Abbrev.), geographical location (latitude (Lat) and longitude (Long)) and
sample size (N)
Location Abbrev. Lat (°N) Long (°W) N Ho He PA AR
Revelstoke BCR 50.9807 −118.1817 54 0.652 0.708 4 2.66
Northern BC NBC 54.8883 −127.7665 43 0.647 0.690 5 2.68
Cluculz Lake CLU 53.9102 −123.5496 20 0.654 0.703 4 2.70
Fort Fraser FF 53.9629 −124.5331 11 0.644 0.672 0 2.79
Francois Lake FrL 54.0488 −125.6988 20 0.622 0.668 1 2.64
Fort St James Town FtStJ 2 54.4183 −124.2743 18 0.623 0.667 0 2.69
Hazelton HAZ 55.2829 −128.0470 20 0.622 0.682 1 2.66
Houston HOU 54.4043 −126.6433 18 0.620 0.666 1 2.72
Kelowna KEL 49.9200 −119.3950 8 0.584 0.572 0 —
Northwest BC NWBC 58.3003 −130.6677 17 0.658 0.689 2 2.63
Vancouver VAN 49.2644 −123.0816 33 0.649 0.625 0 —
Fort St James John Prince Research Station FtStJ 1 54.6453 −124.3949 61 0.666 0.717 11 2.79
Prince George PG 53.8936 −122.8289 30 0.594 0.669 1 2.42
Southern Alberta 1 SAB1 49.3455 −114.4153 30 0.683 0.677 3 2.60
Southern Alberta 2 SAB2 49.0694 −113.8561 22 0.681 0.707 5 2.71
Microsatellite summary statistics for each population and all loci including: observed (Ho) and expected (He) heterozygosities, number of private alleles (PA) and allelic richness (AR).
Microgeographic genetic structure of chickadeesRV Adams et al
65
Heredity
STRUCTURE was run with the admixture model, correlated allele frequen-cies (Falush et al., 2003) and locations as priors (locpriors). To determine the
optimal number of clusters (K), we conducted ten independent runs (100 000
burn-in followed by 200 000 Markov chain Monte Carlo repetitions) for each
value of K (1–10). Results were averaged using STRUCTURE HARVESTER
v0.6.6 (Earl and vonHoldt, 2012) and both delta K (ΔK; Evanno et al., 2005)
and LnPr(X|K) were used to determine the true K. Any populations with
individuals showing mixed ancestry (for example, 50% Q to cluster 1, and 50%
Q to cluster 2) were rerun individually with two populations representing each
of the two clusters involved in the mixed ancestry to determine correct
assignment. This is important to check because as K increases above the true
K value, Q values will often decrease and split clusters (Pritchard et al., 2000).
This splitting of populations must be clarified before additional testing. Finally,
if multiple populations were assigned to the same genetic cluster, these
populations were rerun to test for additional substructure using the same
parameters as the initial run, but only to a maximum of five runs for each
K value.
Pairwise FST values were then calculated in GenAlEx v6.5 to investigate thedegree of genetic differentiation among the predefined populations. We also
calculated DEST (Jost, 2008) in SMOGD v1.2.5 (Crawford, 2010), an alternative
measure of diversity that accounts for allelic diversity and is shown to measure
genetic differentiation more accurately than traditional FST when using
polymorphic microsatellite markers (Heller and Siegismund, 2009). We
compared measures of DEST and FST to determine the true level of genetic
differentiation. As the theoretical maximum of 1 for FST is only valid when
there are two alleles, population-wide F’ST, standardised by the maximum FSTvalue, was calculated in GenAlEx v6.5. To further assess genetic structure
among populations, we carried out the principal coordinate analysis (PCoA)
using both FST and DEST in GenAlEx v6.5.
Landscape geneticsParameterisation of landscape variables. To assess the functional connectivityamong populations, we evaluated four competing models: (1) the null model of
isolation by geographical distance (Wright, 1943), (2) isolation by elevation
resistance, (3) isolation by land cover resistance and (4) isolation by combined
elevation and land cover resistance (that is, both land cover and elevation raster
layers were combined into one resistance layer, termed ‘land-elevation’ herein).
Pairwise resistance distances were calculated among all sampling sites using
spatial data sets and an eight-neighbour connection scheme in CIRCUITSCAPE
v4.0 (McRae, 2006). This method is based on circuit theory and uses resistance
distances to assess all possible pathways between two focal points (or
populations) to better map gene flow across the landscape and measure
isolation by resistance.
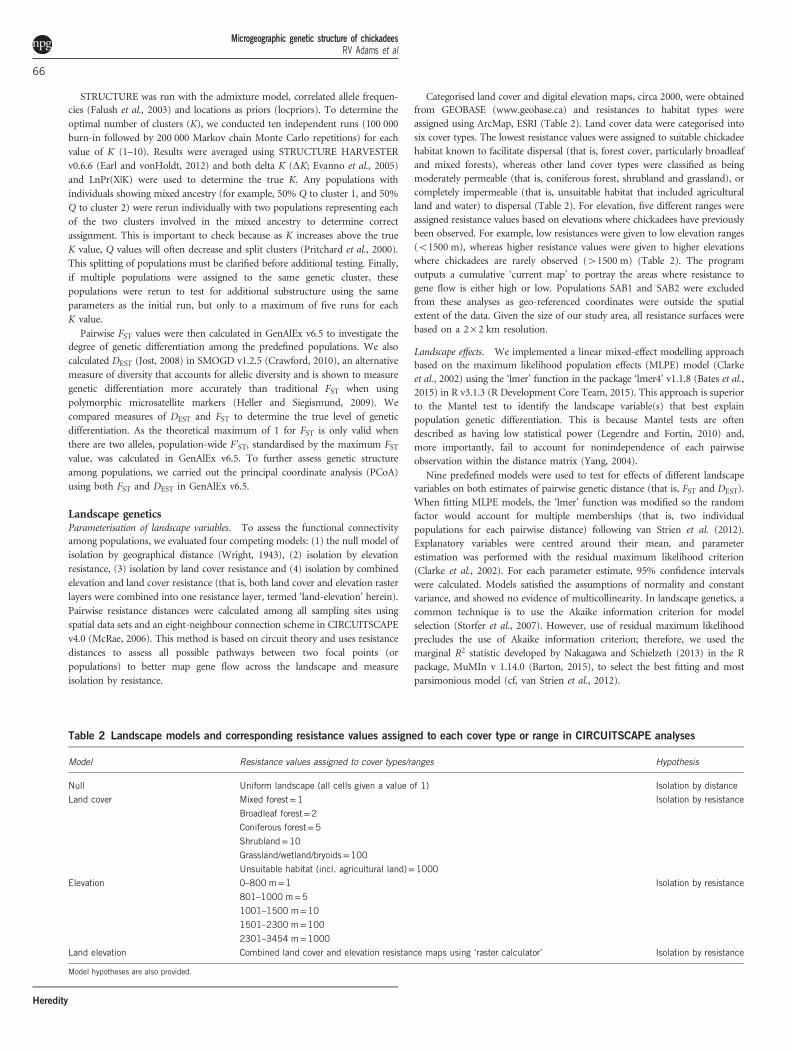
Categorised land cover and digital elevation maps, circa 2000, were obtainedfrom GEOBASE (www.geobase.ca) and resistances to habitat types wereassigned using ArcMap, ESRI (Table 2). Land cover data were categorised intosix cover types. The lowest resistance values were assigned to suitable chickadeehabitat known to facilitate dispersal (that is, forest cover, particularly broadleafand mixed forests), whereas other land cover types were classified as beingmoderately permeable (that is, coniferous forest, shrubland and grassland), orcompletely impermeable (that is, unsuitable habitat that included agriculturalland and water) to dispersal (Table 2). For elevation, five different ranges wereassigned resistance values based on elevations where chickadees have previouslybeen observed. For example, low resistances were given to low elevation ranges(o1500 m), whereas higher resistance values were given to higher elevationswhere chickadees are rarely observed (41500 m) (Table 2). The programoutputs a cumulative ‘current map’ to portray the areas where resistance togene flow is either high or low. Populations SAB1 and SAB2 were excludedfrom these analyses as geo-referenced coordinates were outside the spatialextent of the data. Given the size of our study area, all resistance surfaces werebased on a 2× 2 km resolution.
Landscape effects. We implemented a linear mixed-effect modelling approachbased on the maximum likelihood population effects (MLPE) model (Clarkeet al., 2002) using the ‘lmer’ function in the package ‘lmer4’ v1.1.8 (Bates et al.,2015) in R v3.1.3 (R Development Core Team, 2015). This approach is superiorto the Mantel test to identify the landscape variable(s) that best explainpopulation genetic differentiation. This is because Mantel tests are oftendescribed as having low statistical power (Legendre and Fortin, 2010) and,more importantly, fail to account for nonindependence of each pairwiseobservation within the distance matrix (Yang, 2004).
Nine predefined models were used to test for effects of different landscapevariables on both estimates of pairwise genetic distance (that is, FST and DEST).When fitting MLPE models, the ‘lmer’ function was modified so the randomfactor would account for multiple memberships (that is, two individualpopulations for each pairwise distance) following van Strien et al. (2012).Explanatory variables were centred around their mean, and parameterestimation was performed with the residual maximum likelihood criterion(Clarke et al., 2002). For each parameter estimate, 95% confidence intervalswere calculated. Models satisfied the assumptions of normality and constantvariance, and showed no evidence of multicollinearity. In landscape genetics, acommon technique is to use the Akaike information criterion for modelselection (Storfer et al., 2007). However, use of residual maximum likelihoodprecludes the use of Akaike information criterion; therefore, we used themarginal R2 statistic developed by Nakagawa and Schielzeth (2013) in the Rpackage, MuMIn v 1.14.0 (Barton, 2015), to select the best fitting and mostparsimonious model (cf, van Strien et al., 2012).
Table 2 Landscape models and corresponding resistance values assigned to each cover type or range in CIRCUITSCAPE analyses
Model Resistance values assigned to cover types/ranges Hypothesis
Null Uniform landscape (all cells given a value of 1) Isolation by distance
Land cover Mixed forest=1 Isolation by resistance
Broadleaf forest=2
Coniferous forest=5
Shrubland=10
Grassland/wetland/bryoids=100
Unsuitable habitat (incl. agricultural land)=1000
Elevation 0–800 m=1 Isolation by resistance
801–1000 m=5
1001–1500 m=10
1501–2300 m=100
2301–3454 m=1000
Land elevation Combined land cover and elevation resistance maps using ‘raster calculator’ Isolation by resistance
Model hypotheses are also provided.
Microgeographic genetic structure of chickadeesRV Adams et al
66
Heredity
RESULTS
Genetic structureGenetic diversity. Among all loci and populations, the total numberof alleles ranged from 3 to 46 alleles (Supplementary Table S2).Observed heterozygosity at each site and across all loci ranged from0.584 (KEL) to 0.683 (SAB1, followed closely by SAB2 at 0.681), andexpected heterozygosity ranged from 0.572 (KEL) to 0.717 (FtStJ1;Supplementary Table S3). Accounting for differences in sample size,allelic richness ranged from 2.42 (PG) to 2.79 (FtStJ1 and FF; Table 1).Of the 15 populations, 11 contained at least one private allele(Table 1); FtStJ1 contained the highest number of private alleles(PA= 11) followed by NBC and SAB2 (PA= 5). Null alleles weredetected at a low frequency for a number of loci and were notconsistent across populations with the exception of two loci: VeCr05(0–25%) and Cuμ28 (31–71%). We found a large difference betweenobserved and expected heterozygosities across populations for locusVeCr05 (Ho: 0.185, He: 0.306), but not for Cuμ28 (Ho: 0.485, He:0.502, Supplementary Table S3). Exclusion of VeCr05 and/ or Cuμ28did not alter the results, and hence all 14 loci were included in the finaldata set. Thirteen deviations from Hardy–Weinberg equilibrium(Supplementary Table S3) and two pairs of loci in disequilibriumwere identified after corrections for multiple tests. All deviations werethe result of a heterozygote deficit. Significant LD was found betweenloci Titgata02 and CTC101 (P⩽ 0.001) within FtStJ1 and between lociEscu6 and Titgata02 (P⩽ 0.001) within SAB1. As LD was notconsistent across populations and genotypes showed no association,it is possible that LD is the result of a type 1 error. Results were notsubstantially affected after removing either the underrepresented locior the feather-sampled populations (see summary statistics inSupplementary Table S4).
Population genetic structure. The two clustering analyses failed toconverge on the total number of genetic clusters (K), but a number ofgroupings were similar across analyses. As GENELAND producedmore distinct and biologically meaningful clustering of populations,we have focused our interpretation on GENELAND’s results andincluded the results of STRUCTURE as Supplementary Material forcomparison.
A hierarchical STRUCTURE analysis inferred seven genetic clusters(Supplementary Figure S1a) using both mean log likelihood(Pr(X|K)=− 17544.9) and ΔK (Supplementary Figure S1b). A largernumber of groupings was found in GENELAND; eight runs suggestedK= 9 and two runs suggested K= 10. As the highest posteriorprobability was for K= 9 (−958) we took this as being the trueestimation of K. For population membership and boundary graphs seeSupplementary Figure S2. The genetic clusters included singlepopulations (BCR, CLU, FtStJ1, NBC, NWBC and PG) as well asgroups of populations (KEL+VAN, SAB1+SAB2, and all remainingpopulations; Figure 1). Five of the groupings were identical to thoseidentified in STRUCTURE (BCR, NWBC, PG, FtStJ1 and VAN+KEL;Supplementary Figure S1). The distinction of PG and FtStJ1 isconcordant with patterns observed in our previous study (Adamsand Burg, 2015).Pairwise FST and DEST values showed a significant positive correla-
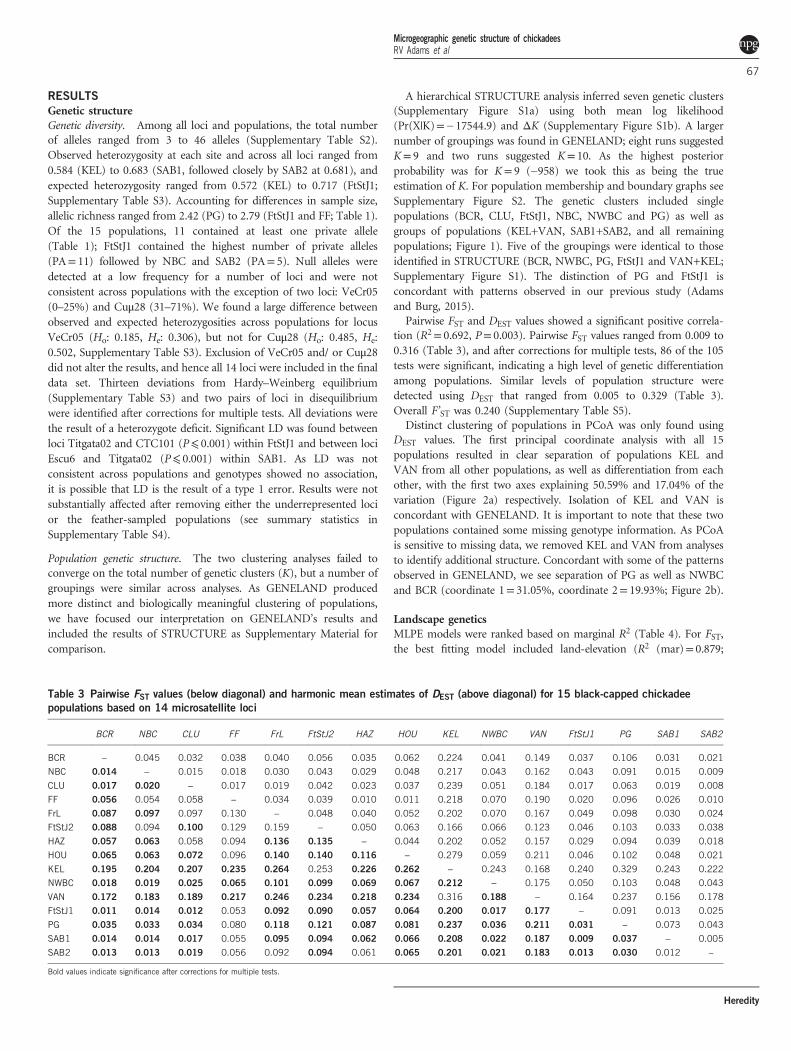
tion (R2= 0.692, P= 0.003). Pairwise FST values ranged from 0.009 to0.316 (Table 3), and after corrections for multiple tests, 86 of the 105tests were significant, indicating a high level of genetic differentiationamong populations. Similar levels of population structure weredetected using DEST that ranged from 0.005 to 0.329 (Table 3).Overall F’ST was 0.240 (Supplementary Table S5).Distinct clustering of populations in PCoA was only found using
DEST values. The first principal coordinate analysis with all 15populations resulted in clear separation of populations KEL andVAN from all other populations, as well as differentiation from eachother, with the first two axes explaining 50.59% and 17.04% of thevariation (Figure 2a) respectively. Isolation of KEL and VAN isconcordant with GENELAND. It is important to note that these twopopulations contained some missing genotype information. As PCoAis sensitive to missing data, we removed KEL and VAN from analysesto identify additional structure. Concordant with some of the patternsobserved in GENELAND, we see separation of PG as well as NWBCand BCR (coordinate 1= 31.05%, coordinate 2= 19.93%; Figure 2b).
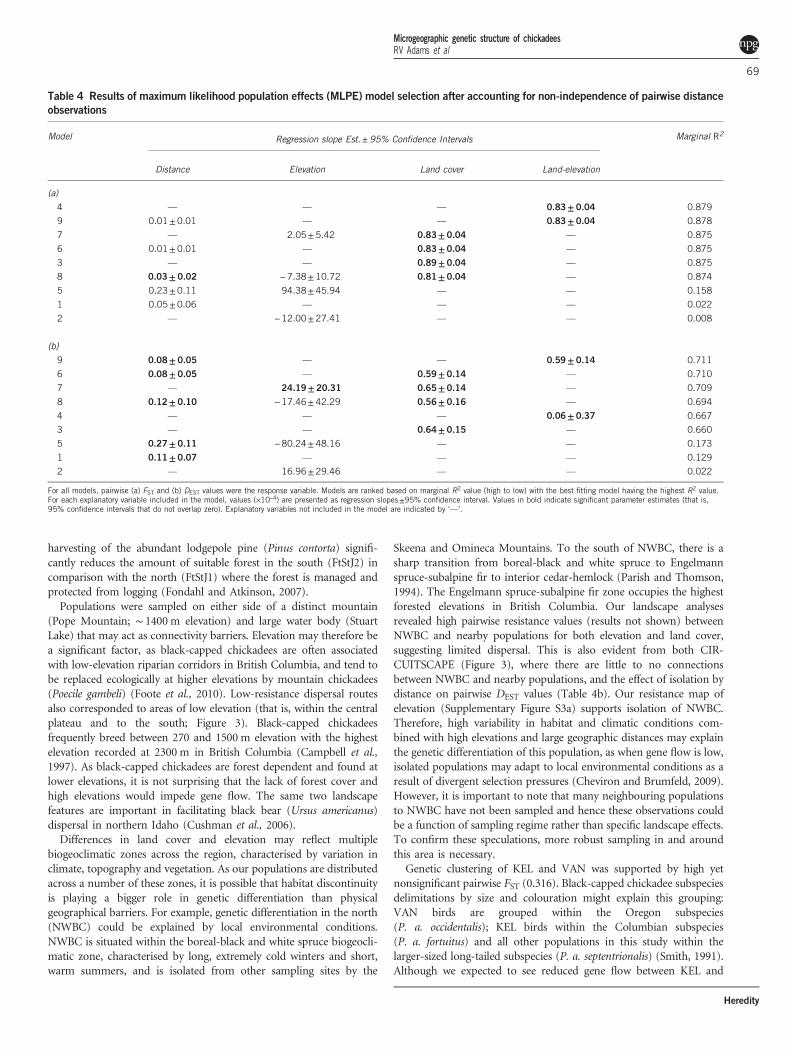
Landscape geneticsMLPE models were ranked based on marginal R2 (Table 4). For FST,the best fitting model included land-elevation (R2 (mar)= 0.879;
Table 3 Pairwise FST values (below diagonal) and harmonic mean estimates of DEST (above diagonal) for 15 black-capped chickadee
populations based on 14 microsatellite loci
BCR NBC CLU FF FrL FtStJ2 HAZ HOU KEL NWBC VAN FtStJ1 PG SAB1 SAB2
BCR − 0.045 0.032 0.038 0.040 0.056 0.035 0.062 0.224 0.041 0.149 0.037 0.106 0.031 0.021
NBC 0.014 − 0.015 0.018 0.030 0.043 0.029 0.048 0.217 0.043 0.162 0.043 0.091 0.015 0.009
CLU 0.017 0.020 − 0.017 0.019 0.042 0.023 0.037 0.239 0.051 0.184 0.017 0.063 0.019 0.008
FF 0.056 0.054 0.058 − 0.034 0.039 0.010 0.011 0.218 0.070 0.190 0.020 0.096 0.026 0.010
FrL 0.087 0.097 0.097 0.130 − 0.048 0.040 0.052 0.202 0.070 0.167 0.049 0.098 0.030 0.024
FtStJ2 0.088 0.094 0.100 0.129 0.159 − 0.050 0.063 0.166 0.066 0.123 0.046 0.103 0.033 0.038
HAZ 0.057 0.063 0.058 0.094 0.136 0.135 − 0.044 0.202 0.052 0.157 0.029 0.094 0.039 0.018
HOU 0.065 0.063 0.072 0.096 0.140 0.140 0.116 − 0.279 0.059 0.211 0.046 0.102 0.048 0.021
KEL 0.195 0.204 0.207 0.235 0.264 0.253 0.226 0.262 − 0.243 0.168 0.240 0.329 0.243 0.222
NWBC 0.018 0.019 0.025 0.065 0.101 0.099 0.069 0.067 0.212 − 0.175 0.050 0.103 0.048 0.043
VAN 0.172 0.183 0.189 0.217 0.246 0.234 0.218 0.234 0.316 0.188 − 0.164 0.237 0.156 0.178
FtStJ1 0.011 0.014 0.012 0.053 0.092 0.090 0.057 0.064 0.200 0.017 0.177 − 0.091 0.013 0.025
PG 0.035 0.033 0.034 0.080 0.118 0.121 0.087 0.081 0.237 0.036 0.211 0.031 − 0.073 0.043
SAB1 0.014 0.014 0.017 0.055 0.095 0.094 0.062 0.066 0.208 0.022 0.187 0.009 0.037 − 0.005
SAB2 0.013 0.013 0.019 0.056 0.092 0.094 0.061 0.065 0.201 0.021 0.183 0.013 0.030 0.012 −
Bold values indicate significance after corrections for multiple tests.
Microgeographic genetic structure of chickadeesRV Adams et al
67
Heredity
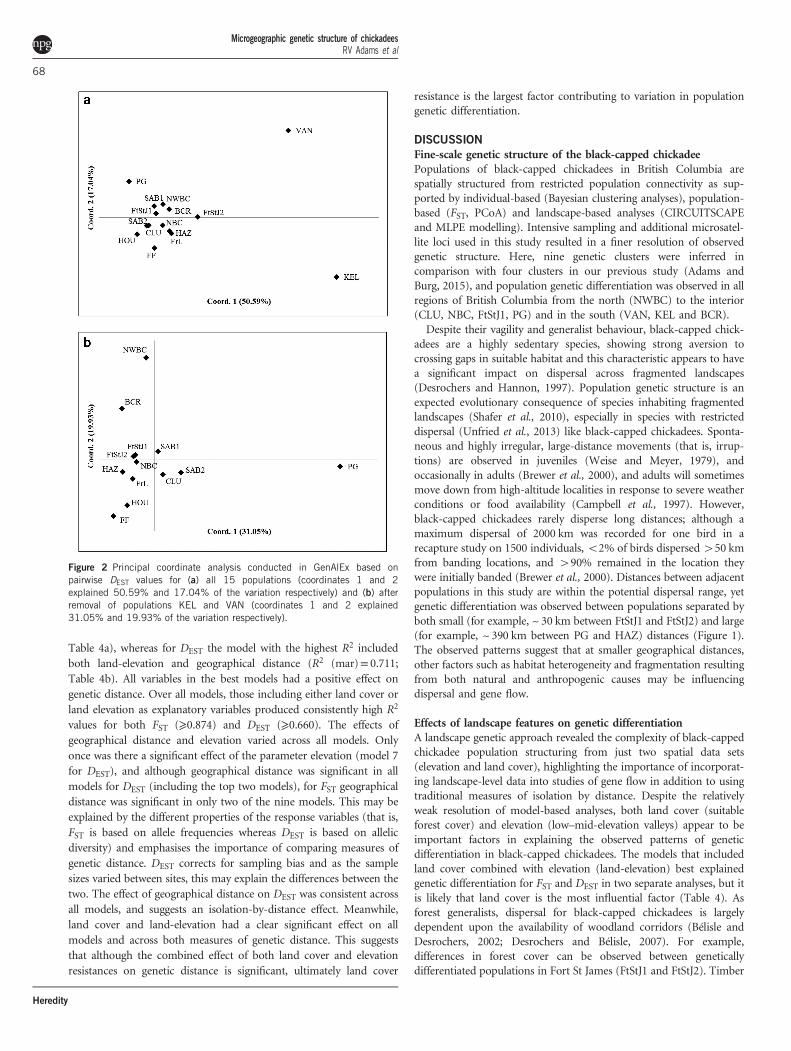
Table 4a), whereas for DEST the model with the highest R2 includedboth land-elevation and geographical distance (R2 (mar)= 0.711;Table 4b). All variables in the best models had a positive effect ongenetic distance. Over all models, those including either land cover orland elevation as explanatory variables produced consistently high R2
values for both FST (⩾0.874) and DEST (⩾0.660). The effects ofgeographical distance and elevation varied across all models. Onlyonce was there a significant effect of the parameter elevation (model 7for DEST), and although geographical distance was significant in allmodels for DEST (including the top two models), for FST geographicaldistance was significant in only two of the nine models. This may beexplained by the different properties of the response variables (that is,FST is based on allele frequencies whereas DEST is based on allelicdiversity) and emphasises the importance of comparing measures ofgenetic distance. DEST corrects for sampling bias and as the samplesizes varied between sites, this may explain the differences between thetwo. The effect of geographical distance on DEST was consistent acrossall models, and suggests an isolation-by-distance effect. Meanwhile,land cover and land-elevation had a clear significant effect on allmodels and across both measures of genetic distance. This suggeststhat although the combined effect of both land cover and elevationresistances on genetic distance is significant, ultimately land cover
resistance is the largest factor contributing to variation in populationgenetic differentiation.
DISCUSSION
Fine-scale genetic structure of the black-capped chickadeePopulations of black-capped chickadees in British Columbia arespatially structured from restricted population connectivity as sup-ported by individual-based (Bayesian clustering analyses), population-based (FST, PCoA) and landscape-based analyses (CIRCUITSCAPEand MLPE modelling). Intensive sampling and additional microsatel-lite loci used in this study resulted in a finer resolution of observedgenetic structure. Here, nine genetic clusters were inferred incomparison with four clusters in our previous study (Adams andBurg, 2015), and population genetic differentiation was observed in allregions of British Columbia from the north (NWBC) to the interior(CLU, NBC, FtStJ1, PG) and in the south (VAN, KEL and BCR).Despite their vagility and generalist behaviour, black-capped chick-
adees are a highly sedentary species, showing strong aversion tocrossing gaps in suitable habitat and this characteristic appears to havea significant impact on dispersal across fragmented landscapes(Desrochers and Hannon, 1997). Population genetic structure is anexpected evolutionary consequence of species inhabiting fragmentedlandscapes (Shafer et al., 2010), especially in species with restricteddispersal (Unfried et al., 2013) like black-capped chickadees. Sponta-neous and highly irregular, large-distance movements (that is, irrup-tions) are observed in juveniles (Weise and Meyer, 1979), andoccasionally in adults (Brewer et al., 2000), and adults will sometimesmove down from high-altitude localities in response to severe weatherconditions or food availability (Campbell et al., 1997). However,black-capped chickadees rarely disperse long distances; although amaximum dispersal of 2000 km was recorded for one bird in arecapture study on 1500 individuals, o2% of birds dispersed450 kmfrom banding locations, and 490% remained in the location theywere initially banded (Brewer et al., 2000). Distances between adjacentpopulations in this study are within the potential dispersal range, yetgenetic differentiation was observed between populations separated byboth small (for example, ~ 30 km between FtStJ1 and FtStJ2) and large(for example, ~ 390 km between PG and HAZ) distances (Figure 1).The observed patterns suggest that at smaller geographical distances,other factors such as habitat heterogeneity and fragmentation resultingfrom both natural and anthropogenic causes may be influencingdispersal and gene flow.
Effects of landscape features on genetic differentiationA landscape genetic approach revealed the complexity of black-cappedchickadee population structuring from just two spatial data sets(elevation and land cover), highlighting the importance of incorporat-ing landscape-level data into studies of gene flow in addition to usingtraditional measures of isolation by distance. Despite the relativelyweak resolution of model-based analyses, both land cover (suitableforest cover) and elevation (low–mid-elevation valleys) appear to beimportant factors in explaining the observed patterns of geneticdifferentiation in black-capped chickadees. The models that includedland cover combined with elevation (land-elevation) best explainedgenetic differentiation for FST and DEST in two separate analyses, but itis likely that land cover is the most influential factor (Table 4). Asforest generalists, dispersal for black-capped chickadees is largelydependent upon the availability of woodland corridors (Bélisle andDesrochers, 2002; Desrochers and Bélisle, 2007). For example,differences in forest cover can be observed between geneticallydifferentiated populations in Fort St James (FtStJ1 and FtStJ2). Timber
Figure 2 Principal coordinate analysis conducted in GenAlEx based onpairwise DEST values for (a) all 15 populations (coordinates 1 and 2explained 50.59% and 17.04% of the variation respectively) and (b) afterremoval of populations KEL and VAN (coordinates 1 and 2 explained31.05% and 19.93% of the variation respectively).
Microgeographic genetic structure of chickadeesRV Adams et al
68
Heredity
harvesting of the abundant lodgepole pine (Pinus contorta) signifi-cantly reduces the amount of suitable forest in the south (FtStJ2) incomparison with the north (FtStJ1) where the forest is managed andprotected from logging (Fondahl and Atkinson, 2007).Populations were sampled on either side of a distinct mountain
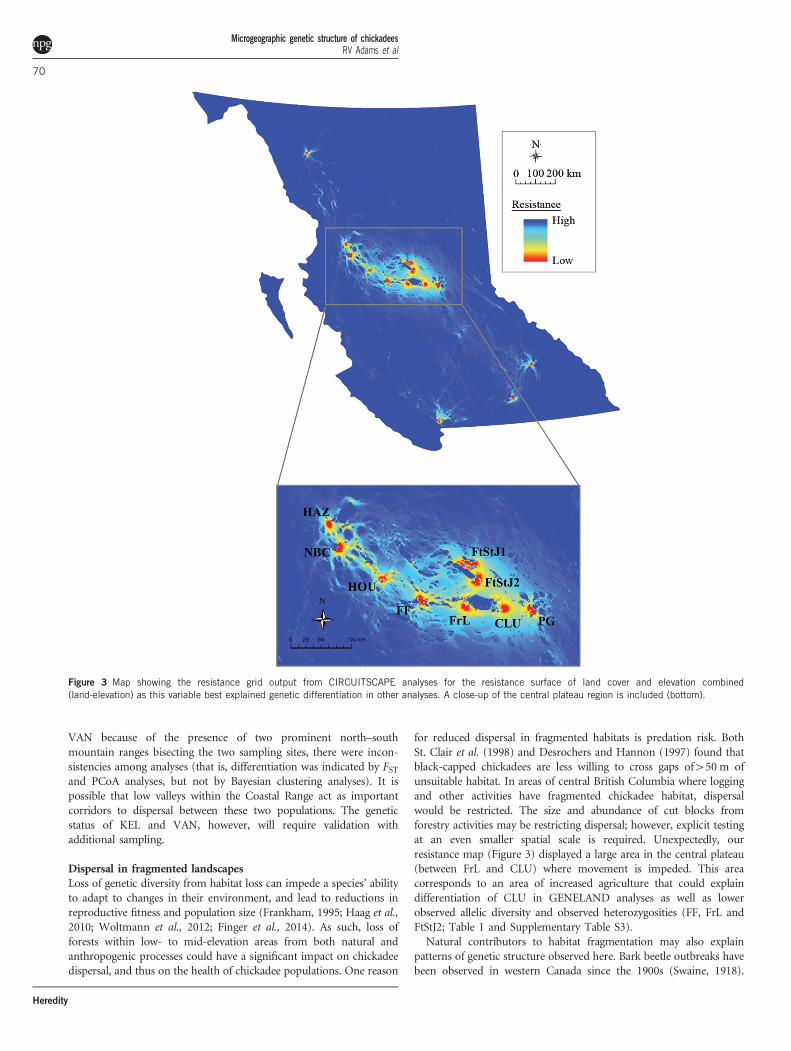
(Pope Mountain; ∼ 1400 m elevation) and large water body (StuartLake) that may act as connectivity barriers. Elevation may therefore bea significant factor, as black-capped chickadees are often associatedwith low-elevation riparian corridors in British Columbia, and tend tobe replaced ecologically at higher elevations by mountain chickadees(Poecile gambeli) (Foote et al., 2010). Low-resistance dispersal routesalso corresponded to areas of low elevation (that is, within the centralplateau and to the south; Figure 3). Black-capped chickadeesfrequently breed between 270 and 1500 m elevation with the highestelevation recorded at 2300 m in British Columbia (Campbell et al.,1997). As black-capped chickadees are forest dependent and found atlower elevations, it is not surprising that the lack of forest cover andhigh elevations would impede gene flow. The same two landscapefeatures are important in facilitating black bear (Ursus americanus)dispersal in northern Idaho (Cushman et al., 2006).Differences in land cover and elevation may reflect multiple
biogeoclimatic zones across the region, characterised by variation inclimate, topography and vegetation. As our populations are distributedacross a number of these zones, it is possible that habitat discontinuityis playing a bigger role in genetic differentiation than physicalgeographical barriers. For example, genetic differentiation in the north(NWBC) could be explained by local environmental conditions.NWBC is situated within the boreal-black and white spruce biogeocli-matic zone, characterised by long, extremely cold winters and short,warm summers, and is isolated from other sampling sites by the
Skeena and Omineca Mountains. To the south of NWBC, there is asharp transition from boreal-black and white spruce to Engelmannspruce-subalpine fir to interior cedar-hemlock (Parish and Thomson,1994). The Engelmann spruce-subalpine fir zone occupies the highestforested elevations in British Columbia. Our landscape analysesrevealed high pairwise resistance values (results not shown) betweenNWBC and nearby populations for both elevation and land cover,suggesting limited dispersal. This is also evident from both CIR-CUITSCAPE (Figure 3), where there are little to no connectionsbetween NWBC and nearby populations, and the effect of isolation bydistance on pairwise DEST values (Table 4b). Our resistance map ofelevation (Supplementary Figure S3a) supports isolation of NWBC.Therefore, high variability in habitat and climatic conditions com-bined with high elevations and large geographic distances may explainthe genetic differentiation of this population, as when gene flow is low,isolated populations may adapt to local environmental conditions as aresult of divergent selection pressures (Cheviron and Brumfeld, 2009).However, it is important to note that many neighbouring populationsto NWBC have not been sampled and hence these observations couldbe a function of sampling regime rather than specific landscape effects.To confirm these speculations, more robust sampling in and aroundthis area is necessary.Genetic clustering of KEL and VAN was supported by high yet
nonsignificant pairwise FST (0.316). Black-capped chickadee subspeciesdelimitations by size and colouration might explain this grouping:VAN birds are grouped within the Oregon subspecies(P. a. occidentalis); KEL birds within the Columbian subspecies(P. a. fortuitus) and all other populations in this study within thelarger-sized long-tailed subspecies (P. a. septentrionalis) (Smith, 1991).Although we expected to see reduced gene flow between KEL and
Table 4 Results of maximum likelihood population effects (MLPE) model selection after accounting for non-independence of pairwise distance
observations
Model Regression slope Est.±95% Confidence Intervals Marginal R2
Distance Elevation Land cover Land-elevation
(a)4 — — — 0.83±0.04 0.879
9 0.01±0.01 — — 0.83±0.04 0.878
7 — 2.05±5.42 0.83±0.04 — 0.875
6 0.01±0.01 — 0.83±0.04 — 0.875
3 — — 0.89±0.04 — 0.875
8 0.03±0.02 −7.38±10.72 0.81±0.04 — 0.874
5 0.23±0.11 94.38±45.94 — — 0.158
1 0.05±0.06 — — — 0.022
2 — −12.00±27.41 — — 0.008
(b)9 0.08±0.05 — — 0.59±0.14 0.711
6 0.08±0.05 — 0.59±0.14 — 0.710
7 — 24.19±20.31 0.65±0.14 — 0.709
8 0.12±0.10 −17.46±42.29 0.56±0.16 — 0.694
4 — — — 0.06±0.37 0.667
3 — — 0.64±0.15 — 0.660
5 0.27±0.11 −80.24±48.16 — — 0.173
1 0.11±0.07 — — — 0.129
2 — 16.96±29.46 — — 0.022
For all models, pairwise (a) FST and (b) DEST values were the response variable. Models are ranked based on marginal R2 value (high to low) with the best fitting model having the highest R2 value.For each explanatory variable included in the model, values (×10–4) are presented as regression slopes±95% confidence interval. Values in bold indicate significant parameter estimates (that is,95% confidence intervals that do not overlap zero). Explanatory variables not included in the model are indicated by ‘—’.
Microgeographic genetic structure of chickadeesRV Adams et al
69
Heredity
VAN because of the presence of two prominent north–southmountain ranges bisecting the two sampling sites, there were incon-sistencies among analyses (that is, differentiation was indicated by FSTand PCoA analyses, but not by Bayesian clustering analyses). It ispossible that low valleys within the Coastal Range act as importantcorridors to dispersal between these two populations. The geneticstatus of KEL and VAN, however, will require validation withadditional sampling.
Dispersal in fragmented landscapesLoss of genetic diversity from habitat loss can impede a species’ abilityto adapt to changes in their environment, and lead to reductions inreproductive fitness and population size (Frankham, 1995; Haag et al.,2010; Woltmann et al., 2012; Finger et al., 2014). As such, loss offorests within low- to mid-elevation areas from both natural andanthropogenic processes could have a significant impact on chickadeedispersal, and thus on the health of chickadee populations. One reason
for reduced dispersal in fragmented habitats is predation risk. BothSt. Clair et al. (1998) and Desrochers and Hannon (1997) found thatblack-capped chickadees are less willing to cross gaps of450 m ofunsuitable habitat. In areas of central British Columbia where loggingand other activities have fragmented chickadee habitat, dispersalwould be restricted. The size and abundance of cut blocks fromforestry activities may be restricting dispersal; however, explicit testingat an even smaller spatial scale is required. Unexpectedly, ourresistance map (Figure 3) displayed a large area in the central plateau(between FrL and CLU) where movement is impeded. This areacorresponds to an area of increased agriculture that could explaindifferentiation of CLU in GENELAND analyses as well as lowerobserved allelic diversity and observed heterozygosities (FF, FrL andFtStJ2; Table 1 and Supplementary Table S3).Natural contributors to habitat fragmentation may also explain
patterns of genetic structure observed here. Bark beetle outbreaks havebeen observed in western Canada since the 1900s (Swaine, 1918).
Figure 3 Map showing the resistance grid output from CIRCUITSCAPE analyses for the resistance surface of land cover and elevation combined(land-elevation) as this variable best explained genetic differentiation in other analyses. A close-up of the central plateau region is included (bottom).
Microgeographic genetic structure of chickadeesRV Adams et al
70
Heredity
Current outbreaks are spreading quickly with warmer/milder wintersfacilitating their expansion across western Canada. The mountain pinebeetle outbreak has destroyed huge portions of mature pine foreststhroughout British Columbia, particularly in the central plateau regionwithin elevations of 800 and 1400 m (Safranyik and Wilson, 2006).Habitat loss could be leading to high levels of population isolationhere, particularly in low–mid-elevation forested valleys that serve asdispersal corridors. In fact, a number of populations within this regionare showing signs of reduced genetic diversity, particularly the PGpopulation (Ho= 0.594, He= 0.669; Table 1), suggesting that somepopulations may be experiencing a bottleneck as a result of restrictedgene flow. Thus, despite being common, widely distributed and oflittle conservation concern (IUCN Red List), isolated chickadeepopulations may be undergoing microevolutionary processes thatmay eventually lead to local adaptation.
CONCLUSIONS
Weak population genetic differentiation is expected for common andwidespread species with the ability to disperse among habitat patches(that is, bird flight), but our findings suggest that variation and/orchanges in the environment can affect genetic differentiation in mobilespecies, resulting in microgeographic population structuring.Dispersal and gene flow among black-capped chickadee populations
appear to be affected by variation in landscape topography and forestcover, features critical to chickadee survival and reproductive success.Climatic differences among sampling sites may also create differentialselective pressures. The importance of including landscape featureswhen assessing connectivity and population differentiation is particu-larly relevant when identifying vulnerable populations and manage-ment units, as over time isolated populations may diverge throughlocal adaptation or inbreeding. In the face of climate change,biogeographic zones will change and forest tree species are underthreat of shifting and narrowing distributions (Hebda, 1997; Hamannand Wang, 2006; Wang et al., 2012) that could in turn, have an impacton black-capped chickadee populations. Changes in precipitation andwinter temperature have already driven shifts in the geographicpatterns of abundance of bird populations in western North America(Illán et al., 2014).Overall, when assessing patterns of genetic differentiation of
populations, a smaller sampling scale and the inclusion of more locican provide additional patterns of genetic structure. In addition,incorporating both landscape features and environmental variableswhen explaining patterns can significantly improve our understandingof how species evolve in response to changes in their environment.
DATA ACCESSIBILITY
Genotype data are available from the Dryad Digital Repository:doi:10.5061/dryad.gs228.
CONFLICT OF INTEREST
The authors declare no conflict of interest.
ACKNOWLEDGEMENTS
Funding for this project was provided by the Natural Science and EngineeringResearch Council (NSERC) Discovery Grant and Alberta Innovates (AI) NewFaculty Award. We also thank P Pulgarin-Restrepo, B Graham, K Gohdes, CMacFarlane, A Martin and volunteers from Project Feederwatch and BC BirdBreeding Atlas for helping with sample collection for this project. Finally, wethank Dr Maarten J van Strien for his expertise in the R programmingenvironment.
Adams RV, Burg TM (2015). Influence of ecological and geological features on rangewidepatterns of genetic structure in a widespread passerine. Heredity 114: 143–154.
Baguette M, Van Dyck H (2007). Landscape connectivity and animal behavior: functionalgrain as a key determinant for dispersal. Landsc Ecol 22: 1117–1129.
Barton K (2015). MuMIn: Multi-Model Inference. R package version 1.14.0 http://CRAN.R-project.org/package=MuMIn.
Bates D, Maechler M, Bolker B, Walker S (2015). lme4: Linear mixed-effects models usingEigen and S4_. R package version 1.1-8, http://CRAN.R-project.org/package= lme4.
Benjamini Y, Yekutieli D (2001). The control of false discovery rate under dependency. AnnStat 29: 1165–1188.
Blackburn I, Godwin S (2003). The status of the Northern Spotted Owl (Strix occidentaliscaurina) in British Columbia. Draft report for Ministry of Water, Land and Air Protection:Victoria, BC.
Brewer AD, Diamond AW, Woodsworth EJ, Collins BT, Dunn EH (2000). The Atlas ofCanadian Bird Banding, 1921-95. Volume 1: Doves, Cuckoos and Hummingbirdsthrough Passerines. CWS Publication: Ottawa, Canada.
Bélisle M, Desrochers A (2002). Gap-crossing decisions by forest birds: an empirical basisfor parameterizing spatially-explicit, individual-based models. Landsc Ecol 17:219–231.
Campbell W, Dawe NK, McTaggart-Cowan I, Cooper JM, Kaiser GW, McNall MCE et al.(1997). Birds of British Columbia, Volume 3, Passerines-Flycatchers through Vireos.UBC Press: Vancouver, BC, Canada.
Cheviron ZA, Brumfeld RT (2009). Migration-selection balance and local adaptation ofmitochondrial haplotypes in rufous-collared sparrows (Zonotrichia capensis) along anelevational gradient. Evolution 63: 1593–1605.
Clarke RT, Rothery P, Raybould AF (2002). Confidence limits for regression relationshipsbetween distance matrices: estimating gene flow with distance. J Agric Biol Environ Stat7: 361–372.
COSEWIC (2008). COSEWIC assessment and update status report on the Spotted Owl Strixoccidentalis caurina, Caurina subspecies, in Canada. Committee on the Status ofEndangered Wildlife in Canada: Ottawa. vii+48 pp.
Crawford NG. (2010). SMOGD: software for the measurement of genetic diversity. Mol EcolResour 10: 556–557.
Cushman SA, McKelvey KS, Hayden J, Schwartz MK (2006). Gene flow in complexlandscapes: testing multiple hypotheses with causal modeling. Am Nat 168: 486–499.
Desrochers A, Bélisle M (2007). Edge, patch, and landscape effects on Parid distributionand movements. In: Otter KA (ed), The Ecology of Chickadees and Titmice: AnIntegrated Approach. Oxford University Press: Oxford, UK, pp 243–261.
Desrochers A, Hannon SJ (1997). Gap crossing decisions by forest songbirds during thepost-fledging period. Conserv Biol 11: 1204–1210.
Earl DA, vonHoldt BM (2012). STRUCTURE HARVESTER: a website and program forvisualizing STRUCTURE output and implementing the Evanno method. Conserv GenetResour 4: 359–361.
Evanno G, Regnaut S, Goudet J (2005). Detecting the number of clusters of individualsusing the software STRUCTURE: a simulation study. Mol Ecol 14: 2611–2620.
Falush D, Stephens M, Pritchard JK (2003). Inference of population structure usingmultilocus genotype data: linked loci and correlated allele frequencies. Genetics 164:1567–1587.
Finger A, Radespiel U, Habel JC, Kettle CJ, Koh LP (2014). Forest fragmentation genetics:what can genetics tell us about forest fragmentation? In: Kettle CJ, Koth LP (eds),Global Forest Fragmentation. Department of Environmental System Science: Zurich,Switzerland, p 50.
Fondahl G, Atkinson D (2007). Remaking space in north-central British Columbia: theestablishment of the John Prince Research Forest. British Columbia Studies 154:67–95.
Foote JR, Mennill DJ, Ratcliffe LM, Smith S (2010). Black-capped Chickadee (Poecileatricapillus), The Birds of North America Online. In: Poole A (ed), Cornell Lab ofOrnithology: Ithaca. retrieved from the Birds of North America Online: http://bna.birds.cornell.edu/bna/species/039X.
Fort KT, Otter KA (2004a). Effects of habitat disturbance on reproduction in black-cappedchickadees (Poecile atricapillus) in Northern British Columbia. Auk 121: 1070–1080.
Fort KT, Otter KA (2004b). Territorial breakdown of black-capped chickadees Poecileatricapillus, in disturbed habitats? Anim Behav 68: 407–415.
Frankham R (1995). Conservation genetics. Annu Rev Genet 29: 305–327.Frantz AC, Bertouille S, Eloy MC, Licoppe A, Chaumont F, Flamand MC (2012).
Comparative landscape genetic analyses show a Belgian motorway to be a gene flowbarrier for red deer (Cervus elaphus), but not wild boars (Sus scrofa). Mol Ecol 21:3445–3457.
Gavin DG, Hu FS (2013). Northwestern North America. In: Elias SA (ed), The Encyclopediaof Quaternary Science. Elsevier: Amsterdam.
Goudet J (2001). FSTAT, a program to estimate and test gene diversities and fixationindices (version 2.9.3). Available from www.uni.ch/popgen/softwares/fsat.htm Updatedfrom Goudet (1995).
Grava T, Fairhurst GD, Avey MT, Grava A, Bradley J, Avis JL et al. (2013b). Habitat qualityaffects early physiology and subsequent neuromotor development of juvenile black-capped chickadees. PLoS One 8: e71852.
Grava T, Grava A, Otter KA (2013a). Habitat-induced changes in song consistency affectperception of social status in male chickadees. Behav Ecol Sociobiol 67: 1699–1707.
Guillot G, Estoup A, Mortier F, Cosson J F (2005b). A spatial statistical model for landscapegenetics. Genetics 170: 1261–1280.
Guillot G, Mortier F, Estoup A (2005a). GENELAND: a computer package for landscapegenetics. Mol Ecol Notes 5: 712–715.
Microgeographic genetic structure of chickadeesRV Adams et al
71
Heredity
Haag T, Santos AS, Sana DA, Morato RG, Cullen L Jr, Crawshaw PG Jr et al. (2010). Theeffect of habitat fragmentation on the genetic structure of a top predator: loss ofdiversity and high differentiation among remnant populations of Atlantic Forest jaguars(Panthera onca). Mol Ecol 19: 4906–4921.
Hamann A, Wang T (2006). Potential effects of climate change on ecosystem and treespecies distribution in British Columbia. Ecology 87: 2773–2786.
Hebda RJ (1997). Impact of climate change on biogeoclimatic zones of British Columbiaand Yukon. In: Taylor B, Taylor EM (eds), Responding to Global Climate Change inBritish Columbia and Yukon, Vol 1. BC Ministry of Environment, Lands and Parks:Victoria, BC, Canada.
Heller R, Siegismund HR (2009). Relationship between three measures of geneticdifferentiation GST, DEST and G’ST: how wrong have we been? Mol Ecol 18:2080–2083.
Holderegger R, Wagner HH (2008). Landscape genetics. Bioscience 58: 199–207.Illán JG, Thomas CD, Jones JA, Wong WK., Shirley SM, Betts M.G (2014). Precipitation
and winter temperature predict long-term range-scale abundance changes in WesternNorth American birds. Global Change Biol 20: 3351–3364.
Jost L (2008). GST and its relatives do not measure differentiation. Mol Ecol 17:4015–4026.
Legendre P, Fortin M-J (2010). Comparison of the Mantel test and alternative approachesfor detecting complex multivariate relationships in the spatial analysis of genetic data.Mol Ecol Resour 10: 831–844.
Levy E, Kennington WJ, Tomkins JL, LeBas NR (2012). Phylogeography and populationgenetic structure of the ornate dragon lizard, Ctenophorus ornatus. PLoS One 7:e46351.
Manel S, Holderegger R (2013). Ten years of landscape genetics. Trends Ecol Evol 28:614–621.
Manel S, Schwartz MK, Luikart G, Taberlet P (2003). Landscape genetics: combininglandscape ecology and population genetics. Trends Ecol Evol 18: 189–197.
Martin K, Norris A, Drever M (2006). Effects of bark beetle outbreaks on avian biodiversityin the British Columbia interior: implications for critical habitat management. BC JEcosyst Manag 7: 10–24.
McRae B (2006). Isolation by resistance. Evolution 60: 1551–1561.Meidinger D, Pojar J (1991). Ecosystems of British Columbia. B.C. Min. For., Victoria, BC.
Spec. Rep. Series 6.Nakagawa S, Schielzeth H (2013). A general and simple method for obtaining R2 from
generalized linear mixed-effects models. Methods Ecol Evol 4: 133–142.Parish R, Thomson S (1994). Tree Books: Learning to Recognize Trees of British
Columbia, 1st edn. BC Ministry of Forests and Canadian Forest Service: Victoria, BC,Canada, p 176.
Peakall R, Smouse PE (2012). GenAlEx 6.5: genetic analysis in Excel. Population geneticsoftware for teaching and research–an update. Bioinformatics 28: 2537–2539.
Pritchard JK, Stephens M, Donelly P (2000). Inference of population structure usingmultilocus genotype data. Genetics 155: 945–959.
R Development Core Team (2015). R: A Language and Environment for StatisticalComputing. R Foundation for Statistical Computing: Vienna, Austria http://www.R-project.org.
Raymond M, Rousset F (1995). GENEPOP (version 1.2): population genetics software forexact tests and ecumenicism. J Hered 86: 248–249.
Rousset F (2008). GENEPOP'007: a complete re-implementation of the GENEPOPsoftware for Windows and Linux. Mol Ecol Resour 8: 103–106.
Runde DE, Capen DE (1987). Characteristics of northern hardwood trees used by cavity-nesting birds. J Wildl Manage 51: 217–223.
Safranyik L, Wilson WR (2006). The Mountain Pine Beetle: A Synthesis of Biology,Management, and Impacts on Lodgepole Pine. Natural Resources Canada, CanadianForest Service, Pacific Forestry Centre: Victoria, British Columbia, Canada, pp 304.
Selkoe KA, Toonen RJ (2006). Microsatellites for ecologists: a practical guide to using andevaluating microsatellite markers. Ecol Lett 9: 615–629.
Shafer ABA, Côté SD, Coltman DW (2010). Hot spots of genetic diversity descended frommultiple Pleistocene refugia in an alpine ungulate. Evolution 65: 125–138.
Smith SM (1991). The Black-Capped Chickadee: Behavioural Ecology and Natural History.Comstock Publishing: Ithaca, NY, USA, pp 362.
Smith SM (1993). Black-capped chickadee (Parus atricapillus). In: Poole A, Gill F (eds),The Birds of North America. The Birds of North America, Inc.: Philadelphia, PA, pp 39.
Sork VL, Waits L (2010). Contributions of landscape genetics–approaches, insights, andfuture potential. Mol Ecol 19: 3489–3495.
St. Clair CC, Bélisle M, Desrochers A, Hannon S (1998). Winter responses of forest birds tohabitat corridors and gaps. Conserv Ecol 2: 13.
Storfer A, Murphy MA, Evans JS, Goldberg CS, Robinson S, Spear SF et al. (2007). Puttingthe ‘landscape’ in landscape genetics. Heredity 98: 128–142.
Swaine JM (1918). Insect injuries to forests in British Columbia. In: Whitford HN, Craig RD(eds), The Forests of British Columbia. Commission on Conservation Canada: Ottawa,pp 220–236.
Unfried TM, Hauser L, Marzluff JM. (2013). Effects of urbanization on song sparrow(Melospiza melodia) population connectivity. Conserv Genet 14: 41–53.
van Oort H, Otter KA, Fort K, Holschuh CI (2006). Habitat quality, social dominanceand dawn chorus song output in black-capped chickadees. Ethology 112:772–778.
van Oosterhout C, Hutchinson WF, Wills DPM, Shipley P (2004). MICRO-CHECKER:software for identifying and correcting genotyping errors in microsatellite data. Mol Ecol4: 535–538.
van Strien MJ, Keller D, Holderegger R (2012). A new analytical approach to landscapegenetic modelling: least-cost transect analysis and linear mixed models. Mol Ecol 21:4010–4023.
Walsh PS, Metzger DA, Higuchi R (1991). Chelex 100 as a medium for simpleextraction of DNA for PCR based typing from forensic material. Biotechniques 10:506–513.
Wang T, Campbell EM, O’Neill GA, Aitken SN (2012). Projecting future distributions ofecosystem climate niches: Uncertainties and management applications. Forest EcolManag 279: 128–140.
Weise CM, Meyer JR (1979). Juvenile dispersal and development of site-fidelity in theblack-capped chickadee. Auk 96: 40–45.
With KA, Gardner RH, Turner MG (1997). Landscape connectivity and populationdistributions in heterogeneous environments. Oikos 78: 151–169.
Woltmann S, Kreiser BR, Sherry TW (2012). Fine-scale genetic population structure of anunderstory rainforest bird in Costa Rica. Conserv Genet 13: 925–935.
Wright S (1943). Isolation by distance. Genetics 28: 114.Yang R-C (2004). A likelihood-based approach to estimating and testing for isolation by
distance. Evolution 58: 1839–1845.Yezerinac S, Moola FM (2006). Conservation status and threats to species associated with
old-growth forests within the range of the Northern Spotted Owl (Strix occidentaliscaurina) in British Columbia, Canada. Biodiversity 6: 3–9.
Supplementary Information accompanies this paper on Heredity website (http://www.nature.com/hdy)
Microgeographic genetic structure of chickadeesRV Adams et al
72
Heredity