influence of pitfall trap size and design on herpetofauna
TRANSCRIPT

© 2011 Sociedade Brasileira de Zoologia | www.sbzoologia.org.br | All rights reserved.
ZOOLOGIA 28 (1): 80–91, February, 2011doi: 10.1590/S1984-46702011000100012
In biodiversity studies the choice of sampling methods isimportant in determining how well one is able to effectivelysample the target fauna, and therefore how successfully the wholestudy is accomplished. Moreover, biodiversity studies will be offar more value if their results are comparable between sites, sothat broader conclusions can be made – an important point forachieving a better understanding of the ecosystems and for thedevelopment of environmental policies. Such comparabilityhowever is difficult to achieve, especially in the absence of stud-ies comparing the effectiveness of different designs of samplingmethods, making their choice a question of personal preference.For terrestrial vertebrates, which concern many secretive spe-cies of leaf litter amphibians, lizards and small mammals, one ofthe most commonly used sampling technique are pitfall traps(THOMPSON et al. 2005), usually associated with drift fences toenhance their effectiveness (RICE et al. 1994). This method is ef-fective for detection of rare species and estimation of speciesrichness and abundance in small mammal and herpetofaunacommunities, even though restricted to leaf litter fauna (BURY &RAPHAEL 1983, BURY & CORN 1987, GREENBERG et al. 1994, RICE et al.1994, RYAN et al. 2002, UMETSU et al. 2006). UMETSU et al. (2006)suggested the technique as essential for inventorying the smallmammal fauna of the tropics, capturing more species and moreindividuals than Sherman traps (but see SANTOS-FILHO et al. 2006
for opposite results). In a comparison between four herpetofaunalsampling techniques (pitfall, funnel and glue traps, and activesampling), RIBEIRO-JÚNIOR et al. (2008) found that pitfall traps cap-tured the largest number of species in Amazonian primary forest,and the highest rate of exclusive leaf litter species. However,pitfall traps vary in many ways, which make it difficult to com-pare results from different studies. Besides, few studies comparethe effectiveness of different designs and sizes of pitfall traps,both for herpetofauna and small mammals, and they are mostlyconfined to the Neartic region (e.g. MENGAK & GUYNN 1978, ENGE
2001), Australian region (e.g. HOPPER 1981, MENKHORST 1982,BRAITHWAITE 1983, FRIEND & MITCHELL 1988, MORTON et al. 1988,FRIEND et al. 1989, HOBBS et al. 1994, ROLFE & MCKENZIE 2000, MOSEBY
& READ 2001, THOMPSON et al. 2005), and Africa (e.g. MARITZ et al.2007). For the Neotropical region no study is available for smallmammals. CECHIN & MARTINS (2000) made a descriptive compari-son between previous herpetofaunal studies chosen fromdifferent biomes in Brazil, and RIBEIRO-JÚNIOR et al. (2008) con-ducted a standardized comparison of patterns of species richness,rank-abundance, and community structure as revealed by twopitfall trap sizes (35 and 62 L buckets) in Amazonian forest.
A variety of containers has been used as pitfall traps, in-cluding metal cans, PVC pipes and plastic buckets or cones ofvarying dimensions (HOW et al. 1984). Differences between con-
Influence of pitfall trap size and design on herpetofauna and smallmammal studies in a Neotropical Forest
Marco A. Ribeiro-Júnior1,3; Rogério V. Rossi2;Cleuton L. Miranda1 & Teresa C. S. Ávila-Pires1
1 Museu Paraense Emílio Goeldi & Programa de Pós-graduação em Zoologia, Universidade Federal do Pará-Museu ParaenseEmílio Goeldi. Caixa Postal 399, 66017-970 Belém, Pará, Brazil.2 Departamento de Biologia e Zoologia, Instituto de Biociências, Universidade Federal de Mato Grosso. 78060-900 Cuiabá,Mato Grosso, Brazil.3 Correspondig author. E-mail: [email protected]
ABSTRACT. One of the most commonly used sampling techniques to capture leaf litter amphibians, lizards and small
mammals is a set of pitfall traps with drift fences. However, there are still many speculations concerning the effectiveness
of different designs of pitfall traps and the most adequate size of each trap. To address this problem, we conducted the
first standardized comparison of patterns of species richness, rank-abundance, and community structure of leaf litter
amphibians, lizards and small mammals for two trap designs (I and Y format) and three bucket sizes (35, 62, and 100 L)
in a Neotropical forest. Results are very similar for the herpetofauna, regardless of the pitfall trap design or size used,
while for small mammals values of species richness were higher for 100 L pitfall traps, as compared to the smaller traps.
Therefore, the use of 100 L pitfall traps is recommended to sample the terrestrial vertebrate fauna, in multidisciplinary
studies. For surveys aiming only the herpetofauna the use of smaller (35 L) traps is acceptable, taking into consideration
the cost-benefits obtained by the smaller traps, in comparison to the larger ones.
KEY WORDS. Amphibians; faunal survey; Neotropical forest; reptiles; sampling method; small mammals.

81Influence of pitfall trap size and design on herpetofauna and small mammal
ZOOLOGIA 28 (1): 80–91, February, 2011
tainers represent one of the variables that may explain distinctresults obtained in comparisons between methods. For instance,FRIEND et al. (1989) observed, in a study site in Australia, thatsmall mammals were caught equally often in 20L buckets and160 mm-diameter PVC pipes, while THOMPSON et al. (2005) foundthat 150 x 600 mm pipes caught more small mammals and thelargest of small trappable mammals compared to 20 L buckets.The latter authors recommended a combination of 20 L buck-ets and 150 mm-diameter pipes for sampling small mammals,considering that the use of only one pitfall type would pro-duce a biased appreciation of the assemblage being trapped.For the herpetofauna, CECHIN & MARTINS (2000), comparing pre-vious studies conducted in different biomes in Brazil, concludedthat 100L-200L pitfalls were more efficient than 20-30 L pit-falls. However, RIBEIRO-JÚNIOR et al. (2008) observed no differencesbetween species richness, capture success, or community struc-ture for lizards and leaf litter amphibians registered by pitfallswith 35 and 62 L buckets. MORTON et al. (1988) showed that290 mm-diameter pitfalls are more efficient than 150 mm-di-ameter pipes for capturing reptiles, as observed by FRIEND et al.(1989). MARITZ et al. (2007) found no differences between spe-cies richness and capture success registered by pitfall traps withrelatively small containers, 5 and 10 L.
Regarding trap design, MORTON et al. (1988) suggested theuse of cross form as an optimal pitfall trap system to samplereptiles in spinifex grasslands in Australia, when compared tostraight line design, but HOBBS et al. (1994) tested several pitfalltrap designs and concluded that differences in results were small,so that the simplest straight line design would be preferable.
In view of these contradictory results and the paucity ofstudies with focus on the Neotropical region, the effectivenessof two pitfall trap designs (straight line format – I; and Y for-mat), and three pitfall trap sizes (35, 62, and 100 L buckets) areevaluated in a rainforest area in eastern Amazonia. In particu-lar, these pitfall trap types are compared in relation to theirperformance with respect to patterns of species richness, rela-tive abundance and community structure for leaf litteramphibians, reptiles and small mammals.
MATERIAL AND METHODS
This study was conducted in the 2,500 ha site of theAmazonia Biodiversity Research Program/PPBio-Amazônia, inFloresta Nacional de Caxiuanã (1º57’36”S, 51º36’55”W), an areaof 330,000 ha in the Tocantins-Xingu interfluvium, state ofPará, Brazilian Amazonia, reserved for sustainable use (Fig. 1).About 85% of the area is terra firme rain forest, a well-drainedforest not subject to seasonal inundation (ALMEIDA et al. 1993).The remaining area is igapó (flooded forest). The forest is char-acterized by a 30-35 m-tall closed canopy, with emergentsgrowing to 45 m (AMARAL et al. 2009). The climate is of the Amtype in the classification of Köppen, with mean annual rainfallbetween 1996 and 2003 of 1960 mm, divided into a rainy sea-
son, from December to May, and a dry season, from June toNovember; mean annual temperature between 1996 and 2003of 26.7°C (COSTA et al. 2009).
Leaf litter amphibians, lizards, snakes, and non-volantsmall mammals were sampled at the PPBio site between Janu-ary and November 2007. Eighteen pitfall trap arrays were used,six of which with 35 L buckets, six with 62 L buckets, and sixwith 100L buckets. The 35 L buckets were 450 mm deep, withan upper diameter of 350 mm and a lower diameter of 250mm; the 62 L buckets were 570 mm deep, with upper and lowerdiameters of 410 and 310 mm; and the 100 L buckets were 820mm deep, with an upper diameter of 520 mm and a lower di-ameter of 390 mm, respectively. Nine pitfall arrays wereY-shaped (one central bucket linked to three peripheral ones,the three arms forming angles of approximately 120°), and nineI-shaped (four buckets in a straight line). Therefore, for eachshape (Y or I), there were three pitfall arrays with 35 L buckets,three with 62 L buckets, and three with 100 L buckets. Bucketsbelonging to the same pitfall array were connected by a 10 m-long and 80 cm-high plastic drift fence. Pitfall arrays were set150 m from one another along a transect, in order to providespatially independent sample units. Pitfall transects were par-
Figure 1. Location of the PPBio research site in the Floresta Nacional(Flona) de Caxiuanã, state of Pará, Brazilian Amazonia.

82 M. A. Ribeiro-Júnior et al.
ZOOLOGIA 28 (1): 80–91, February, 2011
allel to, but at least 50 m distant from, the walking trails. Thedifferent types of pitfall arrays were arranged alternately, con-sidering bucket size and trap design types, in two transectsdistant 1km from each other.
Each pitfall array was sampled for a total of 15 consecu-tive days in January-February, 17 consecutive days inMarch-April, 18 consecutive days in June-July, and 17 consecu-tive days in November. Sampling effort across all sample unitstotaled 1,206 pitfall-trap array nights, shared equally betweenthe three bucket sizes (402 array nights for 35 L pitfall trap, 62L pitfall trap, and 100 L pitfall trap), and trap design (630 Ypitfall trap array nights, and 630 I pitfall trap array nights).Traps were checked every morning by two observers. Eachamphibian, reptile and small mammal captured was identifiedand measured; all specimens were collected and deposited asvouchers in Museu Paraense Emílio Goeldi, Belém, Brazil (cata-log numbers available on request from the authors).
Analyses were conducted separately for leaf litter am-phibians, lizards, and small mammals. Differences in speciesrichness obtained by the different types of pitfall arrays wereanalyzed using individual based rarefaction (GOTELLI & COLWELL
2001), and sample based rarefaction pooling data from allsamples of each pitfall type (THOMPSON et al. 2003, THOMPSON etal. 2005). Rarefaction analyses were implemented in EstimateSv. 7.0 (COLWELL 2004). Perceived species richness were consid-ered significantly different whenever the lower 95% confidenceinterval of the curve with highest values did not overlap withthe remaining mean curves (MAGURRAN 2004). To compare spe-cies-abundance patterns obtained by each sampling method,we used standardized Whittaker plots, which compare speciesrank with log of relative abundance (MAGURRAN 2004). In addi-tion, abundance ranks were compared between methods usingnonparametric Spearman-rank correlations. All statistical testswere carried out using SPSS v.11.5 (SPSS 2001).
To evaluate differences in perceived patterns of commu-nity structure, as revealed by different sampling techniques,we used Nonmetric Multidimensional Scaling (NMDS). NMDSwas prefered over other ordination techniques because thismethod does not impose limiting assumptions concerning thenature of species responses (CLARKE & WARWICK 2001, MCCUNE
& GRACE 2002). Similarity matrices for each method were basedon Bray-Curtis similarity index using square-root transformedand site standardized abundance data. Analysis of Similarity(ANOSIM, CLARKE & WARWICK 2001) was used to compare differ-ences in community structure between pitfall trap types (bucketsize and trap design). All multivariate analyses were conductedusing Primer v. 5 (CLARKE & WARWICK 2001).
The snout-vent length (SVL) for herpetofauna and head-body length (HBL) for small mammals were measured to obtainthe average length of individuals collected by each trap type,and was then compared using parametric one-way ANOVA toexamine whether pitfall trap size and design differed in theirselection of body size (correcting for unequal variances when
necessary). Pairwise post hoc comparisons were made usingTukey’s subsets between each trap type with different size buck-ets. Maximum and minimum SVL or HBL of the individualscaptured per pitfall trap type were compared to estimate varia-tion in body size registered by each method for different speciesgroups.
RESULTS
A total of 1,240 individuals was captured (Tab. I), com-prising 21 leaf litter amphibian species (807 individuals), 17 lizardspecies (234 individuals), 10 snake species (12 individuals), and13 small mammal species (187 individuals). Snakes were notincluded in the analyses because of insufficient captures.
Rarefaction analyses showed that there was no significantdifference between the number of leaf litter amphibian and liz-ard species captured with 35, 62, and 100 L buckets (Figs 2 and3). For small mammals, similar species richness was observedfor 35 and 62 L pitfall traps, but more species were captured by100 L pitfall traps (Fig. 4). When comparing trap design, num-ber of species recorded by I and Y design was not significantlydifferent in any of the three groups (Figs 2-4). Results were simi-lar for both individual based rarefaction and sample basedrarefaction, for all groups analyzed. Species recorded by less thanthree individuals were not included in species richness analyses(four amphibian species, five lizards, and three small mammals;Tab. I). It is considered that they may be rare/uncommon in thestudy area and the low number of captures are not due to anykind of trap selection. Among them, five (three amphibians:Colostethus sp. – I design, Leptodactylus petersii (Steindachner,1864) – Y design, Chiasmocleis jimi Caramaschi & Cruz, 2001 – Iand Y design; and two lizards: Anolis ortonii Cope, 1869, Mabuyanigropunctata Andersson, 1918 – both in I design) were only cap-tured in 100 L pitfalls; one lizard species (Bachia flavescens(Bonaterre, 1789) – Y design) was only captured in a 62 L traparray; and three species (two lizards: Iphisa elegans Gray, 1851 –I design, Anolis punctatus Daudin, 1802 – Y design; and one smallmammal: Oecomys bicolor (Tomes, 1860) – I design) were onlycaptured in 35L pitfalls. Although 100 L pitfalls captured moresmall mammal species than pitfalls with smaller bucket sizes,they failed to register Oecomys bicolor, represented by a singlespecimen captured by a 35L pitfall (Tab. I). Among species rep-resented by four or more specimens (included in the speciesrichness analyses), only one lizard, Anolis fuscoauratus Duméril& Bibron, 1837, was exclusive to 62 L pitfalls, and a few others(the amphibians Adenomera sp. 2 and Physalaemus ephippifer(Steindachner, 1864), the lizard Plica umbra (Linnaeus, 1758),and the mammals Didelphis marsupialis Linnaeus, 1758 andMakalata didelphoides (Desmarest, 1817)) were not captured byone of the bucket sizes. Considering trap design, the amphibianLeptodactylus rhodomystax Boulenger, 1884 was sampled only byI-shaped traps, while Y-shaped traps did not register any exclu-sive species (Tab. I).

83Influence of pitfall trap size and design on herpetofauna and small mammal
ZOOLOGIA 28 (1): 80–91, February, 2011
Table I. Species and number of individuals of leaf litter amphibians, lizards, snakes and small mammals captured by different pitfall traptypes in the PPBio research site of the Floresta Nacional de Caxiuanã, Brazilian Amazon. (I) Pitfall traps with line design, (Y) pitfall trapswith Y design, (ANS) abbreviation of species names used in figures 5 and 6.
ANS Species35 L pitfalls 62 L pitfalls 100 L pitfalls
TotalI Y I Y I Y
Amphibians
B Bufo cf. magnussoni 41 28 36 27 49 40 221
Db Dendrophryniscus bokermanni 28 3 7 14 13 12 77
Af Allobates femoralis 4 2 5 2 8 21
C Colostethus sp. 2 2
Dg Dendrobates galactonotus 5 2 1 2 10
Dv Dendrobates ventrimaculatus 1 1 1 3
A1 Adenomera sp. 1 8 3 35 23 12 12 93
A2 Adenomera sp. 2 2 2 3 7
Cc Ceratophrys cornuta 4 7 1 20 1 33
Ef Eleutherodactylus fenestratus 1 2 2 2 7
Lk Leptodactylus knudseni 1 1 2
Lm Leptodactylus mystaceus 3 1 7 10 23 9 53
Lp Leptodactylus paraensis 3 5 7 5 19 20 59
Lpe Leptodactylus pentadactylus 1 2 1 4 2 10
Lpt Leptodactylus petersii 1 1
Lr Leptodactylus rhodomystax 1 3 5 9
Pe Physalaemus ephippifer 1 3 14 1 19
Ca Chiasmocleis avilapiresae 1 2 1 3 21 28
Cj Chiasmocleis jimi 1 1 2
Cg Ctenophryne geayi 7 4 7 4 15 5 42
Hb Hamptophryne boliviana 9 5 13 6 72 3 108
Total amphibians 111 62 135 104 286 109 807
Lizards
Ca Coleodactylus amazonicus 4 6 11 12 13 8 54
Gh Gonatodes humeralis 2 1 1 8 3 15
Ar Arthrosaura reticulata 7 6 11 9 13 9 55
Bf Bachia flavescens 2 2
Co Cercosaura ocellata 3 2 1 4 1 11
Ie Iphisa elegans 1 1
Lp Leposoma percarinatum 2 2 1 2 1 8
Pb Ptychoglossus brevifrontalis 2 1 4 3 1 11
Ta Tretioscincus agilis 4 5 5 1 5 20
Af Anolis fuscoauratus 2 2 4
Ao Anolis ortonii 1 1
Ap Anolis punctatus 1 1
Pp Plica plica 1 2 1 4
Continue

84 M. A. Ribeiro-Júnior et al.
ZOOLOGIA 28 (1): 80–91, February, 2011
Both pitfall designs presented an even species-relativeabundance distribution for leaf litter amphibians, lizards andsmall mammals (Figs 5 and 6). For leaf litter amphibians, ofthe five most abundant species, four were the same in I and Ydesigns (Bufo cf. magnussoni Lima, Menin & Araújo, 2007,Adenomera sp. 1, Dendrophryniscus bokermanni Izechsohn, 1994,and Leptodactylus mystaceus (Spix, 1824)), representing 49.2%
and 66.4% of all captures respectively (Fig. 5). Bufo cf.magnussoni was the most frequently sampled species, both by Idesign (23.7% of all records) and Y design (34.7% of all records).For lizards (Fig. 5), the three most abundant species represented60% of all lizards captured by I design and 64% by Y design. Inboth designs, Arthrosaura reticulata (O’Shaughnessy, 1881) andColeodactylus amazonicus (Andersson, 1918) were the most abun-
Table I. Continued.
ANS Species35 L pitfalls 62 L pitfalls 100 L pitfalls
TotalI Y I Y I Y
Pu Plica umbra 1 3 4
Mn Mabuya nigropunctata 1 1
Aa Ameiva ameiva 1 4 1 1 7
Kc Kentropyx calcarata 5 4 6 11 9 35
Total lizards 23 31 41 40 61 38 234
Snakes
Atractus schach 1 1
Atractus snethlageae 1 1 2
Erythrolamprus aesculapii 1 1
Leptodeira annulata 1 1
Oxyrhopus melanogenys 1 1
Taeniophallus brevirostris 1 1
Taeniophallus occipitalis 1 1
Xenopholis scalaris 1 1
Micrurus lemniscatus 1 1 2
Micrurus paraensis 1 1
Total snakes 2 0 3 3 1 3 12
Small mammals
Dm Didelphis marsupialis 1 2 2 5
Mp Marmosops cf. pinheiroi 7 7 4 5 5 7 35
Mr Metachirus nudicaudatus 1 1 2 1 5
Mde Micoureus demerarae 1 1 2
Mb Monodelphis brevicaudata 4 1 5 2 6 6 24
Em Euryoryzomys macconnelli 4 3 9 3 15 3 37
Nm Nectomys melanius 1 2 3
Ob Oecomys bicolor 1 1
Oa Oecomys auyantepui 3 5 6 12 8 10 44
R Rhipidomys sp. 1 1 2
Md Makalata didelphoides 1 1 3 5
Ms Mesomys stimulax 1 1 3 5 1 11
P Proechimys sp. 1 3 1 5 3 13
Total small mammals 21 20 32 29 52 33 187

85Influence of pitfall trap size and design on herpetofauna and small mammal
ZOOLOGIA 28 (1): 80–91, February, 2011
Figures 2-3. Individual based rarefaction curves and sample based rarefaction curves for (2) leaf litter amphibians and (3) lizards cap-tured by I and Y pitfall trap designs, and 35, 62 and 100 L pitfall traps sizes. Gray lines represent 95% confidence intervals.
Number of individuals
Leaf
litteram
ph
ibian
s
35 L
62 L
100 L
35 L
62 L
100 L
0 50 100 150 200 250 300 350 400 4500
5
10
15
20Leaf litter amphibians
700
35 L
62 L
100 L
35 L
62 L
100 L
Number of samples
0 50 100 150 200 250 300 350 400 450
0
5
10
15
25
20
Leaf litter amphibians
Leaf litter amphibians
Number of samples
0 100 200 300 400 500 600 7000
5
10
15
20
I Design
Y Design
Num
ber
ofspecie
s
Leaf litter amphibians
Number of individuals0 50 100 150 200 250 300 350 400 450 500 550 600
0
5
10
15
20
I Design
Y Design
Num
ber
ofspecie
s
Number of individuals
20 30 40 50 60 70 80 90 100
35 L
62 L
100 L
Lizards
Number of individuals
0 10 20 30 40 50 60 70 80 90 100 1100
2
4
6
8
10
12
14
16
35 L
62 L
100 L
Lizard
s
Number of samples
0 50 100 150 200 250 300 350 400
0
2
4
6
8
10
12
14
35 L
62 L
100 L
Lizards
Number of samples
0 50 100 150 200 250 300 350 400 450
0
2
4
6
8
10
12
14
16
35 L
62 L
100 L
Lizards
Number of samples0 100 200 300 400 500 600 700
Nu
mb
er
of
sp
ecie
s
0
2
4
6
8
10
12
14
16
I Design
Y Design
Lizards
Number of individuals
0 10 20 30 40 50 60 70 80 90 100 110 120 130
Nu
mb
er
of
sp
ecie
s
0
2
4
6
8
10
12
14
16
I Design
Y Design
2
3

86 M. A. Ribeiro-Júnior et al.
ZOOLOGIA 28 (1): 80–91, February, 2011
dant species (I design – 24.8% and 22.4% respectively; Y de-sign – 22% and 23.9%, respectively). For small mammals (Fig.5), the four most abundant species were the same for both de-signs (Euryoryzomys macconnelli (Thomas, 1910) – 26.7% in Idesign and 11% in Y design; Oecomys auyantepui Tate, 1939 –16.2% in I design, and 32.9% in Y design; Marmosops cf. pinheiroiPine, 1981 – 15.2% in I design and 23.1% in Y design;Monodelphis brevicaudata (Erxleben, 1777) – 14.3% in I designand 11% in Y design).
Regarding pitfalls with different bucket sizes, for leaf lit-ter amphibians, 35L pitfalls registered two dominant species(B. cf. magnussoni and D. bokermanni – 40% and 18% respec-tively), comprising together 58% of all captures by this bucketsize. The same capture rate was observed for the five most abun-dant species captured by 62L pitfalls (B. cf. magnussoni,Adenomera sp. 1, D. bokermanni, Hamptophryne boliviana (Parker,1927) and L. mystaceus – all together 57.2%) and the four mostabundant species in 100L pitfalls (B. cf. magnussoni, H. boliviana,Leptodactylus paraensis Heyer, 2005, and L. mystaceus – all to-gether 59.5%), indicating that 62 and 100 L pitfalls presentmore even species-abundant curves than 35 L pitfalls (Fig. 6).For lizards, the three bucket sizes presented relatively even spe-cies-abundance curves (Fig. 6), with the four most abundantspecies representing 68.5%, 72.8% and 59% of all species cap-
tured by 35, 62 and 100 L pitfalls, respectively. The two mostabundant species (A. reticulata and C. amazonicus) were thesame for all three bucket sizes. For small mammals (Fig. 6), thethree most abundant species captured by 35, 62, and 100 Lpitfalls were the same, although the most abundant species in35 L pitfalls (M. cf. pinheiroi), represented by 34.1% of all cap-tures, was only the third most abundant in 62 and 100 L pitfalls(14.75% and 14.1% respectively). Oecomys auyantepui was themost abundant species registered by 62 L pitfalls (29.5% of allindividuals captured), while both O. auyantepui and E.macconnelli were the most abundant species in 100 L pitfalls(each representing 21.2% of all captures). Pitfalls of 100 L buck-ets presented the most even species-abundance curve, thoseof 35 L buckets the most uneven species-abundance distribu-tion.
Rank orders of abundance of individual species trappedby I-shaped and Y-shaped pitfalls were not significantly differ-ent for leaf litter amphibians (21 species, rs = 0.777, p < 0.001),lizards (17 species, rs = 0.725, p < 0.001) and small mammals(14 species, rs = 0.749, p = 0.002). Rank orders of abundanceobtained from traps with different bucket sizes were also notsignificantly different for leaf litter amphibians (35 and 62 Lpitfalls – rs = 0.827, p < 0.001; 62 and 100 L pitfalls – rs = 0.937,p < 0.001; 35 and 100 L pitfalls – rs = 0.790, p < 0.001); lizards
Figure 4. Individual based rarefaction curves and sample based rarefaction curves for small mammals captured by I and Y pitfall trapdesigns, and 35, 62 and 100 L pitfall traps sizes. Gray lines represent 95% confidence intervals.
Small mammals
0 50 100 150 200 250 300 350 400
0
2
4
6
8
10
12
35 L
62 L
100 L
Small mammals
Number of samples
0 50 100 150 200 250 300 350 400 4500
2
4
6
8
10
12
35 L
62 L
100 L
Small mammals
Number of samples
0 100 200 300 400 500 600 700
Nu
mb
er
of
sp
ecie
s
0
2
4
6
8
10
12
14
16
I Design
Y Design
Small mammals
Number of individuals0 10 20 30 40 50 60 70 80 90 100 110
Nu
mb
er
of
sp
ecie
s
0
2
4
6
8
10
12
14
I DesignY Design
Small mammals
0 10 20 30 40 50 60 70 80
0
2
4
6
8
10
12
35 L
62 L
100 L
Number of individuals
0 10 20 30 40 50 60 70 80 900
2
4
6
8
10
12
35 L
62 L
100 L
Small mammals
87Influence of pitfall trap size and design on herpetofauna and small mammal
ZOOLOGIA 28 (1): 80–91, February, 2011
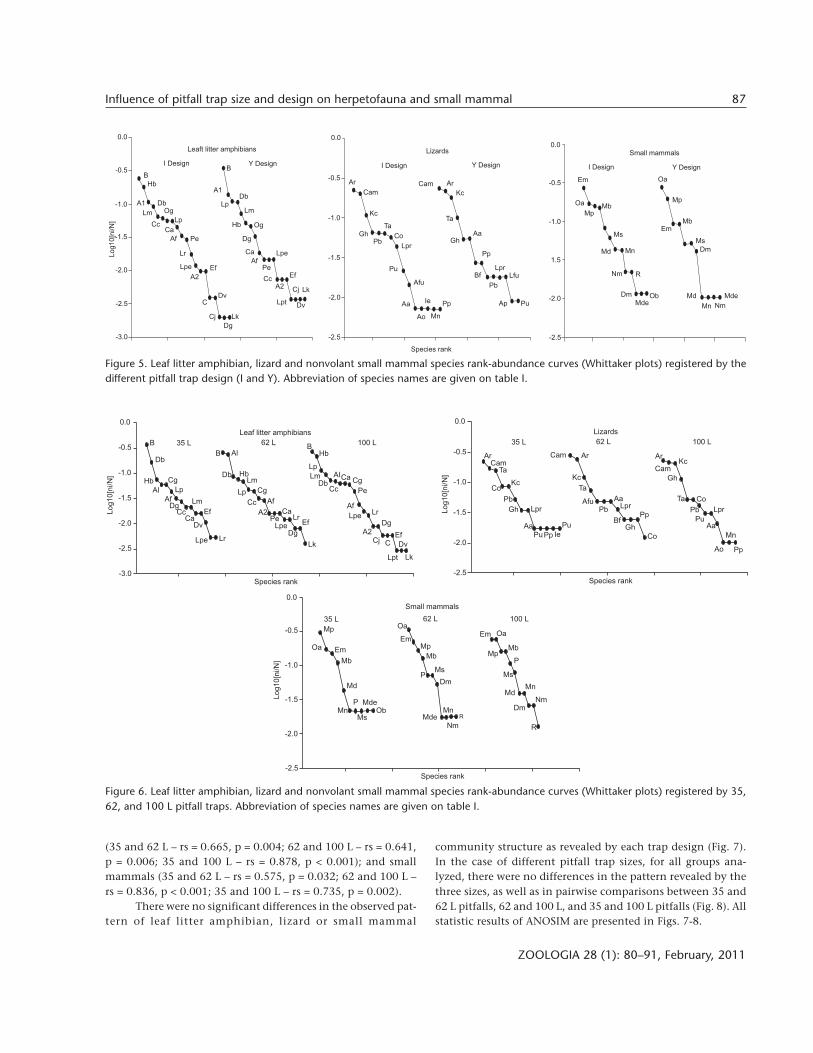
(35 and 62 L – rs = 0.665, p = 0.004; 62 and 100 L – rs = 0.641,p = 0.006; 35 and 100 L – rs = 0.878, p < 0.001); and smallmammals (35 and 62 L – rs = 0.575, p = 0.032; 62 and 100 L –rs = 0.836, p < 0.001; 35 and 100 L – rs = 0.735, p = 0.002).
There were no significant differences in the observed pat-tern of leaf litter amphibian, lizard or small mammal
community structure as revealed by each trap design (Fig. 7).In the case of different pitfall trap sizes, for all groups ana-lyzed, there were no differences in the pattern revealed by thethree sizes, as well as in pairwise comparisons between 35 and62 L pitfalls, 62 and 100 L, and 35 and 100 L pitfalls (Fig. 8). Allstatistic results of ANOSIM are presented in Figs. 7-8.
Figure 6. Leaf litter amphibian, lizard and nonvolant small mammal species rank-abundance curves (Whittaker plots) registered by 35,62, and 100 L pitfall traps. Abbreviation of species names are given on table I.
Species rank
Em
Oa
MpMb
Ms
MnMd
Nm
Dm Ob
R
Mde
EmMb
Mp
Oa
Ms
Dm
Md
Mn
Y DesignI Design
-0.5
-1.0
1.5
-2.0
-2.5
0.0
Small mammals
Mde
Nm
B
Hb
Db
Cc
Lm
A1Og
Lp
Ca
Af Pe
Lr
Lpe Ef
Dv
A2
C
Cj Lk
Dg
DvLpt
A2Cc
Ef
Cj Lk
Pe
LpeAf
Ca
Dg
OgHb
Lm
DbLp
A1
BY DesignI Design
Leaft litter amphibians
0.0
-0.5
-1.0
-1.5
-2.0
Lo
g1
0[n
i/N
]
-2.5
-3.0
Ar
Cam
I Design Y Design
Lizards
Kc
Ta
Co
LprPb
Gh
Pu
Afu
Aa Ie Pp
MnAo
Ap Pu
LfuLpr
Pp
Aa
Bf
Pb
Gh
Ta
Kc
ArCam
0.0
-0.5
-1.0
-1.5
-2.0
-2.5
Figure 5. Leaf litter amphibian, lizard and nonvolant small mammal species rank-abundance curves (Whittaker plots) registered by thedifferent pitfall trap design (I and Y). Abbreviation of species names are given on table I.
Lpt Lk
Dv
EfCCj
A2
Dg
LrLpe
Af
Pe
CgCaAl
CcDb
Lm
Lp
HbB
100 L62 L
Leaf litter amphibians
B Al
Db HbLm
Lp Cg
Cc Af
A2 CaPe
LpeLr
Ef
Lk
DgLrLpe
Dv
Ef
Lm
CaCc
DgAf
Lp
Cg
Al
Hb
Db
B 35 L
Log10[n
i/N
]
0.0
-0.5
-1.0
-1.5
-2.0
-2.5
-3.0Species rank
100 L62 L
Lizards
35 LLog10[n
i/N
]
0.0
-0.5
-1.0
-1.5
-2.0
-2.5Species rank
CamAr
CoKc
Ta
Pb
Gh Lpr
Aa Pu
PuPp IeGh
Bf
LprAa
PbAfu
Ta
Kc
ArCam Ar
CamKc
Gh
Ta
Pp
Co
Pb
Co
Lpr
AaPu
Mn
Ao Pp
100 L62 L
Small mammals
35 L
Log10[n
i/N
]
0.0
-0.5
-1.0
-1.5
-2.0
Mp
Oa Em
Mb
Md
Oa
EmMp
Mb
MnP Mde
ObMs Mde
Mn
Nm
Dm
MsP
R
Ms
P
Mn
NmMd
Dm
R
Mp
Em Oa
Mb
-2.5Species rank

88 M. A. Ribeiro-Júnior et al.
ZOOLOGIA 28 (1): 80–91, February, 2011
Trap design showed no influence on the sizes of speci-mens sampled in any of the groups (ANOVA, leaf litteramphibians: F = 0.304, df = 1, 648, p = 0.582; lizards: F = 0.339,df = 1, 173, p = 0.561; small mammals: F = 0.001, df = 1, 185, p= 0.969). Regarding bucket sizes, there was a significant differ-ence between lengths of leaf litter amphibians registered by 35,62, and 100 L pitfalls (ANOVA, F = 4.123, df = 2, 648, p = 0.017).Pairwise comparisons showed a significant difference only be-tween 62 and 100 L pitfalls, where 62 L pitfalls captured smallerspecimens on average than 100 L pitfalls; 35 and 62, 35, and100 L pitfalls captured similar-sized specimens (Tab. II). In termsof maximum size, 35 L pitfalls captured the largest leaf litteramphibian (L. paraensis, 158 mm). For lizards, average length ofspecimens obtained by the three bucket sizes were not signifi-cantly different, either when all three were compared to eachother (ANOVA, F = 0.316, df = 2, 173, p = 0.729). The largestlizard was registered by 35 L pitfalls [Ameiva ameiva (Linnaeus,1758), 182 mm] and the smallest by 100L pitfalls (C. amazonicus,12 mm; Tab. II). The same was obtained for small mammals(ANOVA, F = 2.592, df = 2, 185, p = 0.078). Buckets of 62 L regis-tered the largest mammal (D. marsupialis, 337 mm), and 100 Lthe smallest (M. cf. pinheiroi, 65 mm; Tab. II). For snakes, eventhough we did not catch enough specimens to conduct a formalanalysis, our preliminary data indicate that 100 L buckets failedto catch larger animals than 35 and 62 L pitfall trap arrays.
DISCUSSION
Previous studies in the Floresta Nacional de Caxiuanã,including both active search and pitfall trap collecting, recorded37 species of amphibians, 24 of lizards, and 70 of snakes (ÁVILA-PIRES & HOOGMOED 1997, BERNARDI et al. 1999, ESTUPIÑÁN et al.2002, MASCHIO et al. 2009, and specimens from MPEG herpeto-logical collection). The present study recorded 21 species ofamphibians, 17 of lizards and 10 of snakes, all previously knownfrom the Floresta Nacional de Caxiuanã, except for four am-phibians that represent new records (Adenomera sp. 2, P.ephippifer, Ctenophryne geayi Mocquard, 1904, and C. jimi). Smallmammals have not been previously surveyed in the area, butLAMBERT et al. (2005) recorded 25 species in the Estação dePesquisa Pinkaiti, within the Tocantins-Xingu interfluvium. Inthe present study 13 small mammal species were recorded. Itshould be noted, however, that only those species that occupythe leaf litter can be expected to be sampled by pitfall traps.Part of the difference in the numbers above, from all threegroups, are due to species that do not occur in the leaf litter.
Our results agree with those by MORTON et al. (1988) andHOBBS et al. (1994) in that trap design (a straight line or withextra arms) has little effect on species sampled. Those studiesfocused on reptiles, but we got similar results for amphibiansand small mammals. For all three groups the present study
I Design
Y Design
-3 -2
Stress: 0.18I x Y R = 0.036 - p = 0.235
Leaf litter amphibians
-1 0 1 2
1.2
1.0
0.8
0.6
0.4
0.2
0.0
-0.2
MD
SA
xis
2
-0.4
-0.6
-0.8
-1.0
1.5
1.0
0.5
0.0
-0.5
I Design
Y Design
-1.0
-1.5-2.0 -1.5
Stress: 0.21I x Y R = 0.076 - p = 0.119
Lizards
-1.0 0.0 1.0 1.5-0.5 0.5
MDS Axis 1
1.5
1.0
0.5
0.0
-0.5
I Design
Y Design
-1.0
-1.5-1.5 -1.0
Stress: 0.19I x Y R = 0.079 - p = 0.148
Small mammals
0.0 1.0 1.5-0.5 0.5
Figures 7-8. Nonmetric Multidimensional scaling plots produced from the Bray-Curtis similarity matrix of species abundance bydifferent pitfall trap (7) designs (I and Y) and (8) sizes (35, 62, and 100 L) for leaf litter amphibians, lizards and small mammals.Clusters of similar symbols would indicate sampling bias of pitfall trap design.
7
8
100 L35 L
-3 -2
Stress: 0.18 R = 0.021 - p = 0.32235 L x 62 L R = 0.061 - p = 0.23235 L x 100 L R - 0.031 - p = 0.30162 L x 100 L R = 0.22 - p = 0.532
Leaf litter amphibians
-1 0 1 2
1.2
1.0
0.8
0.6
0.4
0.2
0.0
-0.2
MD
SA
xis
2
-0.4
-0.6
-0.8
-1.0
62 L
MDS Axis 1
1.5
1.0
0.5
0.0
-0.5
-1.0
-1.5-2.0 -1.5
Lizards
-1.0 0.0 1.0 1.5-0.5 0.5
Stress: 0.21 R = 0.030 - p = 0.35035 L x 62 L R = 0.056 - p = 0.30535 L x 100 L R - 0.015 - p = 0.39262 L x 100 L R = 0.37 - p = 0.368
100 L35 L
62 L
1.5
1.0
0.5
0.0
-0.5
-1.0
-1.5-1.5 -1.0
Small mammals
0.0 1.0 1.5-0.5 0.5
Stress: 0.19 R = 0.034 - p = 0.30435 L x 62 L R = 0.021 - p = 0.37235 L x 100 L R - 0.169 - p = 0.11762 L x 100 L R = 0.87 - p = 0.747
100 L35 L
62 L

89Influence of pitfall trap size and design on herpetofauna and small mammal
ZOOLOGIA 28 (1): 80–91, February, 2011
points out an unbiased recovery of species richness and rankabundance order by I and Y pitfall designs, indicating that stud-ies that differ only in this matter are comparable.
Differences in pitfall size (35, 62, and 100 L buckets) didnot lead to a different perception of species richness, relativeabundance and community structure of leaf litter amphibianand lizard species. This is in agreement with RIBEIRO-JÚNIOR et al.(2008) who only compared buckets of 35 and 62 L. Therefore,it seems that buckets of 35 L are adequate enough for samplingthese animals. Even considering the largest species within thesegroups, no significant differences were observed, except be-tween buckets of 62 and 100 L for amphibians. However, as nodifferences in size of captured amphibians were found between35 and 62 L buckets, and 35 and 100 L buckets, the differenceobserved between 62 and 100 L buckets cannot be attributableto size. Our results contradict CECHIN & MARTINS (2000) whosuggested the use of large pitfalls (100 L) to obtain more spe-cies and larger reptiles. Other studies (FRIEND et al. 1989, THOMPSON
et al. 2005) also found differences, but these authors comparedPVC pipes and buckets, where the form of the container alsoplayed a role.
For small mammals, however, number of species washigher in 100 L buckets than in the smaller ones. THOMSON et al.(2005) found that 600 mm deep pipes registered more smallmammal species than 20 L buckets, and they suggested that thelargest trappable species could be jumping out of the buckets.HOW et al. (1984) also pointed out that some species of small
mammals are able to jump or climb out of pitfall traps. Presentdata suggest that buckets of 100L prevent escaping more effi-ciently than those of 35 and 62 L. However, no difference in sizeof the animals caught by the three different bucket sizes wasfound, in spite of the fact that it could be expected that largeranimals would have more chance of jumping out of the bucket.
There were a few cases where species were absent fromone of the pitfall trap types but, except for P. ephippifer, sampleswere smaller than 10 specimens per species and absence mayresult from chance alone. Even in the case of P. ephippifer wecannot discard the effect of other variable(s) than bucket size.On the other hand, at least some amphibians, as well as somelizards, are able to climb out of buckets (TCSAP pers. obs.) anddifferences in size and/or format of the buckets may facilitateor hinder their escape. However, our results indicate that evenif such differences exist, they were not enough to produce sta-tistically significant differences in the analysed parameters.
Even though snake data were not statistically analyzed,our preliminary observations suggest that pitfalls, even of 100L, are not effective for sampling this group, as already observedby MASCHIO et al. (2009) for the same study area. A total effort of1,206 trap nights were necessary to record 10 species (12 indi-viduals), while by only walking to verify the pitfalls (about fourhours per day) we could record 14 species (21 individuals). CECHIN
& MARTINS (2000) and BERNARDE (2008) recommended the use of100 L pitfalls as an extremely efficient technique to sample snakecommunity in Brazil. Our data do not corroborate this observa-
Table II. Comparison of snout-vent length (SVL, amphibians and lizards) and head-body length (HBL, mammals) captured by differenttrap sizes in each faunal group. First line corresponds to mean SVL or HBL ± standard deviation. Second and third lines show “species(pitfall design) – SVL or HBL” of respectively the largest and smallest animal captured by each trap size. Fourth and fifth lines show thesignificance level of pairwise Tukey post hoc comparisons (P). All measurements are in millimeters. Species abbreviations: (Lp)Leptodactylus paraensis, (A1) Adenomera sp. 1, (Aa) A. ameiva, (Cam) C. amazonicus, (Mb) M. brevicaudata, (Dm) D. marsupialis, (Mp) M.cf. pinheiroi.
Measurements35 L pitfalls 62 L pitfalls 100 L pitfalls
Leaf litter amphibians
SVL ± SE 41.3 ± 1.3 39.1 ± 1.4 47.4 ± 1.3
Maximum SVL Lp (Y) – 158 Lp (I) – 149 Lp (I) – 149
Minimum SVL A1 (I-Y) – 11 A1 (Y) – 9 A1 (I-Y) – 10
62 L pitfalls p = 0.429
100 L pitfalls p = 0.415 p = 0.013*
Lizards
SVL ± SE 50.9 ± 4.2 50.2 ± 3.3 54.3 ± 3.2
Maximum SVL Aa (I) – 182 Aa (Y) – 147 Aa (Y) – 177
Minimum SVL Cam (I) – 17 Cam (Y) – 14 Cam (I) – 12
Small mammals
HBL ± SE 110.8 ± 5.13 130.1 ± 6.9 123.5 ± 3.7
Maximum HBL Mb (Y) – 177 Dm (I) – 337 Dm (Y) – 259
Minimum HBL Mp (I) – 69 Mp (Y) – 73 Mp (I) – 65

90 M. A. Ribeiro-Júnior et al.
ZOOLOGIA 28 (1): 80–91, February, 2011
tion. The technique however is useful as a complementary sam-pling method, especially regarding smaller, (semi-) fossorialsnakes that are difficult to sample by active collecting.
For a number of ecological studies that includes the ver-tebrate leaf litter fauna it is important to understand theeffectiveness and biases of different sampling methods (e.g.UMETSU et al. 2006, MARITZ et al. 2007, RIBEIRO-JÚNIOR et al. 2008).Here, it is shown that studies of species richness, relative abun-dance and community structure of leaf litter amphibians andlizards are not significantly affected by different pitfall trapdesigns and sizes, at least within certain limits. However, thesame was not true for small mammals, for which larger pitfalltraps showed a higher species richness. As a result, the use oflarger pitfall traps (100 L) to sample the terrestrial vertebratefauna in multidisciplinary studies is recommented, maximiz-ing the results obtained. On the other hand, if the study isrestricted to the herpetofauna, 35L buckets, which are cheaperand easier to install, may be used. According to JAMES et al. (1999)and SHEIL (2001) the limited financial resources available forconservation must be allocated with care, including the choiceof sampling methods for the study of biodiversity that are mostcost-effective (e.g. GARDNER et al. 2007, GARDNER et al. 2008). Wehope the present study will be useful to guide Neotropical for-est herpetologists and mammalogists to improve theeffectiveness of their sampling methods.
ACKNOWLEDGMENTS
We thank Danilo L. Arcoverde and Stephenson H.F.Abrantes for assistance in the field, and Marinus S. Hoogmoedfor his help with amphibian identification. The project wasfunded by Amazonia Biodiversity Research Program/PPBio-Amazônia, of the Brazilian Ministry of Science and Techonologyand coordinated by Museu Paraense Emilio Goeldi. MMA/IBAMA gave permission to work in the Floresta Nacional deCaxiuanã. We thank D. Astua and two anonymous reviewersfor helping to improve an earlier version of the manuscript.
LITERATURE CITED
ALMEIDA, S.S.; P.L.B. LISBOA & A.S.L. SILVA. 1993. DiversidadeFlorística de uma comunidade arbórea na Estação Científi-ca Ferreira Penna, em Caxiuanã (Pará). Boletim do MuseuParaense Emílio Goeldi, série Botânica 9: 99-120.
AMARAL, D.D.; S.S. ALMEIDA & D.C.T. COSTA. 2009. Contribuiçõesao manejo florestal de espécies de valor madeireiro e nãomadeireiro na Floresta Nacional de Caxiuanã, p. 199-228.In: P.L.B. LISBOA (Ed.). Caxiuanã. Desafios para a conserva-ção de uma Floresta Nacional na Amazônia. Belém, Mu-seu Paraense Emílio Goeldi.
ÁVILA-PIRES, T.C.S. & M.S. HOOGMOED. 1997. The herpetofauna,p. 389-401. In: P.L.B. LISBOA (Ed.). Caxiuanã. Desafios paraa conservação de uma Floresta Nacional na Amazônia.
Belém, Museu Paraense Emílio Goeldi.BERNARDE, P.S. 2008. Ecologia e métodos de amostragem de rép-
teis squamata, p. 189-201. In: S.P.C. SILVA; D.A.P. GOMES-SILVA;J.S. MELO & V.M.L. NASCIMENTO (Eds). Coletânea de textos:Manejo e monitoramento da fauna silvestre em florestastropicais. Rio Branco, VIII Congresso Internacional sobreManejo de Fauna Silvestre na Amazônia e América Latina.
BERNARDI, J.A.R.; R.A. ESTUPIÑÁN & GALATTI, U. 1999. New anuranrecords from the Floresta Nacional de Caxiuanã, easternAmazon, Brazil. Herpetological Review 30: 176-177.
BRAITHWAITE, R.W. 1983. A comparison of two pitfall trap systems.Victorian Naturalist 100: 163-166.
BURY, R.B. & P.S. CORN. 1987. Evaluation of pitfall trapping innorthwestern forests: trap array with drift fences. Journalof Wildlife Management 51: 112-119.
BURY, R.B. & M.G. RAPHAEL. 1983. Inventory methods foramphibians and reptiles, p. 416-419. In: J.F. BELL & T.ATTERBURRY (Eds). Renewable Resource Inventories forMonitoring Changes and Trends. Corvallis, Oregon StateUniversity.
CECHIN, S.Z. & M. MARTINS. 2000. Eficiência de armadilhas dequeda (pitfall traps) em amostragens de anfíbios e répteisno Brasil. Revista Brasileira de Zoologia 17 (3): 729-740.doi: 10.1590/S0101-81752000000300017.
CLARKE, K.R. & R.M. WARWICK. 2001. Change in marinecommunities: an approach to statistical analysis andinterpretation. Plymouth, Plymouth Marine Laboratory.
COLWELL, R.K. 2004. Statistical estimation of species richnessand shared species from samples. Available online at: http://purl.oclc.org/estimates [Accessed: 07.24.2007]
COSTA, A.C.L.; S.S. ALMEIDA; C.R. CARVALHO; P. MEIR; Y.M. MALHI;R.F. COSTA; J.A. SILVA JR; M.C. COSTA; B.T. TANAKA; R.A. FISHER;E.D. SOTTA; L.L. OLIVEIRA; P.H.L. GONÇALVES; A.P. BRAGA & P.N.BARRETO. 2009. Experimento Esecaflor-LBA em Caxiuanã, p.45-90. In: P.L.B. LISBOA (Ed.). Caxiuanã. Desafios para aconservação de uma Floresta Nacional na Amazônia.Belém, Museu Paraense Emílio Goeldi.
ENGE, K.M. 2001. The pitfalls of pitfall traps. Journal ofHerpetology 35: 467-478.
ESTUPIÑÁN-T, R.A.; J.A.R. BERNARDI & U. GALATTI. 2002. Fauna anura,p. 541-553. In: P.L.B. LISBOA (Ed.). Caxiuanã: populaçõestradicionais, meio físico e diversidade biológica. Belém,Museu Paraense Emílio Goeldi.
FRIEND, G.R. & D.S. MITCHELL. 1988. Efficient pitfall trap designsfor surveying small vertebrates. Landnote 1/88: 1-4.
FRIEND, G.R.; G.T. SMITH; D.S. MITCHELL & C.R. DICKMAN. 1989.Influence of pitfall and drift fence design on capture ratesof small vertebrates in semi-arid habitats of westernAustralia. Australian Wildlife Research 16: 1-10.
GARDNER, T.A.; J. BARLOW; L.T.W. PARRY & C.A. PERES. 2007.Predicting the uncertain future of tropical forest species ina data vacuum. Biotropica 39: 25-30. doi: 10.1111/j.1744-7429.2006.00228.x.

91Influence of pitfall trap size and design on herpetofauna and small mammal
ZOOLOGIA 28 (1): 80–91, February, 2011
GARDNER, T.A.; J. BARLOW; I.S. ARAUJO; T.C.S. ÁVILA-PIRES; A.B.BONALDO; J.E. COSTA; M.C. ESPÓSITO; L.V. FERREIRA; J. HAWES; M.I.HERNANDEZ; M. HOOGMOED; R.N. LEITE; N.F. LO-MAN-HUNG; J.R.MALCOLM; M.B. MARTINS; L.A.M. MESTRE; R. MIRANDA-SANTOS;A. NUNES-GUTJAHR; W.L. OVERAL; L.T.W. PARRY; S.L. PETERS; M.A.RIBEIRO-JÚNIOR; M.N.F. SILVA; C. SILVA-MOTTA & C. PERES. 2008.The cost-effectiveness of biodiversity surveys in tropicalforests. Ecology Letters 11: 139-150. doi: 10.1111/j.1461-0248.2007.01133.x.
GOTELLI, N.J. & R.K. COLWELL. 2001. Quantifying biodiversity:procedures and pitfalls in the measurement and comparisonof species richness. Ecology Letters 4: 379-391. doi: 10.1046/j.1461-0248.2001.00230.x.
GREENBERG, C.H.; D. NEARY & L.D. HARRIS. 1994. A comparison ofherpetofaunal sampling effectiveness of pitfall, single-ended,and double-ended funnel traps used with drift fences.Journal of Herpetology 28: 319-324.
HOBBS, T.J.; S.R. MORTON; P. MASTERS & K.R. JONES. 1994. Influenceof pit-trap design on sampling reptiles in arid spinifexgrasslands. Wildlife Research 21: 483-490.
HOPPER, S.D. 1981. A pit trap survey of small mammals, lizardsand frogs on Two Peoples Bay Nature Reserve. Perth,Department of Fisheries and Wildlife, Western Australia,Report 43.
HOW, R.A.; W.F. HUMPHREYS & J. DELL. 1984. Vertebrate surveys insemi-arid Western Australia, p. 193-216. In: K. MYERS & C.R.MARGULES (Eds). Survey method for nature conservation.Proceedings of a workshop held at Adelaide University,31 August – 2 September 1983. Camberra, CSIRO Water andLand Resources.
JAMES, A.N.; K.J. GASTON & A. BALMFORD. 1999. Balancing theEarth’s accounts. Nature 401: 323-324.
LAMBERT, T.D.; J.R. MALCOLM & B.L. ZIMMERMAN. 2005. Variation insmall mammal species richness by trap height and trap typein Southeastern Amazonia. Journal of Mammalogy 86: 982-990. doi: 10.1644/1545-1542(2005)86[982:VISMSR]2.0.CO;2.
MAGURRAN, A.E. 2004. Measuring Biological Diversity. Oxford,Blackwell Science.
MARITZ, B.; G. MASTERSON; D. MACKAY & G. ALEXANDER. 2007. Theeffect of funnel trap type and size of pitfall trap on trapsuccess: implications for ecological field studies. Amphibia-Reptilia 28: 321-328. doi: 10.1163/156853807781374746.
MASCHIO, G.F.; M.C. SANTOS-COSTA & A.L.C. PRUDENTE. 2009. Co-munidade de serpentes da região de Caxiuanã com avalia-ção da eficiência dos métodos de captura, p. 589-603. In:P.L.B. LISBOA (Ed.). Caxiuanã. Desafios para a conservaçãode uma Floresta Nacional na Amazônia. Belém, MuseuParaense Emílio Goeldi.
MCCUNE, B. & J.B. GRACE. 2002. Analysis of ecologicalcommunities. Gleneden Beach, MJM Software Designs.
MENGAK, M. & D.C.J. GUYNN. 1978. Pitfalls and snap traps forsampling small mammals and herpetofauna. AmericanMidland Naturalist 118: 284-288.
MENKHORST, P.W. 1982. Pitfall trapping of reptiles in the BigDesert, Victoria. Victorian Naturalist 99: 66-70.
MORTON, S.R.; M.W. GILLAM; K.R. JONES & M.R. FLEMING. 1988.Relative efficiency of different pit-trapping systems forsampling reptiles in spinifex grassland. Austral. WildlifeResearch 15: 571-577.
MOSEBY, K. & J.L. READ. 2001. Factors affecting pitfall capture ratesof small ground vertebrates in arid South Australia. II. Optimumpitfall trapping effort. Wildlife Research 28: 61-71.
RIBEIRO-JÚNIOR, M.A.; T.A. GARDNER & T.C.S. ÁVILA-PIRES. 2008.Evaluating the effectiveness of herpetofaunal samplingtechniques across a gradient of habitat change in a tropicalforest landscape. Journal of Herpetology 42: 733-749. doi:10.1670/07-097R3.1.
RICE, C.G.; E.E. JORGENSEN & S. DEMARAIS. 1994. A comparison ofherpetofauna detection and capture techniques in southernNew México. Texas Journal of Agriculture and NaturalResources 7: 107-114.
ROLFE, J.K. & N.L. MCKENZIE. 2000. Comparison of methods usedto capture herpetofauna: an example from the CarnavonBasin. Records of the Western Australian Museum 61(Suppl.): 361-370.
RYAN, T.J.; T. PHILIPPI; Y.A. LEIDEN; M.E. DORCAS; T.B. WIGLEY & J.W.GIBBONS. 2002. Monitoring herpetofauna in a managed forestlandscape: effects of habitat types and census techniques.Forest Ecology and Management 167: 83-90. doi: 10.1016/S0378-1127(01)00692-2.
SANTOS-FILHO, M.; D.J. SILVA & T.M. SANAIOTTI. 2006. Efficiency offour trap types in sampling small mammals in Forestfragments, Mato Grosso, Brazil. Mastozoologia Neotropical13: 217-225. ISSN 1666-0536.
SHEIL, D. 2001. Conservation and biodiversity monitoring inthe tropics: realities, priorities, and distractions. Conserva-tion Biology 15: 1179-1182. doi: 10.1046/j.1523-1739.2001.0150041179.x.
SPSS. 2001. Statistical Package for the Social Sciences v.11.5.Chicago.
THOMPSON, G.G.; P.C. WITHERS; E.R. PIANKA & S.A. THOMPSON. 2003.Assessing biodiversity with species accumulation curves;inventories of small reptiles by pit-trapping in WesternAustralia. Austral Ecology 28: 361-383. doi: 10.1111/j.1442-9993.2003.tb00261.x.
THOMPSON, S.A.; G.G. THOMPSON & P.C. WITHERS. 2005. Influenceof pit-trap type on the interpretation on fauna diversity.Wildlife Research 32: 131-137. doi:10.1071/WR03117.
UMETSU, F.; L. NAXARA & R. PARDINI. 2006. Evaluating the efficiencyof pitfall traps for sampling small mammals in theNeotropics. Journal of Mammalogy 87: 757-765. doi:10.1644/05-MAMM-A-285R2.1.
Submitted: 18.VI.2010; Accepted: 15.XI.2010.Editorial responsibility: Diego A. de Moraes