influence of prominent temperature on the compressive
TRANSCRIPT

Influence of Prominent Temperature on the Compressive Strength
of Self Compacting Concrete
*Deepak G Appaji
1, Dr.Chethan.K
2
1Research scholar, Dept of Civil Engineering, U.V.C.E, Bangalore University,
Bangalore-56
2Associate Professor, Dept of Civil Engineering, U.V.C.E, Bangalore University,
Bangalore-56
Abstract
In an extensive research scenario, the self-compacting concrete influence a major role in
the advanced construction technology which gives the higher impact on its strength and
durability of the structure, for its assessment there were various types of physical and
chemical testing techniques are available. In this article the work represents the
compressive strength of self-compacting concrete in various temperature testing like 200o
C and 400 o C with the consideration of 100% cement and different mix proportion of
admixtures for the replaceable of cement like Fly-ash with 30% and 15% and GGBFS
30% and 15% and the addition of polypropylene fibre with 1% and 2% with all of its mix
proportion. The fundamental tests of the concrete are performed as per the Indian
Standard code. The results indicate that an enhancement of compressive strength at the
maximum optimized temperature.
Keywords: Self Compacting Concrete, Fly-ash, GGBFS, Polypropylene fibres, Optimised
Temperature
1. Introduction
Earliest research in the design of self-compacting concrete mixes began in the
mid-eighties in the twentieth century in Japan. The main drive for this research are the
endangered durability of reinforced concrete structures, need for easier and high-
quality fresh concrete placement and lack of skilled labour force. In 1986, Okamura,
University of Tokyo, Japan, is the first propose concrete that would be placed under
the influence of self-weight only. The polypropylene fibre enhances the thermal
stability of high strength concrete & SCC. It is also absorbed that severe fire spalling
could occurs with SCC high strength concrete even at a low heating rate. Complete
spalling took place when the specimens surface temperature is between 1800C to
2500C A. Noumowé, et al. (2006). Thermal analysis by TGA performed for samples
with and without PPF at the age of 28 days. Results for 4 cement pastes without PPF,
between 30 & 150 a quick weight loss is found in TGA for all samples. This
corresponds to the loss of evaporable water. From 1100C to 7000C the weight loss
indicated from TGA includes the loss of chemically bounded water from the
decomposition of CSH. The weight loss of the samples made by SCCP is lower than
the others for temperature up to 7000C. This indicates the SCCP samples show a better
stability below 7000C due to the low cement content in the mixtures. Temperature is
above 7000C the dramatic loss of mass is observed G. Ye, et al. (2007). The normal
concrete, Compressive strength at 2000C is increased with 4.47%. At 4000C & 6000C
temperature decrease in the compressive strength is about 16.15% & 49.29%
respectively. The percentage of reduction of Compressive strength is 21.09, 37.44 &
Journal of University of Shanghai for Science and Technology ISSN: 1007-6735
Volume 23, Issue 11, November - 2021 Page-243

63.14% of its initial compressive strength at 2000C, 4000C & 6000C respectively. From
the results Concluded that use of Flyash improved the performance of SCC at elevated
temperatures. For SCC, at compressive strength is increased 5.7% with gradual
cooling. At 4000C & 6000C decreasing in compressive strength is about 9.34% &
27.73% respectively. At 2000C the percentage of reduction of compressive strength is
10.33. 24.56 & 40.78 of its initial compressive strength at 2000C, 4000C & 6000C
respectively M.A.Helal and Kh.M.Heiza (2010). The high strength SCCPPF
specimens at 2000C. The loss in compressive strength is 18% of the room temperature
strength. At the same time temperature for normal strength is 10% after initial loss of
strength. The high strength SCCPPF began to recover its strength at 4000C. The
strength of normal SCCPPF decreased rapidly at the temperature range of 2000C to
4000C. The strength is only 50% of that of the room temperature. Jin Tao, et al. (2010).
The percentage decrease in the Compressive strength 1000C to 6000C is 2.91, 7.61,
14.10, 18.21, 24.13 & 30.00% respectively when temperature increased from 1000C to
6000C the compressive strength increases. D.B.Kulkarni and S.N. Patil (2011). SCC
specimens subjected to high temperatures generally results in reduction in compressive
strength. The reduction in compressive strength is due to a series of physical &
chemical changes. Arabi Nawwaf Saoud, et al. (2011). At normal temperature with
increase in Flyash content from 30% to 50% shows between 30.67 & 21.43MPa.
Between 39.50 & 30.40 MPa at 28 & 91 days respectively. An increase of about
22.35% and 19.00% Compressive strength is observed for 28 days & 91 days
respectively SCC Mixes. With increase in temperature from 1000C to 2000C,
Compressive strength varied between 29.00 & 19.25 MPa. For 28 & 91 days‟ samples
the compressive strength varied between 37.90 & 29.00 MPa. with decrease in Fly ash
content from 50% to 30% Neelam Pathak and Rafat Siddique, (2012). It is observed
that SCC specimens at high temperatures generally results in reduction in compressive
strength. The strength reduction on heating is due to the serious of complex physical &
chemical changes. Arabi N.S. Al Qadi, et al. (2012). compressive strength of HSSCC
specimens of 28 days at room temperature varied from 84.69-82.57 N/mm2, for 2000C
varied from 4.84-7.21 at 4hours, 8.54-10.84 at 8hours and 11.97-13.91 at 12hours. For
4000C varied from 14.36-16.62 at 4hours, 17.86-19.04 at 8hours and 20.66-23.97 at
12hours. For 6000C at 4. 8 & 12 hours concretes specimen are crushed. The loss of
compressive strength nearly 14% & 9% at 2000C & 4000C for 12 hours 24% & 18% at
2000C & 4000C for 12hours. R.Vasusmitha and P.Srinivasa Rao (2012). When
temperature raised to 2000C to 6000C they reported loss of compressive strength for all
the mixes but up to 4000C temperature only 70% loss of compressive strength is
observed for all the mixes this is because of positive influence of Flyash & metakaolin
Marija Jelcic Rukavina, et al. (2015). At 4000C the relative compressive strength of the
SCC mixture with 0% PP, SCC mixture with 0.05% PP, SCC mixture with 0.10% PP
& SCC mixture with 0.15% PP mixtures show reduction in residual compressive
strength at 4000C. Residual compressive strength of 4000C with 4hr is greater than that
of concrete mixtures heated to 2000C for 2hr. Aminuddin Jameran, et al. (2015). Plain
SCC are showed small cracks on the surfaces when the temperature is
Journal of University of Shanghai for Science and Technology ISSN: 1007-6735
Volume 23, Issue 11, November - 2021 Page-244

maintained 2000C for 2hours. Specimen of Plain SCC showed more cracks on the
surfaces when the temperature is maintained 2000C for 4hours. Plain SCC specimens
showed small cracks no explosive spalling when temperature maintained at 4000C for
4hours Mahmoud B. Alhasanat, et al. (2016). Addition of PP fibres to the concrete
reduces the compressive strength of 28 days. This strength reduction is greater than in
HSCC.PP6 in all the diameters except 200nm to physico-mechanical characteristics of
SCC at 2000C, 4000C & 6000C A. Saeedian , et al. (2017). After exposure to elevated
temperatures there is no significance distortion of the specimens is observed. But for
those specimens which are kept at 6000C & 8000C with a small amount of
deterioration of concrete at the edges & corners is observed. The colour changes of
concrete cube specimens at elevated temperature shows four distinct colour bands for
each (2000C, 4000C, 6000C & 8000C). The colour of the specimen changes from grey,
greyish yellow, greenish yellow & grey buff colour respectively Swapnil K. Shirsath,
et al. (2017)
2. Material Properties
The constituent materials used for the making of SCC are the same as those
for conventional concrete except that SCC contains lesser aggregates and greater
powder content (cement and filler particles). Fly ash, ground granulated blast furnace
slag, glass filler, limestone powder, silica fume, etc. are used as the filler materials. To
improve the self-compact ability of SCC, many types of chemical admixtures are used
as Super plasticiser. The materials considered for the present investigation are cement,
fine aggregate, coarse aggregate, GGBFS, Fly ash and Polypropylene fibres. Ordinary
Portland cement (OPC) of 53 grade Birla Super is used for casting all the specimens.
As per IS:269-2015, In Table 1 and Table 2, Physical and Chemical Properties of
Ordinary Portland Cement are tabulated.
Table 1. Chemical Composition of Ordinary Portland Cement
Ingredient Composition Percentage (%)
Lime CaO 62
Silica SiO2 22
Alumina Al2 O3 05
Calcium Sulphate CaSO4 04
Iron Oxide Fe2O3 03
Magnesia MgO 02
Sulphur S 01
Alkalies --- 01
Table 2. Physical properties of Ordinary Portland cement
Sl.
No. Properties
Test
Results As per IS 269-2015
1 Normal Consistency (in %) 32 -
2 Specific Gravity 3.09 -
Journal of University of Shanghai for Science and Technology ISSN: 1007-6735
Volume 23, Issue 11, November - 2021 Page-245

3
Setting Time (in Minutes)
a) Initial Setting Time
b)Final Setting time
80
360
Not less than 30mins
Not more than 600mins
4
Compressive Strength(MPa)
(70.6*70.6*70.6mm Cubes)
3 days strength
7 days strength
28 days strength
28.2MPa
38.5 MPa
58.8MPa
Not less than 27Mpa
Not less than 37Mpa
Not less than 53Mpa
The coarse aggregate used is brought from a local supplier in Magadi road, Bangalore,
Karnataka. The C.A of 12.5mm passing is used. The sieve analysis of coarse aggregates
confirms to the specifications of IS 383: 2016 for graded aggregates and specific gravity.
Table. 3 explain Physical properties of Coarse Aggregate respectively.
Table 3. Physical properties of Coarse Aggregate
M- SAND is used as fine aggregate from Tavara Mines &Minerals, Jigani Industrial area,
Anekal Taluk, Bangalore, Karnataka. The sieve analysis and physical Properties results
are presented in Table. 4 respectively. The sieve analysis results indicate that the sand
confirms to Zone-II as per IS: 383-2016.
Table 4. Physical properties of fine aggregates
As per IS:456-2000, Portable water is used for concreting. Ordinary portable water
available in the college campus is used throughout the project work. The fly-ash
used is from BTPS KPCL, Kudathini, Bellary (Dist), Karnataka. As per IS:3812 -
2013, It is pozzolanic fly-ash belonging to ASTM classification “F”. The fly-ash is
collected directly from open dry dumps, Its physical and chemical properties are
presented in Table 5 & 6.
Sl No Physical properties Coarse aggregate
1 Size 12.5mm
2 Specific gravity 2.63
3 Fineness modulus 7.24
4 Loose Bulk density (kg/m3) 1360
5 Rodded Bulk density (kg/m3) 1499
Sl No Physical properties Fine aggregate
1 Size 4.75mm
2 Specific gravity 2.52
3 Fineness modulus 2.94
4 Loose Bulk density (kg/m3) 1444.72
5 Rodded Bulk density (kg/m3) 1555.69
Journal of University of Shanghai for Science and Technology ISSN: 1007-6735
Volume 23, Issue 11, November - 2021 Page-246

Table. 5 Physical Properties of fly-ash obtained
Table. 6 Chemical Properties of fly-ash
Ground-granulated blast furnace slag is highly cementitious and high in CSH
(calcium silicate hydrates) which is a strength enhancing compound which
improves the strength, durability and appearance of the concrete. Use of GGBS
significantly reduces the risk of damages caused by alkali–silica reaction (ASR),
provides higher resistance to chloride ingress reducing the risk of reinforcement
corrosion and provides higher resistance to attacks by sulphate and other
chemicals. The GGBFS used in the Present investigation is from RMC Ready mix
(India), Kumbalagodu Industrial Area, Bangalore, Karnataka. As per IS:16714-
2018 physical properties are presented in Table 7 and Chemical properties are
presented Table 8
Table. 7 Physical Properties of GGBFS obtained
SL.NO Property value
1 Colour Light grey
2 Specific gravity 2.1
3 Surface area 310 m2/kg
SL.NO Parameter Percentage (%)
1 Silicon Dioxide(Sio2) 62.63
2 Alumina(Al2o3) 23.55
3 Iron oxide(Fe2o3) 3.93
4 Calcium oxide(cao) 2.04
5 Magnesium oxide(Mgo) 0.46
6 Sulfur tri oxide(So3) 1.34
7 Sodium oxide(Na2o) 0.032
8 Potassium oxide(K2o) 0.030
9 Loss on ignition% by mass 0.39
Sl.no Characteristics
(physical requirements)
Requirement as Per
IS:16714-2018
Test
Results
1 Fineness (M2/kg) 275 (Min) 395
2 Specific gravity ------ 2.51
3 45 micron (residue) (%) ------ 6.10
Journal of University of Shanghai for Science and Technology ISSN: 1007-6735
Volume 23, Issue 11, November - 2021 Page-247

Table. 8 Chemical Properties of GGBFS
Polypropylene fibres is used in the experimental work and is that uniform dispersion in is
obtained concrete. In this study, polypropylene fibres of 12 mm length are used.
Properties of fibres are shown in Table 9.
Fig. 1 Polypropylene fibres
Table. 9 Properties of Polypropylene fibres
Sl. NO
Characteristics
(Chemical requirements)
Requirement as Per BS
EN15167-1:2006 Test Results
1 Magnesia content (%) 18.0 (Max) 7.95
2 Sulphide Sulphur (%/) 2.00 (Max) 0.50
3 Sulphite content (%) 2.50 (Max) 0.29
4 Loss of ignition (%) 3.00 (Max) 0.22
5 Chloride content (%) 0.10 (Max) 0.008
6 Glass content (%) ------ 93
7 Moisture content (%) 1.0 (Max) 0.13
SI.NO Properties Polypropylene Fibres
1 Length 12mm
2 Diameter 30 µ
3 Slenderness ratio 400
4 Specific gravity 0.91
5 Melting point 1650c
6 Acid resistance High
7 Salt resistance High
8 Aspect ratio 2.5 µ or 0.0025mm
9 Specific gravity of Polypropylene
fibres
0.91
Journal of University of Shanghai for Science and Technology ISSN: 1007-6735
Volume 23, Issue 11, November - 2021 Page-248

3. Testing Methods
The workability tests conducted on SCC mixes are according to the
EFNARC-2002 guidelines.
Table. 10 Acceptance criteria for SCC as per EFNARC guidelines
SL.No
Method
Unit
Typical range of Values
Minimum Maximum
1 Slump flow by Abram‟s cone mm 650 800
2 J-ring mm 0 10
3 V-funnel s 6 12
4 L-box (h2/h1) (h2/h1) 0.8 1.0
5 U-box (h2-h1) mm 0 30
3.1 Fresh Properties of Final Mix Proportions
Table. 11 Fresh properties of final mix proportions 70% Cement + 30% Fly ash with
1%& 2%PP fibres
MIX
SF
SF1
SF2
EFNARC(2005)
GUIDELINES
Slump flow(mm) 720 690 650 650-800
J-ring(mm) 9 8 5 0-10
V-funnel(sec) 7 8.5 11 6-12
L-box(H1/H2 mm) 0.92 0.88 0.83 0.8-1.0
U-box(H1-H2 mm) 23 27 29 0-30
Table. 12 Fresh properties of final mix proportions 70% Cement + 30% GGBFS
with 1%& 2% PP fibres
MIX
SG
SG1
SG2
EFNARC(2005)
GUIDELINES
Slump flow(mm) 740 700 670 650-800
J-ring(mm) 9 7 4 0-10
V-funnel(sec) 8 9 11 6-12
L-box(H1/H2 mm) 0.90 0.88 0.82 0.8-1.0
U-box(H1-H2 mm) 23 27 29 0-30
Journal of University of Shanghai for Science and Technology ISSN: 1007-6735
Volume 23, Issue 11, November - 2021 Page-249

Fig. 2 Casting of Samples
4. Strength and Durability Tests
4.1 Compressive Strength Test
4.1.1 Casting of Cube Specimens for Compression Test
The steel cube moulds are coated with mould oil on their inner surfaces and are
placed on Plate. Concrete is poured in to the moulds. The top surface is finished using
trowel. After 48 hours concrete cubes are demoulded and the specimens are kept for
curing under water. The test results are tabulated.
4.1.2 Testing of cube specimens for Compressive Strength of concrete
The compression strength of concrete i.e., ultimate strength of concrete is defined
as the load which causes failure of the specimen divided by the area of the cross section in
uniaxial compression, under a given rate of loading. To avoid large variation in the results
of compression test, a great care is taken during the casting of the test specimens and the
loading as well. However, it is realized that, in an actual structure, the concrete at any
point is in a complex stress condition and not in uniaxial compression. However, it is
customary to conduct the test in uniaxial compression only. Concrete under Triaxial state
can offer more resistance and will fail only after considerably large deformations. The use
of 150mm cubes have been made as per I.S:516-1959 & IS 456-2000. The advantage of
selection of IS 516 – 1959 cube as the standard test specimen is that two plane and
parallel surfaces can always be found between which the load can be applied.
The failure of concrete under compression is due to shear stress occurring on planes
inclined at an angle of (45o – Φ/2) with the axis of loading, since the resistance of
concrete is a function of both the internal friction of Φ of concrete is generally about 20o,
such that failure occurs by the formation of a cone failure. Typical failures of standard
concrete specimens in compression as shown below.
Journal of University of Shanghai for Science and Technology ISSN: 1007-6735
Volume 23, Issue 11, November - 2021 Page-250

Figure. 3 Failure pattern of Specimen subjected to Compression
The failure in actual test deviates from this theoretical value of 35o, because of the
restraint to internal expansion under the compressive load produced due to friction
exercised by the bearing plates at the ends of the specimen. If this friction is reduced by
applying lubricant at the bearing surfaces and especially in case of high strength concrete,
failure occur by splitting of concrete into a series of vertical columns. This failure called
„Columnar Failure‟ or splitting failure occurs due to the fact that the compressive load
along the axis produces tensile strains along the perpendicular direction. Since concrete is
weak in tension and friction is eliminated from the bearing surfaces, the failure is by
splitting of concrete as shown in the Figure 3. At each desired curing periods specimens
are taken out of water and kept for surface drying. The cubes are tested in 2000kN
capacity compressive testing machine loaded at constant rate of loading at 145kg/cm2/min
as per standard procedure explained in IS: 516-1959(1999) to get the compression
strength of concrete.
5. Temperature Tests
Fig. 4 (a) Fig. 4 (b) Fig. 4(a) Placing of specimens in the temperature analysing box.
Fig. 4 (b) Monitoring the Temperature
Journal of University of Shanghai for Science and Technology ISSN: 1007-6735
Volume 23, Issue 11, November - 2021 Page-251

6. Mineral Admixtures Mixes Considered for Experimental Work
After procuring the required quantity of materials, the materials are tested for their
physical properties. Trials mixes using Okamura method of mix design are carried out for
the following mix proportions to achieve the final mixes, which satisfies all the
workability properties. (i) MIX –S: SCC containing 100% cement. (ii) MIX –S1: SCC
containing 100% cement with 1% fibres (iii) MIX –S2: SCC containing 100% cement
with 2% fibres (iv) MIX-SFG: SCC containing 70% cement, 15% fly ash and 15%
GGBFS, (v) MIX-SFG1: SCC containing 70% cement, 15% fly ash and 15% GGBFS
with 1% fibres, (vi) MIX -SFG2: SCC containing 70% cement, 15% fly ash and 15%
GGBFS with 2% fibres, (vii) MIX –SF: SCC containing 70% cement and 30% fly ash.
(viii) MIX –SF1: SCC containing 70% cement and 30% fly ash with 1% fibres. (ix)MIX –
SF2: SCC containing 70% cement and 30% fly ash with 2% fibres. (x) MIX -SG: SCC
containing 70% cement and 30% GGBFS. (xi) MIX –SG1: SCC containing 70% cement
and 30% GGBFS with 1% fibres. (xii) MIX –SG2: SCC containing 70% cement and 30%
GGBFS with 2% fibres Table. 13 gives the details of all the mixes.
Table 13. Mix Proportions Details.
7. RESULTS AND DISCUSSIONS
The results are shown in the following figures, it represents the compressive
strength influence in the different mix proportion and various optimized temperature. In
this present investigation, the cured specimens are exposed to the two different
temperatures i.e. 200°C & 400°C. Once the specimens are subjected to temperature, it
was checked for its compression strength. The results of each mix are analyzed,
compared and plotted graphs.
Mix Cement% Fly ash % GGBFS % SP % PPF %
S 100 -- -- 1 --
S1 100 -- -- 1 1
S2 100 -- -- 1 2
SF 70 30 -- 1 --
SF1 70 30 -- 1 1
SF2 70 30 -- 1 2
SG 70 -- 30 1 --
SG1 70 -- 30 1 1
SG2 70 -- 30 1 2
SFG 70 15 15 1 --
SFG1 70 15 15 1 1
SFG2 70 15 15 1 2
Journal of University of Shanghai for Science and Technology ISSN: 1007-6735
Volume 23, Issue 11, November - 2021 Page-252
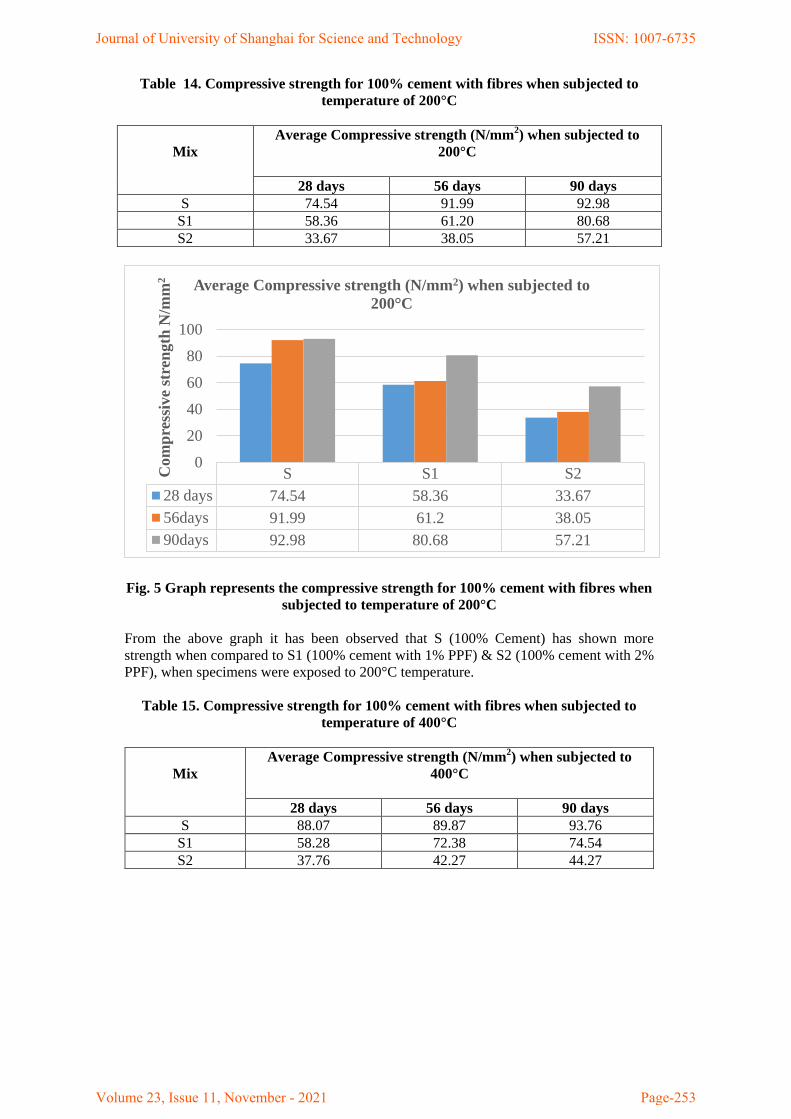
Table 14. Compressive strength for 100% cement with fibres when subjected to
temperature of 200°C
Mix
Average Compressive strength (N/mm2) when subjected to
200°C
28 days 56 days 90 days
S 74.54 91.99 92.98
S1 58.36 61.20 80.68
S2 33.67 38.05 57.21
Fig. 5 Graph represents the compressive strength for 100% cement with fibres when
subjected to temperature of 200°C
From the above graph it has been observed that S (100% Cement) has shown more
strength when compared to S1 (100% cement with 1% PPF) & S2 (100% cement with 2%
PPF), when specimens were exposed to 200°C temperature.
Table 15. Compressive strength for 100% cement with fibres when subjected to
temperature of 400°C
Mix
Average Compressive strength (N/mm2) when subjected to
400°C
28 days 56 days 90 days
S 88.07 89.87 93.76
S1 58.28 72.38 74.54
S2 37.76 42.27 44.27
S S1 S2
28 days 74.54 58.36 33.67
56days 91.99 61.2 38.05
90days 92.98 80.68 57.21
0
20
40
60
80
100
Com
pre
ssiv
e st
ren
gth
N/m
m2
Average Compressive strength (N/mm2) when subjected to
200°C
Journal of University of Shanghai for Science and Technology ISSN: 1007-6735
Volume 23, Issue 11, November - 2021 Page-253

Fig. 6 Graph represents the Compressive strength for 100% cement with fibres
when subjected to temperature of 400°C
From the above graph it has been observed that S (100% Cement) has shown more
strength when compared to S1 (100% cement with 1%PPF) & S2 (100% cement with
2%PPF), when specimens were exposed to 400°C temperature. Also it has been observed
that when the specimens were exposed to temperature of 400° C, the compressive strength
of specimens were decreased when compared to 200°C temperature.
Table 16. Compressive strength for 70% cement + 30% Fly ash with fibres when
subjected to temperature of 200°C
Mix
Average Compressive strength (N/mm2) when subjected to
200°C
28 days 56 days 90 days
SF 65.19 71.65 78.25
SF1 34.48 41.65 64.03
SF2 27.21 38.24 41.74
S S1 S2
28 days 88.07 58.28 37.76
56days 89.87 72.38 42.27
90days 93.76 74.54 44.27
0102030405060708090
100
Com
pre
ssiv
e S
tren
gth
N/m
m2
Average Compressive strength (N/mm2) when subjected to
400°C
Journal of University of Shanghai for Science and Technology ISSN: 1007-6735
Volume 23, Issue 11, November - 2021 Page-254

Fig. 7 Graph represents compressive strength for 70% cement + 30% Fly ash with
fibres when subjected to temperature of 200°C
From the above graph it has been observed that the mix containing 70% cement + 30% fly
ash shows greater strength when compared to the mix containing PP fibres, when
specimens were exposed to 200°C temperature.
Table 17. Compressive strength for 70% cement+ 30% Flyash with fibres when
subjected to temperature of 400°C
Mix
Average Compressive strength (N/mm2) when subjected to
400°C
28 days 56 days 90 days
SF 73.63 74.15 81.94
SF1 37.11 37.59 45.04
SF2 26.94 36.66 37.50
SF SF1 SF2
28 days 65.19 34.48 27.21
56days 71.65 41.65 38.24
90days 78.25 64.03 41.74
0102030405060708090
Com
pre
ssiv
e S
tren
gth
N/m
m2
Compressive strength (N/mm2) for 70% cement + 30% Fly ash
with fibres when subjected to temperature of 200°C
Journal of University of Shanghai for Science and Technology ISSN: 1007-6735
Volume 23, Issue 11, November - 2021 Page-255

Fig. 8 Compressive strength for 70% cement+ 30% Fly ash with fibres when
subjected to temperature of 400°C
From the above graph it has been observed that the mix containing 70% cement+30% fly
ash has shown greater strength when compared to the other mix contain PP fibres when
exposed to 400°C
Table. 18 Compressive strength for 70% cement+ 30% GGBS with fibres when
subjected to temperature of 200°C
Mix
Average Compressive strength (N/mm2) when subjected to
200°C
28 days 56 days 90 days
SG 83.71 91.65 97.54
SG1 53.24 58.41 73.62
SG2 36.04 45.61 47.48
SF SF1 SF2
28 days 73.63 37.11 26.94
56days 74.15 37.59 36.66
90days 81.94 45.04 37.5
0
10
20
30
40
50
60
70
80
90
Com
pre
ssiv
e st
ren
gth
N/m
m2
Average Compressive strength (N/mm2) when subjected to
400°C
Journal of University of Shanghai for Science and Technology ISSN: 1007-6735
Volume 23, Issue 11, November - 2021 Page-256

Fig. 9 Compressive strength for 70% cement+ 30% GGBS with fibres when
subjected to temperature of 200°C
From the above graph it has been observed that the mix containing 70% cement + 30%
GGBS shows greater strength when compared to all other mixes, when specimens
exposed to 200°C. When the same mix added with PP fibre, strength was reduced.
Table .19 Compressive strength for 70% cement+ 30% GGBS with fibres when
subjected to temperature of 400°C
Mix
Average Compressive strength (N/mm2) when subjected to
400°C
28 days 56 days 90 days
SG 81.88 92.11 94.59
SG1 45.78 61.82 67.46
SG2 35.65 39.27 45.27
SG SG1 SG2
28 days 83.71 53.24 36.04
56days 91.65 58.41 45.61
90days 97.54 73.62 47.48
0
20
40
60
80
100
120
Com
pre
ssiv
e S
tren
gth
N/m
m2
Compressive strength (N/mm2) for 70% cement+ 30% GGBS
with fibres when subjected to temperature of 200°C
Journal of University of Shanghai for Science and Technology ISSN: 1007-6735
Volume 23, Issue 11, November - 2021 Page-257

Fig. 10 Compressive strength for 70% cement+ 30% GGBS with fibres when
subjected to temperature of 400°C
From the above graph it has been observed that the specimens were exposed to 400°C, the
compressive strength of specimens was decreased. Increase in temperature will cause the
reduction of CSH gel. Hence compressive strength of the specimens was decreased.
Table. 20 Compressive strength for 70% cement+ 15% fly ash + 15% GGBS with
fibres when subjected to temperature of 200°C
Mix
Average Compressive strength (N/mm2) when subjected to
200°C
28 days 56days 90days
SFG 59.67 74.45 83.09
SFG1 44.26 69.55 82.13
SFG2 29.71 38.06 40.91
SG SG1 SG2
28 days 81.88 45.78 35.65
56days 92.11 61.82 39.27
90days 94.59 67.46 45.27
0102030405060708090
100
Com
pre
ssiv
e st
ren
gth
N/m
m2
Compressive strength (N/mm2) for 70% cement+ 30% GGBS
with fibres when subjected to temperature of 400°C
Journal of University of Shanghai for Science and Technology ISSN: 1007-6735
Volume 23, Issue 11, November - 2021 Page-258

Fig. 11 Compressive strength for 70% cement+ 15% fly ash + 15% GGBS with
fibres when subjected to temperature of 200°C
From the above graph it has been observed that the mix containing 70% cement +15% fly
ash + 15% GGBS with 1% of PP fiber shows the greater strength when compared to the
mix 70% cement +15% fly ash + 15% GGBS and 70% cement +15% fly ash + 15%
GGBS with 2% PP fiber when subjected 200°C.
Table. 21 Compressive strength for 70% cement+ 15% fly ash + 15% GGBS with
fibres when subjected to temperature of 400°C
Mix
Average Compressive strength (N/mm2) when subjected to
400°C
28 days 56 days 90 days
SFG 57.88 59.01 82.60
SFG1 35.50 47.77 81.97
SFG2 41.59 42.28 53.92
Fig. 12 Compressive strength for 70% cement+ 15% fly ash + 15% GGBS with
fibres when subjected to temperature of 400°C
SFG SFG1 SFG2
28 days 59.67 44.26 29.71
56days 74.45 69.55 38.06
90days 83.09 82.13 40.91
0
20
40
60
80
100C
om
pre
ssiv
e S
tren
gth
N/m
m2
Average Compressive strength (N/mm2) when subjected to
200°C
SFG SFG1 SFG2
28 days 57.88 35.5 41.59
56days 59.01 47.77 42.28
90days 82.6 81.97 53.92
020406080
100
Co
mp
ress
ive
stre
ng
th
N/m
m2
Average Compressive strength (N/mm2) when subjected to
400°C
Journal of University of Shanghai for Science and Technology ISSN: 1007-6735
Volume 23, Issue 11, November - 2021 Page-259

From the above graph it has been observed that the mix containing 70% cement +15% fly
ash + 15% GGBS with 1% of PP fiber shows the greater strength when compared to the
mix 70% cement +15% fly ash + 15% GGBS and 70% cement +15% fly ash + 15%
GGBS with 2% PP fiber when subjected 400°C.
8. Conclusions
The samples mix proportions with different admixtures are tested with the two variant
temperature is 200oC and 400oC. The samples were cured up to 90 days and tested under
the temperature of 200°C and 400oC. The sample with 100% cement (S, S1(1%
fibre),S2(2% fibre)) shows that, without fibre the compressive strength is high compared
with the addition of fibres .
It is observed that S (100% Cement) has shown more strength when compared to
S1 (100% cement with 1% Poly Propylene Fiber) & S2 (100% cement with 2%
PPF), when specimens were exposed to elevated temperature of 200°C. It has also
observed that S (100% Cement) has shown more strength when compared to S1
(100% cement with 1%PPF) & S2 (100% cement with 2%PPF). Also it has been
observed that when the specimens were exposed to temperature of 400° C, the
compressive strength of specimens was decreased when compared to 200°C
temperature.
The mix containing 70% cement + 30% fly ash shows greater strength when
compared to the mix containing Poly Propylene Fiber, when specimens were
exposed to 200°C temperature while in the other hand the mix containing 70%
cement+30% fly ash has shown greater strength when compared to the other mix
contain Poly Propylene Fiber when exposed to 400°C
The mix containing 70% cement + 30% GGBS shows greater strength when
compared to all other mixes, when specimens exposed to 200°C. When the same
mix added with Poly Propylene Fiber, strength was reduced while the specimens
were exposed to 400°C; the compressive strength of specimens was decreased.
Increase in temperature will cause the reduction of CSH gel. Hence compressive
strength of the specimens was decreased.
It has been observed that the mix containing 70% cement +15% fly ash + 15%
GGBS with 1% of PP fiber shows the greater strength when compared to the mix
70% cement +15% fly ash + 15% GGBS and 70% cement +15% fly ash + 15%
GGBS with 2% PP fiber when subjected 200°C and the strength is higher when it
is exposed to 400°C.
References
[1] Abhishek T S, S Vijaya, and B Shivakumara Swamy (2015). Study on Fresh and Mechanical
Properties of Coconut Fiber Reinforced Self Compacting Concrete Enhanced with Steel Fibers:
International Journal of Engineering Research and, Vol. V4, No. 06, pp. 15–24, DOI:
10.17577/ijertv4is060939
[2] Al-Tamimi, A.K., and Sonebi, M. (2003). Assessment of Self-Compacting Concrete Immersed in
Acidic Solutions: Journal of Materials in Civil Engineering, Vol. 15, No. 4, pp. 354–357, DOI:
10.1061/(asce)0899-1561(2003)15:4(354).
Journal of University of Shanghai for Science and Technology ISSN: 1007-6735
Volume 23, Issue 11, November - 2021 Page-260

[3] B.C, S., M.C., P., and K.B., P. (2012). Effect of Addition of Combination of Admixtures on the
Properties of Self Compacting Concrete Subjected to Sulphate Attack: i-manager‟s Journal on Civil
Engineering, Vol. 2, No. 4, pp. 34–39, DOI: 10.26634/jce.2.4.2032.
[4] Bhange, A., Dabhekar, K., and Pawade, D.P.. (2014). Analysis of Chemical Effect on Rigid
Pavement: IOSR Journal of Mechanical and Civil Engineering, Vol. 11, No. 3, pp. 72–78, DOI:
10.9790/1684-11317278.
[5] Chandrakant U. Mehetre, Pradnya P. Urade, Shriram H. Mahure, and K. Ravi (2014). Comparative
Study of Properties of Self Compacting Concrete With Metakaolin and Cement Kiln Dust As
Mineral Admixtures: IMPACT: International Journal of Research in Engineering & Technology
(IMPACT: IJRET), Vol. 2, No. 4, pp. 37–52.
[6] Dhiyaneshwaran, S., Ramanathan, P., Baskar, I., and Venkatasubramani, R. (2013). Study on
durability characteristics of self-compacting concrete with fly ash: Jordan Journal of Civil
Engineering, Vol. 7, No. 3, pp. 342–353.
[7] Feys, D., Liu, Z., and Heirman, G. (2009). Influence of self-compacting concrete composition on
sulfuric acid attack: Proc. of the 2nd Int. …, Vol. 65, No. 1, pp. 435–443.
[8] Gupta, P.K., Kumar, R., Gupta, Y.K., and Mehta, P.K. (2017). Effect of acidic environment on self
compacting concrete: International Journal of Civil Engineering and Technology, Vol. 8, No. 2, pp.
595–606
[9] H. Venkataram Pai, B. (2014). Development of Self Compacting Concrete with Various Mineral
Admixtures: American Journal of Civil Engineering, Vol. 2, No. 3, p. 96, DOI:
10.11648/j.ajce.20140203.16.
[10] Karjinni, V. V., Anadinni, S.B., and Patil, D.S. (2009). An investigation on the characteristic
properties of high performance SCC with mineral admixtures: Indian Concrete Journal, Vol. 83, No.
9, pp. 15–19.
[11] Kumari, G.J., Rao, M.V.S., and B, C.S. (2015). An Appraisal on Mechanical Properties of SCC
with Varying Packing Factors: Vol. 1, No. 6, pp. 8–11.
[12] Mahalingam, B., and Nagamani, K. (2011). Effect of processed fly ash on fresh and hardened
properties of self compacting concrete: International Journal of Earth Sciences and Engineering,
Vol. 4, No. 5, pp. 930–940.
[13] Mallesh, M., Shwetha, G.C., and Reena, K. (2015). Experimental Studies on M30 Grade Self
Compacting Concrete: International Journal of Science, Engineering and Technology Research,
Vol. 4, No. 9, pp. 3237–3241.
[14] Murthy.N, K. (2012). Mix Design Procedure for Self Compacting Concrete: IOSR Journal of
Engineering, Vol. 02, No. 09, pp. 33–41, DOI: 10.9790/3021-02933341.
[15] Pai, BHV; Nandy, M; Krishnamoorthy, A; Sarkar, P.K; PramukhGanapathy, C. (2014).
Experimental Study on Self-Compacting Concrete Containing Industrial By-Products: European
Scientific Journal, Vol. 10, No. 12, pp. 1857–7881.
[16] Pai, B., Nandy, M., Krishnamoorthy, A., and George, P. (2014). Comparative study of Self
Compacting Concrete mixes containing Fly Ash and Rice Husk Ash: American Journal of
Engineering Research (AJER), Vol. 03, No. 03, pp. 150–154.
[17] Raja, L.A. (2020). Experimental Study on Fiber Reinforced Self Compacting Concrete:
International Journal for Research in Applied Science and Engineering Technology, Vol. 8, No. 5,
pp. 2905–2909, DOI: 10.22214/ijraset.2020.5488.
[18] Reddy, S.V.B., and Suresh, T. (2018). Influence of Chemical admixture dosage on Fresh
Properties of Self-compacting concrete: International Journal of Engineering Science Invention,
Vol.7, No. 6, pp. 69–76.
Journal of University of Shanghai for Science and Technology ISSN: 1007-6735
Volume 23, Issue 11, November - 2021 Page-261
[19] Reena, K., and Mallesh, M. (2014). Experimental Studies on M20 Self Compacting Concrete:
International Journal of Advanced Technology in Engineering and Science, Vol. 02, No. 09, pp.
27–34.
[20] Shriram H., M., Mohitkar, V.M., and Ravi, K. (2014). Effect of Metakaolin On Fresh and
Hardened Propertios of Self Compacting Concrete: International Journal of Civil Engineering and
Technology (IJCIET), Vol. 5, No. 2, pp. 137–145.
[21] Su, N., Hsu, K.C., and Chai, H.W. (2001). A simple mix design method for self-compacting
concrete: Cement and Concrete Research, Vol. 31, No. 12, pp. 1799–1807, DOI: 10.1016/S0008-
8846(01)00566-X
[22] Suresh, N., Sachin, B.P., and Vinayaka, K.M. (2014). Hardened Properties of Self Compacting
Concrete Subjected to Elevated Temperature – A Review: International Journal of Emerging
Technology and Advanced Engineering, Vol. 4, No. 12, pp. 289–292.
[23] A. N. S. Al Qadi, K. N. Bin Mustapha, S. Nagathan, and Q. N. S. Al-Kadi, “Effect of
polypropylene fibres on fresh and hardened properties of self-compacting concrete at elevated
temperatures,” Aust. J. Basic Appl. Sci., vol. 5, no. 10, pp. 378–384, 2011.
[24] M. B. A. Alhasanat, A. N. Al Qadi, S. Al-Thyabat, M. Haddad, and B. G. Nofal, “Addition of
Waste Glass to Self-Compacted Concrete: Critical Review,” Mod. Appl. Sci., vol. 10, no. 11, pp.
2009–2010, 2016.
[25] S. Asadollahi, A. Saeedian, M. Dehestani, and F. Zahedi, “Improved compressive fracture models
for self-consolidating concrete (SCC),” Constr. Build. Mater., vol. 123, pp. 473–480, 2016.
[26] A. N. S. Al Qadi, K. N. Bin Mustapha, S. Naganathan, and Q. N. S. AL‐Kadi, “Effect of
polypropylene fibers on thermogravimetric properties of self‐compacting concrete at elevated
temperatures,” Fire Mater., vol. 37, no. 3, pp. 177–186, 2013.
[27] R. Vasusmitha and P. S. Rao, “Effect of elevated temperature on mechanical properties of high
strength self compacting concrete,” Int. J. Eng. Res. Technol, vol. 1, no. 8, pp. 1–10, 2012
[28] M. J. Rukavina, D. Bjegovic, and I. Gabrijel, “Mechanical properties of self-compacting concrete
with different mineral aditives after high temperature exposure,” J. Struct. Fire Eng., 2015.
[29] N.Pathak and R. Siddique,“Effects of elevated temperatures on properties of self-compacting-
concrete containing fly ash and spent foundry sand,”Constr. Build. Mater.,vol.34, pp.512–521,
2012.
[30] P.B.Narandiran, C. Mohanasundaram, and V. Aravind, “An Experimental Study on Acid and
Alkaline Resistance Tests on Self Compacting Concrete Super plasticizers,” Int. J. Innov. Res.
Eng. Sci. Technol., vol. V, no. 03, pp. 66–73, 2017.
Journal of University of Shanghai for Science and Technology ISSN: 1007-6735
Volume 23, Issue 11, November - 2021 Page-262