influence of salt quality in the spreading process - startside · influence of salt quality in the...
TRANSCRIPT

Influence of salt quality in the spreading process
Section 1: Data collection
1. Introduction
Salt is spread on the roads every year to combat the winter effects of ice and snow which make
the roads dangerous for driving (Figure 1). Basically, salt works by lowering the freezing point
of water. The most common system to spread the salt is the spinning disk. Its popularity is
motivated by its low production costs, its large spreading width, its small size and its simple
construction (Aphale et. al, 2003).
Figure 1. Spreading salt on icy road (BREDAL A/S 2014)
The centrifugal spreader consists of a rotating disk with blades fixed to the surface. The salt is
poured onto the spreader disk colliding with the rotating blades, accelerating outwards, before
it eventually leaves the spreader.
The process of salt spreading starts in the tank where the salt is stored and thanks to the feeder
mechanism it is supplied to the spreader disk where it is distributed into the air. Eventually,
after being airborne it ends up jumping or sliding at the road surface.
The salt spreading process is still
NOT under control and too often we
come across inadequate spreading
patterns when testing units indoor
(Figure 2). As it is seen in the figure,
around 25% of the salt was spread
directly outside the road in this
particular test set.
This inability to ensure an even
distribution is even bigger when the
test is done outdoor, closer to the
unit´s real working conditions.
Figure 2. Full scale test done at Engineering Center Bygholm

Influence of salt quality in the spreading pattern
2
A vast variety of salt features can be related to the quality of the salt. In this first approach salt
quality is only regarded to size distribution and only rock salt was tested. As seen in Figure 3,
the size and shape of the salt particles in a truck´s tank may show a large variation.
Figure 3. Rock salt particles (Takai, 2013b)
Table 1. Salt particle classification
< 1 mm Small particles
1 - 2,8 mm Medium particles
2,8 - 5,6 mm Big particles
1.1. State of the art
The performance of spinning spreader disks has been widely investigated (Patterson & Reece,
1962; Hao, Jianqun & Hong, 2013; Macías, 2014). Abundant are the papers which analyse
fertilizer spread and less are the ones with salt as object of the investigation. Nevertheless, the
physics behind the movement of both materials on the spreader disk is comparable. Therefore,
research on salt spread on roads as well as fertilizer distribution with agricultural purpose have
been studied.
The object of the studies has been quite varied, including some authors focusing their research
on identifying which factors influence the spread pattern. A multitude factors have been
identified as influencing the spreader pattern from a spinner disk dedicated to distribute
fertilizer or salt. These can be divided in three main groups: the environment where the
spreading takes place, the machine used and the material spread´s characteristics.
The last group is composed of authors who focused their investigations on identifying which
fertilizer characteristics change spread patterns. For this purpose, (Hofstee & Huisman, 1990)
investigated the influence of some factors on particle motion on and off the disk. That included
fertilizer characteristics such as particle size distribution, coefficient of friction, coefficient of
restitution, particle strength and aerodynamic resistance. The effect on the spread pattern from
the particle size distribution has been studied by (Yule, 2011). This study included an analysis
of 1700 tray samples which revealed the effect small particles have on the spreading pattern.
As the proportion of small particles increases it was observed that the peak value around the
centre line also increased. Nevertheless, the author claims that if the proportion remains below
15%, of particles smaller than 0.4 mm the coefficient of variation of spread is not disturbed
more than a 5%. (Takai, 2013b) observed that small particles land close to the disk and large
particles land further from the disk.
In this study, the maximum size allowed was 5,6
mm and as seen in table 1, the salt particles were
divided into small, medium and big depending on
their size.

Influence of salt quality in the spreading pattern
3
2. Method
2.1. Spreader disk features
The spreader disk used for the experiments is flat and has a diameter of 0.7 m (Figure 4). It was
equipped with three straight blades since in this first approach the purpose was to study a simple
geometry. In general, conventional blades on the industrial market have non-straight
geometries. However, if the salt quality has a significant influence for the chosen simple
geometry then probably it also has it for more complex geometries.
Figure 5. Straight blade geometry
The blade was 0.29 m long and 0.05 m high (Figure 5).
The feeding point is situated 0.15m from the centre of the disk and the rotational speed used in
the tests was 150 rpm.
2.2. Salt quality tested
During the summer of 2015 several spreader units came to Test Center Bygholm to be tested.
One of the trials done was a sieve analysis of the salt they were spreading (Table 2).
Table 2. Results of sieve analysis from rock salt samples presented as percentages in mass, Bygholm 2015
K38-S1 K40-S1 K56-S1 K41-S2 K38-S2 K59-S1 K39-S1 Average
<1mm 22 16 26 21 23 21 21 22
1 - 2,8mm 56 57 64 53 55 67 57 58
2,8 - 5,6mm 22 27 11 25 21 12 22 20
The average of these sieve analysis is considered sample 3 in this study. From this sample 3 the
rest of the samples (1, 2, 4 and 5) are established by the following procedure.
200 grams of salt with sample 3 size distribution was prepared, properly mixed and deposited
in a plastic recipient. This container was manually shaken for a couple of minutes, as a simple
simulation of the movement of the truck spreading salt, causing the flow of the small particles
to the bottom. The size distribution of samples 1, 2, 4 and 5 was obtained by analyzing the
content of the 2 top and 2 bottom fractions of salt in the new disposition after the shaken
operation. A diagram of the whole process can be seen in Figure 6.
0.05m 0.7m
Figure 4. Flat disk dimensions
0.2m

Influence of salt quality in the spreading pattern
4
To summarize, the size distribution of the 5 different samples tested during this study can be
seen in the following figure:
Figure 7. Size distribution of the samples
In order to distinguish the 3 different size fractions on each sample, the salt particles have been
colored depending on their size using food coloring (Figure 8). Thus, the small particles are
black, the medium blue and the big ones are pink.
Figure 8. Coloured salt particles
During shaking the
small particles tend to
flow to the bottom of the
container
Samples are
taken from the top
and from the
bottom
SAMPLE 5
SAMPLE 4
SAMPLE 2
SAMPLE 1
Initially the
particles are
homogeneously
distributed
independently
of their size
SAMPLE 3
Figure 6. Overall view of the test samples determination

Influence of salt quality in the spreading pattern
5
These colors were chosen for their different grey intensity levels when seen through the high
speed camera used in the experiments. A MATLAB® script was developed to enhance the
images obtained using grey-level transformations and to segment these images highlighting this
way the black, blue and pink salt particles as can be seen in section 6.4.
2.3. Data adquisition
In order to observe the influence of the salt quality in the salt spreading process several
approaches were taken at the same time. From simple observation of the spreading pattern to
the analysis of high speed movies going through the measure of the angles of the salt particles
leaving the disk (Figure 9).
Figure 9. Overall view of the study
2.3.1. From spreading plates
In order to get an idea of the influence of the salt quality on the spreading pattern, 3 plates were
strategically placed to collect salt portions during every test when using the coloured salt
(Figure 10). The standard plates in use had a dimension of 2,5 x 1 m and are the same type often
used in full scale tests at the Engineering Center Bygholm.
High speed movies

Influence of salt quality in the spreading pattern
6
Figure 10. Plates and high speed camera disposition during the test
The position of the plates during the tests is specified in the following figures and also their
numbering for the result analysis (Figure 11 and Figure 12).
Figure 11. Plan view of plate disposition
sssassa
s
sssas
sas
sss
assas
High speed camera AOS S-PRI plus 2124
Spreader disk Straight blades
Spreading plates 1m x 2,5m
Plate 3
Plate 2
Plate 1

Influence of salt quality in the spreading pattern
7
Figure 12. Elevation view of plate disposition
The 5 samples were tested, repeating the test for samples 1 and 5. It was no possible to repeat
the test with every sample due to the time consuming preparation of each one.
2.3.2. From motion-blurred images
To measure horizontal outlet angles, a simple imaging system was developed to capture the
trajectories followed by the salt particles in the vicinity of the spreader disk (Figure 13).
Figure 13. Motion-blurred imaging arrangement
The camera was placed approximately 1 meter
above the spreader disk. During all the
experiments the camera axis was set parallel to
the spreader disk. The camera exposure was set
in 1/25 seconds, long enough so that salt
particles appear as stripes on the pictures
captured (Figure 14).
Figure 14. Example of motion-blurred image
Every sample was tested following this procedure similar to the one used in (Villete et al.,
2008). Due to the time consuming sample preparation only samples 1, 3 and 5 were tested twice.
A summary of the results obtained is presented in section 3.2 and some of the images captured
in section 6.2.
sss
assas sss
assas
sss
assas
Camera Canon EOS 1100D
Spreader disk Straight blades
Trajectory
Disk and blade
tangential direction
Outlet angle
Salt particle trajectories
Spreading disk
Plate
Background Black plates

Influence of salt quality in the spreading pattern
8
2.3.3. From high speed videos
In order to observe the flow of rock salt particles on the spreader disk, two series of videos were
recorded using a modular and compact high speed camera. A first series using the conveyor
belt mechanism to provide a constant feed of salt to the spreader disk once the disk has already
reached the 150 rpm mentioned speed. And a second series without the feeder mechanism
starting with the disk completely still with the samples to test set in a pre-established position
on the disk, 0,15 m from the centre of the disk. The disk accelerates until reaching 150 rpm.
For the first series the camera was placed focusing on the disk with some angle of inclination.
Throughout filming, the spreader unit was static and the only movement came from the salt
spreader disk. In total, 10 kilograms of sample were spread every time with a constant mass
flow of 0,9 kg/s.
Limitations in the lighting equipment available forced the shoots to be taken outdoors in
daytime. Therefore, the sun has been the main and unique light source. A different setting was
used for practically every shooting made because of the changing nature of the weather.
Moreover, the lighting condition in every filming session highly influenced the quality of the
images obtained.
In Figure 10, it was shown one example of layouts used to take the shoots outdoors and the
equipment needed.
For the second series, the camera was placed approximately 1´5 meter above the spreader disk
with the axis set parallel to the spreader disk and the videos were recorded inside a greenhouse
(Figure 15).
Figure 15. General layout for the second series
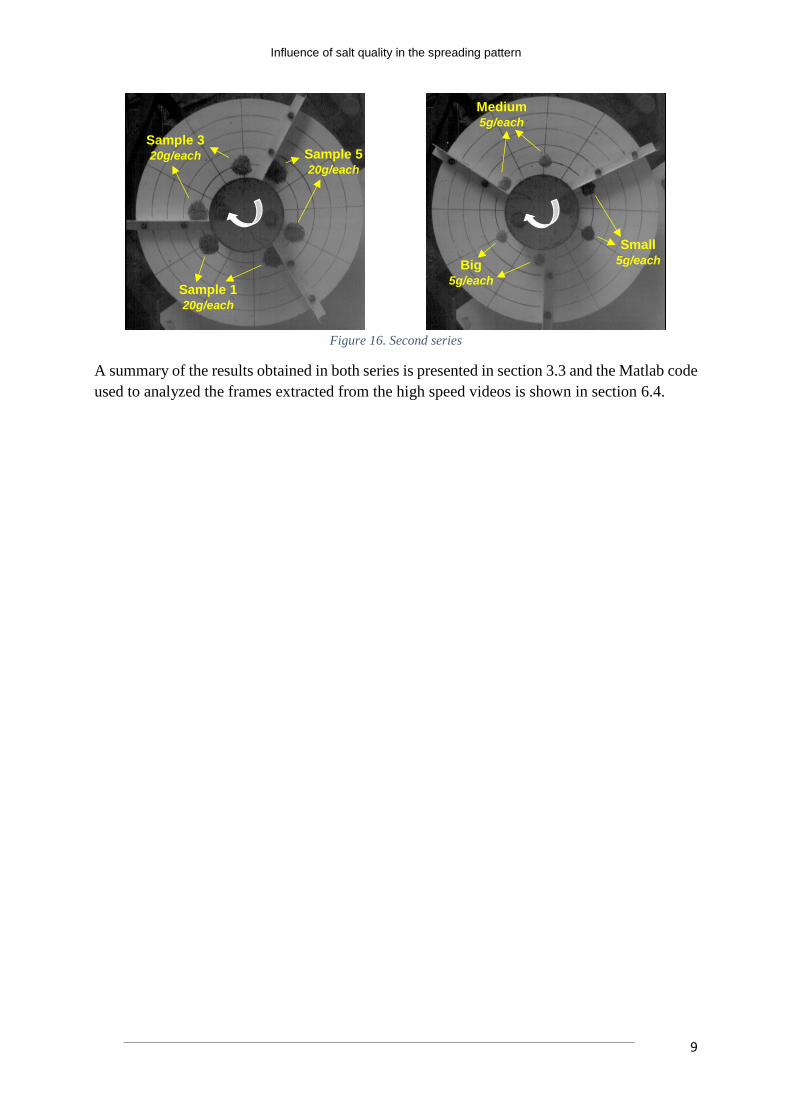
First, 20 grams of sample 1, of sample 3 and of sample 5 were spread at once. Second, 5 grams
of big salt particles, of medium salt particles and of small salt particles were spread at the same
time (Figure 16). In every case, a portion of sample collected already by the blade and another
not.
Influence of salt quality in the spreading pattern
9
Figure 16. Second series
A summary of the results obtained in both series is presented in section 3.3 and the Matlab code
used to analyzed the frames extracted from the high speed videos is shown in section 6.4.
Sample 3 20g/each Sample 5
20g/each
Sample 1 20g/each
Medium 5g/each
Small 5g/each Big
5g/each

Influence of salt quality in the spreading pattern
10
3. Results
3.1. From spreading plates
In this first approach, with limited time available, results have been obtained by simple
observation of the plates. In agreement with Takai, 2013b, it was observed that small particles
land closer to the disk and large particles land further from the disk.
When sample 3 (“average” size distribution) was spread, a significant amount of salt particles
landed in the plate referred as 1. The amount of salt particles resulting in plates 2 and 3 seemed
similar to each other.
However every time the extreme sample 1 or sample 5 have been spread the results have been
way different from those experienced with sample 3. Practically no salt particles have landed
in plate referred as 1 and there is a big difference between the content of plates 2 and 3,
containing a larger amount of salt particles after the test the last one.
Following it is shown a comparison of the salt present in plate 1 after spreading sample 1,
sample 3 and sample 5 (Figure 17).
As it has already been mentioned, when spreading sample 1 (above) and sample 5 (beneath)
very few particles land in plate 1. However, when spreading sample 3 (above) a significant
amount of particles land in plate 1.
Sam
ple
1
Sam
ple
3
1 2
1
2
1
2
1 2
PLATE 1
PLATE 1

Influence of salt quality in the spreading pattern
11
Figure 17. Comparison particles landing in plate 1
Another observation was the variation in the distance flown by the particles before landing on
the plates depending on the sample being tested. The size distribution of the salt spread seems
to have a big influence in the spreading pattern.
Following it is shown a comparison of the salt present in plate 3 after spreading sample 3 and
sample 5 (Figure 18).
As shown above, medium particles (blue ones) fly further from the disk when spreading
sample 5 (landing mainly between sections 5 and 8) than when spreading sample 3 (landing
mainly between sections 4 and 7).
9
8
7 6
4 3 8
6
4 3
3
5
2
7 9
5
1 2
3 2
3
Sam
ple
3
Sam
ple
3
Sam
ple
5
Sam
ple
5
0,25 m
0,25 m
Sam
ple
5
PLATE 1
PLATE 3
PLATE 3
PLATE 3
PLATE 3

Influence of salt quality in the spreading pattern
12
When spreading sample 3, from the first landing section of the plate it is already seen a
significant amount of small particles and some big particles. However, when spreading
sample 5, just few small particles land in the first section of the plate and no big particles at
all are present. Figure 18. Salt particles landing sections
In general, all sizes of salt particles fly further from the disk when spreading sample 5 than
when spreading sample 3.
A selection of images collected during the experiments is presented in section 6.1. later in this
report.
3.2. From motion-blurred images
In order to present the results of the spreading
angles in a comprehensive way, 12 sections of the
spreading disk (covering 18 degrees each), have
been highlighted in Figure 19 and the results will
be referred to them. In the adjacent figure it is also
pointed the direction of rotation of the disk and
the driving direction.
A schematic view of the results is presented in
tables 3, 4 and 5.
A selection of images captured during the
experiments is presented in section 6.2.
Figure 19. Sections of the spreader disk
The 12 sections defined above are divided in 3 groups since the way the salt particles leave the
disk differs depending on where in the disk they are when they initiate the flight. The 3 areas
are highlighted in Figure 20.
Figure 20. Areas of spreading
Area 2
Area 1
Area 3
Influence of salt quality in the spreading pattern
13
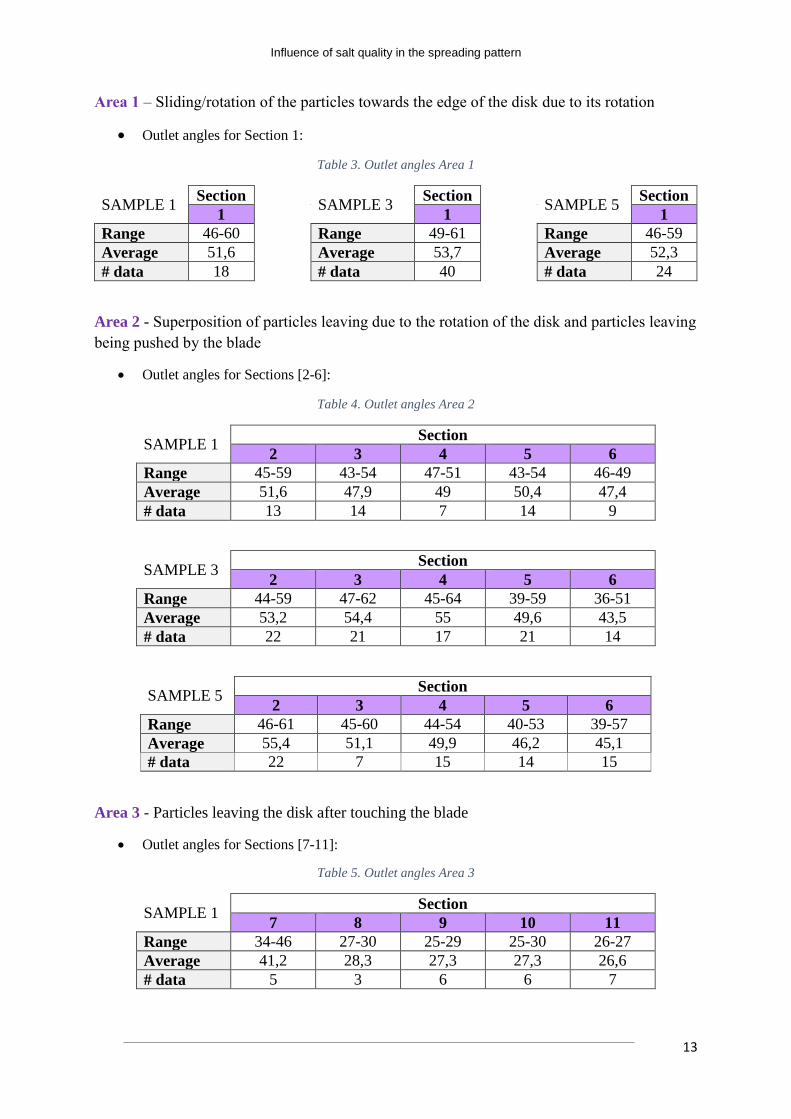
Area 1 – Sliding/rotation of the particles towards the edge of the disk due to its rotation
Outlet angles for Section 1:
Table 3. Outlet angles Area 1
SAMPLE 1 Section
SAMPLE 3 Section
SAMPLE 5 Section
1 1 1
Range 46-60 Range 49-61 Range 46-59
Average 51,6 Average 53,7 Average 52,3
# data 18 # data 40 # data 24
Area 2 - Superposition of particles leaving due to the rotation of the disk and particles leaving
being pushed by the blade
Outlet angles for Sections [2-6]:
Table 4. Outlet angles Area 2
SAMPLE 1 Section
2 3 4 5 6
Range 45-59 43-54 47-51 43-54 46-49
Average 51,6 47,9 49 50,4 47,4
# data 13 14 7 14 9
SAMPLE 3 Section
2 3 4 5 6
Range 44-59 47-62 45-64 39-59 36-51
Average 53,2 54,4 55 49,6 43,5
# data 22 21 17 21 14
SAMPLE 5 Section
2 3 4 5 6
Range 46-61 45-60 44-54 40-53 39-57
Average 55,4 51,1 49,9 46,2 45,1
# data 22 7 15 14 15
Area 3 - Particles leaving the disk after touching the blade
Outlet angles for Sections [7-11]:
Table 5. Outlet angles Area 3
SAMPLE 1 Section
7 8 9 10 11
Range 34-46 27-30 25-29 25-30 26-27
Average 41,2 28,3 27,3 27,3 26,6
# data 5 3 6 6 7

Influence of salt quality in the spreading pattern
14
SAMPLE 3 Section
7 8 9 10 11
Range 31-42 27-28 26-28 27-28 28-31
Average 35,5 27,5 27,25 27,5 29
# data 8 2 4 2 5
SAMPLE 5 Section
7 8 9 10 11
Range 30-33 27-32 28-32 26-30 26-29
Average 31,3 29,4 29,5 28,4 27,7
# data 3 13 12 5 3
The results obtained in section 3.1. show the biggest differences in plate 1 which is influenced
by sections 1, 2 and 3 of the spreading disk. Following in Figure 21 is represented the range of
spreading angles in these 3 mentioned sections and also the average of the angles obtained in
each case.
Figure 21. Spreading angles over plate 1
Plate 1
Plate 2
Average
Sample 1
Sample 3
Sample 5
Average
Average

Influence of salt quality in the spreading pattern
15
3.3. From high speed videos
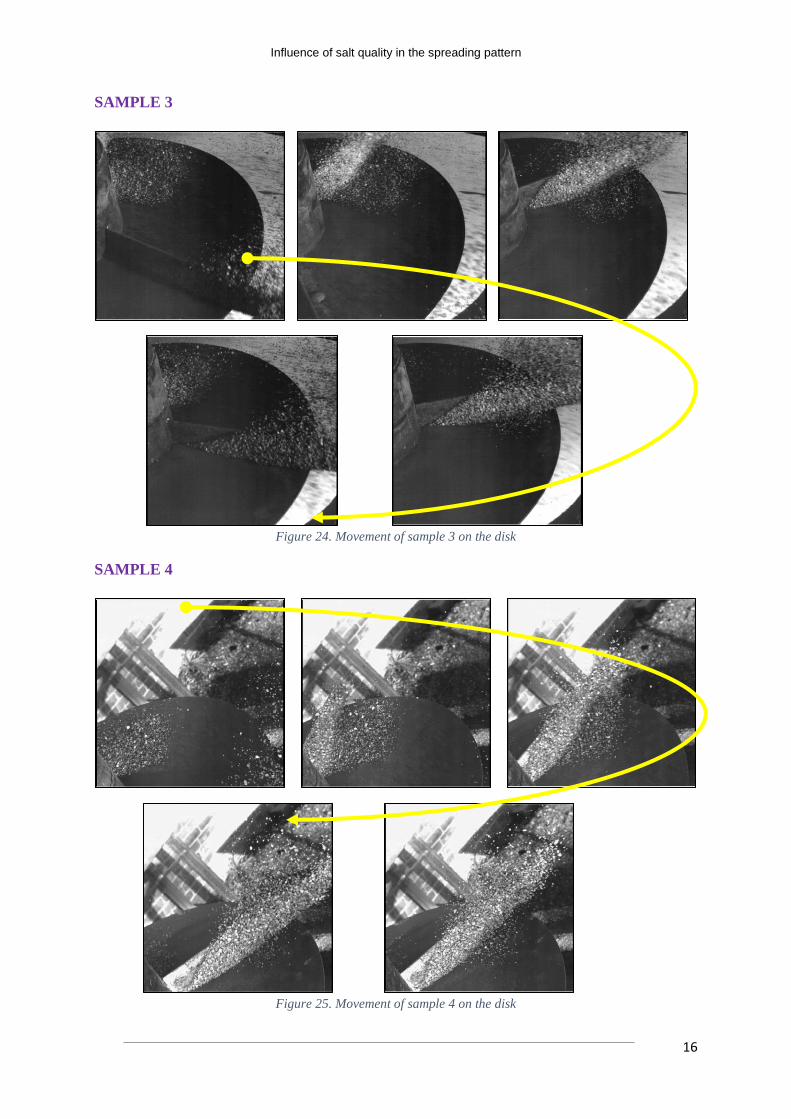
3.3.1. First series
Videos from every sample have been recorded but only 3 of them are going to be analysed in
detail, the corresponding to the samples studied in sections 3.1. and 3.2. (samples 1, 3 and 5).
First, an overall view of all the samples is shown in Figures 22 to 26:
SAMPLE 1
Figure 22. Movement of sample 1 on the disk
SAMPLE 2
Figure 23. Movement of sample 2 on the disk
Influence of salt quality in the spreading pattern
16
SAMPLE 3
Figure 24. Movement of sample 3 on the disk
SAMPLE 4
Figure 25. Movement of sample 4 on the disk

Influence of salt quality in the spreading pattern
17
SAMPLE 5
Figure 26. Movement of sample 5 on the disk
From the sequences above, it can be appreciated how it takes longer for the small particles to
leave the disk. In the following images, the small particles have been highlighted by means of
the Matlab code presented in section 6.4.
The same line of dark particles (small particles) is seen when spreading the 5 different samples.
Figures 27 to 29 illustrate this line of dark particles for the samples containing the largest
proportion of small particles where it is easier to appreciate it.
SAMPLE 1
Figure 27. Small particles highlighted on the disk in sample 1
Line of small particles

Influence of salt quality in the spreading pattern
18
SAMPLE 2
Figure 28. Small particles highlighted on the disk in sample 2
SAMPLE 3
Figure 29. Small particles highlighted on the disk in sample 3
3.3.2. Second series
A selection of images extracted from the videos is shown below in Figure 30 to provide an
overall view of the behaviour of the different sizes subjected to the same rotational velocity of
the disk.
Line of small particles
Line of small particles

Influence of salt quality in the spreading pattern
19
Figure 30. Movement of 5g-clusters of small, medium and big particles on the disk
The small particles are the first ones in start leaving the disk and they also stay the longest on
the disk (in agreement with the previous results exposed in section 3.3.1.).
Moreover, the big particles are the fastest on the disk.
Big Big
Big
Big Big Big
Small
Small Small
Small
Small
Small
Medium
Medium
Medium
Medium
Medium
Medium

Influence of salt quality in the spreading pattern
20
A new selection of images extracted from high speed videos is shown below in Figure 31 to
analyse the respond of samples 1, 3 and 5 subjected to the same rotational speed of the disk.
Figure 31. Movement of 20g-clusters of samples 1, 3 and 5 on the disk
Samples 1 and 3 are the first ones in start leaving the disk, however, sample 5 is the first to have
completely left the disk.
5
3 1
5
3 1 1
5 3
5
3 1
5
3
1 5
3
1

Influence of salt quality in the spreading pattern
21
4. Discussion
During the data collection it was observed that salt particles are cast in sub-clusters, as it had
previously been pointed out in (Takai, 2013a). These sub-clusters disintegrate on the way to the
floor. This process causes separation of particles according to their size. In general, small
particles land the closest to the disk and big particles the furthest.
This study used 5 salt samples with different size distributions and was divided in 3 parts:
behaviour of the rock salt particles on the disk, angle of the salt particles leaving the disk and
resulting spreading pattern.
These tasks, in this first approach, were developed by simple visual observations. One drawback
is that these observations require a large number of high speed videos that are expensive and
quite time consuming. A deeper study in the area would require the development of a
mathematical model of the behaviour of the sub-cluster depending on its size distribution.
During the study it was clear that the salt quality being spread has an important meaning in the
resulting spreading pattern. The pictures taken after spreading the different samples differ
significantly from each other.
An explanation for the results mentioned before may have been the change of angles of the
particles leaving the disk when spreading different samples. However, as it was shown in
section 3.2., the angles of the rock salt particles leaving the disk do not differ much between
different samples. Another possible explanation for these spreading pattern may be the amount
of salt leaving the disk on each section of the disk depending on which sample is being spread.
With the setup used during these tests it was impossible to get information about this topic.
Therefore, a future experimental setup might be designed to collect the salt in baskets around
the disk in order to obtain data about the amount of salt leaving the disk at each section of the
disk, similar to the one in use in (Reumers et al., 2003).
Several high speed videos were recorded for the analysis of the behaviour of the different
samples on the disk. The high speed camera needs plenty of light to get good images.
Limitations in the lighting equipment available forced us to record the movies outside, which
means that the wind also became a source for noise in the data collection.
The monochrome high speed camera used in the experiments made it difficult to distinguished
the different salt particles sizes/colours in the videos. Moreover, the changing nature of the light
source added shadows and light reflection which complicated even more the image
segmentation tasks.
Overall, the data collected along this study support the hypothesis that the salt quality has a
significant impact in the salt spreading process.
Influence of salt quality in the spreading pattern
22
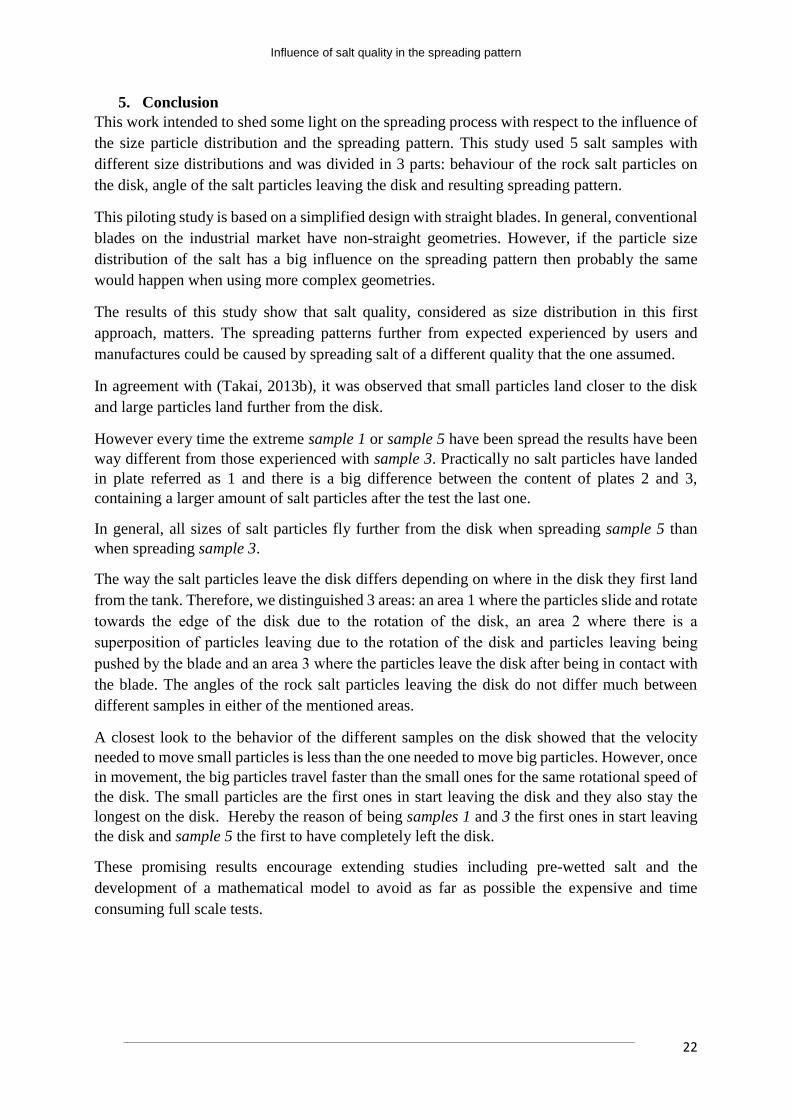
5. Conclusion
This work intended to shed some light on the spreading process with respect to the influence of
the size particle distribution and the spreading pattern. This study used 5 salt samples with
different size distributions and was divided in 3 parts: behaviour of the rock salt particles on
the disk, angle of the salt particles leaving the disk and resulting spreading pattern.
This piloting study is based on a simplified design with straight blades. In general, conventional
blades on the industrial market have non-straight geometries. However, if the particle size
distribution of the salt has a big influence on the spreading pattern then probably the same
would happen when using more complex geometries.
The results of this study show that salt quality, considered as size distribution in this first
approach, matters. The spreading patterns further from expected experienced by users and
manufactures could be caused by spreading salt of a different quality that the one assumed.
In agreement with (Takai, 2013b), it was observed that small particles land closer to the disk
and large particles land further from the disk.
However every time the extreme sample 1 or sample 5 have been spread the results have been
way different from those experienced with sample 3. Practically no salt particles have landed
in plate referred as 1 and there is a big difference between the content of plates 2 and 3,
containing a larger amount of salt particles after the test the last one.
In general, all sizes of salt particles fly further from the disk when spreading sample 5 than
when spreading sample 3.
The way the salt particles leave the disk differs depending on where in the disk they first land
from the tank. Therefore, we distinguished 3 areas: an area 1 where the particles slide and rotate
towards the edge of the disk due to the rotation of the disk, an area 2 where there is a
superposition of particles leaving due to the rotation of the disk and particles leaving being
pushed by the blade and an area 3 where the particles leave the disk after being in contact with
the blade. The angles of the rock salt particles leaving the disk do not differ much between
different samples in either of the mentioned areas.
A closest look to the behavior of the different samples on the disk showed that the velocity
needed to move small particles is less than the one needed to move big particles. However, once
in movement, the big particles travel faster than the small ones for the same rotational speed of
the disk. The small particles are the first ones in start leaving the disk and they also stay the
longest on the disk. Hereby the reason of being samples 1 and 3 the first ones in start leaving
the disk and sample 5 the first to have completely left the disk.
These promising results encourage extending studies including pre-wetted salt and the
development of a mathematical model to avoid as far as possible the expensive and time
consuming full scale tests.

Influence of salt quality in the spreading pattern
23
6. Annexes
6.1. From spreading plates
Link to picture selection:
https://www.dropbox.com/sh/h7bxpl6ij8mmorn/AAAhWwPjgyEiqIsa30DBqBsBa?dl=0
6.2. From motion-blurred images
Link to picture selection:
https://www.dropbox.com/sh/w8dad1oa9d04q6m/AABYfZJzKxHPwfVhiRiYqTUGa?dl=0
6.3. From high speed videos
Link to video selection from the first series:
https://www.dropbox.com/sh/kubbvoad5f1h7bf/AACdZkcmTQXO6LWlW-xAKLbia?dl=0
Link to video selection from the second series:
https://www.dropbox.com/sh/lyw3b68uh3mnry3/AAAucCFK1CntGMzAV1kL-41-a?dl=0
6.4. MATLAB® script %For a 2D greyscale image this function improves it and then segments it
ima=imread('SAMPLE 2-RR.png'); %sample image
im=rgb2gray(ima);
%Improve a 2D image
%OptionA:
A=imadjust(im);
%OptionB:
h=fspecial('unsharp');
B=imfilter(im,h);
%OptionC:
C=imsharpen(im);
%OptionD:
D = histeq(im);
%OptionE:
E = imadjust(im,stretchlim(im),[]);
% Visualize the image improvements
figure('color','w')
subplot(2,3,1), imshow(im)
set(get(gca,'Title'),'String','Original')
subplot(2,3,2), imshow(A)
set(get(gca,'Title'),'String','Option A - Adjust image intensity')
subplot(2,3,3), imshow(B)
set(get(gca,'Title'),'String','Option B - Unsharp filter')
subplot(2,3,4), imshow(C)
set(get(gca,'Title'),'String','Option C - Unsharp masking')

Influence of salt quality in the spreading pattern
24
subplot(2,3,5), imshow(D)
set(get(gca,'Title'),'String','Option D - Contrast enhancement')
subplot(2,3,6), imshow(E)
set(get(gca,'Title'),'String','Option E - Contrast adjustment')
choice=menu('Select the option you wish to proceed with','Option A','Option B','Option
C','Option D','Option E','Original');
switch choice
case {1}
image=A;
case {2}
image=B;
case {3}
image=C;
case {4}
image=D;
case {5}
image=E;
case {6}
image=im;
otherwise
image=im;
end
%----------------------------------------------------------------------------------
imput_img=ima;
imput_img2=ima;
imput_img3=ima;
%Change the limits of Bl, Bk and Pk depending on the image on use
Bl=image(:,:)>=(99)&image(:,:)<=(218); %logical 1 if grey intensity belongs to blue salt,
otherwise logical 0
Bk=image(:,:)>=(0)&image(:,:)<=(54);
Pk=image(:,:)>=(219)&image(:,:)<=(255);
%Find the rows and column with 1
[row,col]=find(Bl);
[row2,col2]=find(Bk);
[row3,col3]=find(Pk);
%In the original image, change the positions found before by black, blue or pink
for i=1:size(row) %BLUE
imput_img(row(i),col(i),1)=0;
imput_img(row(i),col(i),2)=128;
imput_img(row(i),col(i),3)=255;
end
for i=1:size(row2) %BLACK
imput_img2(row2(i),col2(i),1)=0;
imput_img2(row2(i),col2(i),2)=255;
imput_img2(row2(i),col2(i),3)=0;
end
for i=1:size(row3) %PINK

Influence of salt quality in the spreading pattern
25
imput_img3(row3(i),col3(i),1)=255;
imput_img3(row3(i),col3(i),2)=51;
imput_img3(row3(i),col3(i),3)=255;
end
subplot(2,2,1)
imshow(image)
title('Original Image');
subplot(2,2,2)
imshow(imput_img)
title('Medium size');
subplot(2,2,3)
imshow(imput_img2)
title('Small size');
subplot(2,2,4)
imshow(imput_img3)
title('Big size');

Influence of salt quality in the spreading pattern
26
References
Aphale, A., Bolander, N., Park, J., Shaw, L., Svec, J. & Wassgren, C., 2003. Granular Fertilizer Particle
Dynamics on and off a Spinner Spreader. Biosystems Engineering, 85 (3), pp. 319-329.
BREDAL A/S, 2016. Products. [Online] Available at: http://www.bredal.com/ [Accessed 05 May 2016]
Hao, L., Jianqun, Y. & Hong, F., 2013. Simulation of the operation of a fertilizer spreader based on an outer
groove wheel using a discrete element method. Mathematical and Computer Modelling, 58(3-4),
pp. 842-851.
Hofstee, J.W. & Huisman, W., 1990. Handling and spreading of fertilizers part 1: Physical properties of
fertilizer in relation to particle motion. Journal of Agricultural Engineering Research, 47, pp. 213-234.
Macías, P., 2014. Standardization of test method for salt spreader: Air flow experiment. Report 12: Flow of
salt particles in a spinning spreader disk. Aarhus University, Engineering Centre Bygholm, Test and
Development.
Patterson, D.E. & Reece, A.R., 1962. The theory of the centrifugal distributor. I: Motion on the disc, near-
centre feed. Journal of Agricultural Engineering Research, 7 (3), pp. 232-240.
Reumers, J., Tijskens, E. & Ramon, H., 2003. Experimental characterization of the tangential and cylindrical
fertilizer distribution pattern from a spinning disc: a parameter study. Byosystems Engineering, 86 (3),
pp. 327-337.
Takai, H., 2013a. Standardization of test method for salt spreader: Air flow experiment. Report 8:
Observations of salt particle trajectory from spreader disc to road surface. Aarhus University, Engineering Centre Bygholm, Test and Development.
Takai, H., 2013b. Standardization of test method for salt spreader: Air flow experiment. Report 10:
Simulation of salt particle trajectory from spreader disc to road surface. Basic consideration and
equations. Aarhus University, Engineering Centre Bygholm, Test and Development.
Villete, S., Piron, E., Cointault, F. & Chopinet, B., 2008. Centrifugal spreading of fertilizer: deducing three-
dimensional velocities from horizontal outlet angles using computer vision. Biosystems Engineering,
99, pp. 496-507.
Yule I.J., 2011. The Effect of Fertiliser Particle Size on Spread Distribution. NZ Centre for Precision Agriculture, Massey University, Palmerston North, New Zealand, no.24.
- Software
MATLAB® Registered trademark of The MathWorks Inc., Natick, MA, USA www.mathworks.se
AutoCAD® Registered trademark of Autodesk Inc., San Rafael, CA, USA www.autodesk.com