influence of the salt properties on their transport ... online proceeding/5 water... · influence...
TRANSCRIPT

BUE ACE1
Sustainable Vital Technologies in
Engineering & Informatics 8-10 Nov 2016
Influence of the salt properties on their transport through thin
film reverse osmosis membranes
H.A.Shawkya,* , M.E.A.Alia, A.A.S.Gallaba, M.S.A. Abdel-Mottalebb
aHydro-geochemistry department, Egypt Desalination Research Center of excellence (EDRC), Desert Research Center,1 Mathaf El
Matariya Street, 11753,Cairo, Egypt. bNano-Photochemistry and Solar Chemistry Department, Faculty of Science, Ain Shams University,Abbaseyya, 11566, Cairo, Egypt,
Abstract
Salt properties such as ionic size, diffusivity and concentration are three important parameters used to indicate the flow
behavior of the salt through thin film composite (TFC) reverse osmosis (RO) membranes. In our study, NaCl, Na2SO4,
CaCl2.2H2O, MgSO4.7H2O salt was used as feed solutions. Four concentrations were prepared (1000,2000,5000,10000
ppm) for each salt and each salt concentration was operated at two and three folds of its osmotic pressure. All
experimental conditions were done on the flat sheet thin film composite membrane (TFC) model YMSGSP4205 using
CF042 cross-flow test cell to determine the membrane performance, membrane transport parameters and the factors
affecting these salts transport. The observed salt rejection and volumetric water flux were calculated and the graphical
method was applied to determine the mass transfer coefficient to study the effect of salt properties on these results. The
results indicated that the salt rejection percentage are in the order of Na2SO4> NaCl> MgSO4.7H2O > CaCl2.2H2O with
values of 97.9%, 97% , 93% and 92%, respectively, at 2000ppm.
Keywords:Reverse Osmosis; Thin Film Flat membranes; ionic size; diffusivity; Salt Transport; graphical method.
1. Introduction:
Reverse osmosis (RO) technique is an important and rapidly growing source of providing drinking
water and is widely used in desalination plants especially in remote areas because of its lower cost and
simplicity [ Khawajia et al.,2008]and[Lin et.al.,2007]. It can separate salts from saline water with an
efficiency of 99% to give highly pure water. RO membranes are either cellulose acetate derivatives or poly
amide membrane derivatives. Polyamide membranes have better mechanical stability, wide pH range and are
non-hydrolyzed unlike cellulose acetate membrane derivatives that are unfortunately chemically unstable
against the feed pH change [Zaidi et al., 2015]. The reason why poly amide membranes have high salt
rejection and the
__________
*Corresponding author. Tel.:+201002930710 ; Email address: [email protected]

2 Author name / BUE ACE1 SVT2016
salt rejection increase with time as the RO process continues, is the hydrodynamic dependence of the salt
rejection on the structure of the membrane active layer structure that is affected by the applied pressure of the
process. The thin film polyamide membrane consists of three layers; the polyamide (PA) active layer made by
interfacial polymerization method, a polysulfone support layer made by phase inversion method and a
reinforcing non-woven poly ester layer [Zaidi et al., 2015]. Ding and coworkers concluded from their
pressure-driven molecular dynamic simulation study on the RO polyamide membrane, that as the RO
(considered a pressure driven process) continues more and more pressure is applied to the surface of PA active
layer and the structure of the PA become denser at its surface. This increase in the density of the PA limits the
solute transfer through the membrane resulting in the advantage of the high salt rejection of the TFC
membrane [Ding et al., 2015].Ions in solution are formed by the dissociation of inorganic salts in water and
they are not free, they are surrounded by shells of solvent molecules i.e. hydrated ions( Fig. 1).
Figure (1) Formation of hydrated ions in solution.
Many studies have been carried out to investigate the mechanisms that control the performance of reverse
osmosis (RO) desalination processes, among which concentration polarization (CP) is considered a primary
factor for the deviation of the permeate flux from being linearly increasing with driving pressure [Wenwen et
al.,2006]. Concentration polarization is a phenomenon representing the buildup of a solute concentration
boundary layer at the liquid-membrane interface due to salt rejection at the membrane surface.
A.A.S.Gallab/ BUE ACE1 SVT2016 3
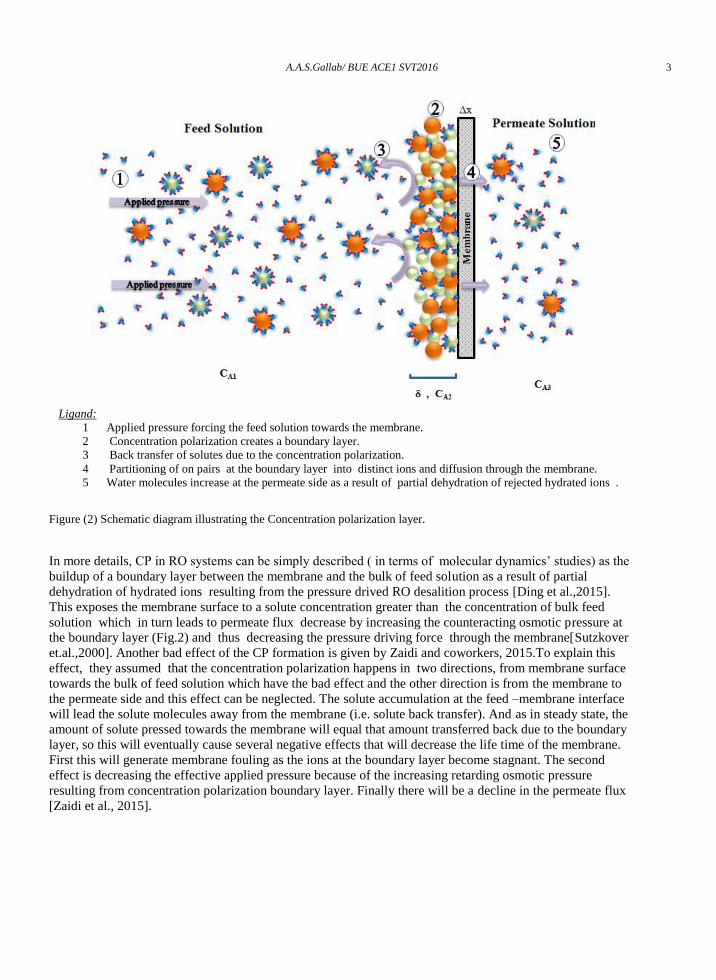
Figure (2) Schematic diagram illustrating the Concentration polarization layer.
In more details, CP in RO systems can be simply described ( in terms of molecular dynamics’ studies) as the
buildup of a boundary layer between the membrane and the bulk of feed solution as a result of partial
dehydration of hydrated ions resulting from the pressure drived RO desalition process [Ding et al.,2015].
This exposes the membrane surface to a solute concentration greater than the concentration of bulk feed
solution which in turn leads to permeate flux decrease by increasing the counteracting osmotic pressure at
the boundary layer (Fig.2) and thus decreasing the pressure driving force through the membrane[Sutzkover
et.al.,2000]. Another bad effect of the CP formation is given by Zaidi and coworkers, 2015.To explain this
effect, they assumed that the concentration polarization happens in two directions, from membrane surface
towards the bulk of feed solution which have the bad effect and the other direction is from the membrane to
the permeate side and this effect can be neglected. The solute accumulation at the feed –membrane interface
will lead the solute molecules away from the membrane (i.e. solute back transfer). And as in steady state, the
amount of solute pressed towards the membrane will equal that amount transferred back due to the boundary
layer, so this will eventually cause several negative effects that will decrease the life time of the membrane.
First this will generate membrane fouling as the ions at the boundary layer become stagnant. The second
effect is decreasing the effective applied pressure because of the increasing retarding osmotic pressure
resulting from concentration polarization boundary layer. Finally there will be a decline in the permeate flux
[Zaidi et al., 2015].
Ligand:
1 Applied pressure forcing the feed solution towards the membrane.
2 Concentration polarization creates a boundary layer.
3 Back transfer of solutes due to the concentration polarization.
4 Partitioning of on pairs at the boundary layer into distinct ions and diffusion through the membrane.
5 Water molecules increase at the permeate side as a result of partial dehydration of rejected hydrated ions .
4 Author name / BUE ACE1 SVT2016
The osmotic pressure π is calculated from eqn. (1)
π = і CRT (1)
And the volumetric permeate flux [Srinivasan et al., 2011] is given by eqn. (2) and (3)
Jv = A (Δp-Δπ) (2)
Jv = permeate volume/membrane surface area x time (3)
Also the observed salt rejection Ro is calculated from eqn. (4)
Ro = (CA1- CA3)/ CA1 (4)
For a better description of RO system, many efforts have been made to determine the mass transfer coefficient
in RO processes which is affected by concentration polarization [Zhou et al., 2006; Al-Bastaki and
Abbas,2000 and Taniguchi et al.,2001].And the mass transfer coefficient k is equal to D /δ where D is the Salt
diffusion coefficient and δ is the boundary layer thickness.
It is important to investigate the effect of different water types on the polyamide thin film composite (TFC)
RO membranes and to apply mass transfer models during the RO desalination to realize the different ions
behavior during their solution desalination. Water types are determined according to the main or predominant
ion constitution of water. The major ions predominant in water are Sodium Na+,potassium K+,calcium
Ca2+,magnesium Mg2+,chloride Cl-, sulphates SO42-,carbonates CO32- and bicarbonates HCO3-. Those ions
are responsible for the water salinity which can be represented as Total dissolved solids (TDS) and measured
by milli grams per litre (mg/l) or part per million (ppm) [Hem, 1985]. Applying models to quantify the mass
transfer coefficient is important to characterize the separative properties of the membrane. Separative
properties of the membrane are characterized by certain parameters that describe the relative transport of
solute and solvent through membranes [Sundaramoorthy S. et al, 2011]. In the desalination process, it is
essential to determine the flow behaviour of the salt through thin film composite reverse osmosis membranes.
The salt transport behaviour through RO membranes is affected by some salt properties such as ionic size,
diffusivity and concentration [Geise et al., 2013].
2. Theory:
Murthy and Gupta, 1996 reviewed different models concerning the determination of mass transfer coefficient
through RO membranes such as the, Kimura-Sourirajan Analysis (KSA) and the graphical method and in
their work the equations of the solution-diffusion model and the film theory model are rearranged so that
they can be used to estimate the membrane parameters ;solute transport parameter (DAM/Kδ) and the mass
transfer coefficient k simultaneously by a simple graphical method. They also concluded that the KSA
method is laborious and time consuming while the graphical model is suitable for estimation of the mass
transfer coefficient especially when the salt rejection percentage is near or close to 100%.
2.1. Film theory model:
During the desalination process, as the water molecules pass through the membrane the concentration of salt
near the membrane-at the feed side- will differ from the concentration at the bulk. The concentration
polarization can be described as the build-up of salt concentration at the membrane-liquid interface. (Song et
al., 2002) suggested that salt accumulation at the feed solution-membrane interface might lead to an

A.A.S.Gallab/ BUE ACE1 SVT2016 5
equilibrium state under certain conditions. At steady state the solute flux through the membrane is constant
and equal to the solute flux throughout the film. The material balance for the solute in a differential element
gives the following equation;
NA = CAJv – DAB (dCA/dx) (5)
which is to be solved using the following boundary conditions:
C = CA1 at x = 0
C = CA2 at x = l
where CA1 is the solute concentration in the bulk of the feed, CA2 is the solute concentration in the boundary
layer (concentration polarization layer) , and l is the concentration polarization layer thickness. Integration of
(Eq. 1) and using the above boundary conditions results in the following equation:
(CA2 – CA3)/(CA1 - CA3)= exp(Jv/k) (6)
where CA3 is the solute concentration in the product and k is the mass transfer coefficient, defined as DAB/ l
.Equation (6) can be rearranged to give a correlation between the observed rejection, and the true salt
rejection(eqn.7)
R= (CA2 - CA3)/CA2 (7)
The correlation is given by the equation (5)
Ln [(1-Ro)/Ro] = Ln [(1-R)/R] + Jv/k
(8)
2.2. Graphical Method
The solvent volumetric flux
Jv = A (ΔP - Δπ) (2)
Whereas A is the pure water permeability (PWP) coefficient
A= [PWP] /(Mv X S X 3600 X P ) (9)
The volumetric solvent flux can be also expressed by the following relation
NA = (DAM/Kδ)(CA2 - CA3) (10)
Where (DAM/Kδ) is a single parameter called the ‘solute transport parameter’. Equations (2) and (9) can be
combined with Eq. (7) to give
1/R = 1+ (DAM/Kδ) (1/Jv) (11)
Now equation (11) can be substituted in Eq. (8) and after rearrangement it can be written as
6 Author name / BUE ACE1 SVT2016
Ln [(1-Ro)/(Jv/Ro)] = Ln[(DAM/Kδ)] + Jv/k (12)
Equation (12) is the working equation of combined solution-diffusion and film theory models. By using
observed salt rejection Ro, and water flux Jv , data taken at different pressures but at constant feed rate and
constant feed concentration for each set, and plotting Ln[(1-Ro)/(Jv/Ro)] vs. Jv , will yield a straight line with
a slope =1/k and an intercept with y-axis = (DAM/Kδ) .
The main objective of this work was to investigate the effect of the salt properties and the operation
conditions on their transport behaviour through TFC RO membranes and several experiments were done to
accomplish this aim. The experimental results are shown in the following points 1 to 4.
3. Experimental Section:
Materials, Equipment and Methods
3.1. Materials
The study was operated on Sodium Chloride NaCl, Sodium Sulphate anhydrous Na2SO4, Calcium Chloride di
hydrate CaCl2.2H2O, and Magnesium Sulphate hepta hydrate MgSO4.7H2O salts. All salts were of
commercial-grade chemicals obtained from El-Gomhoreya Company for chemicals, Egypt.
3.2. Equipment
In this work, commercial polyamide thin film composite membrane(TFC) model YMSGSP4205 was used for
reverse osmosis desalination (RO) using CF042 cross-flow test cell where the active membrane surface area
was 42 cm2 .Hydra-cell pressure pump was used to supply the operating pressure.
3.3. Methods
In this work, commercial polyamide TFC membrane model YMSGSP4205 pre-cut for CF042 cell was used
for reverse osmosis desalination (RO) using CF042 cross-flow test cell where the active membrane surface
area was 42 cm2. Four different concentrations (1000, 2000,5000,10000 ppm) of each salts were prepared
using distilled water as a solvent and then used as feed solutions. Each concentration was operated at twice
and triple its osmotic pressure and a constant feed flow rate of 2 Litre/min. The experimental scheme is shown
in (Fig. 3).

A.A.S.Gallab/ BUE ACE1 SVT2016 7
Figure 3: Schematic diagram of the three cross-flow units system
3.3.1. A-value determination
The commercial RO membrane was tested for pure water permeability (A) value .the membrane was already
pre-cut for the cross flow test cell unit CF042 where the active surface area of the membrane = 42 cm2 .The
test was run at different pressure values (250,500,1000,1500 kPa ) using distilled water at 25ºc as a feed
solution. The value of A was determined by applying Darcy’s law of diffusion [Gill et al., 1988].
3.3.2. Salt Rejection experiments
Three membranes of 42 cm2 were used to determine the salt rejection for each of the four different salts used
and the average of the readings were taken. Each membrane was placed inside the CF042 cross-flow test cell
Legend:
1 Feed tank 5 Valve
2 Feed pump 6 Cross flow test cell
3 Flow meter 7 Permeate collection
4 Pressure gauge 8 Drain

8 Author name / BUE ACE1 SVT2016
in a three test cells system (Fig. 3), then the whole system was rinsed with distilled water for 1 hour. Cross
flow filtration experiments were done for each of the three membranes under a similar set of experimental
conditions like salt concentration, composition of the salts which were drown from the same feed tank.
The applied cross filtration pressure was set at twice and triple the osmotic pressure of each salt concentration
at 25˚c for all salt rejection experiments. For each experiment the amount of permeate collected initially after
the first half hour was discarded and after that all permeate amounts were collected each 30 minutes. Then the
brine and permeate were returned to the feed container to maintain a continuous stream of a constant feed
concentration. At the end of the RO operation, when the permeate concentration readings reached the steady
state, permeate was collected from each of the three test cells and the conductivities were measured with a
conductance cell. The cross flow filtration system was allowed to run until the filtration operation conditions
were stabilized. In case of changing the type of salt in the feed, the system was washed with distilled water for
an hour by rinsing the whole system with distilled water.
3.3.3. Experiments of changing the applied crossflow filtration pressure
The RO cross flow applied pressure was controlled by the valves after each test cells (Fig. 3). Also the feed
flow rate was kept constant at 2 litters/minute. The applied pressure was increased from twice to triple the
osmotic pressure of each salt concentration in the feed at 25˚c.
3.3.4.Determination of mass transfer coefficient and solute transport parameter
The mass transfer coefficient and solute transport parameter were determined from the resulted salt rejection
and water fluxes obtained from operating each salt concentration of the four salts at twice and triple the
osmotic pressure of the feed concentration. The graphical method, given by the equation (12), was applied to
determine the aimed parameters. It is a straight line equation in form of y=mx+c where the slope =1/k and the
exponential of the intercept equals the solute transport parameter.
4. Results and discussion:
Stimulation of further research and development works on improving the membrane performance and is the
most wanted in the recent years in order to upgrade membrane technologies that provide potable water and to
interfere with lots of vital industries such as food and pharmaceutical industries.
The objective of this work was to investigate the effect of the salt properties and the operation conditions on
their transport behaviour through TFC RO membranes and several experiments were done to accomplish this
aim. The experimental results are shown in the following points 1 to 4.
4.1. Determination of PWP
The pure water permeability (PWP) which is important and indicates the pure water permeation flux of the
membrane was determined by applying Darcy’s law of diffusion [Gill et al.,1988] and plotting the pressure
values vs. flux obtained using pure water as a feed solution(Table.1 and Fig.4), the slope will equal to 5 E-10
m/s.kPa . The values of the permeate fluxes were taken at each 30 min after one hour from starting of the
cross flow filtration process. The experimental results of pure water flux were shown in Table (1) and Figure (
4 ).

A.A.S.Gallab/ BUE ACE1 SVT2016 9
Table (1): Pure water flux at different opperating pressure values.
water flux (X E -07)
Pressure (kPa)
4.96 250
7.72 500
9.92 1000
11.24 1500
Figure ( 4 ): Pure water Permeability.
4.2.Salt Rejection determination.
As revealed from the cross flow RO filtration results the salt rejection of the different salts was in the
following sequence: Na2SO4 (Ro%=97.9) > NaCl (Ro%=97) > MgSO4.7H2O(Ro%=93) > CaCl2.2H2O
(Ro%=92) at 2000ppm an applied pressure equal to triple their osmotic pressure (Fig. 5).

10 Author name / BUE ACE1 SVT2016
0.84
0.88
0.92
0.96
1.00
0 2000 4000 6000 8000 10000
0.92
0.94
0.96
0.98 (b)
S
alt
Reje
cti
on
(%
)
NaCl
Na2SO4
CaCl2
MgSO4
(a)
Conc. (mg/l) Figure (5): Effect of feed concentration on the salt rejection at: (a). Applied pressure =2π and (b). Applied pressure = 3π
These results can be explained on the bases of the diffusivity of cations and the hydrated ions size. Na2SO4
and NaCl gave the best salt rejection results but the difference in their salt rejection was referred to the
counter ion radius. In fact, the Sulphate group is more bulky than the chloride ion and has larger hydrated ion
radius SO4-=0.379 nanometres [Nightingale et al., 1959 and Kyung et al., 2014] compared to the chloride ion
Cl- =0.332 nm [Volkov et al., 1997]. When comparing the salt rejection of Na+, Mg2+ and Ca2+ salts, it was
found that Mg2+ and Ca2+ had higher tendency to diffuse through the membrane despite being with larger
hydrated ion radii . The salt rejection was highest for sodium salt and lowest for the calcium salt because the
Ca2+ had higher salt permeability than sodium and magnesium ions [Geise at al.,2013] thus a lower salt
rejection. Although the magnesium ions had larger hydrated ion radius (Mg2+=0.470 nm) than the calcium
ions does (Ca2+ = 0.420 nm) [Emerson and Chi, 1977], Mg2+ ions had higher diffusivity and were more
rejected. Generally, the salt rejection obtained from our experiments was in the following order: Ro(Na+)> Ro
(Mg2+)> Ro (Ca2+), the hydrated ion radii were in the order of Na+< Ca2+ <Mg2+ but the previous studies
showed hydrated cation tendency to diffuse through the RO membrane in the following order : Na+>Mg2+
>Ca2+ which agree with our salt rejection results.
4.3.Applying the Graphical method.
The Graphical method (Eqn.12) was applied using the results of observed rejection (Ro) and water flux (Jv)
A.A.S.Gallab/ BUE ACE1 SVT2016 11
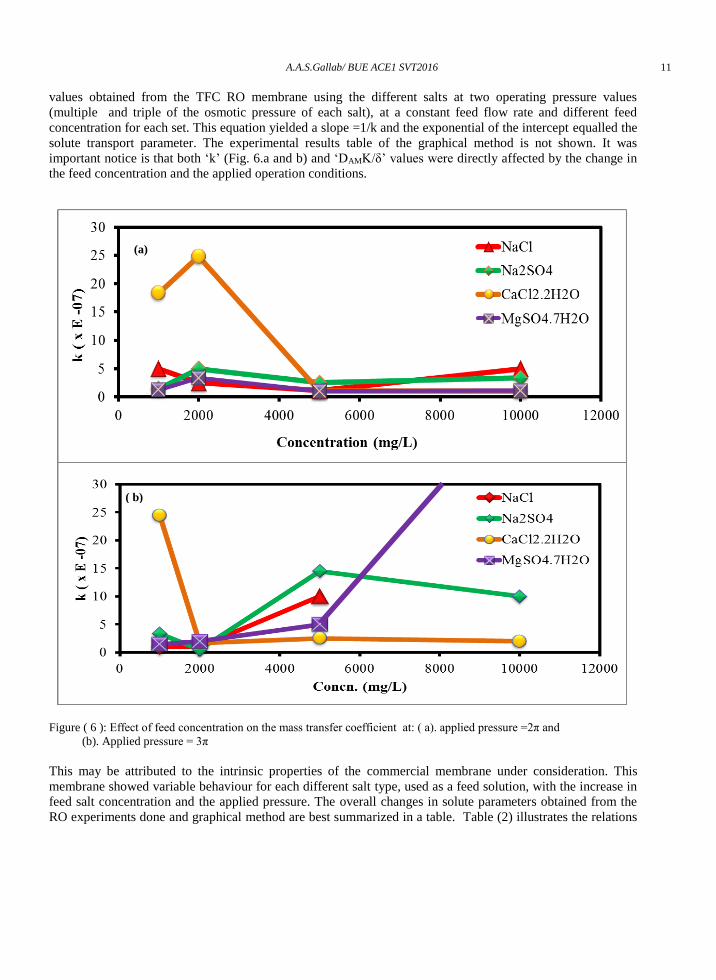
values obtained from the TFC RO membrane using the different salts at two operating pressure values
(multiple and triple of the osmotic pressure of each salt), at a constant feed flow rate and different feed
concentration for each set. This equation yielded a slope =1/k and the exponential of the intercept equalled the
solute transport parameter. The experimental results table of the graphical method is not shown. It was
important notice is that both ‘k’ (Fig. 6.a and b) and ‘DAMK/δ’ values were directly affected by the change in
the feed concentration and the applied operation conditions.
Figure ( 6 ): Effect of feed concentration on the mass transfer coefficient at: ( a). applied pressure =2π and
(b). Applied pressure = 3π
This may be attributed to the intrinsic properties of the commercial membrane under consideration. This
membrane showed variable behaviour for each different salt type, used as a feed solution, with the increase in
feed salt concentration and the applied pressure. The overall changes in solute parameters obtained from the
RO experiments done and graphical method are best summarized in a table. Table (2) illustrates the relations
(a)
)
( b)

12 Author name / BUE ACE1 SVT2016
between the effect of increasing the feed salt concentration of the four different salts used and the applied
pressure and the corresponding change in mass transfer coefficient and solute transport parameter.
Table (2): The effect of increasing the feed salt concentration and the applied pressure on the mass transfer coefficient and solute transport parameter.
The corresponding k value The corresponding Solute Transport Parameter
NaCl Na2SO4 CaCl2. MgSO4 NaCl Na2SO4 CaCl2. MgSO4
Effect of
increasing
the salt
concentration
Increase Increase decrease decrease
Decrease
at P =2π
but
increase
at P=3π
increase decrease
decrease at
P =2π but
increase at
P=3π
Effect of
increasing
the applied
pressure
decrease increase decrease increase decrease increase increase increase
Conclusion:
It is clear that the salt intrinsic properties such as the hydrated ion radius and the diffusivity of ions play a
principle role in the salt transport behaviour through the TFC RO membranes. The parameters k and DAMK/δ
was found to be highly affected by the change in the operation conditions such as the feed solute
concentration and the cross flow applied pressure. They were also different from one salt to another. The
relation between salt properties and the transport behaviour through the polyamide thin film composite
membranes can be defined through applying appropriate pressure enough to reverse the osmosis of the feed
solution and overcome the retarding effect of concentration polarization layer (i.e. applying an RO system) ,
through simple equations that describe the salt rejection, water flux and osmotic pressure . Theoretically Mg2+
and Ca2+ ions are thought to be rejected more than Na+ ions but this is wrong thought because the comparison
in salt rejection must take into consideration that the ions are hydrated ions with radii differ from the non-
hydrated ions and the tendency of cations to diffuse through the membrane despite of its size and charge.
Acknowledgements:
It is a pleasure to acknowledge the financial support provided by the Science and Technological Department
Fund (STDF) in Egypt through grant 5240 (Egyptian Desalination Research Centre of Excellence). This work
forms also part of a thesis presented by A.A.S. Gallab to fulfil the requirements of a Master's degree.
References:
Hem, J. D., 1985.Study and Interpretation of the Chemical Characteristics of Natural Water. Third edition. U.S
Geological Survey Water-Supply paper 2254.

A.A.S.Gallab/ BUE ACE1 SVT2016 13
Zaidi ,S.M.J., Fadhillah F., Khan, Z., Ismail ,A.F,2015. Salt and water transport in reverse osmosis thin film composite
seawater desalination membranes. Desalination368, p.202-213.
Ding M., Szymczyk A., Ghoufi A.,2015. On the structure and rejection of ions by a polyamide membrane in pressure-
driven molecular dynamics simulations. Desalination 368, p76-80.
Sundaramoorthy, S., Srinivasan, G., Murthy, D.V.R., 2011 .An analytical model for spiral wound reverse osmosis
membrane modules: Part I — Model development and parameter estimation. Desalination 280, p. 403–411.
Murthy, Z. V. P. ,Gupta, S. K., 1996 .Simple Graphical Method to Estimate Membrane Transport Parameters and Mass
Transfer Coefficient in a Membrane Cell, Separation Science and Technology 31:1, p.77-94
Murthy, Z.V.P. , Gupta, S.K., 1997. Estimation of mass transfer coefficient using a combined nonlinear membrane
transport and film theory model, Desalination 109, p.39-49
Wenwen Z., Song, L., Guan, T. K., 2006. A numerical study on concentration polarization and system performance of
spiral wound RO membrane modules. Journal of Membrane Science 271, p. 38–46
Al-Bastaki, N.M., Abbas, A., 2000. Predicting the performance of RO membranes, Desalination 132, p. 181–187.
Taniguchi, M., Kurihara, M., Kimura, S., 2001. Behavior of a reverse osmosis plant adopting a brine conversion two-
stage process and its computer simulation, J. Membr. Sci. 183, p.249–257.
Song, L.F., Hong, S.K., Hu, J.Y., Ong, S.L., Ng, W.J., 2002. Simulations of full-scale reverse osmosis membrane
process, J. Environ. Eng.-ASCE128 (10), p. 960–966.
Sutzkover, I., Hasson ,D., Semiat ,R., 2000. Simple technique for measuring the concentration polarization level in a
reverse osmosis system, Desalination 131, p. 117-127.
Kang, K. C., Linga ,P., Park ,K., Choi ,S.-J., Lee, J. D., 2014.Seawater desalination by gas hydrate process and removal
characteristics of dissolved ions (Na+, K+, Mg2+, Ca2+, B3+, Cl−, SO4 2−), Desalination 353 , p. 84–90.
Volkov ,A.G., Paula ,S., Deamer, D.W., 1997.Two mechanisms of permeation of small neutral molecules and hydrates
ions across phospholipid bilayers, Bioelectrochem. Bioenerg. 42 , p.153–160.
Nightingale, E.R., 1959. Phenomenological theory of ion salvation-effective radii of hydrated ions, J. Phys. Chem. 63 ,
p.1381–1387.
Khawajia ,A.D., Kutubkhanaha ,I.K., Wie, J.M., 2008. Advances in seawater desalination technologies, Desalination 221 ,
p. 47–69.
Geise, G. M., Paul, D. R., Freeman,B. D., 2014. Fundamental water and salt transport properties of polymeric materials,
Progress in Polymer Science , 39, p. 1–42.
Emerson,W.W., Chi, C.L., 1977. Exchangeable calcium, Magnesium and sodium and the dispersion of illites in water: II.
Dispersion of illites in water, Aust. J. Soil Res. 15, p. 255–262.
Gill ,W. N., Matsumoto M. R., GILL A. L.,. LEE ,Y.-T, 1988. Flow Patterns in Radial Flow Hollow Fibre Reverse
Osmosis Systems, Desalination, 68, p. 11-28.
Srinivasan ,G., Sundaramoorthy, S., Murthy, D.V.R., 2011.Validation of an analytical model for spiral wound reverse

14 Author name / BUE ACE1 SVT2016
osmosis membrane module using experimental data on the removal of dimethylphenol, Desalination 281 , p. 199–208.
Lin S. W., Sicairos S. P., Navarro M. F., 2007. Preparation, Characterization and Salt Rejection of Negatively Charged
Polyamide Nanofiltration Membranes, Journal of the Mexican Chemical Society,51, p. 129-135.
Appendix
A. Notations:
A Pure Water Permeability constant (m/s/kPa)
c intercept of the straight line
C molar density of solution ( mole/l)
Cij molar concentration ( mole/l)
Dij diffusivity of component i in phase j (m2/s)
і vant hoff factor
Jv solvent volumetric flux (m3/m2.s)
k mass transfer coefficient (m/s)
l concentration polarization thickness (m)
m slope of the straight line
Mv molecular weight of solvent (g/mol)
Ni molar flux of component i
P applied pressure (Pa)
PWP pure water permeability
R universal gas constant (m3 .Pa. K−1 mol−1)
R true salt rejection
Ro observed salt rejection
S surface area of the membrane (m2)
T absolute temperature (k)
x coordinate direction perpendicular to the membrane (m)
x x-axis
Δx membrane thickness (m)
y y-axis
B. Greek letters
δ boundary layer thickness (m)
π osmotic pressure (Pa)
C. Subscripts
A solute
B solvent
M membrane
1 feed solution
2 boundary layer solution
3 permeate solution