influence of total quality management implementation on
TRANSCRIPT
INFLUENCE OF TOTAL QUALITY MANAGEMENT
IMPLEMENTATION ON PERFORMANCE OF INSTITUTIONS
OF HIGHER LEARNING: THE CASE OF INSTITUTE OF
ADVANCED TECHNOLOGY IN KENYA
BY
JACQUELINE SALIMA W. MTONGOLO
A Research Project Report Submitted in Partial Fulfillment of the Requirements for the
Award of the Degree of Master of Arts in Project Planning and Management of the
University of Nairobi.
2015

ii
DECLARATION
This Research Project Report is my original work and has not been presented for an award in any
other University.
Signature : _________________ Date : _________________
Jacqueline Salima W. Mtongolo
L50/72642/08
This Research Project Report has been submitted for examination with my approval as the
University Supervisor.
Signature : ______________ Date: ________________________
Dr. Omondi Bowa
Senior Lecturer, Department of Educational Studies
University of Nairobi
iii
DEDICATION This Research Project Report is dedicated to my Mum Mariam Mtongolo and my sisters Agnes,
Jane, Daines and Caroline. Thank you for your unconditional love and support. Special thanks to
Edwin Atitwa and Elijah Muhindi for their support during the period I was working on this
project report.
iv
ACKNOWLEDGEMENT
I would like to thank and acknowledge my supervisor Dr. Omondi Bowa, for his
professional/academic guidance and support, without which this academic project would have
not succeeded. I sincerely appreciate his effort and words of encouragement during this research.
I acknowledge the academic staff at the University of Nairobi, School of Continuing and
Distance Education, Department of Extra Mural Studies who necessitated my thinking,
knowledge acquisition and prepared me for this task during the M.A. course work. I wish to
thank my fellow students in the Masters class for their continued cooperation and encouragement
which in a great way has contributed towards the attainment of my academic goal. They played
such an important role along the journey as we mutually engaged and tried to make sense of the
various challenges we faced.
Thank you to my family, friends and colleagues for their support and patience while I pursued
this program and understood when I had to miss deadlines or cancel appointments in order to
adhere to set deadlines.
In a very special way, I acknowledge Edwin Atitwa and Elijah Muhindi who have been
instrumental in ensuring the success of this journey. Lastly I would like to thank all the staff of
the Institute of Advanced Technology who participated in my research by taking time off their
busy schedules to provide me with all the information that I needed in the course of my research.

v
TABLE OF CONTENT DECLARATION ...................................................................................................................... ii
DEDICATION ......................................................................................................................... iii
ACKNOWLEDGEMENT ....................................................................................................... iv
TABLE OF CONTENT ............................................................................................................ v
LIST OF TABLES .................................................................................................................... x
LIST OF FIGURES ................................................................................................................. xi
ACRONYMS / ABBREVIATIONS .................................................................................... 1
ABSTRACT ............................................................................................................................... 2
CHAPTER ONE: INTRODUCTION ..................................................................................... 3
1.1 Background of the Study ...................................................................................................... 3
1.2 Statement of the Problem ................................................................................................. 5
1.3 Purpose of the Study ............................................................................................................. 7
1.4 Objectives of the Study ......................................................................................................... 7
1.5 Research Questions ............................................................................................................... 7
1.6 Significance of the study .................................................................................................. 7
1.7 Delimitation of the study .................................................................................................. 8
1.8 Limitations of the study.................................................................................................... 8
1.9 Assumption of the Study .................................................................................................. 9
1.10 Definition of Significant terms ......................................................................................... 9
1.11 Organization of the Study .............................................................................................. 10
CHAPTER TWO: LITERATURE REVIEW .................... .................................................. 12
2.1 Introduction .................................................................................................................... 12
2.2 Leadership and Performance of Institutions of Higher Learning ................................... 12
2.3 Customer Satisfaction and Performance of Institutions of Higher Learning ................. 16
2.4 Employee Involvement and Performance of Institutions of Higher Learning ............... 23
2.5 Student Involvement and Performance of Institutions of Higher Learning ................... 28
2.6 Theoretical Literature Review ........................................................................................ 29
2.6.1 Deming Theory .............................................................................................................. 32
2.4 A Conceptual Framework Analysis Model .................................................................... 40
CHAPTER THREE: RESEARCH METHODOLOGY ............... ...................................... 42

vi
3.1 Introduction ......................................................................................................................... 42
3.2 Research Design ............................................................................................................. 42
3.4 Sample Size and Sampling Procedure ............................................................................ 43
3.5 Data Collection Instruments ........................................................................................... 43
3.5.1 Pilot Test ........................................................................................................................ 44
3.6 Validity of Research Instruments ................................................................................... 44
3.7 Reliability of Research Instruments ............................................................................... 44
3.8 Data Analysis Techniques .............................................................................................. 45
3.9 Ethical Considerations.................................................................................................... 45
3.10 Operational Definition of Variables ............................................................................... 46
CHAPTER FOUR: DATA ANALYSIS, PRESENTATION, INTEPRE TATION AND
DISCUSSION .......................................................................................................................... 48
4.1 Introduction ......................................................................................................................... 48
4.2 Questionnaire Response Rate ............................................................................................. 48
Table 4.1 Respondents ............................................................................................................. 48
4.3 Leadership and Work Performance at IAT .................................................................... 50
4.4 Customer Satisfaction and performance at IAT ................................................................. 57
4.5 Employee involvement in institutional planning and performance at IAT .................... 61
4.6 Student involvement and performance at IAT .................................................................... 64
4.7 Discussion of Findings ................................................................................................... 68
4.7.1 Influence of leadership on performance of institution of higher learning. ...................... 69
4.7.2 Influence of customer satisfaction on performance of institutions of higher learning. ... 69
4.7.3 Influence of students involvement on performance of institution of higher learning. .... 70
4.7.4 Influence of employees involvement on performance of institution of higher learning . 70
CHAPTER FIVE: SUMMARY OF FINDINGS, CONCLUSIONS AND
RECOMMENDATIONS........................................................................................................ 71
5.1 Introduction ......................................................................................................................... 71
5.2 Summary of Findings .......................................................................................................... 71
5.3 Conclusion .......................................................................................................................... 72
5.4 Recommendations ............................................................................................................... 73
5.5 Suggested Areas for Further Research ................................................................................ 73

vii
REFERENCES ........................................................................................................................74
APPENDICES ......................................................................................................................... 83
Appendix I: Letter of Transmittal ............................................................................................. 83
Appendix II. Questionnaire for Employees ............................................................................. 84
Appendix III. Questionnaire for Management ......................................................................... 90
Appendix IV. Questionnaire for Students ................................................................................ 96

x
LIST OF TABLES Table 3.1: Target Population......................................................................................................... 42
Table 3.2: Sample design table ..................................................................................................... 43
Table 3.3 Operational definition of variables ............................................................................... 46 Table 4.1 :Distribution of respondents by position ....................................................................... 48 Table 4.2 Departments where the Managers and Employees belonged ....................................... 49
Table 4. 3 Gender of the respondents ........................................................................................... 49 Table 4.4 Age groups .................................................................................................................... 50
Table 4.5 Vision, Mission and Values of the institute .................................................................. 50 Table 4.6 Descriptive Statistics of the time duration the students have been at the institute ....... 51
Table 4.7 Courses taken by students at the Institute ..................................................................... 51 Table 4.8 Institute ensures that the Vision, Mission and Values are shared ................................. 52 Table 4.9 Organization leadership or management style .............................................................. 52 Table 4.10 Suggestions on how difficult issues should be handled .............................................. 53 Table 4.11 Managers views on the organization’s strategic plan ................................................. 54 Table 4.12 Employees involvement in the formulation of strategic plan ..................................... 54 Table 4.13 Descriptive statistics of Total Quality Management ................................................... 55 Table 4.14 One-Sample Test of Total Quality Management ........................................................ 56 Table 4.15 Correlations ................................................................................................................. 56
Table 4.16 Planning Process ........................................................................................................ 57
Table 4.17 Table of Strategies of maintaining a loyal customer base .......................................... 58 Table 4.18 Determine customer satisfaction ................................................................................. 58 Table 4.19 Customer satisfaction and Retention Challenge ......................................................... 59 Table 4.20 Overcoming Customer satisfaction and Retention Challenge .................................... 59
Table 4.21 Descriptive Statistics on Rate of importance attached to customer ............................ 60
Table 4.22 One-Sample Test of Total Quality Management ........................................................ 60 Table 4.23 Frequency of the Staff training ................................................................................... 61 Table 4.24 Resource allocation for marketing plan ...................................................................... 61 Table 4.25 Major Decision makers ............................................................................................... 62 Table 4.26 Frequency.................................................................................................................... 62
Table 4.27 Descriptive statistics of Total Quality Management ................................................... 63 Table 4.28 One-Sample Test of Total Quality Management ........................................................ 63 Table 4.29 Correlations ................................................................................................................. 64
Table 4.30 Concerns on representation by students’ representatives ........................................... 64 Table 4.31 How Representative were elected ............................................................................... 65 Table 4.32 Mechanisms put in place to promote or ensure succession planning ......................... 65
Table 4.33 Response to queries from students/clients from the front office staff ........................ 66
Table 4.34 Involvement in IAT marketing activities by the students ........................................... 66 Table 4.35 Descriptive Statistics................................................................................................... 67
Table 4.36 Checks to ensure quality ............................................................................................. 67
Table 4.37: Correlations table of extent of respondents relation with Total Quality Management....................................................................................................................................................... 68
xi
LIST OF FIGURES Fig 1: Conceptual Framework ...................................................................................................... 40
1
ACRONYMS / ABBREVIATIONS IAT - Institute of Advanced Technology
QM - Quality Management
TQM - Total Quality Management
UNESCO – United Nations Education Scientific and Cultural Organization
ISB - IAT School of Business
EBCL - European Business Competence License
ICDL - International Computer Driving License
NCC - National Computing Centre
TFU - Teaching for Understanding
CBD - Central Business District
MBO - Management by Objectives

2
ABSTRACT Total Quality Management (TQM) is a comprehensive and structured approach to organizational management that seeks to improve the quality of products and services through ongoing refinements in response to continuous feedback. Although TQM originated in the manufacturing sector, its principles can be applied to almost every type of organization. This study aimed at assessing the influence of Total Quality Management Implementation on performance of Institutions of Higher Learning, a case of the Institute of Advanced Technology. More specifically it aimed at examining how leadership, customer satisfaction, employee involvement and student involvement influence performance at the Institute of Advanced Technology. The study adopted a descriptive survey design. The target population of the study was 1350 which comprised students and staff of four IAT branches. A sample size of 270 respondents was used which is 20% of the target population, this is higher than 10% of accessible population as recommended by Mugenda and Mugenda (1999). Stratified random sampling method was used to achieve the desired representation from the various sub-groups. Pilot testing of the data collection instrument was performed by administering the questionnaires to 10% of the sample size. To establish the validity of the research instrument content validity was used; to check reliability of the instrument, Cronbach’s alpha methodology based on internal consistency of the research instrument was used. An alpha value of 0.849 was obtained, thus the research instrument used was confirmed to be reliable. After data collection, the questionnaires were cleaned, coded, organized and analyzed. Descriptive statistics and Correlation, using Karl Pearson’s Product Moment Coefficient were used to analyse the data and establish the relationship between the dependent variables and the set of independent variables using SPSS software. The study found out that the rate of importance attached to customers by employees and managers had a mean of 9.00 which is close to very important from the Likert scale and had a very small standard deviation of 0.202 which indicates that employees and managers place a high value on customers during their service delivery. The rate on employee involvement in the implementation of TQM has a mean of 7.89 and a small standard deviation of 1.453 from the Likert scale which indicates that majority of the respondents were in agreement that they get involved in TQM implementation to a greater extent. Student involvement in the implementation of TQM at the Institute has a mean of 7.44 which is full implementation on the Likert scale and has a small standard deviation of 1.29 which indicates that majority of the respondents indicated that students are active team players in the implementation of TQM at the institute of Advanced Technology. Organizations need to therefore ensure that their staff and relevant stakeholders know the mission, vision and values of those organizations since this has a bearing on the quality and performance. The study concluded that there needs to be an integrated system that ensures communication between the management, lecturers, other employees and the general student fraternity to help in reducing disputes and improving performance. Future studies could evaluate the influence of TQM implementation in corporate institutions like the banks, insurance companies and other service sector organizations.

3
CHAPTER ONE: INTRODUCTION
1.1 Background of the Study This study was concerned with establishing the influence of TQM implementation on
performance of IAT. The study was carried out at four branches of IAT in Nairobi. This chapter
gives background information of the Institute of Advanced Technology (IAT), when it was
started and how it has experienced tremendous growth over the years. It also gives a brief
description of the challenges it has been facing in regards to competition and insights of steps
that can be taken to ensure they stay ahead of the competition.
Quality authorities have put forth several approaches to improve company performance. These
approaches are embodied in a set of quality management practices, known as Total Quality
Management (TQM). On account of these policies, different approaches have been adopted for
the introduction of quality management in institutions of higher learning. These approaches
include; self-assessment, external assessment of the institutions, accreditation and certification
systems. Quality Management (QM) presents a strategic option and an integrated management
philosophy for organizations, which allows them to reach their objectives effectively and
efficiently, and to achieve sustainable competitive advantage (Goldberg and Cole, 2002).
Several studies on influence of quality on performance of institutions of higher learning have
been carried out. Maingi (2012) found out that there is a positive relationship between quality
assurance and academic performance and there is a significant positive relationship between
quality assurance and customer satisfaction. The study concluded that there needs to be an
integrated system that ensures communication between the management, lecturers, other
employees and the general student fraternity to help in reducing disputes and improving
performance.
A similar study on quality in higher education was done by Odhiambo (2011) and he observed
that higher education in Kenya must be ready to reform and to adapt to modern demands for
quality. It was concluded that quality assurance could play a key role in initiating these reforms
to revitalise the weak higher education system. Investments by the universities and government

4
in the quality improvement of higher education through quality assurance structures could be a
prerequisite for the production of highly competent experts, which would, in turn, contribute to
the competitive economy.
The environment under which universities are operating in Kenya has undergone remarkable
changes during the last decade. The universities have been increasingly subjected to a variety of
demographic, social, economic and technological changes, which obviously require a new
direction of leadership; employee involvement in institutional matters to ensure motivation and
retention; customer satisfaction to ensure competitive success; student involvement to gain their
confidence. Despite the changed circumstances for the universities, they have continued to
increase enrolments. Immediately after independence in 1963, university education in Kenya
began with just 571 students enrolled in Nairobi University College (Weidman, 1995). From the
1980s, enrolment in public universities increased greatly from 2500 in 1982–83 to 20,837 in the
1990–91 academic year and over 40,000 in 1996 up to about 56,000 currently.
This figure does not reflect the total number especially those enrolled under the ‘parallel degree
programmes’. Between 1985 and 2002 alone, the number of higher education students in Kenya
increased by 27% (Materu, 2007). In the East and Central African region, Kenya’s higher
education system is expanding and currently has the highest number of institutions and students.
Unfortunately, this rapid growth has not been matched by increased funding.
University education has always been an important priority in the public agenda. A recent
Carnegie Corporation study of African universities (Carnegie Corporation, 2010) reported that
universities and other institutions of higher education were experiencing resurgence after years
of neglect in favour of primary and secondary education. Based on the challenges discussed, it is
clear that with this resurgence there is need for universities to become more daring with
institutional transformations if they have to survive. Higher education is a repository and
defender of culture, an agent of change in this culture, an engine for national economic growth
and an instrument for the realisation of collective aspirations (Johnstone, 1998). There are
lessons that Kenya can learn from the advanced countries where universities are increasingly
playing a key role in generating knowledge, innovation and human capital required to increase
5
international competitiveness in a knowledge-based economy (Mora et al., 2010) and where the
emphasis is not only on equity but also quality.
This study extended previous research on influence of TQM on performance of institutions of
higher learning. A study of the Institute of Advanced Technology and TQM implementation has
been looked at in depth. The Institute of Advanced Technology (IAT) is one of the leading ICT
and Business learning organizations in Kenya and the East African Region. Established in 1991,
IAT has grown from an initial single centre of 3-classrooms to a national training institution with
9 Campuses in Nairobi, Mombasa and Nakuru including a "state of the art" IAT School of
Business (ISB) in the heart of Nairobi CBD. IAT has an infrastructure of more than 80
classrooms, 1000 computers and over 200 Lecturers and Instructors.
IAT remains committed to high levels of excellence in the provision of quality ICT and Business
training programmes. IAT partners with both local and international partners in offering various
products. In particular, IAT has partnered with Maseno University, St. Pauls University, Oracle
University, NCC Education (UK), ICDL, the European Business Competence License (EBCL),
Microsoft and Pearson Edexcel. Through these partnerships, IAT offers world class
professional/career training education and training in Kenya at Certificate, Diploma and Degree
levels.
IAT Campus has gone a notch higher on its teaching methodology. Its methodology Teaching for
Understanding (TFU) makes learning more interactive, enriching and fun. It's an educational
pedagogy developed by the Harvard Graduate School of Education. It was developed to address
the rising concern of the apparent inability of many students to apply school knowledge and
skills to real-life problems in workplace settings. The methodology ensures that what students
have learnt is not left in the examination room but rather has become part of their life
experiences and can be applied in different environments flexibly.
1.2 Statement of the Problem Traditionally, the quality of education has been essentially an internal affair of the education
system, a responsibility of the educational authorities at governmental and institutional levels.
Today, however, the quality of education is no longer the exclusive preserve of educational
6
authorities and professionals. Ministries other than the Ministry of Education are taking an
interest. The same is true for NGOs, businesses, and the general public—all putting different
pressures on education. The ramifications of this extend far beyond the walls of individual
ministries or educational institutions. To explain why this is occurring and why the quality of
education has become a more “high profile” issue, it is necessary to take several key factors into
account (UNESCO, 2003).
IAT has grown from an initial single centre of 3-classrooms to a national training institution with
9 Campuses in Nairobi, Mombasa and Nakuru including a "state of the art" IAT School of
Business (ISB) in the heart of Nairobi CBD. Though IAT has experienced such growth, it has not
come without challenges. IAT for a long time enjoyed a monopoly in training of ICT courses
like International Computer Driving Licence (ICDL), among others. This has changed in the
recent past with many other education institutions offering the same courses. In order for IAT to
survive and grow there is need to document the most critical quality management practices used
in its education services; while determining the challenges facing the Institute in the
implementation of the continuous improvement principle of quality management.
Higher education has experienced rapid growth in the last two decades and this has led to
commercial competition imposed by economic forces being experienced in this sub-sector. More
and more institutions of higher learning are being set up and it is only those that provide quality
education that are going to survive. This therefore necessitates a study to be conducted to in
order to examine factors that are crucial in ensuring not only survival but growth in these
institutions. Though a number of studies have been done on the concept and context of quality
management and higher education respectively, the researcher has not come across any that has
been done in the context of institutions of higher learning, as a case of the Institute of Advanced
Technology. To fill these gaps, this study seeks to establish the extent of the influence of total
quality management principles on performance of institutions of higher learning, with a focus on
IAT and its branches.
7
1.3 Purpose of the Study The purpose of this study was to assess the influence of leadership, customer satisfaction,
employee involvement and student involvement on the overall performance of the Institute of
Advanced Technology.
1.4 Objectives of the Study
The research objectives that guided the study were:
i. To assess the extent to which leadership influences performance at IAT.
ii. To establish the extent to which customer satisfaction influences performance at IAT.
iii. To determine how employee involvement in institutional planning influences
performance at IAT.
iv. To examine the extent to which student involvement influences performance at IAT.
1.5 Research Questions
The study was guided by the following research questions:
i. How does leadership influence performance at IAT?
ii. To what extent does customer satisfaction influence performance at IAT?
iii. In which way does employee involvement influence performance at IAT?
iv. To what extent does student involvement influence performance at IAT?
1.6 Significance of the study
This study is important because leadership, employee involvement, customer satisfaction and
student involvement are critical factors in ensuring IAT stays ahead of the competition. In the
early 90’s, IAT was the sole provider of internationally recognized IT courses like International
Computer Driving License (ICDL), among others. In the past 10 years there has been a paradigm
shift and IAT has faced cut throat competition due to the numerous middle level colleges that
have sprouted in the various cities in the country. This has led to dwindling numbers in student
registration and therefore necessitated IAT to look for ways of ensuring they stay ahead of the
competition.

8
1.7 Delimitation of the study
This study was delimited to the geographical boundaries of Nairobi County where the four IAT
branches under study are located. The other 4 branches in Nairobi and one in Nakuru were not
covered by the study. The period of study was year 2013- 2014. The study was also delimited to
the variables under study: leadership, customer satisfaction, employee involvement and student
involvement.
1.8 Limitations of the study
Major research has been done on Total Quality Management Implementation. However most of
it is in relation to the manufacturing industry worldwide. Very little has been done and
documented within the service industry more so in institutions of higher learning in Africa.
However in most developed countries universities are in the process of reinvention and are
increasing their partnerships with business and have strong executive control. Their findings,
results and recommendations are well documented, published and available in some accessible
sights like the emerald. This helped the researcher overcome the hurdle of getting relevant
literature to proceed with research.
The second limitation was that the respondents would be concerned with the extent to which the
organization might want them to volunteer information without any repercussions or fear of
victimization. This was curtailed by providing a letter of introduction from the University of Nairobi
and providing the necessary assurances to the key respondents.
The third limitation was in regards to the fact that this was additional responsibility to the
respondents who already had their overwhelming day to day duties. Ample time was given to the
respondents with a polite reminder once in a while to ensure a good return rate of the
questionnaires.
9
1.9 Assumption of the Study
The researcher assumed that the respondents were available and willing to fill in the questionnaires.
The researcher also assumed that the questionnaires would be filled truthfully and returned on time.
The researcher had also assumed that funds required for the research would be available on time. The
researcher further assumed that access to relevant research data throughout the study would be
granted on time.
1.10 Definition of Significant terms
Customer – generally the students are considered as end customers. Johnstone (1995) defines a
customer as ‘one to whom we provide information or service’.
Customer Satisfaction – Lovelock (1983) defines customer expectations as the “desires or
wants of customers”. Following this logic, customer expectations, when exceeded, should lead to
customer satisfaction – and ultimately, the customer’s end evaluation of the service quality level
provided should also be positive. Based on this scenario, the realization or non-realization of
customer expectations would appear to be the primary determinant of customer levels of
satisfaction (Oliver, 1993).
Employee involvement – employee involvement is defined as the extent to which employees
have a sense of control over their work. Employee involvement is signaled by job competence
and job autonomy, and is closely associated with perceptions of service quality and job
satisfaction (Greenberg et al, 1997).
Institutions of higher learning – are those institutions offering post-secondary education and
training and include:
(1) Certificate and Diploma granting institutions, and
(2) Degree granting institutions (middle level institutions and universities)
Leadership - the writings of Novak (2002) suggest that, leadership in the context of higher
education may be defined as a personal and professional ethical relationship between those in
leadership positions and their subordinate staff, needed in order to appreciate and call forth their
full potential. From a strategic quality management perspective, it is the responsibility of quality
managers in leadership positions to “do right things” and to “do things right”, i.e. to be both
effective and efficient in what they do, (Bennis and Nannus, 1985)
10
Performance - Performance may be defined in several different ways. One definition is what a
product performs for a consumer, such as the reliable performance of an automobile (Deighton,
1992). Another definition is one in which the consumer participates in the performance and must
play an active role, such as order a meal in a restaurant or attend a workshop, in order to achieve
a consumption experience. The performance in higher education is described by the latter
characterization, as it requires the active participation of the student to achieve a consumption
experience, that is, an education.
Stakeholders – These are groups or individuals with whom the organization interacts or has
interdependency, plus any individual or group who can affect or is affected by the actions of the
company (Lawler, 1994).
Total Quality Management – According to Moseley (2009), Total Quality Management can be
defined as the engagement of all workplace stakeholders to define, build, measure and assess
quality by controlling products, services and people, through planning assurance, control, and
continuous improvement feedback activities.
Quality - the word quality is derived from the Latin word ‘qualis’, which means ‘what kind of’.
It connotes a variety of meanings and implies different things to different people. According to
Juran, “Quality is fitness for use or purpose”. Crosby considers it as “conformance to standards”.
Deming defines quality as “a predictable degree of uniformity and dependability at low cost and
suited to market”. In general quality is one, which satisfies customer needs and continuously
keeps on performing its functions as desired by customers as per specified standards.
Quality Gurus – a guru is an expert in something. Quality gurus are experts in quality and they
advance theories, for example TQM theory
1.11 Organization of the Study
The research project report is organized into five chapters. Chapter one which is the introduction
includes, the background of the study, statement of the problem, purpose of the study, objectives
of the study, research questions, significance of the study, basic assumptions of the study,
limitations of the study, delimitations of the study and definitions of significant terms.
11
Chapter two contains the literature review and focused on 4 key areas as described in the
objectives of the study.
Chapter three focused on the methodology to be employed. This includes the following sub-
areas; research design, population, sample procedures and sample size, instruments, validity and
reliability, procedure for data collection and data analysis.
Chapter four focused on results and the discussions of the findings of the research. Data collected
from the respondents has been analyzed using descriptive statistics such as mean and standard
deviation. Correlation has also been used to study the relationship of aspects of TQM on
performance.
Chapter five focused on summary of the findings of the research, conclusions relating to the
research objectives, suggestions or recommendations on the factors influencing the
implementation of total quality management in institutions of higher learning, and areas that
need further research.

12
CHAPTER TWO: LITERATURE REVIEW
2.1 Introduction
This section reviews studies of factors that have shown direct linkage with total quality
management in both the commercial sector and institutions of higher learning. The review looks
at past research studies and gives an overview of the previous contributions to the problem to
enable a better understanding of the research problem.
2.2 Leadership and Performance of Institutions of Higher Learning
Visionary Leadership encompasses the role of top management in defining a vision, mission,
strategic objectives, and shared values for the organization’s growth and development. In quality
management context, the visionary leaders need to emphasize the importance of transformation
through open communication to achieve a shared approach to the change. Quality Gurus stressed
that leadership is vital for effective implementation of total quality management initiatives.
Taffinder (1995) noted that top management is responsible for quality leadership and providing
support to achieve superior performance. He further highlighted the importance of leadership in
the process of ascending to world-class status, and emphasized the need for leadership to
establish a high-performance culture, high-performance delivery processes and services in
support of this objective. Based on extensive studies, researchers have concluded that leadership
and top management commitment is the most critical and crucial prerequisite for institutional
success when implementing TQM (Dale, 1999).
The news media have been rife with stories of ethical failures by organizations, business and
non-business alike. A prominent example was the Enron scandal which came to light in late 2001
as the company applied for bankruptcy (Carroll, et al 2006). Another serious indictment fell on
Arthur Andersen, an accounting firm which went bankrupt after it was accused of fraud and
complicity in the Enron debacle. Eventually many other scandals were exposed to the public
since 2002. They involved many such big names like WorldCom, Global Crossing, Tyco and
Adelphia. Since that time, other corporate names have appeared in the news either for allegedly
violating the public trust or for raising questions about ethics. During the 1980s, American
industry was compelled to undergo a painful process of transformation in response to shrinking

13
sales and market shares (Marchese, 1996). Seeking answers for these problems, business firms
have come to realize that something must be done about their formal basic values and policy.
Over the years, they have built and accrued structures that were big, sluggish, control-based and
bureaucratic. This structural phenomenon was not limited to the corporate world alone. Health
care, government, and education also faced similar problems. These complex unwieldy structures
produced an environment vulnerable to the occurrence of unethical events.
Sheer necessity forced many of those businesses to reinvent themselves to become leaner and
more agile organizations. Many jumped on the quality management bandwagon which was an
outgrowth of Deming’s work in Japan after World War II (Blankstein, 1996). The goal was to
reinvent the American business firm, revolutionize the American industry and achieve, if not
surpass, Japan’s economic achievements. Regrettably, while some successes have been
documented, many quality management projects have been deemed embarrassing failures (Koch,
2003). Some say that the implementation failure rate is high, even as high as 70 percent. The
literature is replete with books and articles that cite many reasons for these failures. However,
the most frequently cited reason for the failure of any quality initiative is the lack of viable
commitment from management (Maguad, 2002). Oftentimes management is reluctant to change
their paradigms or old habits. Managers fail to realize that quality improvement starts with them,
that they must lead by example if they have to cause others to behave differently. They also fail
to understand that quality management requires a change in the roles, responsibilities, and
behaviors of every participant in the organization starting with the leadership.
Unless substantial behavioral change is noticed, quality management will be seen merely as a
rhetorical program instead of being an action-oriented program. But how is this substantial
behavioral change accomplished? If management must lead by example, then they must lead in a
way that cultivates a high level of trust and respect from their subordinates. The top leadership of
an organization must model ethical and moral conduct. To sustain the quality initiative in the
organization, top management must demonstrate commitment by displaying consistently high
ethical standards and by cultivating a high level of trust and respect from members, based not
just on stated values but on their willingness to make personal sacrifices for the sake of
upholding these values (Lussier et al, 2001).

14
Moral leadership is determined by what comes from within a person: what a person is and not
adherence to a set of behavioral standard. People can be trained to apply policy and behavior.
This is only half the equation. The moral leader is more than a person who is conditioned to
follow rules or policies. Moral leadership is what one is as opposed to what one does. What one
is flows directly from the values he or she possesses. Values are things or principles preferred.
The values of an individual, group, or society are standards of desirability and evaluation
independent of specific situations. They are what humans want and feel to be the reason for
existence. Values regulate the political process and the managerial process and lie at the heart of
resource allocations. They are the lenses and filters through which the world is viewed. Codes of
ethics created by individuals or organizations come from values. Religions, cultural and social
norms, philosophies and legal systems are the sources of values.
Philip B. Crosby, one of America’s quality management pioneers, said, “Quality boils down to
one word – integrity” (Maguad, 2012). With the Enron debacle and other highly-publicized
scandals in the recent past, integrity in doing business is becoming a precious commodity.
Integrity boils down to honesty – honesty in dealing with customers, employees, suppliers, and
other stakeholders. The quality sciences have transformed the world of business over the past
sixty years. Continuous improvement is now firmly imbedded in corporate strategy.
The writings of Novak (2002) suggest that, leadership in the context of higher education may be
defined as a personal and professional ethical relationship between those in leadership positions
and their subordinate staff, needed in order to appreciate and call forth their full potential. From a
strategic quality management perspective, it is the responsibility of quality managers in
leadership positions to “do right things” and to “do things right”, i.e. to be both effective and
efficient in what they do (Bennis et al., 1985). Byrd (1940) suggests that leadership skills can be
learned, developed and perfected in order to make leaders more effective at influencing staff
behaviour and achievement of team goals. Likert (1961) suggests that leadership resides in a
“task or production” function and a “maintenance or people” function, and not in personality
traits. These two major functions of leadership are consistent with McGregor (1987) Theory X
and Theory Y respectively, and draw attention to the effect of leadership styles on staff
performance in a changing work situation (Likert, 1961). Reference to the works of Likert

15
(1961), suggests that there is a need for greater understanding of staff needs and expectations in a
changing work situation. This need coupled with societal pressure for power sharing, has led to
increased adoption of team leadership style or a participative democratic style of leadership, and
created resistance against purely authoritarian or solo leadership style.
In his model of distributed leadership for managing change in higher educational institutions,
Gregory (1996) suggests four dimensions of institutional leadership; symbolic, political,
managerial and academic. A true leader embodies the whole institution by winning commitment
of others to organizational goals, obtaining resources and presenting corporate image to the
external world. Secondly leadership will be political for the institution, gaining support and using
and resolving conflicts to achieve its means. His managerial skills pertains to controlling,
representing, staffing, structuring, setting goals and communicating, apart from handling
budgets, costs, information flow, employee relations, external funding and relations with
validating and awarding bodies. Finally his academic role includes being a leading professional,
leading others in a collegiate style, recognizing and encouraging quality, fostering and
developing talent, intervening, coaching, being a role model of exemplary behavior, taking risks
and acting as an agent of change (Marsh, 1992). Michael et al. (1997) recommended that top
leadership is the key to any TQM programme and the driving force behind success and failure.
The TQM programme must be sold and not forced on the employees. Leadership must make the
programme attractive and necessary to employees. Good communication, proper training and
using benchmarking and research on TQM philosophies and programmes can enhance the
success rate.
Increasing organizational competitiveness and the need for the most effective use of human
resources have led writers and researchers including Burns (1978) and Nicholls (1988), to study
“Transformational Leadership”. They argued that this style of leadership is both desirable and
necessary in competitive environments, and requires organizations to be capable of fast, radical
change and those aspiring to be the best must be able to lead change rather than just follow it.
Top management’s leadership is one of the essential elements of TQM. In every country where
TQM has been implemented, there are examples of company executives who have initiated the
cultural change and carried their organizations through the quality journey.

16
In summary, even though there are many alternative forms of management and leadership
practices, a human relation, people-oriented leadership style is more likely to lead to staff
satisfaction, group cohesiveness, and improved performance results.
2.3 Customer Satisfaction and Performance of Institutions of Higher Learning
According to David Garvin, most definitions of quality were transcendent, product-based, user-
based, and manufacturing-based or value based (Garvin, 1984). The transcendent view states that
quality is something that is intuitively understood but nearly impossible to communicate. You
just know it when you see it (Evans et al, 1999). The product-based view argues that quality is
found in the components and attributes of a product. It implies that the higher the amounts of its
characteristics, the higher its quality. The user-based says that if the customer is satisfied, the
product has good quality. It is based on the presumption that quality is determined by what a
customer wants. This leads to a definition of quality which is fitness for intended use or how well
the product performs its intended function. According to the manufacturing-based view, if the
product conforms to design specifications, it has good quality. Quality then is defined as the
desirable outcome of engineering and manufacturing practice, or conformance to specifications.
Lastly, according to the value-based perspective, if the product is perceived as providing good
value for the price, it has good quality.
Towards the end of the 1980s, many companies have come to embrace a more customer-driven
definition of quality (Evans et al, 1999). Quality has come to be defined as meeting or exceeding
customer expectations. In order to comprehend this definition, one must first understand the
meaning of the term ‘customer’. Most people think that the customers are the ultimate purchasers
of the product or service and are more specifically referred to as consumers. But before a product
reaches the consumer, it may first flow through a chain of many firms or departments, each of
which adds some value to the product. This type of customers may be referred to as external
customers. It is also important to point out that every employee in a company also has internal
customers who receive goods or services from suppliers within the company. Thus,
understanding who one’s customers are, and what their expectations are, is key to achieving
customer satisfaction.

17
In higher education, the notion of having customers is foreign to many campuses. Even the
suggestion of the term can arouse many emotions, preconceptions, and misconceptions (Canic et
al, 2000). Faculty and administrators alike are reluctant to call a student or anyone else a
customer. They find the commercial flavor distracting and difficult to translate to education. In
campuses that do admit they have customers, there is usually a general agreement that the term
applies to businesses, government agencies, and the society at large. That is not generally the
case with students. Many faculty members feel threatened by the notion that students are
customers of the educational process. The idea that students (customers) are partners in
developing and delivering quality education (the product or service) threatens the historic,
traditional academic role of faculty as purveyor of knowledge. All too often this perspective is
reinforced by administrative actions that tend to put the benefits of the institution before the
needs of the student body.
Many educational institutions are very hesitant to consider themselves as customer-driven
entities (Lewis et al, 1994). Yet one fact has been proven over and over again. Customer-driven
organizations are effective because they are fully committed to satisfying, even anticipating
customer needs. The future success of colleges and universities will increasingly be determined
by how they satisfy their various customers. The successful ones will be those which very clearly
identify their mission and the customers they serve.
The centrality of the customer is grounded in history and tradition. Aristotle, in his Rhetoric,
stated that it is the hearer that determines the speech’s end and object (Corts, 1992). The success
of the speaker therefore depends on the audience, the recipients of the message. The Wordsmyth
Educational Dictionary defines the term customer as follows: (a) “one who buys goods or
services; shopper, patron”; or, (b) “one who must be dealt with.” In a normal commercial sense,
definition (a) is probably sufficient. It involves the concept of exchange whereby two parties are
willing to trade something for their mutual benefit. The (b) definition is broader and more
informal and is suitable for academia. W. Edwards Deming, one of the founders of the modern
quality movement, stated that the customer is one who gets your work (Deming, 1992). Juran
suggests that we follow the product to see whom it impacts. Anyone who is impacted is a

18
customer (Juran, 1998). These definitions are generally applicable to all kinds of organizations,
profit or non-profit, which serve internal and external customers. “Every one of us is a customer.
Every one of us serves customers” (Corts, 1992).
A survey conducted by Management Associate of Europe in conjunction with the American
Association and Japanese Management Association (AMA-Brussels, 1988) reported that nearly
eighty percent of respondents in a survey of over 3300 business executives in Europe, North
America, and Japan believe that improving customer quality service is the key to competitive
success in the global market. While individual determinants of service quality may vary from
industry to industry, in a general sense, service quality is nothing more and nothing less than the
extent to which a service deliverer exceeds or falls short of the customer’s expectations.
Following this logic, customer expectations, when exceeded, should lead to customer satisfaction
– and ultimately, the customer’s end evaluation of the service quality level provided should also
be positive. Based on this scenario, the realization or non-realization of customer expectations
would appear to be the primary determinant of customer levels of satisfaction (Oliver, 1993). In
terms of which determinants are most important in creating this realization, however, Johnston
(1995) provides an interesting dilemma by suggesting that the presence (or absence) of any
specific determinant, even when based upon a relatively high importance weighting, should not
necessarily be construed to imply the creation of satisfaction/dissatisfaction. Hence, one of the
difficulties inherent in assigning importance weightings to any given factor is that researchers
may not get a clear picture of their relative impact on the creation of customer satisfaction.
Performance often plays an important role in discussions of consumer satisfaction/dissatisfaction
because it is the feature of a good or service that creates the consumption experience. While
consumers purchase goods and services they actually consume the performance offered by their
purchases. Performance may be defined in several different ways. One definition is that a
product performs for a consumer, such as the reliable performance of an automobile (Deighton,
1992). Another definition is one in which the consumer participates in the performance and must
play an active role, such as order a meal in a restaurant or attend a workshop, in order to achieve
a consumption experience. The performance in higher education is described by the latter
characterization, as it requires the active participation of the student to achieve a consumption
experience, that is, an education. Performance may be measured simply as “college education

19
contribution’’ (Graham and Cockriel, 1989), or in as much detail as well-structured courses,
involvement with the faculty, individualized instruction, living and learning program,
extracurricular involvement, and social experiences (Baird, 1992).
When we look at customers of higher education, Lewis and Smith observed that every college
and university has a mission but very few fully identify who they serve (Lewis et al, 1994). They
also noted that even fewer institutions acknowledge that they serve customers. This was
surprising given the fact that in order to be effective organizations must be customer-driven.
Customer-oriented organizations are successful because they have a unified focus on what they
do and who they serve.
The term customer can be defined as the recipient or beneficiary of the outputs of work efforts or
the purchaser of products and services. It can be a person, a unit, a department, or an entire
organization. Customers have wants, opinions, perceptions, and desires which are often referred
to as the voice of the customer. The voice of the customer can also be defined in technical terms
as the “standardized, disciplined, and cyclic approach to obtaining and prioritizing customer
preferences for use in designing products and services (Foster, 2007).
Developing a customer focus in higher education is vital. An organization needs to clearly
identify its current and potential customers because failure to identify them correctly results in
wasted efforts and even failure in the entire quality initiative (Sirvanci, 1996). It is highly
desirable that different groups within higher education come to a common consensus as to who
their true customers are. In order for the total quality philosophy to have a lasting impact on
change and quality improvement in higher education, it is important that educational institutions
have the right customer focus model.
We need to remember that while students can be considered customers of higher education, they
differ from your typical business customers in a number of ways. For example, colleges and
universities often admit students selectively based on certain academic standards and
requirements. Businesses usually do not do that. In fact, they do not ordinarily prevent

20
prospective customers from purchasing their products and services. Another difference is that
once students are admitted they are continually tested and graded to determine how well they
have learned their lessons. They must maintain their good academic standing in order to be able
to take more advanced courses and complete their programs of study. Businesses do not do that
to their customers (Noe, 1986).
Identifying the customers of higher education is important in order to know how to proceed in
establishing a feedback mechanism. Establishing a feedback mechanism is accomplished through
a systematic, factual collection of data from customers so that we truly know whether or not the
job is done right. The data that is collected should be used responsibly, that is, to resolve
problems; otherwise, there is no valid reason for collecting it. The information gathered should
be used solely for purposes of continuous improvement within an environment of trust. This
takes courage since it signals that one is serious about not doing business as usual. ‘The great
enemy of courage is not cowardice, but conformity. The vast majority of people yield to the
pressures of conformity because it is safe. It is unconventional to set your sights high, to climb
out of ruts. That takes courage’ (Noe, 1986).
An institution committed to customer satisfaction and continuous improvement will need to work
with students, faculty and staff, and other customers to understand their current expectations and
also to anticipate their requirements in the future. It is extremely important for the college or
university to establish trust within the entire organization where frank and open discussions are
allowed, where opinions are respected, and where participants are empowered to take corrective
action on poor processes and to express their true feelings about the tasks, processes, and
systems that are out of control and requires urgent attention and solution(Noe, 1986).
Educational institutions that truly believe in the quality of their services make strong
commitments to their customers. They address the principal concerns of customers, eliminate
conditions that might weaken their trust and confidence and communicate clearly and simply to
them. Building good customer relationships depends on the quality of customer-contact
personnel. This begins with the recruitment process and the selection of employees who show
21
the ability and desire to develop good customer relationships. These customer-contact employees
must understand the products and services well enough to answer any question, develop good
listening and problem recovery skills, and feel able to handle problems. Their actions are guided
by a common vision, that is, a clear understanding of what actions they may or should take.
Educational institutions may need to establish service standards and communicate these
standards to all customer-contact personnel. These standards must continually be reinforced.
Colleges and universities should implement a process for tracking adherence to the standards and
provide feedback to employees to improve their performance(Noe, 1986).
But despite all efforts to satisfy customers, every institution experiences unhappy customers.
Customer-contact personnel must be trained to deal with angry customers, to listen carefully to
determine the customer’s feelings and understand the complaint, and to make every effort to
resolve the problem quickly. Information collected from the complaint resolution process should
be used to continually improve service processes.
Customer satisfaction is probably the most important element in managing for quality in higher
education. It is often used synonymously with quality which focuses on meeting and exceeding
customer expectations (Sirvanci, 1996). Bergquist (1995) listed four sets of criteria by which
quality could be defined and assessed to increase customer satisfaction. These criteria are input,
output, value-added and process-oriented criteria
The input criteria focus on the nature and level of resources available to the institution like the
characteristics of incoming students, credentials of faculty, size of library, structure and
availability of physical facilities, and the amount of financial reserves. For many years, the input
criteria have been the most commonly identified measures of quality. Many accrediting agencies
have used input measures to measure quality like the quality of entering students, number of
books in the library, quality of graduate degrees held by faculty, number of square feet of
classroom space, student-faculty ratio, and others. Many people believe that if you put good
things together, something good will come out of it. This concept of education is often associated
with traditional high-status institutions.
22
The output criteria stress the nature and extent of institutional products, characteristics of
graduating students, success of alumni, research and scholarly publications, and public service.
They build on the assumption that institutions of higher education are accountable to society for
what they produce. In recent times, the reputation and quality of educational institutions are
increasingly being determined on the basis of their demonstrated outcomes.
The value-added criteria zeroes in on the differences that an institution has made in the growth of
all of its members: intellectual, moral, social, vocational, physical, and spiritual. Considering
these criteria, an institution would be judged by the extent to which it is effective in developing
the talents of its students, from whatever level they are at when entering.
The process oriented criteria includes the level and manner of participation of all appropriate
constituencies (customers/stakeholders) in the educational, administrative, and governance
processes of the institution, including the defining and assessing of quality. Based on these
criteria, “it is not what we do or what we accomplish that makes for quality; rather it is the way
in which we do what we do, and how we decide what to do, that differentiate a high-quality
education”.
There is no single, all-encompassing definition of quality that meets the needs of all customers in
higher education. Quality therefore should not be considered as a unitary concept but a multiple
one. Green suggested that the best that can be achieved is to define as clearly as possible the
criteria that each stakeholder uses when judging quality, and for these competing views to be
taken into account when assessments of quality are undertaken. (Green,1994).
In discussing the role of service quality in higher education, Shank et al. (1995) note that: Higher
education possesses the characteristics of a service industry. Educational services are intangible,
heterogeneous, inseparable from the person delivering it, variable, perishable, and the customer
(student) participates in the process. Additionally, colleges and universities are increasingly
finding themselves in an environment that is conducive to understanding the role and importance
of service quality; this environment is a fiercely competitive one. Within this context, the
educational literature suggests how imperative it is for educational institutions to actively
monitor the quality of the services they offer and to commit to continuous improvements in order
23
to survive the increasingly fierce competition for highly desirable students and the revenue they
generate. In what has become a highly competitive environment, students have become more
discriminating in their selection and more demanding of the colleges and universities they
choose. It is important then for institutions to understand what incoming students desire (and
increasingly expect) from the institution of their choice. Unfortunately for many institutions,
competition for enrollment of an increasingly diverse, yet academically qualified student body
has increased alongside the rise in awareness of these students about the programs and services
offered at most universities. As a result, the issue of retention of these students has become an
area of critical concern for most colleges and universities.
2.4 Employee Involvement and Performance of Institutions of Higher Learning
Employee involvement is defined as the extent to which employees have a sense of control over
their work. Employee involvement is signaled by job competence and job autonomy and is
closely associated with perceptions of service quality and job satisfaction (Lawler, 1994).
Employee involvement is another theme of TQM which aims to involve all organizational
members in corporate affairs for creative problem solving and continuous improvement (Belbin,
1993). Gregory (1996) believed that universities have usually provided a fairly high degree of
participation in management for their academic staff, although support staff have usually been
far less involved. Gregory (1996) proposed a model for total quality leadership in education in
which the main elements were quality philosophy, quality planning, quality leadership, and
quality improvement. Quality philosophy was defined as knowing the customers’ needs and
outlining the core of educational services. Human relation factors regarding students and staff
were emphasized in the leadership element in which an open, critical, and caring attitude towards
the needs of students was advised. According to Stensaasen (1995), the main task of a leader is
to help people to do a better job. In educational institutions, he believes, the role of teacher
would be better considered as that of a leader than of an instructor.
According to Novak (2002), leadership alone is not sufficient, but it needs to be complemented
by teams involved in the outcomes. “An ancillary benefit of teams is that they create an identity
for individuals and therefore have the opportunity to mould a solid and cohesive culture which
generates and perpetuates the workplace norms and ethics.” Novak (2002) continued to state that

24
team working is not common in higher education, and he proposed not to ignore the traditional
role of individualism, especially in research activities, as it “is often perceived as the key to
personal recognition and advancement within the system”. Although higher education is able to
adopt many of the principles of TQM, it is reasonable to expect some problems when applying
them to a different organizational structure to that of the commercial environment.
According to Hansen (1993), TQM’s emphasis on customer satisfaction may cause some
conflicts with those professionals in education “who have traditionally seen themselves as the
guardians of quality and standard”.
Lawler (1994) believed that the motivation of individuals in education is often based on a desire
to be the best possible scholars rather than on a cost trade-off view and so “analogies in the
quality literature which describe a Rolls-Royce and a Mini as cars of potentially equal quality
dependent on the customer’s perception have little meaning”.
Wilkinson et al. (1992) claim that the ‘hard’ and ‘soft� aspects in TQM programmes are
interdependent elements. Similarly, this is supported by Rees (1995) who identified valid
linkages between them. The hard aspect is referred to as generally quantifiable quality tools and
techniques, such as total quality control, just-in-time production, six-sigma and zero defect
performance measurement, and task-based team working. Meanwhile, the soft or more
qualitative aspect of a TQM programme consists of the use of HRM policies and activities to
generate employee commitment to quality, and the dissemination of management vision and
ideology that may reinforce the maxims of quality working culture, attitudinal change,
continuous improvement, and customer orientation.
As the origin of quality management lies within the operation and production fields,
manufacturing firms may tend to place emphasis on the hard and quantifiable measurement
aspects. In contrast, service-oriented organizations including higher education institutions, which
have a greater degree of employee-customer interactions, should concentrate on the more
qualitative and softer aspects of working culture, customer care and personal interactions.
However, the managerial approach towards various aspects of ‘soft’ issues in quality

25
management must continue to search for more quantifiable measurement of performance
outcomes. On the other hand, while modern management allows greater employee discretion,
autonomy and empowerment as the benefits of a TQM programme, closer monitoring and tighter
management control are still needed to go hand-in-hand.
Miller and Cardy (2000) suggest that HRM need to respond in a creative way to TQM and
reengineering in organizational changes. The research constructs used are staffing, training,
performance appraisal, mentoring, compensation, and social support. Furthermore, Dale and
Cooper (1993) highlight the importance of concern for people issues in TQM. The HR activities
that they relate to quality improvement processes are the role of the senior managers, motivating
middle managers, training and education, team building, employee involvement at work, and
handling people resistance in quality change management.
Employee involvement is a process for empowering employees to participate in managerial
decision-making and improvement activities appropriate to their levels in the organization. Since
McGregor’s Theory Y first brought to managers the idea of a participative management style,
employee involvement has taken many forms, including the job design approaches and special
activities such as quality of work life (QWL) programs. There is at the end of the day only one
thing that differentiates one company from another; its people. Not the product, not service
establishments, not the process, not secret ingredients; ultimately any of these can be duplicated.
The Japanese have always recognized this and it is one of the reasons for their success in world
markets, they place tremendous value on the integration of people with organizational objectives,
equipment and processes.
According to Lawler, “Employee Involvement”, if well implemented, changes the fundamental
relationship between individuals and the organization they work for". "It really builds employees
in as a business partner, so they know more and they do more to make the organizations
successful, particularly in industries where the human component is important; most knowledge
work, high-tech and many kinds of service industries.
26
According to Drucker (1989), employee engagement can increase the understanding of
organizational policies. It involves processes such as lower levels of decision making, adopt the
experience, knowledge and the ideas for the advancement of the organization. Employees shall
be given due recognition for their contributions and their ideas. It is a psychological process to
develop confidence between the members of the organization and encourage them to make
decisions and solve problems with each other.
Hunt (1992) maintained that job involvement could be produced in the outer and inner self.
Internal involvement is influenced by its own commitment. It involves defining the duties of
employees entrusted with any evaluated behaviour shown by the employee. Involvement also
enables management, employees share the resulting performance, and member understanding of
the employees will work goals. It is important because without employee engagement, an
organization cannot function properly. It is able to provide satisfaction, especially on the quality
of working life and increase employee commitment to continuous quality improvement process.
Increased involvement means more responsibility, which in turn requires a greater level of skill.
This must be achieved through training. For example, Baldrige Award winners place a great deal
of emphasis on training and support it with appropriate provision of resources. Motorola
allocates 2.5 % of payroll costs or $120 million annually to training, 40% of which goes to
quality training. Training is an important factor that helps in making efforts toward quality
improvement. Quality training includes educating and training all employees, help employees to
increase knowledge, provide information about the mission, vision, direction and organization
structure to enable them to gain skills in an effort to improve the quality and thus solve the
problem.
All employees must work together to produce a quality product or service that meets customer
requirements. This cooperative effort should be evident throughout the product’s or service’s life
cycle, from initial design to final delivery. The success of the school depends increasingly on the
skills and motivation of its work force. Employee success depends increasingly on the
availability of opportunities to learn and practice new skills. These skills can be developed
through investment in education, training, and other continuing growth opportunities.

27
According to Johnston (1995), an organization that demands quality and staff development,
policy formulation and planning will determine the allocation sampler for the training, and
strategic planning is not only focused on training needs now, but also training in the future.
Strategic planning will result in a strategic training plan, and it can be used to predict the future
training needs based on employee needs and demands of consumers.
Johnston (1995) also pointed out that continuous training is not a specialized activity, but the
way people behave with the knowledge that all employees ultimately have. He also describes
that the quality of work could indirectly increase their involvement in the organization. Thus,
training can be a tool for achieving quality.
According to Sangeeta et al. (2004), barriers to applying TQM in higher education are related to
the highly generic and idealistic mission of the institutions, the lack of agreement on the meaning
or implications of quality, and the academic freedom and tenure which have resulted in an
administration having relatively limited control over key personnel. The difficulty resulting from
the freedom, Sangeeta et al. (2004) stated, is that most academic staff “do not view their work as
contributing directly either to their institution’s output or to the satisfaction of the institution’s
customers, however customers are defined”. Seymour (1992) believes that the problem arising
from this type of autonomy is that organizations operate like a random collection of elements
driving off in different directions with no unifying purpose.
Effective involvement of staff in decision making leads to ownership of the management
decisions and creates conducive environment for the effective teaching and learning. Olayo
(2005), found that low level of participation in decision making among staff in selected
universities in Kenya reduced employee work performance with regard to efficiency and
effectiveness. Thus, ineffective involvement of staff in decision making was interpreted as
impacting negatively on quality of services offered by the lecturers in both private and public
universities.

28
2.5 Student Involvement and Performance of Institutions of Higher Learning
Olayo (2005), found that low level of participation in decision making among staff in selected
universities in Kenya reduced employee work performance with regard to efficiency and
effectiveness. Thus, ineffective involvement of staff in decision making was interpreted as
impacting negatively on quality of services offered by the lecturers in both private and public
universities. Similarly, students’ involvement in decision making is significantly different
between private and public universities. It was interpreted that students’ involvement in decision
making was better in private universities compared to public universities. This explained why
there were riots in public universities compared to private universities.
According to K’Okul (2010), the riots were attributed mainly to misunderstanding between the
students and the university authority and poor management followed by inadequate learning
facilities and ineffective guidance and counselling services. Maina (2011) found that colleges
that keep students informed of the challenges that they face in providing services, candidly
explaining any setbacks and how these are handled gives students an opportunity to experience
management in action. This exposes students to failure and risk management thereby building
career resilience. Providing opportunities for students to manage their own affairs within the
constraints of available resources offers useful experiences for personal development and self
discovery. Opportunities to organize events, participate in student leadership etc, whether
successfully or otherwise, builds resilience, autonomy, confidence and enhances independence
and effectuation behaviour (the pre-disposition to construct outcomes from whatever means that
are available). It was thus interpreted that inadequate involvement of staff and students in
decision making impacted negatively on quality of teaching and learning in public universities
and to some extent in private universities.
According to Standa (2007), quality management involves effective management with relevant
stakeholders in order to gain their confidence. Secondly, it involves the existence of any policies
or procedures for assessing overall student performance. Lack of effective communication with
stakeholders was a hindrance to effective implementation of future plans and projects. This
impacted negatively on provision of quality of services which depend on adoption of
management decisions by the stakeholders.

29
Faculty – student interaction has been shown to have a strong influence on both the intellectual
and the personal outcomes. Studies by Baird (1992), Pike (1991), and Terenzini and Pascarella
(1980) all found that involvement with the faculty made a strong contribution to intellectual
growth outcomes. Endo and Harpel (1982) and Terenzini and Wright (1987) examined both
formal and informal faculty – student interactions. Informal interaction was defined as the
product of a more friendly relationship between faculty and students wherein faculty exhibited a
personal and broad concern for students’ emotional and cognitive growth. While both types of
interaction had positive outcomes, interaction which was characterized as informal had greater
impact. Pascarella (1985) found that just knowing a professor or administrator personally had a
significant influence on a student’s academic self- concept.
2.6 Theoretical Literature Review
In recent years the subject of managing for quality has gained prominence in literature and in a
growing number of manufacturing and service organizations. Quality has become a very
powerful tool in international competition. Organizations as well as societies have come to
realize that the pursuit of quality provides a safeguard against anything that threatens human
health and safety, even the environment. Higher education in many developing countries is no
longer a luxury but an essential for survival.
According to the reports of UNESCO and the World Bank, social and private returns of higher
education are less than those of primary and secondary education. It is estimated that social
return of primary education is 25% while that of higher education is only1%. This has led to the
thinking that the returns of higher education are largely personal/private and therefore, subsidy
on this should be reduced. Education policy-makers in developing countries continue to express
concern about the poor state of higher education. Given the historical development of higher
education institutions in Africa, the universities have been at the centre of higher education
challenges (Rosa 2007).
However, it is important to note that African universities play a more significant role in national
development than they do in other parts of the world, as they are often the only institutions with
30
some capacity to undertake research and to generate the knowledge required for development.
This is supported in the study of Bloom et al. (2006), which demonstrated that higher education
in developing countries can play a key role in accelerating the rate of growth towards a country’s
developmental potential. For many years, most universities globally have been, to a significant
extent, self-organising institutions. They ‘have sought to count rank and ritual as equal to cash
reward’ (Marginson et al, 2000). The universities in many advanced countries are now in a
process of reinvention and according to Margarison et al (2000) are becoming more daring and
more fraught and the institutional transformations more dramatic. Two of the paths being
followed by universities including those in Australia and Europe (Mora et al., 2010) are to
increase their partnerships with business and to have strong executive control. Mora et al. (2010)
recently found that European universities are becoming more active in developing relationships
with business. Driving these changes is a redefined internal economy and at times by commercial
and entrepreneurial spirit. These are the so-called enterprise universities or what others call
‘academic capitalism’, ‘entrepreneurial universities’ or ‘corporate universities’. Enterprise is
about advancing the institution’s prestige and competitiveness as well as about income. There
has been a lot of debate regarding the merits and demerits of these changes and there are serious
deficiencies in these norms and models. In this respect, African universities have not been left
very far behind as they have undergone a major transition in the past decade and have moved
from public to a greater emphasis on more private funding and have reinvented themselves as
business enterprises.
Higher education in Kenya has been facing significant and persistent pressures towards
expansion in recent years and this trend has led to significant economic and academic challenges
for both higher education institutions and the government. Education stakeholders are constantly
questioning the value of the products the higher education institutions in Kenya are presenting to
the market and why foreign universities still remain attractive. The same issues could be
identified in other African states (Rosa 2007)
Changes brought about by the transition to a knowledge economy have created a demand for
higher skill levels in most occupations in Africa. As such, ‘countries wishing to move towards
the knowledge economy are challenged to undertake reforms to raise the quality of education and

31
training through changes in content and pedagogy’ (Materu, 2007). Higher education in Africa is
critical to achieving this because the sector educates people in a range of disciplines and supports
other levels of education. Therefore, the challenge for Africa, and Kenya in particular in an
attempt to create this knowledge economy, is to improve the quality of its higher education.
Quality assurance could play a key role in initiating this.
In many developing countries, university education has moved from élite to mass education
within a very short time and Kenya’s development is not isolated. In Hong Kong, for example,
universities were visualised as centres of excellence catering for the privileged upper class but
there has been a transition from élite to mass higher education within the last five years (Kember,
2010). Higher education has also expanded rapidly in many Asian countries such as South
Korea, Taiwan (Hayhoe, 1995) and China (Mok, 2009). Gross enrolment in Latin America has
risen from 1.6% in the 1960s to 29% in 2002 (Guadilla, 2000). In China, it has climbed from
barely 2% in 1990 to 16% in 2005 and in Vietnam from 190,000 student numbers in 1991 to
nearly 1 million in 2002 (Kapur et al, 2008). University education in Kenya has expanded
dramatically since the mid-1980s. At independence from British colonial rule in 1963, Kenya did
not have a fully fledged university (Oketch, 2009). University College, Nairobi, was a
constituent of the University of East Africa with other campuses at Makerere (Uganda) and Dar-
es-Salaam (Tanzania). As recently as 1984, only one degree-granting university existed in
Kenya.
The environment under which universities are operating in Kenya has undergone remarkable
changes during the last decade. The universities have been increasingly subjected to a variety of
demographic, social, economic and technological changes, which obviously require a new
direction of leadership. Despite the changed circumstances for the universities, they have
continued to increase enrolments. Immediately after independence in 1963, university education
in Kenya began with just 571 students enrolled in Nairobi University College (Weidman, 1995).
From the 1980s, enrolment in public universities increased greatly from 2500 in 1982–83 to
20,837 in the 1990–91 academic years and over 40,000 in 1996 up to about 56,000 currently.
This figure does not reflect the total number especially those enrolled under the so-called
‘parallel degree programmes.’ Between 1985 and 2002 alone, the number of higher education
students in Kenya increased by 27% (Materu,2007). In the East and Central African region,
32
Kenya’s higher education system is expanding and currently has the highest number of
institutions and students. Unfortunately, this rapid growth has not been matched by increased
funding.
2.6.1 Deming Theory
According to Hughey (2000), the challenges that lie ahead for higher education are enormous.
Therefore it is absolutely essential that higher education professionals are adequately prepared to
confront those challenges. One of the key ways in which they can better prepare themselves to
survive the coming social, political and economic turbulence is to study Deming's '14 points' and
understand how they apply to the collegiate environment. These have been discussed below.
Create constancy of purpose: Everyone involved in the delivery of programmes and services to
the campus population must understand and accept the fundamental importance of providing
exceptional customer service at every available opportunity. If acquiring a college education
truly gives significant advantages to the recipient, then those benefits should be obvious and
desirable. Students should attend college because it provides something that will help them
succeed personally, socially, and vocationally. Yet this potential can be fully realized only if
everyone in higher education shares the same vision and is pulling in the same direction. In other
words, everyone involved in the educational process must be in total agreement regarding
institutional mission, allocation of resources, how priorities will be established, and how goals
and objectives will be accomplished.
Adopt a new philosophy: in short, what was acceptable as 'standard procedure' in the not-too-
distant past is now no longer appropriate. When college was seen as the only viable route for
getting ahead, the need to be sensitive and responsive to individual desires, concerns, complaints,
and recommendations was not very acute. At most institutions, the decision-making process was
driven solely by enrolments. If students wanted to acquire the knowledge and skills deemed
essential for success, attending college was really the only option. Students were taken seriously
only when it was convenient and/or unavoidable. But now times have changed. In a very real
sense, colleges and universities are much more dependent on students than students are
dependent on them. Customer satisfaction is no longer an abstract philosophical construct, it is

33
potentially the most important consideration in virtually every decision. The very survival of
higher education depends on its ability to make this fundamental change.
Cease dependence on inspection: stated another way, colleges and universities must become
much more proactive in their approach to the provision of programmes and services. Higher
education professionals have a well-deserved reputation for being primarily reactive in how they
respond to issues that affect the on-campus population. Instead of taking the lead when
problematic situations arise, they have often had to be coerced into some form of corrective
action. When something 'bad' has happened, the typical response by many collegiate leaders has
been to try to minimize the potential damage. In the business world, by contrast, the current
emphasis is on taking steps to prevent 'bad' things from happening in the first place. Instead of
simply responding to changing realities, higher education professionals must assume a more
dynamic role in determining what those realities will be at some future point and then developing
programmes and services designed to meet the challenges they represent.
Minimize total cost: while money is certainly a key ingredient for the development and
maintenance of a quality educational system, it is naive to assume that quality is directly
proportional to the number of dollars spent. A tell-tale characteristic of the reactionary mode of
thinking involves the 'band-aid' approach to dealing with problems and other difficult situations.
In an attempt to deal with the perceived short-term consequences of a given situation, institutions
typically spend three times the time, money, and effort needed to solve the problem - ie to take
the steps necessary to resolve the problem completely and thus prevent it from occurring again.
Higher education professionals need to concentrate more on the long-term future of their
programmes as opposed to expending inordinate amounts of time and resources dealing with
relatively trivial matters.
Improve constantly and forever: in today's market, it is never advisable to reach the conclusion
that a particular institution is 'good enough'. Continuous improvement must be a top priority on
all fronts,from the blackboard to the balance sheet. The only way to remain responsive to the
needs of a diverse and dynamic student population is to strive constantly to provide better
services without comparable increases in cost. Higher education professionals must stay in touch
with the students they serve. They must monitor student needs continually and offer programmes

34
and services that meet those needs both now and in the future. The over-riding goal of continual
improvement must dominate every discussion and permeate every agenda. Nothing should be
undertaken in the academic arena that does not add value to the overall enterprise.
Institute training: Training is the key to the successful implementation of TQM within the
academic environment. Training faculty and staff can be a very complicated, involved and even
frustrating process. But if done correctly, it can also be one of the most rewarding dimensions of
work in higher education. Sound training forms the basis for a successful college or university.
Whereas many institutions do an exceptional job when it comes to the provision of training
experiences, others simply do not devote the time and effort needed to ensure that the concepts
are given the attention they deserve. Far too often, training consists of (a) dispensing technical
information, and (b) reacting to situations as they develop. To be truly effective, training must
transcend these somewhat narrow parameters to include the decision-making and problem-
solving skills necessary to facilitate customer satisfaction.
Institute supervision: Once faculty and staff have received training in the basics of TQM, it is
imperative that upper-tier administrators constantly reinforce their commitment to enhanced
quality through every aspect of their management style. Most experts agree that, in the future,
organizational hierarchies will be much more horizontal than is currently the case at many
colleges and universities. In short, there will be far fewer levels between upper administration
and students. One logical result of this collapsing of the structure will be the empowerment of
those at the lowest levels, i.e. those closest to the students. Such an arrangement necessarily
mandates a management strategy foreign to many higher education professionals. Supervising
empowered employees is substantially different from dictating what is to be done centrally.
Supervision of personnel within the context of TQM is quite distinct from supervision of task
facilitation within a more traditional context.
Drive out fear: No one can focus on doing the best job possible if he or she lives in constant fear
of the consequences of perceived failure (such as being reprimanded or fired). Many higher
education professionals, in the guise of enhancing accountability, have instituted a
comprehensive and endless array of evaluations: self evaluations, student evaluations, peer
evaluations, supervisor evaluations, etc. This is further evidenced by the recent interest in

35
implementing post-tenure reviews at many institutions. The intended outcome of these
assessments may indeed be to foster and maintain higher standards of commitment and quality.
Yet the message that is often received by faculty and staff is one of implicit mistrust and
intimidation. Good supervisors must learn to rely minimally on formalized evaluation schemes
as a means of motivating staff and thus ensuring that departmental goals and objectives are
appropriately met.
Break down barriers between departments: TQM requires a system-wide effort on the part of all
departments. Higher education professionals who are obsessively preoccupied with who reports
to whom, following the appropriate channels, and other issues related to turf protection, often do
considerable harm to the institution by keeping the focus from where it should be - on the
delivery of quality programmes and services. Being as responsive as possible to the needs of
students should be the only real concern. Ideas for improvement should always be welcome,
where they originate from should be relatively inconsequential. Getting the job done efficiently
in a humanistic manner, regardless of how the departmental lines appear on an organizational
chart, is all that really matters.
Eliminate unrealistic targets: Although it sounds good to proclaim that '100% student satisfaction
is our goal', in reality this is impossible to achieve. For instance, holding faculty responsible for
the fact that not all of their students feel they are doing an acceptable job is unfair and
unrealistic. Recognition should be given for effort, not just results. If higher education
professionals establish goals and objectives that are inherently unattainable, they are not, as they
might think, motivating their staff members to be 'all they can be'. Moreover, establishing
recruitment or development goals that are unrealistic serves only to dampen morale and thus
needlessly impede performance. In the long run, this leads to high frustration and accelerates
bum-out.
Eliminate numerical quotas: An academic programme can be highly successful even though it
enrols only relatively few students. The mere facts that the programme is available, and that a
great deal of effort has gone into its design and construction, account for a lot more than is often
realized. Similarly, if recognition is given only to those who are successful in recruiting high
numbers of students (or processing high numbers of forms), then an adversarial atmosphere in

36
the workplace is often created. Holding individuals with different abilities to the same
performance standards is inherently counter-productive. Faculty and staff should be rewarded for
performing at their own individual level of proficiency.
Abolish management by objectives: On the surface, management by objectives (MBOs) seems
like a good approach. MBOs can be helpful in establishing priorities and clarifying the various
job functions that must be performed. But in the era of TQM and its emphasis on continual
improvement, MBOs are self-defeating in that they severely limit creativity by inhibiting
employees from proceeding beyond the relatively narrow parameters they prescribe. Higher
education professionals must be extremely flexible in order to respond effectively to each
student's individual needs. MBOs, by their very nature, limit this flexibility and tend to
precipitate meaningless, repetitious conformity.
Institute a vigorous programme of re-education: Achieving the goals and objectives of TQM will
require extensive re-orientation of the culture in higher education. Many of Deming's ideas are
rather easy to comprehend yet moderately difficult to put into practice. Changing the way people
think can be an extremely daunting task, as the proponents of multiculturalism are currently
finding out. TQM requires an unwavering dedication to the central concept of complete and
consistent customer satisfaction which can only be achieved through empowerment of all
organizational members. Such commitment implicitly denotes a fundamental shift in the way
many higher education professionals view their role as proponents of student learning and
development.
The transformation is everybody's job: Instituting the Deming philosophy is not just the
responsibility of the upper administration at a college or university, nor is it the primary concern
of any one group within the organization. It must be seen as everyone's responsibility. A chief
tenet of TQM involves getting the decision-making authority as close to the customer (the
student), as possible. This means that everyone at the institution must have a clear understanding
of the overall goals and objectives of TQM, as well as how those goals and objectives translate
into concrete action. In order to make this connection, it is imperative that everyone works
toward the same end. TQM requires the full support of everyone within the organization; it will

37
be a disappointing failure if it is only the dream of one or two people who have read a little about
it and decided to 'give TQM a try'.
Just like their counterparts in business and industry, higher education professionals stand to
benefit substantially from the adoption of Deming's ideas. TQM is almost universally recognized
as one of the most significant managerial innovations of the last 50 years. Yet it remains a hazy
concept to most collegiate faculty and staff. Higher education advocates would no doubt be hard
pressed to disagree with the assertion that achieving and maintaining the highest quality
standards possible is of paramount importance. The problem is that without more specific
direction and elaboration, such statements are essentially meaningless. They add to the confusion
rather than help alleviate it.
Attempts to implement the quality management philosophy in the educational setting have met
some resistance especially from academic areas. Many of those involved in higher education
believe that quality is already being practiced. However, there are a number of factors in the
educational scene which challenge this assumption. First, quality as it is traditionally defined in
higher education is being challenged by many outside academia. Many colleges and universities
still hold the historic view that they are the preservers, transmitters, and generators of
knowledge. This view, however, conflicts with what the general public expects of their graduates
with regards to the job-related value of higher education. Seymour commented that in the United
States, “the disconnect is real between what our colleges and universities produce in terms of
learning and outcomes in their graduates and what industry requires (Seymour 1992). “We are
buying instruction and service and higher education is selling research (Lewis et al, 1994). This
is the same situation that exists in Kenyan institutions of higher learning.
Second, changing economic conditions have caused concern among the general public about
career opportunities and economic well-being. John Akers, former chairman of IBM once stated,
“Education isn’t just a social concern, it’s a major economic issue. If our students can’t compete
today, how will our companies tomorrow?” (Schargel,1993). There is real public concern about
access to higher education as a means toward employment and economic security. In the past

38
decades tuition and other costs associated with higher education have increased substantially
except in those countries where education is heavily subsidized by the government.
Third, students, parents, legislators, employers, and other stakeholders are bringing a customer
orientation to their assessment of higher education. They “expect of higher education what they
demand elsewhere: better service, lower costs, higher quality, and a mix of products that satisfy
their own sense of what a good education ought to be”. (Zemsky et al,1993). The customer
orientation has helped to facilitate the outcomes assessment movement in higher education.
Fourth, perception of quality in higher education has diminished. Many groups inside and
outside of academia believe that this loss of confidence is partly due to the tendency of colleges
and universities to protect their own disciplines and culture without sufficient regard to the
requirements and expectations of their stakeholders. Chaffee and Sherr described this
environment as follows: (Chaffee et al, 1993): Every [U.S.] college and university is for quality.
Every accreditation self-study documents quality. Every set of admission requirements promotes
it. Every faculty member grades for it. Every promotion and tenure committee screens for it.
Everyone is for quality. Yet the last decade has brought unprecedented public demand for higher
quality in colleges and universities. External agencies and the public have lost confidence: We
might be “for” quality, but in many eyes we do not “do” quality.
Lastly, higher educational institutions are beginning to realize that they are operating in an era
characterized by increasing complexity, novelty, uncertainty, and advances in technology never
previously imagined and experienced. These forces have helped to increase the gap between the
quality desired by people and the quality of products and services being delivered. Technology
enabled stakeholders to compare the quality of other educational systems with their own,
subsequently causing the “quality desired” curve to rise at an accelerating pace.
TQM has been adopted as a management paradigm by many organizations worldwide. Quality
movement across the world started with quality improvement projects at manufacturing
companies. But later it spread to other service institutions including banking, insurance, and non-
39
profit organizations, healthcare, government and educational institutions. Awards like Deming in
Japan, Malcolm Baldridge in USA, European Quality awards, etc are a reflection of the growing
concern in this area.
Although higher education is able to adopt many of the principles of QM, it is reasonable to
expect some problems when applying them to a different organizational structure to that of the
commercial environment. The concern is that there will be a direct relationship between the
conception of higher education being taken, the definition of quality being used and the
performance indicators chosen to measure quality (Tam, 2001).

40
2.4 A Conceptual Framework Analysis Model
In this study, the independent variables were leadership, customer satisfaction, employee
involvement and student involvement. The moderating variable is student performance which
incorporates faculty- student interaction, social integration, and value of course in the job market.
The extraneous variable is gender which could be affected by health of employees and student
absenteeism. This may or may not affect the relationship between the dependant and independent
variables. The dependant variable is Performance of Institutions of Higher Learning, as depicted
in the Fig. 1
Figure 1 is a conceptual framework analysis model providing the relationship of variables as
would be used in the study
Independent Variables Moderating Variables Dependant Variable
Extraneous Variable S
Fig 1: Conceptual Framework
Leadership: • Knowledge of vision,
mission, values • Involvement of all
stakeholders in decision making
Customer Satisfaction • Satisfaction • Retention
Employee Involvement • Succession Planning • Qualifications
Student Performance
Performance • Preference by
learners for enrollment
• Timely completion of courses
• Quality graduates
• Preference of graduates by employers
• Satisfied employees
Student Involvement • Involvement in decision
making
Gender

41
2.5 Gaps In Literature Review Higher education has experienced rapid growth in the last two decades and this has led to
commercial competition imposed by economic forces being experienced in this sub-sector. More
and more institutions of higher learning are being set up and it is only those that provide quality
education that are going to survive. This therefore necessitates a study to be conducted to in
order to examine factors that are crucial in ensuring not only survival but growth in these
institutions.
Though a number of studies have been done on the concept and context of quality management
and higher education respectively, the researcher has not come across any that has been done in
the context of institutions of higher learning, as a case of the Institute of Advanced Technology.
To fill these gaps, this study seeks to establish the extent of the influence of total quality
management principles on performance of institutions of higher learning, with a focus on IAT
and its branches.
2.6 Summary of Literature Review
This chapter reviewed various studies and journals relevant to the area of the study. It also
outlined the background information, theoretical framework, analyzed research findings for
justification of this study and outlined the conceptual framework. It discussed what efforts have
been made to improve Leadership, Customer Satisfaction, Employee involvement and Student
Involvement so as ensure Total Quality Management in institutions of higher learning. From the
numerous studies and journals reviewed in this chapter, much effort has been made to improve
Leadership, Customer Satisfaction, Student Involvement and Employee involvement in decision
making to achieve total quality management in the institution of higher learning. Many
institutions of higher learning including Institute of Advanced Technology have come up with
various strategies like acquiring ISO 9000 certification and accreditation. The major variables
such as customer satisfaction, leadership, student involvement and employee involvement have
been identified as key to achieve Total Quality Management.

42
CHAPTER THREE: RESEARCH METHODOLOGY
3.1 Introduction This chapter details the approach that was used by the researcher for data collection and analysis;
research design, target population, sampling procedure, operational definition of variables, data
collection methods, data collection instruments, reliability of collection instruments and data
analysis techniques.
3.2 Research Design A descriptive design was modeled to collect respondent views through a cross-sectional survey.
The Survey was designed to collect detailed information relating to the representative groups.
Kothari (2003) recommends descriptive design as it allows the researcher to describe, record,
analyze and report conditions that exist or existed. This survey design was considered to be
particularly well suited to researchers who study the individual as a unit of analysis as an
excellent vehicle in measuring for generalization. The purpose of this study justified the use of
the survey.
3.3 Target Population
In this research, the respondents were the senior management, lecturers, front office staff and
students of IAT. The study included a sample obtained from these students and staff in the
various branches. The study targeted a population of 1350.
Table 3.1: Target Population
Branch Student
population
Staff
population
Total
Population
Percentage
(%)
Kasarani 200 40 240 18
School of Business 150 30 180 13
Loita 500 60 560 42
Westlands 350 20 370 27
Total 1200 150 1350 100
Source: (IAT Records, 2014)

43
3.4 Sample Size and Sampling Procedure Sampling is the process of obtaining information about the entire population by examining only
part of it (Kothari 2003). Sampling is the preferred method of selecting the representative sample
for the research. The reason for the preference was that, due to time and resource constraint only
a sample will be deemed to be adequate enough to represent the entire population of IAT. The
study targeted a population of 1350 and a sample size of 270 respondents which is considered
representative since it is higher than 10% of accessible population (Mugenda and Mugenda
1999). The sample size will include 30 staff members and 240 students as indicated in table 3.2
Stratified sampling will be employed to determine the individuals to be questioned. This method
was appropriate since the sample was selected from different branches and the staff being
surveyed was in different cadres. The researcher obtained a list of all employees in the different
cadres and gave them numbers, the numbers were placed in a container and the researcher picked
numbers at random. The students were grouped according to their classes and the number of
students in each class identified. The classes were then picked randomly and students in these
classes were the respondents.
Table 3.2: Sample design table
Branch Student
population
Sample
size
Percentage
(%)
Staff
population
Sample
size
Percentage
(%)
Kasarani 200 40 17 40 8 27
School of Business 150 30 12 30 6 20
Loita 500 100 42 60 12 40
Westlands 350 70 29 20 4 13
Total 1200 240 100 150 30 100
Source: (IAT Records, 2014) 3.5 Data Collection Instruments
Questionnaires were used to collect data from respondents. They were administered through drop
and pick method to the units of analysis who were the senior management, lecturers, front office
staff and students of IAT. The questionnaires were self- administered requiring respondents to
provide relevant answers to the questions to avoid bias. This method collected primary data.

44
Individual consent was sought before administration of the survey instruments to avoid coercing
respondents into giving information not worth revealing in terms of security or personal reasons.
The researcher assured anonymity and confidentiality to all respondents. For purposes of mutual
trust, a letter of introduction to carry out the research was attached to the questionnaire indicating
the researcher’s intention.
3.5.1 Pilot Test
Pilot-testing is an important step in the research process because it reveals vague questions and
unclear instructions (Nachmias et al, 1996). The data collection assistants administered 10
questionnaires and the interview guides to the staff in Kasarani Campus a couple of days before
the study initiation. It is important to note that the data collected was used for testing the data
collection tool and not for the purpose of the study. The data collected was analyzed and
interpreted. After completion of the pilot testing all the data collection tools were reviewed and
suitable corrections and adjustments made to ensure the tool was fit for collection of objective
data.
3.6 Validity of Research Instruments Validity is the degree by which the sample of test items represents the content the test is designed to
measure. Content validity a measure of the degree to which data collected using a particular
instrument represents a specific domain or content of a particular concept was employed by this
study. The researcher sought expert opinion from the lecturers in the department of project planning
and management on the representation and suitability of questions and suggestions for corrections on
the structure of the research tools was given. This helped to improve the content validity of the data
collected. It also facilitated the necessary revision and modification of the research instrument
thereby enhancing validity.
3.7 Reliability of Research Instruments Cronbach’s alpha test was used to check the reliability of the instrument; it is based on internal
consistency of the research instruments. Cronbach’s Alpha was established for all the themes in
the questionnaire, which formed a scale in order to test the reliability of the questionnaires.
Test-retest reliability assesses the degree to which test scores are consistent from one test
administration to the next.

45
R E L I A B I L I T Y A N A L Y S I S - S C A L E (A L P H A)
Reliability Coefficients
N of Cases = 270 N of Items = 4
Alpha = .849
This illustrates that the scales measuring the objectives met the reliability criteria as the alpha
value for each scale exceeded the prescribed threshold, (α>0.7) with the average reliability for all
the constructs being (α= 0.849). This shows that the research instrument (questionnaire) was
sufficiently reliable and needed no amendment.
3.8 Data Analysis Techniques
The Statistical Package SPSS version 20 was used in the analysis. After data collection, the data was
organized and edited to remove any inconsistencies, repetitions or errors that made analysis difficult.
The cleaned data collected was analysed using both quantitative and qualitative methods. Frequency
tables were used to present the data collected for ease of understanding and analysis. Karl Pearson’s
Product Moment correlation was conducted to determine the relationship between the independent
variables: Leadership, Customer Satisfaction, Employee Involvement and Student Involvement
against the dependent variable of Organization performance. Qualitative data are based on meaning
expressed through words. It involves the collection of non-standardized data that require
classification and are analysed through use of conceptualization. Content analysis was used to
analyse the qualitative data and the findings have been presented in prose form.
3.9 Ethical Considerations
Throughout the study there was adherence to the rules of collecting and analyzing data.
Confidentiality of the information was upheld at all stages of the study. The research is based on
factual truth. The principal of “least harm” and anonymity was given the highest priority. The
principle of informed consent was applied. Permission was sought from relevant authorities and a
letter obtained to allow the researcher to carry out the research. Furthermore, the researcher
explained the purpose of the study to the respondents and assured them of confidentiality of their
responses and identities.

46
3.10 Operational Definition of Variables
According to Mugenda and Mugenda (1999), operational definition refers to the measurement of a
variable. It is the description of the operation that will be used in measuring the variable. Table 3.3
summarizes operational definition of variables in this study.
Table 3.3 Operational definition of variables
Research Objective
Variable Type
Indicator Measurement Scale
Data Collection Methods
Tools of Analysis
Data Analysis
To assess the extent to which leadership affects the implementation of TQM at IAT
Independent: Leadership. Dependent: Performance of IAT
Knowledge of vision, mission, values Involvement of all stakeholders in decision making
Ordinal Questionnaire & Interviews
Correlation Descriptive Analysis Mean, Percentage, Standard Deviation
To establish the extent to which customer satisfaction influences TQM implementation at IAT
Independent: Customer Satisfaction Dependent: Performance of IAT
Students satisfied by IAT courses No. of students that enroll from current student referrals
Ordinal Questionnaire & Interviews
Correlation Descriptive Analysis Mean, Percentage, Standard Deviation
To determine how employee involvement in institutional planning influences implementation of TQM at IAT
Independent: Employee Involvement Dependent: Performance of IAT
Number of employees that are satisfied with IAT Succession Planning Qualifications
Ordinal Questionnaire & Interviews
Correlation Descriptive Analysis Mean, Percentage, Standard Deviation
To determine to what extent student involvement influences TQM in institutions of higher learning
Independent: Student Involvement Dependent: Performance of IAT
Number of students that are involved in decision making Number of students that are satisfied with IAT
Ordinal Questionnaire & Interviews
Correlation Descriptive Analysis Mean, Percentage, Standard Deviation

47
Research Objective
Variable Type
Indicator Measurement Scale
Data Collection Methods
Tools of Analysis
Data Analysis
Dependent: Performance of IAT
Preference by learners for enrollment
Timely completion of courses
Quality graduates
Preference of graduates by employers
Satisfied employees
Ordinal Questionnaire & Interviews
Descriptive Analysis Mean, Percentage, Standard Deviation

48
CHAPTER FOUR: DATA ANALYSIS, PRESENTATION, INTEPRE TATION AND DISCUSSION
4.1 Introduction
This chapter provides the results and the discussions of the findings of the research. The data that
was collected from the respondents was analyzed using Descriptive statistics such as mean and
standard deviation, correlation was also used to study the relationship of aspects of TQM on
performance.
4.2 Questionnaire Response Rate This section discusses the repondents, the number of responses, the department where the
respondents were working in, amongst others.
Table 4.1 Respondents The table below shows the percentage of respondent in different departments and their position
in the Institute of Advanced technology.
Table 4.1 :Distribution of respondents by position
Respondents No. of Response Percentages of Responses
Students 235 90% Employees 18 7% Senior managers 9 3%
262 100
From table 4.1,the findings show that the majority of the respondents at 90% were students, 7%
were employees while 3% were senior managers. The majority of those sampled for the study
were students. This is because the targeted population had more students that the staffs.
.
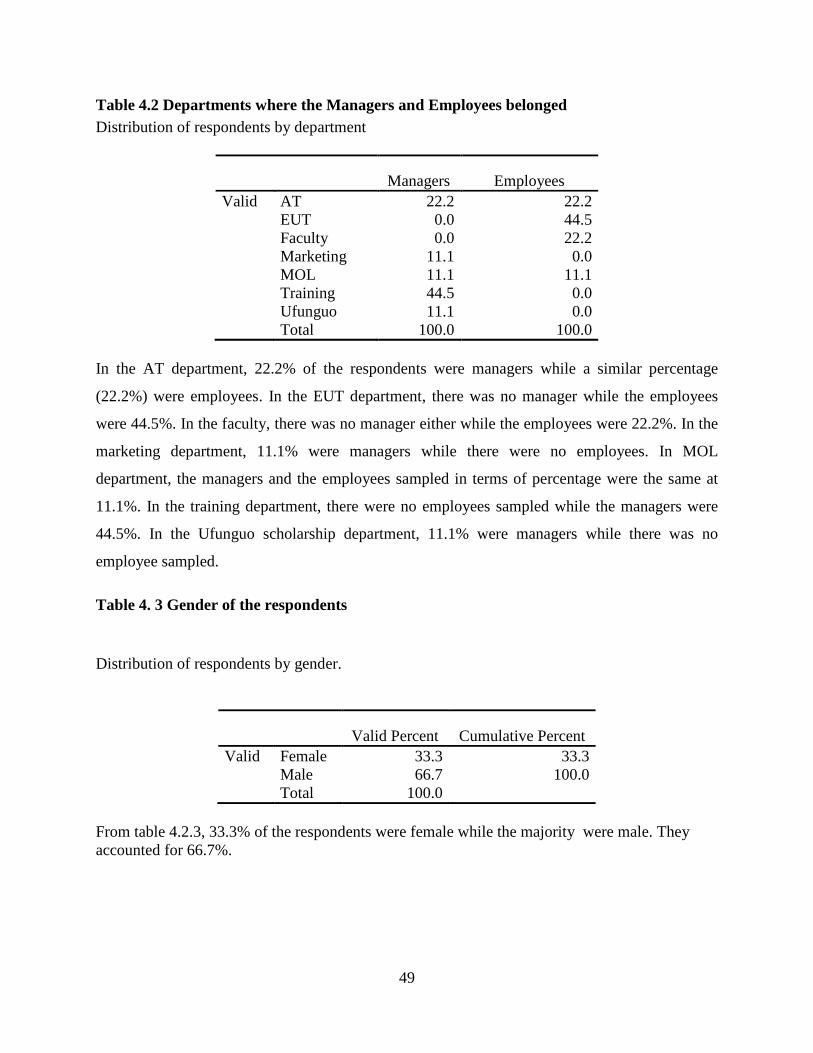
49
Table 4.2 Departments where the Managers and Employees belonged Distribution of respondents by department
Managers Employees Valid AT 22.2 22.2
EUT 0.0 44.5 Faculty 0.0 22.2
Marketing 11.1 0.0 MOL 11.1 11.1 Training 44.5 0.0 Ufunguo 11.1 0.0 Total 100.0 100.0
In the AT department, 22.2% of the respondents were managers while a similar percentage
(22.2%) were employees. In the EUT department, there was no manager while the employees
were 44.5%. In the faculty, there was no manager either while the employees were 22.2%. In the
marketing department, 11.1% were managers while there were no employees. In MOL
department, the managers and the employees sampled in terms of percentage were the same at
11.1%. In the training department, there were no employees sampled while the managers were
44.5%. In the Ufunguo scholarship department, 11.1% were managers while there was no
employee sampled.
Table 4. 3 Gender of the respondents
Distribution of respondents by gender.
Valid Percent Cumulative Percent Valid Female 33.3 33.3 Male 66.7 100.0 Total 100.0
From table 4.2.3, 33.3% of the respondents were female while the majority were male. They accounted for 66.7%.
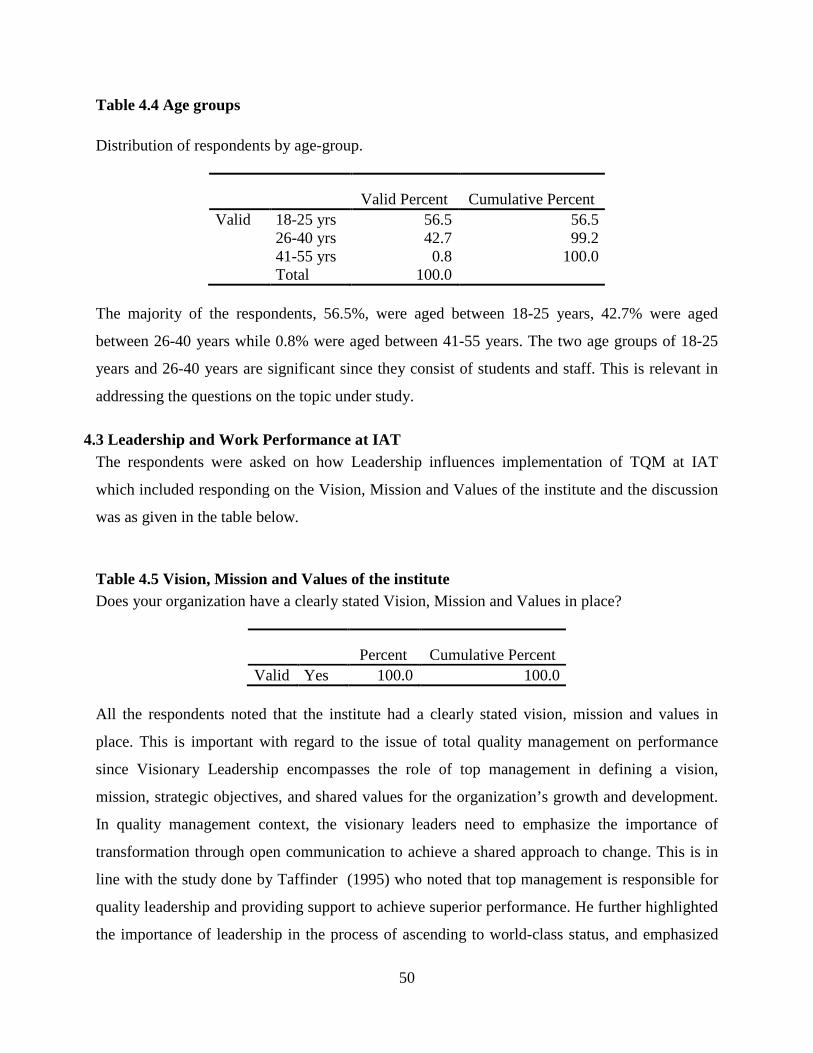
50
Table 4.4 Age groups Distribution of respondents by age-group.
Valid Percent Cumulative Percent Valid 18-25 yrs 56.5 56.5 26-40 yrs 42.7 99.2 41-55 yrs 0.8 100.0 Total 100.0
The majority of the respondents, 56.5%, were aged between 18-25 years, 42.7% were aged
between 26-40 years while 0.8% were aged between 41-55 years. The two age groups of 18-25
years and 26-40 years are significant since they consist of students and staff. This is relevant in
addressing the questions on the topic under study.
4.3 Leadership and Work Performance at IAT The respondents were asked on how Leadership influences implementation of TQM at IAT
which included responding on the Vision, Mission and Values of the institute and the discussion
was as given in the table below.
Table 4.5 Vision, Mission and Values of the institute Does your organization have a clearly stated Vision, Mission and Values in place?
Percent Cumulative Percent Valid Yes 100.0 100.0
All the respondents noted that the institute had a clearly stated vision, mission and values in
place. This is important with regard to the issue of total quality management on performance
since Visionary Leadership encompasses the role of top management in defining a vision,
mission, strategic objectives, and shared values for the organization’s growth and development.
In quality management context, the visionary leaders need to emphasize the importance of
transformation through open communication to achieve a shared approach to change. This is in
line with the study done by Taffinder (1995) who noted that top management is responsible for
quality leadership and providing support to achieve superior performance. He further highlighted
the importance of leadership in the process of ascending to world-class status, and emphasized

51
the need for leadership to establish a high-performance culture, high-performance delivery
processes and services in support of this objective.
Table 4.6 Descriptive Statistics of the time duration the students have been at the institute The table below shows the descriptive Statistics of the time duration the students had been at the
institute.
N Range Minimum Maximum Mean Std. Deviation Time 235 2 1 3 1.87 .628
From the table majority of respondents had on average spent 1.87 years in pursuing their courses.
This indicates that on average students had taken at least one year to pursue the courses at IAT
and this is enough time for the institution to produce leaders that are able to improve
performance in different industries and hence leadership influence of total quality management
implementation on performance of institutions of higher learning. Students getting enough time
to be involved in decision making make them get informed and hence creates a good working
environment of the institution to be more effective. This is supported by the study that was done
by Maina (2011) who found that colleges that keep students informed of the challenges that they
face in providing services, candidly explaining any setbacks and how these are handled gives
students an opportunity to experience management in action.
Table 4.7 Courses taken by students at the Institute The table below shows the courses taken by students at the Institute.
Valid Percent Cumulative Percent Valid Certificate 6.8 6.8 Degree 40.0 46.8 Diploma 53.2 100.0 Total 100.0
From the table 4.2.3, 6.8% of the respondents were taking certificate courses, 40.0% degree
courses while the majority at 53.2% were taking diploma courses. According to Standa (2007),
quality management involves effective management with relevant stakeholders in order to gain
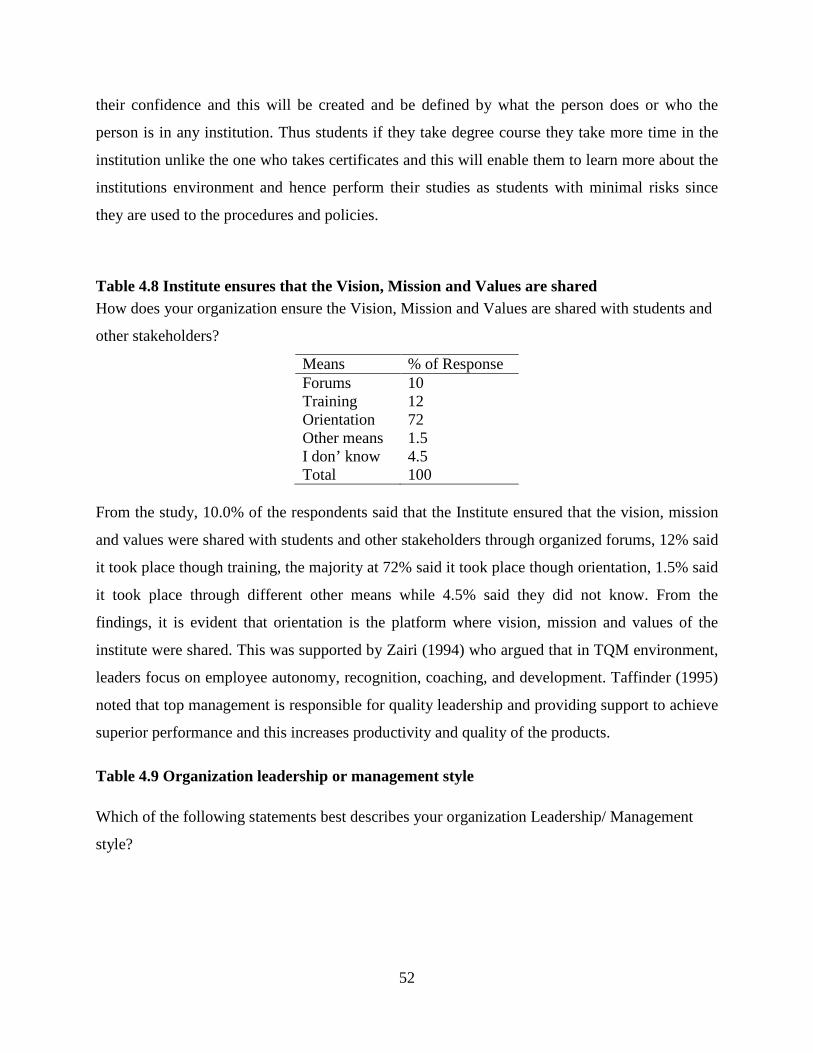
52
their confidence and this will be created and be defined by what the person does or who the
person is in any institution. Thus students if they take degree course they take more time in the
institution unlike the one who takes certificates and this will enable them to learn more about the
institutions environment and hence perform their studies as students with minimal risks since
they are used to the procedures and policies.
Table 4.8 Institute ensures that the Vision, Mission and Values are shared How does your organization ensure the Vision, Mission and Values are shared with students and
other stakeholders?
Means % of Response Forums 10 Training 12 Orientation 72 Other means 1.5 I don’ know 4.5 Total 100
From the study, 10.0% of the respondents said that the Institute ensured that the vision, mission
and values were shared with students and other stakeholders through organized forums, 12% said
it took place though training, the majority at 72% said it took place though orientation, 1.5% said
it took place through different other means while 4.5% said they did not know. From the
findings, it is evident that orientation is the platform where vision, mission and values of the
institute were shared. This was supported by Zairi (1994) who argued that in TQM environment,
leaders focus on employee autonomy, recognition, coaching, and development. Taffinder (1995)
noted that top management is responsible for quality leadership and providing support to achieve
superior performance and this increases productivity and quality of the products.
Table 4.9 Organization leadership or management style Which of the following statements best describes your organization Leadership/ Management
style?
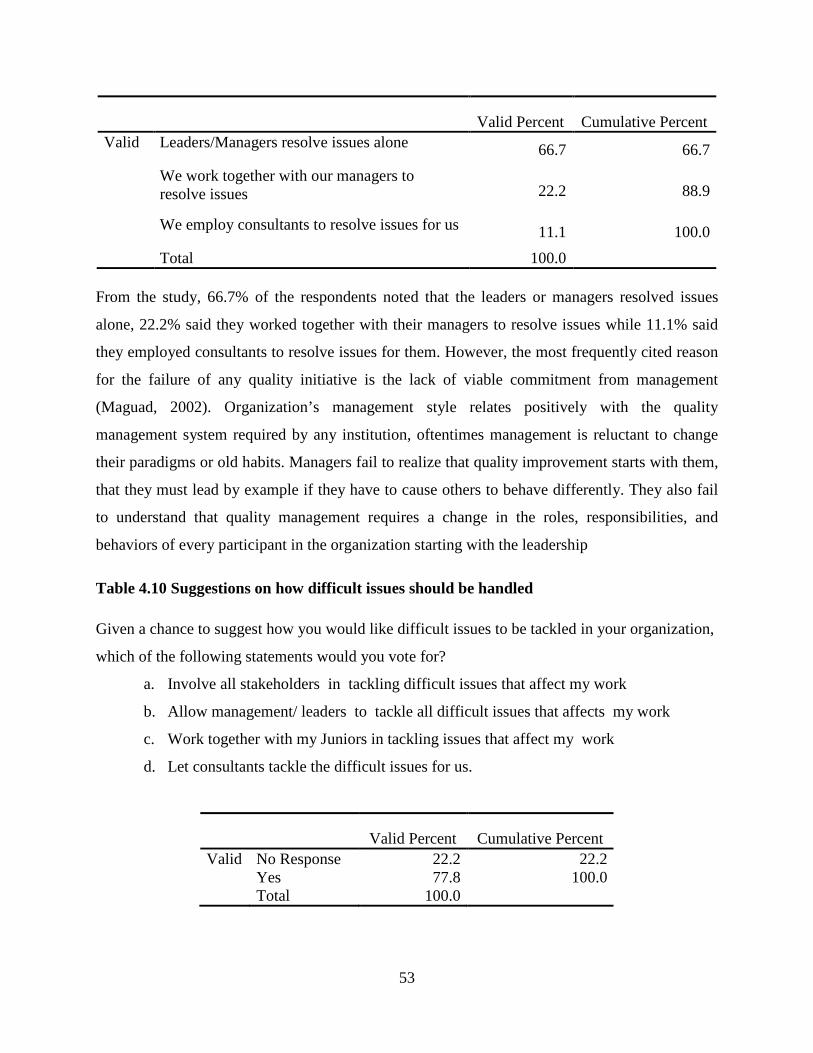
53
Valid Percent Cumulative Percent Valid Leaders/Managers resolve issues alone 66.7 66.7
We work together with our managers to resolve issues 22.2 88.9
We employ consultants to resolve issues for us 11.1 100.0
Total 100.0 From the study, 66.7% of the respondents noted that the leaders or managers resolved issues
alone, 22.2% said they worked together with their managers to resolve issues while 11.1% said
they employed consultants to resolve issues for them. However, the most frequently cited reason
for the failure of any quality initiative is the lack of viable commitment from management
(Maguad, 2002). Organization’s management style relates positively with the quality
management system required by any institution, oftentimes management is reluctant to change
their paradigms or old habits. Managers fail to realize that quality improvement starts with them,
that they must lead by example if they have to cause others to behave differently. They also fail
to understand that quality management requires a change in the roles, responsibilities, and
behaviors of every participant in the organization starting with the leadership
Table 4.10 Suggestions on how difficult issues should be handled Given a chance to suggest how you would like difficult issues to be tackled in your organization,
which of the following statements would you vote for?
a. Involve all stakeholders in tackling difficult issues that affect my work
b. Allow management/ leaders to tackle all difficult issues that affects my work
c. Work together with my Juniors in tackling issues that affect my work
d. Let consultants tackle the difficult issues for us.
Valid Percent Cumulative Percent Valid No Response 22.2 22.2 Yes 77.8 100.0 Total 100.0

54
On the issue, 22.2% gave no response while the majority (77.8%) said yes to the fact that there
was need to involve all stakeholders. If all the stakeholders are involved in handling issues of the
institution, it creates team work and hence proper management /leadership style is experienced
which leads to good quality management system of the institution.
Table 4.11 Managers views on the organization’s strategic plan
Does your organization have a strategic plan in place?
Percent Valid Percent Cumulative Percent Valid No 55.6 55.6 55.6 Yes 44.4 44.4 100.0 Total 100.0 100.0
44.4% of the respondents said that the organization had a strategic plan while 55.6% said it did
not have one. Based on extensive studies, researchers have concluded that leadership and top
management commitment is the most critical and crucial prerequisite for institutional success
when implementing TQM (Dale, 1999) and hence organizations should that the strategic plan
should be disseminated to ensure buy-in from all stakeholders.
Table 4.12 Employees involvement in the formulation of strategic plan If yes in Table 4.3.7, were employees involved in its formulation?
Percent Valid Percent Cumulative Percent Valid Suggestions 22.2 22.2 22.2 Questionnaire Survey 55.6 55.6 77.8 Were never involved at all 22.2 22.2 100.0
Total 100.0 100.0
From the study, 22.2% said the employees were involved through the suggestions they gave,
55.6% said it was through the questionnaire survey while 22.2% said they were never involved at
all. Cumulatively 77.8% of the employees were involved in the formulation of the strategic plan
of the institution. This enables creative problem solving and continuous improvement (Belbin,
1993). According to Novak (2002), leadership alone is not sufficient, but it needs to be
complemented by teams involved in the outcomes. An ancillary benefit of teams is that they
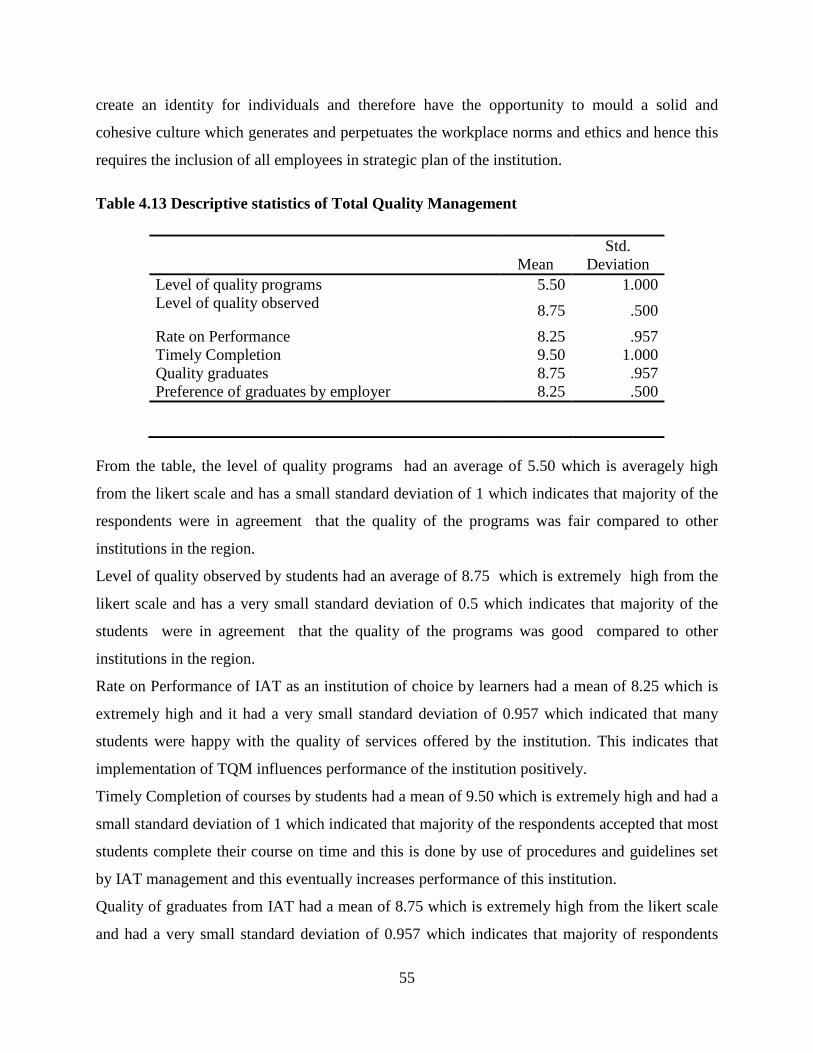
55
create an identity for individuals and therefore have the opportunity to mould a solid and
cohesive culture which generates and perpetuates the workplace norms and ethics and hence this
requires the inclusion of all employees in strategic plan of the institution.
Table 4.13 Descriptive statistics of Total Quality Management
Mean Std.
Deviation Level of quality programs 5.50 1.000 Level of quality observed 8.75 .500
Rate on Performance 8.25 .957 Timely Completion 9.50 1.000 Quality graduates 8.75 .957 Preference of graduates by employer 8.25 .500
From the table, the level of quality programs had an average of 5.50 which is averagely high
from the likert scale and has a small standard deviation of 1 which indicates that majority of the
respondents were in agreement that the quality of the programs was fair compared to other
institutions in the region.
Level of quality observed by students had an average of 8.75 which is extremely high from the
likert scale and has a very small standard deviation of 0.5 which indicates that majority of the
students were in agreement that the quality of the programs was good compared to other
institutions in the region.
Rate on Performance of IAT as an institution of choice by learners had a mean of 8.25 which is
extremely high and it had a very small standard deviation of 0.957 which indicated that many
students were happy with the quality of services offered by the institution. This indicates that
implementation of TQM influences performance of the institution positively.
Timely Completion of courses by students had a mean of 9.50 which is extremely high and had a
small standard deviation of 1 which indicated that majority of the respondents accepted that most
students complete their course on time and this is done by use of procedures and guidelines set
by IAT management and this eventually increases performance of this institution.
Quality of graduates from IAT had a mean of 8.75 which is extremely high from the likert scale
and had a very small standard deviation of 0.957 which indicates that majority of respondents

56
accepted that the quality of graduates is good. This suggests that proper procedures are followed
in training and evaluating students hence increase in performance.
Preference of graduates by employer had a mean of 8.25 which is most preferred from the likert
scale and had a small standard deviation of 0.5 hence many of the respondents accepted that IAT
graduates are good and are preferred by employers in the region.
Table 4.14 One-Sample Test of Total Quality Management
t df Sig. (2-tailed)
Level of quality programs 5.000 261 .015
Level of quality observed 35.000 261 .000 Rate of Performance 17.234 261 .000 Timely Completion 19.000 261 .000 Quality graduates 18.278 261 .000 Preference of graduates by employer
33.000 261 .000
From the table 4.3.10 This indicates some significant of the statements since their T-tests are
significant (p-value<0.05).From the response it indicates that all aspects of total quality
management were significant in determining the performance of institution of higher learning
since their significant level are less than 0.05 i.e (p=.000).
Table 4.15 Correlations
Aspects of TQM Performance Level of quality observed Pearson Correlation .581(*) Sig. (2-tailed) . N 262 Rate Performance Pearson Correlation .533(**) Sig. (2-tailed) .000 N 262 Timely Completion Pearson Correlation .414(**) Sig. (2-tailed) .000 N 262 Quality graduates Pearson Correlation .586(**) Sig. (2-tailed) .000

57
N 262 Preference of graduates by employer
Pearson Correlation .158(*)
Sig. (2-tailed) .015 N 262
** Correlation is significant at the 0.01 level (2-tailed). * Correlation is significant at the 0.05 level (2-tailed).
From the table 4.3.11, all aspects of TQM have a positive correlation on performance. Level of
quality observed has r=.581 which is significant at p=0.05, rate of performance of IAT as a
choice to students has r=.533 which is significant at p=0.01, Timely completion has r=.414
which is significant at p=0.001, quality of graduates has r=.586 which is significant at p=0.01
and preference of graduates by employer has r=.015 which is significant at p=.05. This indicates
that the aspects of TQM had a positive relationship with the performance of the institution of
higher learning in Kenya.
4.4 Customer Satisfaction and performance at IAT The respondents were asked to what extent customer satisfaction influences performance at IAT.
Table 4.16 Planning Process
What is the planning process employed by your organization in identifying your target
customers?
Process Yes Response (%) Marketing 33 Enquiry List
17
No response 50 Total 100
From the figure above, 33% of the respondents indicated that marketing is the planning process
employed by the organization in identifying customer’s target,17% indicated enquiry list and
50% had no idea about the planning process employed by IAT to target customers. Half of the
population cumulatively had an idea about the planning process especially marketing and
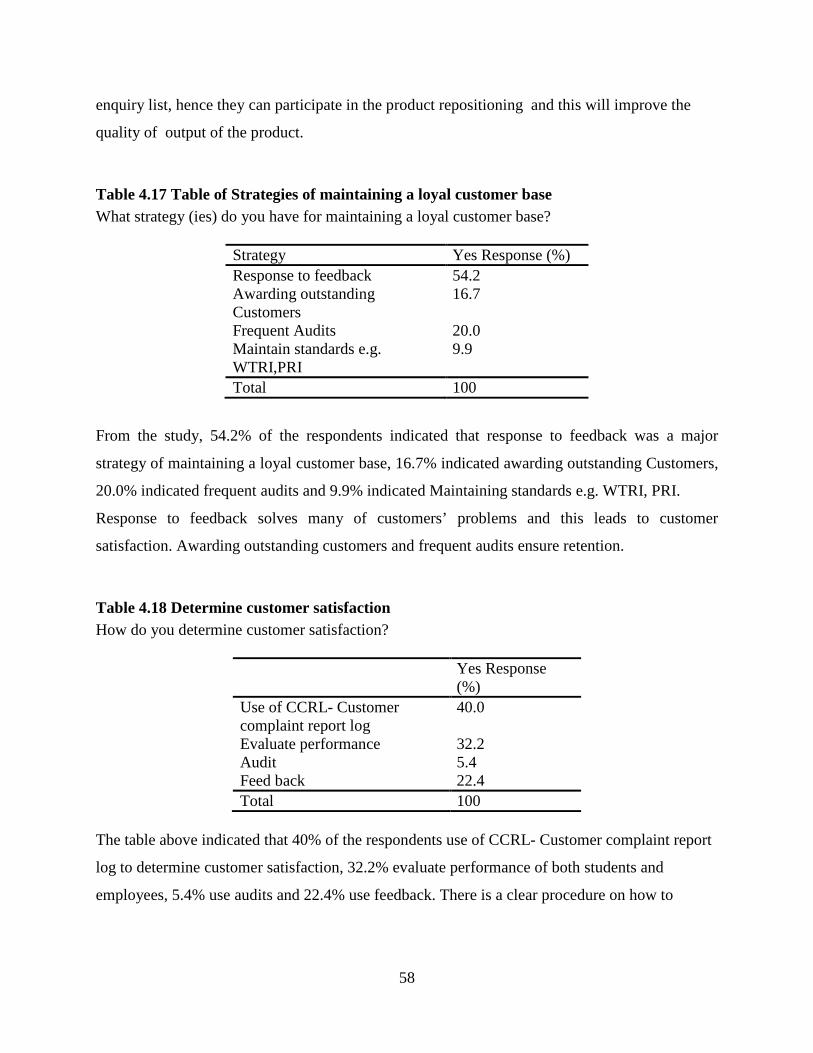
58
enquiry list, hence they can participate in the product repositioning and this will improve the
quality of output of the product.
Table 4.17 Table of Strategies of maintaining a loyal customer base What strategy (ies) do you have for maintaining a loyal customer base?
Strategy Yes Response (%) Response to feedback 54.2 Awarding outstanding Customers
16.7
Frequent Audits 20.0 Maintain standards e.g. WTRI,PRI
9.9
Total 100
From the study, 54.2% of the respondents indicated that response to feedback was a major
strategy of maintaining a loyal customer base, 16.7% indicated awarding outstanding Customers,
20.0% indicated frequent audits and 9.9% indicated Maintaining standards e.g. WTRI, PRI.
Response to feedback solves many of customers’ problems and this leads to customer
satisfaction. Awarding outstanding customers and frequent audits ensure retention.
Table 4.18 Determine customer satisfaction How do you determine customer satisfaction?
Yes Response (%)
Use of CCRL- Customer complaint report log
40.0
Evaluate performance 32.2 Audit 5.4 Feed back 22.4 Total 100
The table above indicated that 40% of the respondents use of CCRL- Customer complaint report
log to determine customer satisfaction, 32.2% evaluate performance of both students and
employees, 5.4% use audits and 22.4% use feedback. There is a clear procedure on how to

59
evaluate customer satisfaction and this ensures all customer data is captured and most of it is
used in making decisions on service improvement and this leads to customer satisfaction.
Table 4.19 Customer satisfaction and Retention Challenge What customer satisfaction and retention challenges does your organization face?
Percent Valid
Percent Cumulative
Percent Valid Lack of enough
facilities 27.8 27.8 27.8
Competition 72.2 72.2 100.0 Total 100.0 100.0
From the table, 27.8% of the respondents indicated that the customer satisfaction and retention
challenges are due to institution lack of enough facilities e.g. library and sports items and 72.2%
indicated completion from other institutions as a major challenge of customer satisfaction and
retention. Competition is major challenge because, many companies have come to embrace a
more customer-driven definition of quality (Evans et al, 1999). Quality has come to be defined as
meeting or exceeding customer expectations.
Table 4.20 Overcoming Customer satisfaction and Retention Challenge What has your institution done to enable you overcome the customer satisfaction and retention
challenges mentioned above?
Yes Response (%) Maintain quality service 77.8 Provide library facilities for students
11.2
Review the programmes 10.0 Total 100
From table above, 77.8% of the respondents indicated that the institution overcomes customer
satisfaction and retention challenge by maintaining quality, 11.2% by providing library facilities
for students and 10% by reviewing the programmes to suit customers’ needs. Majority of the

60
respondents indicated that customers were retained by maintaining quality of the services offered
to them. This further explains that customer satisfaction is a key issue in quality management and
hence its influence of total quality management implementation on performance of
institutions of higher learning.
Table 4.21 Descriptive Statistics on Rate of importance attached to customer How would you rate the importance attached to customer satisfaction as a means of achieving
TQM at IAT on a scale of 0-10?
N Minimu
m Maximu
m Mean Std.
Deviation Rate importance attached to customer
262 3 10 9.00 0.202
Valid N (listwise) 262 From the table above, the rate on importance attached to customers by employees and managers
had a mean of 9.00 which is close to very important from likert scale and had a very small
standard deviation of 0.202 which indicates that employees and managers value customers most
during their service delivery.
Table 4.22 One-Sample Test of Total Quality Management
t df Sig. (2-tailed)
Rate importance attached to customer
22.045 261 .000
Level of quality programs 5.000 261 .015
Level of quality observed 35.000 261 .000 Rate of Performance 17.234 261 .000 Timely Completion 19.000 261 .000 Quality graduates 18.278 261 .000 Preference of graduates by employer
33.000 261 .000

61
From the table 4.4.6 This indicates some significant of the statements since their T-tests are
significant (p-value<0.05).From the response it indicates that all aspects of total quality
management were significant in determining the performance of institution of higher learning
since their significant level are less than 0.05 i.e (p=.000).
4.5 Employee involvement in institutional planning and performance at IAT Respondents were asked on which way employee involvement influences implementation of
TQM at IAT. The discussion was as given in the tables below.
Table 4.23 Frequency of the Staff training How frequently are staff trainings done in a year?
Percent Cumulative
Percent Valid Frequent 27.8 33.3 Not
Frequent 72.2 100
Total 100.0 27.8% indicated IAT carries frequent staff training and 72.2% indicated that there is no frequent
staff training done to employees of IAT. All of the respondents indicated that training is relevant,
recruitment of jobs are based on education qualifications except management positions and there
is no conflict that occurs regarding employing unqualified staff.
Table 4.24 Resource allocation for marketing plan How are resources allocated for implementation of the marketing plan?
Percent Cumulative
Percent Valid Through managers 33.3 33.3 Marketing
Department 66.7 100.0
Total 100.0 From the research, 33.3% indicated that allocation for marketing plan is done through managers
and 66.7% indicated that it’s done by the marketing department. Based on this scenario, the
realization or non-realization of customer expectations would appear to be the primary
determinant of customer levels of satisfaction (Oliver, 1993). In terms of which determinants are
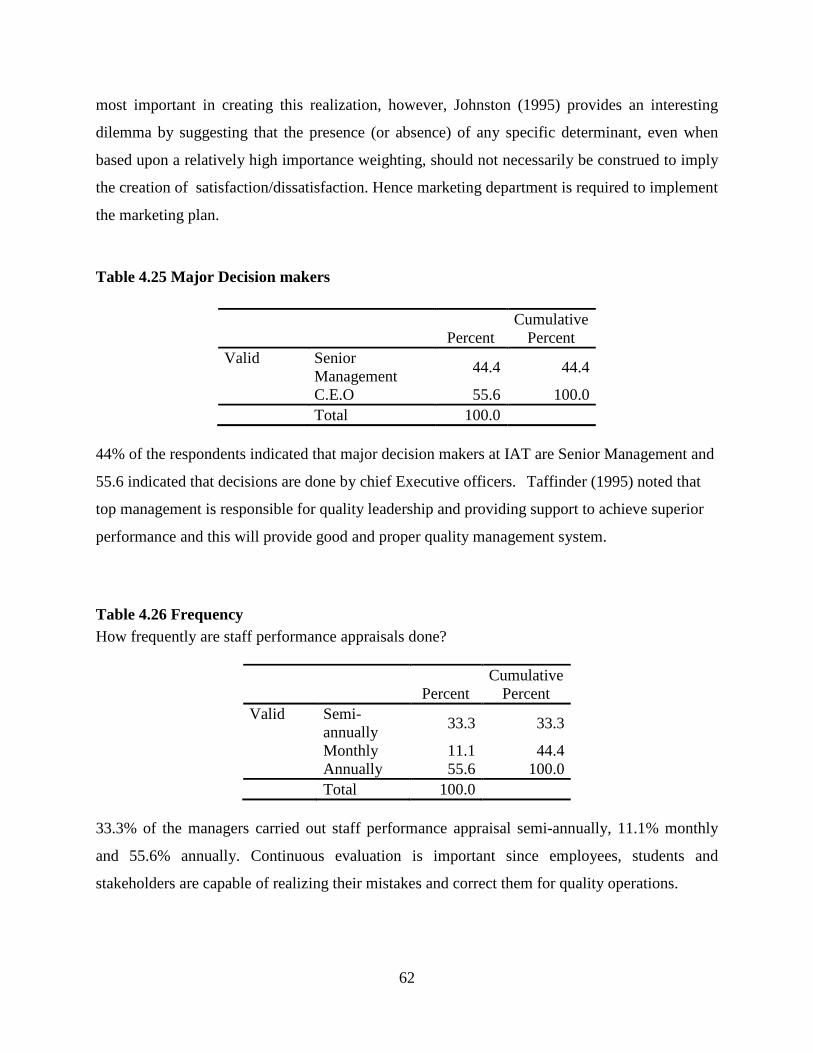
62
most important in creating this realization, however, Johnston (1995) provides an interesting
dilemma by suggesting that the presence (or absence) of any specific determinant, even when
based upon a relatively high importance weighting, should not necessarily be construed to imply
the creation of satisfaction/dissatisfaction. Hence marketing department is required to implement
the marketing plan.
Table 4.25 Major Decision makers
Percent Cumulative
Percent Valid Senior
Management 44.4 44.4
C.E.O 55.6 100.0 Total 100.0
44% of the respondents indicated that major decision makers at IAT are Senior Management and
55.6 indicated that decisions are done by chief Executive officers. Taffinder (1995) noted that
top management is responsible for quality leadership and providing support to achieve superior
performance and this will provide good and proper quality management system.
Table 4.26 Frequency How frequently are staff performance appraisals done?
Percent Cumulative
Percent Valid Semi-
annually 33.3 33.3
Monthly 11.1 44.4 Annually 55.6 100.0 Total 100.0
33.3% of the managers carried out staff performance appraisal semi-annually, 11.1% monthly
and 55.6% annually. Continuous evaluation is important since employees, students and
stakeholders are capable of realizing their mistakes and correct them for quality operations.

63
Table 4.27 Descriptive statistics of Total Quality Management
Mean Std.
Deviation Rate on employee involvement in the implementation of TQM
7.89 1.453
Level of quality observed 8.75 .500 Rate Performance 8.25 .957
From the table, Rate on employee involvement in the implementation of TQM has a mean of
7.89 and a small standard deviation of 1.453 from Likert scale which indicates that majority of
the respondents were in agreement that they get involved in TQM implementation to a greater
extent. This will lead to teamwork in achieving major goals of the institute and hence influence
the performance of the institute.
Table 4.28 One-Sample Test of Total Quality Management
t df Sig. (2-tailed)
Rate employee involvement 16.289 261 .000 Level of quality programs 5.000 261 .015
Level of quality observed 35.000 261 .000
From the table 4.5.6 This indicates some significant of the statements since their T-tests are
significant (p-value<0.05).From the response it indicates that all aspects of total quality
management were significant in determining work performance of institution of higher learning
since their significant level are less than 0.05 i.e (p=.000).
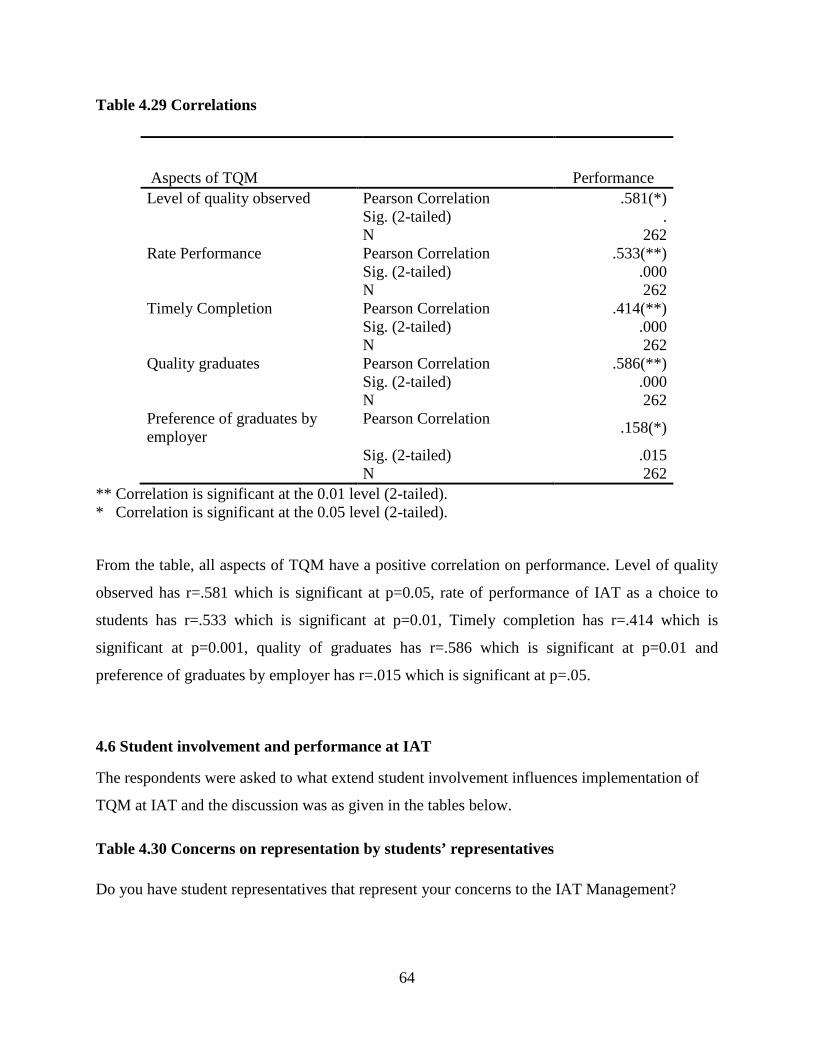
64
Table 4.29 Correlations
Aspects of TQM Performance Level of quality observed Pearson Correlation .581(*) Sig. (2-tailed) . N 262 Rate Performance Pearson Correlation .533(**) Sig. (2-tailed) .000 N 262 Timely Completion Pearson Correlation .414(**) Sig. (2-tailed) .000 N 262 Quality graduates Pearson Correlation .586(**) Sig. (2-tailed) .000 N 262 Preference of graduates by employer
Pearson Correlation .158(*)
Sig. (2-tailed) .015 N 262
** Correlation is significant at the 0.01 level (2-tailed). * Correlation is significant at the 0.05 level (2-tailed).
From the table, all aspects of TQM have a positive correlation on performance. Level of quality
observed has r=.581 which is significant at p=0.05, rate of performance of IAT as a choice to
students has r=.533 which is significant at p=0.01, Timely completion has r=.414 which is
significant at p=0.001, quality of graduates has r=.586 which is significant at p=0.01 and
preference of graduates by employer has r=.015 which is significant at p=.05.
4.6 Student involvement and performance at IAT
The respondents were asked to what extend student involvement influences implementation of
TQM at IAT and the discussion was as given in the tables below.
Table 4.30 Concerns on representation by students’ representatives Do you have student representatives that represent your concerns to the IAT Management?
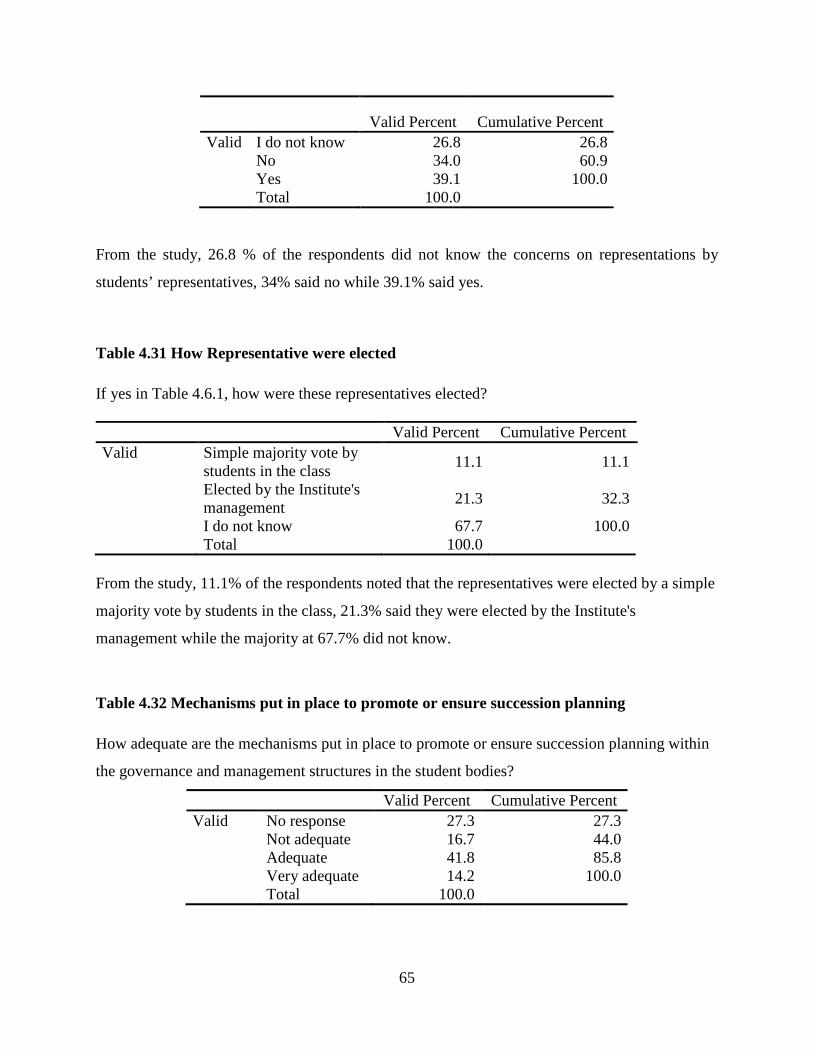
65
Valid Percent Cumulative Percent Valid I do not know 26.8 26.8 No 34.0 60.9 Yes 39.1 100.0 Total 100.0
From the study, 26.8 % of the respondents did not know the concerns on representations by
students’ representatives, 34% said no while 39.1% said yes.
Table 4.31 How Representative were elected If yes in Table 4.6.1, how were these representatives elected? Valid Percent Cumulative Percent Valid Simple majority vote by
students in the class 11.1 11.1
Elected by the Institute's management
21.3 32.3
I do not know 67.7 100.0 Total 100.0
From the study, 11.1% of the respondents noted that the representatives were elected by a simple
majority vote by students in the class, 21.3% said they were elected by the Institute's
management while the majority at 67.7% did not know.
Table 4.32 Mechanisms put in place to promote or ensure succession planning How adequate are the mechanisms put in place to promote or ensure succession planning within
the governance and management structures in the student bodies?
Valid Percent Cumulative Percent Valid No response 27.3 27.3 Not adequate 16.7 44.0 Adequate 41.8 85.8 Very adequate 14.2 100.0 Total 100.0
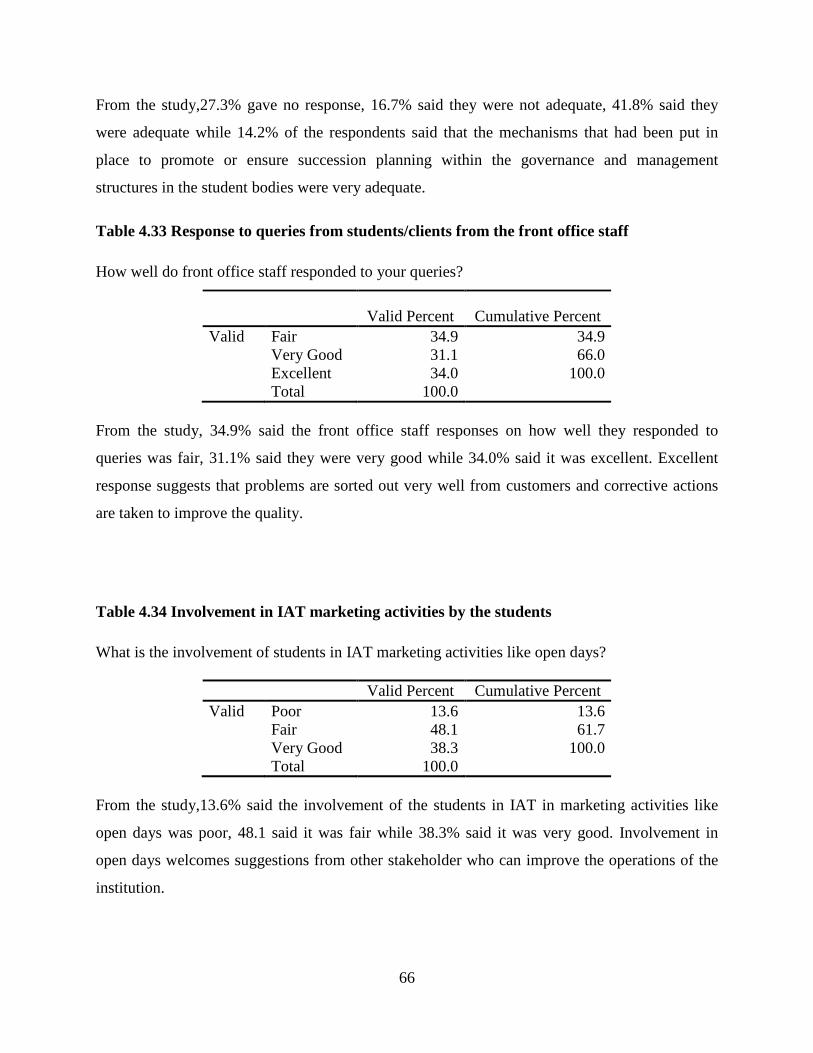
66
From the study,27.3% gave no response, 16.7% said they were not adequate, 41.8% said they
were adequate while 14.2% of the respondents said that the mechanisms that had been put in
place to promote or ensure succession planning within the governance and management
structures in the student bodies were very adequate.
Table 4.33 Response to queries from students/clients from the front office staff How well do front office staff responded to your queries?
Valid Percent Cumulative Percent Valid Fair 34.9 34.9 Very Good 31.1 66.0 Excellent 34.0 100.0 Total 100.0
From the study, 34.9% said the front office staff responses on how well they responded to
queries was fair, 31.1% said they were very good while 34.0% said it was excellent. Excellent
response suggests that problems are sorted out very well from customers and corrective actions
are taken to improve the quality.
Table 4.34 Involvement in IAT marketing activities by the students What is the involvement of students in IAT marketing activities like open days?
Valid Percent Cumulative Percent Valid Poor 13.6 13.6 Fair 48.1 61.7 Very Good 38.3 100.0 Total 100.0
From the study,13.6% said the involvement of the students in IAT in marketing activities like
open days was poor, 48.1 said it was fair while 38.3% said it was very good. Involvement in
open days welcomes suggestions from other stakeholder who can improve the operations of the
institution.

67
Table 4.35 Descriptive Statistics To what extent are students involved in the implementation of TQM at the Institute? N Minimum Maximum Mean Std. Deviation Leadership involvement in TQM
18 5 10 7.44 1.294
Valid N (listwise) 18
From the study, students are involved in the implementation of TQM at the Institute has a mean
of 7.44 which is full implementation on likert scale and has a small standard deviation of 1.29
which indicates that majority of the respondents indicated that students are active team players in
the implementation of TQM at the institute of Advanced Technology.
Table 4.36 Checks to ensure quality Do you have any checks and balances to ensure Quality of programmes?
Valid Percent Cumulative Percent Valid Yes 47.0 47.0 No 14.0 61.00 I do not
know 39.0 100.0
Total 100.0 From the findings, 47% of the respondents accepted that IAT have checks to ensure qualities of
their program is maintained, 39% do not know and 14% said that IAT does not have checks and
balance to ensure quality.

68
Table 4.37: Correlations table of extent of respondents relation with Total Quality Management
Total Quality Management
Rate on performance
Pearson Correlation .130
Sig. (2-tailed) .607 N 18 Timely Completion Pearson Correlation -.227 Sig. (2-tailed) .365 N 18 Quality graduates Pearson Correlation .616(**) Sig. (2-tailed) .006 N 18 TQM implementation
Pearson Correlation .278
Sig. (2-tailed) .264 N 18
* Correlation is significant at the 0.05 level (2-tailed). ** Correlation is significant at the 0.01 level (2-tailed). From tale 4.6.8 all the determinants of respondents relation have a positive relationship with
Total Quality Management on performance of institutions of higher learning except timely
completion on the duties assign to employees which has a negative correlation which is not
significant ant p<.01 and p<.05(r=.-227,p=.365).Quality graduates have a strong relationship
with Total Quality Management and its significant and p<.01(r=.616,p=.006)This indicates that
the presence of total quality management systems in institutions of higher learning increases the
training standards and hence quality graduates.
4.7 Discussion of Findings This section looks at findings of the four variables, that is: leadership, customer satisfaction,
employee involvement and student involvement and their influence the performance of
institutions of higher learning. This section further looks at how these finding are linked to
previous literature. The findings show that though the variables have an influence on
organization performance, the significance varies from variable to another. All this is in line with
the findings in the literature review which indicates that that the main motivation for
69
organizations deciding to implement TQM is continuously improving performance to ensure
survival and growth in a sector that is has experienced cut- throat competition in the recent past.
4.7.1 Influence of leadership on performance of institution of higher learning. On the issue of leadership, all the respondents noted that the institute had a clearly stated vision,
mission and values in place and 93.2% understand the mission and vission of the institution .The
mission,vision and values are shared during orientation of new students and staffs . This was
important with regard to the issue of total quality management on performance. Visionary
Leadership encompasses the role of top management in defining a vision, mission, strategic
objectives, and shared values for the organization’s growth and development which is done
during orientation, training and some forums carried by the institution. This indicates that the
quality services offered by the institution is properly guided by the structure of organization
where the institution involves managers in strategic decision making and hence they represents
the views of other employees and this improves performance of the institution. This is confirmed
by Quality Gurus who stressed that leadership is vital for effective implementation of total
quality management initiatives and Taffinder (1995) noted that top management is responsible
for quality leadership and providing support to achieve superior performance. The study also
indicated that 88.9% of the respondents cumulatively suggested that leaders/managers resolve
issues alone and that employment work together with our managers to resolve issues.
4.7.2 Influence of customer satisfaction on performance of institutions of higher learning. The institution has a clear strategy of maintaining a loyal customer base. This is indicated by
54.2% use of response to feedback from clients and students and internal monitoring of daily
operations and quality of services offered by the institution. The major challenge of customer
satisfaction and retention is competition which accounts up to 72.8% and lack of facilities
27.2%. The institution overcomes these challenges by maintaining quality in their services and
this enables them to retain their customers and this improves performance of the institution. The
institution also has a structure to determine customer satisfaction which includes use of customer
logs, audits, feedbacks and evaluation of performance. Rate of importance attached to customer
is 9.00 on average which is most important and this increases the performance of institution.
Many educational institutions are very hesitant to consider themselves as customer-driven
70
entities (Lewis et al, 1994). Yet one fact has been proven over and over again; Customer-driven
organizations are effective because they are fully committed to satisfying, even anticipating
customer needs and this will influence total quality management implementation on performance
of institutions of higher learning.
4.7.3 Influence of students involvement on performance of institution of higher learning. From the study, students are allowed to elect their representatives who represent their concerns
to other levels of management for decision making. Proper mechanisms are in place to ensure
succession planning which is adequate within the organization. Students are also involved in
marketing activities and this enhances teamwork within the institution and hence increases
performance. The students are involved in electing leaders and hence this enable them to
participate in getting leaders who will provide good leadership that will boost performance in the
institution of higher learning.
4.7.4 Influence of employees involvement on performance of institution of higher learning
From the study, employees are trained by the management and this enables them to become good
leaders at work and hence improves performance of the institution. Also proper mechanisms are
in place to ensure succession planning which is adequate within the organization. Employees are
also involved in marketing activities and this enhances teamwork within the institution and hence
increases performance. According to Drucker (1989), employee engagement can increase the
understanding of organizational policies. It involves processes such as lower levels of decision
making, adopt the experience, knowledge and the ideas for the advancement of the organization.
Employees shall be given due recognition for their contributions and their ideas. It is a
psychological process to develop confidence between the members of the organization and
encourage them to make decisions and solve problems with each other and this will influence
TQM implementation on performance of higher learning institutions. There are also frequent
staff appraisals done by the institutions to its staff and this aims at improving performance and
services offered by the institution. Also employees are well involved in the implementation of
TQM.

71
CHAPTER FIVE: SUMMARY OF FINDINGS, CONCLUSIONS AND RECOMMENDATIONS
5.1 Introduction
This chapter consists of a summary of the findings of the research, conclusions relating to the
research objectives, suggestions or recommendations on the influence of total quality
management implementation on performance of institutions of higher learning: the case of
institute of advanced technology in Kenya and finally areas that need further research.
5.2 Summary of Findings
The purpose of this research was to establish the influence of total quality management on
performance of institutions of higher learning in Kenya, a case of institute of advanced
technology. The study focused on addressing solutions of four research questions; leadership,
customer satisfaction, employee involvement and student involvement.
The study found out that the rate on importance attached to customers by employees and
managers had a mean of 9.00 which is close to very important from likert scale and had a very
small standard deviation of 0.202 which indicates that employees and managers place a high
value on customers during their service delivery.
The study also found out that the rate on employee involvement in the implementation of TQM
has a mean of 7.89 and a small standard deviation of 1.453 from Likert scale which indicates
that majority of the respondents were in agreement that they get involved in TQM
implementation to a greater extent. This will lead to teamwork in achieving major goals of the
institute and hence influence the performance of the institute.
The study established that students involvement in the implementation of TQM at the Institute
has a mean of 7.44 which is full implementation on likert scale and has a small standard
deviation of 1.29 which indicates that majority of the respondents indicated that students are
active team players in the implementation of TQM at the institute of Advanced Technology.
72
This study also established that the level of quality programs had an average of 5.50 which is
averagely high from the likert scale and has a small standard deviation of 1 which indicates that
majority of the respondents were in agreement that the quality of the programs was fair
compared to other institutions in the region. Level of quality observed by students had an
average of 8.75 which is extremely high from the likert scale and has a very small standard
deviation of 0.5 which indicates that majority of the students were in agreement that the quality
of the programs was good compared to other institutions in the region. Rate on Performance of
IAT as an institution of choice by learners had a mean of 8.25 which is extremely high and it had
a very small standard deviation of 0.957 which indicated that many students were happy with the
quality of services offered by the institution. This indicates that implementation of TQM
influences performance of the institution positively. Timely Completion of courses by students
had a mean of 9.50 which is extremely high and had a small standard deviation of 1 which
indicated that majority of the respondents accepted that most students complete their course on
time and this is done by use of procedures and guidelines set by IAT management and this
eventually increases performance of this institution. Quality of graduates from IAT had a mean
of 8.75 which is extremely high from the likert scale and had a very small standard deviation of
0.957 which indicates that majority of respondents accepted that the quality of graduates is good.
This suggests that proper procedures are followed in training and evaluating students hence
increase in performance. Preference of graduates by employer had a mean of 8.25 which is most
preferred from the likert scale and had a small standard deviation of 0.5 hence many of the
respondents accepted that IAT graduates are good and are preferred by employers in the region.
5.3 Conclusion
The Influence of total quality management on performance of institutions of higher learning is
positive and improves the performance of these institutions in terms of growth and development.
All aspects of total quality management such as Level of quality observed, Performance Rate,
Timely Completion, Quality graduates and Preference of graduates by employers have a positive
relationship on performance. Hence Organizations need to embrace total quality management on
their operations since it has a bearing on the performance. For leadership to relate positively to
an organization’s performance, leaders /managers should be given maximum independency in
making their decisions and involving other employees in decision making.
73
5.4 Recommendations
Organizations should ensure that their staff are well acquainted with the mission, vision and
values of those organizations since at some point they will include them in decision making and
hence they have to provide good leadership in case of succession within the organization.
Organizations should also make clear the mechanisms that they have put in place to promote or
ensure succession planning.
5.5 Suggested Areas for Further Research
1. Since the study was on the influence of Total quality management on performance of
institutions of Higher Learning, the same study should be carried out in corporate
institutions like the banks, insurance companies, etc.
2. Another study could be carried out on the role of the managers in the implementation of
Total quality management in their institutions and also on the role of TQM on
development of new programs for higher learning institutions.

74
REFERENCES Baird, Leonard (1992). How to improve your colleges' intellectual outcomes. Planning
for Higher Education 20(3)
Bank, J. (1992). The Essence of Total quality Management. U.K.: Prentice-Hall International Ltd
Bass, B.M. (1960). Leadership, Psychology and Organizational Behaviour. New York, NY:
Harper & Row
Belbin, R.M. (1993). Team Roles at Work. UK: Butterworth-Heinemann
Bennis, W. and Nannus, B. (1985). Leaders: The Strategies for Taking Charge. New York, N.Y:
Harper & Row
Bergman, B. (1995). Quality in academic leadership: a contribution to the discussion”, Total
Quality Management (Vol. 6 No. 5 & 6, pp.487-96).
Bergquist, W.H. (1995). Quality through access, access with quality. California: Jossey-Bass
Publishers.
Blankstein, A. (1996). Eight reasons TQM can’t work. Contemporary Education, 67, 65–68
Bolla, Jr. A.J. (1992) Quality legal education by design: Institutionalizing the process change
in a law school. In J.W. Harris and J.M. Baggett (Eds.), Quality Quest in the Academic
Process. Alabama: Samford University.
Brigham, S.(1994). 25 Snapshots of a Movement: Profiles of Campuses Implementing CQI.
Washington, DC: American Association of Higher Education
Burns, J.M. (1978). Leadership. New York, NY. Harper &Row

75
Byrd, C. (1940). Social Psychology. New York, NY: Appleton-Century-Crofts
Canic, M.J. & McCarthy, P.M. (2000). Service quality and higher education do mix’ Quality
Progress, 33(9), 41–46.
Carroll, A.B. & Buchholtz, A.K. (2006). Business and society: Ethics and stakeholder
management (6th ed.). Ohio: South-Western.
Chaffee, E. & Sherr, L. (1992). Quality: Transforming postsecondary education. ASHE-ERIC
Higher Education Report #3, p 1.
Ciampa, D. (1992). Total Quality: A user’s guide for implementation. U.S.A.: Addison-Wesley
Publishing Company, Inc., p. 4.
Coate, F. (1993). The introduction of total quality management at Oregon State University,
Higher Education. (Vol.25 No.3, pp. 303-20).
Conti, T., Kondo, Y. and Watson, G.H. (2003). Quality management: Current issues and future
trends. In T. Conti, Y. Kondo and G.H. Watson (Eds.) Quality into the 21st Century:
Perspectives on Quality and Competitiveness for Sustained Performance. Wisconsin:
ASQ Quality Press.
Corts, T.E. (1992). Customers: You can’t do without them. In J.W. Harris and J.M. Baggett
(Eds.)
Cowles, D., and Gilbreath, G. (1993). Total quality management at Virginia Commonwealth
University, Higher Education, Vol.25 No.3, pp. 281-302
Cua, K.O., Mc Kone, K.E., Schroedder, R.G. (2001), “Relationships between implementation of
TQM, JIT, and TPM and manufacturing performance’’, Journal of Operations
Management, Vol. 19 pp.675- 94
76
Dale, B.G. and Cooper, C. (1993) Total quality and human resources: An executive guide. UK:
Blackwell, Oxford
Dale, B.G. (1999). Managing Quality (3rd ed). UK: Blackwell, Oxford
Deighton, John (1992). The consumption of performance. Journal of Consumer Re- search 19(3):
362-372.
Deming, W.Edwards. (1992). Out of the Crisis. Cambridge, MA: MIT Center for Advanced
Engineering Study
Drucker, P.F. (1989). The Practice of Management. London: Heinemann Professional
Engelkemeyer, S.W. (1993). TQM in higher education. The Centre for Quality Management
Journal, (Vol. 2 No. 1, pp. 28-33).
Evans, J.R. & Lindsay, W.M. (1999). The management and control of quality. (4th ed.) Ohio:
South- Western College Publishing.
Feigenbaum, A.V. (1994). Quality education and America’s competitiveness", Quality Progress,
Vol. 27 No.9, pp.83-4.
Fieldler, F.E. (1967). A Theory of Leadership Effectiveness. New York. McGraw-Hill
Flood, R.L. (1993). Beyond TQM. West Sussex: John Wiley & Sons Ltd.
Foster, S.T. (2007). Managing quality: Integrating the supply chain. (3rd ed.) New Jersey:
Pearson Education
Fullan, M. (1993). Change Forces. London: London

77
French, J.R.P. and Raven, B. (1968). The bases of social power (3rd ed). New York: Harper and
Row
Garvin, D. (1984). “What does ‘product quality’ really mean?” Sloan Management Review, 25–
43.
Goldberg, J.S., Cole, B.R. (2002). Quality management in education: building excellence and
equity in student performance. Quality Management Journal, Vol 9 No.4, pp.8-22
Graham, Steven W., and Cockriel, Irv (1989). College outcome assessment factors: An empirical
approach. College Student Journal 23(3): 280-288.
Green, D. (1994). What is quality in higher education? Concepts, policy and practice.’ In D.
Green (Ed.), What is quality in higher education (pp. 3–20)? Great Britain: Open
University Press, p. 12.
Greenberg, J., and Baron, R.A. (1997). Behaviour in Organizations (6th ed). NJ: Prentice Hall
Gregory, M., 1996. Developing effective college leadership for the management of educational
. Leadership Org. Dev. J., 17(4): 46-51.
Hansen, N.L. (1993). Bringing total quality improvement into the college classroom, Higher
Education, vol.25 No.3, pp.259-79.
Harris, G.M. (1992). Managing Health Services: Concepts and Practice (2nd ed). Australia:
Elsevier
Hays, D.W. (1994). Quality improvement and its origin in scientific management. Quality
Progress, 27(5), 89–90.
Hunt, J.W. (1992). Managing People at Work, 3rd ed. New York: Mc Graw Hill
Iven, H. (1995). Dearing’s dilemma. Education, 9 June, vol: 14
78
Johnston, R. (1995). The determinants of service quality: satisfiers and dissatisfiers.
International Journal of Service Industry Management, Vol.6, N0.5, pp. 53-71
Juran, J.M. (1995). A history of managing for quality: The evolution, trends, and future
directions of managing for quality. Wisconsin: ASQC Quality Press.
Juran, J.M. (1988). Juran on planning for quality. New York: The Free Press.
Kirkham, R.L. (1992) A better way: Achieving total quality. Utah: American Training Alliance
Koch, J. (2003) TQM: Why is its impact in higher education so small? The TQM Magazine,
15(5), 325–333.
Kothari, C.R. (2004).Research Methodology: Methods and Techniques (2nd Ed.).New Delhi,
India: New Age International Publishers.
Lawler, E. (1994). Total quality management and employee involvement: Are they compatible?
The Academy of Management Executive, 8 (1), 68 – 76.
Lawrence, J.J., and Mc McCullough, M.A. (2001). A conceptual framework for guaranteeing
higher education. Qual. Assur. Edu. 9(3): 139-152
Lewis, R.G. and Smith, D.H. (1994). Total Quality in Higher Education. Florida: St. Lucie Press
Likert, R. (1961). New Patterns of Management. New York: Mc Graw Hill
Lovelock C.H. (1983). Consumer Promotion in Services Marketing, Business Horizon, May-
June, p.66
Lussier, R.N. & Achua, C.F. (2001). Leadership: Theory, application, skill development. Ohio:
79
South-Western College Publishing.
Maguad, B.A. (2002) Managing for quality: Challenges and opportunities. Presentation at the
American Society of Business & Behavioral Sciences 9th Annual Meeting, Las Vegas,
Nevada.
Maguad, B.A., et al (2012). Managing for Quality in Higher Education: A Systems Perspective.
Ventus Publishing
Marchese, T. (1996). Bye, bye, CQI for now. Change, 28, 4–5.
Marsh, D.T. (1992). Leadership and its functions in further and higher education. Bristol:
Mendip Paper
Mc Gregor, D. (1987). The Human Side of Enterprise. Harmondsworth: Penguin
Michael, R.K., et al (1997). A comprehensive model for implementing total quality management
in higher education. Benchmark. Qual. Manage. Technol., 4(2): 104-120
Miller, J.S. and Cordy,R.L. (2000) Technology and managing people: Keeping the “human” in
human resources. Journal of Labor Research, 21 (11) 1293-1312.
Moseley, J.L., Dessinger, J.C. (2009). Handbook of Improving Performance in the Workplace,
Measurement and Evaluation (vol.30). USA: John Wiley and Sons
Mugenda O.M. & Mugenda, A.G. (1999).Research methods: quantitative and qualitative
approaches. Nairobi: ACTS Press.
Nicholls, J. (1998). The transforming autocrat, Management Today. March, pp.114-8
Noe, J.R. (1986). Peak performance principles for achievers. New York: The Berkley Publishing

80
Group, p. 110.
Novak, J.M. (2002). Inviting Educational Leadership: Fulfilling Potential and Applying an
Ethical Perspective to the Educational Process, School Leadership and Management
Series. London: Pearson Education
Olayo, J.O (2005). The Impact of Employee Empowerment on Work Performance: Case Study of
Selected Universities in Kenya. Unpublished MBA Thesis. Kenyatta University.
Oliver, R.L. (1993). Cognitive, affective and attribute bases of the satisfaction response, Journal
of Consumer Research, vol.20, pp. 65-85
Osseo-Asare A.E, Longbottom D., William D. Murphy, (2005),"Leadership best practices for
sustaining quality in UK higher education from the perspective of the EFQM Excellence
Model", Quality Assurance in Education, Vol. 13 Iss: 2 pp. 148 - 170
Owlia, M. S. and . Aspinwall, E. M (1997). TQM in higher education - a review. International
Journal of Quality & Reliability Management 14(5): 527-543.
Parasuraman, A., Zeithaml, V. and Berry, L. (1998). SERVQUAL: a multiple-item scale for
measuring consumer perceptions of service quality, Journal of Retailing, No.64, Spring,
pp 12-40
Rees, C. (1994) Teamworking and services quality: the limits of employee involvement.
Personnel Review, 28 (5) 455-473
Reilly, N.B. (1994). Quality: What makes it happen? New York: Van Nostrand Reinhold, pp. 2–
3.
Rickert, E. (1948). Chaucer’s world. New York: Columbia University Press
81
Rinehart, G. (1993). Quality education. Wisconsin: ASQC Quality Press.
Roberts, H.V. (Ed.) (1995) Academic initiatives in total quality for higher education. Wisconsin:
ASQC Quality Press.
Roffe, L.M. (1998). Conceptual problems of continuous quality improvement and innovation in
higher education. Qual.Assur.Higher Edu., 6(2): 74-82
Sangeeta, S. and Banwe, D.K. (2004). Conceptualizing total quality management in higher
education. The TQM magazine, Volume 16 No.2. pp.145-159. Emerald Group
Publishing Ltd
Sanyal, B., Martin M. (1998). Management of Higher Education with Special Reference to
Financial Management in African Countries. Paris: IIEP
Schargel, F.P. (1993, October). Total quality in education. Quality progress. 26, p. 67.
Seymour, D.T. (1992). On Q: Causing Quality in Higher Education. New York: Macmillan
Shank, M.D., Walker, M. and Hayes, T. (1995). Understanding professional service
expectations: do we know what our students expect in quality education? Journal of
Professional Services Marketing. Vol. 13 No.1, pp 71-83
Sirvanci, M. (1996). Are students the true customers of higher education? Quality Progress,
29(10), 99–102.
Stensaasen, S. (1995). The application of Deming’s theory of TQM to achieve continuous
improvement in education. Total Quality Management, vol. 6 No.5 and 6, pp. 579-592
Summers, D.C. (2003). Quality (3rd ed.). New Jersey: Pearson Education, Inc.

82
Taffinder, P. (1995). The New Leaders: Achieving Corporate Transformation through Dynamic
Leadership. London: Kogan Page
Tam, M. (2001). Measuring quality and performance in higher education, Quality in Higher
Education, Vol.7 No.1, pp.47-54
Tenner, A.R. & DeToro, I.J. (1992). Total quality management: Three steps to continuous
improvement. Massachusetts: Addison-Wesley Publishing Company, Inc.
Tuttle, T.C. (1994). Is total quality worth the effort? How do we know?’ In D. Seymour (Ed.),
Total quality management on campus: Is it worth doing (pp. 21–32)? San Fransisco:
Jossey-Bass Publishers.
Unesco (2003). Measuring Education Quality, Ministerial Round table on the Quality of
Education, France, Paris. Unesco Institute of Statistics
Williams, G. (1993). Total quality management in higher education: Panacea or placebo? Higher
Education, 25, 229–237.
Wilkinson, A., Marchington, M., Goodman, J. and Ackers, P. (1992) Total quality management
and employee involvement. Human Resource Management Journal, 2 (4) 1-20
Zairi, M. (1994). Leadership in TQM implementation: some case examples, The TQM
Magazine, Vol.6 No.6, pp. 9-16
Zemsky, R., Massy, W., & Oedel, P. (1993, May-June). On reversing the ratchet. Change. 25(3),
p. 56.

83
APPENDICES
Appendix I: Letter of Transmittal
Jacqueline Salima W. Mtongolo,
University of Nairobi,
School of Post graduate Studies,
P.O. Box 30197 -00200,
Nairobi.
To whom it may concern,
Dear Sir/Madam,
RE: REQUEST FOR ASSISTANCE IN RESEARCH STUDY
I wish to undertake a research on factors affecting Total Quality Management Implementation
in Institutions of Higher Learning, A case of the Institute of Advanced Technology (Nairobi) in
partial fulfillment of the requirements of the degree of Master of Arts in Project Planning and
Management at the University of Nairobi.
I hereby seek your support and cooperation in the data collection process. All information
obtained will be treated with maximum confidentiality and will only be used for academic
purposes. A copy of the research report will be availed to you on request.
Your cooperation will be highly appreciated.
Yours Sincerely,
Jacqueline Salima W. Mtongolo,
L50/72642/08
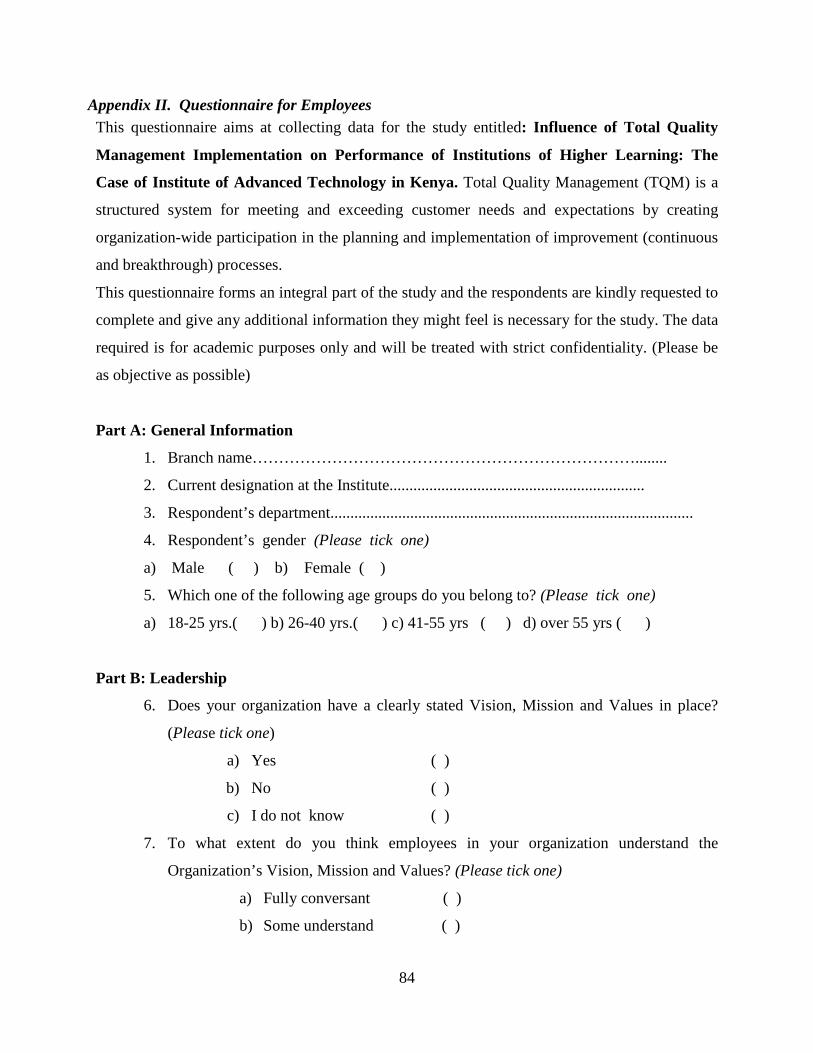
84
Appendix II. Questionnaire for Employees This questionnaire aims at collecting data for the study entitled: Influence of Total Quality
Management Implementation on Performance of Institutions of Higher Learning: The
Case of Institute of Advanced Technology in Kenya. Total Quality Management (TQM) is a
structured system for meeting and exceeding customer needs and expectations by creating
organization-wide participation in the planning and implementation of improvement (continuous
and breakthrough) processes.
This questionnaire forms an integral part of the study and the respondents are kindly requested to
complete and give any additional information they might feel is necessary for the study. The data
required is for academic purposes only and will be treated with strict confidentiality. (Please be
as objective as possible)
Part A: General Information
1. Branch name………………………………………………………………........
2. Current designation at the Institute................................................................
3. Respondent’s department...........................................................................................
4. Respondent’s gender (Please tick one)
a) Male ( ) b) Female ( )
5. Which one of the following age groups do you belong to? (Please tick one)
a) 18-25 yrs.( ) b) 26-40 yrs.( ) c) 41-55 yrs ( ) d) over 55 yrs ( )
Part B: Leadership
6. Does your organization have a clearly stated Vision, Mission and Values in place?
(Please tick one)
a) Yes ( )
b) No ( )
c) I do not know ( )
7. To what extent do you think employees in your organization understand the
Organization’s Vision, Mission and Values? (Please tick one)
a) Fully conversant ( )
b) Some understand ( )

85
c) Barely understand ( )
d) Don’t understand ( )
8. How does your organization ensure the Vision, Mission and Values are shared with
students and other stakeholders?
a) Forums ( )
b) Training ( )
c) Orientation ( )
d) Using other means of communication ( )
e) I do not know ( )
For d) please specify the means
…………………………………………………………...
...............................................................................................................................................
9. Which of the following statements best describes your organization Leadership/
Management style? (Please tick one)
a) Leaders/Managers resolve issues alone ( )
b) We work together with our managers to resolve issues ( )
c) We employ consultants to resolve issues for us ( )
d) Any other (please specify)…………………………………………..
10. Given a chance to suggest how you would like difficult issues to be tackled in your
organization, which of the following statements would you vote for? (Please tick one)
a) Involve all stakeholders in tackling difficult issues that affect my work ( )
b) Allow management/ leaders to tackle all difficult issues that affects my work ( )
c) Work together with my Juniors in tackling issues that affect my work ( )
d) Let consultants tackle the difficult issues for us. ( )
11. On a scale of 0-10, how would you rate the extent to which the leadership of the
institution is involved in implementation of TQM?
0 ( ) 1 ( ) 2 ( ) 3 ( ) 4( ) 5 ( ) 6 ( ) 7 ( ) 8 ( ) 9 ( ) 10 ( )
To a very small extent To a very large extent

86
Part C: Customer Satisfaction
12. What is the planning process employed by your organization in identifying your
target
customers?........................................................................................................................
..........................................................................................................................................
............
13. What strategy (ies) do you have for maintaining a loyal customer base?
a) Response to feedback ( )
b) Awarding outstanding staff in customer service ( )
c) Frequent audits ( )
d) Maintain standard measures of quality i.e WTRI ,PRI etc ( )
14. How do you determine customer satisfaction?
a) Evaluate performance ( )
b) Audits ( )
c) Feed back( )
d) Other (specify)….
15. What customer satisfaction and retention challenges does your organization face?
a) Lack of enough facilities
b) Lack of trained staff
c) Lack of enough time to train
d) Competition
e) Other (specify)……………………………………………………………………
16. What has your institution done to enable you overcome the customer satisfaction and
retention challenges you have listed above? (please tick one )
a) Maintain quality of service provision ( )
b) Provide library facilities for students ( )
c) Review the programmes ( )
d) Other (specify)……………………………………………………………………...

87
17. How would you rate the importance attached to customer satisfaction as a means of
achieving TQM at IAT on a scale of 0-10. (please tick where appropriate)
0 ( ) 1 ( ) 2 ( ) 3 ( ) 4( ) 5 ( ) 6 ( ) 7 ( ) 8 ( ) 9 ( ) 10 ( )
Not important Most important
Part D: Employee Involvement
18. Does your employer carry out staff performance appraisal on its employees?
a) Yes ( )
b) No ( )
19. How frequently are staff trainings done in a year?
a) Very frequent ( )
b) Frequent ( )
c) Not frequent ( )
d) Not at all ( )
20. Was the training you took relevant to your position? (Please explain your answer)
a) Yes ( )
b) No ( )
................................................................................................................................................
..........................................................................................................................................
21. Is recruitment of job vacancies done based on education qualifications?
(Please explain your answer)
a) Yes ( )
b) No ( )
………………………………………………………………………………
……………………………………………………………………………………………..
22. Do conflicts ever occur regarding employing of unqualified staff? (Please give a brief
explanation if yes?)
a) Yes ( )
b) No ( )

88
………………………………………………………………………………………………
………………………………………………………………………………………………
23. On a scale of 0-10, rate the extent to which employees are involved in the
implementation of TQM at the Institute? (Tick where appropriate)
0 ( ) 1 ( ) 2 ( ) 3 ( ) 4( ) 5 ( ) 6 ( ) 7 ( ) 8 ( ) 9 ( ) 10 ( )
To a very small extent To a very large extent
Part E: Total Quality Management
24. Do you have any checks and balances to ensure Quality of programmes?
a) Yes ( )
b) No ( )
If YES, which ones are they?
a) Feed back ( )
b) Training ( )
c) Forums ( )
d) Don’t know ( )
25. How do you rate performance of IAT as an institution of choice by learners on a scale
of 0-10? (Tick where appropriate)
0 ( ) 1 ( ) 2 ( ) 3 ( ) 4( ) 5 ( ) 6 ( ) 7 ( ) 8 ( ) 9 ( ) 10 ( )
Extremely low Extremely high
26. How do you rate IAT in terms of timely completion of courses by students, on a scale
of 0-10?
0 ( ) 1 ( ) 2 ( ) 3 ( ) 4( ) 5 ( ) 6 ( ) 7 ( ) 8 ( ) 9 ( ) 10 ( )
Extremely poor Excellent
27. How do you rate the quality of IAT graduates on a scale of 0-10?

89
0 ( ) 1 ( ) 2 ( ) 3 ( ) 4( ) 5 ( ) 6 ( ) 7 ( ) 8 ( ) 9 ( ) 10 ( )
Extremely low Extremely high
28. How do you rate IAT in terms of preference of its graduates by employers, on a scale
of 0-10?
0 ( ) 1 ( ) 2 ( ) 3 ( ) 4( ) 5 ( ) 6 ( ) 7 ( ) 8 ( ) 9 ( ) 10 ( )
Not preferred Most preferred
29. On a scale of 0-10, how would you rate the extent to which TQM has been
implemented at IAT? (Tick where appropriate)
0 ( ) 1 ( ) 2 ( ) 3 ( ) 4( ) 5 ( ) 6 ( ) 7 ( ) 8 ( ) 9 ( ) 10 ( )
No implementation Full Implementation

90
Appendix III. Questionnaire for Management This questionnaire aims at collecting data for the study entitled: Influence of Total Quality
Management Implementation on Performance of Institutions of Higher Learning: The
Case of Institute of Advanced Technology in Kenya. Total Quality Management (TQM) is a
structured system for meeting and exceeding customer needs and expectations by creating
organization-wide participation in the planning and implementation of improvement (continuous
and breakthrough) processes.
This questionnaire forms an integral part of the study and the respondents are kindly requested to
complete and give any additional information they might feel is necessary for the study. The data
required is for academic purposes only and will be treated with strict confidentiality. (Please be
as objective as possible)
Part A: General Information
1. Branch name………………………………………………………………........
2. Current designation at the Institute................................................................
3. Respondent’s department...........................................................................................
4. Respondent’s gender (Please tick one)
a) Male ( ) b) Female ( )
5. Which one of the following age groups do you belong to? (Please tick one)
a) 18-25 yrs.( ) b) 25-40 yrs.( ) c) 40-55 yrs ( ) d) over 55 yrs ( )
Part B: Leadership
6. Does your organization have a clearly stated Vision, Mission and Values in place?
(Please tick one)
a) Yes ( )
b) No ( )
c) I do not Know ( )
7. To what extent do you think employees in your organization understand the
Organization’s Vision, Mission and Values? (Please tick one)
a) Fully conversant ( )
b) Some understand ( )
c) Barely understand ( )
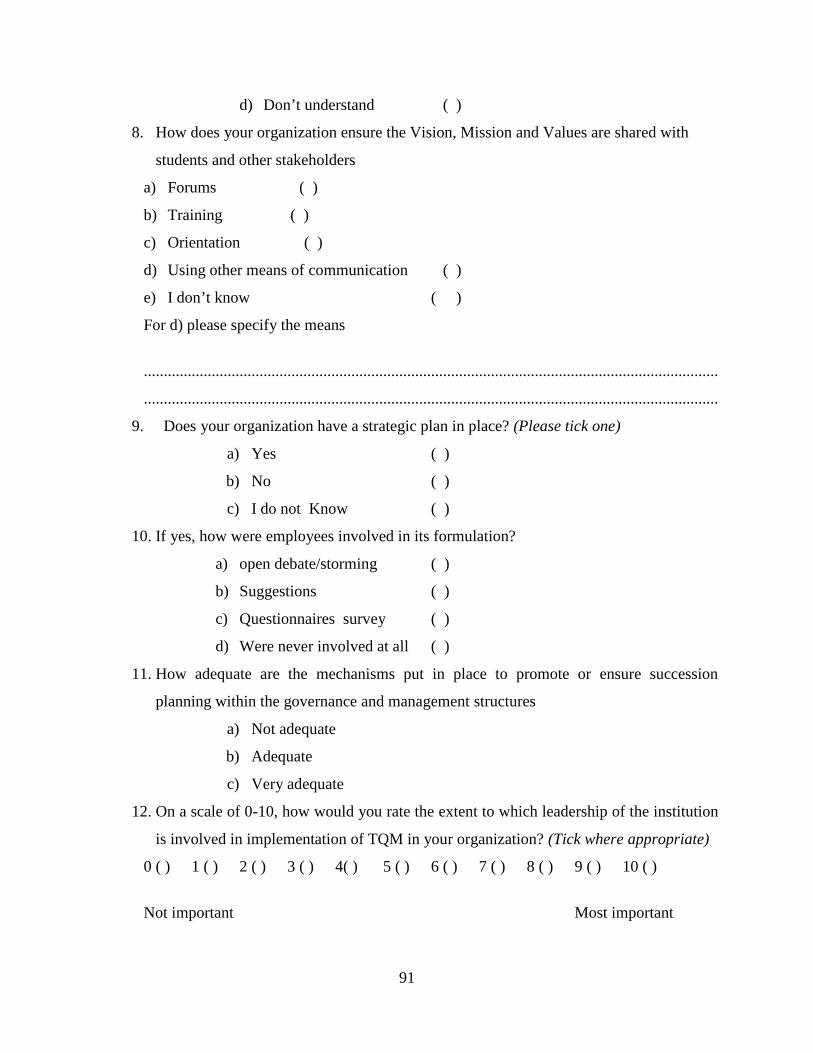
91
d) Don’t understand ( )
8. How does your organization ensure the Vision, Mission and Values are shared with
students and other stakeholders
a) Forums ( )
b) Training ( )
c) Orientation ( )
d) Using other means of communication ( )
e) I don’t know ( )
For d) please specify the means
................................................................................................................................................
................................................................................................................................................
9. Does your organization have a strategic plan in place? (Please tick one)
a) Yes ( )
b) No ( )
c) I do not Know ( )
10. If yes, how were employees involved in its formulation?
a) open debate/storming ( )
b) Suggestions ( )
c) Questionnaires survey ( )
d) Were never involved at all ( )
11. How adequate are the mechanisms put in place to promote or ensure succession
planning within the governance and management structures
a) Not adequate
b) Adequate
c) Very adequate
12. On a scale of 0-10, how would you rate the extent to which leadership of the institution
is involved in implementation of TQM in your organization? (Tick where appropriate)
0 ( ) 1 ( ) 2 ( ) 3 ( ) 4( ) 5 ( ) 6 ( ) 7 ( ) 8 ( ) 9 ( ) 10 ( )
Not important Most important
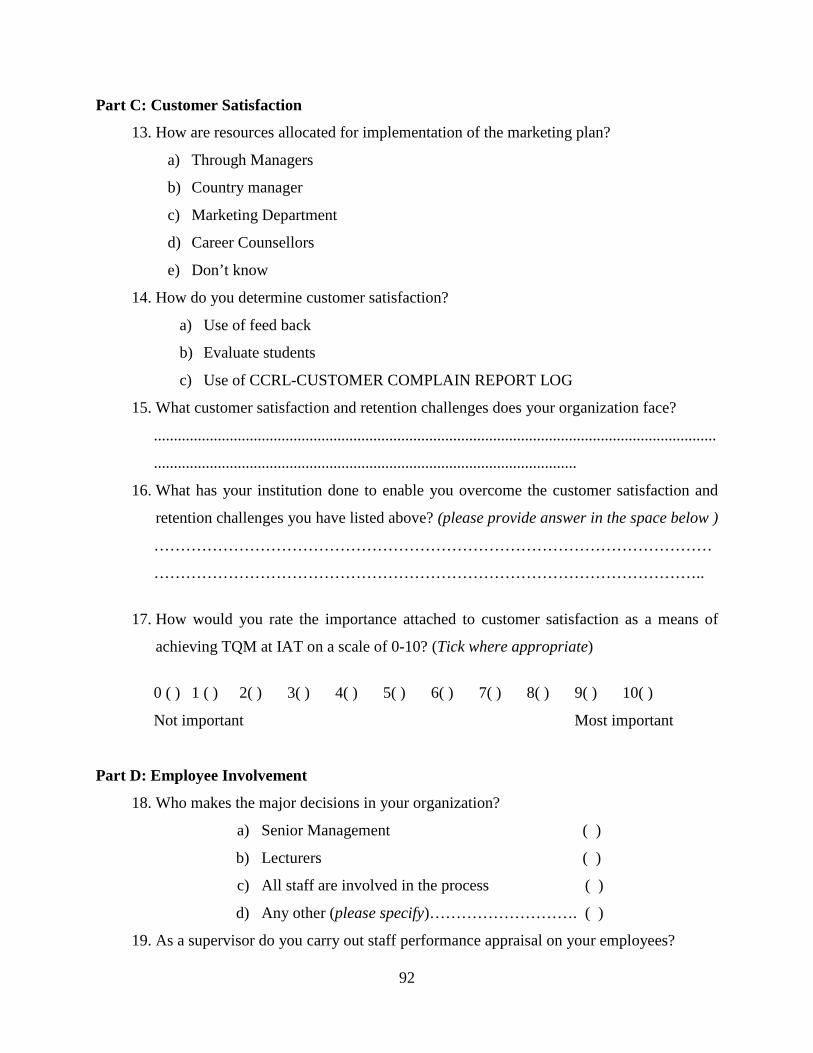
92
Part C: Customer Satisfaction
13. How are resources allocated for implementation of the marketing plan?
a) Through Managers
b) Country manager
c) Marketing Department
d) Career Counsellors
e) Don’t know
14. How do you determine customer satisfaction?
a) Use of feed back
b) Evaluate students
c) Use of CCRL-CUSTOMER COMPLAIN REPORT LOG
15. What customer satisfaction and retention challenges does your organization face?
.............................................................................................................................................
..........................................................................................................
16. What has your institution done to enable you overcome the customer satisfaction and
retention challenges you have listed above? (please provide answer in the space below )
……………………………………………………………………………………………
…………………………………………………………………………………………..
17. How would you rate the importance attached to customer satisfaction as a means of
achieving TQM at IAT on a scale of 0-10? (Tick where appropriate)
0 ( ) 1 ( ) 2( ) 3( ) 4( ) 5( ) 6( ) 7( ) 8( ) 9( ) 10( )
Not important Most important
Part D: Employee Involvement
18. Who makes the major decisions in your organization?
a) Senior Management ( )
b) Lecturers ( )
c) All staff are involved in the process ( )
d) Any other (please specify)………………………. ( )
19. As a supervisor do you carry out staff performance appraisal on your employees?
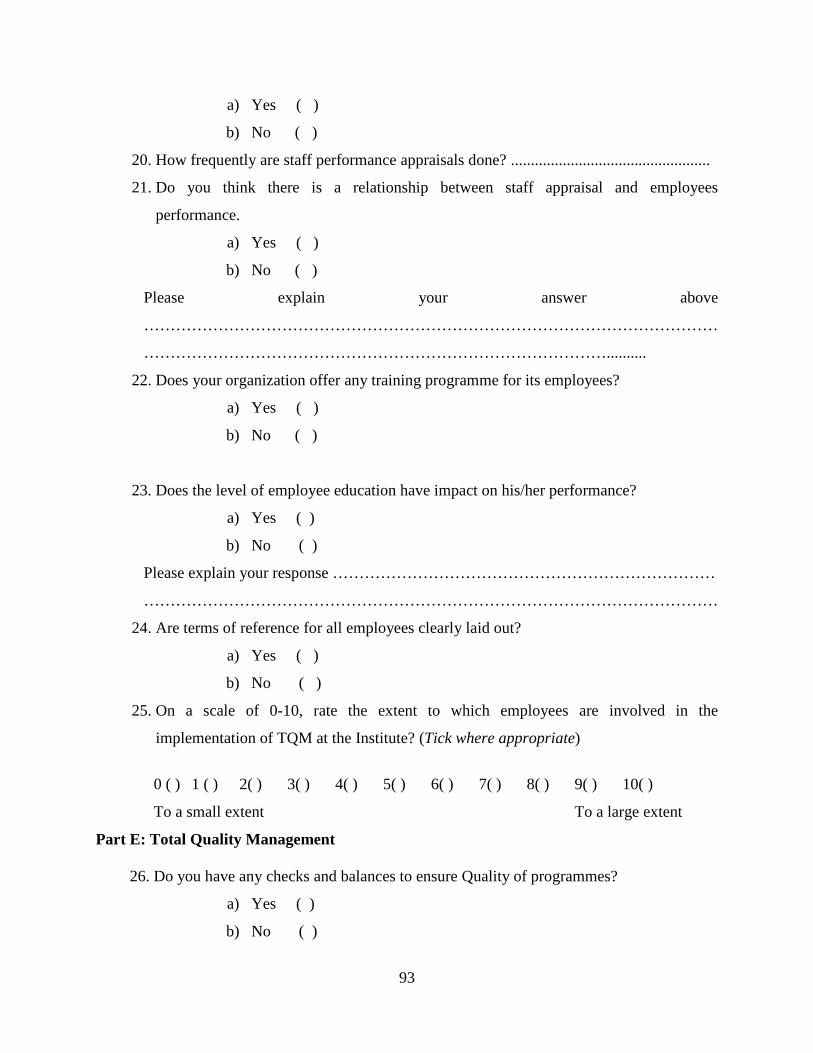
93
a) Yes ( )
b) No ( )
20. How frequently are staff performance appraisals done? ..................................................
21. Do you think there is a relationship between staff appraisal and employees
performance.
a) Yes ( )
b) No ( )
Please explain your answer above
………………………………………………………………………………………………
……………………………………………………………………………..........
22. Does your organization offer any training programme for its employees?
a) Yes ( )
b) No ( )
23. Does the level of employee education have impact on his/her performance?
a) Yes ( )
b) No ( )
Please explain your response ………………………………………………………………
………………………………………………………………………………………………
24. Are terms of reference for all employees clearly laid out?
a) Yes ( )
b) No ( )
25. On a scale of 0-10, rate the extent to which employees are involved in the
implementation of TQM at the Institute? (Tick where appropriate)
0 ( ) 1 ( ) 2( ) 3( ) 4( ) 5( ) 6( ) 7( ) 8( ) 9( ) 10( )
To a small extent To a large extent
Part E: Total Quality Management
26. Do you have any checks and balances to ensure Quality of programmes?
a) Yes ( )
b) No ( )
94
If YES, which ones are they?
................................................................................................................................................
.....................................................................................................................................
27. What levels of Quality do you observe in these programmes?
a) Very High ( )
b) High ( )
c) Satisfactory ( )
d) Poor ( )
28. How often do you check to ensure quality is maintained?
a. Daily ( )
b. Weekly ( )
c. End of term ( )
d. Never at all ( )
29. On a scale of 0-10, how do you rate the extent to which TQM has been implemented at
IAT? (Tick where appropriate)
0 ( ) 1 ( ) 2 ( ) 3 ( ) 4( ) 5 ( ) 6 ( ) 7 ( ) 8 ( ) 9 ( ) 10 ( )
No implementation Full Implementation
30. How do you rate performance of IAT as an institution of choice by learners on a scale
of 0-10? (Tick where appropriate)
0 ( ) 1 ( ) 2 ( ) 3 ( ) 4( ) 5 ( ) 6 ( ) 7 ( ) 8 ( ) 9 ( ) 10 ( )
Extremely low Extremely high
31. How do you rate IAT in terms of timely completion of courses by students, on a scale
of 0-10?
0 ( ) 1 ( ) 2 ( ) 3 ( ) 4( ) 5 ( ) 6 ( ) 7 ( ) 8 ( ) 9 ( ) 10 ( )
Extremely poor Excellent

95
32. How do you rate the quality of IAT graduates on a scale of 0-10?
0 ( ) 1 ( ) 2 ( ) 3 ( ) 4( ) 5 ( ) 6 ( ) 7 ( ) 8 ( ) 9 ( ) 10 ( )
Extremely low Extremely high
33. How do you rate IAT in terms of preference of its graduates by employers, on a scale
of 0-10?
0 ( ) 1 ( ) 2 ( ) 3 ( ) 4( ) 5 ( ) 6 ( ) 7 ( ) 8 ( ) 9 ( ) 10 ( )
Not preferred Most preferred

96
Appendix IV. Questionnaire for Students This questionnaire aims at collecting data for the study entitled: Influence of Total Quality
Management Implementation on Performance of Institutions of Higher Learning: The
Case of Institute of Advanced Technology in Kenya. Total Quality Management (TQM) is a
structured system for meeting and exceeding customer needs and expectations by creating
organization-wide participation in the planning and implementation of improvement (continuous
and breakthrough) processes.
This questionnaire forms an integral part of the study and the respondents are kindly requested to
complete and give any additional information they might feel is necessary for the study. The data
required is for academic purposes only and will be treated with strict confidentiality. (Please be
as objective as possible)
Part A: General Information
1. Branch name………………………………………………………………...................
2. Course being taken at the Institute.................................................................................
3. How long have you been at the Institute ………………………………………………
4. Respondent’s gender (Please tick one)
a) Male ( ) b) Female ( )
5. Which one of the following age groups do you belong to? (Please tick one)
a) 18-25 yrs.( ) b) 25-40 yrs.( ) c) 40-55 yrs ( ) d) over 55 yrs ( )
Part B: Student Involvement
6. Does the Institute have a clearly stated Vision, Mission and Values in place? (Please tick
one)
a) Yes ( )
b) No ( )
c) I do not Know ( )
7. To what extent do you understand IAT’s Vision, Mission and Values? (Please tick one)
a) Fully conversant ( )
b) Somewhat understand ( )
c) Barely understand ( )

97
d) Don’t understand ( )
8. How does the Institute ensure the Vision, Mission and Values are shared with students
a) Through forums ( )
b) Training ( )
c) Orientation ( )
d) Using other means of communication ( )
e) I don’t know ( )
For d) please specify the means
................................................................................................................................................
................................................................................................................................................
..............................................................................................................................................
9. Do you have student representatives that represent your concerns to the IAT
management? (Please tick one)
a) Yes ( )
b) No ( )
c) I do not Know ( )
10. If yes, how were these representatives elected?
a) Simple majority vote by students in your class ( )
b) Elected by the Institute’s management ( )
c) I do not know ( )
11. How adequate are the mechanisms put in place to promote or ensure succession planning
within the governance and management structures in the student bodies
a) Very adequate ( )
b) Adequate ( )
c) Not adequate ( )
12. How well do front office staff respond to your queries
a) Excellent ( )
b) Very Good ( )
c) Fair ( )
d) Poor ( )
13. What is the involvement of students in IAT marketing activities like open days

98
a) Excellent ( )
b) Very Good ( )
c) Fair ( )
d) Poor ( )
14. On a scale of 0-10, rate the extent to which students are involved in the implementation of
TQM at the Institute? (Tick where appropriate)
0 ( ) 1 ( ) 2 ( ) 3( ) 4 ( ) 5 ( ) 6 ( ) 7 ( ) 8 ( ) 9 ( ) 10 ( )
To a very small extent To a large extent
Part C: Total Quality Management
15. In your opinion, does IAT have checks to ensure quality of their programmes is maintained?
(Please tick one)
a) Yes ( )
b) No ( )
c) I do not Know ( )
16. What levels of Quality do you observe in these programmes?
a) Very High ( )
b) High ( )
c) Satisfactory ( )
d) Poor ( )
17. How do you rate performance of IAT as an institution of choice by learners on a scale of 0-
10? (Tick where appropriate)
0 ( ) 1 ( ) 2 ( ) 3 ( ) 4( ) 5 ( ) 6 ( ) 7 ( ) 8 ( ) 9 ( ) 10 ( )
Extremely low Extremely high
18. How do you rate IAT in terms of timely completion of courses by students, on a scale of 0-
10?
0 ( ) 1 ( ) 2 ( ) 3 ( ) 4( ) 5 ( ) 6 ( ) 7 ( ) 8 ( ) 9 ( ) 10 ( )

99
Extremely poor Excellent
19. How do you rate the quality of IAT graduates on a scale of 0-10?
0 ( ) 1 ( ) 2 ( ) 3 ( ) 4( ) 5 ( ) 6 ( ) 7 ( ) 8 ( ) 9 ( ) 10 ( )
Extremely low Extremely high
20. How do you rate IAT in terms of preference of its graduates by employers, on a scale of
0-10?
0 ( ) 1 ( ) 2 ( ) 3 ( ) 4( ) 5 ( ) 6 ( ) 7 ( ) 8 ( ) 9 ( ) 10 ( )
Not preferred Most preferred
21. On a scale of 0-10, how would you rate the extent to which TQM has been implemented
at IAT? (Tick where appropriate)
0 ( ) 1 ( ) 2 ( ) 3( ) 4 ( ) 5 ( ) 6 ( ) 7 ( ) 8 ( ) 9 ( ) 10 ( )
No implementation Full implementation