influence of training on the performance of non …
TRANSCRIPT

INFLUENCE OF TRAINING ON THE PERFORMANCE
OF NON-TEACHING EMPLOYEES AT MANAGEMENT
LEVEL IN SELECTED PUBLIC UNIVERSITIES IN
KENYA
KHAKAYI, SCHOLASTICA WAMWAYI
DOCTOR OF PHILOSOPHY
(Human Resource Management)
JOMO KENYATTA UNIVERSITY OF AGRICULTURE
AND TECHNOLOGY.
2016


Influence of training on the performance of non-teaching employees
at management level in selected public universities in Kenya
Khakayi, Scholastica Wamwayi
A thesis submitted for the award of the degree of doctor of
philosophy in human resource management in the Jomo Kenyatta
University of Agriculture And Technology.
2016

ii
DECLARATION
This Thesis is my original work and has not been presented for a degree in any other
university
Signature ……………………………….. Date …………………………………
Khakayi Scholastica Wamwayi
This Thesis has been submitted for examination with our approval as University
Supervisors
Signature ………… ……………………… Date …………………………………
Dr. Iravo M. Amuhaya, PhD.
JKUAT, Kenya
Signature ………………………………… Date ……………………………………
Prof. Elegwa Mukulu, PhD.
JKUAT, Kenya
Signature ……………………………… Date ……………………………………
Dr. Gichuhi A. Waititu, PhD.
JKUAT, Kenya

iii
DEDICATION
I dedicate this study to my four sons Boaz, Charles, David and Nelson, for their
patience, understanding and cooperation as the study took most of the time for
family.

iv
ACKNOWLEDGMENTS
I acknowledge the three supervisors Dr. Iravo M. Amuhaya; Prof. Elegwa Mukulu;
and Dr Gichuhi A. Waititu, who were ready to guide me through the study with a lot
of patience and understanding. I also acknowledge Dr. Ombui Kepha for being there
for consultations and my research assistants Nigel, K. and David Nashon for running
my errands swiftly. My gratitude goes to Nelson, Boaz and Dora, and Charles and
Cate for their persistent encouragement. Lastly I acknowledge my father and mother
for endeavoring to show me the academic world.

v
TABLE OF CONTENTS
DECLARATION .............................................................................................................. ii
DEDICATION ................................................................................................................. iii
ACKNOWLEDGMENTS .............................................................................................. iv
ACRONYMS AND ABBREVIATIONS ...................................................................... xv
OPERATIONAL DEFINITION OF TERMS: .......................................................... xvi
CHAPTER ONE .............................................................................................................. 1
INTRODUCTION ............................................................................................................ 1
1.1 Background of the Study .......................................................................................... 1
1.2 Statement of the Problem ..................................................................................... 11
1.3 Objectives of the Study .......................................................................................... 12
1.3.1 General Objective. .............................................................................................. 12
1.3.2 Specific Objectives. ............................................................................................ 13
1.4 Hypotheses ............................................................................................................. 13
1.5 Justification ............................................................................................................ 14
1.6 Scope of the Study .................................................................................................. 15
CHAPTER TWO ......................................................................................................... 16
LITERATURE REVIEW ............................................................................................. 16
2.1 Introduction .......................................................................................................... 16
2.2 Theoretical Review ................................................................................................ 16
2.2.1 Reinforcement Theory ........................................................................................ 16

vi
2.2.2 Social Learning Theory ..................................................................................... 18
2.2.3 Goal Setting Theory ........................................................................................... 24
2.2.4 Adult Learning Theory ...................................................................................... 26
2.3 Conceptual Framework ........................................................................................... 27
2.3.1 Training Needs Assessment ................................ Error! Bookmark not defined.
2.3.2 Mode of Training ............................................................................................... 30
2.3.3 Training Duration ............................................................................................ 32
2.3.4 Training feedback .............................................................................................. 33
2.3.5 Motivation .......................................................................................................... 34
2.3.6 Employee Performance ...................................................................................... 35
2.4 Empirical Review ................................................................................................... 36
2.5 Critique of the Existing Literature relevant to the study ........................................ 39
2.6 Research Gaps ........................................................................................................ 43
CHAPTER THREE ....................................................................................................... 46
RESEARCH METHODOLOGY .................................................................................. 46
3.1 Introduction ............................................................................................................. 46
3.2 Research Design ..................................................................................................... 46
3.3. Population .............................................................................................................. 47
3.4. Sampling Frame ..................................................................................................... 50
3.5 Sample size and Sampling Technique .................................................................... 50
3.6 Data Collection Instruments ................................................................................... 52

vii
3.7 Data Collection Procedures .................................................................................... 53
3.8 Pilot Testing ........................................................................................................... 54
3.9 Data Analysis and Presentation .............................................................................. 55
3.9.1 Data Analysis...................................................................................................... 55
3.9.2 Data Presentation ................................................................................................ 57
3.9.3 Measurement of variables................................................................................... 57
CHAPTER FOUR ....................................................................................................... 60
RESEARCH FINDINGS, ANALYSIS AND DISCUSSIONS ................................... 60
4.1 Introduction ....................................................................................................... 60
4.2 Response rate .......................................................................................................... 60
4.3 Results of Pilot Testing .......................................................................................... 61
4.3.1 Reliability of the instruments ............................................................................. 62
4.4 Respondents demographic information .................................................................. 63
4.4.1 Gender of Respondents....................................................................................... 63
4.4.2 Age of Respondents ............................................................................................ 64
4.4.3 Level of Education ............................................................................................. 65
4.4.4 Departments ........................................................................................................ 66
4.4.6 Experience .......................................................................................................... 67
4.4.7 Number of trainings attended ............................................................................. 68
4.4.8 Mode of Training ................................................................................................ 69
4.4.9 Exposure to Training .......................................................................................... 69

viii
4.4.10 Duration of attended Trainings. ....................................................................... 70
4.4.12 Short training Attended .................................................................................... 71
4.4.13 Length of short Trainings ................................................................................ 72
4.4.14 Promotion attained after Training .................................................................... 73
4.4.15 Impact of performance after Training .............................................................. 73
4.4.16 Advantages of e-learning ................................................................................. 74
4.4.17 Contribution of Management ........................................................................... 74
4. 5 Factor Analysis ...................................................................................................... 75
4.5.1 Factor analysis for Training Needs Assessment .................................................. 75
4.5.2 Factor analysis for Mode of training .................................................................. 76
4.5.3 Factor Loading for Training Duration ............................................................... 78
4.5.4: Factors Loading for Training Feedback ........................................................... 79
4.5.5. Factor Loading for Motivation.......................................................................... 80
4.5.6. Factor Loading for Performance ....................................................................... 81
4.6. Descriptive Statistics ............................................................................................. 82
4.6.1. Training Needs Assessment .............................................................................. 82
4.6.2 Mode of Training ............................................................................................... 87
4.6.3 Training Duration .............................................................................................. 95
4.6.4 Training Feedback ............................................................................................. 99
4.6.5 Motivation ........................................................................................................ 104
4.6.6 Performance of non-teaching employees ......................................................... 109

ix
4.7. Correlation between Independent variable constructs and dependent variable .. 115
4.8 Diagnostics tests (Assumptions of regression analysis) ....................................... 116
4.8.1 Shapiro-Wilk Normality tests ........................................................................... 116
4.8.2 Tests for Multicollinearity ................................................................................ 117
4.8.3 Tests for Heteroscedasticity ............................................................................. 117
4.9 Linear regression analysis .................................................................................... 117
4.9.1 Objective 1: Training needs assessment ........................................................... 118
4.9.2 Objective 2: Training mode .............................................................................. 119
4.9.3 Objective 3: Training duration ......................................................................... 120
4.9.4 Objective 4: Training feedback ........................................................................ 121
4.9.5 Objective 5: Motivation .................................................................................... 123
4.10 Optimal Model ................................................................................................... 135
CHAPTER FIVE ......................................................................................................... 137
SUMMARY, CONCLUSION AND RECOMMENDATIONS ................................ 137
5.1 Introduction .......................................................................................................... 137
5.2.1 Influence of training needs assessment on performance of non-teaching
employees at management level in selected public universities in Kenya ................ 137
5.2.2 Influence of mode of training on performance of non-teaching employees at
management level in selected public universities in Kenya ...................................... 138
5.2.3 Influence of training duration on performance of non-teaching employees at
management level in selected public universities in Kenya ...................................... 138
5.2.4 Influence of Training feedback on performance of non-teaching employees
at management level in selected public universities in Kenya .................................. 139

x
5.2.5 Influence of motivation in moderation of the relationship between training
and performance of non-teaching employees at management level in selected
public universities in Kenya...................................................................................... 139
5.3 Conclusions........................................................................................................... 140
5.4 Recommendations ................................................................................................. 140
5.4.1 Training Needs Assessment. .......................................................................... 140
5.4.2 Training Mode. ................................................................................................ 140
5.4.3 Training Duration. ......................................................................................... 141
5.4.4 Training Feedback. .......................................................................................... 141
5.4.5 Motivation ...................................................................................................... 141
5.5 Areas for further research ..................................................................................... 141
APPENDICES .................................................................... Error! Bookmark not defined.

xi
LIST OF TABLES
Table 3.1: Study Population ...................................................................................... 28
Table 3.2: List of Eight Universities in Target Population ....................................... 28
Table 3.3: Sample Size .............................................................................................. 32
Table 3.4: Measurement of Variables ........................................................................ 37
Table 4.1: Rate of Responses ..................................................................................... 39
Table 4.2: Reliability statistics ................................................................................... 40
Table 4.3: Reliability statistics of all variables .......................................................... 41
Table 4.4: Education Levels ...................................................................................... 43
Table 4.5: Departments of Respondents ................................................................... 44
Table 4.6: Cadre ........................................................................................................ 44
Table 4.7: Exposure to Training ............................................................................... 47
Table 4.8: Complaints Experienced During Training Sessions ................................ 49
Table 4.9: Contribution of Management/Leadership ................................................ 53
Table 4.10: Factor Loading for Training needs Assessment .................................... 54
Table 4.11: Factor Loading for Mode of Training .................................................... 55
Table 4.12: Factor Loading for Training Duration ................................................... 56
Table 4.13: Factor Loading for Training Feedback .................................................. 57
Table 4.14: Factor Loading for Motivation .............................................................. 58
Table 4.15: Factor Loading for Performance ............................................................ 59
Table 4.16: Training Needs Assessment ................................................................... 60

xii
Table 4.17: Descriptive Statistics on Training Needs Assessment ........................... 64
Table 4.18: Mode of Training ................................................................................... 65
Table 4.19: Descriptive Statistics on Training Mode ................................................ 71
Table 4.20: Training Duration ................................................................................... 72
Table 4.21: Descriptive Statistics on Training Duration ........................................... 75
Table 4.22: Training Feedback .................................................................................. 76
Table 4.23: Descriptive Statics on Training Feedback .............................................. 81
Table 4.24: Motivation .............................................................................................. 82
Table 4.25: Descriptive Statistics on Motivation ...................................................... 87
Table 4.26: Performance of Non-Teaching Employees ............................................ 88
Table 4.27: Descriptive Statistics on Employee Performance .................................. 93
Table 4.28: Correlation between Independent variable constructs and dependent
variable ...................................................................................................................... 94
Table 4.29: Shapiro-Wilk Normality Test the study Constructs ............................... 94
Table 4.30: Linear regression analysis for employee performance and training needs
assessment ................................................................................................................. 96
Table 4.31: Linear regression for training mode and employee performance .......... 97
Table 4.32: Linear regression for training duration and employee performance ...... 98
Table 4.33: Linear regression for training feedback and employee performance ..... 99
Table 4.34: Multiple regression for employee performance ................................... 100
Table 4.35: Linear regression for motivation and employee performance ............. 102
Table 4.36: Coefficients of Motivation and Training Duration ............................... 103

xiii
Table 4.37: Interaction Effect Coefficient of Motivation and Training Duration ... 104
Table 4.38: Coefficients of Motivation and Training Mode .................................... 104
Table 4.39: Interaction Effect of Motivation and Training Mode ........................... 105
Table 4.40: Coefficients of Motivation and TNA .................................................... 106
Table 4.41: Interaction Effect of Motivation and TNA ........................................... 107
Table 4.42: Coefficients of Performance and Training Feedback ........................... 107
Table 4.43: Interaction effect of Motivation and Training Feedback ...................... 108
Table 4.44: Model Summary without Constant ....................................................... 109
Table 4.45: Model Summary with constant and without constant in model 2 ........ 111

xiv
LIST OF FIGURES
Figure 2. 1: Conceptual Framework……. ........................................................................ 16
Figure 4. 1: Gender of Respondents ................................................................................. 41
Figure 4. 2: Age in Years ................................................................................................. 42
Figure 4. 3: Years of Experience ...................................................................................... 45
Figure 4. 4: Frequency of Training Needs ....................................................................... 46
Figure 4. 5: Mode of Training .......................................................................................... 46
Figure 4. 6: Duration of attended Training ....................................................................... 48
Figure 4. 7: Short Training Attended ............................................................................... 50
Figure 4. 8: Length of Short Training .............................................................................. 51
Figure 4. 9: Promotion attained after Training ................................................................. 51
Figure 4. 10: Impact of Performance after Promotion ..................................................... 52
Figure 4. 11: Advantages of E-Learning .......................................................................... 52
LIST OF APPENDICES
Appendix 1: Letter of introduction………………………...………………………173
Appendix 2: Survey Questionnaire………………………………………………...174
Appendix 3: Supervisor Interview guide…………………………………………..191
Appendix 4: List of Public Universities……………………………………………192

xv
ACRONYMS AND ABBREVIATIONS
CBT : Computer Based Training
CD ROMs : Compact Disc- Read only Memory
COMESA : Community Members of Eastern and Southern Africa
DVD : Digital Versatile Disc
E-Learning : Electronic Learning
HR : Human Resource
I LO : International Labor Organization
JKUAT : Jomo Kenyatta University of Agriculture and
Technology
K U : Kenyatta University
MBO : Management By Objectives
MMUST : Masinde Muliro University of Science and Technology
OJT : On the Job Training
PDAs : Personal Digital Assistants
SMART Goal : Specific, Measureable, Attainable, Realistic, Time
Targeted Goals
U.O.N : University of Nairobi

xvi
OPERATIONAL DEFINITION OF TERMS:
Coaching: Refers to communicating with an employee for
improving on the job performance or behavior and is
a form of systematic feedback intervention designed
to enhance employees’ professional skills,
interpersonal awareness and personal effectiveness
(Mwesigwa, 2010).
Development Refers to systematic efforts affecting individual
knowledge or skills for purposes of personal growth
or future jobs and roles (Appiah, 2010).
Employee Absenteeism Refers to voluntary non-attendance at work, without
valid reason. It may mean either habitual evasion of
work, or willful absence as in a strike action. It does
not include involuntary or occasional absence due to
valid reason, or reasons beyond one’s control, such as
sickness or accidents (Gamage, & Imbulana, 2013).
Learning Refers to the means by which a person acquires and
develops new knowledge, skills, capabilities
behaviors and attitudes (Truitt, 2011).
Mentoring Refers to the way learning is facilitated in the
workplace, and is designed to make use of guided
learning to develop the knowledge and skills required
for high performance (Noe, 2010)
Motivation Refers to the process in which an individual wishes
and decides to act in a specific way of people (Opu,
2008).

xvii
Off the job Training Refers to a form of learning administered away from
the place of work hence reduces on disruptions. It is
productive due to nature of interaction and
involvement experienced (Ongori & Nzonzo, 2011)
Training Effectiveness Refers to the study of individual, group or
organizational level factors that influence learning in
training and transfer after training (Aguinis &
Kraiger, 2009).
Training Evaluation Refers to the systematic investigation of whether a
training program resulted in knowledge, skills, or
affective changes in learners (Mullins, 2009).
Training: Refers to planned effort by an organization to
facilitate employees’ learning, concerning job-related
competencies such as knowledge, skills, and attitudes
that are critical for successful job performance
(Armstrong, 2009).
Training Needs Assessment Refers to a process of identifying performance
requirements and the knowledge, skills, and abilities
needed by an organization’s workforce to achieve the
requirements (Nyongesa, et al. 2014).
Mode of Training Refers to a particular type, or technique of training
(Hornby, 2002)
Training Duration The amount of time (days) dedicated to deliver
learning content (Tracey, 2015)
Training Feedback Refers to information that employees receive while
they are performing how well they are meeting
objectives (Noe, 2010).

xviii
Motivation Refers to strength and direction in behavior and the
factors that influence people to behave in certain
ways. It can also refer to goals that individuals have
and how individuals choose their goals, and ways in
which others try to influence their behavior
(Armstrong, 2009).
Performance Refers to how well employees perform on the job and
assignments given to them against the accepted
performance standards set by the organization
(Appiah, 2010)
Non-teaching employees at management level Refers to employees within grades 13, 14
and 15. They include Senior Assistant Registrars,
Deputy Registrars and Registrars (University statute)

xix
ABSTRACT
The aim of this study was to establish the influence of training on the performance of
non-teaching employees at management level in selected public universities in
Kenya. The scarcity of contemporary literature necessitated this study since most
studies on university deal with teaching employees while the category of non-
teaching employees at management level has been marginalized. Limited finances
have forced universities to cut on training budgets thus making maintenance and
improvement of quality of services a challenge. The objectives were: to determine
the influence of Training Needs Assessment on the performance of non-teaching
employees at management level in selected public universities in Kenya, to establish
the influence of mode of training on the performance of non-teaching employees at
management level in selected public universities in Kenya, to determine the
influence of duration of training on the performance of non-teaching employees at
management level in selected public universities in Kenya , to evaluate the influence
of training feedback on the performance of non-teaching employees at management
level in selected public universities in Kenya and to establish the influence of
motivation in moderation of the relationship between training and performance of
non-teaching employees at management level in selected public universities in
Kenya. The study was conducted in eight of the twenty-two public universities in
Kenya. The study was both qualitative and quantitative. Qualitative due to
descriptive statistics which were used in interpreting data and quantitative due to data
obtained from questionnaires that was interpreted using statistical packages like
SPSS V 20, and Stata V 12, and analysis was done by regression. The study
employed survey and co-relational design methods. The study used open and closed
ended questionnaires and a Likert measurement scale of 1 to 5 which were
administered to 176 non-teaching employees at management levels in selected public
universities. The 176 non-teaching employees were selected through purposive and
stratified random sampling technique. Regression analysis was used to quantitatively
determine relationships between the independent and dependent variables. Data was
presented in pie-charts, histograms, bar-graphs, figures and tables. The study results
revealed that Training needs assessment; Training duration, Training mode and

xx
Training feedback were statistically significant and therefore had a significant
influence on the performance of the non-teaching employees at management level in
selected public universities in Kenya. Motivation has a significant moderating effect
on all the variables. Public universities should continue administering TNA to
employees to help identify areas affecting staff and recommend trainings to bridge
the gap between what is happening and what is expected. Public universities should
recognize the effect of globalization and step up computer/web based
training/awareness to all employees, in order to survive in this competitive era.
Programs should be well designed and take adequate duration to enable appropriate
evaluation and timely training feedback should be conveyed to employees after
attending trainings. Public universities should as well consider effecting timely
financial and non-financial benefits to employees

1
CHAPTER ONE
INTRODUCTION
1.1 Introduction
The purpose of this chapter is to orient the reader to the content of the research
report. In addition, it states the problem, research objectives and reasons why it is
important to do the research.
1.1.1 Background of the Study
Kenya Vision 2030 intends to create a globally competitive and adaptive human
resource base to meet the requirements of a rapidly industrializing economy. To
achieve this much needs to be done through life-long training and education
(Republic of Kenya, 2007). Human Resource must be invested in and leveraged
efficiently in order for it to generate returns, for the individuals involved as well as
an economy as a whole. World Economic Forum reported that the global economy is
entering an era of talent scarcity that, if left unaddressed, will hinder economic
growth worldwide (Odhong, 2015). Human capital investment is one of the key
factors in combating high and persistent unemployment and problems of low pay and
poverty (Ogunade, 2011).
Employee training is an envied undertaking in the university, and it is believed that
training will aid performance output due to acquired skills, technology and
knowledge (Odinga, 2010). Organizations that extensively train their employees
create a reputation for valuing and developing employees and are able to attract a
cadre of highly skilled employees (Kipkebut, 2010). It is imperative that the
institutions of higher learning or businesses whose goals are to survive and prosper
invest in training and development to improve production and acquire great returns
in the investment of human capital (Truitt, 2011). Human capital model is based on
the premise that additional non-compulsory training increases the productivity of
labor in a perfectly competitive market (Omolo, 2014).

2
According to Akala (2010), training is crucial for the development of non-teaching
employees. HR activities such as job training, coaching, mentoring, counseling, and
general career development enable employees get support, knowledge, abilities that
promote chances of being employed, and remain marketable. Employability includes
skills, knowledge and competencies that enhance a worker’s ability to secure and
retain a job, progress at work and cope with change, secure another job if he or she
so wishes or has been laid off, and enter more easily into the labour market at
different periods of his or her lifecycle (Franz & Omolo, 2014).
Odhiambo and Waiganjo (2014), Kipkebut (2010), state that the influence of non-
teaching employees who they refer, to as “invisible workers” have been marginalized
in scholarly contributions. Their work is mostly administrative and entails supporting
the work of teaching staff, dealing with student non-academic matters, and working
in administrative functions such as finance, HR, Marketing, University Corporate
Department and many other sections.
Training is well suited for making clear contribution to enhance human well-being
and performance in work places and society as a whole. American Society for
Training and development spent over 126 Billion dollars annually on employee
training and development (Aquinis & Kraiger, 2009). In recent years, American
companies have been encouraged to embrace a variety of performance-enhancing or
progressive human resource management (HRM) practices such as training; so as to
improve their competitiveness in the global marketplace Mitiku (2015), Weil &
Woodland (2005) argued that training falls under HRD function which has been
agreed to be an important function of HRM. HRM activities are considered as a gift
in the eyes of employees and training is one of them (Mahbuba, 2013).
Iqbal et., al. (2014) argued that training has positive impact on employees’
performance in the context of “Telecommunication Sector” in Pakistan. They pointed
out the significance of training for human development. In the research paper, they
acknowledged that training is more important for the achievement and progress of
the establishments. Training is, therefore essential to improve the awareness, abilities

3
and assertiveness of the workers as well as creates an opportunity for workers to
obtain additional information based on the training.
In addition, Khan et., al. (2014), indicated that there is a significant relationship
between organizational performance in the oil and gas industry in Pakistan and
recruitment and selection; training and development; performance appraisal;
compensation and rewards; and employee participation. He further suggested that
management get the desired results of assigned tasks through effective training
programs.
Training activities positively impact on performance of individuals and teams,
therefore benefits accrue from outcomes of training for both individuals and teams,
such as attitudes, motivation and empowerment. Such changes result in improved job
performance and acquisition of new skills (Armstrong, 2009; Mullins, 2010). Not all
employees will come to the job with complete knowledge and experience necessary
for performing assigned tasks and therefore they must be trained so as to acquire the
necessary knowledge and skills (Buyens, 2010). It is for this reason that a study
within Kuala Lumpur by Juhary (2000), argued that most organizations consider the
development of human resources as important investment efforts towards the
development of the performance of the organization. The main method suggested for
human resource development is the provision of training.
A study on the “value of training on motivation among health workers in Narok
county argued that there is a relationship between training and motivated health
workforce in Narok County (Osoro, 2016). In the same breadth, a comparison of the
motivations of small business owners in Africa by Benzing and Chu (2009) revealed
that motivational factors significantly contributed towards the good performance of
an organization. These motivational elements can be acquired in different ways, one
of which is training. According to Mulwa (2003) motivation is the key for the
productivity, profitability and sustainability of every institution and it ought not to be
a one off undertaking but a continuous undertaking by management as long as the
organization does exist.

4
Tsai et al. (2007), state that, commitment is a product of adequate training and
development which aim at job completion hence increases job performance. In this
case, the gap between skills, abilities, knowledge of organizational goals and
objectives required to perform a task and the actual skills available for performing a
task should be minimized to provide job satisfaction, reduce turnover and enhance
job performance. A satisfied worker is bound to be committed and perform better at
work. In addition (Farooq & Khan, 2011), allude that lack of skills can lead to lack of
job satisfaction leading to dismal performance and expose business to a lesser
advantageous position, hence, competitive disadvantage.
Ajibade & Ayinla (2014), study made public that several advantages can be achieved
through training, including the enhancement of job satisfaction among employees, in
addition to commitment and collective empowerment. Meanwhile, Garcia (2005)
posed that training leads to employee, client and shareholder satisfaction. Training
for organizational staff ensures that service provided to the customer is at the most
satisfactory level.
According to Truitt (2011), 86% of the employees who updated training had the most
positive attitudes toward training. However, 80% of those with negative training
attitudes had negative views on their proficiency. In this case, employees could
perform better at work due to training and practice which had enabled them the
proficiency. Such employees, who train, have the skills and are proficient, will exude
confidence and perform better giving rise to high individual and organizational
productivity and performance. Training that is of importance is one that is geared
towards employees acquiring skills to improve organizations and university overall
objectives and goals.
Susan (2013) study on “Capacity Building in the Public Service in Kenya: An
Evaluation of the Senior Management Course” revealed that training in Senior
Management Course improved the leadership, financial and managerial skills of
participants. This position is also supported by Odhon’g (2015) who argues that there
is a positive significant relationship between human capital investment and
organizational performance.

5
According to Anne et., al. (2015), employee empowerment (autonomy, decision
making, information sharing and training) has a significant effect on organization
performance. Employees who receive specific training for instance, on-the-job
training are likely to stay, than those who do not attend such trainings (Brum, 2007).
In a study within Botswana-Gaborone, Ongori and Nzonzo (2011), state that
contribution and improvement of organizational performance is primarily through
developing people as individuals, work groups and members of the wider
organization. Training, therefore, is intended to raise effective employees to meet the
exigencies of organizations dynamic environment. The employees acquire more
knowledge, skills and attitudes to help improve their performance in the
organization.
Use of management inventory charts, company tours for newly recruited graduates,
replacement, rotation programs and a series of formal courses that characterize
training and development, seem to be a mechanical process. In multinational
companies, training can provide an important impetus to achieve shared values and
to facilitate network building between headquarters and subsidiaries. This decision
was also supported by Ngo et al. (2010) and Paul (2003) whom in their paper on
“Human resource practices of firm performance of multinational corporations” stated
that staff efficiency improvement, leads to better service after purchase and customer
satisfaction.
Training of employees in universities, increases productivity through better job
performance, more efficient use of human resources, attainment of goals and
objectives, reduced costs due to less labor turnover, reduced errors, reduced
accidents and absenteeism, more capable workforce and retention of existing staff
(Ongori & Nzonzo, 2011). Similarly, Echard and Berge (2008), observes that
effective training techniques can produce significant business results especially in
customer service, product development and capability in obtaining new skills. He
continues to argue that linkage of training to business strategy has given many
businesses the needed competitive edge in today’s global market. Training also
improves the culture of quality business workforce and final product (Ongori &
Nzonzo, 2011). This argument has been confounded by Roomi et al., (2009) who

6
stated that training is mainly geared towards building entrepreneurial skills and traits
of the recipients in order to better their businesses practices
According Truitt (2011), organizations can adopt various HRM practices such as
training to enhance employee skills. Efforts can focus on improving the quality of the
individuals hired, or on raising the skills and abilities of current employees, or on
both. Product innovation and product quality can be positively affected by training
(Katou, & Budhwar, 2007). In support of this, a study by Azara et al. (2013) affirmed
significant and positive association between training and development of new
products and trustful relationship. Furthermore, an empirical assessment on the
relationship between human resource practices and firm performance in Malaysia-
(Osman et al, 2011) also acknowledged that training contributes significantly to the
performance of an organization, implying an affirmative link sandwiched between
human resource systems and organizational performance.
According to a study in Ethiopia by Mitiku (2015), training and development
positively correlated and was statistically significant with employee performance and
effectiveness. This relationship was tested for causality using linear regression
statistical model and found out employee effectiveness had a direct cause and effect
relationship with employee performance, and training and development.
Dessler (2005) postulated that having high quality employees, puts an organization in
a competitive advantage over others even if it were in the same industry. Inadequacy
of expertise is a major constraint; therefore, organizations are assertive in organizing
training programs for their employees. Training is of benefit both to employee and
the organization. In this case, training becomes an opportunity leading to promotion,
self-improvement, job satisfaction, better job performance, a chance to learn new
things and greater ability to adapt and cope with change (Ongori & Nzonzo, 2011).
Dessler (2005) continues to state that once a decision of training is made and training
needs and goals have been identified, then designing of training programs should
follow. Failure to conduct training need assessment or identification of skill deficits
leads to poor performance; as conferred by Ongari and Tari (2015), who argued that
Kenya electricity generating and distribution firms lacked clear policies governing

7
training and development and this had a negative effect on organizational
performance.
According to a study by Guerrero and Sire (2001), comprehensive training design
structure is capable of improving productivity and encouraging better product
performance and quality. Additionally, Obisi (2011) in his paper ‘employee training
and development in Nigerian organizations, emphasized that organization should
properly evaluate their training program so that their organization objectives and
missions are achieved. Training can not only change the ability of workforce in
performing their current job but also aids them in the fulfillment of future expected
task.
The organization may use on the job or off the job training methods and the trainers
may be sourced from in-house or externally or use a combination of both sources.
Tukunimulongo (2016) study on Mumias Sugar, deduced that on-the-job-training
programs enhance employee performance in public organization. Similar findings
were also observed by Kasau (2014) who argued that training is central in
determining employee performance especially in service firms under which micro-
finance institutions fall. The research further confirmed that training has a big
influence on performance with attitude, job satisfaction and service delivery equally
getting the same weight.
In reference to studies by Swart et al. (2005), organization management ought to
adopt training interventions to bridge the gap between desired and actual
performance. Bridging the performance gap involved adopting a particular training
intervention aimed at changing specific skills and attitudes of the employees.
Ayodeji et., al. (2011), argues that there is evidence revealing that commendations
have conquered the fact that high commitment work practices improve performance,
labor productivity and the quality of service, although other researchers maintained a
different view. They argue that majority of previous studies looked at high
commitment work practices from the employees’ perspective; therefore
overdependence on such perspectives can sometimes be misleading and may not
present the real impact on organizational performance. Further, it is maintained that,

8
when employees positively interpret high commitment work practices, it will
sequentially increase their commitment to the organization thereby increasing their
individual performances. Companies that seek to achieve organizational goals
through a variety of human resource strategies and approaches in ensuring employee
commitment and retention lies in the strategic approach utilized. Training may be
used to ensure that an employee remains in the company by employers implementing
a strategy of training that fosters commitment. Committed employees will work hard
and boost productivity at individual and organizational performance level. When an
organization trains an employee he or she is bound to reciprocate by exerting more
effort, become more productive and have greater sense of debt to the organization
(Brum, 2007). The impact of training will be felt if its values lie in the part it will
play in the integrated Human Resource Management (HRM) strategy, especially if
there is a lot of investment in quality and flexibility of workforce.
Training and development is envisaged as the process of systematically developing
expertise in individuals for the purpose of improving performance (Swanson, 2001),
since an organization is seen as an amalgamation of many interactive systems and
sub systems. In an organization, there are inputs, processes and outputs. Employees
come in, are trained, acquire knowledge and skills which they use in production
processes. The employees turn out to be better after training, perform better and
increase both individual and company performance, culminating in high productivity
and output.
Afshan et., al. (2012), define performance as the achievement of specific tasks
measured against predetermined or identified standards of accuracy, completeness,
cost and speed. Employee performance can be manifested in improvement in
production, easiness in using the new technology and highly motivated workers.
Employee performance is normally looked at in terms of outcomes. However, it can
also be looked at in terms of behavior (Armstrong 2000). There are a number of
performance standards that can be taken into consideration when measuring
performance for example using of productivity, efficiency, effectiveness, quality and
profitability measures (Ahuja, 2006).

9
1.1.2: Brief on Kenya’s public universities
Higher education in Kenya can be traced back to 1922 when the then Makerere
College in Uganda was established as a small technical college which was then
expanded to meet the needs of the three East African countries i.e. Kenya, Uganda
and Tanganyika and Zanzibar, as well as Zambia and Malawi. In the 1940s and early
50s it is only this college that was providing university education in East Africa. This
lasted until 1956 when the Royal Technical College was established in Nairob In
1963, the Royal Technical College became the University College, Nairobi, i.
following the establishment of the University of East Africa with three constituent
colleges in Nairobi, Dar es Salaam and Kampala (Makerere). The University of East
Africa offered programmes and degrees of the University of London till 1966. In
1970, the University of East Africa was dissolved to create three autonomous
universities of Nairobi, Dar es Salaam and Makerere (Chacha, 2004). The University
of Nairobi was thus established as the first university in Kenya offering degrees in
Bachelor of Arts, and Bachelor of Science in Engineering under the University of
London (Kipkebut, 2010).
Kenyatta College that offered Diploma education became a constituent college of
Uon. Since 1980, a great expansion of public universities was experienced and, with
high demand for university education, six more universities were established for
instance Moi University was established in 1984, following recommendation of a
working presidential party chaired by Professor MacKay. Kenyatta University was
elevated to university status in 1985, and is well known for offering degrees in
education.
Following the same demand for university expansion and for reasons of political
expediency, two more universities were set up within two years: Egerton University
and Jomo Kenyatta University of Agriculture and Technology. Between that time to
the present, two other universities have been established: Maseno University and
Masinde Muliro University (Odhiambo, 2011). About twenty three private
universities were also established to help to alleviate the pressure of demand for

10
university education in Kenya and operated under Commission for Higher Education
(Mwiria et., al. 2007)
1.1.3: Status of Higher Education in Kenya
Universities are expected to make contributions to national development through
training and development of human resources in various professions for the labor
market (Mwiria et., al. 2007). According to UNESCO World Conference on Higher
Education (1998), low funding from the exchequer, increased enrolment, limited
access compared to the population level, increased enrolment without commensurate
improvement in available facilities, gender inequality, and a low research capacity,
are some of the problems facing universities in the region.
These problems have led to extreme pressure on the human and physical resources
making it difficult for universities to maintain reputable levels of performance in
relation to their core mandate of teaching and research. Employees’ dissatisfaction
because of various monetary and non-monetary factors is another major area of
concern for public universities because it is resulting in high turnover rates among
academics while those who have remained are actively involved in moonlighting
activities to supplement their income (Kipkebut, 2007).
Abagi et.,al. (2007) also posits that Kenyan Universities have destroyed middle level
colleges in a bid to extend university education to the public especially in remote
regions. Universities should involve other stakeholders if they have to survive for
instance government, private sector and international community. They should also
observe quality, excellence, equity, responsiveness, governance and management
(Kipkebut, 2007).
Kipkebut (2007) found that academic staff lacked respect for non-teaching
employees. Administrators were most appreciated or acknowledged for skill or
knowledge in their everyday work (a case of Australia). In the case of USA, UK,
Finland and Netherlands, Dobson et., al. (2000) cited lack of appreciation of
differences in nature of work between administrators and faculty caused tension.

11
1.2 Statement of the Problem
This study begins from the realization of the need to effectively administer the effect
of training on employee performance. According to Elnaga and Imran (2013),
Training is a systematic process to enhance employee’s skill, knowledge and
competency, necessary to perform effectively on the job. Overall, training impacts
employee performance.
According to Kipkebut (2007) unplanned increase in student population and creation
of more public universities over the past two decades with no commensurate increase
in funds, have led to extreme pressure on the human and physical resources. This has
made it difficult for universities to maintain quality performance in pursuit of their
core function of training and research.
During the past decade, Kenya’s public university system has experienced very high
rates of growth which have not been accompanied by a commensurate rise in the
level of funding. Unfortunately the government has been facing constraints in
funding the universities. Foreign partners and financiers have played a crucial role in
alleviating the universities’ financial shortcomings (Cheboi, 2004). Nevertheless,
financial limitation still remains the universities’ main challenge yet they are
expected to provide quality education to their clients (students) whose population has
been growing rapidly (Kosgei, 2004). It is because of this situation that some
universities in their attempts to be economical in expenditure have reduced their
training budgets despite the importance of training on employee performance.
Non-teaching employees (Senior Assistant registrars’, Deputy Registrars and
Registrars) at management level are some of the employees whose training programs
have been decreased or discontinued because of budgetary constraints. This means
that training programs for enhancing skills on administration, support for the work of
teaching staff, dealing with student non-academic matters, and working in
administrative functions such as finance, HR, Marketing, University Corporate
Department and many other sections has be affected and in turn affected individual
and organizational performance (Odhiambo & Waiganjo, 2014).

12
Non- teaching employees are likely to fail in accomplishing targets due to lack of
advanced technology, as such, timely feedback coupled with exposure to relevant
training may minimize negative training outcomes (Farooq & Khan, 2011). There is
need to establish the influence of training on the performance of non-teaching
employees at management level in selected public universities in Kenya.
Reviews of past studies conducted in Kenya on performance indicate that the
researchers examined influence of training on performance of many other employees
but not non-teaching employees at management level in public universities. Appiah
et al. (2011) investigated the impact of training on employee performance: a case
study of HFC bank (Ghana) limited. The findings showed that training positively
impacted on employee performance. Dabale (2014) carried out a study that examined
the relationship between Training and Employee Performance: The Case of Mutare
City Council, Zimbabwe. He found a positive relationship between training and
performance. Ayodeji et., al. (2011) investigated the role of training in enhancing
employees’ commitment to organization. He found out that training enhanced
employee commitment.
It is against this background that this study was undertaken to address the research
gap, and also provide a better understanding through empirical evidence of the
influence of training on the performance of non-teaching employees at management
level in selected public universities in Kenya. This study will be valuable to
researchers and academicians in providing more knowledge on the influence of
training on the performance of non-teaching employees at management level in
selected public universities in Kenya.
1.3 Objectives of the Study
1.3.1 General Objective.
The general objective of this study was to establish the influence of training on the
performance of non-teaching employees at management level in selected public
universities in Kenya.

13
1.3.2 Specific Objectives.
The study was guided by the following specific objectives:
1 To determine the influence of training needs assessment on the performance
of non-teaching employees at management level in selected public
universities in Kenya.
2 To establish the influence of mode of training on the performance of non-
teaching employees at management level in selected public universities in
Kenya.
3 To determine the influence of training duration on the performance of non-
teaching employees at management level in selected public universities in
Kenya.
4 To evaluate the influence of training-feedback on the performance of non-
teaching employees at management level in selected public universities in
Kenya.
5 To establish the influence of motivation in moderation of the relationship
between training and performance of non-teaching employees at management
level in selected public universities in Kenya.
1.4 Hypotheses
Ho1 Training needs assessment has no significant influence on the performance of
non-teaching employees at management level in selected public universities
in Kenya.
Ho2The mode of training has no significant influence on the performance of non-
teaching employees at management level in selected public universities in
Kenya.
Ho3 Training duration has no significant influence on the performance of non-
teaching employees at management level in selected public universities in
Kenya.

14
Ho4 Training feedback has no significant influence on the performance of non-
teaching employees at management level in selected public universities in
Kenya.
Ho5 Motivation has no significant influence on the moderation of the relationship
between training and performance of non-teaching employees at management
level in selected public universities in Kenya.
1.5 Justification
Universities emphasize on employee training and staff development as a human
resource management strategy to minimize performance deficiencies and align their
employees to the ever dynamic work-place demands. This trend has been adapted by
public Universities in Kenya which have resorted to spending colossal amounts of
money sourced both internally and externally to train their employees (both academic
and non-academic). However, there are complaints that the universities still exhibit
characteristics that are indicative of poor job performance, such as poor delivery of
services, poor lecturer etiquette, and unavailability for consultation especially from
feedback of performance appraisals conducted annually (Dawo, et al. 2012).
The study intended to investigate the influence of training on the performance of
non-teaching employees at management level in selected Public universities in
Kenya; therefore, close attention was paid on Training Needs Assessment, mode of
training such as; (on the job training and off the job training). Training duration for
courses to be mounted was found to be important as stated by (Batool, & Batool,
2012). This study will be helpful to university Managers .The knowledge attained
will add to existing knowledge and help improve work of future researches; and help
Human Resource department introduce technology training, after which employees
will excel in performance and gain competency in skills. This will lead to competent
and confident employees due to the change envisaged, as contained in (ILO, 2012).
Such introduction can lead to automation of human resource functions in the entire
university, enable employees to upgrade skills and apply the technology, hence lead
to improved performance. Many studies, for instance Kipkebut, (2010); Ngethe,
Iravo & Namusonge, (2012) and Obwogi, (2011) have been conducted on teaching

15
staff at public universities but there are hardly studies on non-teaching employees at
management level in selected public universities.
The study will benefit universities management and their Human Resource
departments will use the recommendations and findings of this study to improve the
incorporation of training for improvement of non-teaching employee performance.
Government departments will utilize this study to improve the training and
performance of their employees and use the information to formulate policies on
training. Scholars will use the findings and recommendations to add on existing
knowledge. Lastly, the recommendations and findings will be used by HR
Departments to improve on training of their employees.
1.6 Scope of the Study
The study was conducted in the eight selected Public Universities in Kenya, and was
confined to 900 non - teaching employees at management levels. The following
variables were addressed: Training needs assessment, Training mode, Training
duration and Training feedback as independent variables. Non-teaching employee
performance was the dependent variable.
1.7 Limitations of the Study
There was no major limitations experienced except for some respondents who
thought the study would expose their university, but this hurdle was overcome by
frequently assuring them that information sought was entirely for academic purposes
and would be treated confidentially. With such assurance, the respondents
cooperated, and provided the required answers.

16
CHAPTER TWO
LITERATURE REVIEW
2.1 Introduction
In this chapter, the study intended to critically examine theories of training that are
relevant to the research topic. Theoretical scholarly work was reviewed, including
theoretical and conceptual framework together with relevant independent and
dependent variables. The chapter explored the theories relevant to the study,
conceptual framework, and critique of the existing literature, research gaps and
summary.
2.2 Theoretical Review
Theoretical review is concerned with explaining phenomena on which a particular
study is based on, by stating the constructs and laws that inter-relate these constructs
to each other (Mugenda & Mugenda, 2003)
There are various theories that relate to how people learn at different times; and
drivers that motivate trainees to learn. Some of the theories include Reinforcement
theory, Social learning theory, Goal setting theory and Adult learning theory. The
theories were described as follows.
2.2.1 Reinforcement Theory
Skinner (2013), states that people are motivated to perform or avoid certain
behaviors due to past experiences that arise from these behaviors. Positive
reinforcement results from pleasurable behavior outcome. Positive reinforcement
theory suggests that for trainees to acquire knowledge, competency, and modify
skills, the trainer needs to identify what outcomes the learners finds most positive
and negative, then link the outcomes to the training practices. Reinforcement theory
suggests that trainees are likely to adopt a desired behavior, through training, if the
changed behavior will be of benefit to them (Matofari, 2015).

17
Negative reinforcement is the removal of pleasurable behavior outcome. When both
the pleasurable and un-pleasurable behaviors are withdrawn the resultant behavior is
extinction. Punishment is unpleasant outcome resulting from some behavior that may
culminate in the decrease in that behavior. For instance, if a supervisor shouts at
employees due to lateness, they will avoid the embarrassing shouting by cheating
they are unwell or make telephone calls that they will come late or device some
mechanism to avoid the boss’ shouting and to ensure the boss does not discover the
trick (Noe, 2010). From a training perspective, reinforcement theory suggests that for
learners to acquire knowledge, change behavior or modify skills, the trainer needs to
conduct a training needs assessment to identify what outcomes the learner finds most
appealing and which he or she finds negating.
Upon conducting the training needs assessment, trainers should therefore connect
these outcomes to learners acquiring knowledge or skills or changing behavior.
There are very many advantages that learners will encounter when they participate in
training programs. The advantages include: acquiring knowledge to do work in much
easier and interesting ways, and encountering other employees who can serve as
resources when problems occur, thus increasing opportunities for promotion.
Reinforcement theory maintains that trainers can withhold or provide these benefits
to learners who get good understanding of program content. The effectiveness of
learning depends on the pattern or schedule for providing these rein forcers or
benefits (Mullins, 2010). Modifying behavior is a mode of training that is primarily
based on reinforcement theory such as, showing employees safe and unsafe work
practices in action. This will make employees appreciate practicing safe behaviors at
work. This actually promotes the employees wellbeing and positive feedback given
to them. Reinforcement theory argues that behavior is strengthened and controlled by
external events, for example Classical Conditioning proposed by Pavlov (2014), and
Operant conditioning proposed by Skinner (2013).It is very important for trainers to
employ positive reinforcement and feedback, to enable pleasant leaning experiences
during the trainings.

18
Studies by Ololube (2004), employed reinforcement theory in assessment of
teachers’ job effectiveness, in which he reveals two variables that promote
reinforcement that is environment and observable laws that can be changed or
predicted according to the situation available. Armstrong (2009) and Noe (2010),
revealed the following variables which a learner must acquire; knowledge, change of
behavior, modification of skills, positive feedback and progress achieved in steps
leading to desired results.
2.2.2 Social Learning Theory
The theory lays emphasis on the fact that people learn by observing what other
people do especially those they believe are credible and knowledgeable (Bandura,
2013) cited in (Noe, 2010). This theory maintains that behavior that is reinforced or
rewarded will always recur. In addition to motivating behavior by directly rewarding
it, a person may perform behavior that he observes another having been rewarded for
(extrinsic reward), and he may learn to reward himself for the appropriate behavior.
The models skill that is rewarded is adopted by the observer. In this model,
acquisition of new skills or behavior arises from either direct experience or by
observation.
Grobler et.al (2006) revealed that training is the use of specific means to inculcate
specific learning, using techniques that can be identified and described. Exposure to
direct experience as one of the specific means of acquisition of new skills, can be
achieved when an employee is exposed to on the job training such as job rotation,
lectures, computer based learning and apprenticeship.
Job Rotation was developed in Denmark in the 1980’s and has been defined as
systematic movement of employees from one job to another at planned intervals
(Dessler and Varkkey, 2009; Malinski, 2002). Job Rotation is the process through
which organization employees’ work as displacement at different homogenous levels
(Nafei, 2014)
Adjei [2012] defines job rotation as a succession planning tool that enhances skills
and legacy of the organization while working to retain younger employees who

19
increasingly demonstrate desires to learn and experience new things. Implementing
job rotation, diversifying job skills, minimizing monotony and thus increasing
motivation result in employees’ personal achievement, higher output, decreased
absence rate and higher level of acceptance (Abbasi et., al, 2013)
Odhong (2015) stated that, job rotation at the senior management levels is frequently
referred to as management rotation. It is tightly linked with succession planning for
instance, developing a pool of people capable of stepping into an existing job. Here
the goal is to provide learning experiences which facilitate changes in thinking and
perspective equivalent to the "horizon" of the level of the succession planning.
Leat, (2007) and Campion (2001) claim that rotating an employee from one
department to another is not a luxury but a necessity of today’s professional climate
as it provides an intermittent opportunity to employees to tackle higher-level
diversified tasks which bring about greater job interest/motivation and involvement
among them and subsequently enhance their job performance. Job rotation also
improves employee’s problem-solving abilities and shared understanding of the job
and enhances team efficiency (Mohsan et al., 2012).
According Rhaman et al., (2011) skill can be passed on using lectures, as he
maintains that lecture method is basically narration that will signify what we usually
call explanation or description.
According to Walker (2003) there are three main reasons for using the lecture format
for instance to transmit information, to create interest, and to promote understanding.
According to Rahaman (2011) lecture method can be used to effectively survey the
structure of knowledge in a particular area as well as suggest the connection between
cases and real decision-making. This mode of training reaches trainees at an
emotional level, and provides necessary motivation for learning difficult material.
Computer Based Learning also known as Computer Aided Instruction refers to the
use of computers as a key component of the educational environment. While this can
refer to the use of computers in a classroom, the term more broadly refers to a
structured environment in which computers are used for teaching purposes.

20
Computer-Based learning has many benefits; including the advantage of users
learning at their own pace and also learning without the need of an instructor to be
physically present (Julia et al. 2009). Chambers et al., (2008) findings revealed that
computer assisted instruction is an effective tool for increasing performance.
According to Harris e.t, al (2007), apprenticeship involves teaming up apprentices
with a knowledgeable, skilled adult worker (a mentor) who guides and assists the
apprentice in skill and knowledge acquisition. The second means of acquisition of
new skills is through observation. Observation is the action or process of examining
something or someone in order to gain information and can be through simulation or
role play.
Recent advances in technology have positioned simulations as a powerful tool for
creating more realistic, experiential learning environments and thereby helping
organizations meet these emerging training challenges Bell et., al. (2008). Bell et., al.
(2008), defines a simulation as an exercise involving “reality of function in a
simulated environment.” They further note that an essential feature of simulations
and other synthetic learning environments (e.g., virtual reality) is, “the ability to
augment, replace, create, and/or manage a learner’s actual experience with the world
by providing realistic content and embedded instructional features.”
Like other types of distributed learning systems, simulations allow training to occur
almost anywhere and anytime, and this flexibility can be used to reduce or eliminate
many of the variable costs associated with traditional training, such as classrooms
and instructors (Summers, 2004). Simulations also possess unique features that
create the potential for instructional benefits not offered by other instructional
mediums. For example, simulations can be used to create a synthetic- or micro-world
that immerses trainees in a realistic experience and exposes them to important
contextual characteristics of the domain (Schiflett, Elliott, Salas, & Coovert, 2004)
Simulations can also be used as realistic practice Simulation-Based environments for
tasks that are too dangerous to be practiced in the real world or to provide
opportunities for practice on tasks that occur infrequently Bell et., al. (2008).

21
A growing body of literature suggests that simulations can serve as effective training
tools. Washbush and Gosen (2001), for example, identified a total of 11 well-
designed experimental studies of business simulations and concluded that the use of
simulations improved learning by an average of 10% on pre- and post-training
knowledge assessments. Bell et., al. (2008), included quasi-experimental studies in
his review, but reached a similar conclusion that simulation gaming produced better
learning than the use of business case studies. Bell et., al. (2008) in their recent
review of synthetic learning environments, noted that simulations have been shown
to be effective in a variety of contexts, including the training of pilots, clinicians,
military personnel, fireman, and survey interviewers. A number of studies have also
shown that in addition to enhancing learning outcomes, individuals generally report
positive reactions.
The role-playing process provides a live sample of human behavior that serves as a
vehicle for employees to explore their feelings, gain insights into their attitudes,
values, and perceptions; to develop their problem-solving skills and attitudes; and
explore subject matter in varied ways (Lynn et., al. 2015). According to Henriksen
(2004) role-play is a medium where a person takes up a role an, is given the
opportunity to participate, and interact with the contents thereof and its participants.
Seaton, Dell’Angelo, Spencer, & Youngblood (2007) suggest the use of role-play to
help in the development of self-awareness, self-regulation, and self-monitoring.
However, Karwowski and Soszynski (2008) as well as describe role-play as an
activity where a limited number of learners take on specifically assigned and well
defined roles, act out an encounter that involves a goal or problem and denotes a
cluster of prescribed behaviors associated with particular positions.
Many researchers have discussed the successful use of role-play as a training tool in
many different scenarios Svinicki & McKeachie (2011). In a Finnish study of role-
playing games, Meriläinen (2012) describes the self-reported social and mental
development of role-players. Specific skills that can be gained by role-play include
modifying one’s performance in light of feedback, becoming a good listener,
showing sensitivity to social cues, managing emotions in relationships, and
exercising assertiveness, leadership, and persuasion Lynn et., al. (2015). Karwowski

22
and Soszynski (2008) used role-play successfully to train undergraduate students in
creativity, but they also believed it developed a capability for constructive criticism.
Lynn et., al. (2015) suggest role-playing is an appropriate strategy to facilitate
employee’s active involvement in learning.
Svinicki & McKeachie (2011) see the chief advantage of role-playing to be that
employees are active participants rather than passive observers and therefore must
make decisions, solve problems and react to the results of their decisions. Dell’Olio
& Donk (2007) believe that roleplaying helps employees make responsible
autonomous choices because it provides a forum for exploring multiple ways of
acting and reacting in a given situation. Hall, Quinn, & Gollnick (2008) on the other
hand state that experiences gained through role play can take the place of firsthand
experiences that may be impossible to otherwise achieve. They further explained that
participants often cite such experiences as the most informative and influential part
of their training.
From another point of view, this theory maintains that learning is also influenced by
self-efficacy. This is a situation where an individual passes judgment on whether he
can successfully learn knowledge and skills (Noe, 2010). A person’s self-efficacy
can be enhanced using the following: Verbal persuasion, logical verification,
observation of others (modeling) and past accomplishments. For instance, Verbal
persuasion implies using or applying words of encouragement to convince others that
they can learn. Logical verification involves perceiving a relationship between a new
task and an already mastered task, (Noe, 2010). Trainers and managers can
encourage employees by telling them that they succeeded in learning similar tasks.
Modeling, involves having employees who have mastered the learning outcomes
demonstrated to them, for trainees. This can either be through job rotation, lecture
method, Computer Based learning or apprenticeship.
Employees will therefore be motivated by confidence and success of their peers, and
past accomplishment where employees are allowed to build a history of successful
accomplishments. Employees may be placed in situations where they are likely to
succeed and provide training so that employees know what to do and how to do it.

23
The processes that can be revealed through Social Learning theory are attention,
retention and motor reproduction.
People cannot learn by observation unless they are aware of important aspects of a
model’s performance. Attention is influenced by characteristics of the model and the
learner. Learners must be aware of the skills or behavior they are supposed to
observe. The model must be clearly identified and credible and, the learner must
have the physical capability (sensory capability) to observe the model (Noe, 2010). A
learner who has been successful in learning other skills or behavior by observing the
model is more likely to attend to the model. Learners must remember the behaviors
or skills that they observe. Learners have to code the observed behavior and skills in
memory in an organized manner so that they can recall them for the appropriate
situation. Behaviors or skills can be coded as visual images (symbols) or verbal
statements. Motor reproduction involves putting in practice the observed behavior to
ascertain they culminate in the same reinforcement that the model received.
Recalling of behavior and skills is an indication that the learner can reproduce them.
Performance of behavior may lack perfection on the first attempt. Practice and
feedback are important components which help behavior to be like that of the model
(Noe, 2010).
Learners enjoy and adopt modeled behavior whose results are positive. Social
learning theory emphasizes that behaviors that are reinforced (a motivational
process) are likely to be repeated in future. Use of employee participation during
appraisal may reveal some positive rewards to employees who will enjoy the
appraisal and make the manager apply the same other times.
Studies by Brum (2007) revealed that training has an integral part to play in
socialization of employees. Employees can also learn by watching, observing others,
and, by imitation (Mullins, 2010). Thus, the process relies on complex, cognitive
processes, which encompass attention, recall, and understanding. The trainee requires
individual intelligence, judgment and skill in order to repeat the behavior. We must
admit that behavior has its pros and cons and may not conclusively explain certain
forms of learning. Bandura (2013), and Wenger (2006), reveal that learning occurs

24
through social interactions, which they refer to as “community practice” as groups of
experts working together.
2.2.3 Goal Setting Theory
Locke (2012) stated that behavior results from a person’s conscious goals and
intentions. People’s behaviors are influenced by goals which direct energy and
attention, sustaining effort over time and motivating them to develop strategies for
goal attainment. Goal setting theory can be used in training program design (Noe,
2010).
It has been agreed that specific challenging goals result in better performance than
vague unchallenging goals. The goals ought to be relatively difficult to enable the
employees strive towards their attainment. Easy goals do not stir any incentive.
Harder goals that push employees to new levels of performance will greatly benefit
the employee by confirming to them that they are capable (Locke, 2012)
Goals usually lead to high performance especially when employees are committed to
the goals. Successful attainment of a goal depends on the level of commitment the
individual places towards achievement of the goal. Locke & Lotham (2006) argued
that goal commitment is the degree of determination one uses to achieve an accepted
goal. The degree of determination is pegged on the importance the individual’s
places on the attainment of the goal as well, the belief that they can achieve the goal
coupled with hard work.
Goal theory suggests that joint setting of objectives, feedback and involvement
which are all part of managerial approach, can improve motivation (Locke and
Lotham, 2006). When objectives are explained to employees their motivation
increases. As such, goals must be specific, measurable, attainable and time bound
(Lunenberg, 2011).
Employees realize that their work is being evaluated, and their contributions are
being recognized when they receive feedback. Feedback is necessary in-order for
goals to remain effective and retain commitment. Feedback allows employees and

25
teams to spot any weakness in their current goals therefore allowing modifications to
be made (Hitt, 2002).
Positive feedback inculcates a sense of pride and self-interest among employees
because they appreciate the fact that the employer recognizes their contributions. If
employees know that an attractive reward is attached to a goal, they will increase
effort, commitment and performance in order to attain such a goal (Kawesa, 2004).
Goal setting theory involves: goal orientation, learning orientation and performance
orientation. Goal orientation refers to goals held by a trainee in a learning situation
and includes learning orientation, or performance orientation. Learning Orientation
refers to increased ability or competence in a task. People with learning orientation
believe that training success is defined as showing improvement and making
progress. They prefer trainers who are more interested in how trainees are learning
than in how they are performing and view errors and mistakes as part of the learning
process. Performance Orientation refers to learners who focus on task performance
and how they compare to others.
Persons with performance orientation define success as a high performance relative
to others, value high ability more than learning. Goal orientation is believed to affect
the amount of effort a trainee will expend in learning (motivation to learn). Learners
with a high learning orientation will direct greater attention to the task and learn for
the sake of learning in comparison to learners with a performance orientation.
Learners with a performance orientation will direct more attention to performing well
and less effort to learning, Noe (2010). Research has revealed that trainees with a
learning orientation exert greater effort to learn and use more complex learning
strategies than trainees with a performance orientation. To create learning orientation
in trainees, would involve setting goals around learning and experimenting with new
ways of having trainees perform trained tasks rather than emphasizing trained task
performance, emphasizing competition among trainees, creating a community of
learning, and allowing trainees to make errors and experiment with new knowledge
skills and behaviors during training.
26
Studies by Gratton, (2007); Hannagan (2005), view Management By Objectives
(MBO) as goals which are set and must be accomplished, similarly, Strategic plans
of selected public universities of Kenya, have indicated various goals and objectives
which must be met within set time limits. In Human Resource, MBO techniques
entail employee involvement in goal setting, decision making. Where employees are
encouraged to set their own goals, they are keen on exhibiting commitment and
achieving the goals (Kiruja and Mukulu 2013).
Studies by Lunenberg (2011) indicate that Goals must be specific, measurable,
realistic, and time targeted (SMART). Feedback is an important variable which helps
in correction, modification or further improvement. The study by Akala, (2010),
revealed that non-teaching employees are evaluated against set goals in performance
contracts and performance appraisals.
2.2.4 Adult Learning Theory
The theory was developed by Knowles (2013), out of a specific theory of how adults
learn. The most popular mode of learning has been for youth and children
(Pedagogy). Pedagogy gives the instructor major responsibility for making decisions
about learning content, method and evaluation. Students are seen as generally being
passive recipients of directions and content, bringing few experiences that may serve
as resources to the learning environment. Educational psychologists recognized
limiting factors in formal education theories and hence developed andragogy (Noe,
2010).
Andragogy the theory of adult learning (Knowles, 2013), is highly associated with
adult learning theory. Knowles theory is based on the assumptions that adults have
the need to know why they are learning something, have a need to be self-directed,
bring more work related experiences into the learning situations, enter into a
learning experience with a problem centered approach to learning, and, are
motivated to learn both by extrinsic and intrinsic motivation. The learner and trainer
are both involved in creating the learning experience and ensuring that learning
occurs. At the completion of any training, the trainer conducts an assessment by

27
interviewing and administering questionnaires to the learner so examine whether the
training matched the expectations of the learner since in andragogy the trainee is
involved in creating the learning experience as well; and this is part of feedback.
Upon successful completion of the training, the employee can be promoted,
appraised and recommended for better placement or remuneration. The environment
of Andragogy must be safe and there should be a sound relationship between trainer
and learner for conducive learning and development (Jones, 2016).
The study revealed that Reinforcement theory was dominant as it emphasized the
power and control of simple learning principles. First, the Stimulus must be
identified and Response follows after which Output/reward is administered as
indicated (S R O). The reward may be reinforced in case of
positive stimuli or withheld in case of negative stimuli but punishment may be
administered instead. In the case of negative stimuli, the reinforcement inform of
punishment fails to motivate the learner to perform. Such a learner may never
appreciate the effect of either the positive or negative reinforcement and therefore the
learner continues to perform poorly.
In the course of training session, the learner must follow instructions step by step
until the process is complete. Sometimes assessment is carried out to establish
whether learning took place. The trainees who pass assessment are rewarded by some
incentives such as compliments, acknowledgement certificates, promised promotion,
secondment or salary increase. Coupled with knowledge and skills attained during
training, the trainees are motivated to perform better in their areas of operation (Noe,
2010).
2.3 Conceptual Framework
Conceptual framework in Figure 2.1 highlights descriptive categories which were
systematically placed in broad structure of explicit propositions, statements of
relationships between two or more empirical properties, to be accepted or rejected
(Nachamias & Nachiamias 2009). Conceptual framework consisted of independent
variables and the dependent variable. The dependent variable included performance

28
of non-teaching staff in management level at selected public universities, while the
Independent variables included, Training Needs Assessment, Mode of Training,
Training Duration and Training Feedback. Motivation was a moderating variable
between training and performance of non-teaching employees at management level
in selected public universities in Kenya.
Independent Variable Moderating Variable
Dependent Variable
Figure 2.1 Conceptual Framework
Motivation
Financial benefits
(promotion, better
remuneration,
scholarship, salary
Non-Financial benefits
(higher responsibilities,
recognition, personal
advancement)
Training Needs Assessment
Skills
Knowledge
Competency
Levels
Mode of training
On the job training ( job
rotation, lecture method,
Computer Based
learning, Apprenticeship)
Off the job training
(Simulation,Role Play,)
Training Duration
Long-term (PhD,
Masters, Bachelor’s,
Diploma.
Short term(Certificate
courses, workshops,
Seminars,
Conferences)
Training feedback
Performance appraisal
Evaluation / interviews
Questionnaires/observa
tions
Performance of Non-
teaching staff in
management level
Team work
Adherence to
policy
Accomplished
targets and goals

29
2.3.1 Training Needs Assessment (TNA)
Training needs assessment aims at identifying performance requirements and the
knowledge, skills, and abilities needed by an organization’s workforce to achieve the
requirements (Nyongesa, et al. 2014). Conducting needs assessment is fundamental
to the success of a training program (Brown, 2002).
Training needs assessment aims at assess/evaluate the trainees’ level of acquaintance
with or understanding of a science, art or technique (Knowledge), possession of
means (ability) to complete a task and proficiency (skill) in doing a task. The fact or
condition of knowing something with familiarity is gained either through experience,
association or training (Noe, 2010).
Training needs assessment involves organizational analysis, personal analysis and
task analysis. Organizational analysis involves determining the appropriateness of
training given the company’s business strategy, its resources available for training,
and support by managers and peers from training activities. Personal analysis
involves determining whether performance deficiencies result from a lack of
knowledge, skills, or ability or from a motivational or work-design problem,
identifying who needs training, and determining employees’ readiness for training.
Task analysis identifies the important tasks and knowledge, skills, and behavior that
need to be emphasized in training for employees to complete their tasks (Noe 2005).
Due to globalization with many changes in world economies and dynamism at
workplace, it is imperative that organizations develop their employees. At times the
individuals fund their development by acquiring more knowledge, skills and
competencies required at work place (Wairimu, Gachunga & Mumbo, 2013).
TNA is the first step in the process which culminates into training and educational
strategy of staff in an organization. TNA is therefore about understanding the nature
of the need and strategizing how to solve it. Well planned training programs will give
value to organizations in terms of increased productivity, increased morale, reduced
costs, increase organization stability and flexibility to adapt to changing external
requirements (Nyongesa,et al. 2014). Needs assessment can help improve the quality

30
of policy or program decisions and may lead to improvements in performance and
accomplishments of desired results (Brown, 2002; Sifuna, 2006)
A well-developed development system enables organizations source from their in-
house talent for staffing and promotion purposes. This gives assurance that the
knowledge, skills, experience and aspirations available are matched with needs of the
organization. Sifuna (2006); Wairimu, Gachunga, and Mumbo (2013), admit that
education plays an important role in promoting the socio-economic development of a
country. Universities therefore have a role of equipping employees with advanced
knowledge, skills and competencies (Wairimu, Gachunga & Mumbo 2013). After
training needs assessment has been conducted, the employees may be promoted or
enrolled for further training to acquire more skills, knowledge and competencies to
enable them improve on performance.
2.3.2 Mode of Training
There are mainly two modes of training, namely, on the job training and off the job
training.
On-the job Training
This mode of training is exposed to new employees and those who lack experience,
at a designated place within the work place. The trainees observe what their peers
and managers do and later imitate what they observed (Mullins, 2010). On the job
training (OJT) can be used for up-skilling in places which require new technology,
within departments inform of cross- training, and where an employee has been
promoted, or transferred to another section. Job Rotation is one of the OJT (On the
job Training ) where trainees are transferred from department to department, job to
job, plant to plant, in order to broaden their knowledge and skills and expose them to
general operations of the organization (Dessler, 2005). Employees learn a lot from
job-rotation experiences such as varied job exposures, and realization that all
departments are equally important for the success of the organization.
Lecture method is another form of on the job training method in which trainees listen
to trainers during a learning session (Noe, 2005; Ongori & Nzonzo, 2011).Trainees
31
learn specific topics and selected programs. Lecture method is limited as it lacks
much interaction, participation and involvement. It also lacks feedback on whether
the trainees understood the content that had been taught.
Apprenticeship is another form of on the job training, in which a master craftsman
imparts skills on learners under his or her supervision. This type of training was
commonly found among professionals such as Doctors, dentistry, law, and teaching
and was not a preserve for artisans. Both classroom and job experiences are
contained in apprenticeship and may require long period under experts guidance in
order for trainees to gain proficiency.
Computer based training (CBT) or Digital Versatile Disc (DVD) systems are used by
the trainees to enhance learning, acquisition of knowledge and skills (Dessler, 2005).
Soft-ware and Computer Packages may be installed in computers for employees to
use after tutorial sessions. Computer Based learning (CBT) is economical, time
saving, and motivating to employees (Sims, 2006).
Off the job training
This is a form of learning administered away from the place of work hence reduces
disruptions (Armstrong, 2009; Ongori & Nzonzo, 2011). It is productive due to
nature of interaction and involvement experienced. It also allows simulation and role
playing (Ongori & Nzonzo, 2011).
Simulation aims at facilitating the transfer of what has been learnt off-the job to on-
the-job behavior by reproducing, in the training room, situations that are close as
possible to real life. Trainees are thus given the opportunity to practice behavior in
conditions identical to act or at least very similar to those they will meet when they
complete the course (Armstrong, 2009).
Role playing is used to give managers, team leaders or sales representatives practice
in dealing with face-to-face situations, such as interviewing, conducting a
performance review meeting, counseling, coaching, dealing with a grievance, selling,
leading a group or running a meeting. It develops interactive skills and gives people
insight into the way which people behave and feel. In role playing, the participants

32
act out a situation by assuming the role of characters involved. The situation will be
one in which there is interaction between two people or within a group. It should be
specially prepared with briefs written for each participant explaining the situation
and, broadly, their role in it. Alternatively, role playing could emerge naturally from
a case study when the trainees are asked to test their solution by playing the parts of
those concerned (Gajanan, 2016)
The technique of ‘role reversal’ in which a pair playing, for instance, a manager and
a team leader run through the case and then exchange roles and repeat it, gives extra
insight into the feelings involved and the skills required (Gajanan, 2016.)
Role playing enables trainees to get expert advice and constructive criticism from the
trainer and their colleagues in a protected training situation. It can help to increase
confidence as well as developing skills in handling people. The main difficulties are
either trainees are embarrassed or they do not take the exercise seriously and
overplay their parts (Armstrong, 2009).
Computer based learning is an example of Electronic learning (e-learning), which
uses computer Technology. No physical interaction occurs but learners are taught via
instructions, observation, and processes that elucidate required skills and knowledge
to meet needed organizational goals (Ongori & Nzonzo, 2011).
2.3.3 Training Duration
Various trainings may take varied time, some may be for short duration for instance
few weeks to six months, and others may be over long period of time, that is, from
seven months to some years (Akala, 2010).
Long - term training
Long term training encompasses PhD, Masters, and Bachelor’s degree. Both teaching
and non-teaching employees undertake long term training depending on which
education level they wish to accomplish. According to Knowles (2013), theory of
andragogy, adults seek knowledge outside normal learning schedule for youth, to

33
enable them improve on their certificates and when possible to earn promotions,
better salary, and associated perks (Odinga, 2010; Kipkebut, 2010).
Short term training
Today’s fast-paced and bustling world requires the modern worker to become a jack-
of-all-trades. But, rather than spending a lifetime studying degrees and higher
qualifications, short courses give employees the opportunity to update their skills
(Andrea, 2010).
Akala (2010) revealed that, short term courses for non-teaching employees included
workshops, seminars, conferences, symposiums, continuing enrichment courses,
certificate courses for short periods of time which may last from a few weeks to six
months. Short term programs have been proven to improve the individuals in various
ways, and are a big investment for the future.
Ranging from one day to six months, short courses are perfect where the employee
intends to formalize the skills gained in the workplace or build upon the
qualifications gained through university. They can be the key to unlocking job
prospects, promotions or new career ventures – and they’ll do wonders for their
creativity. Short courses are an excellent way of filling the gaps in knowledge and
give a competitive edge when it comes to job promotions. As technology evolves
systems, programs and practices change, making it critical for workers to refresh
their skills and stay on top of the game.Short courses are appealing to more
employees because they help the employee specialize in a short time and employee
feels more competent. For instance, an engineer will learn marketing to boost the
marketing component that was lacking. Short courses also help an employee boost
their curriculum vitae and show employer that he/she is willing to improve
professionally. This enhances chances of being employed as well as self-
employment (Andrea, 2010).
2.3.4 Training feedback
According to Opu (2008), feedback is the last step in the training process whereby
trainees are asked to fill a form expressing their experiences during the training. The

34
questions seek to establish aspects of the training communication effectiveness on
the part of the trainer, relevance of topics, and whether training objectives were
achieved. Akala (2010) observed that during performance appraisal and performance
contract exercises, non-teaching employees are evaluated against agreed
organizational goals and objectives. The strengths, weaknesses, opportunities and
threats of the employees’ performance evaluation outcome are determined and
appropriate action taken. The action may be promotion, transfer, granting of awards,
and recognition, further training, as incentives to make the employee perform better.
Sometimes employees may suffer due to the biased nature of appraisal systems.
Noe (2010), contends that advanced technology, coupled with affordable costs for
accessing technology has influenced delivery of training, making it real and has
enabled employees to choose convenient places of work.
2.3.5 Motivation
Mullins (2010) asserted that motivation is the creation of stimuli, incentives and
working environments that enable people to perform to their utmost. Thus motivation
has a tendency of giving people what they want most from their work and in return,
managers require better production, quality, and service. Motivation occurs in
various forms such as: financial: promotions, better remuneration and scholarships
which encourage more involvement in training. The study further established that
employee engagement can be increased through sponsorship in an attempt to develop
a performance culture to motivate employees. In terms of non-financial, motivation
can be envisaged in higher responsibilities and personal development granted to
employees.
Promotion is envisaged as one of the external reward in motivation together with
salary and other extrinsic motivators, (Armstrong 2009; Mullins, 2010).On the other
hand, intrinsic rewards are internal to people and have to do with personal growth,
responsibility, accomplishment, competence, advancement, and recognition.
Promotional opportunities refer to extent employees conceive their chance to grow
and gain vertical mobility in the organization. Managers who experience less

35
mobility are less committed than those who undergo more mobility during their
tenure, and unfair promotional opportunities lead to negative attitudes, low morale,
and low performance (Kipkebut, 2010).
Odinga (2010) revealed that promotion should be advanced to senior staffs that have
been in service for a long time and it should be viewed as a reward for employees
with additional skills and knowledge. In addition, fair performance appraisals may be
used in promotion policies with consideration of staff competence. Promotion of
university employees may depend on academic qualifications, administrative
excellence, and, or established policies. Mwesigwa (2010) asserted that managers
who engage staff in training programs create a dynamic and motivating climate in the
work environment. From studies conducted in Uganda, Mwesigwa (2010) maintains
that knowledge and skills must be refreshed by training in order to offer higher
performance. Studies by Pheko (2008), indicate that lack of training for staff often
leads to frustration and lack of motivation.
2.3.6 Employee Performance
Leung (2006) stated that Organization performance is the evaluation of efficiency,
effectiveness and customer satisfaction. Other factors that can contribute to
organization performance are government policies, adequate supply of equipment,
resources such as finances, materials, the prevailing political and economic
environments. Nyakundi, et al. (2012), asserted that employees seem to improve
performance in instances where compensation is commensurate to the actual work
they do. Employers and supervisors should acknowledge the achievements and
accomplishments employees acquire. The study recognized employee performance
indicators which include employee retention, absenteeism levels, exceeded targets,
employee satisfaction, higher esteem and confidence, budgetary savings, or losses,
minimized resources wastage, and relative ranking.
Organizations can improve employee performance by employee empowerment,
which is a way of motivating them and has an effect on increasing performance.

36
Employees should be encouraged to make decisions with regard to the work they
perform, input in managerial decision-making, and tasks delegated. Organizations
should also provide job security, bonuses, and incentives on achievement of target as
these HRM Practices have a strong correlation with employee performance. Other
practices to be considered are decision making, allowing employees to plan
execution of their duties, delegation, and equipping them with job related skills, set
achievable targets, incorporate them in task setting, evaluate them fairly, increase
salary on achievement of set targets, and offer administrative rewards (Munjuri,
2011).
2.4 Empirical Review
Studies by Aguinis and Kraiger (2009), stated that many benefits accrue from
training such as innovation, tacit skills, adaptive expertise, technical skills, self-
management skills, cross-cultural, adjustment and improved performance. They
stated that recognition of benefits from training activities has made many countries in
the world to adopt policies to improve training design and delivery which in turn lead
to improved human capital and greater economic prosperity. Thus organizations
should conduct needs assessment tests and use technology for training and provide
trainees with adaptive guidance. Studies by Aguinis and Kraiger (2009), state that
training should be incorporated with other human resource activities such as
employee selection, performance management and rewards in order to succeed.
Studies by Appiah (2010), posit that training varies with organizations in terms of
amount, quality and quantity.
She revealed that the following factors influence training: quality, quantity of
training and development activities, change in external environment, extent of
internal change, availability of suitable skills within current employees, and
management perception of training as a motivator in work. Studies by Ongori and
Nzonzo (2011) revealed that training and development improved organizational
effectiveness, enhanced organizational competitiveness and retention of human
capital. They also mentioned that Human resource practices (HRM) should be added
to the training component to make it complete.

37
Training is an aspect of human resource practices that help in enhancing employees’
skills, knowledge, and competences thus improving employees’ ability to perform
more efficiently on current jobs and future assignment (Falola et., al. 2014). The
level of competency, skills and ability of the workforces of an organization
influences its ability to preserve its obtained positions and gain competitive
advantage (Armstrong, 2010, & Houger, 2006). Meanwhile, employees competence,
skills and pro-activeness is directly proportional to the level at which organization
can compete with others. Organizations are confronted with increased competition
resulting from changes in technology, economic environments and globalization
(Nassazi, 2013).
Training plays an important role in employee performance. This is because through
training, skills and knowledge are passed from the trainer to the trainee especially on
new products/services and technology. It is through training that one builds the right
attitudes towards work and unlearns the negative ones. When training is
administered, it leads to effectiveness in service delivery and also makes the
employees more confident at work hence job satisfaction is achieved (Ngo et.al,
2010).
There has been a lot of research to support the fact that employee performance can
improve through training by building a sense of teamwork among employees and to
develop specialized financial skills (Chiaburu, 2005). In addition to the
aforementioned, one can acquire networks, transfer technology, develop commercial
entities and acquire new and better management techniques (Maria et., al. 2012).
Elnaga and Imran (2013) further mentioned that a well-trained worker is able to
make best use of organizational resources along with minimum level of wastages.
Elnaga and Imran (2013) further mentioned that training sessions accelerate the
initiative, ability and creativity of the workforce and to avoid human resource
obsolescence that may occur because of demographic factors such as age, attitude or
the inability to cope with the technological changes.
According to Kiruja and Mukulu (2013), the purpose of skills development is to
provide a range of core skills (entrepreneurial, communication, financial
management and participation in decision making processes) so that individuals are

38
equipped for productive activities and employment opportunities (such as wage
employment, self-employment and income generation activities).
The way an organization train's its employees can influence its efficiency. Effective
training program helps in constructing a more conducive learning environment for
the workforce and train them to cope with the upcoming challenges more easily and
in time (Tai, 2006). These programmes can be held on the job (job rotation, lecture
method, Computer Based learning, Apprenticeship) or off the job (e.g. simulation
and role play). Off the job is argued to be more effective since employees are away
from work place and their concentration is fully at training. Depending on the
knowledge needed, organization’s structure and policies, the trainers too may be
hailing from within the corporation or outside the organization (Nassazi, 2013).
Mitikitu et., al. (2015) affirm that providing formal and informal training for new
employees has an influence on employee’s development. There are a number of
formal training courses and development program methods which may be used to
develop the skills required within an organization. These courses and programmes
are usually a set of defined and known programmes where the contents, durations
and all the details about the training are clear to both the organization and the
personnel to be trained. Unlike informal trainings and programmes, formal training
and programmes can be planned earlier and also plan for their evaluation. Employees
may undertake these courses and programmes while completely off work for a
certain duration of time or alternatively be present for work on a part-time basis
depending on whether the training is long-term (PhD, Masters, Bachelor’s, Diploma)
or short term (Certificate, Workshops, Seminars, Conferences) (Nassazi, 2013).
Nassazi (2013) argues that policies are necessary to ensure that employee
performance is evaluated, which in turn ensures that the appropriate training and
development take place. With the help of the performance appraisal reports and
findings, the organization can be able to identify development needs. However,
individuals themselves can help to indicate the areas requiring improvement as a
result of the issues raised in the performance appraisal process and their career path
needs.

39
Performance appraisal is a process that is carried out to enable both the individual
and the organization to analyze, examine and evaluate the performance of specified
objectives over a period of time. This process can take up formal and informal forms
(McCourt & Derek 2003). The purpose of performance appraisal has been classified
into two groups that is; the developmental and administrative purpose. The
developmental purpose of performance appraisal include providing performance
feedback, identifying individual strengths/weaknesses, recognizing individual
performance, assisting in goal identification, evaluating goal achievement,
identifying individual training needs, determining organizational training needs,
improving communication and allowing employees to discuss concerns. On the other
hand, administrative purpose includes documenting personal decisions, determining
promotion candidates, determining transfers and assignments, identifying poor
performance, deciding layoffs, validating selection criteria and meeting legal
requirements.
2.5 Critique of the Existing Literature relevant to the study
Most studies such as Brum (2007), Farooq (2011), Kipkebut (2010) and Ngethe
(2013) concentrated on benefits of training, training and commitment, productivity,
staff development practices, feedback, attitude, turnover and retention in corporate
organizations in both the developed and developing world, although training
enhances the development of both the individual employee and the organization. It
has been suggested that longitudinal studies be conducted and comparison should be
made with a control group to determine the relationship between training and
improved business performance (Ongori and Nzonzo, 2011).
Training need assessment or identification of skill deficits in the civil service is a
rarely performed activity. This could be due to the fact that most of the civil service
reform activities are derived from high level decision. Ongalo and Tari (2015)
Confer in Kenya electricity generating and distribution firms lacked clear policies
governing training and development, which had a negative effect on organizational
performance. Additionally, Golden (2003) study on training practices in Irish
software companies revealed that almost one third of respondents believed that the
40
training provided by their organization was not structured based on employee
feedback and requirements.
Goldstein (2007) says that, it is very unfortunate some programs have not gone
through appropriate needs assessment, and many organizations do not collect the
information to determine the usefulness of their own instructional programs. Thus,
there is need to carry out studies of the employees ‘views to get their insights,
because they are the envisioned consumers of the training events in terms of
motivation, attraction and retention.
The other aspect of inefficiency by the training departments in Africa is the
implementation of policies issued by the various directorates in charge of Personnel
Management. Training and capacity building in the public service has been guided
by circulars, general letters, policies, and other directives issued to the service from
time to time. Training needs analysis has not been adequately conducted thereby
making training more supply driven. This means the key areas of needs are rarely
targeted by training hence lack of effectiveness (Mbijiwe, 2013).
Career development and mentoring are also necessary practices that have not been
very prevalent in the public service in Kenya. Progression and promotions have in
most cases been determined by political, racial, ethnic and other un-friendly
considerations other than one’s abilities. It is clear that many public ministries do
not have a T.N.A to guide their training projections and priorities (Mbijiwe, 2013).
This is not an isolated case for Kenya as Sreekumar (2009) discovered the same of
the training departments in India. To stamp the justification further, Stewart (2011)
says it is unfortunate organizations sometimes place too much emphasis on the
techniques and methods of training and not enough on first defining what the
employee should learn in relation to desired job behaviors. In addition, fewer than
50% of all organizations even try to measure the value of training, and fewer still
calculate the return in monetary terms. This is true even of sales training which
would seem easy to measure. Just 11% of the companies attempt to assess the
payoffs of training on sales.

41
While apprenticeships provide the technical skills needed for paid employment, it is
unclear if apprentices receive the skills they need to be successful at self-
employment. This is important because many former apprentices become
unemployed for various reasons. For example, at the end of the formal
apprenticeship period, companies can release apprentices to seek employment
elsewhere. Some former apprentices may be unable to find paid employment, or
when they do, may find wages in the smaller firms to be lower than their pay in the
larger companies where they had received their training. Due to a lack of
employment or underemployment, an increasing number of former apprentices leave
formal wage employment and choose to enter into self-employment (Erskine et., al.
2012).
Some of the on the job training such as conferences are disadvantageous because it is
not easy to ensure that all individual trainees understand the topic at hand as a whole;
not all trainees follow at the same pace during the training sessions; focus may go to
particular trainees who may seem to understand faster than others and thus leading to
under training of other individuals (Mbijiwe, 2013).
Performance appraisal has been a nagging problem in work places even in the most
developed economies. As Obama (2006) notes of teaching in the U.S.A ,in exchange
for money, teachers need to become more accountable for their performance and
school districts need to have greater ability to get rid of ineffective teachers. So far
teachers’ unions have resisted the idea of pay for performance, in part because it
could be disbursed at the whim of a principal. This is a clear indication that there is
no clear set system to measure the teachers’ performance even in developed
economies like the USA. It is worse when it comes to appraising employees in the
poor countries mostly because of the poor accounting systems and the social cultural
and political lifestyles in such countries.
The importance of evaluation of training programs cannot be assumed, but this has
not made even the best of the best organizations to put a lot of emphasis on them.
According to Mbijiwe (2013), of the Fortune 500 firms about evaluation indicate that
most evaluations (86%) consist of trainee reactions that are written at the end of the

42
course. Relatively few efforts are made to collect information concerning
performance changes by means of follow-up on the job, which is when both the
trainee and the organization could discover whether the programs are achieving the
desired results and when the evaluation could provide feedback to the modifications
necessary to enable the program to work. When this evaluation is not done in such
companies, it leaves one wondering if this has been accepted as the norm.
It is however important to note that, if there are no proper systems and plans to deal
with the findings of the performance appraisal, the expected benefits of this process
for the organization may not be realized. Further still, although good performance
appraisal may be good for an organization, it may be bad if not professionally
handled. Depending on the appraisal feedback; negative or positive, its impact to the
employee may damage the organization if not taken well by the employee (McCourt
& Derek, 2003). It can demoralize the employee and sometimes may lead to losing
the key employees just because they could not take the appraisal feedback and feel
that they will be better off somewhere else.
Arshad (2008), in his study on the “Role of Evaluation of Training in Designing
Training Programs in Institutions of Government, Private and Public Sector and
Banking Institutions in Andhra Pradesh”, found that the training systems is weak;
evaluation of training in many organizations are unscientific and do not indicate
transfer of learning on the job, and therefore suggested that the training evaluation
system could be improved by simulated learning exercises, group discussions, video
films and observation techniques
Scholars have revealed that motivation can be met in terms of promotions and salary
increments but have not mentioned other ways in which employees can be
empowered such as career development and other non-financial ways of
empowerment. Wairimu, Gachunga, and Mumbo (2013), posit that Universities
should use other motivational strategies for instance through appraisal procedures to
evaluate staff and enhance their development.
According to Mbijiwe (2013), performance-contingent rewards undermine intrinsic
motivation; however, if the reward given to the employee conveys that the employee

43
has performed on a truly outstanding level, the reward would serve to solidify that
employee's sense of competence and decrease the negative effect on that employee's
intrinsic motivation.
Kiruja and Mukulu (2013) suggested that people are motivated to seek social equity
in the rewards they receive for high performance. According to them, the outcome
from job includes; pay recognition, promotion, social relationship and intrinsic
reward. To get these rewards various inputs needs to be employed by the employees
to the job, such as time, experience, efforts, education and loyalty. They suggested
that, people tend to view their outcomes and inputs as a ratio and then compare these
ratios with others and turn to become motivated if this ratio is high. Work motivation
does not determine employee’s level of performance, but it does influence his/her
effort toward performing the task.
Deci (2000) conducted and replicated an experiment that showed the negative impact
of monetary rewards on intrinsic motivation and performance. A group of college
students were asked to work on an interesting puzzle. Some were paid and some
were not paid for the work. The students that were not paid, worked longer on the
puzzle and found it more interesting than the students being paid. When the study
was brought into a workplace setting, employees felt that their behavior was being
controlled in a dehumanizing and alienating manner by the rewards. It was
discovered that rewards would seriously decrease an employee's motivation to ever
perform the task being rewarded, or one similar to it, any time in the future. Another
observation of the study was that employees would expect a reward every time the
task was to be completed if the reward was offered at one time. Employees would
require the reward in order to perform the job and would probably expect the reward
to increase in amount. If the rewards were not increased or if they were taken away
they actually served as negative reinforcement.
2.6 Research Gaps
Training is important to employee performance. Much research has been conducted
on influence of training on employee’s performance in various sectors of Kenya
including banking, manufacturing and education. There are many studies on nexus

44
between training and performance; however there is lack of studies conducted on
influence of training on performance among non-teaching staff at management level
in selected public universities. Therefore the need study the influence of training on
the performance of non-teaching employees at management level in selected public
universities. The study identified the need to adopt motivation as a moderator
because most on the studies conducted earlier had used motivation as an independent
variable. Moderators explain the conditions under which an effect or relationship is
likely to be present and likely to be stronger (Aguinis and Kraiger, 2009). Despite the
increasing effects of training of organizational employees, it is worth noting that
while much is known about the economics of training in the developed world, studies
of issues associated with training in less-developed countries are rarely found hence
the need for this study.
2.7 Chapter Summary
Generally, this chapter addressed various theories relevant to training for instance,
reinforcement theory, social learning theory, goal setting theory, and adult learning
theory.
Skinner (2013), states that people are motivated to perform or avoid certain
behaviors due to past experiences that arise from these behaviors. Positive
reinforcement results from pleasurable behavior outcome
Reinforcement theory focuses on reinforcing a desirable behavior or inhibiting an
undesirable behavior through certain motivators or stimuli. Social learning theory is
an approach that synthesizes principles of learning with those of cognitive
psychology. Goal setting theory focuses on the assumption that learning is influenced
by an individual’s life goals. Adult learning focuses on explaining that adults have a
tendency to learn and to know the purpose behind the learning. They learn with a
view to gaining experiences and solving problems (Azara, 2013). Training Needs
Assessment refers to a process of identifying performance requirements and the
knowledge, skills, and abilities needed by an organization’s workforce to achieve the
requirements (Nyongesa, et al. 2014). Mode of Training refers to a particular type, or
technique of training (Hornby, 2002). The amount of time (days) dedicated to deliver

45
learning content (Tracey 2015). Training feedback refers to information that
employees receive while they are performing on how well they are meeting
objectives (Noe, 2010).
Motivation refers to strength and direction in behavior and the factors that influence
people to behave in certain ways. It can also refer to goals that individuals have and
how individuals choose their goals, and ways in which others try to influence their
behavior (Armstrong, 2009). Performance refers to how well employees perform on
the job and assignments given to them against the accepted performance standards
set by the organization (Appiah, 2010)Ongori and Nzonzo (2011) revealed that
training and development improve organizational effectiveness, enhance
organizational competitiveness and retention of human capital. Studies by Aguinis
and Kraiger (2009), stated that many benefits accrue from training such as
innovation, tacit skills, adaptive expertise, technical skills, self-management skills,
cross-cultural, adjustment and improve performance
Effective training program helps in constructing a more conducive learning
environment for the workforce and train them to cope with the upcoming challenges
more easily and in time (Tai, 2006). These programs can be held on the job (e.g. job
rotation, lecture method, Computer Based learning, Apprenticeship) or off the job
(e.g. simulation and role play).Employees may undertake these courses and
programmes while completely off work for a certain duration of time or alternatively
be present for work on a part-time basis depending on whether the training is long-
term (PhD, Masters, Bachelor’s, Diploma) or short term (Certificate, Workshops,
Seminars, Conferences)
Nassazi (2013) argues that policies are necessary to ensure that employee
performance is evaluated, which in turn ensures that the appropriate training and
development take place. Flippo (2001) adds that employee performance in
institutions results in a more motivated work force that has the drive for higher
productivity, quality, quantity, commitment and drive
The chapter also reviewed the empirical literature, critiqued it and gave research gaps
that emerged from the review.

46
CHAPTER THREE
RESEARCH METHODOLOGY
3.1 Introduction
This chapter addressed the following aspects: research design, sample population,
target population, sampling techniques, and measurement of variables, data
collection instruments, procedures for data collection, data processing and data
analysis.
3.2 Research Design
The study adopted the Survey design and Correlational research designs. Scholars
have stated that survey method is associated with deductive approach; it is a popular
and common strategy in business and management research (Mugenda & Mugenda,
2003; Saunders et al. 2009). Survey design answers questions with “who, what, how
much, and how many”. Survey design allowed a large amount of data to be obtained
by use of a questionnaire which was administered to a sample; the data was
standardized, and allowed easy comparison and was relatively easy to understand
and explain. Survey strategy allows collection of quantitative data which is analyzed
quantitatively by use of descriptive and inferential statistics, (Mugenda & Mugenda
2003). Data which has been collected can be used to infer possible reasons for
specific relationships. The study gained more control over the research process and
during sampling it generated the findings which represented the entire population at
an affordable cost than collecting data for the whole population.
The idea of a survey is that the researcher obtains the same kind of data from a large
group of people or events in an economical, standardized and systematic way. The
researcher then looks for patterns in the data that can be generalized to a large
population and the group targeted (Martyn, 2010). Survey involves asking questions,
interviewing, which form the basis of deriving information (Oates, 2010).
Mugenda and Mugenda (2003), also indicates that Correlational research design is
basically concerned with assessing relationships among variables. It is thus based on
the premise that if a statistically significant relationship exist between two variables,

47
then it is possible to predict one variable using the information available on another
variable.
Correlation is the statistical tool which is used to describe the degree to which one
variable is linearly related to the other (Richard, 2009). The range of significant
correlation lies between negative one (-1) and positive one (+1). It is strongly
positively correlated when it is near positive one (+1).
Akala (2012), Waiganjo (2013) and Sila (2014) all in ttheir studies adopted the
survey and correlation design. It is on the backdrop of wide scholary usage of the
two research designs that informed the current study.
3.3. Population
Population is defined as the aggregate of all cases that conform to some sort of
specifications, (Nachamias & Nachamias, 2009). In the study non-teaching
employees at management level are composed of employees in management cadres
in grade 13, 14 and 15. It is the total collection of elements about which the study
wishes to make some inferences (Cooper & Schindler, 2011). In this case, the study
population consisted of all non –teaching employees in management level in the
selected twenty-two public universities in Kenya, who constitute a total of 900. The
list of the public universities was attached as Appendix 3. The tabulated form of
study population is indicated in Table 3.1.

48
Table3.1: Study Population
Name of University Total No of Non-Teaching staff in
Management Level Grade 13 to 15
JKUAT 67
KU 65
MOI 63
ELDORET 50
UoN 66
MMUST 50
Egerton 54
Maseno 35
Dedan Kimathi 30
Chuka 32
Multimedia 43
Technical university-Mombasa 30
Pwani 30
Kisii 32
South Eastern 30
Masaai Mara 30
Jaramogi Odinga Odinga 37
Laikipia 34
Kabianga 30
Technical University –NRB 35
Karatina 30
Meru 27
TOTAL 900
3.3.1: Target Population
Target Population is the population to which a researcher wants to generalize the
results of a study (Mugenda & Mugenda, 2003). In this study, the target population
was selected by use of purposive sampling. Purposive sampling is a non-probability
sampling procedure in which the study chose participants arbitrarily for their unique
characteristics or their experiences, attitudes, or perceptions (Cooper & Schindler
2011; Saunders et al. 2009). Purposive sampling was used because it allows

49
generalizability to a large population with a margin of error that is statistically
determined. It allows use of inferential statistics. Statistical indices calculated on the
sample can be evaluated to determine the degree to which they accurately represent
the population parameters (Mugenda & Mugenda 2003). The eight (8) Universities
that were sampled for the study included JKUAT, KU, Moi, Eldoret, Egerton,
MMUST, Maseno, and University of Nairobi.
The study was conducted in 8 public universities in Kenya due to the following
reasons: they are the oldest universities in Kenya, and have substantial numbers of
non-teaching employees to sustain the study. The eight were selected by Purposive
sampling method. According to Mugenda and Mugenda (2003), 10% of the required
target population was adequate, and 30 cases are required per group, for statistical
analysis. Sekaran and Bougie (2009) concur that research was possible with samples
of small sizes of 10 to 20.The views from the two Scholars justified the study to be
conducted in the 8 public universities which constituted 39 % of the target
population.
Table3.2: List of Eight Universities in Target Population
Name No of Non-teaching
Employees at Management
Level in Public Universities
in Kenya Grade 13 to 15 of University
JKUAT 67
KU 65
MOI 63
Eldoret 50
UoN 66
Egerton 54
Maseno 35
MMUST 50
TOTAL 450

50
3.4. Sampling Frame
According to Sekaran and Bougie (2009) a sampling frame is a physical or actual
representation of all the elements in the population from which the sample is drawn.
In this study, the sample population consisting of all non-teaching staff at
management level employed in grade 13 to 15 was worked at 39 % as represented in
Table 3.3.
3.5 Sample size and Sampling Technique
The sampling method was chosen according to Kothari (2008), and (Sekaran &
Bougie, 2009), who maintain that stratified random sampling helps to achieve
intended representation from various sub-groups in any given population, and
guarantees minimal bias. Random sampling also assists in equalizing between groups
the amount of error that occurs as a result of extraneous variables.
In the study, the population was divided into meaningful, subsets that do not overlap
and, the subjects were chosen from each subset. The study used stratified and
systemic random sampling because the population was heterogeneous. The total
population of non-teaching employees in the target population was 450.
The Sample given was statistically determined using the indicated formula, since the
total population was less than 10, 000 (Mugenda & Mugenda, 2003).
n = z2p q
d2
Where:
n= the desired sample (if the population is greater than 10,000).
z= the standard normal deviate at the required confidence level
p=the proportion in the target population estimated to have characteristics being
measured.
q=1-p
d= the level of estimated significance set.
For instance, a target population with a characteristic .50, the z -statistic is 1.96, and
desired accuracy at 0.05 level, the sample size as follows:

51
n = (1.96)2 (.50) (.50) == 384
(0.05)2
In this case, the target population was less than 10,000, and the required sample size
was smaller. To get the sample size therefore, the formula given by Mugenda and
Mugenda (2003) was adapted in this study.
nf = n / 1+ n)/N
Where:
nf= desired sample size when the population is less than 10,000
n = desired sample size when population is more than 10,000
N= the estimate of population size
For instance:
= 384/ 1+450)/384
= 384 / 1+1.17
= 384/ 2.17
nf= 176
Percentage=176/450*100 =39%
The study worked with 39%. Mugenda and Mugenda (2003), recommend that 10%
of the accessible population is adequate, and at least 30 cases are required per group,
for statistical data analysis.

52
Table3.3: Sample Size
Grades of the Non-
Teaching Employees at
management level
Name of selected
public university
No of Non-
Teaching
Employees at
management level
13 14 15 Sample
Size
JKUAT 67 11 11 5 27
KU 65 12 11 4 27
MOI 63 11 10 3 24
Eldoret 50 9 8 3 20
UoN 66 11 11 3 25
Egerton 54 9 9 2 20
Maseno 35 5 5 3 13
MMUST 50 9 8 3 20
TOTAL 450 77 73 26 176
3.6 Data Collection Instruments
The main research instruments were questionnaires, and each item of the
questionnaire addressed a specific objective, and research question, of the study
(Mugenda & Mugenda, 2003). Both closed ended (structured) questions and open
ended (unstructured) questions were used in the questionnaire. Primary data was
collected through questionnaires, while secondary data was obtained from published
materials and reports from other scholars. Close ended questions were used because
they are easier to analyze since they are in a format that allowed one to use. They
were also easier to administer, because they had alternative answers.
On the other hand, Open ended questionnaires allowed for greater depth of response.
The respondents may give more information on the topic and they stimulate the
individual to think deeper (Mugenda & Mugenda, 2003).Questionnaires generally are
low cost, free from bias of the interviewer as answers are in respondents’ own words,
respondents have adequate time to give well thought out answers, and inaccessible
respondents can be conveniently reached. Large numbers can be accessed, and
results can be more dependable and reliable (Kothari, 2008). Likert scale was used
on the questionnaires to determine respondents’ scores that are high and those that

53
are low, for instance 5, representing strongly agree, 4 agree, 3 Not sure, 2 Disagree,
to 1, Strongly Disagree (Kothari, 2008; Sekaran & Bougie, 2009; Saunders, et al.
2009).
Most of the employees who fall in the supervisory category were also respondents
and gave the same explanations confirming that public universities conducted TNA
and exposed employees to various trainings. They concurred that some training
sessions were short, others long and employees attended seminars, conferences and
workshops. The supervisors revealed that employees were given feedback in various
forms such as reports, verbal encouragement/appreciation and certificates on
completion of training.
3.7 Data Collection Procedures
Visits were made to the institutions with intention of seeking permission to distribute
the questionnaires. Structured questionnaires were used to collect data from
respondents, since questionnaires are more objective than interviews, and they gather
information in a standard way (Kothari, 2008). With the help of the research
assistants, the researcher administered 176 questionnaires after giving notification
and the time for distributing questionnaires. There was need to win the confidence of
the respondents that whatever information gathered was confidential and it was used
for research only (Nachamias & Nachamias, 2009).
The study was as objective as possible, avoiding intrusion on respondents’ privacy
which could have made them not respond freely. Generally, the study used the drop
and pick method as well as one on one interviews in the administration of the
questionnaire with the help of a research assistant. According to Kothari (2008),
interview method allows for gathering of more information and in great depth,
interviewer can overcome resistance and allows for great flexibility in restructuring
of questions. In addition to the aforementioned, personal information can be obtained
easily and the interviewer can collect supplementary information about the
respondent personal characteristics and environment which is of great value in
interpreting results.

54
The responses from the questionnaire constituted the source of primary data, while
secondary data was obtained from published materials and reports.
3.8 Pilot Testing
Before the questionnaire was administered in the field or administered on
respondents it was exposed or tested on 10% of the respondents, that is, 17
respondents. The pilot test intended to refine the questionnaire to reduce problems
that could be experienced by respondents. Using Cronbach’s Alpha test known as
KR20 Mugenda & Mugenda, (2003) enabled the attainment of reliability and validity
of the questionnaire that was used to collect data.
The Formula of cronbach’s Alpha test was as follows:
KR20 =(K) (S2 -∑s2 )
( S2) (K-1)
Where:
K20 =Reliability coefficient of internal consistency
K = Number of items used to measure the concept
S2 = Variance of all scores
s2 =Variance of individual items
When results indicated high co-efficiency, it implied that correlation is high, thus,
there was consistency in the items measuring the concept. In this case, a result of
Alpha of 0.70, and above was regarded by the study as acceptable since it was
indicative of high reliability (Sekaran & Bougie 2009).
After pilot testing, the questionnaire and interview guide were revised to incorporate
the feedback that was provided
3.8.1 Reliability
Reliability refers to the extent to which the data collection techniques or analysis
procedures yield consistent findings, free of bias. It is concerned with whether
measures give same results at other occasions, whether similar observations were
reached by other observers, and whether there was transparency in how sense was
derived from raw data (Saunders, et al. 2009).

55
3.8.2 Validity
At the same time, there was need to test validity, that is, the accuracy and meaning of
inferences, based on results of the research. Validity gave the degree to which results
obtained from the analysis of data actually represented the phenomenon under study,
and the variables of the study (Mugenda & Mugenda, 2003). In Factor analysis when
factor loadings are above 0.4, they are valid. This therefore means that they will be
retained for analysis stage.
3.9 Data Analysis and Presentation
3.9.1 Data Analysis
Descriptive analysis was used; this included the use of weighted means, standard
deviation, relative frequencies and percentages (Mugenda and Mugenda, 2003).
Descriptive statistics were used to analyze Qualitative data while SPSS (Version 20)
and stata (v.12) were used to analyze Quantitative data (Cooper & Schindler, 2011;
Saunders, et al. 2010; Sekaran & Bougie, 2009; and Mugenda & Mugenda, 2003).
The term analysis implies computation of certain measures along with searching for
patterns of relationships that exist among data groups. Generally, data analysis
involved a number of closely related operations which were performed with intent of
summarizing the collected data, and organizing it in a way that it answers the
research questions, Kothari (2008). In the study, editing, coding, classification and
tabulation of data was conducted using SPSS (Version 20). Editing ensured that data
was accurate, consistent with other facts gathered, uniformly entered, as completely
as possible, and was well arranged to facilitate coding and tabulation. Field editing
was done as soon as possible. Central editing was done after all forms or schedules
were completed and returned to the office. Coding is the process in which numerals
or other symbols are assigned to answers to enable responses to be put in categories,
or classes. Classification of data involves arranging data in groups or classes on the
basis of common characteristics. It was done according to attributes or class intervals
(Kothari, 2008). Before analysis, all the outliers were dropped and using the means
substitution method all missing values within the data set were replaced with the
56
sample mean. After replacement, the analysis was run as if all complete cases were
present. Data was analyzed using readily available analysis software, SPSS Version
20 and Stata Version 12, (Saunders, et al. 2009).
The equation for multiple regressions was as depicted in the equation below:
Y = β0+β1 x1 +β2 x2+ β 3 x3 +β4 x4 +β5 x5 + ε
x1, x2, x3, x4 are independent variables x5is a moderating variable while Y is
the dependent variable.
β0, is the Constant.
x1 is Training needs assessment
x2 is Mode of training
x3 is Training duration
x4 is Training feedback
x5 is Motivation
Y is Performance
ε is error term assumed to be normal in distribution with mean zero and
constant Variance.
The number of equations depended on the number of independent variables.
Individual effect of two variables taken separately gave the coefficient of multiple
correlations as follows,
r =∑(x- x) (y-ȳ)
√(∑ ( x-x)2 (y- ȳ)2)
Multiple regression was preferred because it gave expectation of better prediction.
From multiple predictors, one can avoid picking or depending on a single predictor,
can ‘avoid’ non-optimal combinations of predictors’ for instance total scores.
57
Multiple regression allowed the examination of more sophisticated research
hypotheses, than is possible when using single correlations. This study was
exploratory since it aimed to seek new insights into phenomena, to ask questions, and
to assess the phenomena in a new light (Saunders et al. 2009).
The study used regression and correlation analysis. Regression was used to examine
whether the coefficients of the independent variable can predict the dependent
variable. Correlation was used to examine the strength and direction of the
relationship between the independent and dependent variable. In this case, the study
employed multiple Regression and correlation because there are more than two
independent variables Kothari, (2008). Multiple regressions was preferred because it
gave expectation of better prediction. From multiple predictors, one can avoid
picking or depending on a single predictor, can avoid non-optimal combinations of
predictors’ for instance total scores.
3.9.2 Data Presentation
Saunders, et al. (2009), stated that after data entry, and checking for errors, the next
stage is analysis. Diagrams may be used to help understand data, and assist choice of
analysis .Use of computer packages such as SPSS (Version 20) made it easier to
present data. Each Figure and Table was well labeled at every stage. Computer
software was helpful, and this called for saving all the diagrams and tables generated
electronically. Bar graphs, pie charts, Bar charts, Histograms, line graphs, were used.
Quantitative data was presented by use of statistical tables and Bar Graphs while
qualitative data was presented descriptively (Saunders, et al. 2009; Sekaran &
Bougie, 2009).
3.9.3 Measurement of variables
Measurement can be defined as a procedure in which the researcher assigns symbols
or numbers to empirical properties according to rules, (Nachamias and Nachamias,
2009). In this case a likert scale was used to obtain attitudes of respondents. The
scale consisted of five points ranging from 5=strongly agree, 4=agree, 3=not sure,
2=disagree and 1=strongly disagree.

58
Training Needs Assessment: it is geared towards identifying performance
requirements, knowledge, skills and competencies needed by an organizations
workforce to achieve the requirements (Nyongesa et al. 2014). The sub-variables for
TNA were: Skills, knowledge and competency level. A five-point likert scale (5 =
strongly agree, to 1= strongly disagree) was used for each of the statements
corresponding to the various parameters of TNA.
Training Mode: this refers to a particular type or technique of training (Hornby,
2002). There are two modes of training, namely on the job training and off the job
training. On the job training is a mode of training exposed to new employees and
those who lack experience at a designated place within the work place (Mullins,
2010). Sub-variables considered in this category include: Job rotation, lecture
method, computer based learning and apprenticeship)
Off the job training is a form of learning administered away from the place of work
and therefore reduces interruptions during training sessions. It is highly valued due to
its productive nature of interaction and involvement (Armstrong, 2009; Ongori &
Nzonzo, 2011). Sub-variables included simulation, role playing and e-learning by use
of technology. A five-point likert scale (5 = strongly agree, to 1= strongly disagree)
was used for each of the statements corresponding to the various parameters of
Training Mode.
The amount of time (days) dedicated to deliver learning content (Tracey 2015).
Training Duration had two main sub-variables; long-term and short-term duration.
Long term training (more than six months) encompassed sub variables such as: PhD,
Masters, Bachelors and Diploma programs. Non-teaching employees may willingly
pursue any of the above mentioned programmes as approved by training committee
or undertake as an individual. Knowles (2003), theory of Andragogy states that
adults seek knowledge outside normal learning schedule of the youth to enable them
improve on certificates. This can enable them earn promotions, get better salary and
other benefits (Odinga 2010, Kipkebut 2010). Short term duration (less than six
months) refers to workshops, seminars, conferences, symposiums, continuing
enrichment courses and certificates. A five-point likert scale (5 = strongly agree, to

59
1= strongly disagree) was used for each of the statements corresponding to the
various parameters of Training Duration.
Training Feedback: this is the process whereby trainees fill forms expressing
experience during the training (Opu, 2008). The sub-variables for Training Feedback
were Performance Appraisals, Evaluation/interviews and
Questionnaires/Observations. A five-point likert scale (5 = strongly agree, to 1=
strongly disagree) was used for each of the statements corresponding to the various
parameters of Training Feedback.
Motivation: Refers to the process in which an individual wishes and decides to act in
a specific way of people (Opu, 2008). Motivation may be due to intrinsic or extrinsic
factors (Mullins, 2010). The sub-variables for motivation were in two classifications;
financial and non-financial benefits accrued from training. Financial benefits
included better remuneration, salary and promotions; while non-financial included
higher responsibilities, recognition interms of compliments and certificates, and
personal advancements. .A five-point likert scale (5 = strongly agree, to 1= strongly
disagree) was used for each of the statements corresponding to the various
parameters of Motivation.
Performance: Refers to how well employees perform on the job and assignments
given to them against the accepted performance standards set by the organization
(Appiah, 2010). In this case, the sub-variables for non-teaching employees at
management level in selected public universities included; Teamwork, Adheherance
to policy, Accomplished targets and goals. A five-point likert scale (5 = strongly
agree, to 1= strongly disagree) was used for each of the statements corresponding to
the various parameters of Performance.

60
CHAPTER FOUR
RESEARCH FINDINGS, ANALYSIS AND DISCUSSIONS
4.1 Introduction
This chapter entails information on results of analyzed responses and further
explanations for all the items contained in the questionnaire which originated from
the research objectives. The general Objective of the study was to establish the
influence of training on the performance of non-teaching employees at management
level in selected public universities in Kenya. The chapter entails the interpretation
and presentation of findings established from the study which have been developed
by use of descriptive and inferential statistics.
4.2 Response rate
A total of 176 questionnaires were distributed, 3 were completely destroyed and
illegible, 173 questionnaires were returned in sound condition, representing 98%. In
this case the response rate of 98% was considered acceptable as supported by
Mugenda and Mugenda (2003) who posit that a response rate of 70% and above is
excellent. Bell and Bryman, (2011) also agree that a response rate of 60-70 is
acceptable; 70-85 is very good, and 85 and above is excellent. The study managed to
survey the eight public universities in Kenya with a percentage of response as
indicated in Table 4.1. JKUAT 15%, KU 16%, UoN 14%, Moi 14%, University of
Eldoret 12%, Egerton University12%, Maseno 7%, and MMUST 12%. The eight
universities are among the oldest universities in Kenya and had adequate population
to sustain the study.

61
Table4.1: Rate of Responses
University
Number of
respondent
percentage
Jomo Kenyatta University 26 14.9
of Agriculture and Technology
Kenyatta University 27 15.5
Moi University 24 13.8
University of Eldoret 20 11.5
Egerton University 20 11.5
Maseno University 11 6.9
University of Nairobi 25 14.5
Masinde Muliro University 20 11.5
of Science and Technology
Total 173 100
4.3 Results of Pilot Testing
Seventeen questionnaires were tested on the target population, to find out the correct
validity of the study. The 17 questionnaires represented 10% of the target population.
The pilot testing is a trial collection of data, to detect weaknesses in design and
instrumentation and provide proxy data for selection of a probability sample. The
process involves the assessment of questions and instruments before the start of a
study. It helps to establish errors in questions, question sequencing, instructions, and
other important pertinent issues pertaining to the study (Cooper & Schindler, 2011).
10% of the target populations were tested to derive validity and reliability of the
instruments. Cronbach’s Alpha result should range from 0.7 and above (Mugenda &

62
Mugenda, 2003).The closer the coefficient is to 1, the more reliable the
questionnaire, and the more it will have high validity. The results of the pilot testing
are depicted in Table 4.2.
4.3.1 Reliability of the instruments
Reliability of the instruments was checked through the Cronbach’s Alpha coefficient.
The results in Table 4.3 were presented according to the variables. The results show
that all variables had a reliability of Cronbach’s Alpha of 0.7and above, hence were
acceptable. Mugenda and Mugenda (2003) posit that a high coefficient implies that
there is high correlation among items and indicates that there exists consistency
among the items in measuring the concept of interest. In this case a coefficient of 0.7
and above is acceptable.
Table 4.2: Reliability Statistics
Variable Cronbach’s Alpha No: of Items
Training needs assessment 0.702 6
Training mode 0.800 10
Training duration 0.705 5
Training feedback 0.710 8
Motivation 0.810 7
Performance 0.733 8
In Table 4.2, Motivation which is the moderating variable had the highest reliability
at 0.810, followed by Mode of training 0.800, Feedback 0.710,Training duration
0.705 and training needs assessment 0.702.The dependent variable was Performance
had a reliability of 0.733.The reliability of all variables was 0.872 as indicated in
Table 4.3.

63
Table 4.3: Reliability Statistics of all Variables
Cronbach’s Alpha Number of Items
0.872 44
4.4 Respondents demographic information
The demographic information depicted in Figure 4.1 and 4.2 will help the researcher
understand the general view of the respondents and is divided into two components,
those that relate to the individual gender and age in years.
4.4.1 Gender of Respondents
In terms of gender, the males’ respondents were 54% while the females constituted
46%. This indicated that there were more males in the study group than females as
shown in Figure 4.1. The assertion was in agreement with the study by Paula, (2015)
in which data for census showed 86% males and 74% females hence more male than
female counterpart employees in the labor market.
Figure 4.1: Gender of Respondents

64
4.4.2 Age of Respondents
The study consisted of five age groups as shown in Figure 4.2. Employees in the age
of 31 to 40 years were 24%, those with the age of 41 to 50 years, 30% and 51 to 60
years with 29%. The remaining 17% was distributed between age group 20 to 30
years (15%) and those over 61years 2%. The percentages in figure 4.2 show the age
distribution of the individuals employed in the selected public universities in Kenya
who were addressed in the study. It showed that there were few numbers of
individuals in the age bracket 20 to 30 years and a marginal number with over 61
years and above.
This was deduced to be true of the age distribution of the working Kenyan
population in general and other employment regulations which call for the retirement
of individuals over 60 years. The retirement age and pensions ACT CAP.189 states
that the government of Kenya raised the retirement age from 55 to 60 years with
effect from 1stApril 2009. It was actually established that very few employees are
found in grade 15, Registrar, which is a preserve of those who are highly learned and
have the longest serving experience in the university. Usually a university may have
2 or at most three full Registrars, thus the explanation for few employees in the
cadre. In the case of age 20-30, these are the few young employees who just qualified
to join management grades at the university.
Figure 4.2: Age in Years

65
4.4.3 Level of Education
Table 4.4 shows the cross–tabulation of gender and level of education. Majority of
the respondents comprising of 48% had a master’s level of education with 54%
males and 46% females. Those with a degree level comprising of 41% were split into
two halves of males on one side and females on the other. Lastly two thirds of those
with doctoral degree were male while a third was female but comprised of 11% of
the total number of respondents. The distribution showed that there are more males
53.4% than females 46.6% which may be explained by the characteristics of the
population in general and other social factors about the population studied at
management level.

66
Table 4.4: Education Levels
Level of education
Gender Male Degree Masters
PhD
(Doctoral) Total
Count 33 42 12 87
% in gender 37.90% 48.30% 13.80% 100.00%
% in level of 49.30% 53.80% 66.70% 53.40%
Education
Female Count 34% 36% 6% 76%
in
gender 44.70% 47.40% 7.90% 100.00%
% in level of 50.70% 46.20% 33.30% 46.60%
Education
Total Female Count 67 78 18 163
%in gender 41.10% 47.90% 11.00% 100.00%
% in level of 100.00% 100.00% 100.00% 100.00%
Education
4.4.4 Departments
The study was structured to collect data from seven departments in the universities.
As is shown in the table 4.5, administration, library, research and academic divisions
had the highest distribution of the respondents as opposed to other departments. The
highest percentage was that of administration at 24.3%, followed by Academic 17.3
%, Research 16.8%, Library 15.6% with the other departments; Estates, Transport
and Hostel having 6.9%, 6.9% and 8.7% respectively.

67
Table 4.5: Departments of Respondents
Department
No of
Respondents percentage
Administration
43 24.3
Library
26 15.6
Estates
12 6.9
Transport
12 6.9
Hostel
15 8.7
Research
29 16.8
Academic
30 17.3
Others
6 3.5
Total 173 100
4.4.5 Cadres
Three jobs groups were studied and job group 13 and 14 had almost equal
distribution of 42% each with the remaining 15% belonging to job group 15 as
indicated in Table 4.6.
Table 4.6: Cadre
Job cadre No of Respondent percentage
Grade 13
74 42.8
Grade 14
73 42.2
Grade 15
26 15
Total 173 100
4.4.6 Experience
Figure 4.3 showed distribution of the three groups that addressed the study
population based on the number of years of experience. Those with 11 to 20 years’
experience comprised 43.7%, those having 5 to 10 years’ experience being 33.3%
while those who had 21 to 30 years’ experience were 20.7%. Employees having 31
and above years of experience were 2.3%. The figures may in large part be explained
by the real age distribution of the respondents as per the years of experience in
Figure 4.3.

68
Figure 4.3: Years of Experience
4.4.7 Number of trainings attended
Figure 4.4 show that 48.6% of the respondents had attended more than two trainings
at their workplace. Those who had attended two trainings were 32.4%, with the
remaining 19.1% having attended once. This distribution may largely be explained
by the number of years that each respondent had worked or the department within
which each individual works, such that those who had attended more than two
trainings must have worked for longer periods of time than those who worked for
few years.

69
Figure 4.4: Frequency of Training Needs
4.4.8 Mode of Training
Figure 4.5 indicates that, more than half 52% of the individuals attended induction
training more than any other type of training. This number is followed by those who
attended management training at 29.3% with further 9% having attended technical
training. Skills presentation as a type of training has been attended by 10.3% of the
study respondents. The results are largely attributed to the fact that each individual
had to attend induction training at the time of appointment and the nature of
exclusivity of the management training.
Figure 4.5: Mode of Training
4.4.9 Exposure to Training
Table 4.7 indicates that eleven (11) respondents consisting of 6% confirmed that they
had not been exposed to training at all. One hundred and five (105) respondents who
constituted 61% confirmed that they were exposed to frequent trainings. Another
group of fifty-seven respondents constituting 33% confirmed to very frequently
attend trainings. In this case there are those who never go for trainings, others happen
to be enlisted once in a while, but another group is always enlisted for all trainings.

70
Table4.7: Exposure to Training
Frequency No of Respondents percentage
None at all
11 6.3
Frequent
105 60.9
Very
frequent
57 32.8
Total 173 100
4.4.10 Duration of attended Trainings.
Figure 4.6 indicates that 10% had attended training of over one year. With reference
to the time taken by training, those who had attended two weeks training were 47%
while those with one month training were 43% of the respondents.
Figure 4.6: Duration of attended Training
4.4.11 Complaints experienced during training sessions
Though there were infinite number of complaints that arose during training period
the study confined itself to only four. The reasons given fall into two categories such

71
as personal, the trainings taking employee’s work time (22%) and that trainings
being boring (21%). The other reasons given were as follows; too much breaks
during training session 30% and training sessions were unplanned 27%. The
explanations for the answers given were that employees would prefer the training
time that is distinct from work. The use of same trainers regularly did not augur well
with different training regimes and thus the employees found them boring as
indicated in Table 4.8.
Table4.8: Complaints Experienced During Training Sessions
Complaints raised during
training No of Respondents percentage
Employee’s time was
consumed
39 22.4
Frequent breaks during
training
52 29.9
Training session were
unplanned
46 27
Training session were boring
36 20.7
Total 173 100
4.4.12 Short training Attended
Figure 4.7 addresses the concerns of the respondents on short–term trainings and
benefits accrued thereafter. On the variable of short courses attended, the majority of
respondents 41.6% had attended the short courses two times in a year, while 23.1%
had attended the short courses only once a year. The remaining percentage 35.3%
had attended the said short courses more than twice in a year. The frequency and the
duration of the trainings were probably dependent on the individual trainings needs,
performance appraisals and departmental needs. Due to this factor, the frequency of
the training and time of the same was attributed to organizational factors namely;
training needs assessment, performance appraisals, departmental needs and extra-
organizational factors such as competitive advantage, regulatory aspects and many
other issues (Mullins, 2010).

72
Figure 4.7: Short Training Attended
4.4.13 Length of short Trainings
Figure 4.8 shows the length of the short trainings that range from one week to six
months. Majority of the respondents 58% had attended the one week trainings
followed by one month trainings at 36.2% with the lowest percentage at 5.7%
attending training in more than a month. The frequency and the duration of the
trainings were probably dependent on the individual trainings needs, performance
appraisals and departmental needs. The frequency of the training duration was
attributed to organizational factors for example training needs assessment,
performance appraisals, departmental needs and extra-organizational factors such as
competitive advantage, regulatory aspects and many other issues (Noe, 2010).

73
Figure 4.8: Length of Short Training
4.4.14 Promotion attained after Training
Figure 4.9 reveals that 31% of respondents had not received any promotion at all.
Those who attained one promotion after training constituted 38.2%, those who
received promotions twice consisted of 25%, while those who experienced
promotion three times were 6.4%. In summary about 69% of respondents had been
promoted after attending some training.
Figure 4.9: Promotion attained after Training
4.4.15 Impact of performance after Training
The respondents’ perception of the post–training effects were captured and displayed
as seen in figure 4.10. A higher percentage comprising of 83.2% had higher
expectations that they would be promoted with a further 15.6% expected promotion
would come their way after the training. Sometimes, training makes employees hold
some expectations that immediately after training they will be able to use their new
skills and knowledge in different circumstances and thus the perceived expectations
are in line with the perceptions that the organizational personnel hold.

74
Figure 4.10: Impact of Performance after Training
4.4.16 Advantages of e-learning
Training could take many formats depending on the individual requirement and
organizational needs. When the respondents were asked question surrounding e-
learning, majority felt that e-learning had benefited them by making them effective in
the jobs 68.4%, while 15.5% felt that e–learning helped in conferencing and effective
presentations as depicted in Figure 4.11.
Figure 4.11: Advantages of E-Learning
4.4.17 Contribution of Management
Management support for training was found to be important if the training is to
succeed. Results from the study show that the respondents agreed that the
organizational leadership could aid much in the success of training by enhancing

75
approvals for trainings 43.5% and providing financial support during training 54.7%.
Respondents who did not appreciate the role of management in enhancing training
consisted of 1.8% which was found to be minimal as indicated in Table 4.9.
Table4.9: Contribution of management
Contribution of management No of Respondents
percentage
Not helped at all
4 1.8
Enhance approval for trainings
74 43.5
Provide finances for training
65 37.6
Provide finances for in-house
training 30 17.1
Total 173 100
4. 5 Factor Analysis
4.5.1 Factor analysis for Training Needs Assessment
TNA as an independent variable had a total of six (6) items. All factor loadings were
above 0.4 therefore they were valid. They were retained for analysis stage. The
indictors therefore passed the test of construct validity as indicated in Table 4.10.
Table 4.10: Factor Loading for Training needs Assessment
Rotated component matrixa Component
Training needs assessment conducted before skills acquisition .767
Training needs assessment conducted helped improve the use .704
of new technology.
Training needs assessment conducted helps in performance standards .653
Assessed by administration before Training needs assessment conducted .408
Training needs assessment conducted enabled me undergo courses required .553
Training needs assessment conducted enabled me to identify opportunities .473
Extracted method: principal component Analysis
Rotation method: Varimax with Kaiser Normalization

76
Training needs assessment had six items and all of them were confirmed to be valid,
and had an acceptable reliability coefficient of above 0.7 as indicated in Table 4.11
Table 4.11 Reliability Coefficient of TNA
Cronbach’s Number of items Reliability coefficient
6 0.72
4.5.2 Factor analysis for Mode of training
Mode of Training as an independent variable has a total of ten (10) items. All the
factor loadings were above 0.4 therefore they were valid. They were retained for
subsequent analysis. The indicators therefore passed the test of construct validity as
indicated in Table 4.12.

77
Table 4.12: Factor Loading for Mode of Training
Rotated component matrixa Component
Knowledge gained after job training helped me master operations .764
On the job training helped me improve my performance .834
Job rotation helped in operations .786
Reference materials from lectures improves performance .770
Induction after training led to comfort in executing duties at work .649
Simulation helps in performance .675
Apprenticeship is a better method of transfer of skills and knowledge
to employees .421
I undertake bigger quality and quantity of work as a result
of Computer based knowledge that I acquired .561
Knowledge acquired from lectures improved performance .632
I concentrate better during role-play offered away from university .499
premises
Extraction Method: principal component Analysis
Rotation method: Varimax with Kaiser Normalization
Mode of training had ten (10) items and all of them were confirmed valid, and had an
acceptable reliability coefficient of above 0.7 as indicated in Table 4.13.
Table 4.13: Reliability coefficient of Mode of Training
Cronbach’s Number of items Reliability coefficient
10 0.800

78
4.5.3 Factor Loading for Training Duration
Training duration as an independent variable had a total of five (5) items. All the
factor loadings were above 0.4, therefore they were valid. They were retained for
analysis later. The indicators therefore passed the test of construct validity as
indicated in Table 4.14.
Table 4.14: Factors Loading for Training Duration
Rotated component matrixa Component
Certificate programs help in degree attainment .808
Diploma training enhanced work performance .824
Seminars improve knowledge and performance .755
Conferences boost knowledge .784
One week workshops sponsored by university have improved my .573
knowledge and skills
Extraction Method: principal component Analysis
Rotation method: Varimax with Kaiser Normalization
Training Duration had five (5) items and all of them were confirmed valid. They had
an acceptable reliability coefficient of above 0.7, as indicated in Table 4.15.
Table 4.15: Reliability coefficient of Training Duration
Cronbach’s Number of items Reliability coefficient
10 0.705

79
4.5.4: Factors Loading for Training Feedback
Training Feedback as an independent variable had a total of eight (8) items. All the
factor loadings were above 0.4, therefore they were valid. They were retained for
subsequent analysis. The indicators therefore, passed the test of construct validity as
indicated in Table 4.16.
Table 4.16: Factor Loading for Training Feedback
Rotated component matrixa Component
Performance appraisal improves skills .774
I always get interviewed immediately after training .734
Observations made during training sessions improved my performance .823
I am usually given evaluation reports in relation to the knowledge, .596
skills and competencies acquired after training
Results of Performance appraisals have greatly helped me to undergo .804
various trainings in the university
I always complete filling questionnaires after, training, and the .711
trainer gives immediate reports
The trainer conveys his observations timely after training .633
After training I discuss my interview results with the trainer training .661
Extraction Method: principal component Analysis
Rotation method: Varimax with Kaiser Normalization
Training Feedback had eight (8) items and all of them were confirmed valid. It had
an acceptable reliability coefficient of above 0.7 as indicated in Table 4.17.
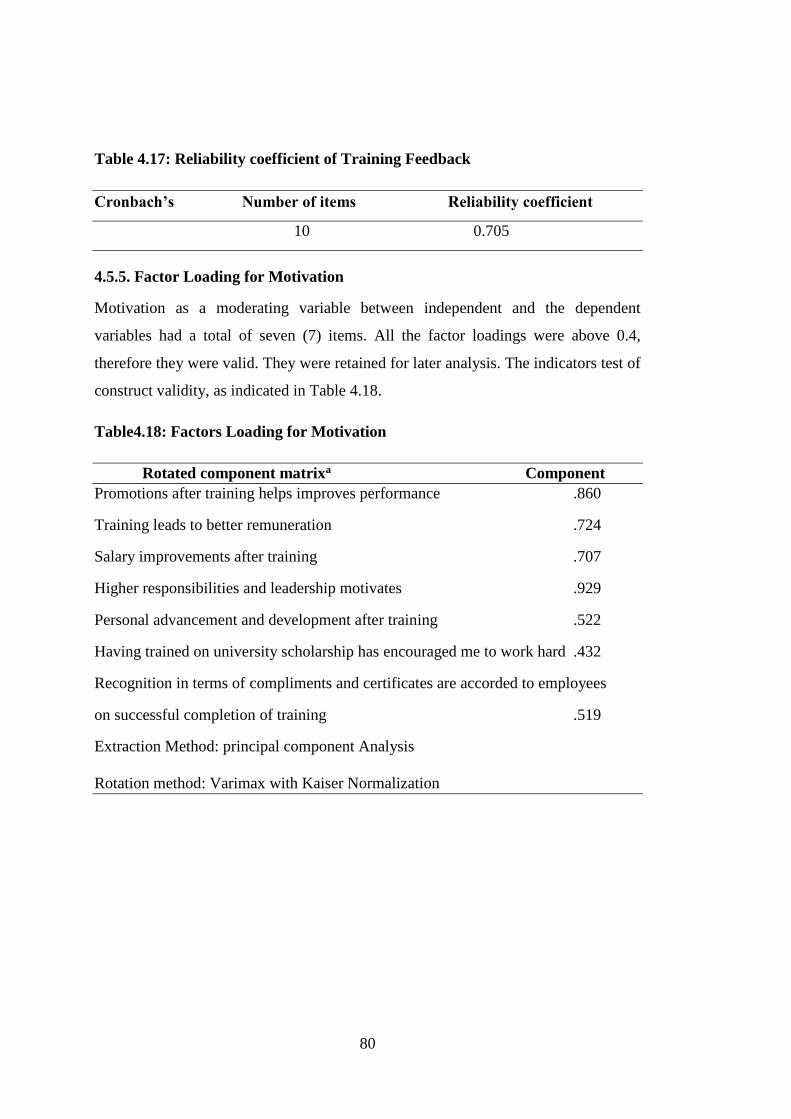
80
Table 4.17: Reliability coefficient of Training Feedback
Cronbach’s Number of items Reliability coefficient
10 0.705
4.5.5. Factor Loading for Motivation
Motivation as a moderating variable between independent and the dependent
variables had a total of seven (7) items. All the factor loadings were above 0.4,
therefore they were valid. They were retained for later analysis. The indicators test of
construct validity, as indicated in Table 4.18.
Table4.18: Factors Loading for Motivation
Rotated component matrixa Component
Promotions after training helps improves performance .860
Training leads to better remuneration .724
Salary improvements after training .707
Higher responsibilities and leadership motivates .929
Personal advancement and development after training .522
Having trained on university scholarship has encouraged me to work hard .432
Recognition in terms of compliments and certificates are accorded to employees
on successful completion of training .519
Extraction Method: principal component Analysis
Rotation method: Varimax with Kaiser Normalization

81
Motivation had seven (7) items and all of them were confirmed valid. Motivation had
an acceptable reliability coefficient of above 0.7, as indicated in Table 4.19.
Table 4.19: Reliability coefficient of Motivation
Cronbach’s Number of items Reliability coefficient
7 0.810
4.5.6. Factor Loading for Performance
Performance as a dependent variable had a total of eight (8) items. All the factor
loadings were above 0.4, therefore they were valid. They were retained for later
analysis. The indicators therefore, passed the test of construct validity as indicated in
Table 4.20.
Table4.20: Factor Loading for Performance
Rotated component matrixa Component
Accomplishment of work targets leads to performance benefits .645
Teamwork translates into higher productivity .774
Endeavour to meet the institution goals .899
High quality work .759
Work gives great pleasure especially when I meet set targets .564
Intends to work till retirement .752
Adhere to university policies .592
Rate of absenteeism is low .401
Extraction Method: principal component Analysis
Rotation method: Varimax with Kaiser Normalization
Performance had eight (8) items and all of them were confirmed valid. Performance
had an acceptable reliability coefficient of above 0.7, as indicated in Table 4.21

82
Table 4.21: Reliability coefficient of Performance
Cronbach’s Number of items Reliability coefficient
8 0.733
4.6. Descriptive Statistics
This section elaborates on the analysis of responses from respondents as captured
from the questionnaires. All variables were discussed.
4.6.1. Training Needs Assessment
TNA refers to a process of identifying performance requirements and the knowledge,
skills, and abilities needed by an organization’s workforce to achieve the
requirements (Nyongesa, et al. 2014). This will facilitate the organization’s
development of relevant trainings which lead to achievement of objectives and goals.
It is important to conduct a needs analysis before mounting trainings to avoid
launching trainings that are irrelevant to the needs of employees (Riech, 2008). The
study revealed that 55.2% of the respondents strongly agreed to having been assessed
by administration before training needs (TNA). 32.2% agreed, 1.7% were not sure,
9.8% disagreed and lastly, 1.1% strongly disagreed. Generally, 10.9% of the
respondents disagreed, 1.7% were not sure, and 87.4% of the respondents agreed that
they were assessed before TNA was administered to them. The results of the study
clearly indicate that assessment by administration is conducted before TNA is carried
out among non-teaching staff in management cadres at the universities. The study
agrees with Noe, (2010), as he contends that personal analysis and task analysis are
helpful in enhancement of organizational needs on training. Adherence to this
practice leads to proper and correct training administered to employees.
Concerning training needs being administered before skills acquisition, 4.6% of the
respondents strongly disagreed having been subjected to TNA before acquiring
skills. 6.9% disagreed, 1.7% were not sure, 57.5% agreed, and lastly, 29.3% strongly
agreed. Generally, 11.5% of the respondents disagreed, 1.7% were not sure, while,
86.8% of the respondents were in agreement with the fact that TNA was
administered before skills acquisition. The results of the study is in agreement with

83
Mullins (2009), who states that full regard should be preferred to training needs of
special groups. Noe (2010) also postulates that training needs is a prerequisite in
instructional design process and ought to be conducted properly to produce effective
results. Training should therefore have correct content to address cited issues for
intervention purpose, to help curb mismatch between programs offered and demand
from labor market (Riech, 2008). Klane and Pearson (2007), caution that training
which may be administered but does not meet the needs of employees is just
‘perfunctory’, since some employees may miss out on practical experience of some
aspects of the training.
The study also sought to establish the extent to which training needs assessment
helped in improving the use of new technology. The study found out that 1.7% of the
respondents strongly disagreed, another, 1.7% disagreed, 0.7% were not sure, and
37.9% agreed, while 58.0% strongly agreed that TNA helped improve the use of new
technology. Generally 3.4% of the respondents disagreed, 0.7% were not sure, while
95.9% agreed that TNA helped improve the use of new technology. The study agrees
with Noe (2010), who alluded that online technology can be used to monitor and
track employee performance and is a skill used to provide feedback to employees.
Dabale, Jagero and Nyauchi (2014), concur that training is important due to the
complex work environment, rapid change in organizations and advancement in
technology, especially in Nigeria and Zimbabwe municipalities, where they studied
the relationship between training and employee performance. The study therefore
established that training needs assessment helped employees improve in the use of
new technology.
The study sought to determine how training needs assessment help employees to
undergo required courses, which enhanced legislation and policies introduced by
government.10.3% of the respondents strongly disagreed, 9.2% disagreed, 5.7% were
not sure, 46.6% agreed, and 28.2% strongly agreed. The study agreed with Ghosh,
Satyawadi, Joshi, and Singh (2012) who revealed that the government of Libya
trained 98 graduates in 1953-54 in universities. These graduates underwent training
of between six months to one year at national institute for administration. As a result,

84
Libyan manpower increased from 454,100 in 1975 to 678,400 in 1985, to 861,800 in
1989.This was a result of government policy and initiative.
The study sought to determine how training needs assessment helps in performance
standards, hence, 1.7% of the respondents strongly disagreed, 1.7% disagreed,
another 1.7% were not sure, while 50.6% agreed, and lastly, 44.3% strongly agreed.
Generally, 3.4% of the respondents disagreed, 1.7% were not sure, while 94.9%
agreed that training needs assessment helps in determining performance standards.
The study agreed with Elnaga and Imran (2013) who revealed that employees are,
evaluated to ensure they understand tasks and duties, smooth cooperation with
supervisors and are aware of set targets.
The study sought to establish how training needs assessment aids in job opportunity
identification. 10.3% of the respondents strongly disagreed, 3.4% disagreed, and 3.0
% were not sure, 56.9% agreed, 26.4% strongly agreed that training needs
assessment aids in job opportunity identification. Generally, 13.7% disagreed, 3.0%
were not sure, and 73.3% agreed that training needs assessment aids in job
opportunity identification. The study agrees with Noe (2010), who envisaged new
job opportunities as one of the reasons or pressure points that justify the need for
training thus agreeing that TNA assisted in new job opportunities identification.

85
Table 4.22: Training Needs Assessment
SA A N D SD Total
SURE %
Assessed by administration before training 55.2 32.2 1.7 9. 8 1.1 100
needs assessment
Training needs assessment conducted before 29.3 57.5 1.7 6.9 4.6 100
skills acquisition (training)
Training needs assessment helped improve 58.0 37.9 0.7 1.7 1.7 100
the use of new technology
Training needs assessment enabled me to 28.2 46.6 5.7 9.2 10.3 100
Undergo courses required
Training needs assessment helps in 44.3 50.6 1.7 1.7 1.7 100
Performance standards
Training needs assessment aids in job 26.4 56.9 3.0 3.4 10.3 100
opportunity identification
Table 4.23 gives the respondents views on issues touching on training needs
assessment with concerns ranging from the assessment to knowledge gained after
training. As seen most respondents affirmed that they were assessed (Mean = 4.30,
SD = 0.99) before any training needs assessment. Most organizations usually
conduct an assessment or an appraisal on their employees for any mismatch between
job specification and skill requirement. A deficiency that is worth a training needs
assessment occurs when the skills requirement is lacking on the part of the employee.
This then necessitates a training needs assessment as a precursor to training. Once a
mismatch is detected, training needs assessment is then carried out to identify the

86
areas that the employee needs training on. The respondents also affirmed (Mean =
4.23, SD = 3.19) that a needs assessment was conducted in order to evaluate and
determine what kind of trainings were necessary.
Training needs assessment takes cognizant of the skill deficiency on the part of the
employee in relation to the job. As is deduced from Table 4.23, the respondents
alluded to the fact they lacked knowledge on the use of new technologies that are
introduced at work place (mean = 4.49, SD = 0.758), it helped improve on their skills
level by allowing them attend prerequisite job training such as induction and
management training (Mean = 3.73, SD= 1.25) and that the needs assessment also is
an evaluation tool to check on the performance level of each individual employee
(Mean = 4.03, SD = 0.76). The justification that best sums up the reasons above is,
that probably there is a mismatch in technological skills of the employees, new
employees and the personnel hired lacked prerequisite training and thus the need for
needs assessment. The output also suggest that respondents also use the needs
assessment to identify job opportunities (Mean = 3.86, SD = 1.16) and that there is a
knowledge transfer gained after each training (Mean = 4.74, SD = 0.58).
When the respondents were asked on the ways to identify their training needs
assessment based on their own individual analysis, a variety of responses came up.
The responses range from job assessment, performance standards, supervisor’s
recommendation, job analysis, performance appraisal, skills and education levels.
Majority of them preferred that the needs assessment should be best identified
through performance standards or performance appraisals which show that they
understood the needs assessment from their own individual perspective as per the
human resource development literature. Others still preferred the task analysis as
shown by the respondents (job analysis and assessment, education and skills levels
and/or supervisor’s recommendation).

87
Table 4.23: Descriptive Statistics on Training Needs Assessment
N Mean Std. Deviation
Statisic Statistic Statistic
Assessed by administration before 173 4.304 6.98795
training needs assessment
Training needs assessment 173 4.2299 3.1939
conducted before skills acquisition (training)
Training needs assessment helped 173 4.4885 .75830
improve the use of new technology
Training needs assessment enabled me 173 3.7299 1.25460
undergo courses required
Training needs helps in performance 173 4.03391 .75645
standards
Training needs assessment aids 173 3.8563 1.1615
in job opportunity identification
4.6.2 Mode of Training
The study sought to establish the extent to which performance improved after
attending training. 1.7% of the respondents strongly disagreed that performance
improved after attending the job training, 1.7% disagreed, 1.7% were not sure, 61%
agreed, while 33.9% strongly agreed that performance improved after attending on
the job training. Generally, 4.0% of the respondents disagreed, 1.7% were not sure,
and 94.9% agreed that performance improved after attending training. The study
concurred with findings by Shah et al. (2014) who alluded that programs which are
developed according to the training need assessment and keeping in mind the
organization’s short & long term objectives help improve performance. It has been

88
proved through various researches that training has a positive influence on employee
performance, although, there may be other HR factors that boost performance.
Employees who are exposed to proper training are likely to perform better than those
who did not attend any training (Brum, 2007).
The study sought to establish the extent to which on the job training helped
employees at the university in operations. 4.0% of the respondents strongly
disagreed, 4.1% disagreed, 4.6% were not sure, 27.0% agreed and 60.3% strongly
agreed. Generally, 8.1% disagreed, 4.6% were not sure and lastly 87.3% agreed that
the on the job training helped employees at the university in operations. The study
agreed with Jagero, Komba, and Mlingi (2012) who revealed that employee training
involves teaching employees skills which will make them efficient and productive to
the employer. Most employees undergo on the job training during their careers, thus
they accrue some benefits as well as the employers. Training is often conducted to
familiarize new employees with the roles and responsibilities of their positions as
well as company policies. Many companies offer continuing training opportunities
for employees, focusing on skills that can improve efficiency. Armstrong (2009)
contends that trained employees often work better as teams because everyone is
aware of the expectations and can achieve them together smoothly. Trained
employees are also more confident in their performance and decision-making skills.
The study sought to establish the extent to which Computer-based knowledge
acquisition helped non-teaching employees to undertake bigger quantity and better
quality of work in the public universities in Kenya. 1.1% of the respondents strongly
disagreed, 4.6% disagreed, 1.1% were not sure, 42.0% agreed, and 51.2 % strongly
agreed. Generally, 5.6% of the respondents disagreed, 1.1% were not sure, and lastly,
93.2% agreed that Computer-based knowledge acquisition helps non-teaching
employees to undertake bigger quantity and better quality of work in the public
universities in Kenya.
The study agrees with Robert (2006); Elnaga and Imran (2013) who maintained that
effective training helped employees to get acquainted with desired new technological
advancement, gain full command on competencies and skills required to perform a

89
specific job and reduce on mistakes. Elnaga and Imran (2013) reveal that there are
varied ways of overcoming the employee performance gap, therefore, through
training; employees may develop skills, competencies and ability leading to
individual employee performance improvement and organizational productivity.
Armstrong (2009) confirmed that new technology has overtaken employees’ jobs.
Dabale, Nyauchi and Jagero (2014) revealed that employees need to train in use of
technology to remain relevant.
The study sought to establish the extent to which lecture notes obtained during
training help non-teaching employees as future reference materials in the course of
their work. 10.9% of the respondents strongly disagreed, 6.9% disagreed, 9.2% were
not sure, and 31.6% agreed, while 41.1%strongly agreed. Generally, 17.8%
disagreed, 9.2% were not sure, and 73.3% agreed that lecture notes obtained during
training help non-teaching employees as future reference materials in the course of
their work. A lecture may involve talking by the facilitator, and the trainees may be
required to listen and take notes, while answering questions when necessary. Lecture
method is a means of transferring of information to learners (Armstrong, 2009).The
visual aids used during lectures may prove helpful to the learner after training. The
study therefore confirmed that materials used during lectures are of great benefit to
employees.
The study sought to establish the extent to which non-teaching employees enjoy
comfort at university work places after induction training. 1.9% of the respondents
strongly disagreed, 1.7% agreed, 1.8% were not sure, 36.0% agreed, and 58.0%
strongly agreed that non-teaching employees enjoy comfort at university work places
after induction training. Generally, 3.6% disagreed, 1.8% were not sure, and, 94.0%
agreed that non-teaching employees enjoy comfort at university work places after
induction training. This implies that induction helps non-teaching employees to settle
at work, familiarize with work environment, and the associated tasks. The HRM, the
supervisor, or the team leader may address the new employees. The department
heads may also address the new employee regarding immediate duties, and introduce
them to the department. The employee may thereafter settle to perform assigned
duties or proceed on further training, hence the study agrees with (Armstrong, 2009).

90
The study sought to establish the extent to which role playing improved learning
during training offered away from the university. 51% of respondents strongly
disagreed, 8% disagreed, 11% were not sure, 15.8% agreed, and 14.2% strongly
agreed. Generally, 59% of the respondents disagreed, 11% were not sure, and 30%
agreed that employees at the university, concentrated better during off- the- job
training. The study clearly indicates that more than half of the respondents disagreed,
implying that there may be other factors that may determine better concentration
when employees are training away from the university premises. This may be due to
dependence on balance between what may be considered as theoretically desirable
and what participants understand as practically possible to implement (Mullins,
2010).
The study sought to determine the extent to which simulation benefited employees in
the course of performing their duties. 22% of the respondents strongly disagreed,
18% disagreed, 10% were not sure, 7% agreed, while 43% strongly agreed that
simulation trainings attended benefited employees in the course of performing their
duties. Generally, 40% of the respondents disagreed, 10% were not sure, while 50%
strongly agreed. The study concurred with Mullins (2010) who alluded that
management development for instance simulation entails dual function of improving
effectiveness of individual managers and improving management performance as a
whole and organizational effectiveness. Therefore, an integrated approach is to be
adopted regarding the development of the entire organization. Lastly all managers
require continual enhancement of their professional competence (Armstrong, 2009).
The study sought to determine whether job rotation helps employees to master
operations in most divisions within the universities. 10% of the respondents strongly
disagreed, 11% disagreed, 21% were not sure, 5% agreed and 53% strongly agreed
that job rotation helped employees to master operations in most divisions within the
universities. The study agrees with Dessler (2005) who stated that employees learn a
lot from job rotation experiences; for instance, varied job exposures and the
realization that all departments are equally important for the success of the
university/organization. Mullins (2010) asserts that job rotation can be used for up
skilling in areas which require new technology, within departments inform of cross-

91
training and in cases where an employee has been promoted or transferred to another
section.
The study sought to establish whether apprenticeship is a better method of transfer of
skills and knowledge to employees. The study revealed that 8% of the respondents
strongly disagreed, 10% disagreed, 17% were not-sure, 30% agreed, while 35%
strongly agreed. Generally, 18% disagreed, 17% were not sure, and 65% of the
respondents agreed that apprenticeship is a better method of transfer of skills and
knowledge. ILO-Steedman, (2014) posit that employment services expand peoples’
awareness of apprenticeship and the kinds of jobs they can perform.

92
Table4.24: Mode of Training
SA A NOT D SD Total
SURE %
On the job training helped me 33.9 61.0 1.7 1.7 1.7 100
improve my performance
On the Job training helped me in operations60.3 27.0 4.6 4.1 4.0 100
Computer-based knowledge acquisition 51.2 42.0 1.1 4.6 1.1 100
Helps undertake bigger quantity and better
quality of work
Knowledge acquired from lectures during 42.0 52.9 2.3 1.1 1.7 100
on the job training Improves performance
Reference materials from lectures help 41.4 31.6 9.2 6.9 10.9 100
in work execution
Induction after training led to comfort in 58.0 36.0 1.8 1.7 1.9 100
executing duties at work
Role playing improves my learning during 14.2 15.8 11 8 51 100
training offered away from the university
Simulation benefitted me in the course of 43 7 10 18 22 100
performing my duties
Job rotation has helped me to master 53 5 21 11 10 100
operations in most of the divisions
in the university
Apprenticeship is a better method of 35 30 17 10 8 100
transfer of skills and knowledge to employees
Table 4.25 focused on specific aspect of on-the job training which ranged from
computer based training, job rotation, lectures, simulation and role play. The
descriptive statistics shows that job training serves three objectives; improvement in
operations, knowledge acquisition and performance improvement. The respondents
affirmed that their performance improved after training (Mean = 4.27, SD = 0.66),

93
there was an improvement in operations (Mean = 4.37, SD = 1.01) and that they
acquired knowledge during the training lectures (Mean = 4.33, SD = 0.72). This
implies that the training being offered was geared towards knowledge and skill
acquisition and towards the improvement of individual and organizational
performance. Another aspect of on job training is the computer – based knowledge
acquisition which is touted as a solution to the work place job performance.
Organizations investing in IT with the hope that it will lead work place efficiencies
but such investment require the prerequisite investments in the human aspect of IT in
order for the information systems to serve its purpose. The respondents affirmed that
the training in IT (Mean = 4.39, SD = 0.78) is important as it is a prerequisite to the
investments in IT.
In general, the organization offers a variety of training ranging from induction
training through lectures to role play at management level. In between there are a
variety of training geared towards specific objectives and outcomes. The employees
tend to feel the job rotation after training (Mean = 4.55, SD = 0.68) and that
simulation is and important aspect of improving performance (Mean = 4.51, SD =
0.57). At entry level, most employees hold prerequisite educational level but lack
the critical skills to undertake their jobs and thus the need for job rotation to equip
them with the job skills. Similarly, simulation is critical to individuals who are
promoted or hired to management positions. They may have the technical skill, but
may lack in the person management skill and thus apprenticeship is offered to them
to help them cope with the increase in responsibilities.
Computer – based learning is a technique that is used in training workforce with an
emphasis on the use of IT. As per the responses, the benefits of computer –based
learning range from training and communication, information access and storage,
work efficiency, improved use of new technology, computer skills acquisitions,
communication and conferencing. Majority of the respondents felt that IT improves
information access and storage and thus it aids in training and communication,
improvements in the use of new technology and computer skills acquisition.

94
According to respondents, the other HRM strategies that might be used include open
door policy, interpersonal relationship, employee welfare, and improvement in
working conditions and motivation (incentives, better pay and allowances). The
responses illustrated that HR policies at work place were not effective enough to be
felt by the employees and thus the need to focus on employee motivation in terms of
incentives, better pay, allowances and employee welfare in terms of insurance. Other
issues raised include the improvement in working conditions and open door policy.
Table 4.25: Descriptive Statistics on Training Mode
N Mean Std.Deviation
Statistic Statistic Statistic
On- the- job training helped me improve 173 4.2659 .66371
performance
On the Job training helped in operations 173 4.3699 1.01249
Computer based knowledge acquisition 173 4.3931 .78233
Knowledge acquired from lectures 173 4.3353 .71753
improves performance
Reference materials help in work 173 3.8613 1.32654
Execution
Job training led me to master 173 4.5491 .67700
operations in most of the divisions in
the university
Simulation benefitted me in the 173 4.5087 .56670
course of performing my duties

95
4.6.3 Training Duration
The study sought to establish the extent to which certificate programs help in the
attainment of degrees. 1.0% strongly disagreed, 2.3% disagreed, 2.7% were not sure,
17.0% agreed, and 77.0% strongly agreed. Generally, 3.0% disagreed, 2.0% were not
sure, and 94.0% agreed that short programs helped in the attainment of degrees.
KarimImani, Tavakkoli, and Salagegheh (2013) agreed that training and
improvement lead to deeper insights, higher knowledge, and more abilities and skills
in employees within the organizations/universities, as they conduct their duties, and
as a result organizational goals are achieved with much more efficacy and output.
The study sought to establish the extent to which diploma training enhances work
performance.1.0% strongly disagreed, 2.0% disagreed, 2.7% were not sure, 64.0%
agreed, while, 30.3% strongly agreed. Generally, 3.0% disagreed, 2.7% were not
sure, and 94.3% agreed that short term training enhances work performance. The
study agreed with Seyed, (2015) who postulated that diploma training improves
employee performance, since they have positive impact on job skills, improvement
of behavior and organizational decision making.
The study sought to establish the extent to which, workshops sponsored by the
university improved employee knowledge and skills. 1.1% strongly disagreed, 2.8%
disagreed, 8.0% were not sure, 48.0 % agreed, and 40.1% strongly agreed. This study
concurred with KarimImani, Tavakkoli, and Salagegheh (2013), who revealed that,
workshops involve participation and interaction among the learners which helped
increase interest in learning and grasping content. Seminars, conferences and
workshops are intended to enable work to be done quickly, efficiently and easily.
The participants are expected to use relevant tools and systems at their disposal to
improve production (w.w.w.Womac Company.Com).
The study sought to establish the extent to which Seminars held within and outside
the University for Improved Employee Knowledge and performance. The study
showed that 1.6% of the respondents strongly disagreed, 1.5% disagreed, 2.6% were
not sure, 31.6% agreed, 62.7% strongly agreed. Generally, 3.1% disagreed, 2.6%
were not sure, and 94.3% strongly agreed that seminars held both within and outside

96
the University for three to four weeks, improved employee knowledge and
performance. Seminars, conferences and workshops are intended to enable work to
be done quickly, efficiently and easily. The participants are expected to use relevant
tools and systems at their disposal to improve production (w.w.wWomac
Company.Com.)
The study sought to establish the extent to which conferences attended by employees
in six months duration boosted knowledge. 2.9% strongly disagreed, 0.6% disagreed,
9.2% were not sure, 53.4% agreed, while 33.9% strongly agreed. Generally, 3.5%
disagreed, 9.2% were not sure, and 87.3% agreed that attended by employees in six
months duration boosted knowledge among non-teaching employees at the
university. Seminars, conferences and workshops are intended to enable work to be
done quickly, efficiently and easily. The participants are expected to use relevant
tools and systems at their disposal to improve production (w.w.wWomac
Company.Com.).

97
Table 4.26: Training Duration
SA A NOT D SD Total
SURE %
Certificate programs help in degree 77.0 17.0 2.7 2.3 1.0 100
attainment
Diploma training enhances work 30.3 64.0 2.7 2.0 1.0 100
performance
workshops sponsored by the 40.1 48.0 8.0 2.8 1.1 100
university have improved my knowledge
and skills
Seminars held both within and outside the 62.7 31.6 2. 6 1.5 1.6 100
university
improved my knowledge and performance
Conferences I attended for six months have 33.9 53.4 9.2 0.6 2.9 100
boosted my knowledge
Table 4.27 highlights the various aspects of training. The training may take the form
of certificates, Diplomas, workshops, seminars and conferences. As it can be
deduced from statistics, certificates and Diploma training enhances work
performance (Mean = 4.73, SD = 0.59; Mean = 4.30, SD = 0.47) respectively. This
highlights the fact that the institution focuses on certificate training to improve
performance.
Short – term training can fall into three categories; workshops, seminars and
conferences. From the statistics, employees prefer the three methods since they
affirmed that the three forms contribute to performance (Mean = 4.11, SD = 0.925:
Mean = 4.54, SD = 0.74 and Mean = 4.28, SD = 0.71) respectively. The perception
can be attributed to the institutionalism within the organization; the preference for
workshops, seminars and/or conferences as a mode of training and knowledge
dissemination.
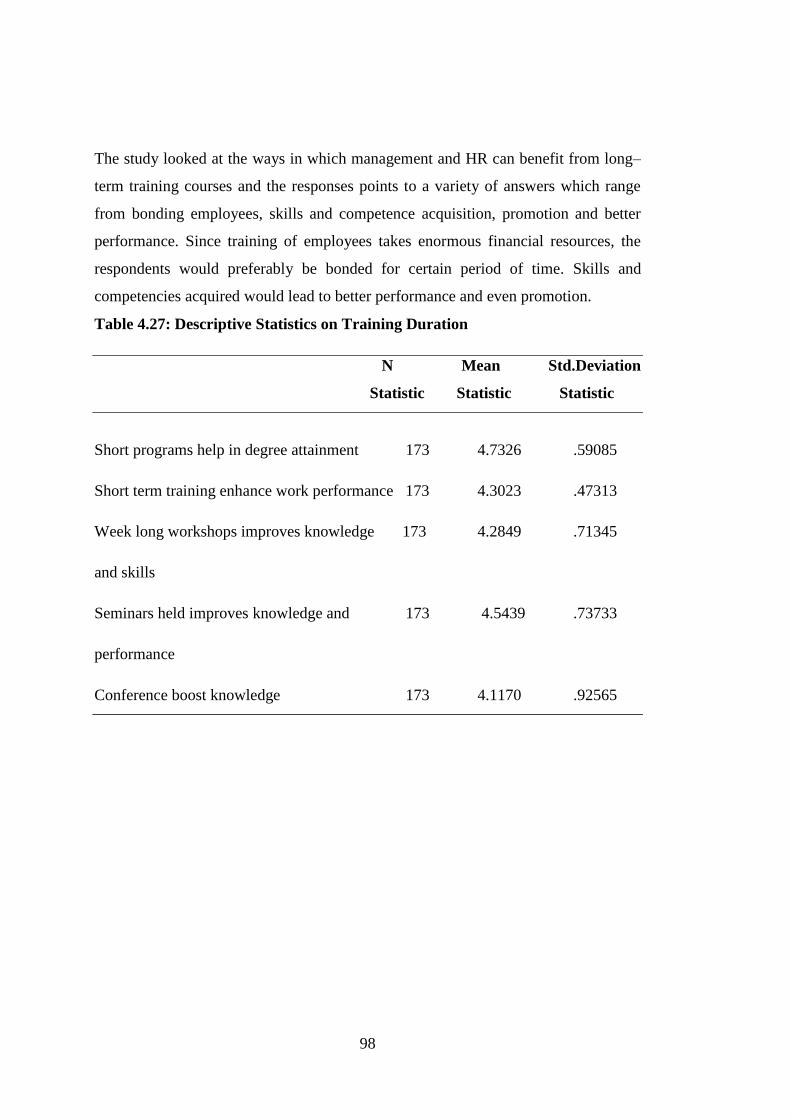
98
The study looked at the ways in which management and HR can benefit from long–
term training courses and the responses points to a variety of answers which range
from bonding employees, skills and competence acquisition, promotion and better
performance. Since training of employees takes enormous financial resources, the
respondents would preferably be bonded for certain period of time. Skills and
competencies acquired would lead to better performance and even promotion.
Table 4.27: Descriptive Statistics on Training Duration
N Mean Std.Deviation
Statistic Statistic Statistic
Short programs help in degree attainment 173 4.7326 .59085
Short term training enhance work performance 173 4.3023 .47313
Week long workshops improves knowledge 173 4.2849 .71345
and skills
Seminars held improves knowledge and 173 4.5439 .73733
performance
Conference boost knowledge 173 4.1170 .92565

99
4.6.4 Training Feedback
The study sought to establish the extent to which Performance Appraisal practiced at
the university helped identify areas to improve employee skills. 2.0% of the
respondents strongly disagreed, 2.0 % disagreed, 2.3% were not sure, 16.7% agreed
and 77.0% strongly agreed that Performance appraisal practiced at the university
helped identify areas to improve employee skills. Generally, 4.0% 0f the respondents
disagreed, 2.3% were not sure, while 83.7% agreed that Performance appraisal
practiced at the university helped identify areas to improve employee skills. This
study complied with Prowse and Prowse (2009); Wilson and Western (2001) who
revealed that appraisal is a tool for improving individual employees in attainment of
university/organizational goals by helping managers to execute effective
management. Appraisal should therefore be conducted frequently according to set
goals. The sentiments echo goal setting theory which stipulates that the learners must
agree on and accomplish the set goals on time (Locke & Latham 2006).
The study sought to establish the extent to which employees get interviewed
immediately after training. 5.7% of the respondents strongly disagreed, 9.2%
disagreed, 2.7% were not sure, 52.9% agreed while 30.5% strongly agreed.
Generally, 14.9% of the respondents disagreed, 2.7% were not sure, while 83.4% of
the respondents agreed that employees get interviewed immediately after training.
This study agreed Anna and Bierstaker (2009); Ohman and Svanberg (2013); and
Stewart and O’Leary (2011) who posit that there is a general belief that feedback can
improve performance although not much evidence has been envisaged.
The study sought to establish the extent to which observations made by trainer and
shared with the employees’ improved performance. 1.8% of the respondents strongly
disagreed, 2.3% disagreed, 2.3% were not sure, 35.0% agreed and 58.6% strongly
agreed that observations made by trainer and shared with the employees’ improved
performance. Generally, 4.1% disagreed, 2.3% were not sure, and 93.6% agreed that
observations made by trainer and shared with the employees’. The study agreed with
Irawanto (2015) who argued that employee involvement in decision making is a
strategy that enhances employee satisfaction (sharing decisions with employees), and

100
culminates in accomplishment of organizational goals, reduces on stress and conflict
but promotes and encourages organizational goal attainment, commitment, and
acceptance of change.
The study sought to establish the extent to which employees always completed filling
questionnaires after training, and the trainer gave immediate reports. 5.2% of the
respondents strongly disagreed, 2.3% disagreed, 2.9% were not sure, 58.0% agreed,
while 31.6% strongly agreed that employees always complete filling questionnaires
after training, and the trainer gives reports immediately. Generally, 7.5% disagreed,
2.9% were not sure, and 89.6% agreed that employees always complete filling
questionnaires after training, and the trainer gives immediate reports. According to
Opu (2008), feedback is the last step in the training process whereby trainees are
asked to fill a form expressing their experiences during the training.
The study sought to establish the extent to which the trainer conveys his observations
timely after training. 7.5% of the respondents strongly disagreed 4.0% disagreed,
1.7% were not sure, 43.1% agreed, 43.7% strongly agreed that the trainer conveys
his observations timely after training. Generally, 11.5% disagreed, 1.7% were not
sure, 86.8% agreed that the trainer conveys his observations timely after training.
The study realized that successful assessment for learning strategies result in
improved learner progress on a continual basis and the value of the feedback is
dependent on the quality of the feedback, and how learners receive and ultimately
use it. There is need for learners to be trained on how to appreciate feedback and use
the information contained therein effectively to improve their work. The facilitators
require induction on training for the learners to appreciate feedback (Jones, 2016).
The study sought to establish the extent to which results of performance appraisals
have greatly helped employees undergo various trainings in the university. 9.8% of
the respondents strongly disagreed, 4.0% disagreed, 4.0% were not sure, 42.5%
agreed, while 39.7% strongly agreed. Generally, 13.8% of the respondents disagreed,
4.0% were not sure, while 82.2% agreed that results of performance appraisals have
greatly helped me to undergo various trainings in the university. Managers across the
University already support staff to take paid time off to attend staff training and

101
development activities such as courses, workshops and conferences. The employee
study, training Policy and associated procedures do not supersede the existing
mechanism for staff to request and take paid time off to attend any training courses
coordinated by the Staff Development unit (Akala 2012).
The study sought to establish the extent to which employees are usually given
evaluation reports in relation to the knowledge, skills and competencies acquired
after training. 3.0% of the respondents strongly disagreed, 5.0 % disagree, 3.0% were
not sure, 37.0 % agreed, while 52.0 % strongly agreed that employees are usually
given evaluation reports in relation to the knowledge, skills and competencies
acquired after training. Generally, 8.0% disagreed, 3.0% were not sure, while 89.0%
agreed that employees are usually given evaluation reports in relation to the
knowledge, skills and competencies acquired after training. The study is in
agreement with Mullins (2010) who stated that results of evaluation of training
would consider the extent to which the training contributed to enhanced
organizational performance, effectiveness, quality and prospects of employees. When
employees are deemed to be competent, then automatically, their skills and
knowledge are acceptable for the required, expected and improved performance.
The study sought to establish the extent to which employees after training, discuss
their interview results with their trainer. The study revealed that 10.0% of the
respondents strongly disagreed, 9.0% disagreed, 19.0% were not sure, 19.0% agreed,
and 43.0% strongly agreed that employees after training discuss their interview
results with their trainer. Generally, 19.0% disagreed, 19.0% were not sure, and
62.0% agreed that employees after training discuss their interview results with their
trainer. The environment of Andragogy must be safe and there should be a sound
relationship between trainer and learner for conducive learning and development
(Jones, 2016). The learner and trainer are both involved in creating the learning
experience and ensuring that learning occurs (Knowles, 2013).

102
Table4.28: Training Feedback
SA A NOT D SD Total
SURE %
Performance Appraisal practiced at the 77.0 16.7 2.3 2.0 2.0 100
university helped identify areas to improve
my skills
I always get interviewed immediately after 30.5 52.9 2.7 9.2 5.7 100
training
Observations made during training sessions 58.6 35.0 2.3 2.3 1.8 100
improved my performance
I always complete filling questionnaires after 31.6 58.0 2.9 2.3 5.2 100
training, and the trainer gives immediate reports
The trainer conveys his observations timely 43.7 43.1 1.7 4.0 7.5 100
after training
Results of Performance appraisals have 39.7 42.5 4.0 4.0 9.8 100
greatly helped me to undergo various trainings in the university
I am usually given evaluation reports in 52.0 37.0 3.0 5.0 3.0 100
relation to the knowledge, skills and
competence acquired after training
After training I appreciate discussing 43.0 19.0 19.0 9.0 10.0 100
my interview results with the trainer training
Table 4.29 highlights the respondents’ views on training feedback. The statistics
show that the respondents viewed performance appraisal as a way to improve skills
(Mean = 4.76, SD = 0.47). Most organizations conduct a performance appraisal
specifically to gauge performance deficiency from the employee. This performance
deficiency can be due to lack of skills or skills mismatch and thus appraisal measures
detect these anomalies. Once appraised, the individual will know the level of skill
deficiency.

103
Employees prefer to get interviewed immediately after training (Mean = 3.95, SD =
1.09). A feedback after training serves to alert the trainer of the training gaps or
effectiveness of the training to the individual employee. The feedback may be in the
form of suggestions, questions and follow-ups from an interview
The employees would also prefer to be observed and observation reports shared with
them for improving performance. (Mean = 4.54, SD = 0.64). Feedback in the form of
observational reports improves productivity and performance.
Statistics show that the respondents get evaluation reports in relation to knowledge,
skills and competencies after training (Mean = 4.10, SD = 0.94). The respondents
alluded to the fact that the presence of training policy assisted in matters touching on
training (Mean = 3.99, SD = 1.22). A good training policy would help govern the
training agenda within the organizations. Lack of it would likely lead to skill
deficiency, skills mismatch and haphazard training regimes. Most employees
affirmed that they were comfortable with their jobs and that the training acquired
adequately prepared them for challenging duties. This shows that the training they
received gave them relevant skills that match the jobs demand.
There appropriate ways suggested by respondents were; improvement in working
condition, specialized training (skills deficiency), promotion, recognition,
remuneration and incorporation in decision making. From the answers given, it can
be deduced that there are many underlying structural issues affecting the
respondents; which may include the workplace design which affected the ergonomic
aspect at work place, skills deficiency on those who required specialized training,
and their being incorporated in decision making.

104
Table 4.29: Descriptive Statics on Training Feedback
N Mean Std. Deviation
Statistic Statistic Statistic
Performance appraisal improves skills 173 4.7572 .46882
I always get interviewed immediately 173 3.9535 1.0887
after training
Observation made during training 173 4.5407 .63391
sessions helped improve performance
I am usually given evaluation 173 4.1047 .93695
reports in relation to knowledge, skills
and competencies after training
Time allowance for reflection learning 173 4.1214 1.13212
Training policy help in training 173 3.9942 1.2211
4.6.5 Motivation
The study sought to establish the extent to which promotions that employees attained
after training sessions helped improve performance at work. The study revealed that
1.7% of the respondents strongly disagreed, 1.1% disagreed, and 2.9% were not sure,
13.2% agreed, 81.0% strongly agreed that promotions that employees attained after
training sessions helped improve performance at work. Generally, 2.8% disagreed,
2.9% were not sure and 94.2% agreed that promotions that employees attained after
training sessions helped improve performance at work. It is true that promotions play
a dual function in goal attainment; that is, promotion is used to identify personnel for
positions of greater responsibility or matching duties of the promotion system and, it
also motivates employees by instilling healthy competition for employees to aim at
higher ranks (Phelan and Zhiang lin,2001); (Gibbs, 2008). Employees who feel
comfort at work place improve their status by attending training in some discipline to
help improve status, skill and knowledge, thus they feel motivated to develop
themselves (Illeris, 2003).

105
The study sought to establish the extent to which training had led to better
remuneration thus making employees to work hard. 0.6% strongly disagreed, 1.1 %
disagreed, 2.9% were not sure, 28.2% agreed, while, 67.2% strongly agreed that
training had led to better remuneration thus making employees to work hard.
Generally, 1.7% disagreed, 2.9% were not sure, while, 95.4% agreed that training
had led to better remuneration thus making employees to work hard. The study
agrees with Morrison (2014) who posits that compensation is a result of services
rendered, and benefit that employees receive in the form of pay or wages as rewards
intended to persuade employee’s to increases performance.
The study sought to establish the extent to which employees who trained on
scholarship felt encouraged to work hard. 1.1% of the respondents strongly
disagreed, 1.8 % disagreed, 4.0% were not sure, 25.9% agreed, and 67.2% strongly
agreed that employees who trained on scholarship felt encouraged working hard.
Generally, 2.9% disagreed, 4.0% were not sure, and 93.1% agreed. The study
concurred with Morrison (2014) who posits that research has identified that
employee engagement can be increased through sponsorship to develop a
performance culture.
The study sought to establish the extent to which improvement in salary after training
made employees more interested in working hard for the university. 5.2% of the
respondents strongly disagreed, 2.9% disagreed, and 9.2% were not sure, 23.6 %
agreed and 59.2 % strongly agreed that improvement in salary after training made
employees more interested to work hard for the university. Generally, 8.1%
disagreed, 9.2% were not sure, while 81.8% agreed that improvement in salary after
training made employees more interested to work hard for the university. Onyancha
et., al. (2014) stated that remuneration of employees depended on the skills and
competencies that they possess, and not on the jobs worth. This statement clearly
agrees with the study in that after training, the employees are equipped with
necessary skills to undertake new assignments. Workplace surveys provide a special
upward feedback and are useful in assessing the performance of individuals in
supervisory positions and above (Branham, 2005).

106
The study sought to establish the extent to which after attending training, employees
get higher responsibilities which was motivating. 1.1% strongly disagreed, 1.7%
disagreed, 8.0% were not sure, 17.4% agreed, and 71.8% strongly agreed that after
attending training, employees get higher responsibilities which were motivating.
Generally, 2.8% disagreed, 8.0% were not sure, 88.6% agreed that after attending
training, employees get higher responsibilities was motivating. The study agrees with
Illeris, (2003) who stated that employees who feel comfort of work place improve
their status by attending training in some discipline to help improve status, skill and
knowledge, thus they feel motivated to develop themselves.
The study sought to establish the extent to which recognition in terms of
compliments and certificates are accorded to employees on successful completion of
training. 1.2% of the respondents strongly disagreed, 1.1% disagreed, 6.9% were not
sure, 24.7% agreed, and 66.1% strongly agreed that recognition in terms of
compliments and certificates are accorded to employees on successful completion of
training. Generally, 2.3% disagreed, 6.9% were not sure, and 90.8% agreed that
recognition in terms of compliments and certificates are accorded to employees on
successful completion of training. The study agreed with Gruber (2015) who stated
that praise leads to positive reinforcement, may develop and maintain an individual’s
academic achievement behavior, or strategies. He continues to assert that praise can
affect behavior in relation to performance. Praise can be used to minimize problems
thus modifying behavior, encourage learning, influence other behaviors and enhance
efficacy.
The study sought to establish the extent to which employees experienced general
personal advancement, development and were more confident in performing their
duties. 1.0% of the respondents strongly disagreed, 14.0% disagreed, 16.0% were not
sure, 10.0% agreed, and 59.0% strongly agreed. Generally, 15.0% disagreed, 16.0%
were not sure, while 69.0% agreed that employees experience general personal
advancement, development and are more confident in performing their duties. The
study agreed with Billet (2004) who revealed that during learning, employees
undergo personality changes which happen at the same time causing changes in the
cognitive, emotional, and socio-societal dimensions that give rise to transformative

107
learning. The three dimensions help the learner to attain competence as development
occurs. Lastly, employees should be exposed to opportunities to develop their skills
and grow and in the art of learning new things and applying them. The employee is
more likely to retain what has been learnt and more likely to be motivated (Branham,
2005).
Table4.30: Motivation
SA A
NOT
SURE
% D SD
Total
a) Financial sub variable
I appreciate promotions I attained after
81 13.2 2.9 1.1 1.7 100
training sessions as they helped me improve on
my performance
Training has led to better remuneration
67.2 28.2 2.9 1.1 0.6 100
which has given me impetus to work hard and
achieve both
organizational and personal goals
Having trained on university scholarship
67.2 25.9 4 1.8 1.1 100
has encouraged me to work hard
After training, my salary improved,
59.2 23.6 9.2 2.9 5.2 100
thus, making me more interested
to work hard for the university
b) Non-financial sub variable
After undertaking training, non-teaching
71.8 17.4 8 1.7 1.1 100
employees are given higher responsibilities,
which
motivates them to perform better
Recognition in terms of compliments
66.1 24.7 6.9 1.1 1.2 100
and certificates are accorded to employees on
successful completion of training
Employees experience general personal
59 10 16 14 1 100
advancement, development and are
more confident in performing their duties

108
Table 4.31 shows the opinions of the respondents’ expectations on rewards and
incentives after trainings. These expectations are either direct such as promotions,
better remunerations, scholarship or indirect such as broaden responsibilities,
recognition, advancement and development.
The statistics show that employees would prefer promotions (Mean = 4.71, SD =
0.63), to scholarships (Mean = 4.39, SD = 0.85) and better remuneration (Mean =
4.27, SD = 0.75). These are direct forms of incentives to the employees since the
forms were directly felt by the respondents. In this case promotion is double edged
since it bequeaths the employees’ salary improvement and a rise in position. This
shows that salary improvement is only one sided since it offers only the raise in pay.
The second component of incentives is the indirect forms of motivation which
include the recognition, career advancement and enlarged responsibilities. The
respondents would prefer responsibilities (Mean = 4.57, SD = 0.81), to recognition
(Mean = 4.32, SD = 0.66) and career advancement (Mean = 4.27, SD = 0.92). The
rationale for this is that; three job groups were considered and thus at some levels
responsibilities is more important than other factors, the sector in which the study
was conducted was not–for profit and academic and thus holding a position is a more
important form of compensation. The respondents were indifferent on the idea that
the promotion criteria was adhered to. The responses point to the fact that promotion
is inherent in the workplace because the institutions are not-for profit enterprises.
When the respondents were asked on the factors that affect promotions, many
pointed to discriminations, nepotism.

109
Table 4.31: Descriptive Statistics on Motivation
N Mean Std. Deviation
Statistic Statistic Statistic
Promotion after training help improve 173 4.7110 .62668
performance
Training leads to better remuneration 173 4.2659 .74619
University scholarships encourage 173 4.3895 .84777
Salary improvement after training 173 3.5723 1.44743
Resultant responsibilities and leadership 173 4.5665 .80869
motivates
Recognition accord after successful 173 4.3237 .65536
training
Personal advancement and development 173 4.3237 .92059
after training
4.6.6 Performance of non-teaching employees
The study sought to establish the extent to which accomplishment of work targets
lead to performance benefit. The study revealed that 1.0% of the respondents
strongly disagreed, 1.8% disagreed, 1.1% were not sure, 27.0% agreed, and 69.1%
strongly agreed. Generally, 2.8% disagreed, 1.1% were not sure, and 96.1% agreed
that accomplishment of work targets leads to performance benefit. Logistics
encompasses a complex set of activities which require a collection of metrics to
adequately measure performance. Ideally, the performance metrics used should be
selected and maintained as a system, so that they can complement and support each
other and provide the decision makers with a well-balanced picture of the logistics
process (Sheriff, 2012).

110
The study sought to establish the extent to which employees enjoy working at the
university because the university promotes teamwork which translates into higher
productivity. The study revealed that 1.7% of the respondents strongly disagreed,
5.7% disagreed, 2.4% were not sure, 51.1% agreed, and 39.1% strongly agreed. The
study agreed with Irawanto (2015) who revealed that training can be viewed as a tool
for enabling organizations to increase productivity for the organization and the
employees.
The study sought to establish the extent to which employees endeavor to meet
university goals when possible. The study revealed that 1.0% of the respondents
strongly disagreed, 1.1% disagreed, 1.7% were not sure, 40.5% agreed, and 55.7 %
strongly agreed that employees endeavor to meet university goals when possible.
Generally, 2.1% disagreed, 1.7% were not sure, while 96.2% agreed that employees
endeavor to meet university goals when possible. There is empirical evidence by
Irawanto (2015) that positive work participation is encouraged through current
organizational issues, related to achieving organizational goals, and discussed at
meetings. In addition, employees also show deeper commitment to increasing their
motivation in work situation setting, both informal work discussions and formal
work environment.
The study sought to establish the extent to which employees adhere to university
policies at all times. The study revealed that 2.9% of the respondents strongly
disagreed, 2.3% disagreed, 5.1% were not sure, 46.6% agreed and 43.1% strongly
agreed that employees adhere to university policies at all times. Generally, 5.2%
disagreed, 5.1% were not sure, and 89.7% agreed that employees adhere to university
policies at all times. The study agreed with Lecourt et al. (2013) posit that
organizations /universities corporate training policies enhance employee interest in
training and provide guidance for orderly training schedules, as a
university/organization endeavor.
The study sought to establish the extent to which work of employees at the university
is of high quality. The study revealed that 8.0% of the respondents strongly
disagreed, 1.1% disagreed, 4.0% were not sure, 40.0% agreed, 37.0% strongly

111
agreed. Generally, 9.1% disagreed, 4.0% were not sure, while 77.0% agreed that
work of employees at the university is of high quality. The study thus agreed with
ILO (2015) which revealed that in many industries, shorter hours are associated with
higher output rates per hour and that flexible working hours have a positive effect on
employee satisfaction. In addition, Gupta (2012) observed that well managed
organizations viewed employees as a source of quality and productivity gains hence
a fundamental source of improvement especially when goals are achieved. According
to Appiah (2010), the amount; quality and quantity of training provided vary among
organizations. The factors which influence the quantity and quality of training and
development activities and output include the degree of change in the external
environment, internal environment, the availability of suitable skills within the
existing work-force and the extent to which management views training as a
motivating factor.
The study sought to establish the extent to which job at the university gives
employees pleasure especially when they meet set targets. The study revealed that
2.0% of the respondents strongly disagreed, 4.0% disagreed, 2.0% were not sure,
33.0% agreed, while 59.0% strongly agreed that job at the university gives
employees pleasure especially when they meet set targets. The study agrees with
Zimeras et al. (2014) who posit that a large number of factors for instance, work
environment and compensation policies influence employee performance.
Organizations should also provide job security, bonuses, and incentives on
achievement of target as these HRM Practices have a strong correlation with
employee performance. Other practices to be considered are decision making,
allowing employees to plan execution of their duties, delegation, equipping them
with job related skills, and setting of achievable targets. Other practices to be
incorporate include: involvement in task setting, fair evaluation, increased salary on
achievement of set targets and administrative rewards (Munjuri, 2011).
The study sought to establish the extent to which the rate of absenteeism at the
university is very low. 13% of the respondents strongly disagreed, 9.0% disagreed,
11.0% were not sure, 50% agreed, and 17% strongly agreed. Generally, 22%

112
disagreed, 11.0% were not sure, while 67% agreed that which the rate of absenteeism
at the university is very low. Thus, Punctuality is a sound performance indicator
which allows airlines to differentiate themselves from their competitors. It therefore
offers significant potential for saving on costs. Similarly, the employees at the
university strive to keep time and avoid being absent from work (Booz et., al., 2006).
The study sought to establish the extent to which employees intend to work at the
university till retirement. The study revealed that 4.0% of the respondents strongly
disagreed, 2.0% disagreed, 1.0% were not sure, 20.0% agreed, while 73% strongly
agreed that employees intended to work at the university till retirement. Generally,
6.0% disagreed, 1.0% were not sure, and 93.0% agreed that employees intended to
work at the university till retirement. The study concurred with Akala (2012) who
argued that employee retention among non-teaching staff at the UoN is influenced by
training and development, performance appraisal, welfare benefits, disciplinary
procedure and career growth. Non –teaching employees accepted that institutional
support for staff training and development was a major contributor to employee
retention. Clear performance targets, fair ratings in assessment, timely application of
performance results and upward mobility in careers greatly enhances employee
retention at the university. ILO (2012) revealed that employers who offer work
schedule flexibility to their employees are likely to improve the recruitment of new
staff and the retention of staff, resulting in cost savings to the organization.

113
Table 4.32: Performance of Non-Teaching Employees
SA A NOT D SD Total
SURE %
Accomplishment of work targets leads to 69.1 27.0 1.1 1.8 1.0 100
performance benefit
I enjoy working at the university because 39.1 51.1 2.4 5.7 1.7 100
the university promotes teamwork which
translates into higher productivity
I endeavor to meet university goals 55.7 40.5 1.7 1.1 1.0 100
when possible
I adhere to university policies all the time 43.1 46.6 5.1 2.3 2.9 100
My work at the university is of high quality 37.0 40.0 4.0 1.1 8.0 100
The rate of absenteeism at the university is 17.0 50.0 11.0 9.0 13.0 100
very low
My job at the university gives me great 59.0 33.0 2.0 4.0 2.0 100
pleasure especially when I meet set standards
I intent to work at the university till my 73.0 20.0 1.0 2.0 4.0 100
retirement
Table 4.33 shows the resultant effect of the trainings. As is observed from the Table
4.33, there are two components of performance; the individual employee
productivity and organizational performance. The individual employee productivity
includes high quality work and rate of absenteeism whereas organizational
performance is capture by work targets, teamwork and institutional goals. The

114
statistics show that the respondent’s perceived that accomplishment of work targets
would translate to improved performance(Mean = 4.70, SD = 0.48) .The work set
targets are benchmarks for performance in any organization and thus the respondents
perceived that accomplishing work targets would result in improved performance
though sometimes it may not be the case.
Teamwork is the new face of work productivity and as such it is given weight by the
organizational members (Mean = 4.32, SD = 1.61). Teamwork has been emphasized
by many studies as the solution to the employee productivity because it brings unity
of purpose, sense of belonging and harmony. Adherence to the institutional goals and
objectives is the foundation to the organizational performance and thus the
respondents affirmed that they adhered to them (Mean = 4.53, SD = 0.57).
Institutional goals serve as a motivator to drive the employee towards the attainment
of organizational goals and thus organizational performance.
On the part of the individual employee productivity, the most basic indicator is the
quality of work as is performed by the employee. The employees affirmed that they
carry out their work assignments to the utmost desired quality (Mean = 4.17, SD =
0.81) while at the same time reducing the time lost by lowering the absenteeism rate
to the bare minimum (Mean = 3.70, SD = 1.32). Evidently, the employees were more
satisfied with their work (Mean = 4.16, SD = 1.01). The aspect is heavily dependent
on the nature of the job the employee is performing, the skills required and job
demands. A mismatch in the skill requirement would inadvertently lead to disconnect
and thus the dissatisfactions. Most of the responses were centred on the training itself
such as continuous training, use of distance learning modules, while others alluded to
mentoring and induction, provision of scholarship and provision of financial support
.Employees suggested the following ways to improve on employee performance:
better pay and remuneration, motivation, equity, recognition and promotion.

115
Table 4.33: Descriptive Statistics on Employee Performance
N Mean Std. Deviation
Statistic Statistic Statistics
Accomplishment of work target leads 173 4.6994 .48447
to performance benefit
Teamwork translates into higher 173 4.3179 1.60579
productivity
Endeavor to meet the institution goals 173 4.5318 .56587
Adherence to university policies 173 4.2616 .87602
Higher quality work 173 4.1706 .81427
Rate of absenteeism is low 173 3.6763 1.32479
Work give great satisfaction 173 4.1618 1.01003
Intends to work until retirement 173 3.7225 1.06389
4.7. Correlation between Independent variable constructs and dependent
variable
Table 4.34 shows the correlation coefficient(r) statistics between study variables
Training needs assessment (r = 0.025), Training Mode (r = 0.186), Training Duration
(r = 0.24) and Training feedback (r =0.017) all positively correlate with performance.
Correlation coefficients can range from -1 to +1. -1 indicates that the there is a strong
negative relationship between the variables whereas +1 indicates that the there is a
strong positive relationship between the variables.

116
Table 4.34: Correlation between Independent variable constructs and
dependent variable
Training
needs
assessmen
t
Traini
ngmod
e
Training
duration
Training
feedbac
k
Motivation Performan
ce
Training needs
assessment
1.000
Training Mode 0.061* 1.000
Training
Duration
0.086* 0.165* 1.000
TrainingFeedb
ack
0.187* 0.022* 0.168* 1.000
Motivation 0.093* 0.192* 0.135* 0.121* 1.000
Performance 0.025* 0.186* 0.241* 0.017* 0.077* 1.000
* Significance at 0.05
4.8 Diagnostics tests (Assumptions of regression analysis)
4.8.1 Shapiro-Wilk Normality tests
Shapiro-Wilk's is recommended for small and medium samples size n = 2000
whereas for large samples, Kolgomorov - Smirnov is recommended. When W is
significantly smaller than 1, the normality assumption is not met with W = 1 showing
perfect normal distribution.
Table 4.35: Shapiro-Wilk Normality Test the study constructs
Variable Obs W Prob>z
Performance 173 0.79324 0.075
Shapiro-Wilk test for normality in performance construct
Ho: Data is distributed normally

117
H1: Data is not distributed normally
Since p value is greater than 0.05, the study did not reject the null hypothesis, hence
data is assumed to be distributed normally as indicated in table 4.35. Normal
distribution means that the data is symmetrical and most of the results lie near the
mean.
4.8.2 Tests for Multicollinearity
Two techniques are used concurrently to manage multicollinearity; tolerance and
variance inflation factor. In cases of tolerance, the cut-off value is usually 0.4
(Sekaran & Bougie, 2010) the independent variable should be dropped from the
analysis due to multicollinearity. Variance inflation factor (VIF) is simply the
reciprocal of tolerance. When variance inflation factor (VIF) is used in lieu of
tolerance, the rule of thumb is that VIF>10 (Sekaran & Bougie, 2010) when
multicollinearity is a problem. Although in this study there was no multicollinearity
detected.
4.8.3 Tests for Heteroscedasticity
Heteroscedasticity causes standard errors to be biased. OLS assumes that errors are
both independent and identically distributed; robust standard errors relax either or
both of those assumptions. The use of robust standard errors did not change the
coefficient estimates provided by OLS, but changed the standard errors and
significance tests. This means that the test statistics gave reasonably accurate p
values (Anderson, 2003 & Saunders, et., al. 2009).
4.9 Linear regression analysis
Before the regression analysis was done the items were dimensionally reduced using
factor analysis. This performance component will be used in all the regression
models. With the aid of Stata Version 12, linear regression was carried out using the
robust model inclusive of the test for heteroscadasticity (Robust HC3).

118
4.9.1 Objective 1: Training needs assessment
H0 Training needs assessment had no significant influence on the performance of
non-teaching employees at management level in selected public universities in
Kenya.
Vs.
H1 Training needs assessment had a significant influence on the performance of non-
teaching employees at management level in selected public universities in Kenya.
Training needs assessment was linear regressed on employee performance. With a
constant beta coefficient = 0.941781, table 4.30 shows that F(1, 172) = 3525.56,
with the Prob> F < 0.001. This indicates that the overall model is statistically
significant in explaining the employee performance. The explanatory power R2 is
0.9535 with the adjusted R2 = 0.9532. The VIF value is 1, illustrating that
multicollinearity was not an issue.
Given the “t” statistic value (30.53)> 1.96, the study rejected that that training needs
assessment coefficient is different from zero and since p value (0.001) < 0.05; the
study therefore rejected the null hypothesis (H0) and thus did not reject the alternate
hypothesis (H1) and concluded that training needs assessment influenced the
performance of the non – academic employees at management level in selected
public universities. An increase in training needs assessment results in 97% increase
in employee performance. In support of this, Nyongesa et., al. (2014) stated that
TNA led to well-planned training programs which gave value to organizations in-
terms of increased productivity, increased morale, reduced costs, increased
organizational stability and flexibility in adapting to changing external environment
thus led to improved employee performance.

119
Table 4.36: Linear regression analysis for employee performance and training
needs assessment
Unstandardized
Coefficients.
Std. Err.
t
P>| t |
Standardized
Beta
coefficient
Training needs
assessment .9741781 .0319075 30.53 0. 001 1.941248
Number of obs = 173 F( 1, 172) = 3525.56
Prob> F < 0.001 R-squared = 0.9535
Root MSE = 0.92753
VIF = 1
AdjR-squared = 0.9532
4.9.2 Objective 2: Training mode
H0The mode of training had no significant influence on the performance of non-
teaching employees at management level in selected public universities in Kenya.
Vs.
H1The mode of training had a significant influence on the performance of non-
teaching employees at management level in selected public universities in Kenya.
Training mode was linear regressed on employee performance. With a constant beta
coefficient =0.9520602, table 4.31 shows that F(1, 171) = 13225.47, with the Prob>
F < 0.001. This indicated that the overall equation is statistically significant in
explain the performance. The explanatory power R2 was 0.9872 with the adjusted R2
= 0.9871. The VIF value is 1 illustrating that multicollinearity was not an issue.
Given the “t” statistic value (115.00)> 1.96, the study rejected that that training mode
coefficient is different from zero and since p value (0.001) < 0.05; the study therefore
rejected the null hypothesis (H0) and thus did not reject the alternate hypothesis (H1)
and concluded that training mode influenced the performance of the non – teaching
employees at management level in selected public universities. An increase in
training mode results in 98% increase in employee performance. In support of this

120
Ongori and Nzonzo (2011) argued that training mode elucidated skills and
knowledge that led to improved employee performance.
Table 4.37: Linear regression for training mode and employee performance
Performance Unstandardized
Coefficients.
Std. Err. t P>| t | Standardized
Beta
coefficient
Training modes .9520602 .0082786 115.00 0. 001 .7951646
Number of obs = 173 F(1, 172) = 13225.47
Prob> F < 0.001 R-squared = 0.9872
Root MSE = 0.48727
VIF = 1
Adj R-squared = 0.9871
4.9.3 Objective 3: Training duration
H0Training duration had no significant influence on the performance of non-
teaching employees at management level in selected public universities in Kenya.
Vs.
H1 Training duration had a significant influence on the performance of non- teaching
employees at management level in selected public universities in Kenya.
Training duration was linear regressed on employee performance. With a constant
beta coefficient = 0.9622036, table 4.32 shows that F (1, 172) = 14840.50, with the
Prob> F < 0.001. This indicated that the overall equation is statistically significant in
explain employee performance. The explanatory power R2 is 0.9886 with the
adjusted R2 = 0.9885. The VIF value is 1 illustrating that multicollinearity was not an
issue.
Given the “t” statistic value (121.82)> 1.96, the study rejected that that training
duration coefficient is different from zero and since p value (0.001) < 0.05; the study
rejected the null hypothesis (H0) and thus did not reject the alternate hypothesis (H1)
and concluded that training duration significantly influenced the performance of the

121
non – teaching employees at management level in selected public universities. An
increase in training duration results in 96% increase in employee performance. In
support of this finding, Akala (2010) established that training duration had proven to
improve the individuals in various ways, and were a big investment for the future.
Table 4.38: Linear regression for training duration and employee performance
Performance Unstandar
dized
Coefficie
nts.
Std.
Err.
t P>| t | Standardized
Beta
coefficient
VIF
Training
duration .9622036
.00789
5
121.8
2 0. 001 .6937262
1
Number of obs = 173 F(1, 172) = 14840.50
Prob> F < 0.001 R-squared = 0.9886
Root MSE = 0.45936
VIF = 1
Adj R-squared = 0.9885
4.9.4 Objective 4: Training feedback
H0 Training feedback had no significant influence on the performance of non-
teaching employees at management level in selected public universities in Kenya.
Vs.
H1 Training feedback had a significant influence on the performance of non- teaching
employees at management level in selected public universities in Kenya.
Training feedback construct items was linear regressed employee performance. With
a constant beta coefficient = 0.9881002, table 4.33 shows that F(1, 171) = 8366.53
with the Prob> F < 0.001. This indicated that the overall equation was statistically
significant in explaining employee performance.

122
Given the “t” statistic value (91.47)> 1.96, the study rejected that that training
feedback coefficient is different from zero and since p value (0.001) < 0.05; the study
therefore rejected the null hypothesis (H0) and thus did not reject the alternate
hypothesis (H1) and concluded that training feedback significantly influenced the
performance of the non–teaching employees at management level in selected public
universities. An increase in training feedback results in 98.8% increase in employee
performance. In support of this Akala (2010) argued that from training feedback
promotions, transfers, awards, recognition and further training were incentives that
led to better employee performance.
Table4.39: Linear regression for training feedback and employee performance
Performance Unstandardized
Coefficients.
Std. Err. t P>| t | Standardized
Beta
coefficient
Training
feedback .9881002 .0108026 91.47 0. 001 1.025905
Number of obs = 173 F(1, 172) = 8366.53
Prob> F < 0.001 R-squared = 0.9799
Root MSE = 0. 61037
VIF= 1
Adj R-squared = 0.9797
Table 4.40 shows the overall regression coefficients. With a constant beta coefficient
= 0, table 4.34 results show that F (4, 168) = 4154.13, with the Prob> F < 0.001
which indicated that the overall equation is statistically significant in explain the
employee performance. The explanatory power R2 is 0.9900 with adjusted R2 being
0.9898 whereas two variable training; training duration and training mode suffice to
explain the employee performance.
Given that all the “t” statistic value are less than 1.96, the study rejected that that
training coefficient is different from zero and since p value (0.001) < 0.05; the study
therefore rejected the null hypothesis (H0) and thus did not reject the alternate

123
hypothesis and concluded that training significantly influenced the performance of
the non – teaching employees at the management level in selected public universities.
Table4.40: Multiple regression for employee performance
Performance Unstandardiz
ed
Coefficients.
Std. Err. t P>| t | Standardized
Beta
coefficient
Training needs
assessment .0024177 .041117 1.93 0.042 0.0048442
Training mode .3967962 .088966 4.46 0.001 .3330958
Training duration .558018 .094575 5.90 0.001 .4023178
Training feedback .0080652 .077022 1.83 0.0441 .0084151
Number of obs = 173 F(4, 168) = 4154.13
Prob> F < 0.001 R-squared = 0.9900
Root MSE = 0. 43442
VIF = 1
AdjR-squared = 0.9898
4.9.5 Objective 5: Motivation
H0 Motivation had no moderating influence on the relationship between training and
performance of non-teaching employees at management level in selected public
universities in Kenya.
Vs.
H1 Motivation plays a moderating role in the relationship between training and
performance of non-teaching employees at management level in selected public
universities in Kenya.

124
The Table 4.41 results show that F (4, 168) = 2.56, with the Prob> F = 0.0395, which
indicates that the overall model is statistically significant in explain the moderating
effect on employee performance. The explanatory power R2 is 0.9715 with adjusted
R2 being 0.9435 whereas two variable training; training duration and training mode
suffice to explain the employee performance.
Given that all the “t” value are less than 1.96, the study rejected that that motivation
coefficient is different from zero and since p value (0.0395) < 0.05; The study
therefore rejected the null hypothesis (H0) and did not reject alternate hypothesis (H1)
and concluded that motivation influences moderation of the relationship between
training and performance of non-teaching employees at management level in selected
public universities in Kenya.
This effect shows that motivation accentuates the effect of the independent variables
by increasing the effects of the individual variables (training mode and training
duration). To support this statement Mullins (2010) asserted that motivation is the
creation of stimuli, incentives and working environments that enable people to
perform to their utmost.

125
Table 4.41: Linear regression for motivation and employee performance
Performance Unstandardized
Coefficients.
Std. Err. t P>| t
|
Standardized
Beta
coefficient
VIF
Training needs
assessment
.0120571 .0386006 4.31 0.035 .0241583 1
Training mode .7155889 .0976348 1.21 0.029 .180979 1
Training duration .7559528 .1094895 2.34 0.021 .184536 1
Training feedback .0803237 .0775636 5.04 0.040 .0838092 1
Motivation .0887686 .0881853 2.01 0.032 .0839629 1
Number of obs = 173 F(4, 168) = 2.56
Prob> F = 0.0395 R-squared = 0.9715
Root MSE = 0.40698 AdjR-squared = 0.9435
1. Test for moderating effect on Motivation and Training duration
The test for moderating effect on training duration was created by multiplying
motivation and training duration. The interaction and the main effects are included in
a multiple linear regression model. The output is shown in Table 4.42. As indicated
by the coefficients in Table 4.42, the slope of independent variable “TD*M” was
statistically significant at 95% confidence interval. The slope was 0.335, thus, for
every unit increase in motivation, there is 33.5% increase in Training duration
predicted holding other variables constant. The results indicated that Motivation
positively moderates the relationship between TD and motivation in predicting
performance of non-teaching employees in selected public universities in Kenya. The
study addressing factors that influence employee retention among non-teaching staff
at UoN, by Akala (2010), agree with the findings as he postulates that certificate
programs have been proven to improve the individuals’ performance in various ways
and are a big investment for the future.

126
Table 4.42: Coefficients of Motivation and Training Duration
The model used is Y=B0+B1X1+B2X2+B3X3+B4X4+ B5X5 +ε
Model Coefficients
t p-value B
Std.
Error
1 (Constant) 2.586 .505 5.120 .000
Training duration .226 .104 2.165 .032
Motivation .151 .063 2.402 .017
2 (Constant) 9.090 3.773 2.409 .017
Training duration -1.297 .882 -1.471 .143
Motivation -1.284 .827 -1.552 .123
Motivation*Training
Duration
.335 .193 1.739 .044
The interaction effect coefficient is significant (p value= 0.044), hence motivation
moderates training duration. The change in R square when interaction effect is
included is also significant (0.21).This means that 21% of the corresponding change
in Motivation can be explained by a unit change in Training Duration. The R square
was 21% which means that 21% of change in moderating variable is explained by a
change in the independent variable. The results therefore indicate a strong
relationship since the recommended level by Szewezak and Snodgrass (2002) lies
between 20% to 30%. Therefore it can be concluded that training duration had a
significant influence on the performance of non-teaching employees at management
levels in selected public universities in Kenya.

127
Table 4.43: Interaction Effect Coefficient of Motivation and Training Duration
Model
Adjusted
R Square
Std. Error
of the
Estimate
Change Statistics
R
Square
Change
F
Change df1 df2
Sig. F
Change
1 .47 .404 0.068 6.165 2 169 .003
2 .68 .402 0.21 3.025 1 168 .044
2. Test for moderating effect of Motivation and Training mode
The slope in the regression equation in Table 4.44 indicated that there was an
average change in the independent variable with a one unit increase in the
moderating variable. The slope of the moderating variable TM*M was not significant
in the model at 95% confidence interval. Thus, for every unit increase in TM*M, a
decrease in motivation was predicted. This is indicated by regression results with
unstandardized beta coefficient of 0.012 and a p-value of 0.931. This implied that
there is no significant moderation effect between TM and M. The findings are
supported by Tao and Bucy (2007), who state that sometimes a variable may be
significant or insignificant, depending on the hypothetical causal path of the model.
Table 4.44: Coefficients of Motivation and Training Mode
Model Coefficients
t p-value B
Std.
Error
1 (Constant) 2.696 .476 5.665 .000
Motivation .157 .062 2.514 .013
Training mode .192 .089 2.161 .032
2 (Constant) 2.933 2.789 1.052 .294
Motivation .104 .620 .167 .867
Training mode .139 .627 .221 .825
Motivation*TrainingMode .012 .139 .086 .931
The model used was Y=B0+B1X1+B2X2+ε

128
The results in Table 4.44 showed that Motivation has no moderating effect on the
relationship between training mode and performance.
Table 4.45: Interaction Effect of Motivation and Training Mode
Model
Adjusted
R
Square
Std. Error of the
Estimate
Change Statistics
R
Square
Change
F
Change df1 df2
Sig. F
Change
1 .531 .40623 .064 5.822 2 170 .004
2 .275 .40742 .000 .007 1 169 .931
The slope in the regression equation in Table 4.45 indicated that there was an
average change in the independent variable with a one unit increase in the
moderating variable. The slope of the moderating variable TM*M was not significant
in the model at 95% confidence interval. Thus, for every unit increase in TM*M, a
decrease in motivation was predicted. This is indicated by regression results with
unstandardized beta coefficient of 0.012 and a p-value of 0.931, the R2 change is 000.
This implies that there is no significant moderation effect between TM and M. The
findings are supported by Tao and Bucy (2007), who state that sometimes a variable
may be significant or insignificant, depending on the hypothetical causal path of the
model.
3. Test for moderating effect of Motivation and Training needs assessment
The test for moderating effect on Motivation and Training needs assessment was
obtained by multiplying motivation and Training needs assessment. This interaction
and the main effects are included in a multiple linear regression model. The output is
shown in Table 4.46. As indicated in the coefficient table, the slope of independent
variable “TNA*M” was statistically significant at 95% confidence interval. The
slope was 0.087. Thus for every unit increase in motivation, there is 1.3% increase in
TNA predicted holding other variables constant. The results indicated that there was
moderation between TNA and M in predicting management level non- teaching

129
employee’s Performance in selected public universities in Kenya. The study by
Nyongesa et al, (2014) agrees with the findings as he postulates that well planned
training programs give value to organizations in terms of increased morale,
productivity, reduced costs, and increase in organizational stability, and flexibility to
changing external requirements. Brown (2002); and Sifuna (2006), stated that TNA
helps improve quality of policy, program decisions and may lead to improvements in
performance and accomplishments of desired results.
Table 4.46: Coefficients of Motivation and TNA
Model Unstandardized
Coefficients
t Sig. B
Std.
Error
1 (Constant) 3.559 .319 11.156 .000
Motivation .166 .063 2.622 .011
TNA -0.112 .038 2.980 .010
2 (Constant) 5.270 1.824 2.890 .004
Motivation .193 .182 2.505 .046
TNA .424 .135 2.975 .033
Motivation*TrainingNeeds .087 .011 2.953 .013
The model used was Y=B0+B1X1+B2X2+B3X3+ε
The interaction effect coefficient is significant (p value = 0.013), hence motivation
moderates training needs assessment (TNA). The change in R square when
interaction effect is included is also significant (0.013). The interaction term
improves the goodness of fit by 10.1 %. This change was found to be significant. The
results therefore indicate a strong relationship since the recommended level by
Szewezak and Snodgrass (2002) is between 20% and 30%.

130
Table 4.47: Interaction Effect of Motivation and TNA
Model
Adjusted
R
Square
Std.
Error of
the
Estimate
Change Statistics
R
Square
Change
F
Change df1 df2
Sig. F
Change
1 .276 .41167 .039 3.439 2 170 .034
2 .371 .31178 .101 4.908 1 169 .013
4. Test for moderating effect of Motivation and Training Feedback
The slope in the regression equation in Table 4.48 indicated that the average change
in the independent variable with a one unit increase in the moderating variable. The
slope of the moderating variable TF*M was not significant in the model at 95%
confidence interval. Thus, for every unit increase in TF *M, a decrease in motivation
was predicted. This is indicated by regression results with unstandardized beta
coefficient of 0.058 and a p-value of 0.723. These imply that there is no significant
moderation effect between TF and motivation. The findings are supported by Tao
and Bucy (2007), who state that sometimes a variable may be significant or
insignificant depending on the hypothetical causal path of the model.

131
Table 4.48: Coefficients of Performance and Training Feedback
Model Coefficients
t Sig. B
Std.
Error
1 (Constant) 3.626 .436 8.313 .000
Motivation .163 .063 2.083 .011
Training feedback .024 .073 2.328 .041
2 (Constant) 4.780 3.284 1.455 .147
Motivation .084 .700 -.120 .905
Training feedback .295 .768 -.384 .701
Motivation*TrainingFeedback .058 .164 .355 .723
The model used was Y=B0+B1X1+B2X2+B3X3+B4X4+ε
The results in Table 4.49 showed that Motivation explained 72.3% of the variation in
training feedback. The results therefore indicated a strong relationship as the level
recommended by Szewezak and Snodgrass (2002) is between 20% and 30%.The
relationship of R=0.428 and R2 = 0.001 meant that 0.1% of the corresponding
change in TF can be explained by a unit change in Motivation. The interaction term
improves the goodness of fit by 0.1%. This change was found to be insignificant.
Table 4.49: Interaction effect of Motivation and Training Feedback
Model
Adjusted
R
Square
Std.
Error of
the
Estimate
Change Statistics
R
Square
Change
F
Change df1 df2
Sig. F
Change
1 .428 .41164 .039 3.449 2 170 .034
2 .423 .41271 .001 .126 1 169 .723

132
Multiple Regression Analysis Results for all Variables
The study aimed at establishing the influence of training on the performance of non-
teaching employee at management level in selected public universities in Kenya.
The aspects of training that were studied included training needs assessment, training
duration, training mode and training feedback, with motivation as the moderating
variable.
The model equation, is Y=B0+B1X1+B2X2+B3X3+B4X4+ B5X5 +ε, measured at 60%
as shown in Table 4.50. The R2 value was .600. This shows that the model explains
60% of the variance in the dependent variable. This therefore indicated a strong
relationship since the recommended level by Szewezak and Snodgrass, (2002) is
between 20% and 30%. The relationship of, R = 0.600 and R² = 0.092 which meant
that 9.2 % of the corresponding change in performance can be explained by a unit
change in motivation. Co-efficient of determination in linear regression relationship,
tells how well the regression line fits the data. It is an important indicator of the
predictive accuracy of the equation. Goodness of fit refers to how well the model fits
the data, (Anderson, Sweeney, & Williams 2002).
The overall model as shown on Table 4.51 imply that out of the four independent
variables, TNA was significant at p=0.022 with a beta of 0. 013. Training Duration
had a p value of 0.001, hence significant and a beta of 0.703. Feedback exhibited a
low significance at p=0.086 and its beta was 0.241. Mode had a high significance of
p=0.037 with a beta of 0.928.These results suggested that TNA, TD and TM had a
significant influence on the performance of non-teaching employee at management
level in selected public universities, while Feedback was insignificant.
The findings corroborate with what Tao and Bucy, (2007), found out that although
the level of interactivity in structural studies is generally presumed to be objective
and the effects more or less uniform across users, interactive attributes can and do
have differential effects. Such findings suggest that changes in the dependent
variable are not a direct function of the independent variable, (the level of
interactivity), that is, Y is not equal to f (X). Instead, there may be one or more

133
variables moderating the relationship between the independent and dependent
variables.
Table 4.50: Model Summary without Constant
Model Adjusted
R
Square
Std.
Error of
the
Estimate
Change Statistics
R
Square
Change
F
Change df1 df2
Sig. F
Change
1 .600 .41773 .600 7.188 5 167 .000
2 .692 .40487 .092 9.592 3 164 .004
Linear Regression analysis of performance and Motivation
Linear Regression analysis of performance and motivation was done and based on
the results of the study as presented in Table 4.51, it was indicated as follows: the
correlation coefficient ( p) between performance and motivation was found to be at
0.000 with a beta coefficient of 0.234.These findings indicate that there was strong
linear correlation between the two variables.
Training needs assessment
Training needs assessment had a beta of 0.017 and standard error of 0.040, with a
calculated t value of 0.437, with a p value of 0.662.This implies that motivation had a
low moderating effect on TNA with a (p) value of 0.662. Although, studies by
Brown (2002); and Sifuna (2006), state that TNA helps improve quality of policy,
program decisions and may lead to improvements in performance and
accomplishments of desired results.
Training Mode
Training mode variable had a beta coefficient of 0.328, standard error was at 0.087,
with a calculated t value of 3.757 and the (p) value was 0.000.This implies that
motivation had a strong positive significant effect on training mode.

134
Training Duration
Training duration had a beta coefficient of 0.404 and a standard error at 0.099.
Calculated t was at 4.058 and the p value was= 0.000 .This suggests that motivation
had a high significant influence on Training Duration. The study on factors that
influence employee retention among non-teaching staff at UoN, by Akala (2010),
agree with the findings as he postulates that short-term programs have been proven
to improve the individuals’ performance in various ways and are a big investment
for the future.
Training feedback
Training feedback had a beta of 0.006 and standard error was 0.74. Calculated t was
at 0.086 and the (p) value was= 0.932 .This implies that motivation had a very weak
influence on training feedback. Opus (2008), stated that there was no positive
relationship between employee motivation and resultant good performance since
other factors exists in the interplay and should be in place, such as achievement,
advancement, responsibility, and recognition. In addition to positive relationships
which are essential for performance, there is need for adequate remuneration, good
working conditions, and reliable job security to motivate employees. In addition;
supervision, performance appraisals, coupled with training were important to
encourage employee good performance. However, a contrary opinion is held by
Atwater et al. (2000) who reported that providing individuals with written feedback
does not necessarily predict improvement in subsequent performance.

135
Table 4.51: Model Summary with constant and without constant in model 2
Model Coefficients t
B Std.
Error
p
value
1 Motivation .234 .061 3.834 .000
TNA .017 .040 .437 .662
Training mode .328 .087 3.757 .000
Training duration .404 .099 4.058 .000
Training feedback .006 .074 .086 .932
2
Motivation 0.93 0.127 5.023 0.018
TNA 0.13 0.408 2.218 0.022
Training mode 0.928 0.589 2.177 0.037
Training duration 0.703 0.564 3.106 0.001
Training feedback 0.241 0.086 1.281 0.086
Motivation*TrainingNeeds 0.524 0.127 2.412 0.024
Motivation*TrainingDuration 0.167 0.133 2.254 0.033
Motivation*TrainingMode 0.818 0.016 1.106 0.612
Motivation*TrainingFeedback 0.64 0.127 1.024 0.753
4.10 Optimal Model
The coefficients for regression of all variables indicated that TNA, TD, TM and TF
were significant. However, Training Mode and Training Feedback presented low
significance. In arriving at the final model, the four variables TNA, TM, TD and TF
were significant and were retained since they all had influence on performance of
non-teaching employees at management level in selected public universities in
Kenya.
The model holds that: Y=0.13X1 +0.928X2+0.703X3+0.241X4 + ε
Where Y = Dependent variable (Performance)

136
X1 = TNA
X2 = Training Mode
X3 = Training Duration
X4 = Training Feedback
ε = Error Term
Training Needs
Assessment X1
Training Mode X2
Motivation X5
Performance Y
Training Duration X3
Training Feedback X4
Independent Variables Moderating Variable Dependent Variable
Figure: 12 Optimal Model

137
CHAPTER FIVE
SUMMARY, CONCLUSION AND RECOMMENDATIONS
5.1 Introduction
This chapter comprises of the summaries of the findings and implications derived
from the objectives of the study and conclusions arrived at from the objectives are
stipulated. Important recommendations and suggestions for further research are
incorporated, based on the results of this study.
5.2 Summary of major findings
The study aimed at establishing the influence of training on the performance of non-
teaching employees at management level in selected public universities in Kenya.
The independent variables included: Training needs assessment, Training Mode,
Training duration and Training feedback. Motivation was a moderating variable,
while performance was the dependent variable. The study revealed that all the
independent variables such as TNA, Training Mode, Training Duration, and Training
feedback all played a significant role in the performance of non-teaching employees
at management level in selected public universities in Kenya.
5.2.1 Influence of training needs assessment on performance of non-teaching
employees at management level in selected public universities in Kenya
The study revealed that public universities in Kenya administer TNA to non-teaching
employees in management cadres to enable exposure of staff to relevant trainings,
with the aim of achieving organizational goals and objectives. For instance, most of
the respondents agreed to having been assessed by administration before they were
exposed to TNA exercise. In this case, TNA lead to acquisition of appropriate skills.
Greater regard should be preferred to training needs of special groups. TNA helped
identify employees who seriously needed to improve on the use of new technology in
performing duties. With the onset of Globalization, new technology has made
communication easier as it is through the use of new technology that organizations

138
will keep abreast with new economic and social trends in the world. TNA curbs
wastage of man hours, and monetary resources by not launching unrequired
programs for employee training. TNA therefore helps in maintaining standards in
performance. The right personnel are exposed to the right training which bridges the
gap of lack of adequate training. Through TNA, new job opportunities are identified
for employees and as a result, many employees stay focused in their relevant and
appropriate jobs. TNA helped in the improvement of quality policy and program
decisions culminating in improvement in performance and accomplishment of
desired results. TNA involved moving from current to desired results and directed
subsequent decisions such as design, implementation, and evaluation of projects and
programs that give desired results.
5.2.2 Influence of mode of training on performance of non-teaching employees
at management level in selected public universities in Kenya
The study revealed that mode of training had played a significant influence on non-
teaching employee performance at management level in selected public universities
in Kenya. Most of the respondents agreed that performance improved after training
while on the job training helped in operations, as computer based knowledge helped
them to undertake bigger quantity and quality of work. Depending on the mode of
training, employees acquired knowledge that improved their performance. Job
rotation helped employees to master operations in most departments within the
university, enabling employees to work with ease in any department. Where possible
for senior technical staff, apprenticeship promoted transfer of skills and knowledge
to employees through participation and observation.
5.2.3 Influence of training duration on performance of non-teaching employees
at management level in selected public universities in Kenya
The study revealed that duration of training played a significant influence on the
performance of non-teaching employees at management level in selected public
universities in Kenya. Duration implies the length of time training takes; therefore,
there are short programs: seminars, conferences, workshops, and long programs:
PhD, Masters, degree, diploma, certificate, others include management sponsored

139
trainings. Most of the respondents agreed that short-duration programs helped in the
attainment of degree programs, and at the same time enhanced work performance.
Generally majority of respondents indicated high percentages agreeing that duration
of training played a significant role in non-teaching employee performance in
selected public universities in Kenya. Short training improved employee
performance at management level in selected public universities and had a positive
impact on job skills, improved behavior, and organizational decision making.
5.2.4 Influence of Training feedback on performance of non-teaching employees
at management level in selected public universities in Kenya
The study revealed that training feedback played a significant influence on the
performance of non-teaching employees at management level in selected public
universities in Kenya. Most of the respondents agreed that appraisal practiced at
universities helped identify areas to improve skills. The study therefore established
that employees required frequent feedback; as positive reinforcement was the most
desired and effective form of feedback.
5.2.5 Influence of motivation in moderation of the relationship between training
and performance of non-teaching employees at management level in selected
public universities in Kenya
The study revealed that motivation played a significant role in moderating the
relationship between non-teaching employee training and performance. Motivation
occurs in various forms such as: financial: promotions, better remuneration, salary,
and scholarships, which encourage more involvement in training. The study further
established that employee engagement can be increased through sponsorship in an
attempt to develop a performance culture to motivate employees. Non-financial
motivation can be envisaged in higher responsibilities, personal advancement and
recognition granted to employees. Recognition by compliments and certificates are
accorded on completion of courses. The motivating factors mentioned inherently
cause employees to perform better. The study confirmed that allowing employees to
participate in decision making led to increase in motivation, job performance and
organizational growth.

140
5.3 Conclusions
The study aimed at establishing the influence of training on the performance of non-
teaching employees at management level in selected public universities in Kenya.
The independent variables included: Training needs assessment, mode of training,
training duration and training feedback. The moderating variable was motivation,
and the dependent variable was performance. The study revealed that all independent
variables of training had a significant influence on the performance of non-teaching
employees at management level in selected public universities in Kenya.
The universities administer TNA, for total quality management control. The mode of
training used is of relevance to employees and of good quality. Training duration was
well timed and acceptable to both employees and the university management.
Training feedback is an area given much attention by public universities management
as well. The study established that motivation played a significant moderating
influence between training and non-teaching employee performance. Motivated
employees work with purpose, vision, and accomplish set assignments.
5.4 Recommendations
5.4.1 Training Needs Assessment.
Public universities should continue administering TNA to employees to help identify
areas affecting staff and recommend for them trainings accordingly to help bridge the
gap between what is happening and what is expected to be done. This is because
trainings which are irrelevant to employees, would lead to waste of time and
financial resources. Through trainings need assessment, public universities will
realize many new job opportunities for various employees and employees will
therefore be happy, satisfied and stay focused in their appropriate jobs.
5.4.2 Training Mode.
Various training methods in the study were widely used in most public universities in
the study. However, public universities must recognize the effect of globalization and
step up computer/web based training/awareness to all employees, in order to survive
in this competitive era. Job rotation should not be used as a punishment but it should

141
be done in a way that is appealing, knowing employees would benefit from exposure
to many departments.
5.4.3 Training Duration.
Programs should be well designed and take adequate duration to enable appropriate
evaluation. The programs should be developed by experts and involve participation
by employees. Employees should be encouraged to attend workshops, seminars &
conferences to stay relevant in their jobs.
5.4.4 Training Feedback.
Public Universities must give timely training feedback to employees after attending
trainings. Delayed feedback is of no use to employees. Feedback should be relayed
with caution and in a humane manner to encourage positive reception and taking of
action.
5.4.5 Motivation
Public universities should consider effecting timely financial and non-financial
benefits to employees. Motivation is an incentive that employees cherish and
appreciate. Delayed motivation already waves the desire for employees to perform
better. On successful completion of training, employees should be motivated timely
with appropriate promotions, salary increments, scholarships, higher responsibility,
recognition and personal advancement. If motivation is delayed, then employees lose
morale and lower performance.
Employee welfare is considered by incorporating HR department to hasten employee
updates and appropriately slotting them in required cadres with relevant provisions.
For instance, after promotion there are advantages the employees deserve. The
universities should formulate and effect policies for motivating their employees.
5.5 Areas for further research
More research should be conducted on the same topic as well as longitudinal study to
compare various times and happening and check for consistency in the way
universities conduct and monitor training. This study concentrated on the influence

142
of training on the performance of non-teaching employees at management level in
selected public universities, but another study could be conducted covering all
university staff both teaching and non-teaching from lower cadres to the higher
levels. In addition, a study could be conducted on employees in private universities,
or a comparative study between private and public universities.

143
REFERENCES
Abagi, N., & Yego, H. (2016). Challenges facing higher education in management of
privately sponsored student programs in Kenya. British journal of education,
4 (8), 52-62.
Abbasi, B., & Shahin, R. S. (2013). Investigating the influence of job rotation on
performance by considering skill variation and job satisfaction of bank
employees. Tehnical Gazzette, 20 (3), 473-478.
Adjei, D. (2012). The impact of job rotation on employees performance: A case of
UTRAK financial services limited. Accra. Kwame Nkurumah University.
Afshan, S., Sobia, I., Kamran, A., & Nasir, M. (2012). Impact of Training on
Employee Performance: A Study of Telecommunication Sector in Pakistan.
Interdisciplinary Journal of Contemporary Research in Business, 4 (6), 646-
661.
Aguinis, H., & Kraiger, K. (2009). Benefits of Training and Development for
Individuals and Teams, Organizations and Society: The Business School of
colorado. The Annual Review of Psychology, 60 (3), 451-477.
Ahuja, K. 2006. Personnel management (3rd Ed.). New Delhi: Kalyani publishers.
Ajibade, S., & Ayinla, N. (2014). Investigating the Effect of Training on Employees
Commitment: An Empirical Study of a Discount House in Nigeria.
Megatrend Review, 11 (3), 7-18.
Akala, H. S. (2012). Factors influencing employee retention among the non teaching
staff at the University of Nairobi. University of Nairobi. Nairobi: University
of Nairobi.
Anderson, T. W. (2003). An introduction to multi-variate statistical analysis. New
York: John Wiley.
Andrea, R. (2015). Long term benefits of short courses. Journal of human resource
management, 6 (1), 45-117.
Anna, M., & Bierstaker, J. (2009). The Effect of Performance Feedback amd Client
Importance on Auditors Self and Public Focused Ethical Judgements.
Managerial Auditing Journal, 24 (5), 45-474.
Anne, K., & Charity, M. (2015). Employee Empowerment and Organization
Performance of Tata Chemicals Magadi Ltd, Kenya. European Journal of
Business and Management, 7 (8), 120-134.
Appiah, B. (2010). The Impact of Training on Employee Performance: A Case Study
of HFC Bank. Ashesi University College, Department of Business
Administration ( MBA Thesis). Accra: Ashesi University College.
144
Armstrong, M. (2009). Armstrong's Handbook of Human Resource Management
Practice (11th Ed.). London: Kogan Page.
Arshad, H. (2008). Emerging Human Resource Policies and Practices in Select
Banks: A Study.(UnpublishedPh.D Thesis). Osmania University, India.
Atwater, L. (2001). 3600 Feedback: Accuracy, Reactions, and Perceptions of
Usefulness. Journal of Applied Psychology, 86 (5), 930-942.
Ayodeji, O. O., Michael, O., & Tunde, E. (2011). Enhancing Employee's
Commitment to Organization through Training. International Journal of
Business Management, 6 (7), 280-286.
Azara, S., Syed, M., Hussain, N., & Muhammad, A. (2013). Employees Training and
Organizational Performance: Mediation by employees’ performance.
Interdisciplinary Journal of Contemporary Research in Busisiness, 5 (4),
490-503.
Baker, V., & Ronald, C. (2015).Teamwork Improves Trauma Team Performance in
undergraduate Health Proffessional students, Education Evaluation for
Health Proffessions, 12 (36), 1-6.
Bandura, A., & Benight, C. (2013). Social cognitive theory of postraumatic recovery:
the role of percieved self- efficacy. Journal of Behaviourm Research and
Therapy, 42 (1), 1129-1148.
Batool, A., & Batool, B. (2012). Effect of Employee Training on the Organizational
Competitve Advantage: Empirical Study of Private Sector of Islamabad. Far
East Journal of Psychology and Business, 6 (1), 59-72.
Bell, E., & Bryman, A. (2011). Business Research Methods (3rd Ed.). New York:
Oxford University Press.
Bell, S., & Kozlowski, J. (2008). Active learning: Effects of core training design
elements on self-regulatory processes, learning, and adaptability. Journal of
Applied Psychology, 93 (2), 296-316
Benzing, C. & Chu, M. (2009). A comparison of the motivations of small business
owners in Africa. Journal of Small Businesses and Enterprise Development,
16 (1) 60-77.
Billet, S. (2004). Work place participatory practices:Conceptualising workplace as
learning environment.The Journal of Workplace Learning, 16 (6), 312-324.
Booz, Allen & Hamilton. (2001). Punctuality: How airlines improve on time
performance. Booz, Allen & Hamilton Publishers
Bower, H., & Hilgard, R. (1981). Theories of learning. Englewood Cliffs, New
Jersey: Prentice-Hall.

145
Branham, L., & Saratoga. (2005). The Seven Hidden Reasons Employees Leave.
Business Book Review, 22 (3), 1-10. New York: American Management
Associate.
Briscoe, R. (1995). International Human Resource Management. New Jersey:
Prentice Hall.
Brown, J. (2002). Training needs Assesment: A Must for Developing an Effective
Training Program. Public Personel Management, 31 (4), 569-578.
Brum, S. (2007). What Impact does training have on Employee Commitment and
Employee Turnover? University of Rhodes, Schmid Labour Research Center:
Seminar Research Series. Rhodes: University of Rhodes.
Buyens, D. (2010). The relationship between training and firm performance: A
literature review, research and practice in Human Resource Management, 18
(1), 28-45.
Campion, A. (2001). The Knowledge, Skills and Ability requirements for
Teamwork: Implications for Human Resource Management. Journal of
Management, 30 (2), 503-530.
Chacha, N. (2004). Reforming Higher Education in Kenya Challenges, Lessons and
Opportunities. Nairobi. Interuniversity Council for East Africa press.
Chambers, B., Slavin, R., Madden, N., Abrami, P., Tucker, B., Cheung, A., et al.
(2008). Technology infusion in Success for All: Reading outcomes for first
graders. Elementary School Journal, 109 (1), 1–15.
Cheboi, C. (2004). Financing higher education in Kenya: The experience of the
Higher Education Loans Board. Eldoret: Moi University Press.
Chiaburu, S., & Teklab, G. (2005). Individual and contextual influences on multiple
dimensions of training effectiveness. Journal of European Industrial
Training, 5 (20), 282-290.
Coles, M. (2000). Virtual Universites are just the Job. The Sunday, 21stMay 2000., p.
35.
Cooper, D. R., & Schindler, P. S. (2011). Business Research Methods (11th Ed.).
New York: McGraw-Hill International.
Dabale, W., Jagero, N., & Nyauchi, M. (2014). The Relationship Between Training
and Employee Perfromance: The Case of Mutare City Council Zimbabwe.
International Journal of Human Resource Studies, 4 (4), 61-72.
Dawo, A. J., Simatwa, E. M., & Okwatch, T. (2012). Evaluation of Academic Staff
Development Practices Outcomes on Job Performance in Selected Public
Universities in Kenya. International Journal of Academic Research in
Progressive Education and Development, 1 (4), 309-317.

146
Deci, M. (2000). What” and ‘Why” of Goal Pursuits: Human Needs and the self
determination of behavior. New Jersey: Lawrence Erlbaum Associates, Inc.
Dell’Olio, J. M., & Donk, T. (2007). Modeling of teaching: Connecting student
learning with standards. Carlifornia: Sage Publications.
Dessler, G. (2005). Human Resource Management (10th Ed.). London: Prentice Hall.
Dessler, G., & Varkkey, B. (2009). Human Resource Management (11th Ed).
Amazon Paperback Publishers: Pearson Education.
Dobson, S., & Khatiri, N. (2000). Cognitive therapy: Looking backward, looking
forward. Journal of clinical psychology, 56 (7), 907-923.
Echard, R. D., & Berge, Z. L. (2008). Quality management builds solid e-training
Administering examinations for quality control in distance education: The
National Open University of Nigeria Perspective EC IBARA, National Open
University of Nigeria, 7-11: 12.
Elnaga, A. &. Imran. A. (2013). The Effect of Training on Employee Perfromance.
European Journal of Business Management, 5 (4), 137-147.
Erskine, L., & Johnson, S. (2012). Effective Learning Approaches for Sustainability:
A Student Perspective. Journal of Education for Business, 87 (4), 1-8.
Falola, A., & Osibanjo, S. (2014). Effectiveness of Training and Development on
Employees’ Performance and Organisation Competitiveness in the Nigerian
banking industry. Romania: Bulletin of the Transilvania University of Braşov
press.
Farooq, M., & Khan, M. (2011). Impact of Training and Feedback on Employee
Performance. Far East journal of Psychologyand Business, 5 (1), 23-33.
Flippo, E. (2001). Personnel management. New York: Mc Graw Hill.
Fox. (2003). Training Budgets said to be withstanding Companies Economic
Resources. Human Resource Magazine, 48 (7), 32-33.
Franz, J., & Omolo, J. (2014). Youth Employment Initiatives in Kenya: A Report of
Review Commissioned by the World Bank and Kenya Vision 2030, Nairobi.
World Bank and Vision 2030 Delivery Secretariat.
Gajanan, S. (2016). Learning and Development Activities and Methods
https://www.linkedn.com/Learning and development activities and methods 3-
5-03-2015.
Gamage, P. N. (2013). Training and Development Performance of Employees:
Evidence from Sri Lanka Telcom. Journal of Marketing, Financial Services
& Management Research, 2 (9), 12-24.
Garcia, M. (2005). Training and business performance: The Spanish case.
International Journal of Human Resource Management, 16 (9), 1691-1710.

147
Ghoshi, P., Singh, P., Rajan, R., Josh, P., &.Satyawadi, R., (2012). Towards more
effective trainning programs: A Study of Trainner attributes. Jounal of
Industlrial and Commercial Trainning, 44 (4), 194- 202.
Gibbs, M. (2007). Personnel economics for managers (2nd Ed).http://www.nursing-
standard.co.uk/archives/ns/vol 15-43/vol 15w-43p384/pdf accessed 16th
Jan,2008.
Golden, W. (2003). Training the knowledge worker: a descriptive study on training
practices in Irish software companies. Journal of European Industrial
Training, 27 (4), 137-146.
Goldstein, L., & Ford, J. (2007) .Training in Organizations (4th Ed). New Delhi:
New Age International Publishers.
Gratton, L. (2004). The Democratic Enterprise. London: Prentice Hall.
Grobler, K., Molefi, M., & Tiholoe, K. (2006). The implication of staff turnover on
performance: A case of North West provincial department of South Africa.
Mediterranean Journal of Social Sciences. 5 (23), 117-125.
Gruber, T. (2015). When good news is bad news:the negative impact of customer
feedback on frontline employee well being. journal of Services Marketing, 29
(7), 599-612.
Guerrero, S., & Sire, B. (2001). Motivation to train from the workers perspective:
Example of French companies. The International Journal of Human Resource
Management, 12 (6), 988-1004.
Gupta, K. (2007). A Practical Guide to Needs Assessment. (3rdEd.). SanFrancisco:
John Willey&Sons.
Gupta, K. (2012). Impact of Job Satisfaction on Employee Performance, A Challenge
for Human Resouce Managers in Changing Environment. International
Journal of Scientific Research and Reviews, 1 (3), 88-95.
Hall, E., Quinn, F., & Gollnick, D. M. (2008). The joy of teaching: Making a
difference in student learning. Boston: Allyn & Bacon.
Hannagan. (2005). Management Concepts and Practices (4th Ed.). Harlow: Pearson
Press.
Hansson, B. (2007). Company Based Determinants of Training and the Impact of
Training on Company Performance Results from International HRM Survey.
Emarald Journal Personel Review, 36 (2), 311-331.
Harris, R., Peter, W., Michele, S., & Emily, C. (2007). The relative contributions of
institutional and workplace learning environments: an analysis of
apprenticeship training. Journal of Vocational Education & Training, 53 (2),
263-278.

148
Henriksen, T. (2004). Beyond role and play: On the transmutation of educational
role-play: A critical reframing to the role-play in order to meet educational
demands. Helsinki: Solmukohta Inc.
Hitt, A., & Esser, K. (2002). Effects of delayed rewards and task. Special Issue of
Organizational Behaviour and Human Decision Processes, 73-484. Engage
Learning Indian Ltd
Hornby, A. S. (2012). Oxford Advanced Learners Dictionary (6th Ed.). London:
Oxford University press.
Houger, P. (2006). Trends of employee performance. Collaborative effort between
managers and employees. International Society for performance improvement
journal, 45 (5), 26-31.
Illeris, K. (2003). Workplace learning and learning theory. Journal of Workplace
Learning, 15 (4), 167-178.
ILO Steedman. (2014). Overview of Apprenticeship Systems and Issues: ILO
contribution to the G-20 Task Force on Employment.
ILO. (2012). Global estimate of forced labour: Executive summary. Geneva
ILO. (2015). World Employment and Social Outlook. Geneva.
International-Labour-Conference. (2008). Conclusions on Skills for Improved
Productivity Employment, Growth and Development. International Labour
Organization. Geneva: International Labour Office.
Iqbal, N., Ahmad. N., & Javaid, K. (2014). Impact of Training on Employee
Performance: A Study of Telecommunication Sector in Pakistan.
International Letters of Social and Humanistic Sciences. 17 (1), 60-73.
Irawanto, D. (2015). Employee Participation in Decision Making: Evidence from a
State owned Enterprise in Indonesia. Journal of Management, 20 (1), 159-
172.
Jagero, N., Komba, H. V., & Mulingi, M. N. (2012). Relationship between on the
job-training and employee’s performance in courier companies in Dar es
Salaam, Tanzania. International Journal of Humanities and Social Sciences,
2 (22), 114-120.
Jones, R. (2016). Innovation, research and the UK’s productivity crisis. London:
Sheffield Political Economy Research Institute.
Juhary, A. (2000). Mengurus tenaga kerja. Kuala Lumpur: Dewan Bahas dan
Pustaka.
Julia, R., & Alison, W. (2009). The effect of computer-assisted learning versus
conventional teaching methods on the acquisition and retention of hand

149
washing theory and skills in pre-qualification nursing students: A randomized
controlled trial. International Journal of Nursing Studies, 5 (47) 287–294.
Karim, I., & Salagegheh, S. (2013). Impact of in-service Training on Employee
Empowerment Regional Electric Company in Gilan. Journal of Education
and Human Development, 1 (2), 1-11.
Karwowski, M. & Soszynski, M. (2008). How to develop creative imagination?
Assumptions, aims and effectiveness of role play training in creativity
(RPTC). Thinking Skill and Creativity Journal, 3 (2), 163-171.
Kasau, A. (2014). Relationship between Training and Performance: A case study of
Kenya Women Finance Trust Eastern Nyanza Region, Kenya. European
Journal of Business and Social Sciences, 3 (1), 95-117.
Katou, A., & Budhwar, P. (2007). The effect of HRM polcies on organizational
performance in Greek Manufacturing firms. Thunderbird International
Business Review, 49 (1), 1-35.
Kawesa, H. (2004). Performance-based rewards and the performance of teachers in
private secondary schools in Kampala district. Kampala: Makerere University Press.
Khan, F., Yusoff, R. M., & Khan, A. (2014). Effect of Human Resource Practices on
Job satisfaction in Pakistan. World Applied Sciences Journal, 30 (1), 20-28.
Kipkebut, D. J. (2010). Organizational Commitment and Job Satisfaction in Higher
Educational Institutions: The Kenyan Case (PhD Thesis). London: Middlesex
Univeristy.
Kiruja, E., & Mukuru, E. (2013). Effect of Motivation on Employee Performance in
Public Middle Level Technical Training Institutions in Kenya. International
Journal of Advances in Management and Economics, 2 (4), 73-82.
Klane, J. & Pearson, G. (2007). Training Needs Assessment-Who,What,
When,Where,Why and How! http://www Osha/publications/Osha 2254 pdf.
Knowles, M. (2013). Informational Adult Education. Chicago: Association Press.
Kosgei, K. Z. (2004). The role of foreign aid in financing university education in
Kenya. Eldoret: Moi University Press
Kothari, C. R. (2008). Research Methodology-Methods and Techniques (2nd Ed.).
New Delhi: New Age International Publishers.
Kotler, P., & Armstrong, G. (2002). Marketing: An introduction (6th Ed.). London:
Prentice-Hall.
Leat, M. (2007). Exploring Employee relations (2nd Ed). London: Routledge Taylor
Group publishers.

150
Lecourt. (2013). Driving human resource towards quality in a highly competitive
environment. International Journal of Manpower, 34 (8), 839-860.
Leung, A. (2006). Conceptual model of Information Technology Training Leading to
Better Outcomes. International journal of Business and Information, 1 (1),
74-95.
Locke, E. & Latham, G. (2012).The effect of sub-concious goals on organizational
behaviour. International review of Industrial and organizational psychology.
NJ: John Willey & Sons Limited.
Locke, E., & Latham, G. (2006). New Directions in Goal-Setting Theory. Toronto:
Association for Psychological Science Inc.
Lunenberg, F. (2011). Goal Setting Theory of Motivation. International Journal of
Management, Business and Administration, 15 (10), 2-3.
Lynn, M., & Nelson, L. (2015). The Effects of Using Academic Role-Playing in a
Teacher Education Service-Learning Course. International Journal of Role-
playing, 5 (1), 1-8.
Mahbuba, S. (2013). Impact of Training in Pharmaceutical Industry: An Assesment
on Square Pharmaceuticals Limited, Bangladesh. International journal of
Science and Research, 2 (2), 576-587.
Malinski, A. (2002). Job rotations as a workplace learning tool in the Flinders
University Library Graduate Trainee program. Australia: Fliders university
press.
Maria, I., Daniel, J. J., & Raquel, S. V. (2014). Training and performance: The
mediating role of organizational learning. Business Research Quarterly, 17
(30), 161-173
Martyn, D. (2010). The Good Research guide for small scale social research projects
(4th Ed.). New York: McGraw-Hill Publishers.
Matofari, E. (2015). Effects of Training Practices on the Performance of small and
medium size hotel enterprises in Mombasa County. Mombasa: Technical
University of Mombasa.
Mbijiwe J., & Venkataiah, P. (2013). The Doom of Employees’ Training in Public
Service – A Case Study of Ministry of Education in Kenya. Journal of
Business and Management, 14 (2), 74-104.
McCourt, W., & Derek, E. (2003). Global Human Resource Management: Managing
People in Developing and Transitional Countries. London: Edward Elgar
Publishers.
Mehdi, A. (2004). Innovations through Information Technology. Information
Resources Managment Association. International Conference IDEA Group, 1
(1), 47-76.

151
Meriläinen, M. (2012). The self-perceived effects of the roleplaying hobby on
personal development – a survey report. International Journal of Role-
Playing, 3 (1), 49-68.
Mitiku, A., Mesele, A., & Lemessa, B. (2015). The Impact of Training and
Development on Employee Performance and Effectiveness: A Case Study of
District Five administration offices, Bole Sub-City Addis Ababa, Ethiopia.
Journal of Human Resource and Sustainability Studies, 3 (1), 188-202.
Mohsan, F., Faizan, M., Nawaz, M., & Khan, S. (2012). Impact of job rotation on
employee motivation, commitment and job involvement in banking sector of
Pakistan. African Journal of Business Management, 6 (24), 7114-7119.
Morrison, E. W. (2014). Employee voice and silence. The annual review of
organizational psychology and organizational behavior, 1 (1), 173-197.
Mugenda, O., & Mugenda, A. (2003). Research Methods Quantitative and
Qualitative Approaches. Nairobi: ACTS Press.
Mullins, L. (2010). Management and Organizational Behavior (9th Ed.). London:
Pearson Education Limited.
Mulwa, W. (2003). The efficacy of participatory strategic planning Approaches to
organizational building. South Africa: University of South Africa press.
Munjuri, M. (2011). The effect of Human Resource Management Practices in
Enhancing Employee Performance in Catholic Institutions of Higher
Learning in Kenya. International Journal of Business Administration, 2 (4),
1-36.
Mwesigwa, A. (2010). The Impact of Training on Employee Work Performance
Behavior: A Case Study of Government Aided secondary schools in Ibanda
District Uganda. International Journal of Arts and Commerce, 1 (7), 1-14.
Mwiria K., Ng’ethe N., Ngome C., Ouma, D., Wawire, V. & Wesonga, D. (2007).
Public and private universities in Kenya: New challenges, issues and
achievements. Nairobi: East African publishers.
Nachamias, D., & Nachamias, C. F. (2009). Research Methods in the sciences (5th
Ed.). London: Hodder Education.
Nafei, W. (2014). Do job rotation and role stress affect job attitudes? A study from
Egyptian context. American International Journal of Science, 3 (1), 1-15.
Nassazi, A. (2013). Effects of Training on Employee Performance. Evidence
fromUganda. International Business Journal, 7 (56) No. 99-103.
Ngethe, J., Iravo, A. M., & Namusonge, G. (2012). Determinants of Academic Staff
Retention in Public Univerisites in Kenya. International journal of
Humanities and Social Science, 2 (13), 205-211.

152
Ngo, Y., Turban, D., Lau, M. & Lui, S. (2010). Human resource practices of firm
performance of multinational corporations: Influences of country of origin.
International Journal of Human Resource Management, 9 (4), 632-652.
Nifla, C. (2005). Trining Needs Assesment for Bachibanga Company in Botswana.
Wisconsin University Graduate School. Msc Research Paper in Training and
Development. Wisconsin: University of Wisconsin-Strout Menomonie.
Njiru, P. N., & Iravo, M. A. (2013). The Role of Training in Developing Staff
Performance in GTI in Embu West District. Jome Kenyatta University of
Science and Technology (Masters Dissertation). Nairobi: Jomo Kenyatta
University of Science and Technology.
Noe, R. A. (2010). Employee Training and Development (5th Ed.). Singapore:
McGraw Hill.
Nyakundi, A., Karanja, K., Charles, M., & Bosibori, N. (2012). Enhancing the Role
of Employee Recognition towards improving Performance. International
Journal of Arts and Commerce, 1 (7), 95-108.
Nyongesa, W., W, B., Nyamanga, E. A., & Syanda, P. (2014). Accessing the extent
to Which Staff Training Needs are implemented at the Kenya Polytechnic
University College. Journal of Education and Practice, 5 (28), 212-231.
Oates, B. J. (2010). Researching Information Systems and Computing. Sage
publication.
Obama, B. (2006).The Audacity of Hope: Thoughts on Reclaiming the American
Dream. New York: Crown Publishing Group.
Obisi, C. (2011). Employee Training and Development in Nigerian Organizations:
Some Observations and Agenda for Research. Australian Journal of Business
and Management Research, 1 (9), 82- 91.
Obwogi, J. (2011). Factors that Affect Quality of Teaching Staff in Universities in
Kenya. Jomo Kenyatta University of Agriculture, Science & Technology
(PhD Thesis). Nairobi: Jomo Kenyatta University of Agriculture, Science and
Technology.
Odhiambo, G. (2011). Higher education quality in Kenya: a critical reflection of key
challenges. Sydney: Australia Publishers.
Odhiambo, G., & Waiganjo, E. (2014). Role of Human Capital Management
Strategies on Employee Mobility in Kenya's Public Universities: A Case
Study of Jomo Kenyatta University of Agriculture, Science and Technology.
International Journal of Business and Social Sciences, 5 (6), 185-189.
Odhon’g, E. (2015). Effect of human capital investment on organizational
performance of pharmaceutical companies in Kenya. Global Journal of
Human Resource Management, 3 (6), 1-29.

153
Odinga, M. (2010). Staff Development Programs and Job Performance of Lecturers
of Moi University. Makerere Univeristy (MA Dissertation). Kampala:
Makerere University.
Ogunade, A. O. (2011). Human Capital Investment in the Developing World: An
Analysis of Praxis. Schmidt Labour Research Center Seminar Series.
Ohman, P., & Svanberg, J. (2013). Auditors time Pressure: Does Ethical Culture
Support Audit Quality. Managerial Auditing Journal, 28 (7), 572-579.
O'Leary, M. C., & Steward, J. (2007). Governance Factors Affecting Internal
Auditors ethical decision making. An Exploratory Study. Managerial
Auditing Journal, 22 (8), 787-808.
Ololube, N. (2006). Teachers Job Satisfaction and Motivation for School
Effectiveness: An Assesment. University of Helsinki. Helsinki: University of
Helsinki.
Omolo, J. (2014). Employment Challenges in Kenya. African Journal of Economic
Review, 1 (1), 18-32.
Ongalo, E., & Tari, J. (2015). Effect of Employee Motivation Strategies on
Organizational Performance: A Case of Electricity Generating and
Distribution Firms in Kenya. European Journal of Business and
Management, 7 (1), 55-65.
Ongori, H., & Nzonzo, C. (2011). Training and Development Practices in an
Organization: An Intervention to enhance Organziational effectiveness.
International Journal of Engineering and Management Science, 2 (4), 187-
198.
Onyancha, N., Munene, E., & Muturi, M. (2014) Effect of Remuneration on
employees performance in the ministry of internal Security: A case of Kisii
county. Interna tional journal of human resource studies, 4 (1), 223-231.
Opu, S. (2008). Motivation and Work Performance: Complexities in Achieving Good
Performance Outcomes: A Study Focusing on Motivation Measures and
Improving Workers Performance in Kitgum District Local Government:
Uganda. Erasmus University (MA Research Paper in Human Resource and
Empowerment. Erasmus: Erasmus University.
Osabiya, B. (2015). The effect of employee’s motivation on organizational
performance. Journal of Public Administration and Policy Research, 7 (4),
62-57.
Osman, I., Theresa C., & Maria, G. (2011). The relationship between human
resource practices and firm performance: An empirical assessment of firms in
Malaysia. Bus. Strat. Series, 12 (1), 41-48.

154
Osoro, G. (2016). Value of training on motivation among health workers in Narok
County, Kenya. Pan African Medical Journal, 5 (1), 1937-8688.
Oxford advanced learners dictionary, 6th edition
Paul, A., & Anantharaman, R. (2003) Impact of people management practice on
organizational performance. International Journal of Human Resource
Management, 14 (1), 1246-1266.
Paula, E. (2015). Gender Inequality in Labour Markets: The Role of Motherhood and
Segregation. Oxford Journals: Social Politics, 12 (2), 264-288.
Pavlov, L. (2014). Conditioned Reflexes. London: Oxford University Press.
Pheko, E. (2008). Secondary School Leadership in Botswana: Implications for
Effective Training. Educational Management Administration and Leadership
Journal, 38 (1), 71-84.
Phelan, A., & Zhianglin, P. (2001). Promotion systems and organizational
performance: A contingency model. Netherland: Kluwer Academic Publisher.
Porter, M. E. (2006). Strategy and Society : The Link between Competitve Advantage
and Corporate Social Responsibility, Havard Business Review Reynolds.
London:
Prowse, P., & Prowse, J. (2009). The dilemma of performance appraisal. Journal of
measuring Business Excellence, 13 (4), 69-77.
Rahaman, F., Khalil, J., Jumanani, N., Ajmal, M., Mark, S., & Sharif, M. (2011).
Impact of discussion method on student performance. International Journal
of Business and Social Science, 2 (7), 1-11.
Reena, A. (2009). The impact of reward and recognition programs on employees’
motivation and job satisfaction: An empirical study. International review of
Business Research papers, 5 (4), 270-279.
Republic of Kenya (2007). Kenya Vision 2030: A Globally Competitive and
Prosperous Kenya. Nairobi: Ministry of Planning and National Development
and National Economic and Social Council.
Richard, P. J., Devinney T. M., Yip, G. S., & Johnson, G. (2009). Measuring
performance: Towards methodological best practice. Journal of Management,
35 (3), 718-804.
Riechi, A., Oanda, I., & Jowe, J. (2013). University Expansion & Challenges to
social development in Kenya: Dilemmas and Pitfalls.Council for the
development of social science Research in Africa,10 (1), 49-71.
Robert, W. (2008). Knowledge Based Intelligent Information and Engineering
Systems: The Comparative Effectiveness of Web-Based and class Room

155
Instruction: A Meta Analysis. Journal of computers &education archive, 51
(3), 988-1006.
Roomi, M. A., & Harrison, P. (2009). Women-owned small and medium enterprises
in England: Analysis of factors influencing the growth process. Journal of
Small Business and Enterprise Development, 16 (1), 270-288.
Saunders, M., Lewis, P., & Thornhill, A. (2009). Research Methods for Business
Students. London: Pearson Education Limited.
Sayed, M. (2015). The Effect of Short Term Training Courses on Employee
Perfromance: A Case Study in Cement Factory in Iran. Journal of
Managment Research , 3 (2), 299-304.
Schiflett, S. G., Elliott, L. R., Salas, E., & Coovert, M. D. (2004). Scaled worlds:
Development, validation, and application. Surrey, England: Ashgate
Publishing Limited.
Seaton, G., Dell’Angelo, T., Spencer, M. B., & Youngblood, J. (2007). Moving
beyond the dichotomy: Meeting the needs of urban students through
contextually-relevant education practices. Teacher Education Quarterly, 34
(2), 163-183.
Seiler, S. (2010). What is the best Practice for Training in Density and Duration
Distribution in Endurance Athletes. International Journal of Sports,
Psychology and Perfromance, 2 (6), 1-16.
Sekaran, U., & Bougie, R. (2009). Research Methods for Business -A Skill Building
Approach (5th Ed.). Hobouken, NJ: John Wiley & Sons Limited.
Shah, R., Hussain, A., Ali, A., Fayaz, A., & Jawad, H. (2014). Employees perception
and motivation towards training and development programmes in Health
sector of Pakistan: A case study of Khyber Pakhtunkwa. Research journal of
recent sciences, 3 (2), 1-7.
Sheffi, Y., & Caplice, C. (2012). Impact of Warehouse Managment System in a
Supply Chain. International Journal of Computer Applications, 54 (1), 14-20.
Shelton, K. (2001). The Effect of Employee Development Programs on Job
Satisfaction and Employee Retention. University of Wisconsin-Stout.
Wisconsin: Menomonie Press.
Sifuna, D. N. (1998). Public & Private Universities in Kenya: New Challenges,
Issues and Achievements. University of Nairobi. Nairobi: University of
Nairobi.
Sifuna, D. N. (2006). The Governance of Kenya Public Universities. Research in
Post Compulsory Education, 3 (2), 175-212.

156
Sila, K. (2014). Relationship between training and performance: a case study of
Kenya women finance trust Eastern Nyanza region, Kenya. European
Journal of Business and Social Sciences, 3 (1), 95-117.
Simiyu, A. N. (2012). Performance Contract as a Tool for Improving Performance
in Local Authorities in Kenya. PhD Thesis. Jomo Kenyatta University of
Agriculture and Technology.
Sims, R. (2006). Human Resource Development: Today and Tomorrow. Charlotte:
Information Age Publishers.
Skinner, B. (2014). Science and Human Behavior. London: Macmillan Press.
Sreekumar, A. (2009). Service quality evaluation in internet banking: An empirical
study in India. International journal of Indian culture and Business
Management, 2 (1), 30-43.
Stewart (2011). Horizontal inequalities: A Negleted Dimension of Development.
Working paper Number 81.
Stone, R. (2002). Human Resource Management (2nd Ed.). London: John Wiley &
Sons Press.
Summers, G. J. (2004). Today’s business simulation industry. Sage Journal, 35(1),
208- 241.
Susan, N. (2013). Capacity Building in the Public Service in Kenya: An Evaluation
of the Senior Management Course. International Review of Management and
Business Journal, 2 (4), 5-15.
Svinicki, M., & McKeachie, W. J. (2011). Teaching tips: Strategies research, and
theory for college and university teachers (13th Ed.). Belmont, CA:
Wadsworth, Cengage.
Swanson, R. A. (2001). Human Resource Development and its Underlying Theory.
Human Resource International Journal, 4 (3), 299-312.
Swart, J., Mann, C., Brown, S., & Price, A. (2005). Human Resource Development:
Strategy and Tactics. Oxford: Elsevier Butterworth-Heinemann Publications.
Szewezak, A., & Synodgrass., G. (2002). Managing the human side of information
Technology:challenges and solutions, Idea Group publishing. The
information Society journal, 1 (20), 151-152.
Tagero, N., Komela, V., & Michael, M. (2012). Relationship Between on the Job
Training and Employee Performance in Courier Companies in Dar-es-salam.
International Journal of Humanities and Social Science, 1 (22), 1-14.
Tai, T. (2006). Effects of Training Framing, General Self-efficacy and Training
Motivation on Trainees’ Training Effectiveness. Massachusetts: Emerald
Group Publishers.

157
Tao, C., & Bucy, P. (2007). The mediated moderation model of interactivity.Media
psychology 1 (9), 647-672. Lawrence Erlbaum Associates,Inc.
Tracey, J. B., Hinkin, R., Tran, B., Emigh, T., Kingra, M., Taylor, J., & Thorek, D.
(2015). A field study of new employee training programs: Industry practices
and strategic insights. Cornell Hospitality Quarterly, 56 (4), 345-354.
Truit, D. (2011). The Effect of Training and Development on employee Attitiude as it
Relates to Training and Work. Salisbury university. Salisbury: Sage Press.
Tsai, P., Yen, C., Huang, L., & Huang, I. (2007). A study on motivating employee’s
learning commitment in post-downsizing era: Job Satisfaction Perspective.
Journal of World Business, 42 (2), 157-169
Tukunimulongo, J. (2016). Effect of on the job training on employee performance in
Kenya. International Journal of Recent Research in Commerce Economics
and Management, 3 (1), 7-24.
W.W.W. Womac company.com. Downloaded on 20/01/2016.
Waigango, E. W., Mukulu, E. R., & Kahiri, J. Relationship between strategic human
resource and firm performance of Kenya’s corporate organizations.
International Journal of Humanities and Social Sciences, 2 (10), 62-70.
Wairimu, N., Gachunga, H., & Mumbo, H. (2013). Impact of Employee
Development Programs on Organizational Commitment in the Public
Universities. International Journal of Human Resource and Procurement, 1
(5), 1-14.
Walker, G. H., (2003). Lecturing with style. Chattanooga: The University of
Tennessee
Washbush, J., & Gosen, J. (2001). An exploration of game-derived learning in total
enterprise simulations. Sage Journals, 32 (2), 281-296.
Weil, A., & Woodall, J. (2005). HRD in France: the corporate perspective. Journal
of European Industrial Training, 29 (7), 529–540.
Wenger, E. (2006). Social Learning and Publicity. Lessons from an Energy Village
Energy Policy Journal, 1 (2), 129-137.
Weston, J. (2002). Room to Learn: Training in the Boardroom. Journal of Chatered
Secretaries, 19 (3), 19-20.
Wilson, & Western, S. (2001). Perfomance Apprisal: An obstacle to Trainning and
development? Career Development. International Jounal of European
Indurstrial Trainning, 6 (2), 93- 100.
Zimeras,S. Reklitis,P. Plastis,C.(2014) Relationship between job satisfaction and job
performance in health services. International conference on strategic
innovative marketing 1 (175), 480-487–Madrid, Spain.

158
APPENDIX 1: LETTER OF INTRODUCTION
JKU/HD412-0624/2010
Khakayi Scholastica Wamwayi
P.O Box 62000-00200,
Nairobi.
TO WHOM IT MAY CONCERN
Dear Sir/Madam,
RE: DATA COLLECTION
I am Scholastica Khakayi Wamwayi. REG NO: HD412-0624/2010 PhD student at
JKUAT. I am kindly requesting for your cooperation to obtain data and information
from you, within the scope of the study.
The title of the research is: Role of training in the performance of non –teaching
employees at management level in public universities in Kenya.
Please note that information obtained will be confidential, and only serve for
research purposes.
I appreciate your assistance and co-operation.
Yours Faithfully
Scholastica Khakayi W.

159
APPENDIX 2 SURVEY QUESTIONNAIRE
This questionnaire has been designed to gather information on the role of training in
the performance of non-teaching employees in management level in grades 13 to 15
in public universities. The findings will help to enhance effectiveness of training in
the university.
Kindly respond by placing a tick in the appropriate box depending on how you view
the situation. Please do not write your name nor identify yourself as that is not part of
the research.
SECTION I: PERSONAL INFORMATION
1. Age
20 -30
31-40
41-50
51-60
51-60
Over 61
2. Gender
Male is
Female

160
3. What level of education have you attained to date?
Degree
Masters
PhD
Other ------------------------
4. Please indicate your department.
Administration
Library
Estates
Transport
Hostels
Research
Academic division
Other -----------------------------
5. Indicate your job group
Grade 13
Grade 14
Grade 15

161
6. State the number of years you have worked at the university
5-10 Years
11-20 Years
21-30 Years
Above 30 Years
7. State the number of trainings you have undergone.
One
Two
More than two
Tick as appropriate:
8 a) What type of training is imparted to employees that help them to settle quickly
in the university?
Induction training
Technical training
Management training
Skill presentation
Other (Specify)---------------------------------------------
b). How frequent have you benefited from the long duration courses you were
exposed to, by the university
Very frequent
Frequent
Not at all

162
c). How long did the training take?
Over Two weeks
One month
One year
Over one year
9. General complaints raised by non-teaching employees about training sessions
include:
Time of the employee having been taken away
Too frequent breaks between training sessions
Training sessions seem unplanned
Training sessions being mostly boring
10. Explain how many times you benefitted from the short courses which you
attended.
Once
Twice
More than twice
11. How long did the short term training you attended take?
One week
One month
More than a month

163
12. How many promotions have you attained after training sessions?
One
Two
Three
None of the above
13. The training I underwent created an impact on my Performance
To a small extent
To great extent
Not at all
14. How has e-learning benefitted you in the execution of your daily duties?
Made work easier
Helps in making presentations at meetings
Helped me to acquire more knowledge by use of
E-conferencing
Has not helped me at all

164
15. How has the current leadership helped in the improvement of your work?
Enhanced approval and attending of trainings
Provided finances for training away from work
Has provided finances for in-house training
Has not helped me at all

165
SECTION II (A): INFORMATION ON INFLUENCE OF TRAINING ON THE
PERFORMANCE OF NON-TEACHING EMPLOYEES AT MANAGEMENT
LEVEL IN SELECTED PUBLIC UNIVERSITIES IN KENYA.
1. Training Needs Assessment
Training needs assessment refers to a process of identifying performance
requirements and the knowledge, skills, and abilities needed by an organization’s
workforce to achieve the requirements (Nyongesa,et al. 2014).TNA is a systematic
process for determining and addressing needs or ‘gaps’ between current conditions
and desired conditions or ‘wants’. The discrepancy must be measured to identify the
need, which may be a desire to improve current performance or to correct a
deficiency (Wikipedia).
Appropriately tick the extent to which you agree or disagree on the following
TNA statements where:
5 Strongly Agree 4 Agree 3 Not sure 2 Disagree 1 Strongly Disagree
5
Strongly
Agree
4
Agree
3
Not-
Sure
2
Disagree
1
Strongly
Dis-
Agree
I was assessed by administration on
Training needs assessment before
undertaking training.
Training needs assessment was
conducted before my acquisition of
new skills
Training needs assessment has
helped to improve my use of New
Technology

166
Training needs assessment enabled
me to undergo courses which
enhanced Legislation, and policies
that are introduced by Government
Training needs assessment helped
me to gain higher standards in
performance
Training needs assessment enabled
me to identify new jobs opportunities
State the best methods used in identification of employees Training needs in the
university------------------------------------------------------------------------------------------
------------------------------------------------------------------------------------------------------
------------------------------------------------------------------------------------------------------
------------------------------------------------------------------------------------------------------
------------------------------------------------------------------------------------------------------
--------------------------------------------------------------------------------------------
Suggest ways in which feedback from Training needs assessments should be
submitted to employees ------------------------------------------------------------------------
------------------------------------------------------------------------------------------------------
------------------------------------------------------------------------------------------------------
------------------------------------------------------------------------------------------------------
------------------------------------------------------------------------------------------------------
------------------------------------------------------------------------------------------------------
----------------------------
2. Mode of Training
Mode of training refers to a particular type, or technique of training (Hornby, 2002).
Appropriately tick the extent to which you agree or disagree on the following
Mode of training statements where:
5 Strongly Agree 4 Agree 3 Not sure 2 Disagree 1 Strongly Disagree

167
5
Strongly
Agree
4
Agree
3
Not
Sure
2
Disagree
1
Strongly
Dis-
Agree
I have gained a lot of knowledge
after attending on the job training
On the job training has improved
my performance skills at the
university
Job Rotation has helped me to master
operations in most of the divisions
in the university
Apprenticeship is a better method of
transfer of skills and knowledge to
employees
I undertake bigger quantity and
quality of work as a result of
Computer based knowledge that I
acquired
Knowledge acquired during training
by lecture method helps improve my
work performance
The lecture notes obtained during
training have helped me in terms of
reference material in the course of
executing my duties.
I concentrate better during training

168
offered away from the university
premises
I enjoy comfort at work place after
induction training at the university
Management trainings that I attended
have benefitted me in the course of
performing my duties
Suggest ways in which Computer Based learning can be of benefit to Human
Resource functions of the university----------------------------------------------------------
------------------------------------------------------------------------------------------------------
------------------------------------------------------------------------------------------------------
------------------------------------------------------------------------------------------------------
-----------------------------------------------------------------------
State other HRM strategies that the university could employ to enhance work
performance---------------------------------------------------------------------------------------
------------------------------------------------------------------------------------------------------
------------------------------------------------------------------------------------------------------
------------------------------------------------------------------------------------------------------
----------------------------------------------------------------------------------
3. Training Duration
Training duration refers to the length of time that training lasts or continues (Horn
by, 2002).

169
Appropriately tick the extent to which you agree or disagree on the following
Training duration statements where:
5 Strongly Agree 4 Agree 3 Not Sure 2 Disagree 1 Strongly Disagree
5
Strongly
Agree
4
Agree
3
Not
Sure
2
Disagree
1
Strongly
Dis-
Agree
I appreciate long duration Programs
which have enabled me to higher
degrees.
Long duration trainings attended
enhanced my work performance
The one week workshops sponsored
by the university have improved my
knowledge and skills.
Seminars held within and outside the
university for three to four weeks
improve my knowledge and
performance.
The conferences I attended for six
months have boosted my knowledge
Suggest how best the University Management and HR Department could benefit
from long duration courses----------------------------------------------------------------------
------------------------------------------------------------------------------------------------------
------------------------------------------------------------------------------------------------------

170
------------------------------------------------------------------------------------------------------
------------------------------------------------------------------------
In your view, suggest whether Conferences and workshops attended by senior
management non-teaching employees are beneficial --------------------------------------
------------------------------------------------------------------------------------------------------
------------------------------------------------------------------------------------------------------
------------------------------------------------------------------------------------------------------
------------------------------------------------------------------------------------------------------
------------------------------------------------------------------------------------------------
4. Training Feedback
Training feedback refers to information that employees receive while they are
performing how well they are meeting objectives (Noe, 2010).
Appropriately tick the extent to which you agree or disagree on the following
Training feedback statements where:
5 Strongly Agree 4 Agree 3 Not sure 2 Disagree 1 Strongly Disagree
5
Strongly
Agree
4
Agree
3
Not
Sure
2
Disagree
1
Strongly
Dis-
Agree
Performance Appraisal practiced at
the university helped identify areas
to improve my skills
I always get Feedback immediately
after training
My participation in management
decision making has improved my

171
performance
I always accomplish targets set by
the university
I am usually accorded adequate time
to reflect and understand whatever I
learn.
Training policy has greatly helped
me to undergo various trainings in
the university
I am usually evaluated in relation to
the knowledge, skills and
competence acquired after training.
I enjoy using up to date materials
during training
State whether training acquired prepared you adequately for more challenging
duties-----------------------------------------------------------------------------------------------
------------------------------------------------------------------------------------------------------
------------------------------------------------------------------------------------------------------
------------------------------------------------------------------------------------------------------
---------------------------------------------------------------------------------
State whether you are comfortable and satisfied with your current job ------------------
------------------------------------------------------------------------------------------------------
------------------------------------------------------------------------------------------------------
------------------------------------------------------------------------------------------------------
-----------------------------------------------------------If you are not satisfied, suggest the
best ways the University could employ to make the situation satisfying-----------------
------------------------------------------------------------------------------------------------------
------------------------------------------------------------------------------------------------------
172
------------------------------------------------------------------------------------------------------
------------------------------------------------------------------------------------------------------
-------------------------------
5. Motivation
Motivation refers to strength and direction in behavior and the factors that influence
people to behave in certain ways. It can also refer to goals that individuals have and
how individuals choose their goals, and ways in which others try to influence their
behavior (Armstrong,2009).
Appropriately tick the extent to which you agree or disagree on the following
motivation statements where:
5 Strongly Agree 4 Agree 3 Not sure 2 Disagree 1 Strongly Disagree
5
Strongly
Agree
4
Agree
3
Not
Sure
2
Disagree
1
Strongly
Dis-
Agree
a) Financial sub variable
I appreciate promotions I attained
after training sessions as they helped
me improve my work performance.
Training has led to better
remuneration which has given me
impetus to work hard and achieve
both organizational and personal
goals
Having trained on university
scholarship has encouraged me to

173
work hard.
After attending training, my salary
improved, thus making me more
interested to work hard for the
university.
b) Non-financial sub
variable
After undertaking training, non-
teaching employees are given higher
responsibilities, leadership which
motivates them to perform better.
Recognition in terms of compliments
and certificates are accorded to
employees on successful completion
of training.
Employees experience general
personal advancement, development
and are more confident in performing
their duties
State whether the criteria of promotion is adhered to at the university. ------------------
------------------------------------------------------------------------------------------------------
------------------------------------------------------------------------------------------------------
------------------------------------------------------------------------------------------------------
-------------------------------------------------------------------------------
What other problems are experienced in relation to promotions at the university?-----
------------------------------------------------------------------------------------------------------
------------------------------------------------------------------------------------------------------

174
------------------------------------------------------------------------------------------------------
------------------------------------------------------------------------------------------------------
---------------------------------------------------------------------------------------------------
Do you think training can lead to improvement and betterment of the employee?-----
------------------------------------------------------------------------------------------------------
------------------------------------------------------------------------------------------------------
------------------------------------------------------------------------------------------------------
------------------------------------------------------------------------------------------------------
---------------------------------------------------------------------------------------------------
1. Performance of Non-Teaching Staff
Refers to how well employees perform on the job and assignments given to them
against the accepted performance standards set by the organization (Appiah, 2010)
Carefully think about the following statements and appropriately tick the extent
to which you agree or disagree using the key provided

175
5 Strongly Agree 4 Agree 3 Not sure 2 Disagree 1 Strongly Disagree
5
Strongly
Agree
4
Agree
3
Not
Sure
2
Disagree
1
Strongly
Dis-
Agree
I enjoy exceeding given work targets
which lead to surplus from which I
benefit in terms of bonus.
I enjoy working at the university
because the university promotes
teamwork which translates into
higher productivity.
I endeavor to meet university goals
when possible.
I adhere to university policies all the
time.
Suggest various ways in which the university H/R can improve training to enhance
non-teaching employee work performance.---------------------------------------------------
------------------------------------------------------------------------------------------------------
------------------------------------------------------------------------------------------------------
---------------------------------------------------------------------------
Suggest possible ways in which top management at university can improve employee
performance---------------------------------------------------------------------------------------
------------------------------------------------------------------------------------------------------
------------------------------------------------------------------------------------------------------
-----------------------------------------------------------------------------

176
APPENDIX 4 SUPERVISOR’S INTERVIEW GUIDE
1) a). How does the university conduct Training needs assessment for non- teaching
employees in the university
b). How do you identify gaps in terms of employee skills?
c). How does the university identify employees with gaps and require acquisition
of more knowledge?
2) a). Are non-teaching employees assessed to ascertain whether they are able to
transfer the learning situation to the working situation?
b). Are non-teaching employees subjected to job rotation and why?
c). Does the university use apprenticeship training methods for non-teaching
employees.
d). Do employees with Computer Based Knowledge give better output at work?
3) a). After non-teaching employees attend long-term training? Do they perform
their duties utmost? And who sponsors such trainings?
b). Does the university offer development programs for non-teaching employees?
4) a). Does the university appraise no-teaching employees after the training?
b). What other methods does the university use to get feedback from non-
teaching employees?
5) a). What kind of financial incentives does the university extend to non-teaching
employees
b). What kind of non-financial incentives does the university give to non-
teaching employees
6) a). Does the university encourage teamwork among the non-teaching employees?
b). Does the university adhere to training policy for non-teaching employees?
c). Does the university encourage non-teaching employees to accomplish set
targets and meet the goals of the university?

177
APPENDIX 4 LIST OF PUBLIC UNIVERSITIES IN KENYA
Name of University Location
1. Chuka Chuka
2. DedanKimathi university of technology Nyeri
3. Egerton University Njoro
4. JaramongiOgingaOdinga University of science and technology Bondo
5. Jomo Kenyatta university of agriculture and technology Nairobi
6. Karatina university Karatina
7. Kenyatta university Nairobi
8. Kisii university Kisii
9. Laikipia university Nyahururu
10. Maasai Mara university Narok
11. Maseno university Maseno
12. MasindeMuliro university of Science and Technology Kakamega
13. Meru university of Science and technology Meru
14. Moi university Eldoret
15. Multimedia university Nairobi
16. Pwani university Kilifi
17. South Eastern Kenya university Kitui
18. Technical university of Kenya Nairobi
19. Technical university of Mombasa Mombasa
20. University of Eldoret Eldoret
21. University of Kabianga Kericho
22. University of Nairobi Nairobi
Source: Commissions for University Education (2014)