influential vectors in fuel consumption by an urban bus operator
TRANSCRIPT
1/26 January 9, 2015 - Portland State University - Portland
Influential vectors in fuel consumption by an urban
bus operator
João de Abreu e Silva
CESUR/DECivil - Instituto Superior Técnico, University of Lisbon,
Portugal

2/26 January 9, 2015 - Portland State University - Portland
FUEL CONSUMPTION IN BUS
OPERATION
3/26 January 9, 2015 - Portland State University - Portland
Introduction
• Transportation role in energy use and GHG emissions has been
growing in the last decade, being responsible for 23% of all world
energy consumption
• In the case of bus companies, fuel consumption represents a very
large proportion of their budgets
• Optimizing resources, ranging from vehicles to drivers, is one of the
main concerns of a bus operator in order to reduce fuel
consumption

4/26 January 9, 2015 - Portland State University - Portland
Literature review (I)
• Vehicle type, physical and operational characteristics of lines, driving
behavior and company policies (training courses) are the main
parameters to be explored in the study of fuel consumption patterns
• Many initiatives are taken on the vehicle side - improving the
performance of powertrains and transmission systems
• Bus maintenance is also relevant. Major maintenances could result
in significant fuel economies
• Training actions have proven to be effective to some extent, although
their effect decreases with time

5/26 January 9, 2015 - Portland State University - Portland
Literature review (II)
• More systemic approaches include all vectors of fuel efficiency in the
same analysis. These parameters were organized into four
categories:
1. energy efficiency of the bus - vehicle weight and road grade
2. driving cycle of the bus operation - speed, frequency of stops and
idle time
3. traffic environment - volume to capacity ratios as well as road
surface conditions
4. bus use - mainly a load factor

6/26 January 9, 2015 - Portland State University - Portland
Literature review (III)
• Ang and Fwa (1989) found routes and vehicle types as the most
significant influences on fuel efficiency, followed by average speed
and loaded weight. Driver behavior and scheduled times also
accounted for variations on fuel efficiency, although to a lesser extent
• Frey et al. (2007) found that speed, acceleration and road grade
were able to largely explain the variability of fuel consumption
• Delgado et al. (2011) found that average speed, average positive
acceleration, and average distance between stops, as being the most
adequate parameters to predict fuel consumption
7/26 January 9, 2015 - Portland State University - Portland
THE CASE STUDY
8/26 January 9, 2015 - Portland State University - Portland
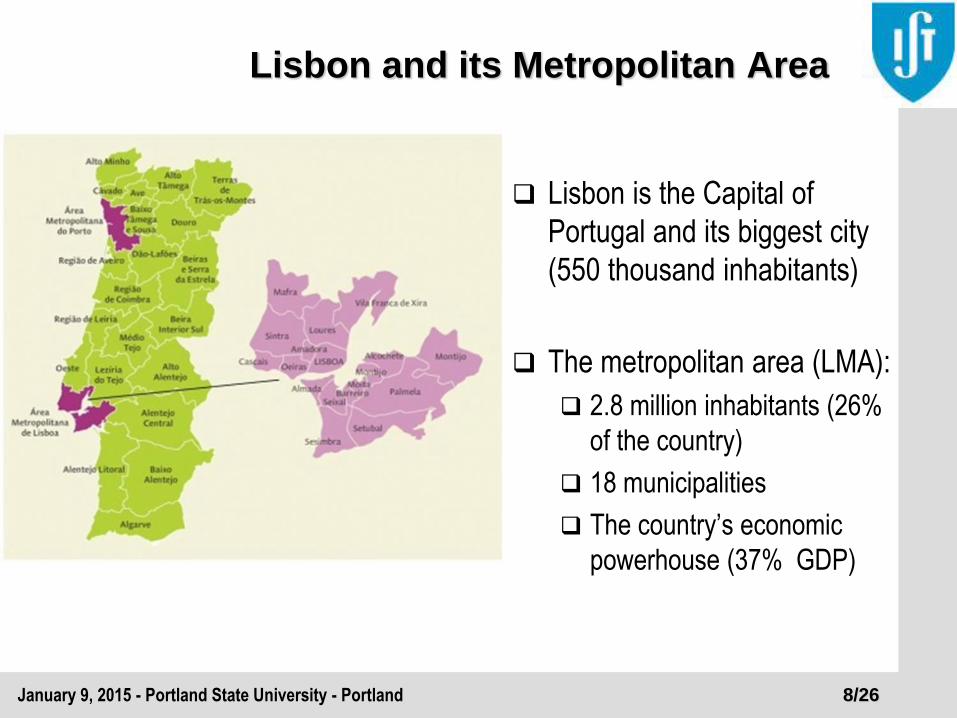
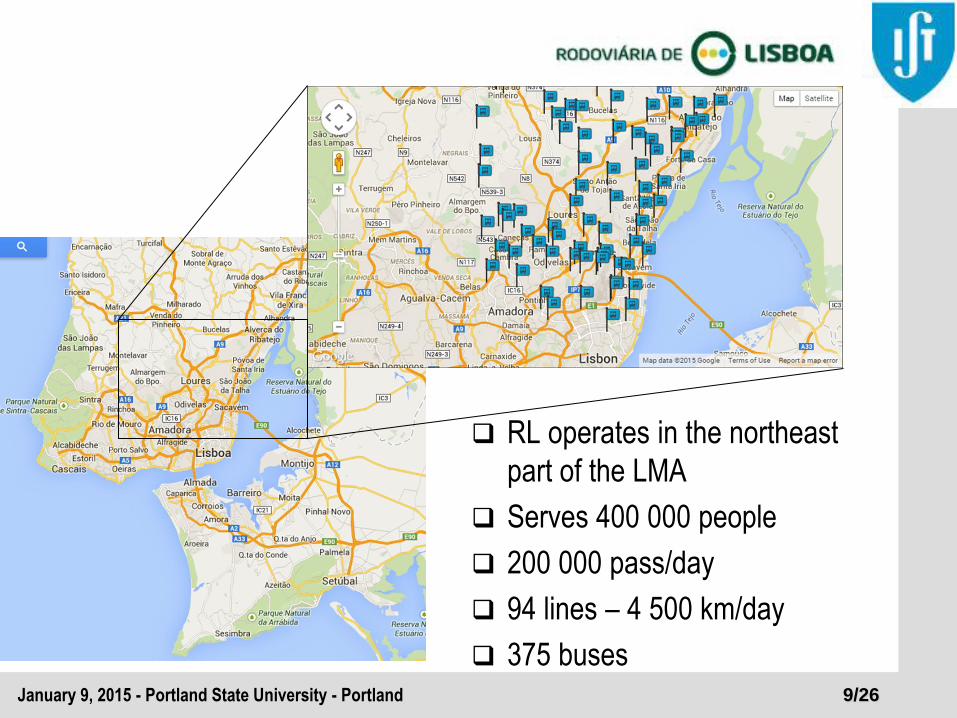
Lisbon and its Metropolitan Area
Lisbon is the Capital of
Portugal and its biggest city
(550 thousand inhabitants)
The metropolitan area (LMA):
2.8 million inhabitants (26%
of the country)
18 municipalities
The country’s economic
powerhouse (37% GDP)
9/26 January 9, 2015 - Portland State University - Portland
RL operates in the northeast
part of the LMA
Serves 400 000 people
200 000 pass/day
94 lines – 4 500 km/day
375 buses
10/26 January 9, 2015 - Portland State University - Portland
• Average age of the vehicles is 14,8 years old, all powered with diesel
• Since 2004, the GISFrot fleet management program was implemented
in Rodoviária de Lisboa
• GISFrot aims to optimize fuel consumption in the company, by
comparing the performance of drivers based on a rate of driving
events occurrence
• These results are used to support an eco-driving training program,
resulting in an overall reduction of 2.5% of global fuel consumption

11/26 January 9, 2015 - Portland State University - Portland
GISFrot and drivers’ performance
Source: Rodoviária de Lisboa, 2014
12/26 January 9, 2015 - Portland State University - Portland
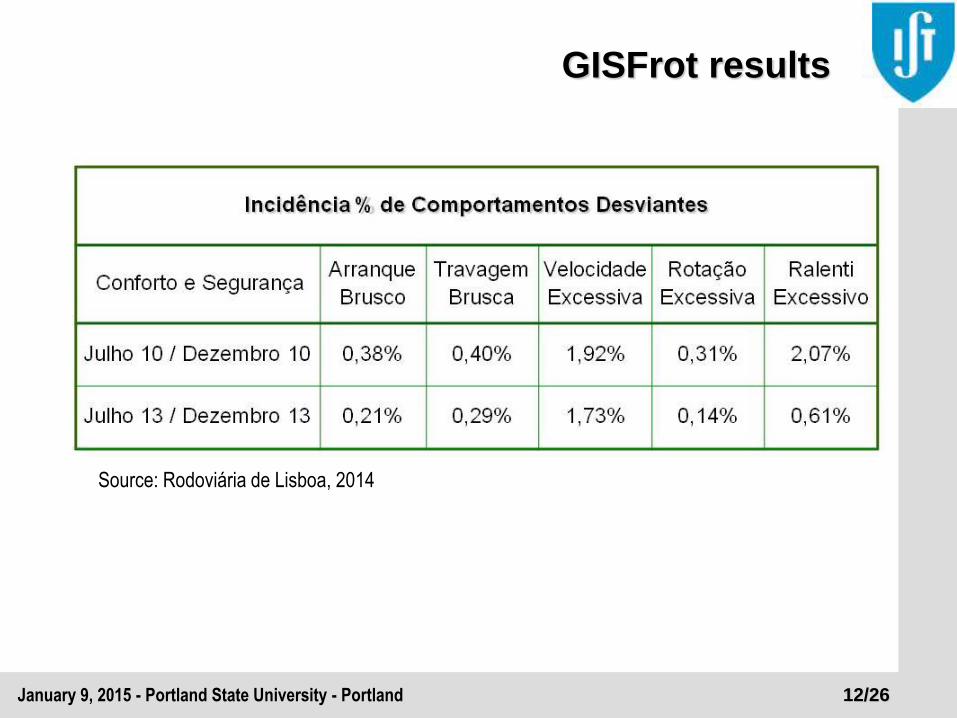
GISFrot results
Source: Rodoviária de Lisboa, 2014
13/26 January 9, 2015 - Portland State University - Portland
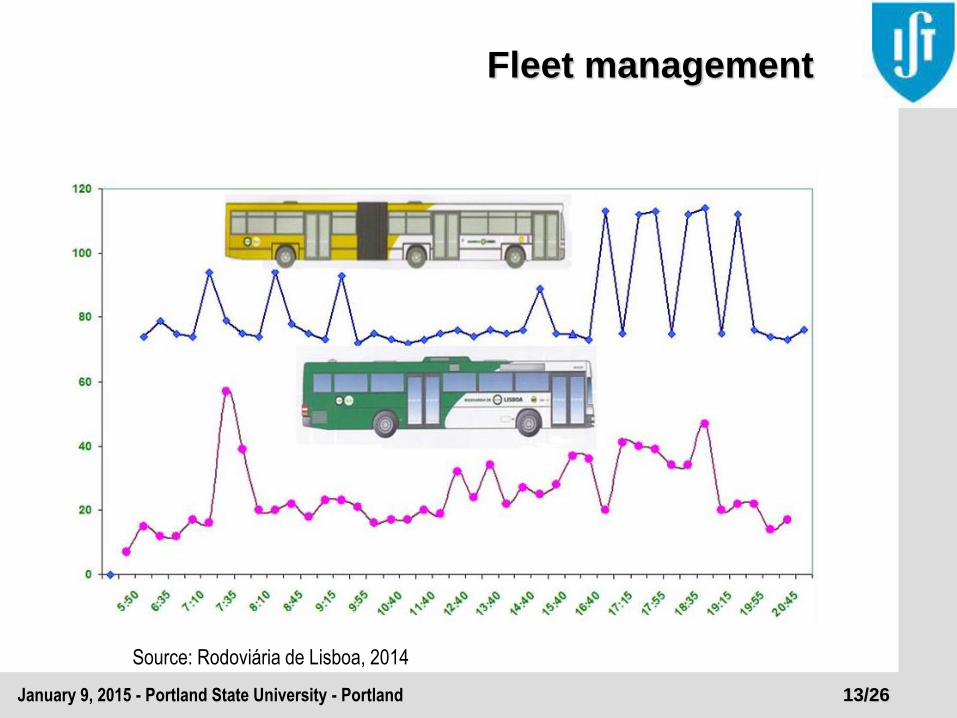
Fleet management
Source: Rodoviária de Lisboa, 2014
14/26 January 9, 2015 - Portland State University - Portland
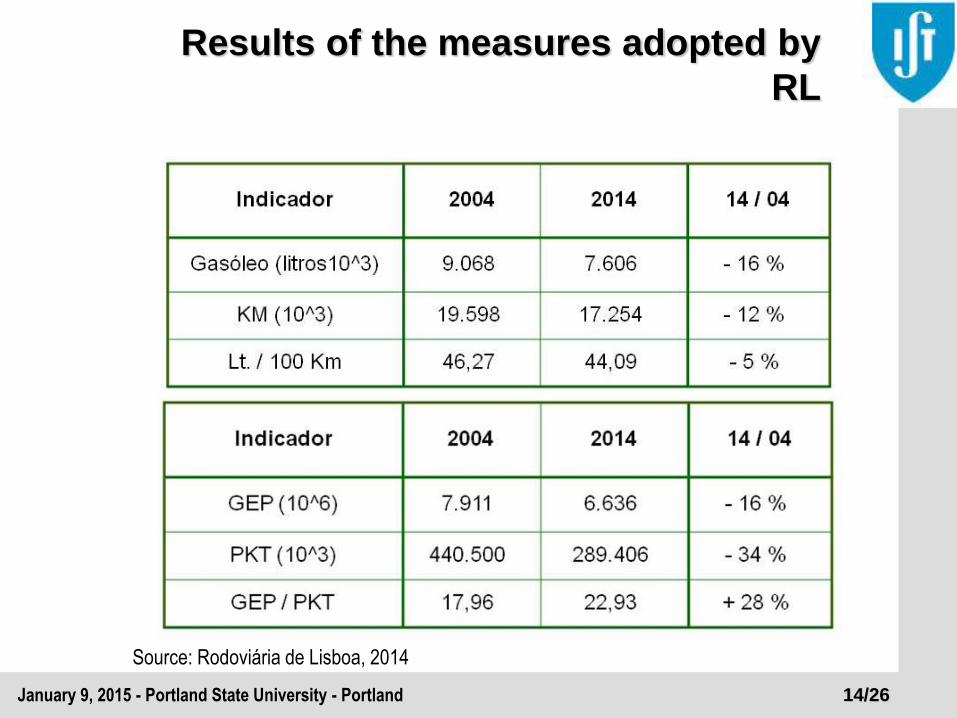
Results of the measures adopted by
RL
Source: Rodoviária de Lisboa, 2014

15/26 January 9, 2015 - Portland State University - Portland
Data Collection
• The data was collected with an on-board data logger for a significant
set of routes, over two periods:
October and November 2009, and March 2010 (model estimation)
May and September 2010 (model validation)
• Caveats
The daily fuel consumption registry (based on checking the amount of
fuel required to completely fill the vehicle’s tank), could produce errors.
Unrealistic values were deleted from the dataset
Grade intervals were created regardless of route directions
Vehicle sample was limited to those equipped with on-board data
loggers
There was no data available about transported passengers

16/26 January 9, 2015 - Portland State University - Portland
Variables • NTraining – Average number of eco-driving training sessions per driver
• ComSpeed – Average commercial speed
• VehicMini – Percentage of routes made with mini vehicles
• VehicMidi – Percentage of routes made with midi vehicles
• VehicStand – Percentage of routes made with standard vehicles
• VehicArtic – Percentage of routes made with articulated vehicles
• (5%_slope)2 – Square of the percentage of routes with more than 5%
slope
• AvrLength – Average length of routes
• log(ComSpeed) – Logarithm of average commercial speed
• log(MaxDistStops) – Logarithm of maximum distance between stops
• log(DriversAge) – Logarithm of average age of drivers
• log(VehicMass) – Logarithm of vehicle mass
• Ev1040 – Percentage of loading air with excessive rotation, among
all events registered (coded as event 1040)
• Ev1007 – Percentage of abrupt longitudinal decelerations, among
all events registered (coded as event 1007)
• Ev1067 – Percentage of engine rotation above maximum value,
among all events registered (coded as event 1067)
17/26 January 9, 2015 - Portland State University - Portland
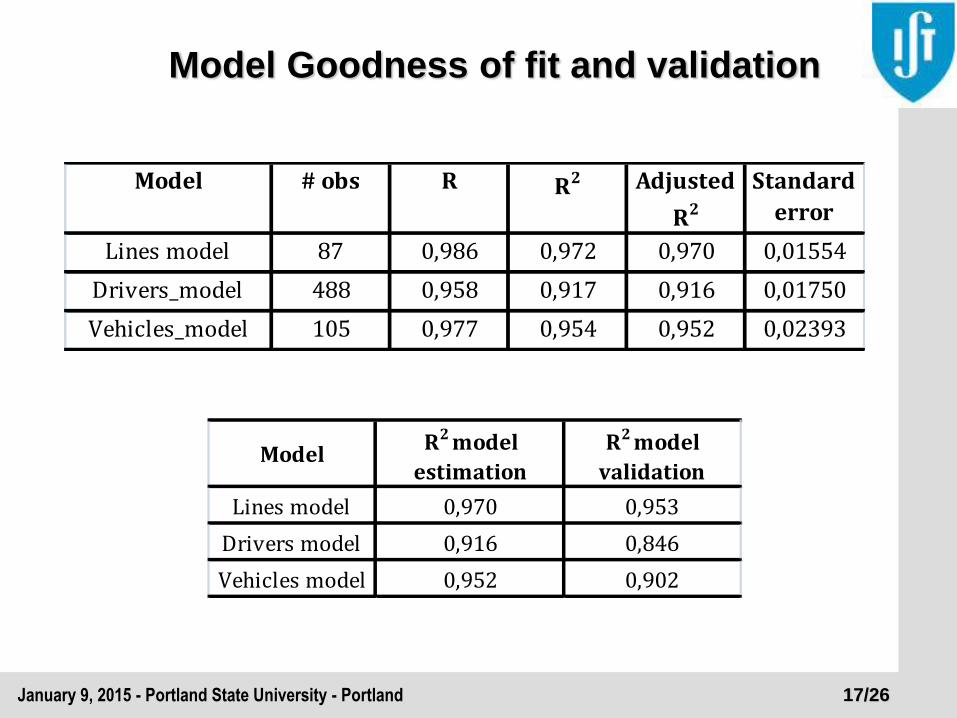
Model Goodness of fit and validation
Model # obs R R2 Adjusted
R2
Standard
error
Lines model 87 0,986 0,972 0,970 0,01554
Drivers_model 488 0,958 0,917 0,916 0,01750
Vehicles_model 105 0,977 0,954 0,952 0,02393
ModelR2 model
estimation
R2 model
validation
Lines model 0,970 0,953
Drivers model 0,916 0,846
Vehicles model 0,952 0,902
18/26 January 9, 2015 - Portland State University - Portland
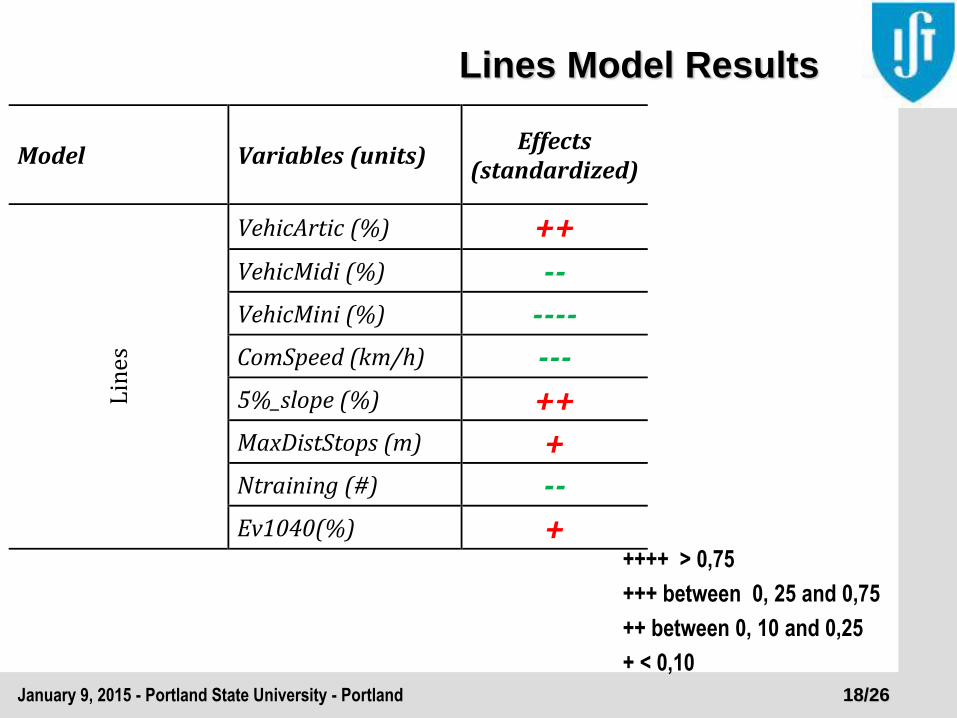
Lines Model Results
Model Variables (units) Effects
(standardized)
Lin
es
VehicArtic (%) ++ VehicMidi (%) -- VehicMini (%) ---- ComSpeed (km/h) --- 5%_slope (%) ++ MaxDistStops (m) + Ntraining (#) -- Ev1040(%) +
++++ > 0,75
+++ between 0, 25 and 0,75
++ between 0, 10 and 0,25
+ < 0,10
19/26 January 9, 2015 - Portland State University - Portland
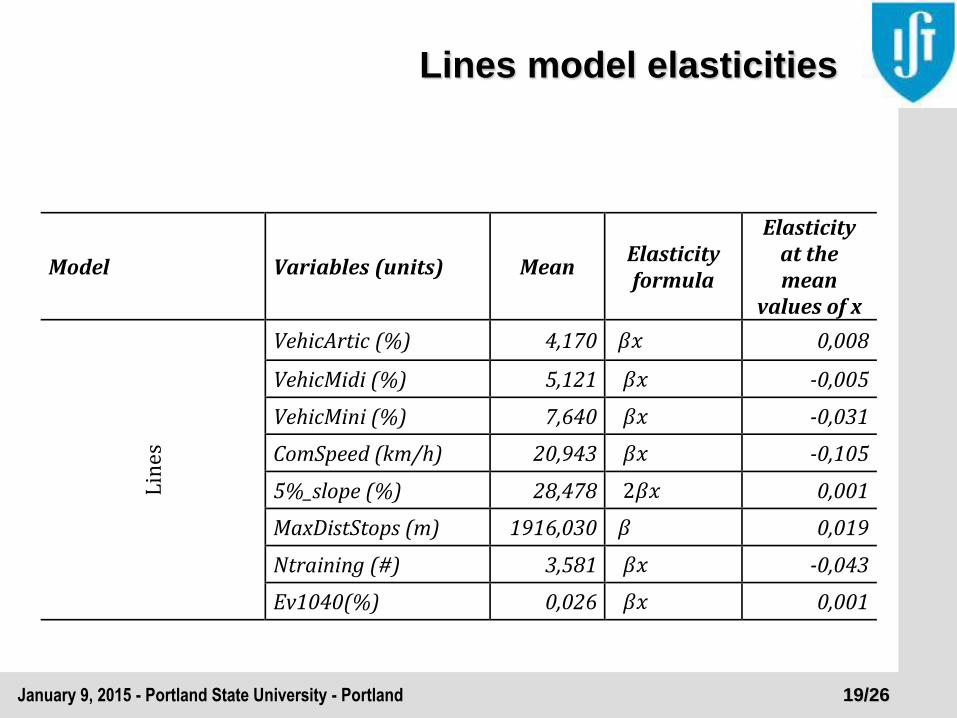
Lines model elasticities
Model Variables (units) Mean Elasticity formula
Elasticity at the mean
values of x
Lin
es
VehicArtic (%) 4,170 𝛽𝑥 0,008
VehicMidi (%) 5,121 𝛽𝑥 -0,005
VehicMini (%) 7,640 𝛽𝑥 -0,031
ComSpeed (km/h) 20,943 𝛽𝑥 -0,105
5%_slope (%) 28,478 2𝛽𝑥 0,001
MaxDistStops (m) 1916,030 𝛽 0,019
Ntraining (#) 3,581 𝛽𝑥 -0,043
Ev1040(%) 0,026 𝛽𝑥 0,001
20/26 January 9, 2015 - Portland State University - Portland
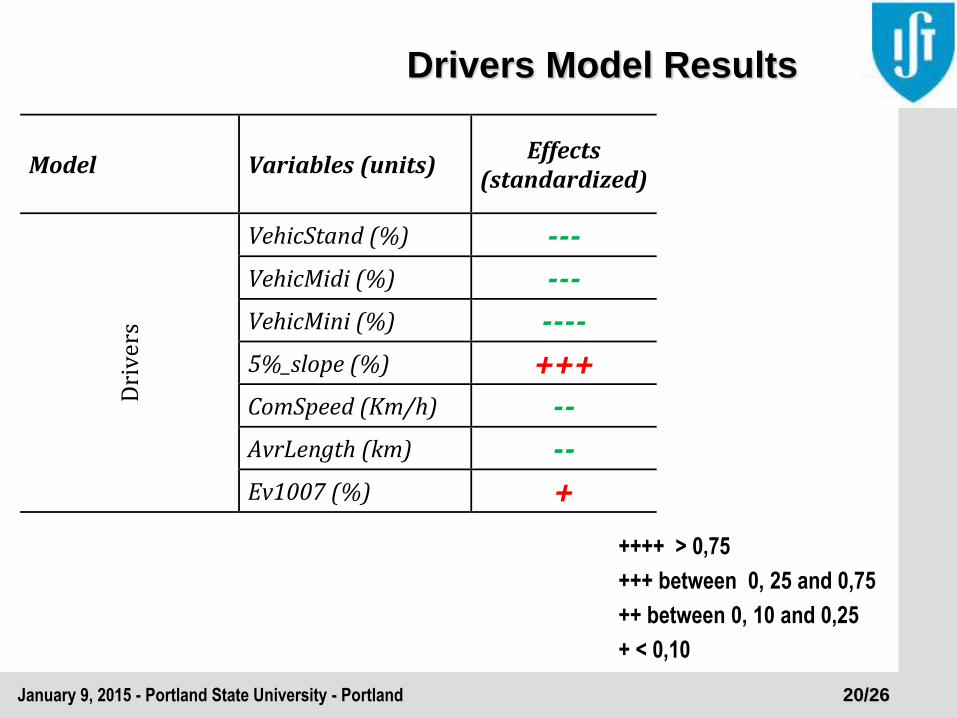
Drivers Model Results
Model Variables (units) Effects
(standardized)
Dri
ver
s
VehicStand (%) --- VehicMidi (%) --- VehicMini (%) ---- 5%_slope (%) +++ ComSpeed (Km/h) -- AvrLength (km) -- Ev1007 (%) +
++++ > 0,75
+++ between 0, 25 and 0,75
++ between 0, 10 and 0,25
+ < 0,10
21/26 January 9, 2015 - Portland State University - Portland
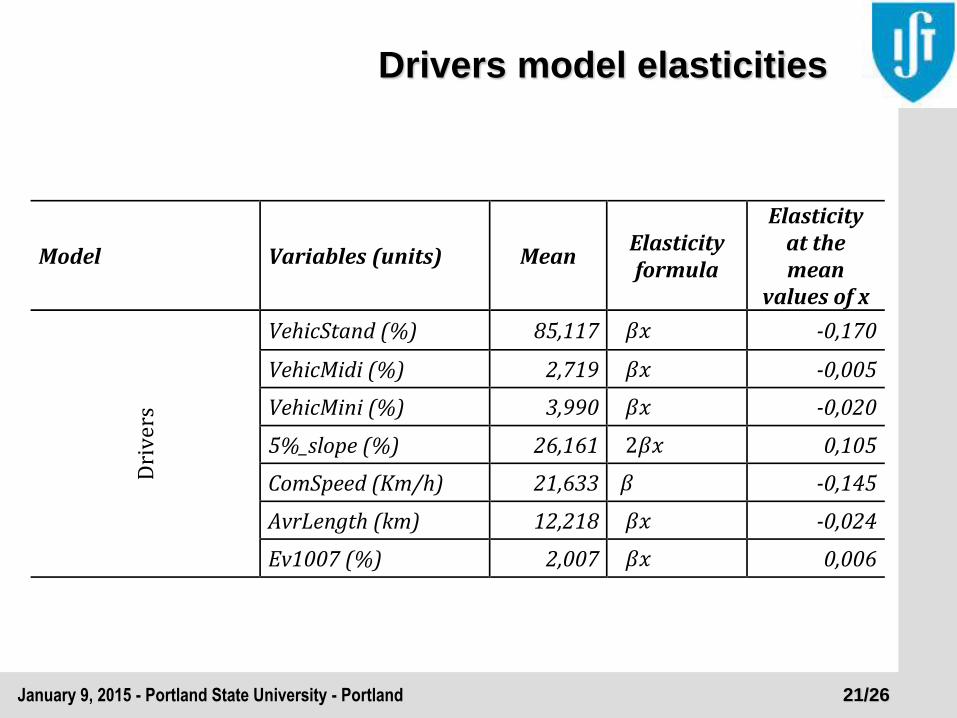
Drivers model elasticities
Model Variables (units) Mean Elasticity formula
Elasticity at the mean
values of x
Dri
ver
s
VehicStand (%) 85,117 𝛽𝑥 -0,170
VehicMidi (%) 2,719 𝛽𝑥 -0,005
VehicMini (%) 3,990 𝛽𝑥 -0,020
5%_slope (%) 26,161 2𝛽𝑥 0,105
ComSpeed (Km/h) 21,633 𝛽 -0,145
AvrLength (km) 12,218 𝛽𝑥 -0,024
Ev1007 (%) 2,007 𝛽𝑥 0,006
22/26 January 9, 2015 - Portland State University - Portland
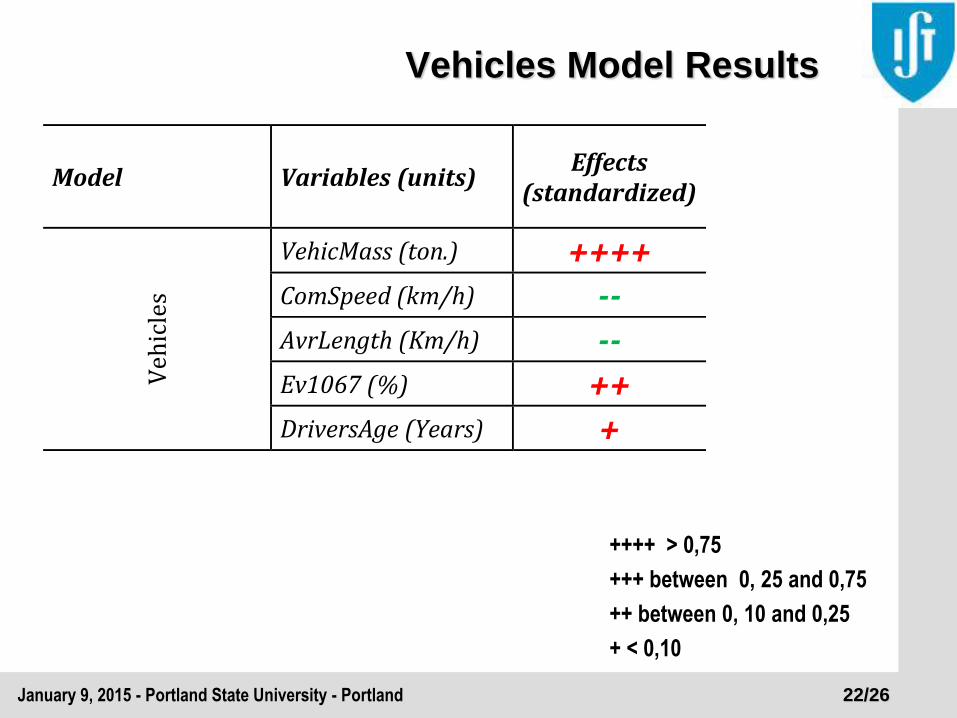
Vehicles Model Results
Model Variables (units) Effects
(standardized)
Veh
icle
s
VehicMass (ton.) ++++ ComSpeed (km/h) -- AvrLength (Km/h) -- Ev1067 (%) ++ DriversAge (Years) +
++++ > 0,75
+++ between 0, 25 and 0,75
++ between 0, 10 and 0,25
+ < 0,10
23/26 January 9, 2015 - Portland State University - Portland
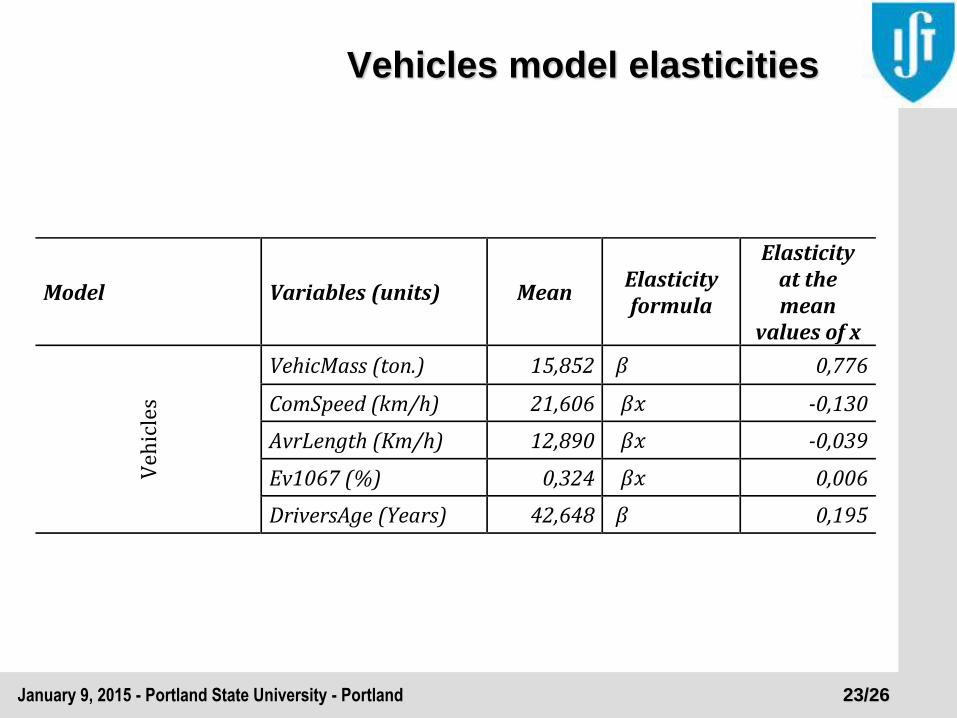
Vehicles model elasticities
Model Variables (units) Mean Elasticity formula
Elasticity at the mean
values of x
Veh
icle
s
VehicMass (ton.) 15,852 𝛽 0,776
ComSpeed (km/h) 21,606 𝛽𝑥 -0,130
AvrLength (Km/h) 12,890 𝛽𝑥 -0,039
Ev1067 (%) 0,324 𝛽𝑥 0,006
DriversAge (Years) 42,648 𝛽 0,195
24/26 January 9, 2015 - Portland State University - Portland
Conclusions (I)
• Vehicle type is the most influential variable in all three models,
confirming the importance of fleet renewal and management
• Commercial speed is also an important factor in all three models,
with higher speeds meaning lower fuel consumption
• Number of drivers passing monitored training was detected in the
routes’ model as having a positive influence on fuel consumption.
This result confirms the success of training measures on the energy
efficiency of bus operator companies
• Driver age has also an impact on fuel consumption. Older drivers
seem to be more adverse to change their behavior
• Driving events such as abrupt deceleration and excessive rotation
have a negative impact on fuel consumption
25/26 January 9, 2015 - Portland State University - Portland
Conclusions (II)
• To continue improving the energy efficiency, some actions should be
considered such as:
Improvement of the data collection process (including passengers data)
Cost/benefit ratio evaluation of various energy conservation measures
Definition of similar models for each operation area of Rodoviária de
Lisboa, since each one presents different traffic and topographical
conditions
Definition of objectives regarding driver monitoring and formative
training
A periodic validation of the developed models, followed by their
readjustment, if necessary
26/26 January 9, 2015 - Portland State University - Portland
Thank you for your attention
Questions?
This presentation is based on:
de Abreu e Silva, João, Moura, Filipe, Garcia, Bernardo and Vargas, Rodrigo,
Influential vectors in fuel consumption by an urban bus operator: bus route, driver
behavior or vehicle type?, submitted for Transportation Research Part D, under the
process of reviewing and resubmitting
Rodoviária de Lisboa is acknowledge for all of their support in this study
27/26 January 9, 2015 - Portland State University - Portland
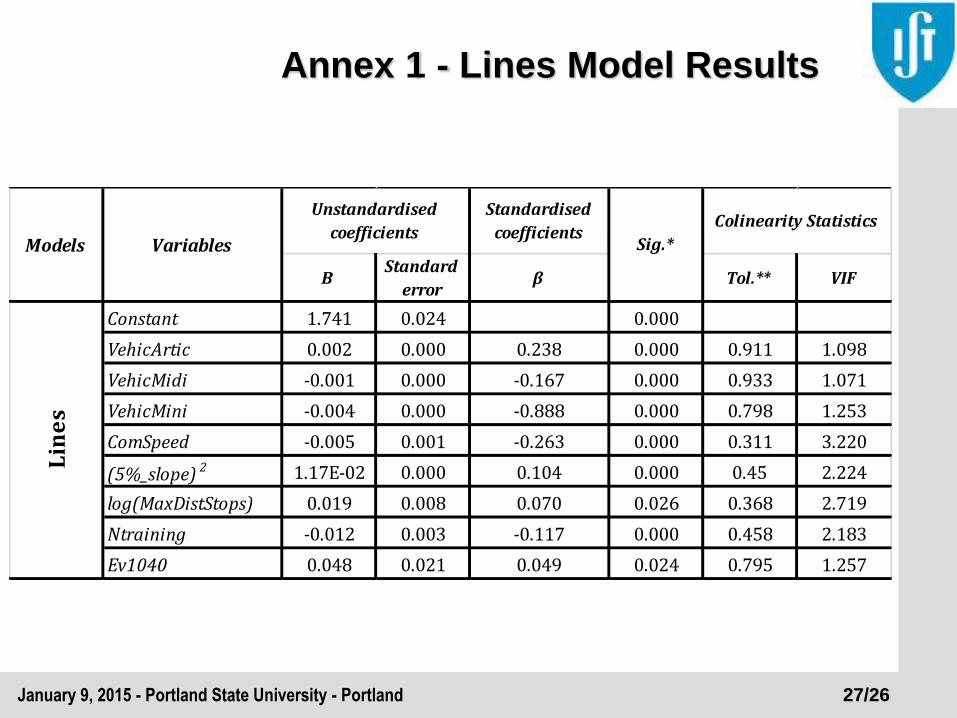
Annex 1 - Lines Model Results
Standardised
coefficients
BStandard
errorβ Tol.** VIF
Constant 1.741 0.024 0.000
VehicArtic 0.002 0.000 0.238 0.000 0.911 1.098
VehicMidi -0.001 0.000 -0.167 0.000 0.933 1.071
VehicMini -0.004 0.000 -0.888 0.000 0.798 1.253
ComSpeed -0.005 0.001 -0.263 0.000 0.311 3.220
(5%_slope) 2 1.17E-02 0.000 0.104 0.000 0.45 2.224
log(MaxDistStops) 0.019 0.008 0.070 0.026 0.368 2.719
Ntraining -0.012 0.003 -0.117 0.000 0.458 2.183
Ev1040 0.048 0.021 0.049 0.024 0.795 1.257
Lin
es
Models Variables
Unstandardised
coefficientsSig.*
Colinearity Statistics
28/26 January 9, 2015 - Portland State University - Portland
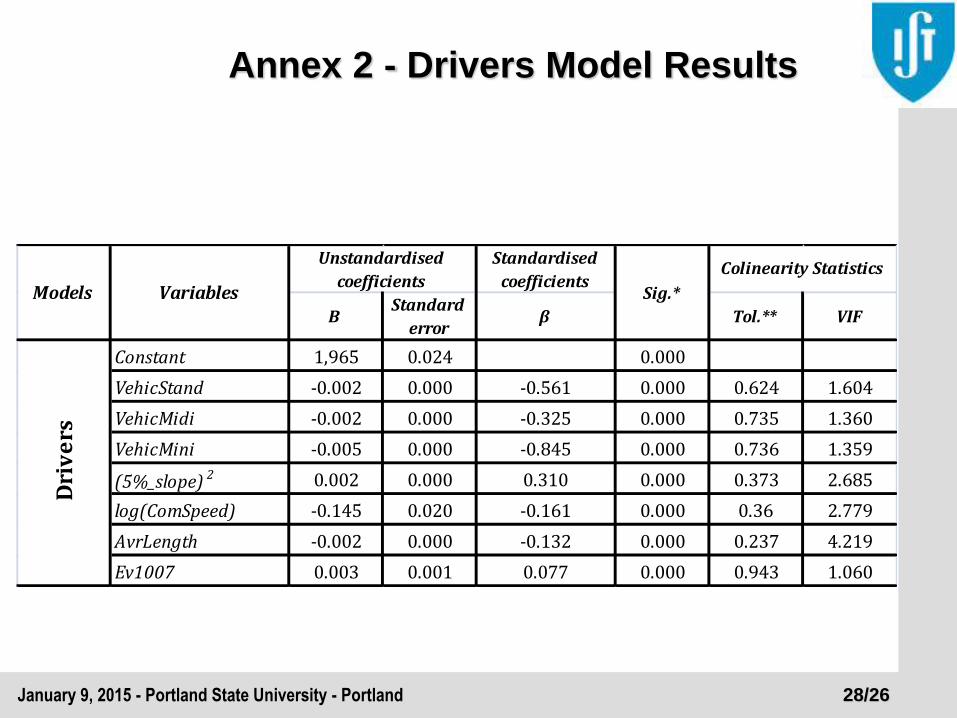
Annex 2 - Drivers Model Results
Standardised
coefficients
BStandard
errorβ Tol.** VIF
Constant 1,965 0.024 0.000
VehicStand -0.002 0.000 -0.561 0.000 0.624 1.604
VehicMidi -0.002 0.000 -0.325 0.000 0.735 1.360
VehicMini -0.005 0.000 -0.845 0.000 0.736 1.359
(5%_slope) 2 0.002 0.000 0.310 0.000 0.373 2.685
log(ComSpeed) -0.145 0.020 -0.161 0.000 0.36 2.779
AvrLength -0.002 0.000 -0.132 0.000 0.237 4.219
Ev1007 0.003 0.001 0.077 0.000 0.943 1.060
Sig.*
Colinearity Statistics
Dri
ve
rs
Models Variables
Unstandardised
coefficients
29/26 January 9, 2015 - Portland State University - Portland
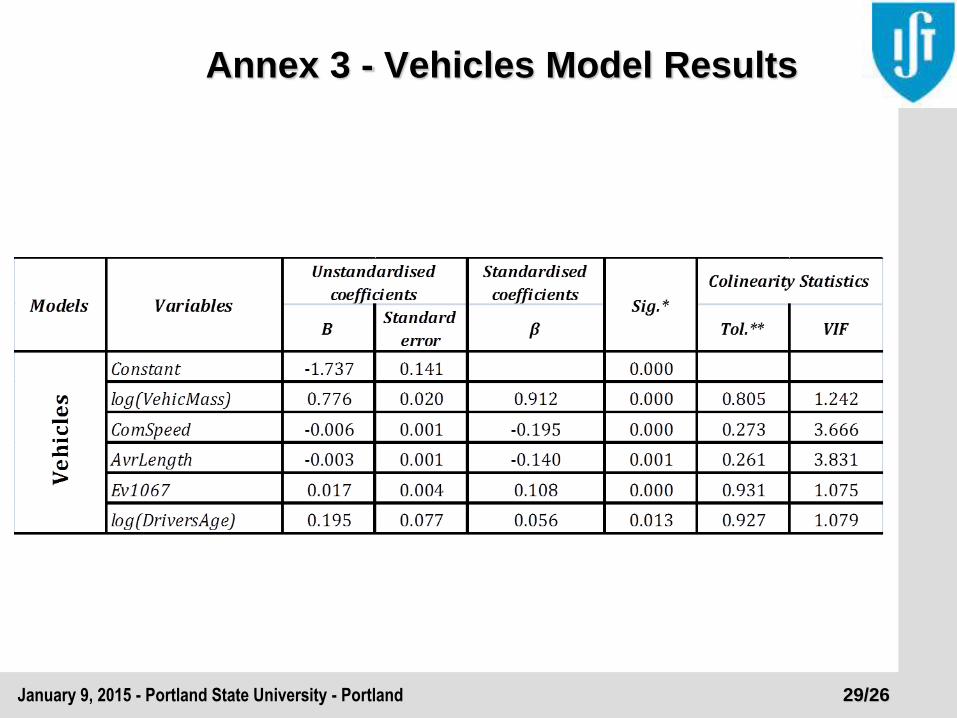
Annex 3 - Vehicles Model Results