info1408: database design concepts term 2 lecture 2 report and form design
TRANSCRIPT

INFO1408: Database Design Concepts
Term 2 Lecture 2
Report and Form Design

Where are we now?
Forms & reports for users
In week 3, we looked at the layers of development in relation to the systems development lifecycle.
We are now looking at the external level, in how users view the database

What is a report?
A report can defined as: An account presented usually in detail. A formal account of the proceedings or
transactions of a group.
In database systems, we are concerned with “reporting”. Reporting is defined as:
To make or present an often official, formal, or regular account of.
To relate or tell about; present: report one's findings.
To write or provide an account or summation of for publication or broadcast: report the news.

So what does this mean to us?
No matter at what level you work in a database system, you will be involved with the reporting processReports, combined with forms, are the methods for information retrieval in most modern relational database systemsMost users at the novice end of the information technology spectrum are not concerned with HOW the database works, or how it is designed.Most users are purely interested in USING the database system, and that it produces the INFORMATION THEY want it to produce.
What is a Form
A form is a screen display that is used for data entry and querying of database data.
Essentially a form provides a ‘window’ into the database, showing the data in a convenient user-friendly format.
It is an alternative to the table-based interfaces that most DBMSs provide.

So what does this mean to us?
To clarify, we need a quick recap of the three main database roles:
Stage Role Performed by
Conceptual Design
Technology independent view of analysing requirements of customer
Data-Modeller
Logical Design
Mapping independent view to fit into chosen design model (ours is relational database model)
Database Designer
Physical Design
Implementing the logical design into the chosen DBMS chosen to run it
Database Administrator (DBA)
So what does this mean to us?
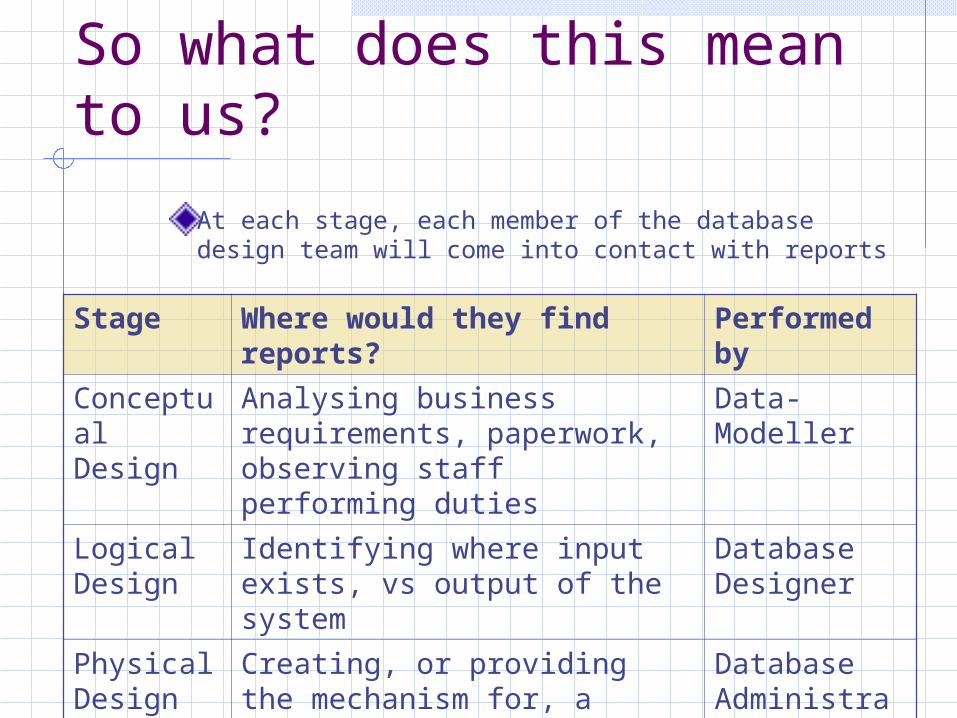
At each stage, each member of the database design team will come into contact with reports
Stage Where would they find reports?
Performed by
Conceptual Design
Analysing business requirements, paperwork, observing staff performing duties
Data-Modeller
Logical Design
Identifying where input exists, vs output of the system
Database Designer
Physical Design
Creating, or providing the mechanism for, a reporting system to exist in the format that the customer wants
Database Administrator (DBA)

So what does this mean to us?
95% of our database users will only EVER use forms and reportsThis means, it is even more important to get it right

Why do people want reports?
Psychology: Studies by Zaphiris (2001) at
Wayne-State University evidenced that reading from a computer screen is between 10-30% slower than from paper.
Some authors quote the scanlines (flickering) of CRT monitors for the problems with this

Why do people want reports?
Business: The paperless office is a myth! What about users without access to
computers? How do they see the data? Many people like to see a printout of the data
– many prefer to annotate or highlight regions of interest
People are still scared of both using computers, and trusting them to reliably store the data.
Reports are easily portable – yes PDAs exists, but not every person in every country has a PC, or PDA capable or reading information

How do we design them?Why “re-invent the wheel”?: Document analysis of current paper-based
systems Examination of current system Examination of similar systems
Why do this: “If it isn’t broke, don’t fix it”, “To err is human,
but to really foul up requires a computer” If users are used to a method of information
retrieval / analysis – DO NOT change it. Changing ways in which people work confuses
them, and may cause unnecessary upset This is particularly evident in techno phobic
users.

Elements of a Report
Report Header- appears at the head of the report- includes title, date etcPage header- appears at the beginning of each page- includes column headingsReport body- includes the dataPage footer- appears at the bottom of each page- includes page numbersReport footer- appears at the end of the report- includes grand totals

Report Design


Good practice
Give the report a title that means something to the userDate the reportGive all columns etc meaningful headings ( caption can be useful, add units)Format data EG Left align text, Right align numbers, Line up the decimal pointsUse colour to help the user

Microsoft Access Application
So how is it done?
Standalone: Microsoft Access The Access Application provides its own
environment for producing reports
Microsoft Access Database File
FormsReports

So how is it done?

So how is it done?Small Scale Client Server: Visual Basic & Microsoft Access
The Access Database provides a file store The Visual Basic Program provides the interface
method The Visual Basic Data Environment (Data Report)
provides a simple report production toolMicrosoft Visual Basic
ProgramMicrosoft Access
Database FileForms
Data Environment
Reports
DatabaseAccess
Methodology(DAO, ADO,
RDC)

So how is it done?

So how is it done?Large Scale Client Server: SQL Server & Crystal Reports
The SQL Server is the database Crystal reports provides an application to report
from A visual basic (or equivalent) program would be
used for a user to interact with the system
Microsoft Visual Basic Program
Microsoft SQL
ServerForms
DatabaseAccess
Methodology(ADO or RDC)
Crystal ReportsEditorApplication
Reports

So how is it done?

Which is best?
The choice is dependant upon the scale of your problem, and the complexity of your reportSmall scale problems for SMEs, with few users, are easily solved using MS AccessMedium sized problems normally need a more robust application with greater functionality, especially with multiple distributed usersLarge scale, multi-national, multi-user problems are separated into process (program), input (form) and output (reports) modules, handled by specific tailored applications.At each size of project, the complexity of the security of these systems becomes much greater

What do business want to show?
Typical reports include: Sales reports - showing forecasts,
trends of sales, or actual sales Client details – for memberships,
renewals, mailing lists Stock control – highlighting stock
takes, shortages, all current stock Delivery – Delivery dockets, orders,
delivery mainifests Accounts – Invoices, statement of
accounts, bills.

Form DesignForms are primarily an end-user facility – their principal role is to facilitate the operation of the database application by clerical and administrative staff, who may not be familiar with the internal design of the database.
For such end-users, the set of forms supporting a database application ‘is’ the database.
Forms have been used in most database systems except those using a purely SQL-based command interface.

Elements of Forms
A form provides a means of viewing and maintaining data held within a database.
The simplest situation is where the form shows one row of data on screen at a time:

Elements of Forms
However, there are several more elaborate possibilities:
The form may be based, not on a physical table, but on the output from a query.
The form may display several rows of the table/query – used mainly in browsing-type operations.
The screen display may hold two (or more) forms interconnected in some fashion – use of SubForm (this will be covered in the lab).

Form Controls
Forms can be constructed using the visual objects, usually called ‘controls’. Controls in MS Access
The most important control is the text box, which is used to display data from a database column.
A text box can be: Bound – box is linked to a column of the table Unbound – not linked to a table column

Form Controls Changes made to data displayed in a bound text
box are reflected in changes to the table.
Unbound text boxes are used to hold intermediate or temporary values.
Command Buttons are used to initiate some specified action, such as closing the form or moving the form display to the next record.
They are also used to construct menu systems using unbound forms.

Form Controls List boxes are used to enable selection of
a data value from a list of alternatives. The list can be directly entered by the
designer or be derived from a reference table.
A combo box is a combination of a text box and a list box. It presents data in a list format but also
permits entry of new values.
Form Applications Forms are used for three main purposes within a database
system:
1. General table maintenance, i.e. adding, amending and deleting rows from tables.
2. Application transactions, i.e. performing the essential processing operations of the application such as entering a new order, issuing an invoice, etc. – such operations frequently utilise two or more tables.
3. Menu (Switchboard) construction – in order to navigate through the various options within the database application – a system of menus constructed from form buttons is often used (this will be covered in the tutorial).

Form Applications The design of a form is partly an aesthetic matter and as such,
individual tastes will vary, for instance, some people will prefer many colours, others only grey, white and black.
However, there are a number of factors of ‘good practice’ which ought to be taken into account:
1. Use consistent conventions on all forms.
2. Use a comfortable font size and style.
3. Establish the correct tabs sequence on forms (mirror the source document) .
4. Divide the form into different functional areas.
5. Customise the system for end-users.
6. Ensure that the form has a convenient size.
7. Apply validation to data.
8. Use control buttons to facilitate user interaction.

Summary Forms are the users’ window into the
database. Forms are generally used to process the
routine transactions of the database application.
Reports are used to supply information to users.
Attention should be paid to the design of the form or report to maximise its usability.

References McBride N, “The Smart Guide to Access 2000 Further Skills”,
Continuum, 2001
Ritchie C, “Relational Database Principles”, Letts Educational, 1998
Mott J & Rendell I, “Database Projects in Access for Advanced Level”, Hodder & Stoughton, 2001
• Zaphiris, P., Kurniawan, S.H. 2001. Effects of Information Layout on Reading Speed Differences between Paper and Monitor Presentation. Proceedings of the 45th Annual Meeting of the Human Factors and Ergonomics Society [CD-ROM], Minneapolis, MN, USA, October 8-12, 2001, pp.1210-1214.