information content of cluster-periods in stepped wedge trials session 5.1... · information...
TRANSCRIPT

Information content of cluster-periods in steppedwedge trials
Jessica KaszaAndrew Forbes
Department of Epidemiology and Preventive MedicineMonash University
ICTMC & SCT, May 2017
Jess Kasza (Monash) Information content of SW cells 1 / 18
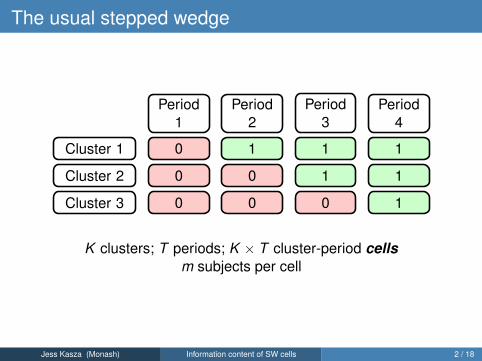
The usual stepped wedge
Period1
Period2
Period3
Period4
Cluster 1 0 1 1 1
Cluster 2 0 0 1 1
Cluster 3 0 0 0 1
K clusters; T periods; K × T cluster-period cellsm subjects per cell
Jess Kasza (Monash) Information content of SW cells 2 / 18

Optimal designs: where to allocate?
Optimal designs seek to allocate a fixed number of subjects in such away so as to maximise power.• Example: to which treatment sequence should a cluster be
assigned?
0 1 1 1
0 0 1 1
0 0 0 1
?
Jess Kasza (Monash) Information content of SW cells 3 / 18

Minimal designs: which to measure?
Minimal designs seek to reduce the total number of subjects with aminimal decrease in power.• Which cells can be excluded?
0 1 1 1
0 0 1 1
0 0 0 1
Jess Kasza (Monash) Information content of SW cells 4 / 18

Minimal designs: which to measure?
Minimal designs seek to reduce the total number of subjects with aminimal decrease in power.• Which cells can be excluded?
0 1 1 1
0 0 1 1
0 0 0 1
Jess Kasza (Monash) Information content of SW cells 4 / 18

Minimal designs: which to measure?
Minimal designs seek to reduce the total number of subjects with aminimal decrease in power.• Which cells can be excluded?
0 1 1 1
0 0 1 1
0 0 0 1
Jess Kasza (Monash) Information content of SW cells 4 / 18

Minimal designs: which to measure?
Minimal designs seek to reduce the total number of subjects with aminimal decrease in power.• Which cells can be excluded?
0 1 1 1
0 0 1 1
0 0 0 1
My focus is on minimal designs:aim to reduce trial costs by omitting cells.
Which cells can be omitted with the smallest acceptable decrease inpower (or precision)?
Jess Kasza (Monash) Information content of SW cells 4 / 18

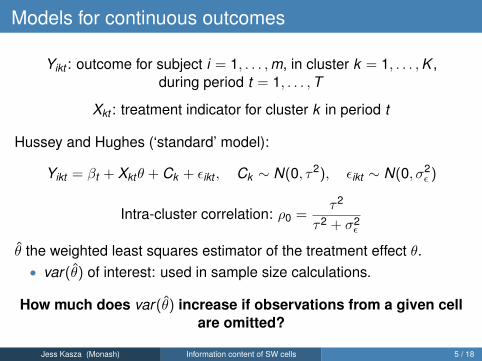
Models for continuous outcomes
Yikt : outcome for subject i = 1, . . . ,m, in cluster k = 1, . . . ,K ,during period t = 1, . . . ,T
Xkt : treatment indicator for cluster k in period t
Hussey and Hughes (‘standard’ model):
Yikt = βt + Xktθ + Ck + εikt , Ck ∼ N(0, τ2), εikt ∼ N(0, σ2ε )
Intra-cluster correlation: ρ0 =τ2
τ2 + σ2ε
θ̂ the weighted least squares estimator of the treatment effect θ.
• var(θ̂) of interest: used in sample size calculations.
How much does var(θ̂) increase if observations from a given cellare omitted?
Jess Kasza (Monash) Information content of SW cells 5 / 18
Models for continuous outcomes
Yikt : outcome for subject i = 1, . . . ,m, in cluster k = 1, . . . ,K ,during period t = 1, . . . ,T
Xkt : treatment indicator for cluster k in period t
Hussey and Hughes (‘standard’ model):
Yikt = βt + Xktθ + Ck + εikt , Ck ∼ N(0, τ2), εikt ∼ N(0, σ2ε )
Intra-cluster correlation: ρ0 =τ2
τ2 + σ2ε
θ̂ the weighted least squares estimator of the treatment effect θ.• var(θ̂) of interest: used in sample size calculations.
How much does var(θ̂) increase if observations from a given cellare omitted?
Jess Kasza (Monash) Information content of SW cells 5 / 18

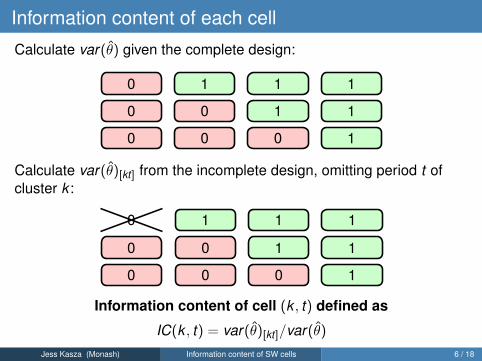
Information content of each cell
Calculate var(θ̂) given the complete design:
0 1 1 1
0 0 1 1
0 0 0 1
Calculate var(θ̂)[kt] from the incomplete design, omitting period t ofcluster k :
0 1 1 1
0 0 1 1
0 0 0 1
Information content of cell (k , t) defined as
IC(k , t) = var(θ̂)[kt]/var(θ̂)
Jess Kasza (Monash) Information content of SW cells 6 / 18
Information content of each cell
Calculate var(θ̂) given the complete design:
0 1 1 1
0 0 1 1
0 0 0 1
Calculate var(θ̂)[kt] from the incomplete design, omitting period t ofcluster k :
0 1 1 1
0 0 1 1
0 0 0 1
Information content of cell (k , t) defined as
IC(k , t) = var(θ̂)[kt]/var(θ̂)Jess Kasza (Monash) Information content of SW cells 6 / 18
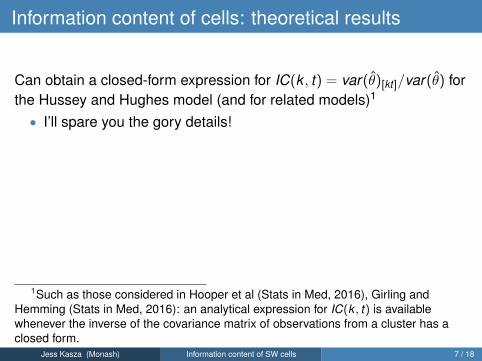
Information content of cells: theoretical results
Can obtain a closed-form expression for IC(k , t) = var(θ̂)[kt]/var(θ̂) forthe Hussey and Hughes model (and for related models)1
• I’ll spare you the gory details!
For this (and related) models, IC(k , t) has the following properties:
Centrosymmetry: IC(k , t) = IC(K + 1− k ,T + 1− t)
Information-free cells: IC(K+1
2 ,1)= IC
(K+12 ,T
)= 1
1Such as those considered in Hooper et al (Stats in Med, 2016), Girling andHemming (Stats in Med, 2016): an analytical expression for IC(k , t) is availablewhenever the inverse of the covariance matrix of observations from a cluster has aclosed form.
Jess Kasza (Monash) Information content of SW cells 7 / 18
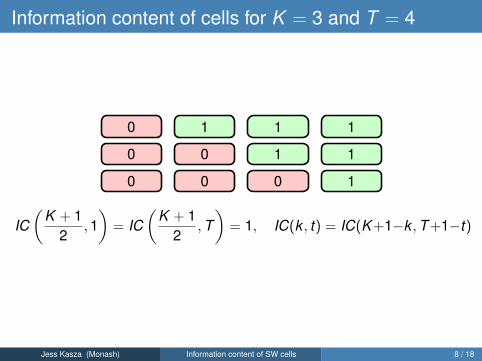
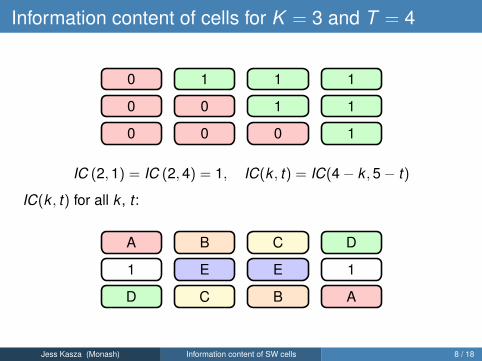
Information content of cells for K = 3 and T = 4
0 1 1 1
0 0 1 1
0 0 0 1
IC(
K + 12
,1)
= IC(
K + 12
,T)
= 1, IC(k , t) = IC(K+1−k ,T+1−t)
Jess Kasza (Monash) Information content of SW cells 8 / 18

Information content of cells for K = 3 and T = 4
0 1 1 1
0 0 1 1
0 0 0 1
IC (2,1) = IC (2,4) = 1, IC(k , t) = IC(4− k ,5− t)
Jess Kasza (Monash) Information content of SW cells 8 / 18
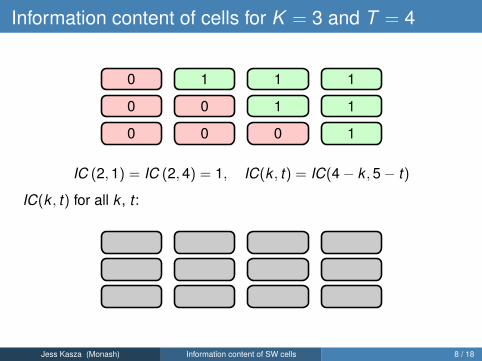
Information content of cells for K = 3 and T = 4
0 1 1 1
0 0 1 1
0 0 0 1
IC (2,1) = IC (2,4) = 1, IC(k , t) = IC(4− k ,5− t)
IC(k , t) for all k , t :
Jess Kasza (Monash) Information content of SW cells 8 / 18

Information content of cells for K = 3 and T = 4
0 1 1 1
0 0 1 1
0 0 0 1
IC (2,1) = IC (2,4) = 1, IC(k , t) = IC(4− k ,5− t)
IC(k , t) for all k , t :
1 1
Jess Kasza (Monash) Information content of SW cells 8 / 18

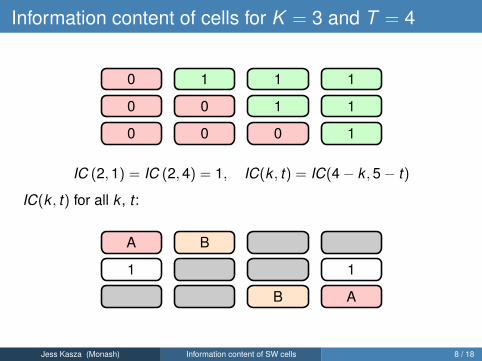
Information content of cells for K = 3 and T = 4
0 1 1 1
0 0 1 1
0 0 0 1
IC (2,1) = IC (2,4) = 1, IC(k , t) = IC(4− k ,5− t)
IC(k , t) for all k , t :
A
1 1
A
Jess Kasza (Monash) Information content of SW cells 8 / 18
Information content of cells for K = 3 and T = 4
0 1 1 1
0 0 1 1
0 0 0 1
IC (2,1) = IC (2,4) = 1, IC(k , t) = IC(4− k ,5− t)
IC(k , t) for all k , t :
A B
1 1
B A
Jess Kasza (Monash) Information content of SW cells 8 / 18
Information content of cells for K = 3 and T = 4
0 1 1 1
0 0 1 1
0 0 0 1
IC (2,1) = IC (2,4) = 1, IC(k , t) = IC(4− k ,5− t)
IC(k , t) for all k , t :
A B C
1 1
C B A
Jess Kasza (Monash) Information content of SW cells 8 / 18

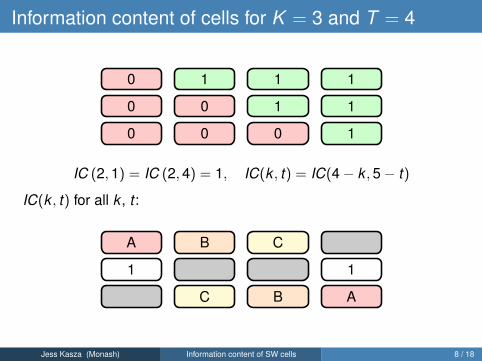
Information content of cells for K = 3 and T = 4
0 1 1 1
0 0 1 1
0 0 0 1
IC (2,1) = IC (2,4) = 1, IC(k , t) = IC(4− k ,5− t)
IC(k , t) for all k , t :
A B C D
1 1
D C B A
Jess Kasza (Monash) Information content of SW cells 8 / 18
Information content of cells for K = 3 and T = 4
0 1 1 1
0 0 1 1
0 0 0 1
IC (2,1) = IC (2,4) = 1, IC(k , t) = IC(4− k ,5− t)
IC(k , t) for all k , t :
A B C D
1 E E 1
D C B A
Jess Kasza (Monash) Information content of SW cells 8 / 18
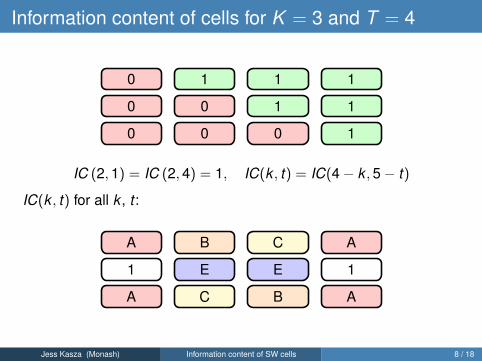
Information content of cells for K = 3 and T = 4
0 1 1 1
0 0 1 1
0 0 0 1
IC (2,1) = IC (2,4) = 1, IC(k , t) = IC(4− k ,5− t)
IC(k , t) for all k , t :
A B C A
1 E E 1
A C B A
Jess Kasza (Monash) Information content of SW cells 8 / 18

Particular examples
Hussey and Hughes model:
Yikt = βt + Xktθ + Ck + εikt , Ck ∼ N(0, τ2), εikt ∼ N(0, σ2ε )
Intra-cluster correlation: ρ0 =τ2
τ2 + σ2ε
• Fix total variance at unity: τ2 + σ2ε = 1⇒ ρ0 = τ2 = 0.05
• m = 100 subjects per cluster-period cell• Consider standard SW designs with T = 4,10,15,20 periods.
Calculate IC(k , t) for K = 1, . . . ,K , T = 1, . . . ,T .
Jess Kasza (Monash) Information content of SW cells 9 / 18
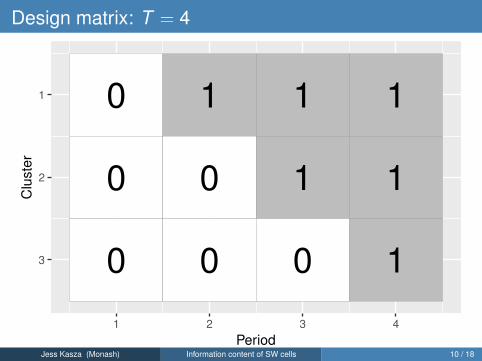
Design matrix: T = 4
0
0
0
1
0
0
1
1
0
1
1
1
1
2
3
1 2 3 4
Period
Clu
ste
r
Jess Kasza (Monash) Information content of SW cells 10 / 18

Design matrix: T = 10
000000000
100000000
110000000
111000000
111100000
111110000
111111000
111111100
111111110
111111111
2.5
5.0
7.5
0.0 2.5 5.0 7.5 10.0
Period
Clu
ste
r
Jess Kasza (Monash) Information content of SW cells 11 / 18

Design matrix: T = 15
0
0
0
0
0
0
0
0
0
0
0
0
0
0
1
0
0
0
0
0
0
0
0
0
0
0
0
0
1
1
0
0
0
0
0
0
0
0
0
0
0
0
1
1
1
0
0
0
0
0
0
0
0
0
0
0
1
1
1
1
0
0
0
0
0
0
0
0
0
0
1
1
1
1
1
0
0
0
0
0
0
0
0
0
1
1
1
1
1
1
0
0
0
0
0
0
0
0
1
1
1
1
1
1
1
0
0
0
0
0
0
0
1
1
1
1
1
1
1
1
0
0
0
0
0
0
1
1
1
1
1
1
1
1
1
0
0
0
0
0
1
1
1
1
1
1
1
1
1
1
0
0
0
0
1
1
1
1
1
1
1
1
1
1
1
0
0
0
1
1
1
1
1
1
1
1
1
1
1
1
0
0
1
1
1
1
1
1
1
1
1
1
1
1
1
0
1
1
1
1
1
1
1
1
1
1
1
1
1
1
0
5
10
15
0 5 10 15
Period
Clu
ste
r
Jess Kasza (Monash) Information content of SW cells 12 / 18

Design matrix: T = 20
0
0
0
0
0
0
0
0
0
0
0
0
0
0
0
0
0
0
0
1
0
0
0
0
0
0
0
0
0
0
0
0
0
0
0
0
0
0
1
1
0
0
0
0
0
0
0
0
0
0
0
0
0
0
0
0
0
1
1
1
0
0
0
0
0
0
0
0
0
0
0
0
0
0
0
0
1
1
1
1
0
0
0
0
0
0
0
0
0
0
0
0
0
0
0
1
1
1
1
1
0
0
0
0
0
0
0
0
0
0
0
0
0
0
1
1
1
1
1
1
0
0
0
0
0
0
0
0
0
0
0
0
0
1
1
1
1
1
1
1
0
0
0
0
0
0
0
0
0
0
0
0
1
1
1
1
1
1
1
1
0
0
0
0
0
0
0
0
0
0
0
1
1
1
1
1
1
1
1
1
0
0
0
0
0
0
0
0
0
0
1
1
1
1
1
1
1
1
1
1
0
0
0
0
0
0
0
0
0
1
1
1
1
1
1
1
1
1
1
1
0
0
0
0
0
0
0
0
1
1
1
1
1
1
1
1
1
1
1
1
0
0
0
0
0
0
0
1
1
1
1
1
1
1
1
1
1
1
1
1
0
0
0
0
0
0
1
1
1
1
1
1
1
1
1
1
1
1
1
1
0
0
0
0
0
1
1
1
1
1
1
1
1
1
1
1
1
1
1
1
0
0
0
0
1
1
1
1
1
1
1
1
1
1
1
1
1
1
1
1
0
0
0
1
1
1
1
1
1
1
1
1
1
1
1
1
1
1
1
1
0
0
1
1
1
1
1
1
1
1
1
1
1
1
1
1
1
1
1
1
0
1
1
1
1
1
1
1
1
1
1
1
1
1
1
1
1
1
1
1
0
5
10
15
20
0 5 10 15 20
Period
Clu
ste
r
Jess Kasza (Monash) Information content of SW cells 13 / 18
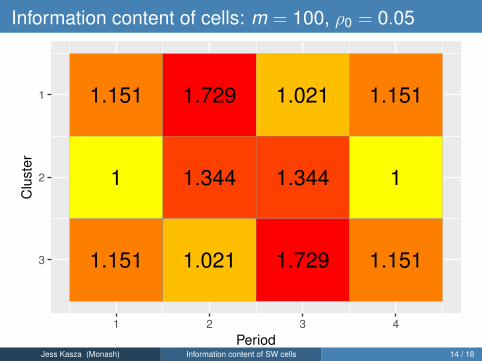
Information content of cells: m = 100, ρ0 = 0.05
1.151
1
1.151
1.729
1.344
1.021
1.021
1.344
1.729
1.151
1
1.151
1
2
3
1 2 3 4
Period
Clu
ste
r
Jess Kasza (Monash) Information content of SW cells 14 / 18

Information content of cells: m = 100, ρ0 = 0.05
1.0265
1.01474
1.0065
1.00162
1
1.00162
1.0065
1.01474
1.0265
1.04305
1.02833
1.01609
1.00739
1.00207
1.00003
1.00122
1.00566
1.01345
1.0255
1.04074
1.03023
1.0175
1.00834
1.00259
1.00011
1.00087
1.00488
1.01275
1.02377
1.0385
1.0322
1.01897
1.00936
1.00316
1.00025
1.00059
1.00447
1.01156
1.02211
1.03633
1.03423
1.02051
1.01043
1.00379
1.00045
1.00045
1.00379
1.01043
1.02051
1.03423
1.03633
1.02211
1.01156
1.00447
1.00059
1.00025
1.00316
1.00936
1.01897
1.0322
1.0385
1.02377
1.01275
1.00488
1.00087
1.00011
1.00259
1.00834
1.0175
1.03023
1.04074
1.0255
1.01345
1.00566
1.00122
1.00003
1.00207
1.00739
1.01609
1.02833
1.04305
1.0265
1.01474
1.0065
1.00162
1
1.00162
1.0065
1.01474
1.0265
2.5
5.0
7.5
0.0 2.5 5.0 7.5 10.0
Period
Clu
ste
r
Jess Kasza (Monash) Information content of SW cells 15 / 18
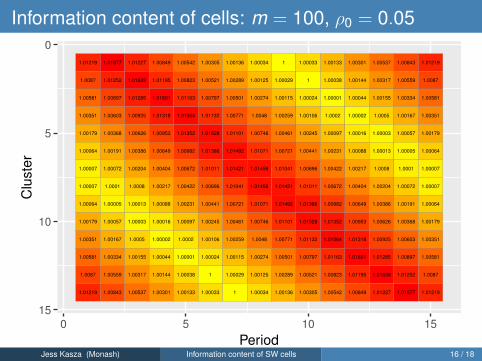
Information content of cells: m = 100, ρ0 = 0.05
1.01219
1.0087
1.00581
1.00351
1.00179
1.00064
1.00007
1.00007
1.00064
1.00179
1.00351
1.00581
1.0087
1.01219
1.01677
1.01252
1.00897
1.00603
1.00368
1.00191
1.00072
1.0001
1.00005
1.00057
1.00167
1.00334
1.00559
1.00843
1.01227
1.01639
1.01285
1.00925
1.00626
1.00386
1.00204
1.0008
1.00013
1.00003
1.0005
1.00155
1.00317
1.00537
1.00849
1.01195
1.01601
1.01318
1.00953
1.00649
1.00404
1.00217
1.00088
1.00016
1.00002
1.00044
1.00144
1.00301
1.00542
1.00823
1.01163
1.01564
1.01352
1.00982
1.00672
1.00422
1.00231
1.00097
1.0002
1.00001
1.00038
1.00133
1.00305
1.00521
1.00797
1.01132
1.01528
1.01386
1.01011
1.00696
1.00441
1.00245
1.00106
1.00024
1
1.00033
1.00136
1.00289
1.00501
1.00771
1.01101
1.01492
1.01421
1.01041
1.00721
1.00461
1.00259
1.00115
1.00029
1
1.00034
1.00125
1.00274
1.0048
1.00746
1.01071
1.01456
1.01456
1.01071
1.00746
1.0048
1.00274
1.00125
1.00034
1
1.00029
1.00115
1.00259
1.00461
1.00721
1.01041
1.01421
1.01492
1.01101
1.00771
1.00501
1.00289
1.00136
1.00033
1
1.00024
1.00106
1.00245
1.00441
1.00696
1.01011
1.01386
1.01528
1.01132
1.00797
1.00521
1.00305
1.00133
1.00038
1.00001
1.0002
1.00097
1.00231
1.00422
1.00672
1.00982
1.01352
1.01564
1.01163
1.00823
1.00542
1.00301
1.00144
1.00044
1.00002
1.00016
1.00088
1.00217
1.00404
1.00649
1.00953
1.01318
1.01601
1.01195
1.00849
1.00537
1.00317
1.00155
1.0005
1.00003
1.00013
1.0008
1.00204
1.00386
1.00626
1.00925
1.01285
1.01639
1.01227
1.00843
1.00559
1.00334
1.00167
1.00057
1.00005
1.0001
1.00072
1.00191
1.00368
1.00603
1.00897
1.01252
1.01677
1.01219
1.0087
1.00581
1.00351
1.00179
1.00064
1.00007
1.00007
1.00064
1.00179
1.00351
1.00581
1.0087
1.01219
0
5
10
15
0 5 10 15
Period
Clu
ste
r
Jess Kasza (Monash) Information content of SW cells 16 / 18

Information content of cells: m = 100, ρ0 = 0.05
1.006995
1.005519
1.00422
1.003097
1.002149
1.001374
1.000772
1.000343
1.000086
1
1.000086
1.000343
1.000772
1.001374
1.002149
1.003097
1.00422
1.005519
1.006995
1.008874
1.007093
1.005606
1.004296
1.003162
1.002203
1.001417
1.000805
1.000365
1.000097
1
1.000075
1.000322
1.00074
1.001331
1.002095
1.003032
1.004144
1.005432
1.007097
1.008763
1.007193
1.005694
1.004373
1.003228
1.002258
1.001462
1.000838
1.000387
1.000109
1.000001
1.000066
1.000302
1.000709
1.001289
1.002042
1.002969
1.00407
1.005522
1.006998
1.008654
1.007292
1.005783
1.004451
1.003295
1.002313
1.001506
1.000872
1.000411
1.000121
1.000003
1.000057
1.000282
1.000679
1.001248
1.00199
1.002905
1.004147
1.005435
1.006901
1.008545
1.007393
1.005872
1.004529
1.003362
1.00237
1.001552
1.000907
1.000435
1.000134
1.000005
1.000048
1.000263
1.000649
1.001207
1.001938
1.002971
1.004072
1.005349
1.006804
1.008436
1.007494
1.005962
1.004608
1.00343
1.002427
1.001598
1.000942
1.000459
1.000148
1.000008
1.00004
1.000244
1.000619
1.001167
1.001992
1.002907
1.003998
1.005264
1.006707
1.008329
1.007596
1.006053
1.004687
1.003498
1.002485
1.001645
1.000978
1.000484
1.000162
1.000012
1.000033
1.000226
1.000591
1.001208
1.00194
1.002845
1.003925
1.00518
1.006612
1.008222
1.007699
1.006144
1.004768
1.003568
1.002543
1.001692
1.001015
1.00051
1.000177
1.000016
1.000027
1.000209
1.00062
1.001168
1.001889
1.002783
1.003852
1.005096
1.006517
1.008116
1.007802
1.006236
1.004849
1.003638
1.002602
1.00174
1.001052
1.000537
1.000193
1.000022
1.000021
1.000227
1.000592
1.001129
1.001839
1.002722
1.00378
1.005013
1.006423
1.008011
1.007906
1.006329
1.00493
1.003708
1.002662
1.001789
1.00109
1.000564
1.00021
1.000027
1.000027
1.00021
1.000564
1.00109
1.001789
1.002662
1.003708
1.00493
1.006329
1.007906
1.008011
1.006423
1.005013
1.00378
1.002722
1.001839
1.001129
1.000592
1.000227
1.000021
1.000022
1.000193
1.000537
1.001052
1.00174
1.002602
1.003638
1.004849
1.006236
1.007802
1.008116
1.006517
1.005096
1.003852
1.002783
1.001889
1.001168
1.00062
1.000209
1.000027
1.000016
1.000177
1.00051
1.001015
1.001692
1.002543
1.003568
1.004768
1.006144
1.007699
1.008222
1.006612
1.00518
1.003925
1.002845
1.00194
1.001208
1.000591
1.000226
1.000033
1.000012
1.000162
1.000484
1.000978
1.001645
1.002485
1.003498
1.004687
1.006053
1.007596
1.008329
1.006707
1.005264
1.003998
1.002907
1.001992
1.001167
1.000619
1.000244
1.00004
1.000008
1.000148
1.000459
1.000942
1.001598
1.002427
1.00343
1.004608
1.005962
1.007494
1.008436
1.006804
1.005349
1.004072
1.002971
1.001938
1.001207
1.000649
1.000263
1.000048
1.000005
1.000134
1.000435
1.000907
1.001552
1.00237
1.003362
1.004529
1.005872
1.007393
1.008545
1.006901
1.005435
1.004147
1.002905
1.00199
1.001248
1.000679
1.000282
1.000057
1.000003
1.000121
1.000411
1.000872
1.001506
1.002313
1.003295
1.004451
1.005783
1.007292
1.008654
1.006998
1.005522
1.00407
1.002969
1.002042
1.001289
1.000709
1.000302
1.000066
1.000001
1.000109
1.000387
1.000838
1.001462
1.002258
1.003228
1.004373
1.005694
1.007193
1.008763
1.007097
1.005432
1.004144
1.003032
1.002095
1.001331
1.00074
1.000322
1.000075
1
1.000097
1.000365
1.000805
1.001417
1.002203
1.003162
1.004296
1.005606
1.007093
1.008874
1.006995
1.005519
1.00422
1.003097
1.002149
1.001374
1.000772
1.000343
1.000086
1
1.000086
1.000343
1.000772
1.001374
1.002149
1.003097
1.00422
1.005519
1.006995
0
5
10
15
20
0 5 10 15 20
Period
Clu
ste
r
Jess Kasza (Monash) Information content of SW cells 17 / 18
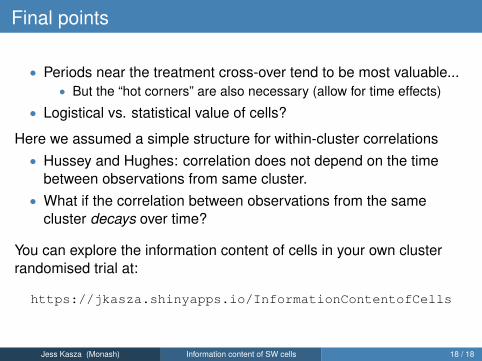
Final points
• Periods near the treatment cross-over tend to be most valuable...• But the “hot corners” are also necessary (allow for time effects)
• Logistical vs. statistical value of cells?
Here we assumed a simple structure for within-cluster correlations• Hussey and Hughes: correlation does not depend on the time
between observations from same cluster.• What if the correlation between observations from the same
cluster decays over time?
You can explore the information content of cells in your own clusterrandomised trial at:
https://jkasza.shinyapps.io/InformationContentofCells
Jess Kasza (Monash) Information content of SW cells 18 / 18

Jess Kasza (Monash) Information content of SW cells 19 / 18

A more complex intra-cluster correlation structure
• Hussey and Hughes:
Yikt = βt + Xktθ + Ck + εikt , Ck ∼ N(0, τ2), εikt ∼ N(0, σ2ε )
corr(Yikt ,Yjkt) = corr(Yikt ,Yjks) =τ2
τ2 + σ2ε
• Exponential decay model:
Yikt = βt +Xktθ+CPkt + εikt , CPk ∼ NT (0, τ2R), εikt ∼ N(0, σ2ε )
R[t , s] = r |t−s| ⇒ corr(Yikt ,Yjkt) =τ2
τ2 + σ2ε
but corr(Yikt ,Yjks) =τ2
τ2 + σ2ε
r |t−s|
Key difference: the correlation between two observations in the samecluster now depends on the amount of time between them!
Jess Kasza (Monash) Information content of SW cells 20 / 18

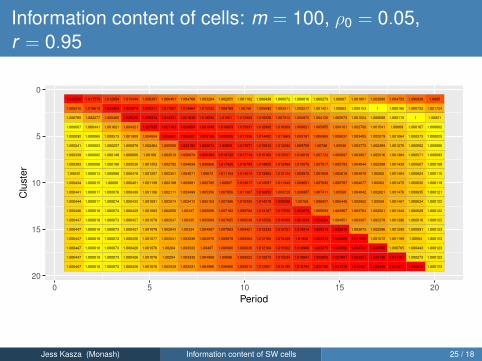
Exponential decay and information content of clusters
Yikt = βt + Xktθ + CPkt + εikt , CPk ∼ NT (0, τ2R), εikt ∼ N(0, σ2ε )
R[t , s] = r |t−s| ⇒ corr(Yikt ,Yjkt) =τ2
τ2 + σ2ε
, corr(Yikt ,Yjks) =τ2
τ2 + σ2ε
r |t−s|
Consider same design parameters as previously:• Fix total variance at unity: τ2 + σ2
ε = 1⇒ ρ0 = τ2 = 0.05• m = 100 subjects per cluster-period cell• Consider standard SW designs with T = 4,10,15,20 periods.
What about r? Set r = 0.95⇒ 5% decay in correlation per period.
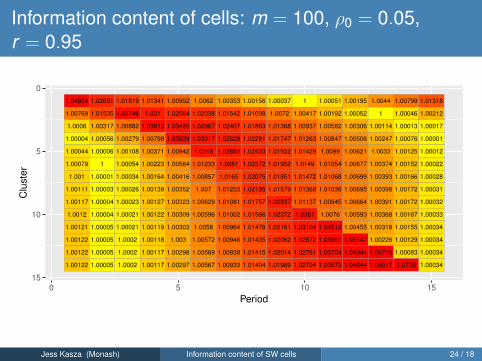
Jess Kasza (Monash) Information content of SW cells 21 / 18

Information content of cells: m = 100, ρ0 = 0.05,r = 0.95
1.222
1.007
1.136
1.598
1.246
1.029
1.04
1.232
1.654
1.062
1.001
1.045
1
2
3
1 2 3 4
Period
Clu
ste
r
Jess Kasza (Monash) Information content of SW cells 22 / 18

Information content of cells: m = 100, ρ0 = 0.05,r = 0.95
1.0785
1.00873
1.00005
1.00121
1.00304
1.00423
1.00489
1.00523
1.00542
1.05376
1.02713
1.00514
1.00074
1.00003
1.00002
1.0001
1.00016
1.00019
1.03033
1.06582
1.01957
1.00691
1.00312
1.00182
1.00131
1.00109
1.00098
1.01752
1.04667
1.06081
1.02244
1.01215
1.00831
1.0067
1.00597
1.00561
1.00844
1.03174
1.04629
1.04862
1.03151
1.02145
1.01728
1.01539
1.01445
1.00252
1.0191
1.03203
1.03713
1.03471
1.04647
1.03562
1.03083
1.02848
1.00005
1.00922
1.01924
1.02455
1.02537
1.02186
1.06784
1.05537
1.04943
1.00151
1.00267
1.0091
1.01333
1.015
1.01443
1.01149
1.09636
1.08081
1.00768
1.00002
1.0024
1.00492
1.0063
1.00666
1.0061
1.00447
1.13174
1.02065
1.00242
1.00001
1.00033
1.00084
1.00117
1.00135
1.00145
1.00152
2.5
5.0
7.5
0.0 2.5 5.0 7.5 10.0
Period
Clu
ste
r
Jess Kasza (Monash) Information content of SW cells 23 / 18
Information content of cells: m = 100, ρ0 = 0.05,r = 0.95
1.04924
1.00769
1.0006
1.00004
1.00044
1.00079
1.001
1.00111
1.00117
1.0012
1.00121
1.00122
1.00122
1.00122
1.02691
1.01535
1.00317
1.00056
1.00006
1
1.00001
1.00003
1.00004
1.00004
1.00005
1.00005
1.00005
1.00005
1.01819
1.03746
1.00882
1.00279
1.00108
1.00054
1.00034
1.00026
1.00023
1.00021
1.00021
1.0002
1.0002
1.0002
1.01341
1.031
1.03913
1.00798
1.00371
1.00223
1.00164
1.00139
1.00127
1.00122
1.00119
1.00118
1.00117
1.00117
1.00952
1.02564
1.03485
1.03629
1.00942
1.00564
1.00416
1.00352
1.00323
1.00309
1.00303
1.003
1.00298
1.00297
1.0062
1.02038
1.02967
1.03317
1.0315
1.01233
1.00857
1.007
1.00629
1.00596
1.0058
1.00572
1.00569
1.00567
1.00353
1.01542
1.02407
1.02828
1.02889
1.0261
1.0165
1.01253
1.01081
1.01002
1.00964
1.00946
1.00938
1.00933
1.00156
1.01098
1.01863
1.02281
1.02433
1.02372
1.02075
1.02185
1.01757
1.01566
1.01478
1.01435
1.01415
1.01404
1.00037
1.0072
1.01368
1.01747
1.01922
1.01952
1.01851
1.01579
1.02837
1.02372
1.02161
1.02062
1.02014
1.01989
1
1.00417
1.00937
1.01263
1.01429
1.0149
1.01472
1.01368
1.01137
1.0361
1.03104
1.02872
1.02761
1.02704
1.00051
1.00192
1.00582
1.00847
1.0099
1.01054
1.01068
1.01036
1.00945
1.0076
1.04512
1.03961
1.03704
1.03573
1.00195
1.00052
1.00306
1.00506
1.00621
1.00677
1.00699
1.00695
1.00664
1.00593
1.00455
1.05547
1.04944
1.04644
1.0044
1
1.00114
1.00247
1.0033
1.00374
1.00393
1.00398
1.00391
1.00368
1.00318
1.00226
1.06716
1.06017
1.00799
1.00046
1.00013
1.00076
1.00125
1.00152
1.00166
1.00172
1.00172
1.00167
1.00155
1.00129
1.00083
1.0795
1.01318
1.00212
1.00017
1.00001
1.00012
1.00022
1.00028
1.00031
1.00032
1.00033
1.00034
1.00034
1.00034
1.00034
0
5
10
15
0 5 10 15
Period
Clu
ste
r
Jess Kasza (Monash) Information content of SW cells 24 / 18
Information content of cells: m = 100, ρ0 = 0.05,r = 0.95
1.035536
1.006315
1.000765
1.000007
1.000092
1.000241
1.000339
1.000393
1.00042
1.000434
1.000441
1.000444
1.000446
1.000447
1.000447
1.000447
1.000447
1.000447
1.000447
1.017579
1.010619
1.002277
1.000441
1.000065
1.000003
1.000002
1.000008
1.000013
1.000015
1.000017
1.000017
1.000018
1.000018
1.000018
1.000018
1.000018
1.000018
1.000018
1.012884
1.025953
1.005465
1.001621
1.000573
1.000257
1.000148
1.000106
1.000088
1.00008
1.000076
1.000074
1.000074
1.000073
1.000073
1.000073
1.000073
1.000073
1.000073
1.010444
1.022874
1.028498
1.004321
1.001809
1.000978
1.000666
1.000536
1.000478
1.000451
1.000438
1.000432
1.000429
1.000427
1.000427
1.000426
1.000426
1.000426
1.000426
1.008381
1.020311
1.026914
1.027935
1.004554
1.002464
1.00168
1.001353
1.001207
1.001139
1.001106
1.001091
1.001083
1.001079
1.001078
1.001077
1.001076
1.001076
1.001076
1.006481
1.017607
1.024531
1.027103
1.025881
1.005508
1.003513
1.002705
1.002351
1.002188
1.002111
1.002074
1.002056
1.002047
1.002043
1.002041
1.00204
1.00204
1.002039
1.004768
1.014864
1.021638
1.024854
1.025321
1.023193
1.006974
1.004934
1.004071
1.003681
1.003499
1.003412
1.00337
1.00335
1.00334
1.003336
1.003333
1.003332
1.003331
1.003284
1.012222
1.018592
1.021948
1.023158
1.022673
1.020304
1.008868
1.00672
1.005785
1.005356
1.005153
1.005056
1.005009
1.004987
1.004976
1.00497
1.004968
1.004966
1.002055
1.009769
1.01561
1.018859
1.020325
1.02058
1.019732
1.017428
1.011154
1.00887
1.007856
1.007386
1.007162
1.007055
1.007003
1.006978
1.006966
1.00696
1.006956
1.001102
1.00755
1.012803
1.015831
1.017326
1.017871
1.017714
1.016783
1.014674
1.013817
1.011387
1.010293
1.009782
1.009538
1.009421
1.009364
1.009336
1.009322
1.009315
1.000438
1.005592
1.010228
1.012982
1.014402
1.015033
1.015163
1.014855
1.013963
1.012097
1.016853
1.014279
1.013107
1.012556
1.012293
1.012165
1.012104
1.012073
1.012057
1.000072
1.003911
1.007913
1.010369
1.011669
1.012293
1.012527
1.012484
1.012144
1.011343
1.009729
1.020268
1.017555
1.016309
1.015721
1.015439
1.015302
1.015234
1.015199
1.000016
1.002517
1.005875
1.008021
1.009181
1.009759
1.010015
1.010076
1.009972
1.009651
1.008957
1.00759
1.024074
1.021229
1.019914
1.01929
1.018989
1.018841
1.018764
1.000279
1.001421
1.004126
1.005955
1.006965
1.00748
1.007724
1.007817
1.007809
1.007693
1.007411
1.006827
1.005693
1.028284
1.025315
1.023934
1.023275
1.022952
1.022785
1.00087
1.00063
1.002673
1.004181
1.005037
1.00548
1.005697
1.005793
1.005819
1.005787
1.00568
1.005445
1.004967
1.004051
1.032915
1.029829
1.028382
1.027681
1.027318
1.001801
1.000153
1.001524
1.002708
1.003405
1.003773
1.003957
1.004044
1.004078
1.004077
1.004042
1.003952
1.003764
1.003387
1.002673
1.037988
1.034781
1.033251
1.032467
1.003088
1
1.000688
1.001541
1.002079
1.002369
1.002516
1.002588
1.00262
1.00263
1.002621
1.00259
1.002521
1.002378
1.002096
1.001572
1.043508
1.040138
1.038439
1.004753
1.000185
1.000175
1.00069
1.001064
1.001275
1.001384
1.001439
1.001464
1.001475
1.001476
1.001467
1.001444
1.001396
1.001299
1.001109
1.000765
1.049421
1.045677
1.006839
1.000733
1
1.000167
1.000373
1.000502
1.000571
1.000607
1.000624
1.000632
1.000635
1.000634
1.000629
1.000616
1.000591
1.00054
1.000443
1.000273
1.055316
1.0095
1.001724
1.00021
1.000002
1.000025
1.000066
1.000093
1.000108
1.000115
1.000119
1.000121
1.000122
1.000122
1.000122
1.000123
1.000123
1.000123
1.000123
1.000123
0
5
10
15
20
0 5 10 15 20
Period
Clu
ste
r
Jess Kasza (Monash) Information content of SW cells 25 / 18