information retrieval and web search ir evaluation and ir standard text collections
TRANSCRIPT
Information Retrieval and Web Search
IR Evaluation and IR Standard Text Collections

Slide 2
Why System Evaluation?
•There are many retrieval models/ algorithms/ systems, which one is the best?
•What is the best component for:– Ranking function (dot-product, cosine, …)– Term selection (stopword removal, stemming…)– Term weighting (TF, TF-IDF,…)
•How far down the ranked list will a user need to look to find some/all relevant documents?

Slide 3
Why System Evaluations?(an example)
•From all the ranking schemes that are possible with given weighting/ranking schemes, which one has the best performance?
•We need to compare 16 different schemes.
•For a fair comparison:– Should be all evaluated on the same collection of
documents– Should be all evaluated on the same set of questions– Should be all evaluated using the same measures

Slide 4
Difficulties in Evaluating IR Systems
• Effectiveness is related to the relevancy of retrieved items.
• Relevancy is not typically binary but continuous.
• Even if relevancy is binary, it can be a difficult judgment to make.
• Relevancy, from a human standpoint, is:– Subjective: Depends upon a specific user’s judgment.– Situational: Relates to user’s current needs.– Cognitive: Depends on human perception and
behavior.– Dynamic: Changes over time.

Slide 5
Human Labeled Corpora (Gold Standard)
• Start with a corpus of documents.
• Collect a set of queries for this corpus.
• Have one or more human experts exhaustively label the relevant documents for each query.
• Typically assumes binary relevance judgments.
• Requires considerable human effort for large document/query corpora.

Slide 6
documents relevant of number Total
retrieved documents relevant of Number recall =
retrieved documents of number Total
retrieved documents relevant of Number precision =
Relevant documents
Retrieved documents
Entire document collection
retrieved & relevant
not retrieved but relevant
retrieved & irrelevant
Not retrieved & irrelevant
retrieved not retrieved
rele
vant
irre
leva
nt
Precision and Recall

Slide 7
Determining Recall is Difficult
•Precision vs. Recall:– Precision = The ability to retrieve top-ranked
documents that are mostly relevant.– Recall = The ability of the search to find all of the
relevant items in the corpus.
•Total number of relevant items is sometimes not available:– Sample across the database and perform relevance
judgment on these items.– Apply different retrieval algorithms to the same
database for the same query. The aggregate of relevant items is taken as the total relevant set.

Slide 8
Trade-off between Recall and Precision
10
1
Recall
Pre
cisi
on
The idealReturns relevant documents butmisses many useful ones too
Returns most relevantdocuments but includes lots of junk
Precision and Recall are inverse proportional

Slide 9
R=3/6=0.5; P=3/4=0.75
Computing Recall/Precision Points: An Example
n doc # relevant
1 588 x2 589 x3 5764 590 x5 9866 592 x7 9848 9889 57810 98511 10312 59113 772 x14 990
Let total # of relevant docs = 6Check each new recall point:
R=1/6=0.167; P=1/1=1
R=2/6=0.333; P=2/2=1
R=5/6=0.833; p=5/13=0.38
R=4/6=0.667; P=4/6=0.667
Missing one relevant document.
Never reach 100% recall

Slide 10
Interpolating a Recall/Precision Curve
•Interpolate a precision value for each standard recall level:– rj {0.0, 0.1, 0.2, 0.3, 0.4, 0.5, 0.6, 0.7, 0.8, 0.9, 1.0}– r0 = 0.0, r1 = 0.1, …, r10=1.0
•The interpolated precision at the j-th standard recall level is the maximum known precision at any recall level between the j-th and (j + 1)-th level:
)(max)(1
rPrPjj rrr
j+≤≤
=

Slide 11
Interpolating a Recall/Precision Curve: An Example
0.4 0.8
1.0
0.8
0.6
0.4
0.2
0.2 1.00.6 Recall
Prec
isio
n

Slide 12
Average Recall/Precision Curve
•Typically average performance over a large set of queries.
•Compute average precision at each standard recall level across all queries.
•Plot average precision/recall curves to evaluate overall system performance on a document/query corpus.
•Average:– Micro-average: average over all queries – Macro-average: average of within-query precision/recall
Slide 13
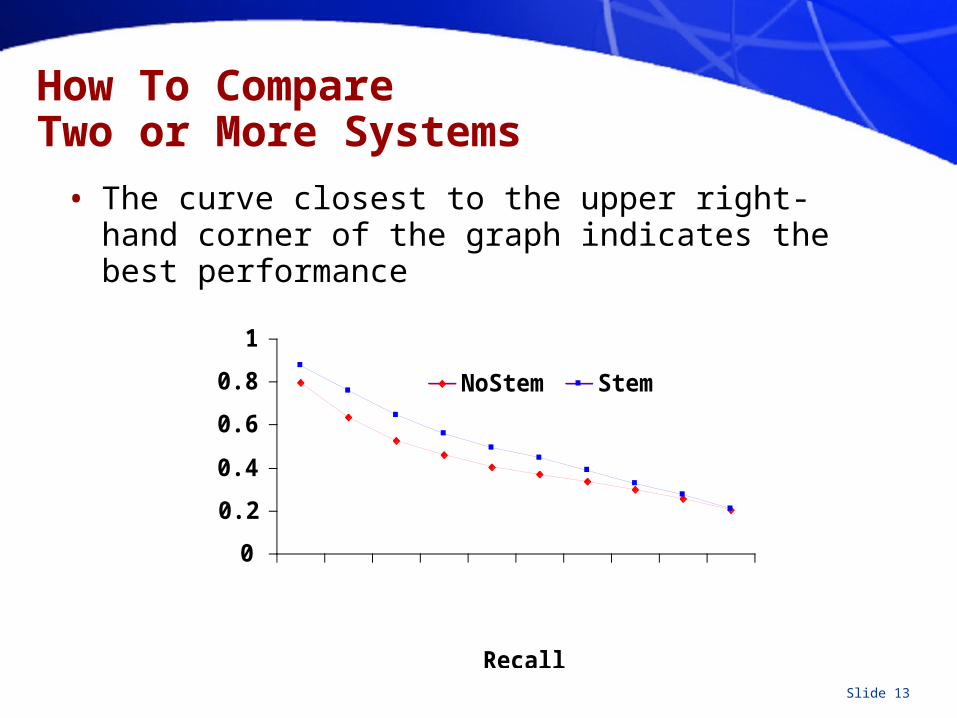
How To Compare Two or More Systems
• The curve closest to the upper right-hand corner of the graph indicates the best performance
0
0.2
0.4
0.6
0.8
1
0.1 0.2 0.3 0.4 0.5 0.6 0.7 0.8 0.91
Recall
Precision
NoStem Stem

Slide 14
Sample Recall/Precision Curve

Slide 15
R- Precision
•Precision at the R-th position in the ranking of results for a query that has R relevant documents.
n doc # relevant
1 588 x2 589 x3 5764 590 x5 9866 592 x7 9848 9889 57810 98511 10312 59113 772 x14 990
R = # of relevant docs = 6
R-Precision = 4/6 = 0.67

Slide 16
F-Measure
•One measure of performance that takes into account both recall and precision.
•Introduced by van Rijbergen, 1979
•Harmonic mean of recall and precision:
•Compared to arithmetic mean, both need to be high for harmonic mean to be high.
PRRP
PRF 11
22+
=+
=

Slide 17
E-Measure (parameterized F-Measure)
• A variant of F measure that allows
• weighting emphasis on precision over recall:
• Value of controls trade-off: = 1: Equally weight precision and recall (E=F). > 1: Weight precision more. < 1: Weight recall more.
PRRP
PRE
1
2
2
2
2
)1()1(
+
+=
++
=

Slide 18
Fallout Rate
• Problems with both precision and recall:– Number of irrelevant documents in the collection
is not taken into account.– Recall is undefined when there is no relevant
document in the collection.– Precision is undefined when no document is
retrieved.
collection the in items tnonrelevan of no. totalretrieved items tnonrelevan of no.
Fallout =
Slide 19
Average un-interpolated precision
•Primary method for evaluation for TREC routing sub-task
•Systems are assumed to return a ranked list of documents– Determine the precision at its position in the list for
each relevant document– Add these numbers up and divide by the total number of
relevant documents– May limit to max N documents (e.g. TREC uses top
1000)

Slide 20
False alarms / missed detections
•Traditionally used in Topic Detection and Tracking
correct Missed detection
False alarm correct
retrieved not retrieved
Rel
evan
t(t
arge
ts)
Irre
leva
nt(n
on-t
arge
t)
Targets of Number
Detections Missedof Number Pmiss =
Targets-Non of Number
Alarms False of Number Pfa =
= ?

Slide 21
Subjective Relevance Measure
• Novelty Ratio: The proportion of items retrieved and judged relevant by the user and of which they were previously unaware.– Ability to find new information on a topic.
• Coverage Ratio: The proportion of relevant items retrieved out of the total relevant documents known to a user prior to the search.– Relevant when the user wants to locate documents
which they have seen before (e.g., the budget report for Year 2000).
• User effort: Work required from the user in formulating queries, conducting the search, and screening the output.
• Response time: Time interval between receipt of a user query and the presentation of system responses.
Slide 22
Benchmarking
• Analytical performance evaluation is difficult for document retrieval systems because many characteristics such as relevance, distribution of words, etc., are difficult to describe with mathematical precision.
• Performance is measured by benchmarking. That is, the retrieval effectiveness of a system is evaluated on a given set of documents, queries, and relevance judgments.
• Performance data is valid only for the environment under which the system is evaluated.

Slide 23
Benchmarks
• A benchmark collection contains:– A set of standard documents and queries/topics.– A list of relevant documents for each query.
• Standard collections for traditional IR:– Smart collection: ftp://ftp.cs.cornell.edu/pub/smart– TREC: http://trec.nist.gov/
Standard document collection
Standard queries
Algorithm under test Evaluation
Standard result
Retrieved result
Precision and recall

Slide 24
Benchmarking The Problems
•Performance data is valid only for a particular benchmark.
•Building a benchmark corpus is a difficult task.
•Benchmark web corpora are just starting to be developed.
•Benchmark foreign-language corpora are just starting to be developed.

Slide 25
• Previous experiments were based on the SMART collection which is fairly small. (ftp://ftp.cs.cornell.edu/pub/smart)
Collection Number Of Number Of Raw Size Name Documents Queries (Mbytes)
CACM 3,204 64 1.5
CISI 1,460 112 1.3
CRAN 1,400 225 1.6
MED 1,033 30 1.1
TIME 425 83 1.5
• Most collections available from http://www.sigir.org
Early Test Collections

Slide 26
The TREC Benchmark
• TREC: Text REtrieval Conference (http://trec.nist.gov/) Originated from the TIPSTER program sponsored by Defense Advanced Research Projects Agency (DARPA).
• Became an annual conference in 1992, co-sponsored by the National Institute of Standards and Technology (NIST) and DARPA.
• Participants are given parts of a standard set of documents and TOPICS (from which queries have to be derived) in different stages for training and testing.
• Participants submit the P/R values for the final document and query corpus and present their results at the conference.

Slide 27
The TREC Objectives
• Provide a common ground for comparing different IR techniques.
– Same set of documents and queries, and same evaluation method.• Sharing of resources and experiences in developing the benchmark.
– With major sponsorship from government to develop large benchmark collections.
• Encourage participation from industry and academia.• Development of new evaluation techniques, particularly for new applications.
– Retrieval, routing/filtering, non-English collection, web-based collection, question answering.
Slide 28
TREC Advantages
• Large scale (compared to a few MB in the SMART Collection).
• Relevance judgments provided.
• Under continuous development with support from the U.S. Government.
• Wide participation:– TREC 1: 28 papers 360 pages.– TREC 4: 37 papers 560 pages.– TREC 7: 61 papers 600 pages. – TREC 8: 74 papers.

Slide 29
TREC Tasks
• Ad hoc: New questions are being asked on a static set of data.
• Routing: Same questions are being asked, but new information is being searched. (news clipping, library profiling).
• New tasks added after TREC 5 - Interactive, multilingual, natural language, multiple database merging, filtering, very large corpus (20 GB, 7.5 million documents), question answering.

Slide 30
Characteristics of the TREC Collection
• Both long and short documents (from a few hundred to over one thousand unique terms in a document).
• Test documents consist of:
WSJ Wall Street Journal articles (1986-1992) 550 M
AP Associate Press Newswire (1989) 514 M
ZIFF Computer Select Disks (Ziff-Davis Publishing) 493 M
FR Federal Register 469 M
DOE Abstracts from Department of Energy reports 190 M

Slide 31
Sample Document (with SGML)
<DOC> <DOCNO> WSJ870324-0001 </DOCNO> <HL> John Blair Is Near Accord To Sell Unit, Sources Say </HL> <DD> 03/24/87</DD> <SO> WALL STREET JOURNAL (J) </SO><IN> REL TENDER OFFERS, MERGERS, ACQUISITIONS (TNM)
MARKETING, ADVERTISING (MKT) TELECOMMUNICATIONS, BROADCASTING, TELEPHONE, TELEGRAPH (TEL) </IN>
<DATELINE> NEW YORK </DATELINE> <TEXT> John Blair & Co. is close to an agreement to sell its TV
station advertising representation operation and program production unit to an investor group led by James H. Rosenfield, a former CBS Inc. executive, industry sources said. Industry sources put the value of the proposed acquisition at more than $100 million. ...
</TEXT> </DOC>

Slide 32
Sample Query (with SGML)
<top> <head> Tipster Topic Description <num> Number: 066 <dom> Domain: Science and Technology <title> Topic: Natural Language Processing <desc> Description: Document will identify a type of natural
language processing technology which is being developed or marketed in the U.S.
<narr> Narrative: A relevant document will identify a company or institution developing or marketing a natural language processing technology, identify the technology, and identify one of more features of the company's product.
<con> Concept(s): 1. natural language processing ;2. translation, language, dictionary
<fac> Factor(s): <nat> Nationality: U.S.</nat></fac> <def> Definitions(s): </top>

Slide 33
TREC Properties
•Both documents and queries contain many different kinds of information (fields).
•Generation of the formal queries (Boolean, Vector Space, etc.) is the responsibility of the system.– A system may be very good at querying and ranking,
but if it generates poor queries from the topic, its final P/R would be poor.

Slide 34
Evaluation at TREC
• Summary table statistics: Number of topics, number of documents retrieved, number of relevant documents.
• Recall-precision average: Average precision at 11 recall levels (0 to 1 at 0.1 increments).
• Document level average: Average precision when 5, 10, .., 100, … 1000 documents are retrieved.
• Average precision histogram: Difference of the R-precision for each topic and the average R-precision of all systems for that topic.

Slide 35