information system improvement plan for water supply ... application/information system... ·...
TRANSCRIPT
Information System Improvement Plan for Water
Supply, Sewerage and Solid Waste Management
Sectors in Vadodara Draft
July 2014
Urban Management Centre
Performance Assessment System

ii
Prepared by Urban Management Centre (UMC)
July 2014
All photographs are by UMC unless otherwise mentioned.
Data from this document may be used and quoted with due
acknowledgement to the organization and the program.
The Urban Management Centre (UMC) is a women promoted
not-for-profit organization, that works towards professionalizing
urban management in India and worldwide. UMC provides
technical assistance and support to city governments and
facilitates change through peer-to-peer learning processes. It
enhances the capacity of city governments by providing expertise
and ready access to innovations on good governance
implemented in India and abroad. UMC extensively works in the
areas of urban water and sanitation, heritage management,
planning, urban health, municipal finance, urban management,
urban transportation and institutional restructuring. UMC is a
legacy organization of International City/County Management
Association (ICMA) and hence is also known as ICMA-South
Asia. For more information, visit our website: www.umcasia.org.
PAS, a seven-year action research project, has been initiated by
Centre for Environment Planning and Technology (CEPT)
University with funding from the Bill and Melinda Gates
Foundation. PAS aims to develop better information on water and
sanitation performance at the local level to be used to improve
the financial viability, quality and reliability of services. It uses
performance indicators and benchmarks on water and sanitation
services in all the 400-plus urban areas of Gujarat and
Maharashtra. Urban Management Centre (UMC) and the All India
Institute of Local Self Government (AIILSG) are CEPT
University’s project partners in Gujarat and Maharashtra,
respectively. More details are available on www.pas.org.in.

iii
In formation System Improvement Plan for
Water Supply, Sewerage and Solid Waste
Management Sectors in Vadodara Draft
July 2014
Prepared by
Urban Management Centre
Prepared under
Performance Assessment System

iv
Acknowledgements
Urban Management Centre (UMC) would like to thank Vadodara Mahanagar Seva Sadan for their
continuous support throughout the study. We wish to give a special mention to the following officers/
departments
- Municipal Commissioner
- Assistant Municipal Commissioner
- City Engineer
- Add. City Engineer
- SLB Nodal Officer
- Director IT, EDP Unit
- Ex. Engineer, Dy. Ex. Engineers, AE, AAE, Operators, Water Supply Dept.
- Ex. Engineer, Dy. Ex. Engineers, AE, AAE, Operators, Sewerage & Drainage Dept.
- Head of Dept., Solid Waste Management
- Chemist, Public Health Laboratory, VMSS
- Revenue Department
- Accounts Department
- Tax Department
- JnNURM Cell
- Private operators of various facilities such as water treatment plants, sewage treatment plants,
waste processing plants, scientific landfill site, door-to-door collection service, etc.
UMC would also like to thank the team at CEPT University, especially Prof. Meera Mehta and Prof.
Dinesh Mehta for their continuous support and guidance for completion of this study. UMC also
appreciates the work the efforts put in by its team members including Anurag Anthony, Arvind Singh,
Dhruvi Panchal, Hemal Patel, Kinjal Pillai, Meghna Malhotra, Urvi Patel, Vimal Sharma and Vinay
Patel.
Manvita Baradi
v
Preamble
Urban Management Centre (UMC) and Vadodara Mahanagar Seva Sadan (VMSS) signed a
Memorandum of Understanding (MoU) in July 2012 to prepare Information System Improvement Plan
(ISIP) for water supply, sewerage and solid waste management sectors in Vadodara based on the
Service Level Benchmarking (SLB) framework.
Under this MoU, UMC conducted a detailed assessment of the existing information system maintained
by water supply, sewerage and solid waste management (SWM) departments; and other departments
which provide data for calculation of SLB indicators, such as Electronic Data Processing (EDP) unit,
revenue, accounts and tax departments. This draft report is a work-in progress document and
presents draft recommendations, implementation plan and its budgetary requirements.
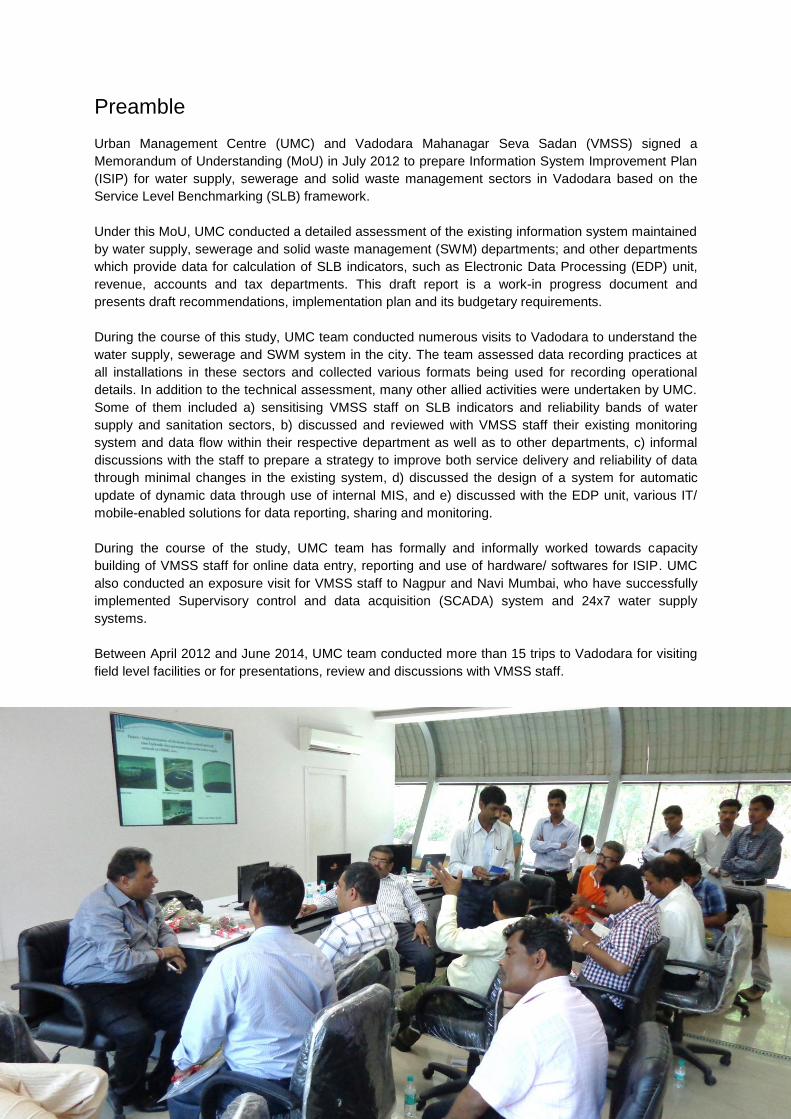
During the course of this study, UMC team conducted numerous visits to Vadodara to understand the
water supply, sewerage and SWM system in the city. The team assessed data recording practices at
all installations in these sectors and collected various formats being used for recording operational
details. In addition to the technical assessment, many other allied activities were undertaken by UMC.
Some of them included a) sensitising VMSS staff on SLB indicators and reliability bands of water
supply and sanitation sectors, b) discussed and reviewed with VMSS staff their existing monitoring
system and data flow within their respective department as well as to other departments, c) informal
discussions with the staff to prepare a strategy to improve both service delivery and reliability of data
through minimal changes in the existing system, d) discussed the design of a system for automatic
update of dynamic data through use of internal MIS, and e) discussed with the EDP unit, various IT/
mobile-enabled solutions for data reporting, sharing and monitoring.
During the course of the study, UMC team has formally and informally worked towards capacity
building of VMSS staff for online data entry, reporting and use of hardware/ softwares for ISIP. UMC
also conducted an exposure visit for VMSS staff to Nagpur and Navi Mumbai, who have successfully
implemented Supervisory control and data acquisition (SCADA) system and 24x7 water supply
systems.
Between April 2012 and June 2014, UMC team conducted more than 15 trips to Vadodara for visiting
field level facilities or for presentations, review and discussions with VMSS staff.

vi
Disclaimer
The objective of this assignment is to conduct an assessment of existing information system in water-
sanitation sectors in VMSS. In the course of the assignment, Urban Management Centre (UMC) was
provided with both written and verbal information supplemented by hand drawn sketches, archive
pictures, maps and drawings. Nothing has come to our attention to cause us to believe that the data or
maps provided by various sources are not true. All the information received is believed to be reliable,
and has not been independently verified by UMC.
Nothing contained herein, to the contrary and in no event shall UMC be liable for any loss of profit or
revenues and any direct, incidental, consequential damages incurred by any user of this document. In
case this document is to be made available or disclosed to any third party, this disclaimer along with
all the limiting factors must be issued to the concerned party. The fact that UMC assumes no liability
whatsoever, if for the reason any party is led to any loss for acting upon this document, must also be
brought to the notice of the concerned party.
Images used in this report are property of Urban Management Centre unless explicitly stated
otherwise. This assignment has been prepared by Urban Management Centre under the Performance
Assessment System program led by CEPT University and funded by Bill & Melinda Gates Foundation.

vii
List of Abbreviations
APS Auxiliary pumping station
C&D Construction and demolition
CPHEEO Central Public Health and Environmental Engineering Organisation
CTP Chief Town Planner
DCB Demand, Collection and Balance
DMA District Metering Area
EDP Electronic Data Processing
ESR Elevated Service Reservoir
GIS Geographical Information System
GPCB Gujarat Pollution Control Board
GPS Global Positioning System
HH Household
ISIP Information System Improvement Plan
IT Information technology
MLD Million litres a day
MoUD Ministry of Urban Development
MSW Municipal Solid Waste
MT Metric Tons
NMMC Navi Mumbai Municipal Corporation
NRW Non-revenue water
O&M Operation and maintenance
PAS Performance Assessment System
PGR Public Grievance Redressal
RC Residual chlorine
SCADA Supervisory control and data acquisition
SLB Service Level Benchmarking
STP Sewage Treatment Plant
SWM Solid Waste Management
UCD Urban Community Development
ULB Urban local body
UMC Urban Management Centre
VMSS Vadodara Mahanagar Seva Sadan
WDS Water distribution station
WTP Water treatment plant

viii
Table of Contents
1. Introduction to Service Level Benchmarking ................................................................................. 1
2. Need for Information System Improvement Plan in Vadodara .................................................... 3
2.1. Methodology ........................................................................................................................................ 5
2.2. Limitations of the study ...................................................................................................................... 6
3. About Vadodara Mahanagar Seva Sadan ........................................................................................ 7
4. Water supply ....................................................................................................................................... 11
4.1. Existing water supply system in Vadodara ................................................................................... 11
4.2. Existing information system in water supply ................................................................................. 14
4.3. Data generation, recording and transfer practices in VMSS – gaps and recommendations . 19
5. Sewerage ............................................................................................................................................. 36
5.1. Existing sewerage system in Vadodara......................................................................................... 36
5.2. Existing information system in sewerage ...................................................................................... 37
5.3. Data generation, recording and transfer practices in VMSS – gaps and recommendations . 42
6. Solid waste management ................................................................................................................. 53
6.1. Existing solid waste management system in Vadodara .............................................................. 53
6.2. Existing information system in solid waste management ........................................................... 56
6.3. Data generation, recording and transfer practices in VMSS – gaps and recommendations . 60
7. Summary of recommendations and its implementation ............................................................ 73
8. Way forward ........................................................................................................................................ 80
Bibliography .................................................................................................................................................... 81
Annexures ....................................................................................................................................................... 82

1
1. Introduction to Service Level Benchmarking
Benchmarking is an important mechanism for introducing accountability in service delivery. It
involves measuring and monitoring of service providers performance on a systematic and
continuous basis. Sustained benchmarking can help utilities to identify performance gaps
and introduce improvements through the sharing of information and best practices, ultimately
resulting in better services to people. This initiative has been undertaken by the Ministry of
Urban Development (MoUD), Government of India as ‘Service Level Benchmarking’ (SLB)
covering water, sanitation, solid waste management (SWM) and storm water drainage
sectors. For the purposes of this Information System Improvement Plan (ISIP), water supply,
waste water, storm water drainage and solid waste management sectors have been taken
up.
The framework encompasses the following indicators:
1. Water Supply
1.1. Coverage of water supply connections
1.2. Per capita supply of water
1.3. Extent of metering of water connections
1.4. Extent of non-revenue water
1.5. Continuity of water supply
1.6. Efficiency in redressal of customer complaints
1.7. Quality of water supplied
1.8. Cost recovery in water supply services
1.9. Efficiency in collection of water supply related charges
2. Sewerage & Sanitation
2.1. Coverage of Toilets
2.2. Coverage of waste water network services
2.3. Collection efficiency of waste water network
2.4. Adequacy of waste water treatment capacity
2.5. Quality of waste water treatment
2.6. Extent of reuse and recycling of waste water
2.7. Extent of cost recovery in waste water
2.8. Efficiency in redressal of customer complaints
2.9. Efficiency in collection of sewerage related charges
3. Solid Waste Management
3.1. Household level coverage of Solid Waste Management services
3.2. Efficiency of collection of municipal solid waste
3.3. Extent of segregation of municipal solid waste
3.4. Extent of municipal solid waste recovered
3.5. Extent of scientific disposal of municipal solid waste
3.6. Extent of cost recovery in Solid Waste Management services
3.7. Efficiency in redressal of customer complaints
3.8. Efficiency in collection of SWM related user charges

2
4. Storm Water Drainage
4.1. Coverage of Storm Water Drainage network
4.2. Incidence of water logging/ flooding
It is important that all cities maintain reliable data about their service delivery and assets for
efficient management of the same. Hence, for each of the above indicators, MoUD provides
data reliability grading scale. This scale rates the indicators as A, B, C or D based on the
parameters laid down for each indicator value in the SLB Handbook prepared by MoUD
(Ministry of Urban Development, 2009).

3
2. Need for Information System Improvement Plan in Vadodara
Vadodara Mahanagar Seva Sadan (VMSS) is one of the progressive urban local body (ULB)
in Gujarat. It is the third largest city in the state. VMSS has undertaken many initiatives in the
recent past to improve municipal service delivery, especially in water supply, sewerage and
SWM sectors.
Some of these initiatives include infrastructural improvements such as water and sewage
collection network expansion, augmentation of water treatment capacity, augmentation of
sewage treatment capacity, increasing door-to-door municipal solid waste collection (MSW)
and setting-up of MSW processing plants.
To ensure efficient use of the infrastructure, VMSS has implemented reforms to improve its
information systems and hence, initiate informed decision making process at the operational
level. Once such example is geographical positioning system (GPS) based real-time
monitoring of SWM vehicular fleet. Similarly, VMSS has shown keen interest in improving
information collection, storage, transfer and reporting mechanisms in water supply, sewerage
and SWM sectors.
Navi Mumbai Municipal Corporation (NMMC) has implemented fully automated supervisory
control and data acquisition (SCADA) system in water supply and Nagpur Municipal
Corporation (NMC) has implemented 24x7 water supply in a demonstration zone of Nagpur.
In order to provide a first-hand experience to city officials, Urban Management Centre (UMC)
conducted an exposure visit to NMMC and NMC for officials of VMSS and municipalities of
Kalol, Kadi, Himmatnagar and Mehsana.

4
VMSS has shown keen interest in implementation of SCADA system in water supply in a
pilot zone. VMSS is also exploring implementing 24x7 water supply in the same area.
Motivated by the exposure visit, VMSS prepared a detailed project report (DPR) for
implementing SCADA system and 24x7 water supply in the city. VMSS has already engaged
implementing agency to initiate work in a pilot area.
Based on the learnings from the exposure visit, VMSS also recognised that implementation
of a full scale city wide SCADA system may take anywhere between 3 to 10 years. Hence,
VMSS feels that it is necessary to streamline the current data collection, transfer, analysis
and reporting systems (in water supply, sewerage and SWM) in Vadodara. This would not
only be useful in implementing SCADA but would also improve service delivery under the
current system.
Based on VMSS’ future plans and their existing data systems, UMC outlined the aim of this
ISIP as:
Improve data recording1, transfer, analysis and reporting mechanism of VMSS for
water supply, sewerage and solid waste management sectors.
1 Recording data while improving its reliability as per SLB definitions.

5
2.1. Methodology Under this ISIP, information recording, its transfer, analysis and reporting system of VMSS
has been studied for water supply, sewerage and SWM systems. The improvements in the
same have been undertaken with minimal intervention – both infrastructural and procedural.
The work conducted under this ISIP can be divided in the following 5 stages:
Stage 1: Existing situation assessment of data recording, processing/usage and
reporting in water supply, sewerage and SWM sectors
Stage 2: Identification of gaps in existing information system in VMSS
Stage 3: Assessment of use of data gathering/ measuring devices/ equipment required
at various installations of water-sanitation utilities
Stage 4: Assessment of field facilities related to water-sanitation utilities where data is generated or should be generated to fulfil SLB requirements. The assessment includes
i. Availability of computers
ii. Availability of connectivity to VMSS head office
iii. Availability of staff trained in basic use of computer application (such
as MS Office and web browsing)
Stage 5: Recommending interventions in three categories
i. Design of existing and new forms for gathering data; including surveys
wherever required
ii. Installation of measuring equipment at various locations at appropriate
iii. Training and capacity building of staff for implementation of ISIP
6
2.2. Limitations of the study
UMC encountered several limitations while preparing ISIP for VMSS in water-sanitation
sectors as per the SLB framework. UMC modified the SLB framework to suit the existing
condition of information systems in Vadodara. These limitations and modifications have been
listed below.
- This study has been conducted with the focus on improving reliability of SLB
indicators in Vadodara only. The framework may or may not be applicable to other
cities in its current form.
- The study has accepted the ‘Handbook of Service Level Benchmarking’ prepared by
MoUD as a general guide. For preparation of ISIP in Vadodara, this study suggests
revisions in ‘Minimum frequency of measurement of performance indicator’ and
‘Smallest geographical for measurement of performance indicator’ for some
indicators. The respective sections have been highlighted wherever SLB norms for
these 2 parameters have been revised for Vadodara.
- VMSS has recently initiated consumer metering in newly covered areas (by water
supply distribution network). There is lack of clarity within VMSS regarding consumer
metering in the existing water supply connections. Hence, for the purposes of this
study, reliability improvement for the SLB indicator ‘Extent of metering of water
connections’, has not been undertaken.
- Based on the study, UMC concludes that for implementation of ISIP, installation of
bulk flow meters is absolutely necessary at all bulk water production, treatment and
distribution points for water supply and inlets & outlets of all STP units. However,
errors arising out of malfunction of meters have not been considered.
- It is assumed that linemen, pump operators, engineers and other relevant staff of
VMSS would fill forms (both manual as well as digital) diligently. Any inconsistencies
in filling of the forms by staff would not be reflected in the reliability of SLB indicators.
- UMC found that many forms contain column/ row heads to capture information which
may not be relevant in the present context. UMC has not removed or modified such
columns/ rows and retained them as-it-is. Any modifications and/ or additions have
been done purely for the purposes of ISIP.
- Storm water drainage sector has not been covered under this study.
7
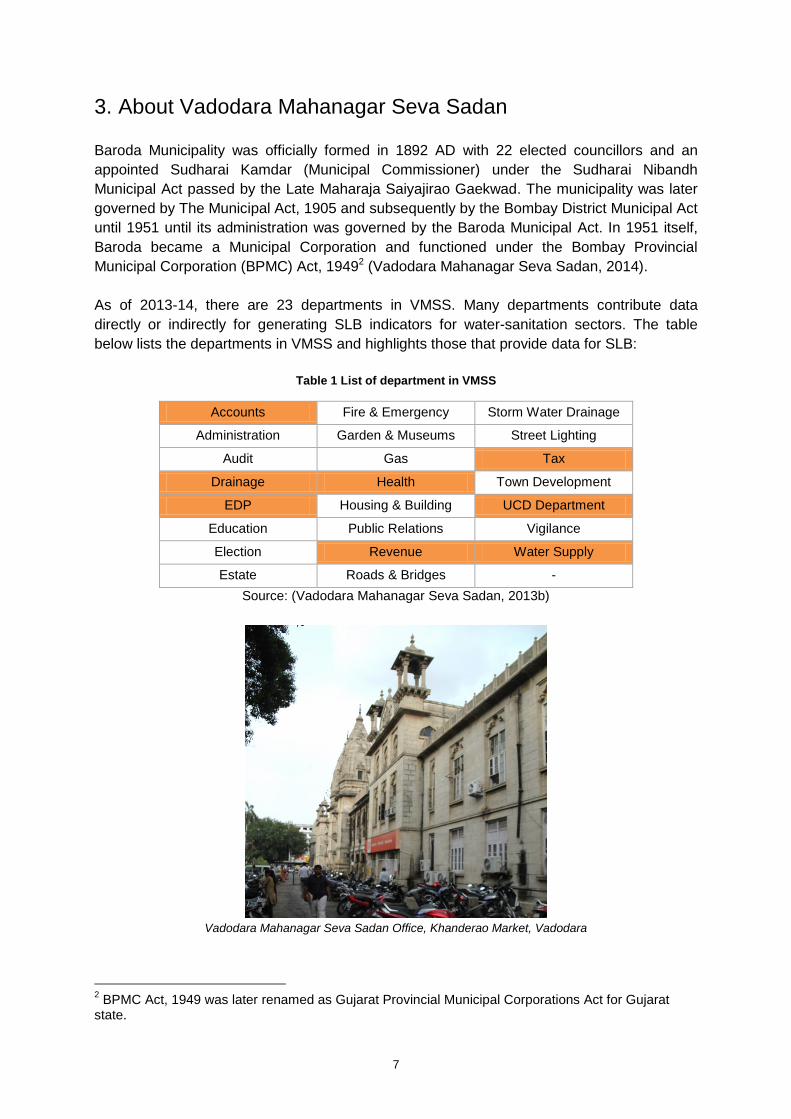
3. About Vadodara Mahanagar Seva Sadan
Baroda Municipality was officially formed in 1892 AD with 22 elected councillors and an
appointed Sudharai Kamdar (Municipal Commissioner) under the Sudharai Nibandh
Municipal Act passed by the Late Maharaja Saiyajirao Gaekwad. The municipality was later
governed by The Municipal Act, 1905 and subsequently by the Bombay District Municipal Act
until 1951 until its administration was governed by the Baroda Municipal Act. In 1951 itself,
Baroda became a Municipal Corporation and functioned under the Bombay Provincial
Municipal Corporation (BPMC) Act, 19492 (Vadodara Mahanagar Seva Sadan, 2014).
As of 2013-14, there are 23 departments in VMSS. Many departments contribute data
directly or indirectly for generating SLB indicators for water-sanitation sectors. The table
below lists the departments in VMSS and highlights those that provide data for SLB:
Table 1 List of department in VMSS
Accounts Fire & Emergency Storm Water Drainage
Administration Garden & Museums Street Lighting
Audit Gas Tax
Drainage Health Town Development
EDP Housing & Building UCD Department
Education Public Relations Vigilance
Election Revenue Water Supply
Estate Roads & Bridges -
Source: (Vadodara Mahanagar Seva Sadan, 2013b)
Vadodara Mahanagar Seva Sadan Office, Khanderao Market, Vadodara
2 BPMC Act, 1949 was later renamed as Gujarat Provincial Municipal Corporations Act for Gujarat
state.

8
The following organogram shows head of various departments in VMSS. Figure 1 Organogram of VMSS
3
Source: (Vadodara Mahanagar Seva Sadan, No Year)
As highlighted in the Organogram, the relevant departments for ISIP include Electronic Data
Processing (EDP) Unit, accounts and offices of Executive Engineers for water supply,
drainage and SWM departments. Other relevant departments include Urban Community
Development (UCD) and town planning.
Each department provides relevant data for computation of SLB indicators. These have been
shown in the diagram below.
3 Storm water drainage and solid waste management has not been included in this study and hence,
the relevant departments have not been highlighted.
9
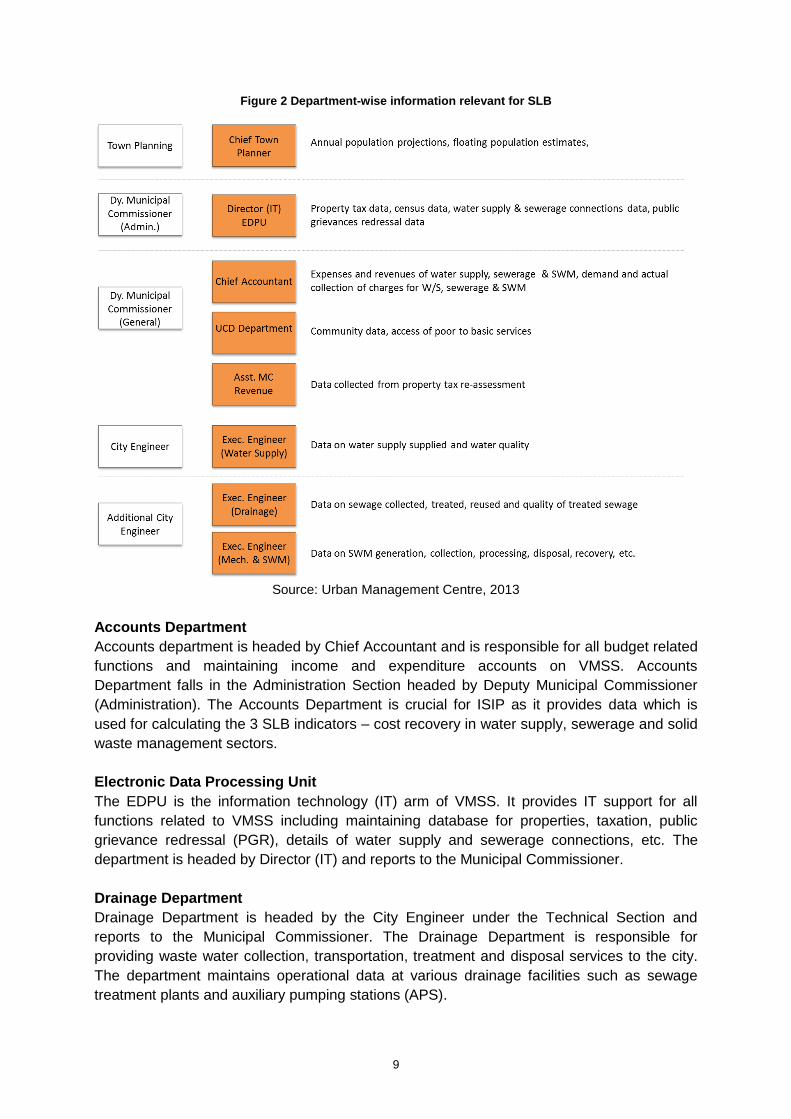
Figure 2 Department-wise information relevant for SLB
Source: Urban Management Centre, 2013
Accounts Department
Accounts department is headed by Chief Accountant and is responsible for all budget related
functions and maintaining income and expenditure accounts on VMSS. Accounts
Department falls in the Administration Section headed by Deputy Municipal Commissioner
(Administration). The Accounts Department is crucial for ISIP as it provides data which is
used for calculating the 3 SLB indicators – cost recovery in water supply, sewerage and solid
waste management sectors.
Electronic Data Processing Unit
The EDPU is the information technology (IT) arm of VMSS. It provides IT support for all
functions related to VMSS including maintaining database for properties, taxation, public
grievance redressal (PGR), details of water supply and sewerage connections, etc. The
department is headed by Director (IT) and reports to the Municipal Commissioner.
Drainage Department
Drainage Department is headed by the City Engineer under the Technical Section and
reports to the Municipal Commissioner. The Drainage Department is responsible for
providing waste water collection, transportation, treatment and disposal services to the city.
The department maintains operational data at various drainage facilities such as sewage
treatment plants and auxiliary pumping stations (APS).

10
Solid Waste Management Department
SWM Department is headed by an Environmental Engineer and reports to the Assistant
Municipal Commissioner. SWM Department maintains all data relevant to their operations
and monitors performance of private contractors engaged to assist VMSS.
Town Planning Department
The Town Planning Department headed by a Chief Town Planner (CTP) is responsible for
planning Town Planning (TP) Schemes in the city. In addition to the TP Schemes, the
department is mandated with preparation of the statutory development plan for Vadodara
city. However, in practice, Vadodara Urban Development Authority undertakes this activity.
Urban Community Development Department
Urban Community Development (UCD) Department takes care of the community facilities
including activities related to development of slums and their access to water-sanitation
services.
Water Supply Department
This department is headed by the City Engineer. For functional purposes, activities under this
department are divided as ‘operations and maintenance’ (O&M), and ‘projects’. Each vertical
is headed by an Executive Engineer. Executive Engineer for O&M generates and maintains
water supply related operational data.
The following section presents analysis of existing information system in water supply,
sewerage and SWM sectors. Each sector is assessed for its existing data flow including
- location of data generation (field location, office, etc.)
- frequency of data recording
- method of recording (paper based or electronic)
- suitability of formats used for data recording
- data reporting frequency and mode of transfer
- basic assessment of staff capacity and IT infrastructure at field level facilities

11
4. Water supply
4.1. Existing water supply system in Vadodara
A stage wise break-up of the existing water supply system in Vadodara has been shown in
the following sections.
Demand
Vadodara Mahanagar Seva Sadan (VMSS) has a population of 17,12,699 as per the Census
of India 2011. VMSS caters to around 3.18 lakh households out of a total of 4.07 lakh
households through 2.6 lakh residential connections approximately (Vadodara Mahanagar
Seva Sadan, 2013a). Presently, Vadodara needs 231 MLD to serve the entire population of
the city for domestic supply. There are no estimates of the industrial and commercial demand
of water in Vadodara, but based on the discussions with VMSS staff, an estimated 150 MLD
is needed apart from the domestic demand.
Water sources
Against a demand of 231 MLD, VMSS currently supplies 401.8 MLD including bulk supply to
industries and commercial establishments. VMSS produces water from the following
sources:
- Sayaji Sarovar (surface source)
- 4 French wells at River Mahi (ground water)
- 23 tubewells in the bed of River Mahi (ground water)
- 80 borewells within the city (ground water)
All of the above sources are perennial in nature and suffice the city’s current needs. To
provide for the expansion of the city, VMSS has proposed augmentation of existing sources
and would be sourcing water from the Narmada canal in the future. VMSS is building
infrastructure to treat water to be sourced from Narmada canal in the future. This source is
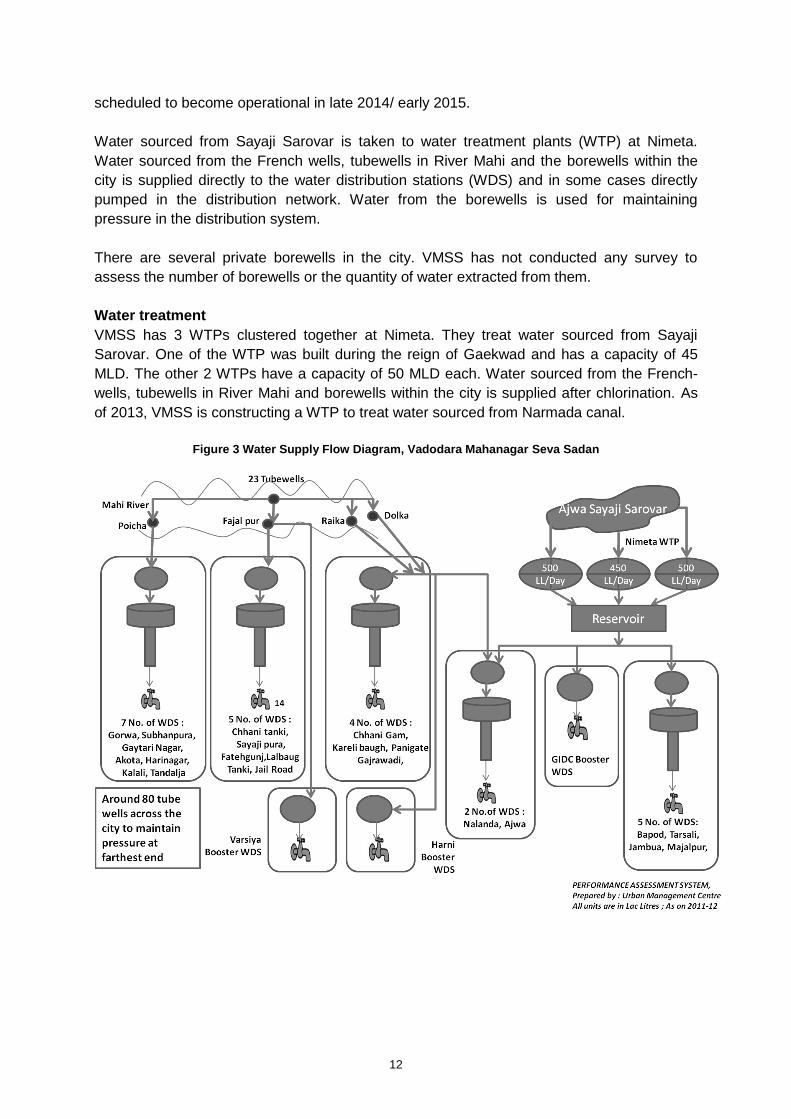
12
scheduled to become operational in late 2014/ early 2015.
Water sourced from Sayaji Sarovar is taken to water treatment plants (WTP) at Nimeta.
Water sourced from the French wells, tubewells in River Mahi and the borewells within the
city is supplied directly to the water distribution stations (WDS) and in some cases directly
pumped in the distribution network. Water from the borewells is used for maintaining
pressure in the distribution system.
There are several private borewells in the city. VMSS has not conducted any survey to
assess the number of borewells or the quantity of water extracted from them.
Water treatment
VMSS has 3 WTPs clustered together at Nimeta. They treat water sourced from Sayaji
Sarovar. One of the WTP was built during the reign of Gaekwad and has a capacity of 45
MLD. The other 2 WTPs have a capacity of 50 MLD each. Water sourced from the French-
wells, tubewells in River Mahi and borewells within the city is supplied after chlorination. As
of 2013, VMSS is constructing a WTP to treat water sourced from Narmada canal.
Figure 3 Water Supply Flow Diagram, Vadodara Mahanagar Seva Sadan

13
Water distribution
VMSS supplies water from various sources using 27 existing WDS covering nearly all
urbanised areas of the city. VMSS is constructing 4 new WDS and expanding its distribution
network. The treated water supplied from WTPs is stored in a balance reservoir which in-turn
feeds several WDS in the city. A list of all WDS in Vadodara has been provided in Annexure
1 and shown on a map in Annexure 2.
Each WDS serves around 3 to 5 district metering areas (DMA) commonly referred to as
localities. Supply operation valves are located in and around the WDS and are operated by
the linemen for regulating supply to command area.
In all, there are 2.65 lakh municipal water supply connections out of which around 2.50 lakh
are domestic individual connections serving around 3.22 lakh households. Rest of the
population is served through public stand-posts and private water sources such as tankers
and private borewells.
WDS, Water Supply System, Vadodara

14
4.2. Existing information system in water supply
This section presents an analysis of existing information system in water supply in VMSS. To
analyse data generation, UMC conducted field visits at all installations in water supply
including sources, intermediate storage facilities, water treatment plants and water
distribution stations. In addition, UMC conducted discussions with all levels of staff working in
operation and maintenance of water supply. An overview of the data provided by each
department for generating water supply indicators has been provided in the figure below.
Figure 4 Department-wise information sources for generating SLB indicators
Source: Urban Management Centre, 2013
During the visits, the team collected data recording formats (maintained as logbooks) at all
facilities. Based on the data collected during 2012-13 for Performance Assessment System
(PAS) program, the water supply SLB indicators for VMSS were as below:

15
Table 2 Performance indicators of VMSS in water supply as per the SLB framework
S. No Water supply indicator values Unit FY 2012-13
1 Coverage of water supply connections % 78
2 Per capita available of water at consumer end Lpcd 156
3 Extent of metering of water connections % 3
4 Extent of non-revenue water % 32
5 Continuity of water supply Hours/ day 1.00
6 Efficiency in redressal of customer complaints % 97
7 Quality of water supplied % 99
8 Cost recovery in water supply services % 49
9 Efficiency in collection of water supply related charges % 91
Source: (PAS, 2013)
To conduct assessment of data collation or summarisation and its reporting to higher
officials, UMC tracked the flow of information from various facilities to VMSS head office as
well as to Harni Tanki – the main data centre for water supply.
The analysis conducted for water supply’s existing information system has been presented
using the following:
- Water supply flow diagram
- Information flow diagram from various facilities related to water supply to the zonal
and main offices of VMSS
- Gap analysis in existing information system clearly identifying data not generated/
recorded and recommendations to capture such data
- Gap analysis in existing data recording formats and recommendations to fulfil them as
per SLB framework
While providing recommendations, UMC’s approach has been to make minimal modifications
in the existing formats. Recommendations provided by UMC to fill data gaps include
a) new formats
b) minor modifications to existing formats
c) computerisation of data and defining its flow
d) outlining equipment and manpower requirements for filling in the data gaps and
improving reliability bands
A detailed assessment of the information system reveals that information should be collected from several field locations and administrative offices within VMSS as shown below.
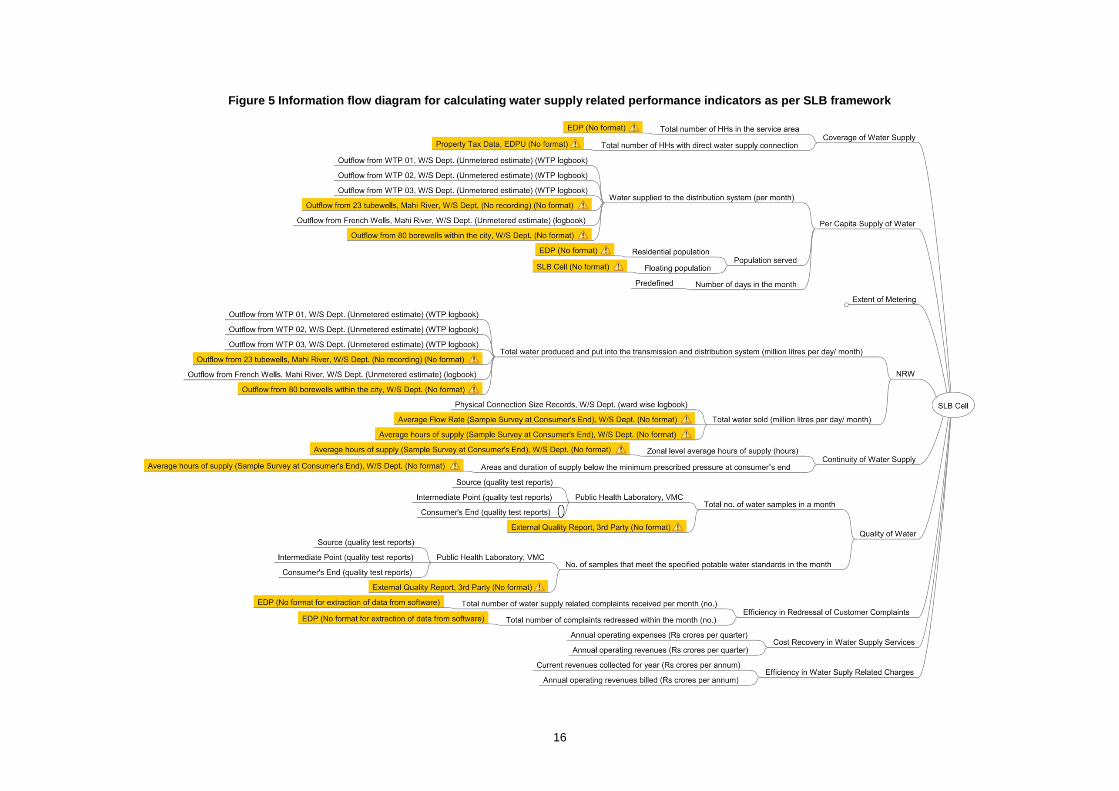
16
Figure 5 Information flow diagram for calculating water supply related performance indicators as per SLB framework
17
In the above diagram, the data sets highlighted are the ones which are not recorded by
VMSS. Some data from the highlighted sets requires additional infrastructure, studies or
surveys to be generated.
Summary of recommendations for improvement of water supply information system
For the purposes of ISIP, new formats have been proposed in the subsequent sections for
data sets which are generated by not recorded. This ISIP also proposes format required to
capture information through proposed surveys, studies and recording using the proposed
infrastructure.
Process improvements, studies and surveys proposed
The following process improvements, studies and surveys have been recommended:
General (departments other than water supply)
1. Digitise complaints logbooks placed at various ward offices and water supply
facilities in the city. Alternatively, where manual registers are maintained, a
computer should be installed and connected to the main online complaints
system of VMSS.
2. Accrual based double-entry accounting system should be adhered to strictly in
order to ascertain actual expenses and revenues for each year.
3. Sharing of staff, machinery & equipment and consumables (such as fuel, spares,
etc.) should be well documented and expenses incurred should be accounted for
respective department/ work proportionately.
Water Supply Department
4. Conduct a sample survey at consumers’ end to assess the quantity of water
reaching the consumers, duration of supply and pressure at which the water is
supplied to the consumer. The sampling methodology has been suggested in
‘Indicator 1.5: Continuity of water supply’ in the following section.
5. Water quality testing regime should be calculated based on CPHEEO norms.
UMC has designed an MS Excel based tool to prepare the regime. Based on this
tool, VMSS should conduct location-wise and type-wise quality testing. The
details of tests to be conducted have been provided in ‘Indicator 1.6: Quality of
water supplied’.
6. VMSS should get an independent periodic water quality assessment conducted.
7. The CTP, Town Planning Department at VMSS should prepare estimates of the
floating population for the city.
Infrastructure proposed
In addition to the above forms, the following infrastructural improvements have been
recommended:
1. Installation of 113 bulk flow meters at all bulk water production points including
a. Four French wells at River Mahi
b. Twenty three tubewells along River Mahi
c. Eighty borewells within the city
d. Inlet and outlets of all WTPs
2. Purchase of 242 portable meters and pressure gauges for conducting survey of
water quantity, duration of supply and pressure head at consumers’ end

18
Forms proposed
S. No. Proposed/
Modified
Form No. Title of the form
1. Proposed Form GE01 Households, properties and establishment details
2. Proposed Form GE02 Complaints received and redressed
3. Proposed Form WS01 Bulk flow meter readings
4. Proposed Form WS02 Quantity, duration and pressure of water at consumers’ end
5. Proposed Form WS03 Summary of quality of water
Indicator-wise details including gaps and recommendations have been discussed in the
following section.

19
4.3. Data generation, recording and transfer practices in VMSS –
gaps and recommendations
VMSS captures data from various facilities through logbooks. Central office of the water
supply department (housed in the main VMSS building at Khanderao Market) collates some
of the data captured from various installations. The data collated includes daily production of
water from all sources (except 80 borewells within the city) and circulates this information to
the Executive Engineer (Electrical & Mechanical) and City Engineer.
While some data is collated and used by engineers in water supply department for
operations, a large volume of data is never collated or reviewed to contribute in decision-
making process. As per the SLB framework, some data is partially captured or not captured
at all by VMSS. In many cases, UMC observed that the formats used by VMSS to capture
operational details carry redundant information which could be removed to make the forms
simpler and user friendly4.
UMC team at WDS, Vadodara
The data recording practices are also non-uniform in many cases. In many cases, transfer of
data does not take place and the registers are archived without being digitised or its data
being used.
In addition to water supply department, the SLB framework requires data from other
departments typically including accounts, information technology, slums, tax, revenue and
public health laboratory.
4 As mentioned in the Limitations of the study, redundant information from the formats has not been
removed.

20
The following section analyses existing forms used by VMSS to record data required for
generation of water supply related SLB indicators. The analysis also identifies practices
adopted by VMSS to capture data, local collation/ summarisation/ totalling, data transfer, city
level collation & reporting and review & decision making processes for water supply. The
analysis has been conducted indicator-wise.
Indicator 1.1: Coverage of water supply connections
This indicator measures the number of households which are connected to the piped
municipal water supply network against the total number of households in the city. This
indicator is calculated using the following formula:
Coverage of
water supply
connections
=
Total no. of HHs with direct water connections
X 100 Total no. of HHs in the service area
Minimum frequency of measurement : Quarterly Annually5
Smallest geographical jurisdiction for measurement : Zone/ DMA Level
Total no. of HHs with direct water connections
EDP Department, VMSS maintains data regarding the total number of water supply
connections. Ward offices of VMSS maintain a manual register of new connections provided
during the year. Ward offices in the west zone have migrated to using a computer software
‘Connection Management Centre’ for receiving, forwarding and submitting applications for
new water supply and sewerage connections. This software is linked with EDP Department
and feeds the data as and when updated. However, data from ward offices in other zones is
collated annually (and not quarterly as demanded by SLB framework) in accordance with the
property tax billing cycle of VMSS.
Total no. of HHs in the service area
Currently, no department/ officer maintains and updates population (and households) data
on a yearly basis in VMSS. Each department projects population for preparing their
respective DPRs. UMC believes that Officer on Special Duty (OSD) Census or Town
Planning Officer is best suited to project demographic data for the city periodically.
VMSS calculates this indicator based on data from the above 2 sources. Based on this
method, the indicator falls in reliability scale ‘B’. In order to achieve reliability scale ‘A’,
periodic surveys should be done to ascertain the exact number of households within the
municipal area. In addition, new building units approved and constructed should be updated
periodically in the database with respective water connection information.
Recommendations
In order to achieve reliability scale A, the actual number of households with direct service
connections (for which data are maintained) and the total number of households should be
obtained as per a ground survey.
5 SLB framework recommends calculating this indicator quarterly. However, based on the field
experience, UMC recommends this indicator to be monitored annually.

21
UMC has designed a form for recording this information. The form has been presented
below.
Proposed Form GE01: Households, properties and establishment details
Information relevant for this indicator has been highlighted in Form GE01. ‘Total number of
households in service area’ is to be obtained from the proposed household survey. ‘Total
number of households served with individual water supply connection’ should be taken from
the property tax database6.
UMC believes that quarterly change in the number of connections in VMSS would not be
crucial to monitor. Hence, VMSS could measure this indicator annually instead of quarterly
as suggested by the SLB handbook.
Indicator 1.2: Per capita supply of water
This indicator provides an overall indication of adequacy of water for every citizen in the city.
This indicator measures the water supplied into the distribution system after treatment in a
month and divided by the population of the city. The indicator is then divided by the number
of days in the month to arrive at litres per capita per day. The formula for this indicator is
expressed as:
Per capita
supply of
water
=
(Water supplied to the distribution system in
a month / Number of days in a month)
Population served
Minimum frequency of measurement : Quarterly
Smallest geographical jurisdiction for measurement : Zone/ DMA Level
6 For the purposes of this ISIP, it is assumed that 1 property houses 1 household.

22
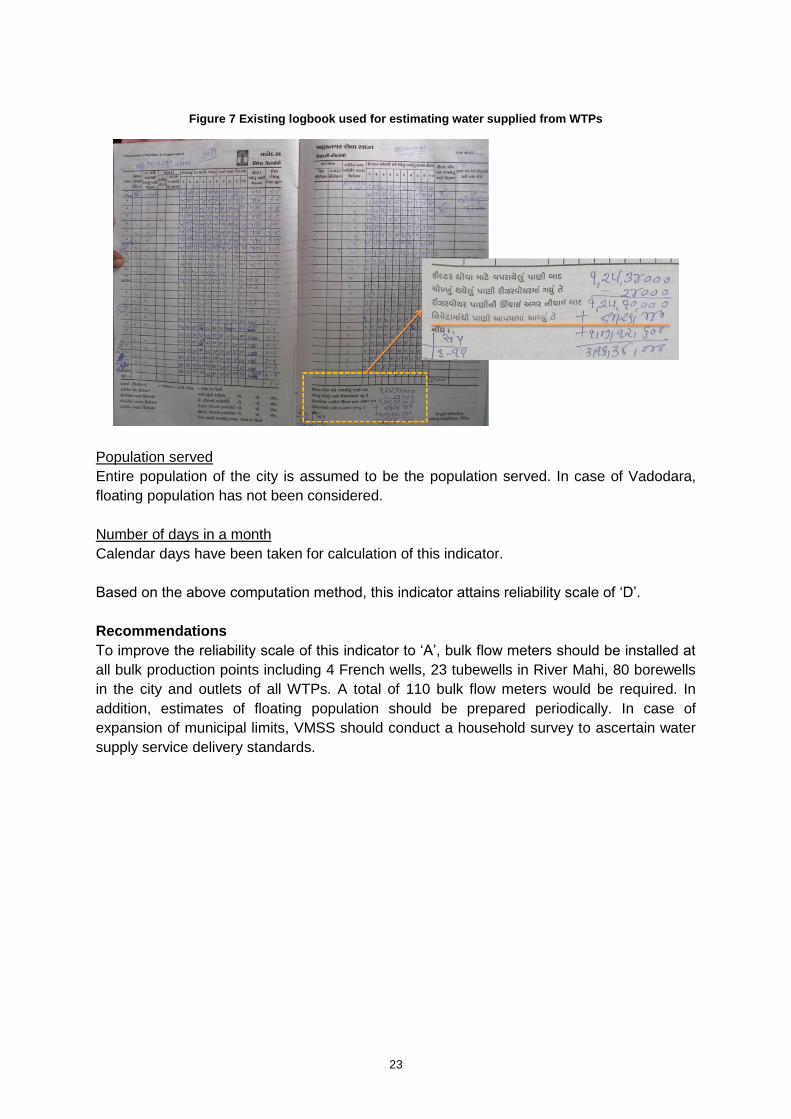
Water supplied to the distribution system
This data can be calculated by taking the sum of water produced from all ground water
sources and treated water pumped out from the WTPs. In Vadodara, water produced from
ground water sources – 4 French wells and 23 tubewells in River Mahi are estimated based
on pumping hours and designed pump capacity. Logbooks are not maintained for capturing
the water produced from the 23 borewells. The format used for recording water produced by
the French wells has been provided in the figure below.
Figure 6 Existing logbook used for estimating water supplied from WTPs
Operational details of 80 borewells in the city are not recorded and hence the water
produced from this source is not estimated. Water produced from surface source (Ajwa
Dam) is treated at 3 WTPs at Nimeta. None of the WTPs have flow meters installed at the
outlet of the plant. At 1 WTP, flow meter is installed at the inlet of the plant. During UMC’s
visit in June April 2013, the meter was not functional. At the remaining 2 WTPs, water
quantity pumped into the distribution system is estimated based on pumping capacity and
the duration of operation.
23
Figure 7 Existing logbook used for estimating water supplied from WTPs
Population served
Entire population of the city is assumed to be the population served. In case of Vadodara,
floating population has not been considered.
Number of days in a month
Calendar days have been taken for calculation of this indicator.
Based on the above computation method, this indicator attains reliability scale of ‘D’.
Recommendations
To improve the reliability scale of this indicator to ‘A’, bulk flow meters should be installed at
all bulk production points including 4 French wells, 23 tubewells in River Mahi, 80 borewells
in the city and outlets of all WTPs. A total of 110 bulk flow meters would be required. In
addition, estimates of floating population should be prepared periodically. In case of
expansion of municipal limits, VMSS should conduct a household survey to ascertain water
supply service delivery standards.
24
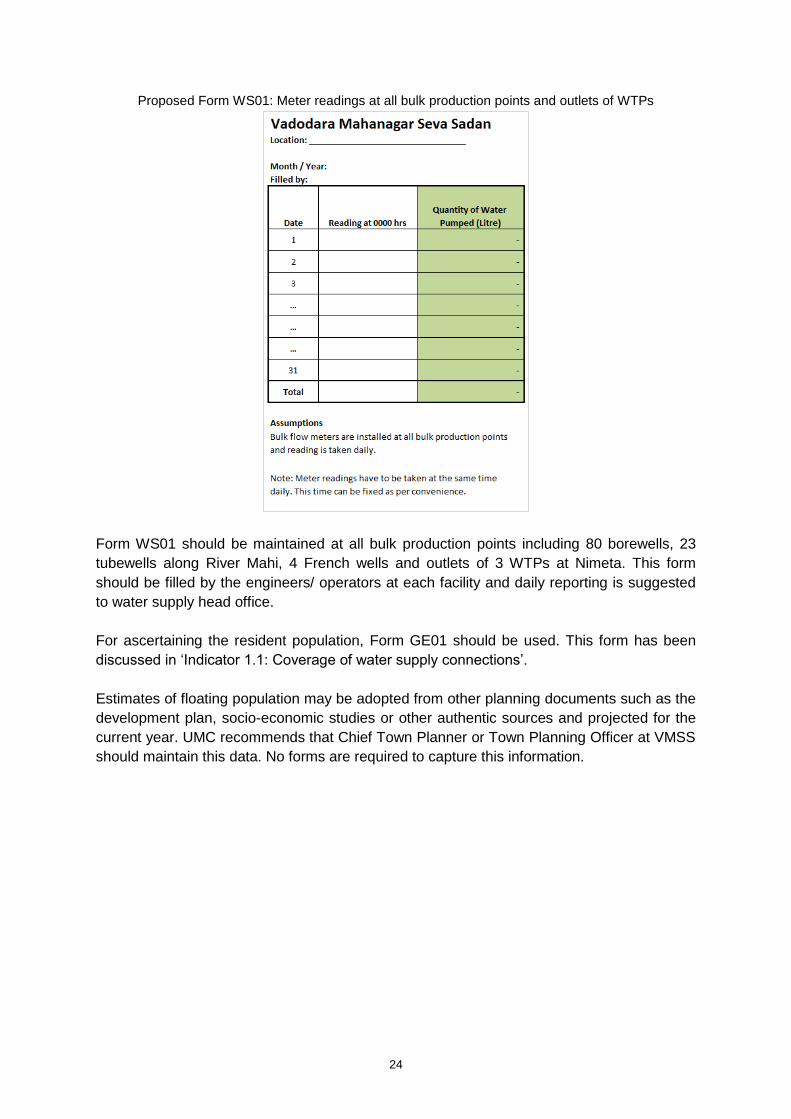
Proposed Form WS01: Meter readings at all bulk production points and outlets of WTPs
Form WS01 should be maintained at all bulk production points including 80 borewells, 23
tubewells along River Mahi, 4 French wells and outlets of 3 WTPs at Nimeta. This form
should be filled by the engineers/ operators at each facility and daily reporting is suggested
to water supply head office.
For ascertaining the resident population, Form GE01 should be used. This form has been
discussed in ‘Indicator 1.1: Coverage of water supply connections’.
Estimates of floating population may be adopted from other planning documents such as the
development plan, socio-economic studies or other authentic sources and projected for the
current year. UMC recommends that Chief Town Planner or Town Planning Officer at VMSS
should maintain this data. No forms are required to capture this information.
25
Indicator 1.3: Extent of metering of water connections
This indicator is dependent on the decision related to individual metering of water
connections. As of 2013, VMSS had not initiated metering of individual connections. For this
reason, information system improvement has not been computed in this plan. As per SLB
framework, the formula for this indicator is expressed as:
Extent of
metering of
water
connections
=
(No. of metered direct service connections +
No. of metered public standposts) X 100
(Total no. of direct service connections +
Total no. of public standposts)
Minimum frequency of measurement : Quarterly
Smallest geographical jurisdiction for measurement : Zone/ DMA Level
Indicator 1.4: Extent of non-revenue water (NRW)
This indicator highlights the quantity of water produced but which does not earn any revenue
to the ULB. This indicator is calculated by finding the gap in the quantity of treated water
pumped in the distribution network and the quantity of water supplied to paid connections.
The formula for this indicator is expressed as:
Extent of
non-revenue
water
=
(Total water produced and put in transmission and
distribution system – Total water sold) X 100
Total water produced and put in transmission and
distribution system
Minimum frequency of measurement : Quarterly
Smallest geographical jurisdiction for measurement : ULB Level
Total water produced and put in transmission and distribution system
Vadodara does not have bulk flow meters installed at the bulk production points (ground
water) or at outlets of WTPs to measure the quantity of water put into transmission and
distribution system. This quantity is estimated based on the pump capacity and hours of
operation. VMSS captures this information in the forms discussed in ‘Indicator 1.2: Per
capita supply of water’ and has been discussed in the respective section.
Total water sold
The quantity of water sold is obtained by multiplying the number of water connections (from
the sourced from the property tax database) and estimated water supplied through each
connection (based on ferrule size calculations). However, this method does not account for
physical losses of water through leakage and illegal connections.
Based on the above formula, reliability scale of this indicator in Vadodara is ‘D’.
Recommendations
To improve the reliability scale of this indicator to ‘A’, metering of all individual connections
should be undertaken. VMSS has initiated metering of domestic connections in the areas
where new distribution network is being laid. However, for the majority of the city, the

26
decision to meter all water connections rests with VMSS. In the absence of 100 percent
metering of water connections, the reliability scale ‘A’ cannot be achieved.
In order to achieve the next best possible reliability scale ‘B’, bulk flow meter should be
installed at all bulk production points and outlets of all WTPs. This has already been
suggested for improving reliability scale of ‘Indicator 1.2: Per capita supply of water’.
To calculate the total water sold, UMC recommends a sample survey7 at consumers’ end.
This survey should have a statistically valid sample size to arrive at average water flow
through different ferrule sizes. The survey should also capture the duration of supply and
pressure at which water is supplied8. For bulk consumers, UMC recommends installation of
meters and the reading from these be used for measuring the total water sold.
Proposed Form WS02: Form for consumers’ end survey for duration of supply, quantity of water
supplied and pressure at consumers’ end
A statistically valid sample size should be taken up by VMSS to conduct the survey. The
above form should be filled by surveyors to capture the data. This sample survey should be
conducted using portable electro-magnetic meters for duration of 7 continuous days at each
location. Sampling methodology has been discussed further in this section and should be
suitably adapted by VMSS.
Indicator 1.5: Continuity of water supply
This indicator provides information about average duration of supply to consumers at
minimum prescribed pressure. This indicator is calculated by measuring the duration of
supply in each water supply zone/ district metering area (DMA) subject to a pressure head of
7 metres at the consumers’ end.
7 Methodology of the sample survey has been discussed in the next section Indicator ‘1.5: Continuity
of water supply’. 8 A single sample survey for all indicators should be planned and designed. Although, pressure at
which water is supplied is not mandatory for computing this indicator, this information would be required for improving reliability scale of ‘Indicator 1.5: Continuity of water supply’.
27
Minimum frequency of measurement : Monthly9 Annually
Smallest geographical jurisdiction for measurement : Zone/ DMA Level
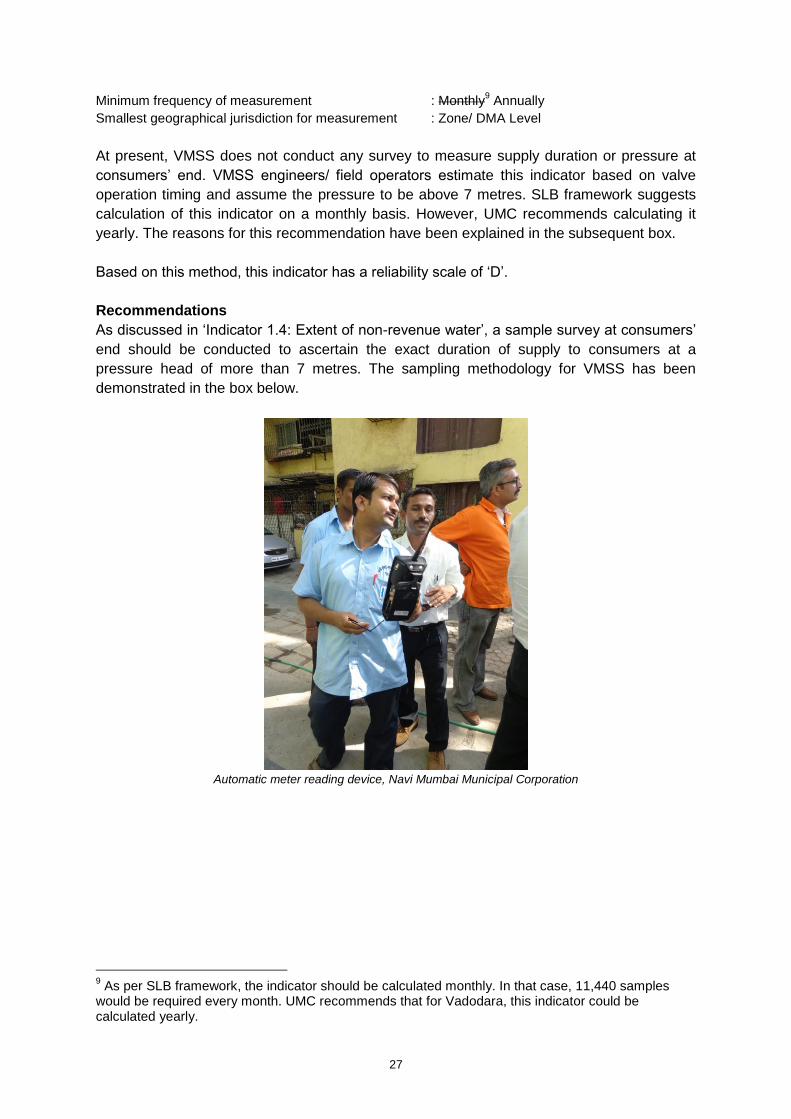
At present, VMSS does not conduct any survey to measure supply duration or pressure at
consumers’ end. VMSS engineers/ field operators estimate this indicator based on valve
operation timing and assume the pressure to be above 7 metres. SLB framework suggests
calculation of this indicator on a monthly basis. However, UMC recommends calculating it
yearly. The reasons for this recommendation have been explained in the subsequent box.
Based on this method, this indicator has a reliability scale of ‘D’.
Recommendations
As discussed in ‘Indicator 1.4: Extent of non-revenue water’, a sample survey at consumers’
end should be conducted to ascertain the exact duration of supply to consumers at a
pressure head of more than 7 metres. The sampling methodology for VMSS has been
demonstrated in the box below.
Automatic meter reading device, Navi Mumbai Municipal Corporation
9 As per SLB framework, the indicator should be calculated monthly. In that case, 11,440 samples
would be required every month. UMC recommends that for Vadodara, this indicator could be calculated yearly.

28
Methodology for sample survey
Sample surveys are conducted where survey of the entire population is not possible. Sample survey
gives us an overall idea of the information being probed. The data collected by sample survey is
projected to present the scenario for the entire population. Hence, it is imperative that the sample is
selected carefully to be representative of the entire population as well as statistically valid to make
meaningful conclusions.
For ISIP in Vadodara, a sample survey for consumers’ end to measure a) quantity of water supplied
to each consumer, b) duration of supply, and c) pressure at which water reaches the consumer. To
design this survey, samples should be taken from each water zone in the city10
. A statistically valid
sample size from each water zone should be chosen. Within the sample size of each zone, it should
be ensured that samples be distributed equally amongst
1. areas in proximity of ESRs
2. areas at the tail-end of the distribution network
3. intermediate areas
As per the SLB framework, each sample location should be surveyed for 7 days continuously. Based
on the above principles, samples should be taken from all 31 zones (command areas of 31 WDS).
Based on the population being served in each command area, sample size for each zone has been
shown in the table below:
Water zone HHs (2011) Sample size Water zone HHs (2011) Sample size
Airport booster 10,589 371 Lalbaug 20,365 378
Ajwa 27,123 379 Manjalpur 9,746 370
Akota 10,700 371 Nalanda 11,607 372
Bapod 5,234 358 North Harni* 6,257 362
Chhani Jakat 8,844 369 Panigate 18,114 377
Chhani Village* 13,184 374 Sama 14,292 375
Extra* 6,302 363 Sayajibaug 9,824 370
Gajarawadi 12,939 374 Sayajipura* 19,484 377
Gayatrinagar 12,759 373 South GIDC 13,578 374
GIDC 6,576 363 Subhanpura 12,421 373
Gorwa 10,724 371 Tandalja 12,505 373
Harinagar 12,145 373 Tarsali 11,663 372
Harni 14,372 375 Vehiclepool
Booster 2,210 328
Jail 13,025 374 Wadiwadi 12,767 373
Kalali 15,640 375 Warashia
Booster 2,265 329
Kapurai* 13,076 374 Total 3,70,332 11,440
A total of 11,440 sample should be tested in Vadodara for achieving 5 percent margin of error and a
confidence level of 95 percent (Raosoft, Inc., 2014).
Note: As per SLB framework, the indicator should be calculated monthly. In that case, 11,440 samples would be
required every month. UMC recommends that for Vadodara, this indicator could be calculated yearly.
10
Typically, command area of each WDS is considered to be a water zone.

29
Based on the above sampling method, VMSS requires 242 portable meters to be installed in
the field simultaneously and an equal number of pressure gauges. The same number of staff
is required for noting down the readings and constantly monitoring the duration for which
water is supplied at more than 7 metres pressure head.
Indicator 1.6: Quality of water supplied
This indicator measures quality of potable water as per the standards defined by the Central
Public Health and Environmental Engineering Organisation (CPHEEO). The formula for this
indicator is expressed as:
Quality of
water supply =
No. of samples that meet the specified potable standards X 100
Total no. of samples taken
Minimum frequency of measurement : Monthly
Smallest geographical jurisdiction for measurement : ULB Level
Total number of samples taken
VMSS conducts residual chlorine (RC), bacteriological and physical-chemical tests at
different locations in the system. There is no documented regime available with VMSS.
Based on the discussions with VMSS staff, currently they conduct water quality tests as
indicated in the table below:
Table 3 Water quality testing conducted monthly by VMSS during 2013-14
11
Type of test Source/ WTP
Outlet Intermediate
Consumer’s end
Total
RC 79 - 11,142 11,221
Physical 13 9 - 22
Chemical 13 9 - 22
Bacteriological 24 - - 24
Total 129 18 11,142 11,289
Source: Data provided by VMSS for Performance Assessment System
As per the above regime, number of tests carried out seems inadequate as total number of
tests required for Vadodara according to CPHEEO regime is close to 2.9 lakh. A detailed
break-up of CPHEEO’s recommended tests by type and location have been provided
subsequently in this section.
Number of samples that meet the specified potable standards
There are no forms to record findings of RC tests conducted at the consumers’ end. Also, a
summary of all tests conducted with their results is not prepared by VMSS.
11
The annual number of tests have been divided equally over 12 months.

30
Figure 8 Water quality testing (bacteriological) report at Ajwa, surface water source (left) and WTP (right)
Source: VMSS, 2013
Figure 9 Water quality test report for physical and chemical tests conducted by VMSS
Source: VMSS, 2013
VMSS conducted bacteriological tests in their own laboratory and no external audit of water
quality is conducted.
Based on the above method, the reliability scale of this indicator is ‘C’
Recommendations
In order to achieve reliability scale ‘A’, VMSS needs to undertake the following:
1. Prepare a water quality testing regime as per the CPHEEO norms. UMC has
prepared an MS Excel based tool to prepare a list of tests by type and location. The
tool also provides a daily or a monthly list of tests to be conducted. Using this tool,
the proposed number of test for the month of January has been presented below:
31
Table 4 Proposed list of water quality tests to be conducted by type and location (sample)
Type of test Source/ WTP
Outlet Intermediate
Consumer’s end
Total
RC 6,090 930 4,650 11,670
Physical 3,047 930 4,650 8,627
Chemical 3,047 31 0 3,078
Bacteriological 597 155 155 907
Total 12,781 2,046 9,455 24,282
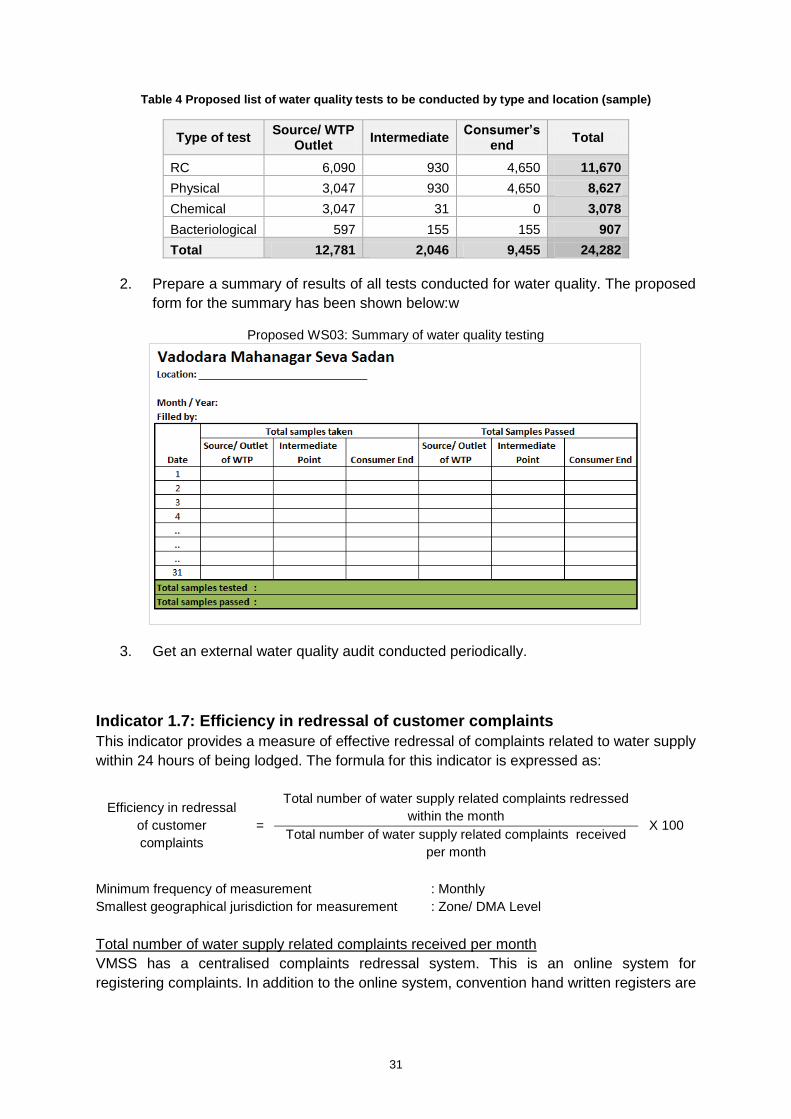
2. Prepare a summary of results of all tests conducted for water quality. The proposed
form for the summary has been shown below:w
Proposed WS03: Summary of water quality testing
3. Get an external water quality audit conducted periodically.
Indicator 1.7: Efficiency in redressal of customer complaints
This indicator provides a measure of effective redressal of complaints related to water supply
within 24 hours of being lodged. The formula for this indicator is expressed as:
Efficiency in redressal
of customer
complaints
=
Total number of water supply related complaints redressed
within the month X 100
Total number of water supply related complaints received
per month
Minimum frequency of measurement : Monthly
Smallest geographical jurisdiction for measurement : Zone/ DMA Level
Total number of water supply related complaints received per month
VMSS has a centralised complaints redressal system. This is an online system for
registering complaints. In addition to the online system, convention hand written registers are
32
being maintained at ward offices and water supply related facilities such as WDS. Presently,
VMSS uses the complaints from the online system only to calculate this indicator.
Total number of water supply related complaints redressed within the month
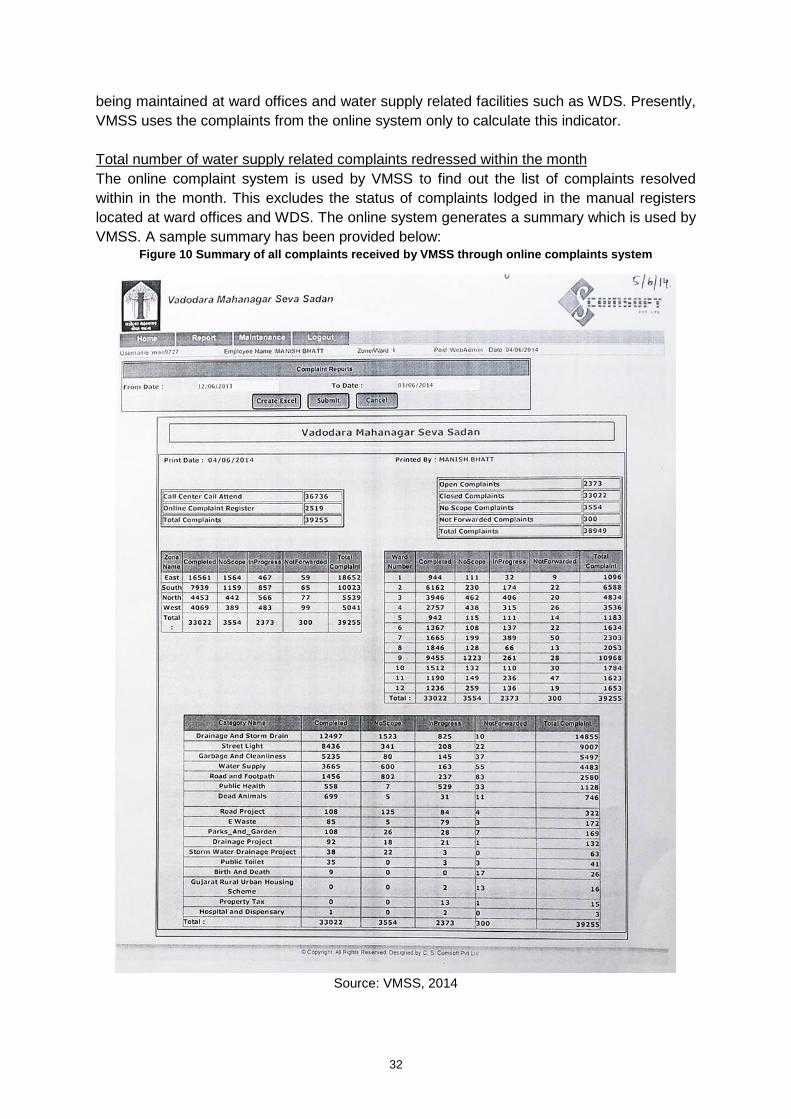
The online complaint system is used by VMSS to find out the list of complaints resolved
within in the month. This excludes the status of complaints lodged in the manual registers
located at ward offices and WDS. The online system generates a summary which is used by
VMSS. A sample summary has been provided below: Figure 10 Summary of all complaints received by VMSS through online complaints system
Source: VMSS, 2014

33
Based on the above calculation method, the reliability scale of this indicator is ‘B’ with the
only gap of collation of manual and online complaints systems.
Recommendations
In order to achieve reliability scale ‘A’, VMSS should install a computer with access to online
complaints system at the complaints desks at ward offices. All complaints should be
registered on the online system by the computer operator. Any request to lodge a complaint
at the WDS should be diverted to the nearest ward office.
Alternatively, VMSS can digitise manual registers located at ward offices and at WDS every
month. Once the data is digitised and added to the online system, VMSS should seek
endorsement of complaints redressed from the complainants.
In either case, a form to record this information is required. UMC proposes the following form
to be used for the same:
Proposed GE02: Summary of complaints
Indicator 1.8: Cost recovery in water supply services
This indicator provides the financial operating health of the water supply department. This
indicator is calculated as a ratio of revenue earned from water supply and expenses made
for providing the service to citizens, excluding capital expenditure. The formula for this
indicator is expressed as:
Cost recovery in
water supply
services
=
Total annual operating revenues
X 100 Total annual operating expenses
Minimum frequency of measurement : Quarterly Annually
Smallest geographical jurisdiction for measurement : ULB Level
Total annual operating revenues
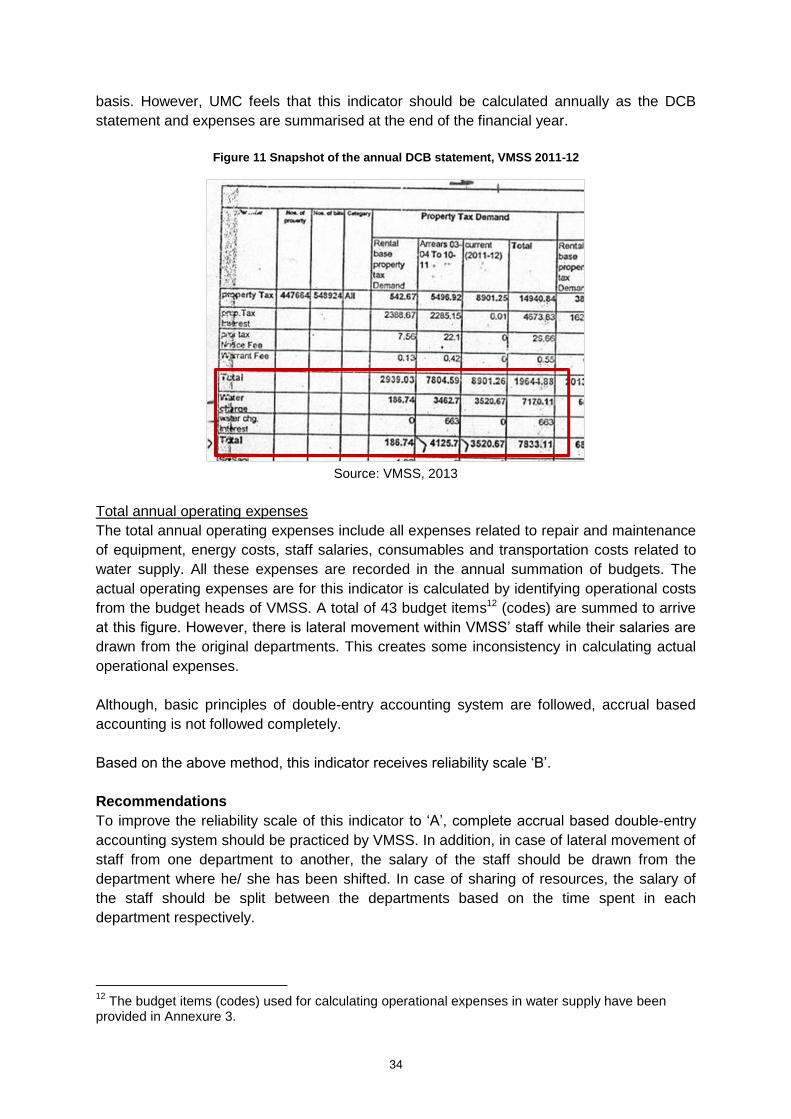
VMSS issues annual property tax bill to its citizens. This property tax bill includes water
supply related taxes and charges (see figure below). VMSS generates an annual demand-
collection-balance (DCB) statement for property tax clearly identifying the revenue demand
raised for water supply. The SLB framework suggests calculating this indicator on a quarterly
34
basis. However, UMC feels that this indicator should be calculated annually as the DCB
statement and expenses are summarised at the end of the financial year.
Figure 11 Snapshot of the annual DCB statement, VMSS 2011-12
Source: VMSS, 2013
Total annual operating expenses
The total annual operating expenses include all expenses related to repair and maintenance
of equipment, energy costs, staff salaries, consumables and transportation costs related to
water supply. All these expenses are recorded in the annual summation of budgets. The
actual operating expenses are for this indicator is calculated by identifying operational costs
from the budget heads of VMSS. A total of 43 budget items12 (codes) are summed to arrive
at this figure. However, there is lateral movement within VMSS’ staff while their salaries are
drawn from the original departments. This creates some inconsistency in calculating actual
operational expenses.
Although, basic principles of double-entry accounting system are followed, accrual based
accounting is not followed completely.
Based on the above method, this indicator receives reliability scale ‘B’.
Recommendations
To improve the reliability scale of this indicator to ‘A’, complete accrual based double-entry
accounting system should be practiced by VMSS. In addition, in case of lateral movement of
staff from one department to another, the salary of the staff should be drawn from the
department where he/ she has been shifted. In case of sharing of resources, the salary of
the staff should be split between the departments based on the time spent in each
department respectively.
12
The budget items (codes) used for calculating operational expenses in water supply have been provided in Annexure 3.

35
Indicator 1.9: Efficiency in collection of water supply-related charges
This indicator provides the efficiency of the ULB in collecting water supply related charges
from the citizen. This indicator is calculated as a ratio of demand raised (or billed) for water
supply related taxes and charges and actual collection done by the ULB. The formula for this
indicator is expressed as:
Efficiency in
collection of water-
related charges
=
Current revenues collected in the
given year X 100
Total operating revenues billed during
the given year
Minimum frequency of measurement : Annually
Smallest geographical jurisdiction for measurement : Zone/ DMA Level
Total operating revenues billed during the given year
This information is generated by VMSS in the annual DCB statement. VMSS uses the DCB
statement to calculate this indicator.
Current revenues collect in the given year
VMSS uses this information from the annual DCB statement.
Based on this method, the reliability scale of this indicator is ‘A’ and hence, no improvements
are suggested.

36
5. Sewerage
5.1. Existing sewerage system in Vadodara
A stage wise break-up of the existing sewerage system in Vadodara has been shown in the
following sections.
Sewage generation
Vadodara Mahanagar Seva Sadan (VMSS) has a population of 17,12,699 as per the
Census 2011. As of 2011-12, VMSS has 5.49 lakh properties in its jurisdiction out of which
4.72 lakh properties have on-premises toilets. Another 1287 households are dependent on
functional community toilets (PAS, 2013). Around 4.65 lakh properties are connected to the
municipal sewerage system while around 7000 properties are dependent on on-site sanitary
disposal systems. Based on the water supplied to the citizens, 80 percent of it is assumed to
be the sewerage generated. Based on this calculation, around 290 MLD13 of sewerage is
generated in Vadodara.
Sewage collection and treatment
Against an estimated generation of 290 MLD, VMSS collected 278 MLD through its
sewerage network of about 1170 km. This network covers around 145 sqkm of the city’s
area out of a total of 159 sqkm. The sewerage network is divided in 3 zones and the sewage
collected is treated at 5 sewage treatment plants (STP). VMSS has installed 45 auxiliary
pumping stations (APS) along the sewerage network for pumping of sewage. Figure 12 Sewage network diagram, VMSS (2011-12)
Source: Urban Management Centre, 2013
13
This figure includes sewage generated from ULB as well as non-ULB sources.

37
The table below provides a zone-wise list of treatment plants and their respective treatment
capacity.
Table 5 Details of sewage treatment plants in Vadodara
Zone Details of STP
Drainage Zone I STP at Tarsali (52 MLD)
Drainage Zone II
STP at Gajarawadi
Unit 1 (66 MLD)
Unit 2 (27 MLD) (non-functional)
Drainage Zone IIII
STP at Atladara
Unit 1 (43 MLD)
Unit 2 (43 MLD)
Unit 3 (27 MLD) (non-functional)
STP at Sayaji Baug
Unit 1 (8.5 MLD)
STP at Kapurai
Unit 1 (43 MLD)
Source: (PAS, 2013)
The treated sewage is disposed in either River Vishwamitri or in River Jambuva. All STPs
have a bypass to divert sewage from the treatment plant which is also disposed in the
respective outlets in these two rivers.
5.2. Existing information system in sewerage
This section presents an analysis of existing information system in sewerage in VMSS. To
analyse data generation, UMC conducted field visits at various installations related to
sewerage including some auxiliary pumping stations (APS) and selected sewage treatment
plants. In addition, UMC conducted discussion with all levels of staff working in operation
and maintenance of sewerage. An overview of the data provided by each department for
generating sewerage indicators has been provided in the figure below.

38
During the visits, the team collected data recording formats (maintained as logbooks) at all
facilities. Based on the data collected during 2012-13 for PAS program, the sewerage SLB
indicators for VMSS were as below:
Table 6 Performance indicators of VMSS in sewerage as per the SLB framework
S. No Sewerage indicator values Unit FY 2012-13
1 Coverage of Toilets % 86
2 Coverage of wastewater network services % 87
3 Collection efficiency of wastewater networks % 97
4 Adequacy of wastewater treatment capacity % 107
5 Extent of reuse and recycling of treated wastewater % 2
6 Quality of wastewater treatment % 91
7 Efficiency in redressal of customer complaints % 98
8 Extent of cost recovery in wastewater management % 109
9 Efficiency in collection of sewerage charges % 89
Source: (PAS, 2013)
39
To conduct assessment of data collation or summarisation and its report to higher officials,
UMC tracked the flow of information from various facilities to VMSS head office. The
analysis conducted for existing information system has been presented using the following:
- Sewerage flow diagram
- Information flow diagram from various facilities related to sewerage
- Gap analysis in existing information system clearly identifying data not generated/
recorded and recommendations to capture such data
- Gap analysis in existing data recording formats and recommendations to fulfil them
as per SLB framework
While providing recommendations, UMC’s approach has been to make minimal
modifications in the existing formats. Recommendations provided by UMC to fill data gaps
include
e) new formats
f) minor modifications to existing formats
g) computerisation of data and defining its flow (both from bottom to top and vice-versa)
h) outlining equipment and manpower requirements for filling in the data gaps and
improving reliability bands
A detailed assessment of the information system reveals that information should be collected from several field locations and administrative offices within VMSS as shown below.
40
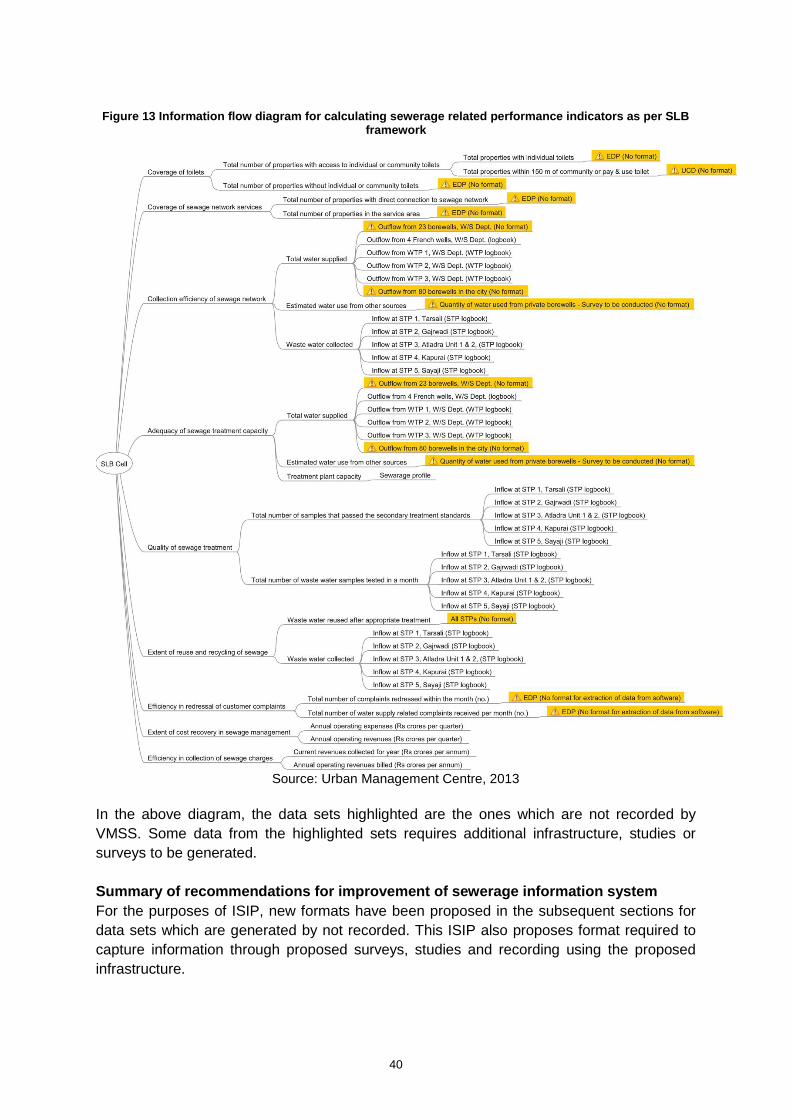
Figure 13 Information flow diagram for calculating sewerage related performance indicators as per SLB
framework
Source: Urban Management Centre, 2013
In the above diagram, the data sets highlighted are the ones which are not recorded by
VMSS. Some data from the highlighted sets requires additional infrastructure, studies or
surveys to be generated.
Summary of recommendations for improvement of sewerage information system
For the purposes of ISIP, new formats have been proposed in the subsequent sections for
data sets which are generated by not recorded. This ISIP also proposes format required to
capture information through proposed surveys, studies and recording using the proposed
infrastructure.
41
Process improvements, studies and surveys proposed
The following process improvements, studies and surveys have been recommended:
General (departments other than sewerage)
1. Modify the property tax re-assessment form to include information regarding
access to individual toilet in each property. The details of this recommendation
have been discussed in ‘Indicator 2.1: Coverage of toilets’.
2. VMSS’ Revenue Department uses hand-drawn maps of the city as a part of the
property tax database. UMC recommends that these maps be digitised with
property tax information linked as attributes. In addition, locations of all public
toilets should also be mapped to ascertain its access by households without
individual toilets. This recommendation has been discussed in ‘Indicator 2.1:
Coverage of toilets’.
3. Digitise complaints logbooks – same as water supply section.
4. Accrual based double-entry accounting – same as water supply section.
5. Sharing of staff, machinery & equipment and consumables – same as water
supply section.
Sewerage Department
6. Conduct a survey of private borewells in the city to assess quantity of water
produced by these and hence, quantity of sewerage generated.
7. Sewage quality testing regime should be calculated based on CPHEEO norms.
8. Work in close coordination with the Water Supply Department to ascertain the
exact quantity of sewage generated based on the water supplied to the city.
Infrastructure proposed
In addition to the above forms, the following infrastructural improvements have been
recommended:
1. Installation of a total of 24 bulk flow meters at 8 STP units – 2 meters at the inlet
chamber (to measure total inflow and bypass) and 1 at the outlet of treated water
for each STP unit.
New forms proposed/ existing forms modified
S. No. Proposed/
Modified
Form No. Title of the form
1. Proposed Form GE01 Households, properties and establishment details
2. Proposed Form GE02 Complaints received and redressed
3. Modified Form SE01R Bulk flow measurement of sewage inflow, sewage bypassed
and treated water produced by STP
4. Proposed Form SE02 Quantity of water produced by borewells
5. Proposed Form SE03 Number of households without individual toilet and not
within walking distance (150 metres) of a public toilet
Indicator-wise details including gaps and recommendations have been discussed in the
following section.

42
5.3. Data generation, recording and transfer practices in VMSS –
gaps and recommendations
VMSS captures data from various facilities through logbooks. Data is generated at all STPs
and reported to the central office of the sewerage department (housed in main VMSS
building at Khanderao Market). The data collated includes daily quantity of sewage received
at the STPs from the collection network. Operation and maintenance of sewerage system is
managed by Executive Engineer of VMSS.
For calculating some SLB indicators, the Sewerage Department borrows data from other
departments including water supply, tax, revenue and EDP unit. Some of this data is used by
engineers in sewerage department for managing operations of their utilities, a large volume
of data is never collated or reviewed to contribute in decision-making process.
As per the SLB framework, some data is partially captured or not captured at all by VMSS.
The following section analyses existing forms used by VMSS to record data required for
generation of sewerage related SLB indicators. The analysis also identifies practices
adopted by VMSS to capture data, local collation/ summarisation/ totalling, data transfer, city
level collation & reporting and review & decision making processes for sewerage. The
analysis has been conducted indicator-wise.
Indicator 2.1: Coverage of toilets
This indicator measures the number of households which have access to toilets including
on-premises toilet and functional community toilets. This indicator is calculated using the
following formula:
Coverage of
toilets =
Total no. of properties with access to individual or
community toilets within walking distance X 100
Total no. of properties within service area14
Minimum frequency of measurement : Quarterly
Smallest geographical jurisdiction for measurement : Ward Level
Total no. of properties with access to individual or community toilets within walking distance
VMSS has not conducted any survey to ascertain this information and hence, does not have
this information. VMSS calculates this number based on an estimate by field officials from
sewerage and slum departments.
Total no. of properties within service area
This information is borrowed by the sewerage department from the tax department for
calculating this indicator.
14
The SLB handbook provided the formula as [a/(a+b)] x 100; where a = Total no. of properties with access to individual or community toilets within walking distance b = Total no. of properties without access to individual or community toilets within walking distance For ease of calculation, ‘b’ has been replaced to Total no. of properties within service area’.

43
Based on the above calculation method, this indicator attains a reliability of ‘C’
Recommendations
In order to improve the reliability scale to ‘A’, exact number of properties with access to
individual toilet or a community toilet within walking distance should be ascertained by a field
survey. Further this data should be updated based on the building plan approval for new
properties being developed there after. VMSS conducts property tax assessment survey
throughout the city in a 4 year cycle.
UMC has recommended that a one-time survey of the city be conducted to ascertain this
information. For VMSS to update this information regularly thereafter, UMC recommended
during the course of the study, that a question regarding individual toilet on the property
being assessed be added to the current property tax re-assessment survey form. VMSS
accepted the suggestion and incorporated the question.
Figure 14 Existing property tax re-assessment form and suggested modification
Source: Urban Management Centre, 2013
Once the survey is complete, this information is digitised and the property tax database
could be used to find the number of properties without on-premises toilets. In order to extract
a summary from the property tax database, Form GE01 (discussed in Indicator 1.1:
Coverage of water supply) can be used.
UMC also recommends mapping of all community toilets on GIS and ascertain its access to
properties without toilets. Based on this recommendation, exact number of properties without
access to toilets can be calculated. Form SE03 can be used for documenting this
information.
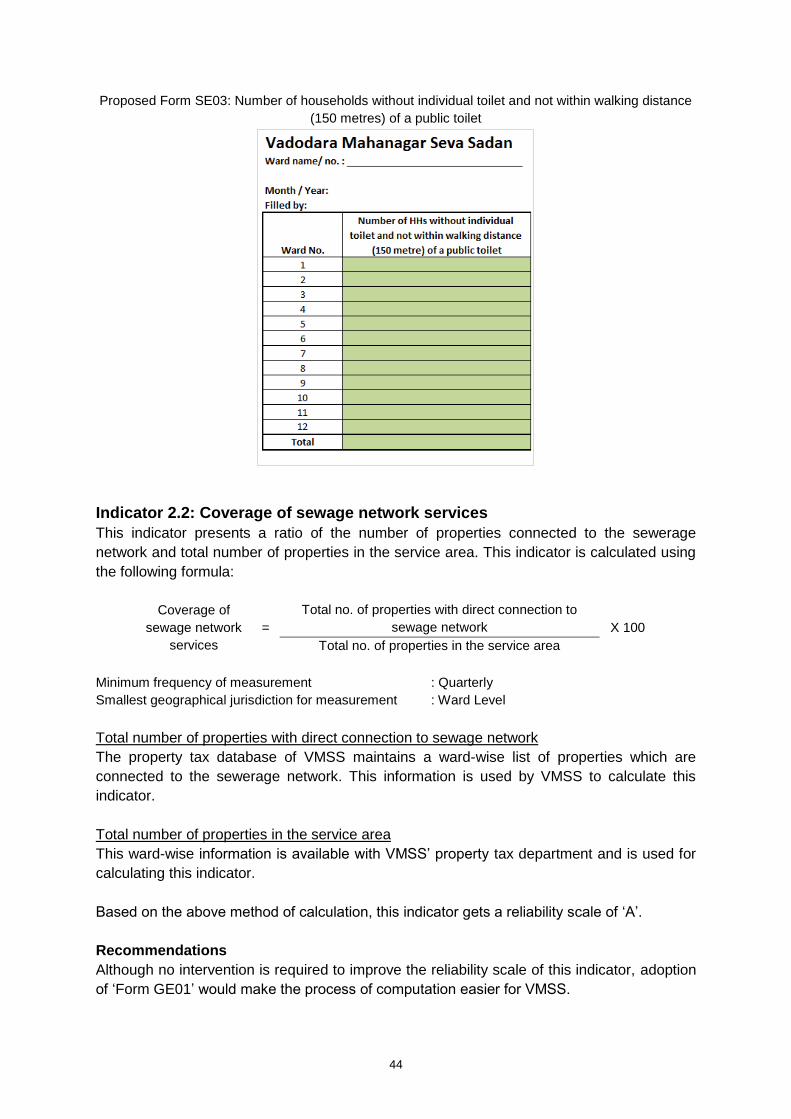
44
Proposed Form SE03: Number of households without individual toilet and not within walking distance
(150 metres) of a public toilet
Indicator 2.2: Coverage of sewage network services
This indicator presents a ratio of the number of properties connected to the sewerage
network and total number of properties in the service area. This indicator is calculated using
the following formula:
Coverage of
sewage network
services
=
Total no. of properties with direct connection to
sewage network X 100
Total no. of properties in the service area
Minimum frequency of measurement : Quarterly
Smallest geographical jurisdiction for measurement : Ward Level
Total number of properties with direct connection to sewage network
The property tax database of VMSS maintains a ward-wise list of properties which are
connected to the sewerage network. This information is used by VMSS to calculate this
indicator.
Total number of properties in the service area
This ward-wise information is available with VMSS’ property tax department and is used for
calculating this indicator.
Based on the above method of calculation, this indicator gets a reliability scale of ‘A’.
Recommendations
Although no intervention is required to improve the reliability scale of this indicator, adoption
of ‘Form GE01’ would make the process of computation easier for VMSS.

45
Indicator 2.3: Collection efficiency of the sewage network
This indicator presents a ratio of the sewage collected by the sewerage network and the total
sewage generation in the city. This indicator is calculated using the following formula:
Collection
efficiency of
sewage network
=
Waste water collected
X 100 (Total water supplied + water used from other sources) X 0.8
Minimum frequency of measurement : Monthly
Smallest geographical jurisdiction for measurement : ULB Level
Waste water collected
This information is currently measured in Vadodara based on the flow meters at inlets at a
few STP units. On the rest of the STP units, it is estimated based on pumping capacity and
hours of operation. The form used for capturing the inflow at STP at Atladara using flow
meter has been shown below: Figure 15 Format used for recording inflow of sewage at STP, Atladara
Source: VMSS, 2013
Total water supplied and water used from other sources
VMSS takes this information from the water supply department. VMSS has not conducted
any survey to estimate the quantity of water used from private sources including borewells.
Hence, VMSS currently does not have an estimate of the quantity of water from other
sources. As a rule of thumb, it is assumed that 80 percent of the water supplied gets
converted into waste water.
Based on the above method of calculation in Vadodara and as per the SLB framework, this
indicator falls in the reliability scale ‘D’.
Recommendations
VMSS has installed flow meter at inlet chambers of some STP units. The inlet chamber
contains a bypass channel for diverting excessive sewage of in case of break-down or
repairs of the unit. The quantity of sewage bypassed using this channel is not recorded.
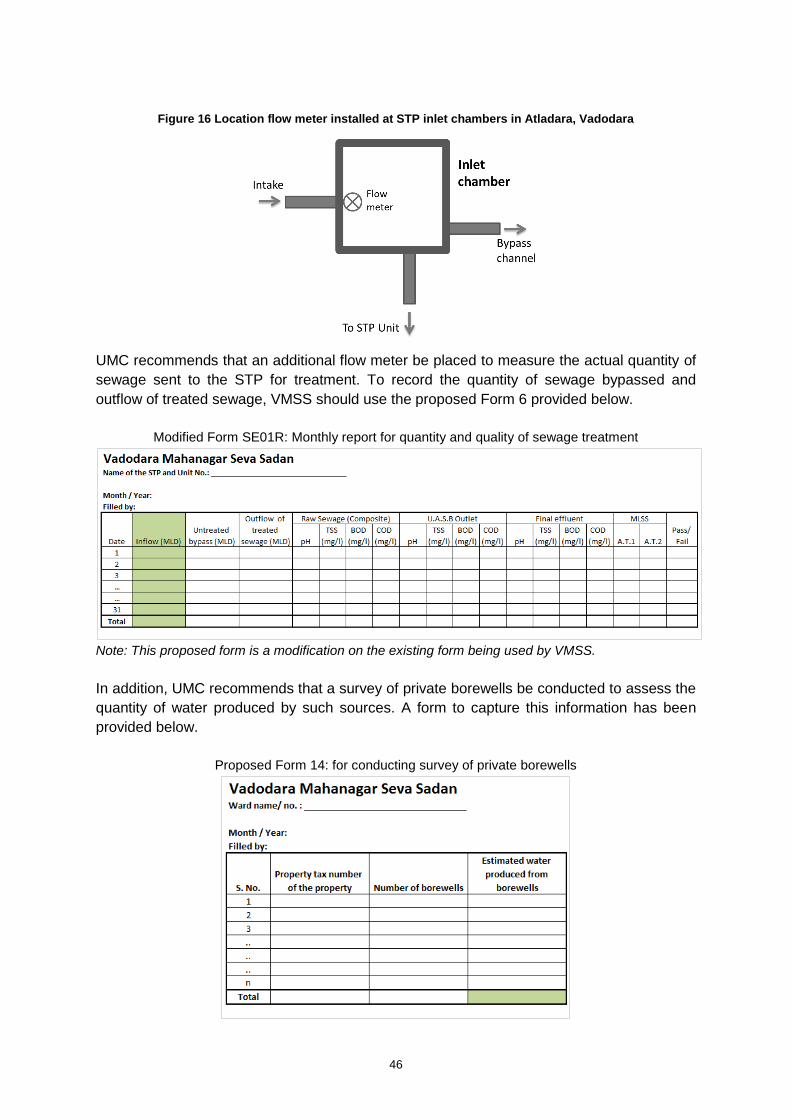
46
Figure 16 Location flow meter installed at STP inlet chambers in Atladara, Vadodara
UMC recommends that an additional flow meter be placed to measure the actual quantity of
sewage sent to the STP for treatment. To record the quantity of sewage bypassed and
outflow of treated sewage, VMSS should use the proposed Form 6 provided below.
Modified Form SE01R: Monthly report for quantity and quality of sewage treatment
Note: This proposed form is a modification on the existing form being used by VMSS.
In addition, UMC recommends that a survey of private borewells be conducted to assess the
quantity of water produced by such sources. A form to capture this information has been
provided below.
Proposed Form 14: for conducting survey of private borewells

47
Indicator 2.4: Adequacy of sewage treatment capacity
This indicator presents a ratio of the sewage generated by the city and the designed
capacity of all STPs in the city. This indicator is calculated using the following formula:
Adequacy of
sewage treatment
capacity
=
Treatment plant capacity
X 100 (Total water supplied + water used from other sources) X 0.8
Minimum frequency of measurement : Annually
Smallest geographical jurisdiction for measurement : ULB Level
Treatment plant capacity
This information is compiled by summing up the designed capacity all STPs in the city and
used for calculating the indicator.
Total water supplied and water used from other sources
Same as calculated in the previous indicator.
Based on the above calculation method, the reliability scale for this indicator is ‘D’.
Recommendations
Reliability scale of this indicator is dependent on the reliability scale of ‘Indicator 1.4: Extent
of non-revenue water (NRW)’. Once reliability scale of Indicator 1.4 is improved, it would
automatically improve the reliability of this indicator.
Indicator 2.5: Quality of sewage treatment
This indicator measures quality of treated sewage as per the standards defined by
CPHEEO. This indicator is calculated using the following formula:
Quality of sewage
treatment =
No. of samples that pass the specified secondary
treatment standards X 100
Total no. of samples tested in a month
Minimum frequency of measurement : Monthly
Smallest geographical jurisdiction for measurement : ULB Level
Total number of samples that pass the specified secondary treatment standards
VMSS is equipped with testing laboratories at all STPs. VMSS has outsourced operation of
STPs to private contractor and received periodic quality report from them. The report
provides daily measurements of various parameters such as pH, TSS, BOD and COD from
various points within the STP (raw sewage, UASB outlet and Secondary Clarifies Outlet/
Final Effluent). However, it does not summarise the results of the tests indicating the number
of tests that passed or failed the benchmarks. Information from the report is used for
calculating this indicator. A sample of the report has been provided below.
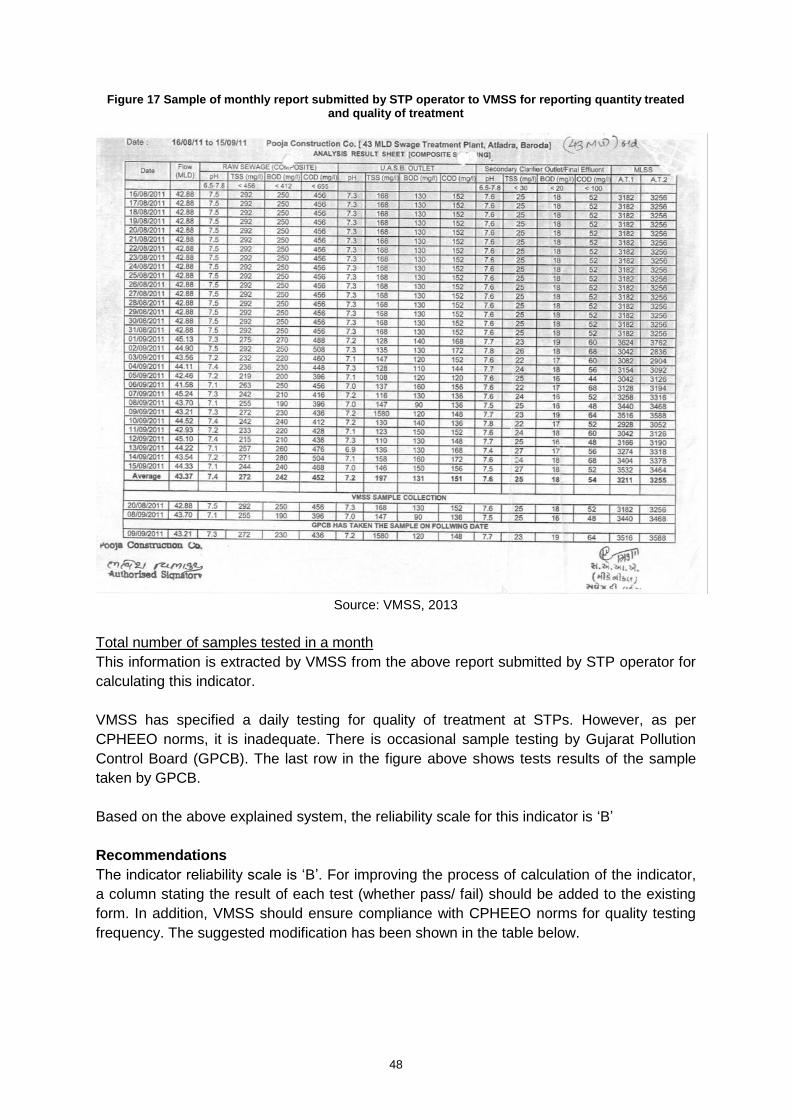
48
Figure 17 Sample of monthly report submitted by STP operator to VMSS for reporting quantity treated and quality of treatment
Source: VMSS, 2013
Total number of samples tested in a month
This information is extracted by VMSS from the above report submitted by STP operator for
calculating this indicator.
VMSS has specified a daily testing for quality of treatment at STPs. However, as per
CPHEEO norms, it is inadequate. There is occasional sample testing by Gujarat Pollution
Control Board (GPCB). The last row in the figure above shows tests results of the sample
taken by GPCB.
Based on the above explained system, the reliability scale for this indicator is ‘B’
Recommendations
The indicator reliability scale is ‘B’. For improving the process of calculation of the indicator,
a column stating the result of each test (whether pass/ fail) should be added to the existing
form. In addition, VMSS should ensure compliance with CPHEEO norms for quality testing
frequency. The suggested modification has been shown in the table below.
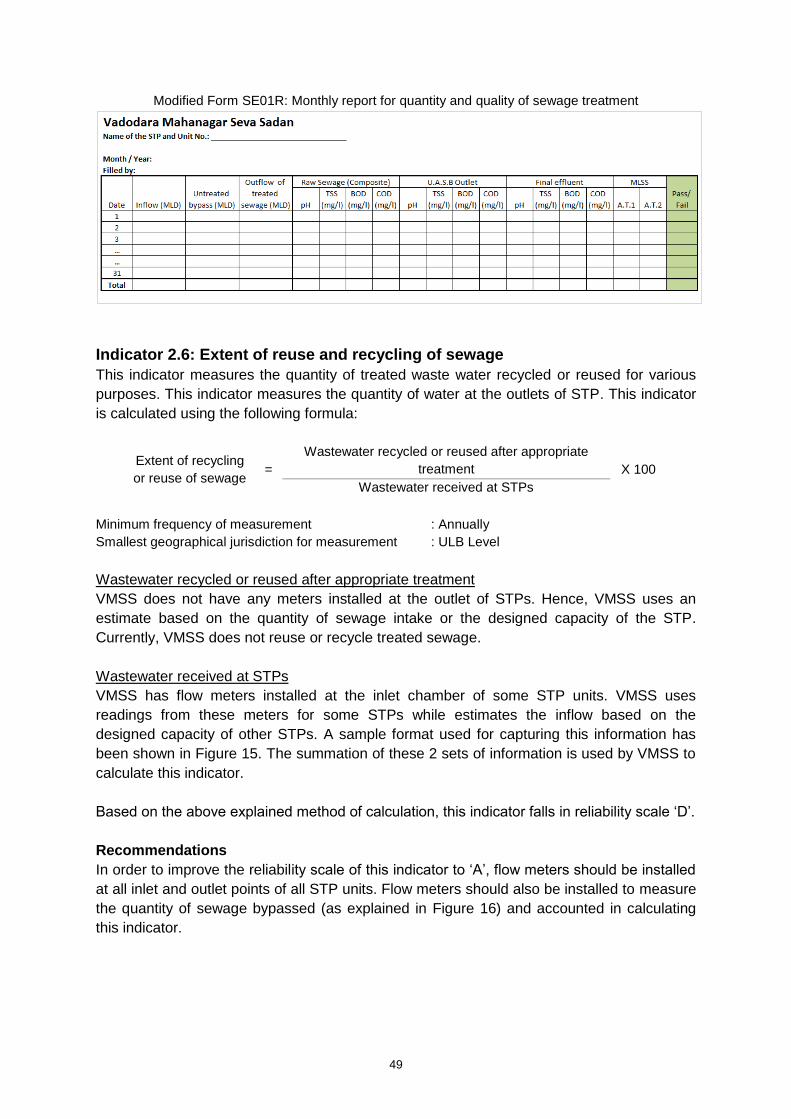
49
Modified Form SE01R: Monthly report for quantity and quality of sewage treatment
Indicator 2.6: Extent of reuse and recycling of sewage
This indicator measures the quantity of treated waste water recycled or reused for various
purposes. This indicator measures the quantity of water at the outlets of STP. This indicator
is calculated using the following formula:
Extent of recycling
or reuse of sewage =
Wastewater recycled or reused after appropriate
treatment X 100
Wastewater received at STPs
Minimum frequency of measurement : Annually
Smallest geographical jurisdiction for measurement : ULB Level
Wastewater recycled or reused after appropriate treatment
VMSS does not have any meters installed at the outlet of STPs. Hence, VMSS uses an
estimate based on the quantity of sewage intake or the designed capacity of the STP.
Currently, VMSS does not reuse or recycle treated sewage.
Wastewater received at STPs
VMSS has flow meters installed at the inlet chamber of some STP units. VMSS uses
readings from these meters for some STPs while estimates the inflow based on the
designed capacity of other STPs. A sample format used for capturing this information has
been shown in Figure 15. The summation of these 2 sets of information is used by VMSS to
calculate this indicator.
Based on the above explained method of calculation, this indicator falls in reliability scale ‘D’.
Recommendations
In order to improve the reliability scale of this indicator to ‘A’, flow meters should be installed
at all inlet and outlet points of all STP units. Flow meters should also be installed to measure
the quantity of sewage bypassed (as explained in Figure 16) and accounted in calculating
this indicator.
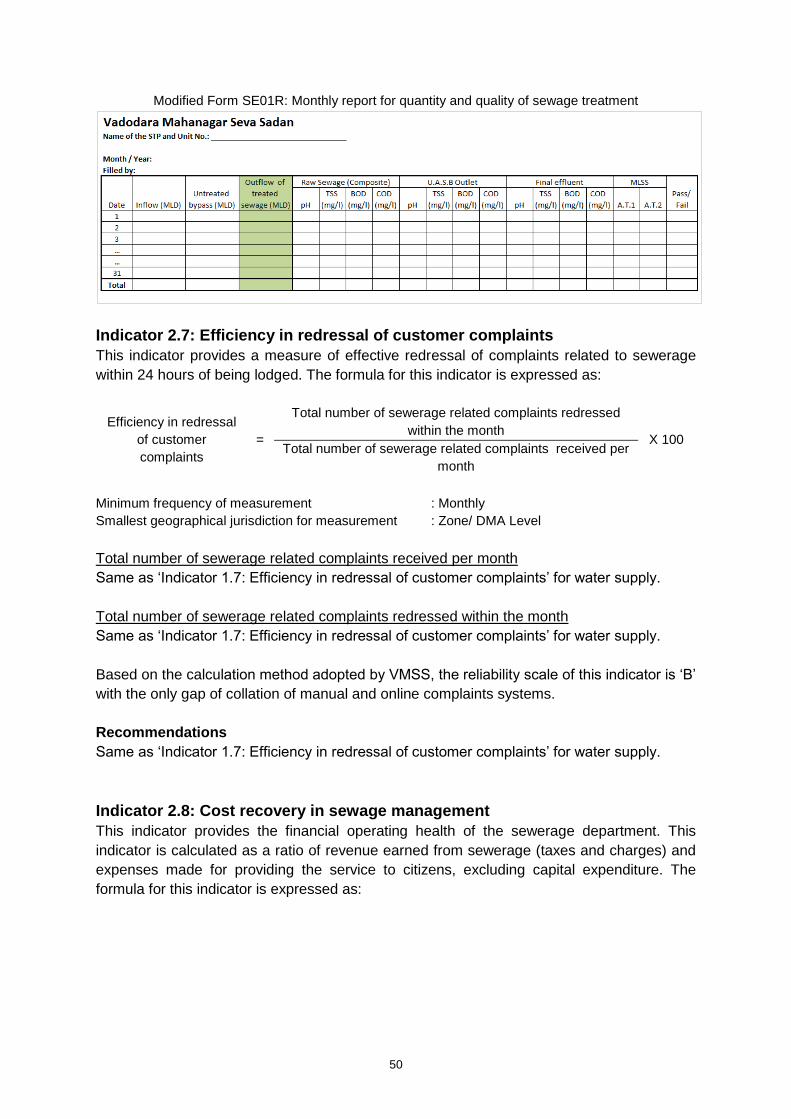
50
Modified Form SE01R: Monthly report for quantity and quality of sewage treatment
Indicator 2.7: Efficiency in redressal of customer complaints
This indicator provides a measure of effective redressal of complaints related to sewerage
within 24 hours of being lodged. The formula for this indicator is expressed as:
Efficiency in redressal
of customer
complaints
=
Total number of sewerage related complaints redressed
within the month X 100
Total number of sewerage related complaints received per
month
Minimum frequency of measurement : Monthly
Smallest geographical jurisdiction for measurement : Zone/ DMA Level
Total number of sewerage related complaints received per month
Same as ‘Indicator 1.7: Efficiency in redressal of customer complaints’ for water supply.
Total number of sewerage related complaints redressed within the month
Same as ‘Indicator 1.7: Efficiency in redressal of customer complaints’ for water supply.
Based on the calculation method adopted by VMSS, the reliability scale of this indicator is ‘B’
with the only gap of collation of manual and online complaints systems.
Recommendations
Same as ‘Indicator 1.7: Efficiency in redressal of customer complaints’ for water supply.
Indicator 2.8: Cost recovery in sewage management
This indicator provides the financial operating health of the sewerage department. This
indicator is calculated as a ratio of revenue earned from sewerage (taxes and charges) and
expenses made for providing the service to citizens, excluding capital expenditure. The
formula for this indicator is expressed as:
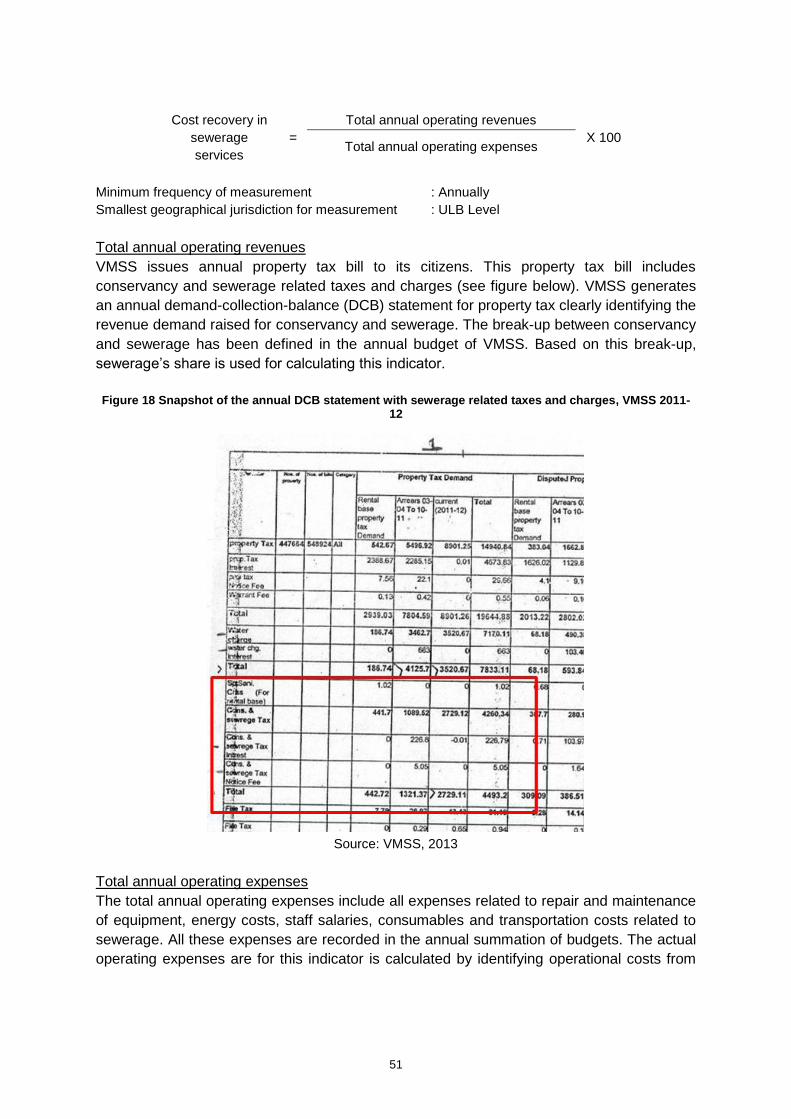
51
Cost recovery in
sewerage
services
=
Total annual operating revenues
X 100 Total annual operating expenses
Minimum frequency of measurement : Annually
Smallest geographical jurisdiction for measurement : ULB Level
Total annual operating revenues
VMSS issues annual property tax bill to its citizens. This property tax bill includes
conservancy and sewerage related taxes and charges (see figure below). VMSS generates
an annual demand-collection-balance (DCB) statement for property tax clearly identifying the
revenue demand raised for conservancy and sewerage. The break-up between conservancy
and sewerage has been defined in the annual budget of VMSS. Based on this break-up,
sewerage’s share is used for calculating this indicator.
Figure 18 Snapshot of the annual DCB statement with sewerage related taxes and charges, VMSS 2011-
12
Source: VMSS, 2013
Total annual operating expenses
The total annual operating expenses include all expenses related to repair and maintenance
of equipment, energy costs, staff salaries, consumables and transportation costs related to
sewerage. All these expenses are recorded in the annual summation of budgets. The actual
operating expenses are for this indicator is calculated by identifying operational costs from

52
the budget heads of VMSS. A total of 35 budget items15 (codes) are summed to arrive at this
figure. However, there is lateral movement within VMSS’ staff while their salaries are drawn
from the original departments. This creates some inconsistency in calculating actual
operational expenses.
Although, basic principles of double-entry accounting system are followed, accrual based
accounting is not followed completely.
Based on the above method, this indicator receives reliability scale ‘B’.
Recommendations
Same as ‘Indicator 1.8: Cost recovery in water supply services’.
Indicator 2.9: Efficiency in collection of sewage charges
This indicator provides the efficiency of the ULB in collecting sewerage related charges from
the citizen. This indicator is calculated as a ratio of demand raised (or billed) for sewerage
related taxes and charges and actual collection done by the ULB. The formula for this
indicator is expressed as:
Efficiency in
collection of
sewage charges
=
Current revenues collected in the
given year X 100
Total operating revenues billed during
the given year
Minimum frequency of measurement : Annually
Smallest geographical jurisdiction for measurement : Zone/ DMA Level
Total operating revenues billed during the given year
This information is generated by VMSS in the annual DCB statement. VMSS uses the DCB
statement to calculate this indicator.
Current revenues collect in the given year
VMSS uses this information from the annual DCB statement.
Based on this method, the reliability scale of this indicator is ‘A’.
Recommendations
There are no improvements are suggested for this indicator.
15
The budget items (codes) used for calculating operational expenses in sewerage have been provided in Annexure 4.

53
6. Solid waste management
6.1. Existing solid waste management system in Vadodara
A stage wise break-up of the existing SWM system in Vadodara has been discussed below.
Generation
It is estimated by VMSS that Vadodara generated around 750 MT of municipal solid waste
daily. This waste is generated by various category of sources such as households
(domestic), markets and institutions, commercial establishments, small hotels/ restaurants/
tea stalls, street sweeping, large hotels/ restaurants/ party plots, dead animals, construction
and demolition (C&D) waste, temples and e-waste. VMSS has not conducted any survey to
ascertain the quantity of waste generated by each type of source. However, solid waste
management (SWM) staff broadly estimates source-wise quantity to plan collection. For
example, based on an informal reconnaissance survey, the SWM department estimated the
organic waste generation from temples to be around 1 MT.
Segregation
As of 2013-14, no segregation of waste is being practiced at source by the generator, except
organic waste (comprising of flowers and fruits) from temple and organic waste from
kitchens of large hotels and restaurants. All other waste is collected in a mixed state
including C&D waste. There is no formal segregation being practiced by VMSS at any
intermediate point. Segregation is practiced at the processing plant in order to recycle the
waste.
Collection
VMSS collects waste by broadly 6 streams. These are based on the source of generation.
The diagram below explains the collection process based on the source of generation.
Waste from households and small markets is collected through the door-to-door collection
system. VMSS has engaged private contractors for this service. In addition to this waste,
organic waste from large hotels’ and restaurants’ kitchen and from temple is also collected
through a special door-to-door service.
Waste generated by street sweeping, C&D, commercial establishments and small hotels/
restaurants/ tea stalls is collected through secondary collection bins while e-waste collection
is done through a call-based door step collection service.
Transportation
All waste collected is transport by VMSS or its contractors from the collection points to either
waste processing plants or to open dumping sites. VMSS has engaged private contractors
for door-to-door collection and transportation service (upto the processing plant/ open
dumping site) using mini-vans (1 MT capacity) and compactors (12 MT capacity). Secondary
collection bins are transported using dumper placers and nuisance spots are cleared using
tractor-trolleys. Special vehicles have been deployed for collection of waste from other
sources such as temples, large hotels/ restaurants/ party plots and e-waste. VMSS is
constructing a transfer station at Atladara also to double-up as a waste sorting and
segregation facility.
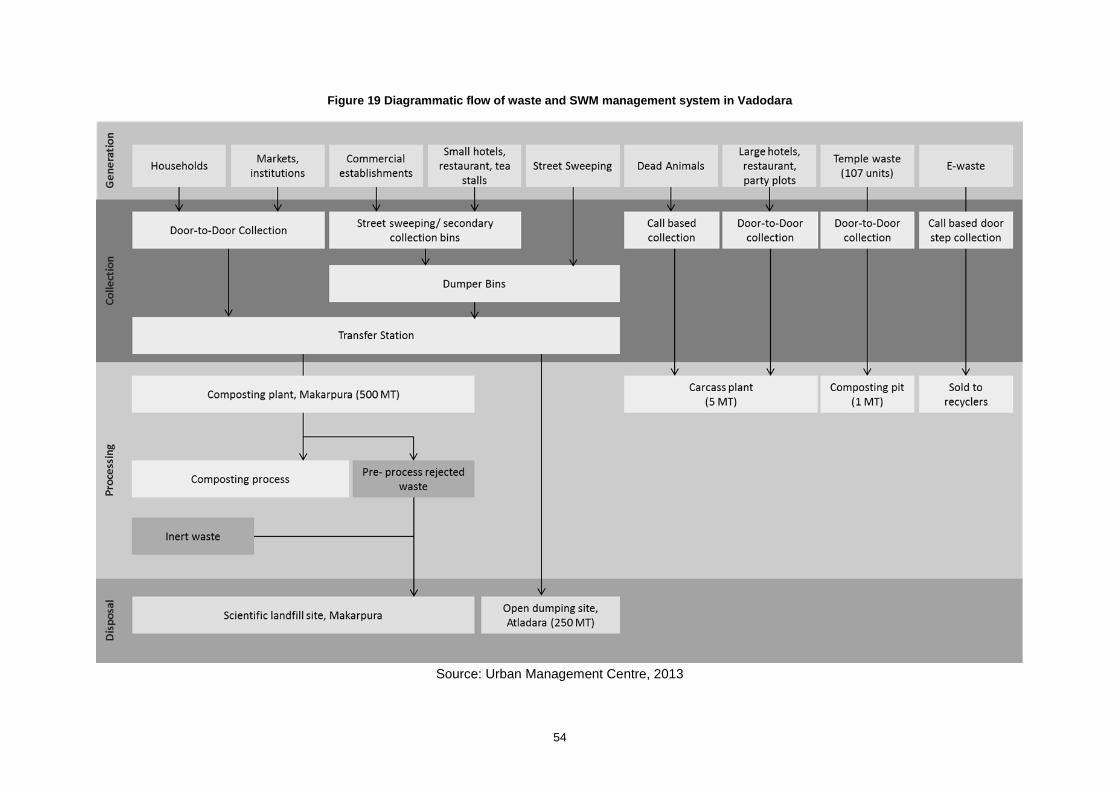
54
Figure 19 Diagrammatic flow of waste and SWM management system in Vadodara
Source: Urban Management Centre, 2013
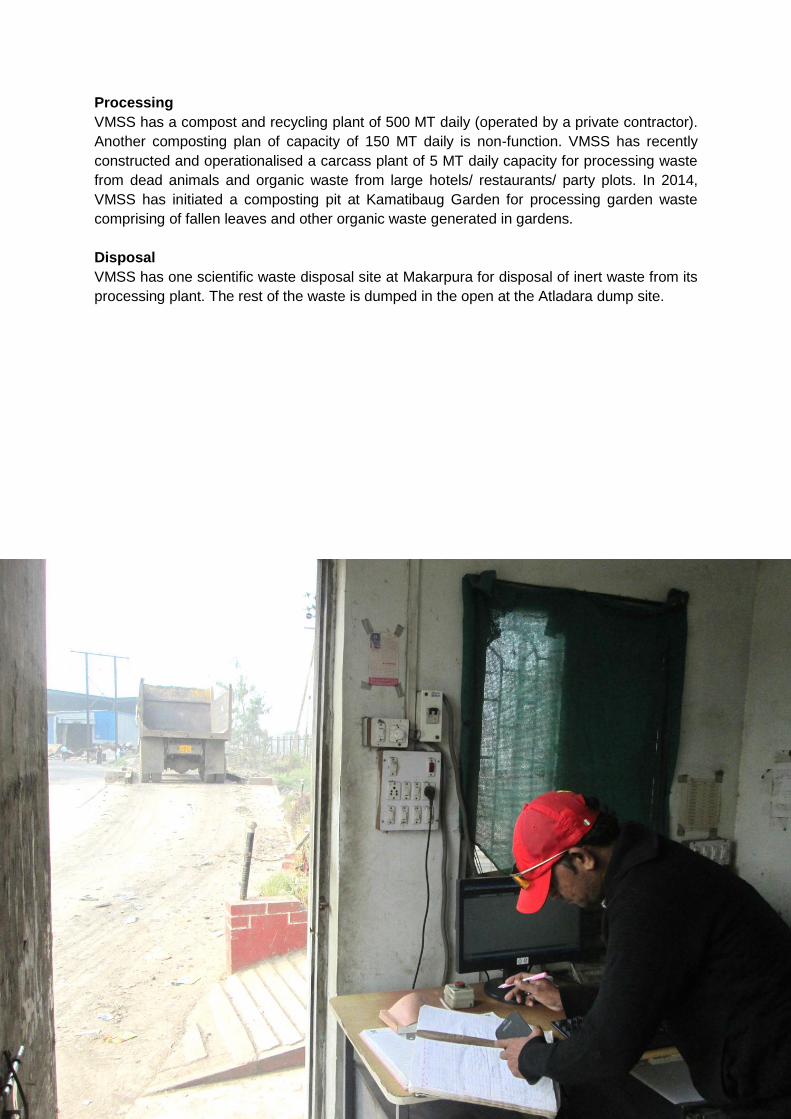
55
Processing
VMSS has a compost and recycling plant of 500 MT daily (operated by a private contractor).
Another composting plan of capacity of 150 MT daily is non-function. VMSS has recently
constructed and operationalised a carcass plant of 5 MT daily capacity for processing waste
from dead animals and organic waste from large hotels/ restaurants/ party plots. In 2014,
VMSS has initiated a composting pit at Kamatibaug Garden for processing garden waste
comprising of fallen leaves and other organic waste generated in gardens.
Disposal
VMSS has one scientific waste disposal site at Makarpura for disposal of inert waste from its
processing plant. The rest of the waste is dumped in the open at the Atladara dump site.
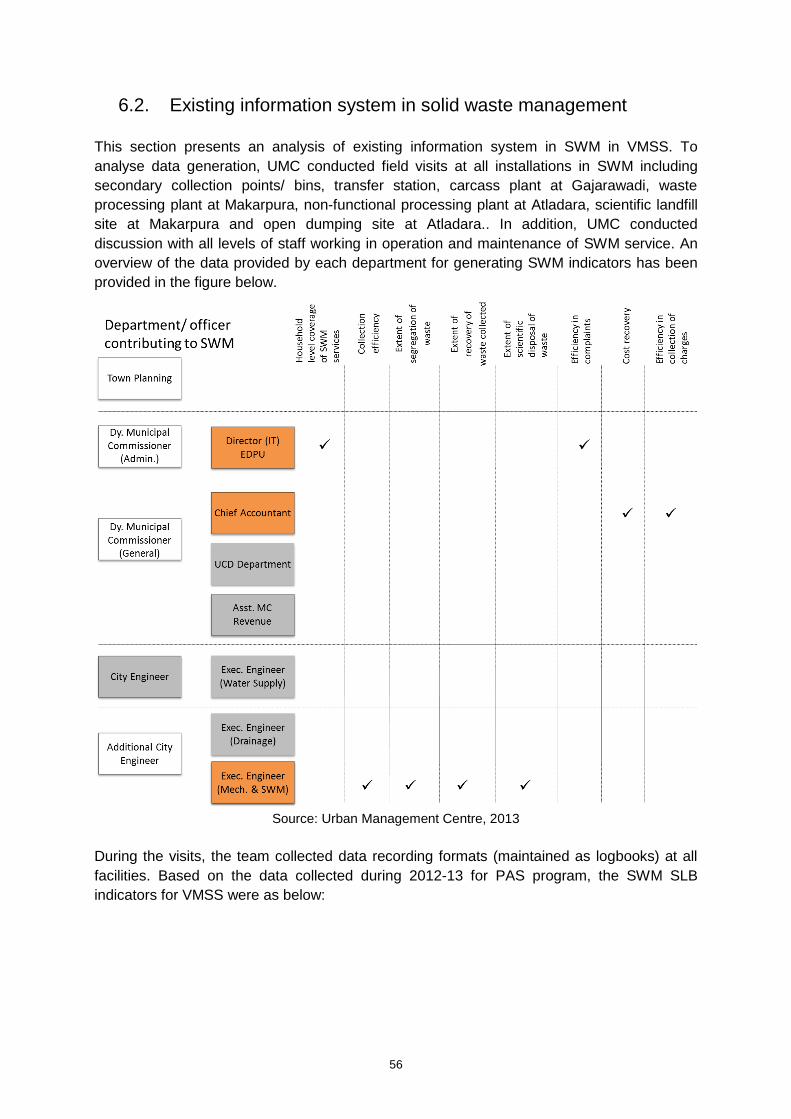
56
6.2. Existing information system in solid waste management
This section presents an analysis of existing information system in SWM in VMSS. To
analyse data generation, UMC conducted field visits at all installations in SWM including
secondary collection points/ bins, transfer station, carcass plant at Gajarawadi, waste
processing plant at Makarpura, non-functional processing plant at Atladara, scientific landfill
site at Makarpura and open dumping site at Atladara.. In addition, UMC conducted
discussion with all levels of staff working in operation and maintenance of SWM service. An
overview of the data provided by each department for generating SWM indicators has been
provided in the figure below.
Source: Urban Management Centre, 2013
During the visits, the team collected data recording formats (maintained as logbooks) at all
facilities. Based on the data collected during 2012-13 for PAS program, the SWM SLB
indicators for VMSS were as below:

57
Table 7 Performance indicators of VMSS in SWM as per the SLB framework
S. No SWM indicator values Unit FY 2012-13
1 Household level coverage of solid waste management services %
100.0
2 Efficiency of collection of municipal solid waste % 98.56
3 Extent of segregation of municipal solid waste % 0
4 Extent of municipal solid waste recovered % 100
5 Extent of scientific disposal of municipal solid waste % 100.0
6 Extent of cost recovery in solid waste management services %
6.7
7 Efficiency in collection of solid waste management charges %
84.2
8 Efficiency in redressal of customer complaints % 100.0
Source: (PAS, 2013)
To conduct assessment of data collation or summarisation and its report to higher officials,
UMC tracked the flow of information from various facilities to VMSS head office. The analysis
conducted for SWM’s existing information system has been presented using the following:
- Flow diagram showing generation, collection, transportation, processing and disposal
of waste
- Information flow diagram from various facilities related to SWM to the head office of
VMSS
- Gap analysis in existing information system clearly identifying data not generated/
recorded and recommendations to capture such data
- Gap analysis in existing data recording formats and recommendations to fulfil them as
per SLB framework
While providing recommendations, UMC’s approach has been to make minimal modifications
in the existing formats. Recommendations provided by UMC to fill data gaps include
i) new formats
j) minor modifications to existing formats
k) computerisation of data and defining its flow (both from bottom to top and vice-versa)
l) outlining equipment and manpower requirements for filling in the data gaps and
improving reliability bands
A detailed assessment of the information system reveals that information should be collected from several field locations and administrative offices within VMSS as shown below.

58
Figure 20 Information flow diagram for calculating SWM related performance indicators as per SLB framework
Source: Urban Management Centre, 2013
In the above diagram, the data sets highlighted are the ones which are not recorded by VMSS. Some data from the highlighted sets requires
additional infrastructure, studies or surveys to be generated.

59
Summary of recommendations for improvement of SWM information system
For the purposes of ISIP, new formats have been proposed in the subsequent sections for
data sets which are generated by not recorded. This ISIP also proposes format required to
capture information through proposed surveys, studies and recording using the proposed
infrastructure.
Process improvements, studies and surveys proposed
The following process improvements, studies and surveys have been recommended:
General (departments other than SWM)
1. VMSS’ Revenue Department uses hand-drawn maps of the city as a part of the
property tax database. UMC recommends that these maps be digitised with
property tax information linked as attributes. In addition, routes of all door-to-door
collection vehicles have already been mapped by VMSS. The 2 sets of spatial
information can be overlapped and exact number of HHs/ properties served can
be ascertained. Digitisation of the property tax maps has been discussed earlier in
‘Indicator 2.1: Coverage of toilets’.
2. Digitise complaints logbooks – same as water supply section.
3. Accrual based double-entry accounting – same as water supply section.
4. Sharing of staff, machinery & equipment and consumables – same as water
supply section.
SWM Department
5. Conduct a sample survey on quarterly basis for various types of waste generators
to ascertain the average per capita waste generation.
6. Conduct trend analysis of bulk waste generators such as temples, construction
and demolition waste, etc.
7. Formulate public health bye-laws for implementing segregation at source.
8. Conduct a study for assessing quantity of waste recycled by waste pickers.
9. Create an inventory and list of private composting initiatives in the city to ascertain
the quantity of waste processed at them.
Infrastructure proposed
In addition to the above forms, the following infrastructural improvements have been
recommended:
1. Enforce segregation at source as per the public health bye-laws.
2. Create partitioned vehicles for transporting waste in a segregated manner.
New forms proposed/ existing forms modified
S. No. Proposed/
Modified
Form No. Title of the form
1. Proposed Form SW01 Households and establishments covered by door-to-door
collection of waste
2. Proposed Form SW02 Waste segregation
3. Proposed Form SW03 Waste recovered in the city
Indicator-wise details including gaps and recommendations have been discussed in the
following section.

60
6.3. Data generation, recording and transfer practices in VMSS –
gaps and recommendations
VMSS captures data from various facilities through logbooks. Data is generated at West
Zone office for door-to-door collection16 and quantity of waste collected is measured at the
temporary transfer station through a weigh bridge operated by VMSS at Atladara. In addition,
data related to collection of waste from secondary collection bins, temples, street sweeping
and nuisance spots is maintained by the SWM Department located near VMSS head office at
Khanderao Market. Data related to quantity of waste collected from dead animals and large
hotels/ restaurants/ party plots is recorded at the carcass plant at Gajarawadi. Data of waste
processing is generated at the processing plant at Makarpura. The data related to scientific
landfill site is also generated at the landfill site at Makarpura. All data generated at various
facilities is transferred to the SWM Department office periodically as per the private
operators’ respective terms of reference.
For calculating some SLB indicators, the SWM Department uses this data. As per the SLB
framework, most of the data is captured by VMSS with some gaps.
The following section analyses existing forms used by VMSS to record data required for
generation of SWM related SLB indicators. The analysis also identifies practices adopted by
VMSS (or its private contractors) to capture data, local collation/ summarisation/ totalling,
data transfer, city level collation & reporting and review & decision making processes for
sewerage. The analysis has been conducted indicator-wise.
Indicator 3.1: Household level coverage of solid waste management services
This indicator measures the number of households which are covered by daily doorstep
collection system. This indicator is calculated using the following formula:
HH level coverage
of door-to-door
collection of waste
=
Total no. of HHs and establishments with daily
doorstep collection X 100
Total no. of HHs and establishments in the service
area
Minimum frequency of measurement : Quarterly
Smallest geographical jurisdiction for measurement : Ward Level
Total number of households and establishments with daily doorstep collection
VMSS levies tax and user charges related to conservancy from all properties within its
jurisdiction. Hence, exact number of properties served by doorstep collection of waste cannot
be ascertained from the property tax data. VMSS currently assumes that all properties are
covered by the door-to-door collection service and reports the indicator based on this
assumption.
16
The private contract engaged by VMSS has been provided a GPS-based vehicle monitoring control room at the West Zone office of VMSS.
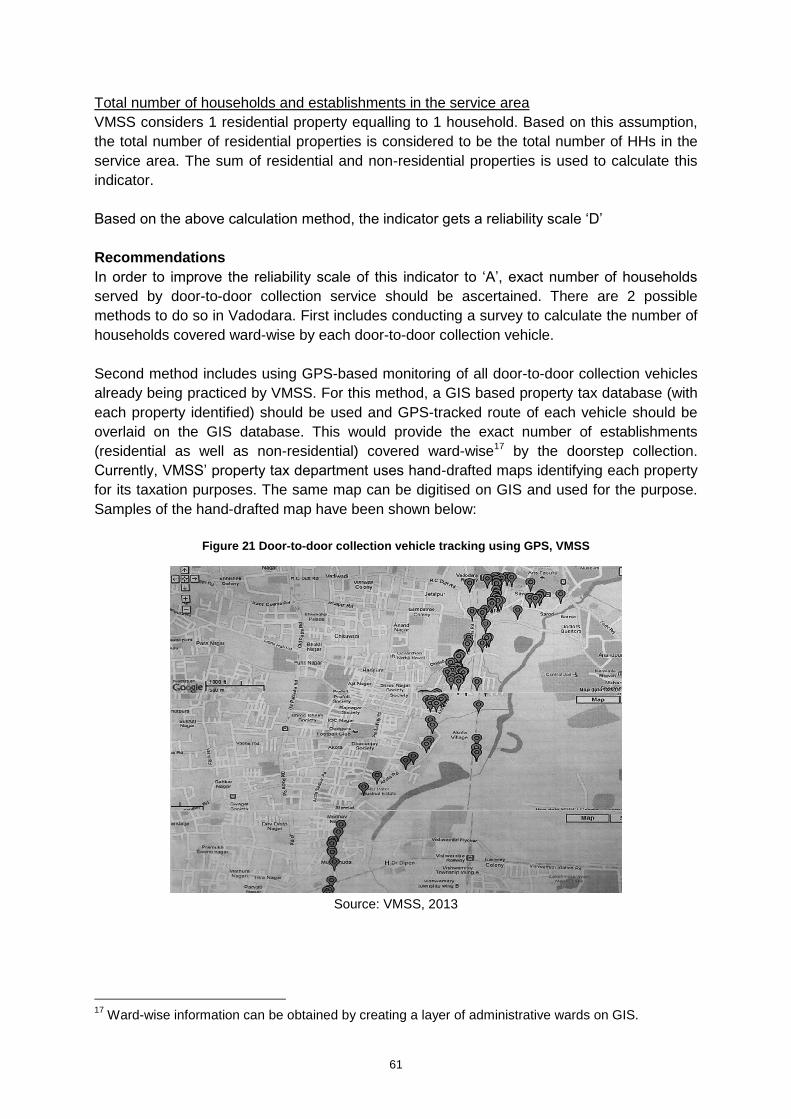
61
Total number of households and establishments in the service area
VMSS considers 1 residential property equalling to 1 household. Based on this assumption,
the total number of residential properties is considered to be the total number of HHs in the
service area. The sum of residential and non-residential properties is used to calculate this
indicator.
Based on the above calculation method, the indicator gets a reliability scale ‘D’
Recommendations
In order to improve the reliability scale of this indicator to ‘A’, exact number of households
served by door-to-door collection service should be ascertained. There are 2 possible
methods to do so in Vadodara. First includes conducting a survey to calculate the number of
households covered ward-wise by each door-to-door collection vehicle.
Second method includes using GPS-based monitoring of all door-to-door collection vehicles
already being practiced by VMSS. For this method, a GIS based property tax database (with
each property identified) should be used and GPS-tracked route of each vehicle should be
overlaid on the GIS database. This would provide the exact number of establishments
(residential as well as non-residential) covered ward-wise17 by the doorstep collection.
Currently, VMSS’ property tax department uses hand-drafted maps identifying each property
for its taxation purposes. The same map can be digitised on GIS and used for the purpose.
Samples of the hand-drafted map have been shown below:
Figure 21 Door-to-door collection vehicle tracking using GPS, VMSS
Source: VMSS, 2013
17
Ward-wise information can be obtained by creating a layer of administrative wards on GIS.

62
Figure 22 Hand-drafted maps identifying each property used by VMSS' property tax department
Key map (top left); Map of a single tile (top right); Close-up of the map with property details (bottom)
Source: VMSS, 2013
The proposed Form SW01 provided below can be used for documenting the number of
properties covered by door-to-door collection of waste.
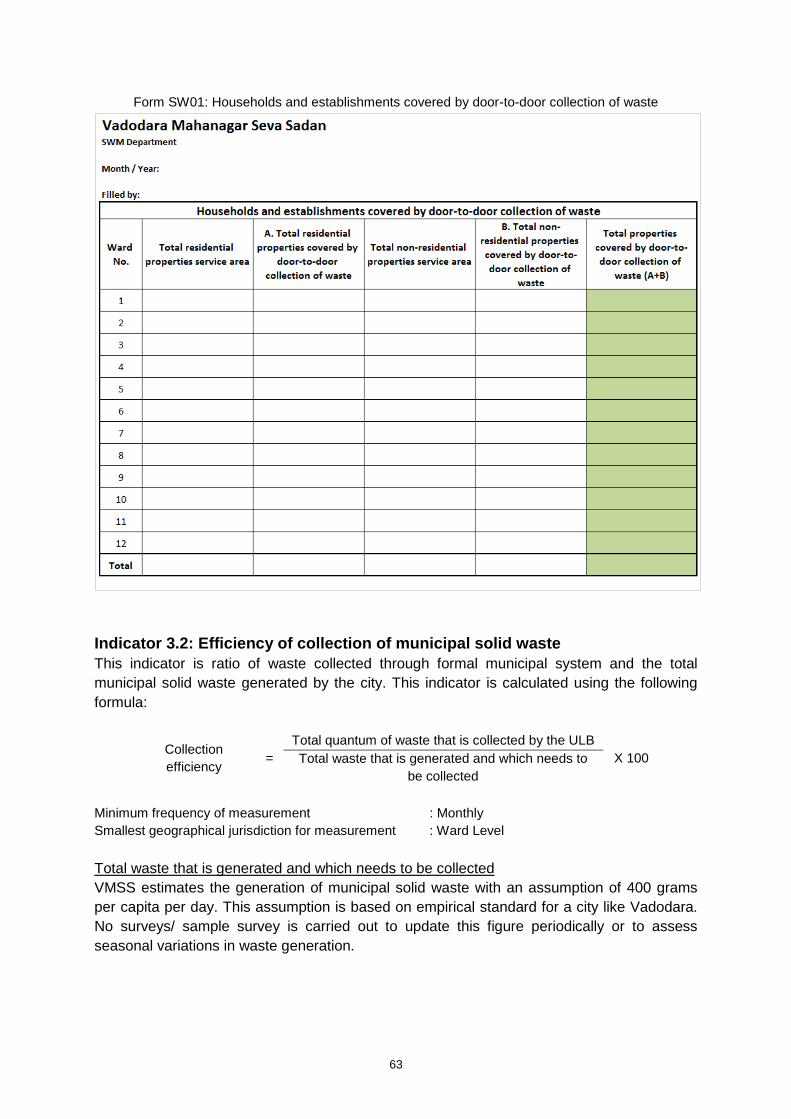
63
Form SW01: Households and establishments covered by door-to-door collection of waste
Indicator 3.2: Efficiency of collection of municipal solid waste
This indicator is ratio of waste collected through formal municipal system and the total
municipal solid waste generated by the city. This indicator is calculated using the following
formula:
Collection
efficiency =
Total quantum of waste that is collected by the ULB
X 100 Total waste that is generated and which needs to
be collected
Minimum frequency of measurement : Monthly
Smallest geographical jurisdiction for measurement : Ward Level
Total waste that is generated and which needs to be collected
VMSS estimates the generation of municipal solid waste with an assumption of 400 grams
per capita per day. This assumption is based on empirical standard for a city like Vadodara.
No surveys/ sample survey is carried out to update this figure periodically or to assess
seasonal variations in waste generation.
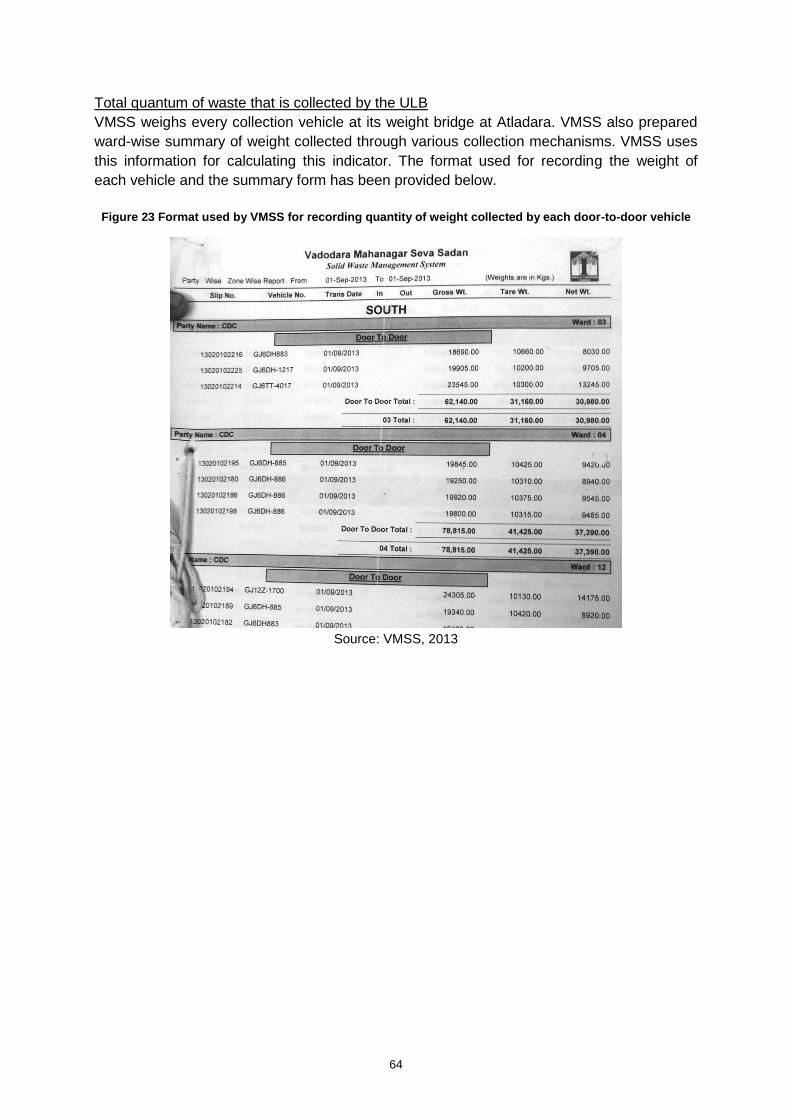
64
Total quantum of waste that is collected by the ULB
VMSS weighs every collection vehicle at its weight bridge at Atladara. VMSS also prepared
ward-wise summary of weight collected through various collection mechanisms. VMSS uses
this information for calculating this indicator. The format used for recording the weight of
each vehicle and the summary form has been provided below.
Figure 23 Format used by VMSS for recording quantity of weight collected by each door-to-door vehicle
Source: VMSS, 2013
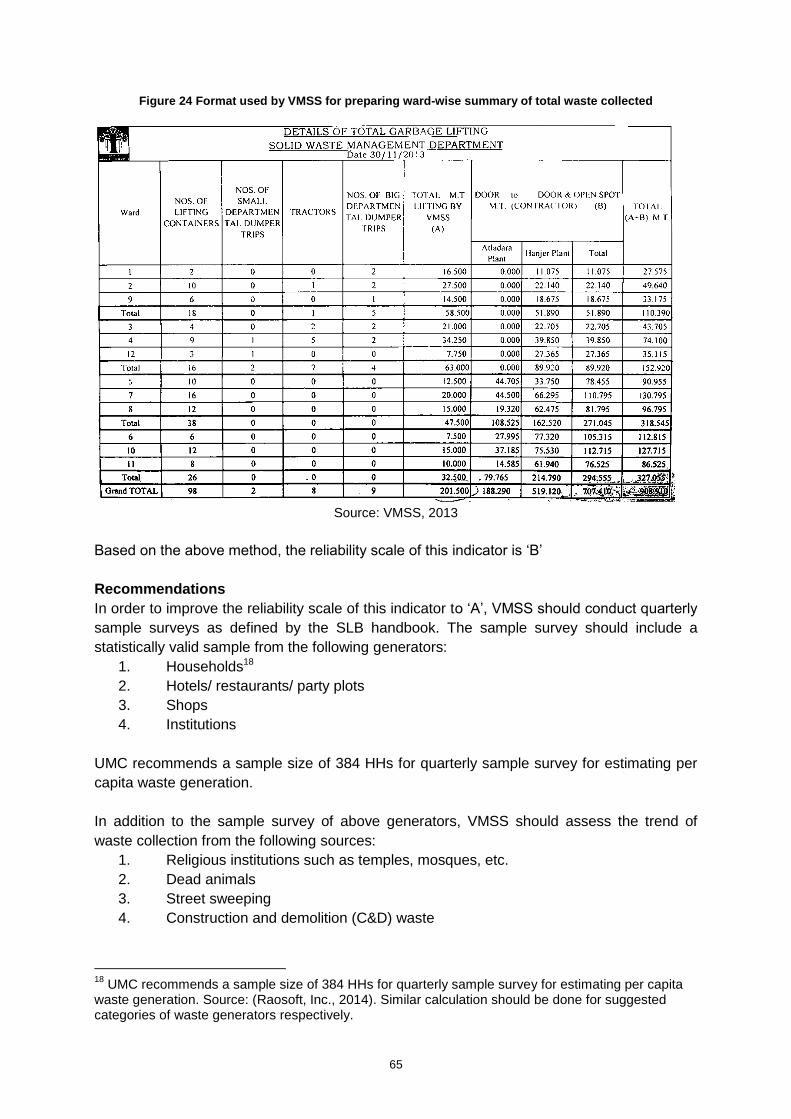
65
Figure 24 Format used by VMSS for preparing ward-wise summary of total waste collected
Source: VMSS, 2013
Based on the above method, the reliability scale of this indicator is ‘B’
Recommendations
In order to improve the reliability scale of this indicator to ‘A’, VMSS should conduct quarterly
sample surveys as defined by the SLB handbook. The sample survey should include a
statistically valid sample from the following generators:
1. Households18
2. Hotels/ restaurants/ party plots
3. Shops
4. Institutions
UMC recommends a sample size of 384 HHs for quarterly sample survey for estimating per
capita waste generation.
In addition to the sample survey of above generators, VMSS should assess the trend of
waste collection from the following sources:
1. Religious institutions such as temples, mosques, etc.
2. Dead animals
3. Street sweeping
4. Construction and demolition (C&D) waste
18
UMC recommends a sample size of 384 HHs for quarterly sample survey for estimating per capita waste generation. Source: (Raosoft, Inc., 2014). Similar calculation should be done for suggested categories of waste generators respectively.

66
Indicator 3.3: Extent of segregation of municipal solid waste
This indicator is ratio of waste collected through formal municipal system and the total
municipal solid waste generated by the city. This indicator is calculated using the following
formula:
Extent of
segregation of
waste
=
Quantum of waste that is segregated X 100
Total quantum of waste that is collected by the ULB
or authorised service providers
Minimum frequency of measurement : Monthly
Smallest geographical jurisdiction for measurement : ULB Level
Quantum of waste that is segregated
VMSS has not enforced segregation of waste by households, commercial or institutional
establishments. Hence, mixed waste is collected from these sources. However, segregation
has been enforced by VMSS for hotels/ restaurants/ party plots and temples. The waste from
these sources is collected and transported in a segregated manner. The quantum of
segregated waste from these sources is measured at the municipal weigh bridge at Atladara
and then sent to their respective processing or disposal sites. VMSS uses this quantum to
calculate this indicator.
Staff of SWM Department does not have any estimate of waste taken away by informal
waste pickers and recyclers from intermediate points.
Total quantum of waste that is collected by the ULB or authorised service providers
This information has been discussed in ‘Indicator 3.2: Efficiency of collection of municipal
solid waste’.
Based on the above computation method, the reliability scale for this indicator is ‘D’.
Recommendations
UMC recommends that in order to improve the reliability scale of this indicator to ‘A’, the
following needs to be undertaken:
1. Initiate segregation of waste at household and commercial establishment level
2. Create provision of collection and transportation of waste in a segregated manner
to the respective processing or disposal site
3. Each vehicle carrying segregated waste should be weighed at the municipal
weigh bridge and data recorded using the proposed SW02 provided below.
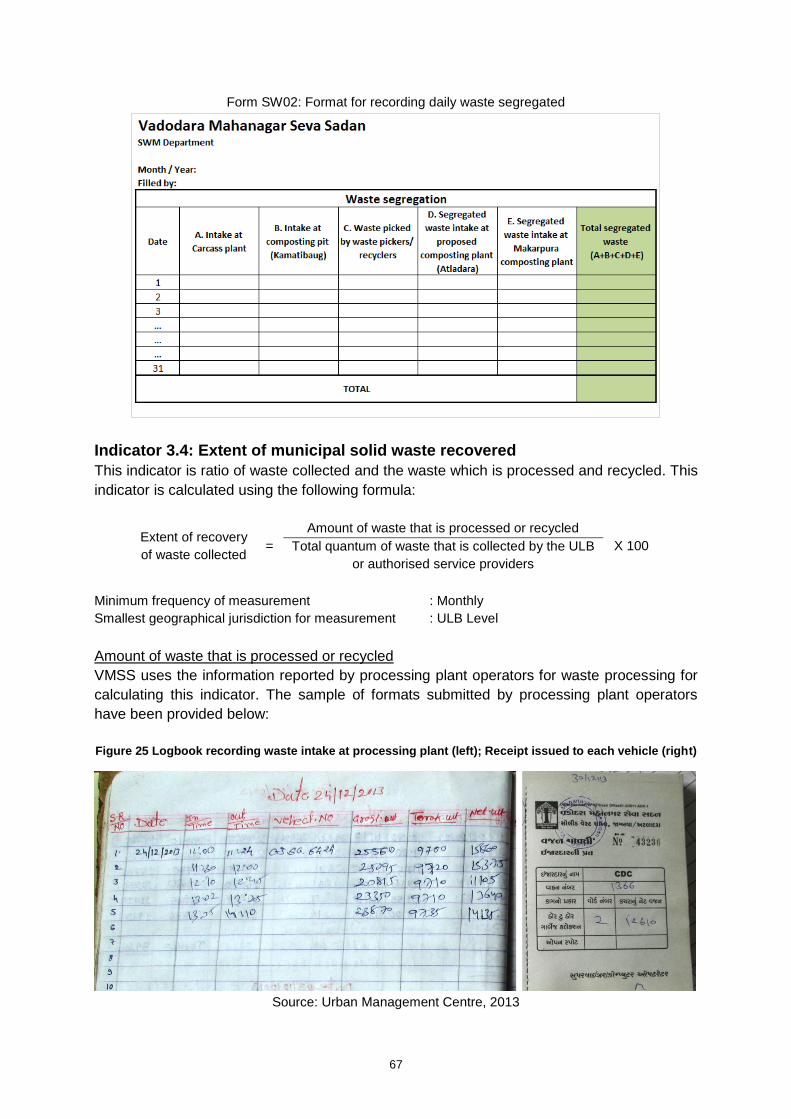
67
Form SW02: Format for recording daily waste segregated
Indicator 3.4: Extent of municipal solid waste recovered
This indicator is ratio of waste collected and the waste which is processed and recycled. This
indicator is calculated using the following formula:
Extent of recovery
of waste collected =
Amount of waste that is processed or recycled
X 100 Total quantum of waste that is collected by the ULB
or authorised service providers
Minimum frequency of measurement : Monthly
Smallest geographical jurisdiction for measurement : ULB Level
Amount of waste that is processed or recycled
VMSS uses the information reported by processing plant operators for waste processing for
calculating this indicator. The sample of formats submitted by processing plant operators
have been provided below:
Figure 25 Logbook recording waste intake at processing plant (left); Receipt issued to each vehicle (right)
Source: Urban Management Centre, 2013
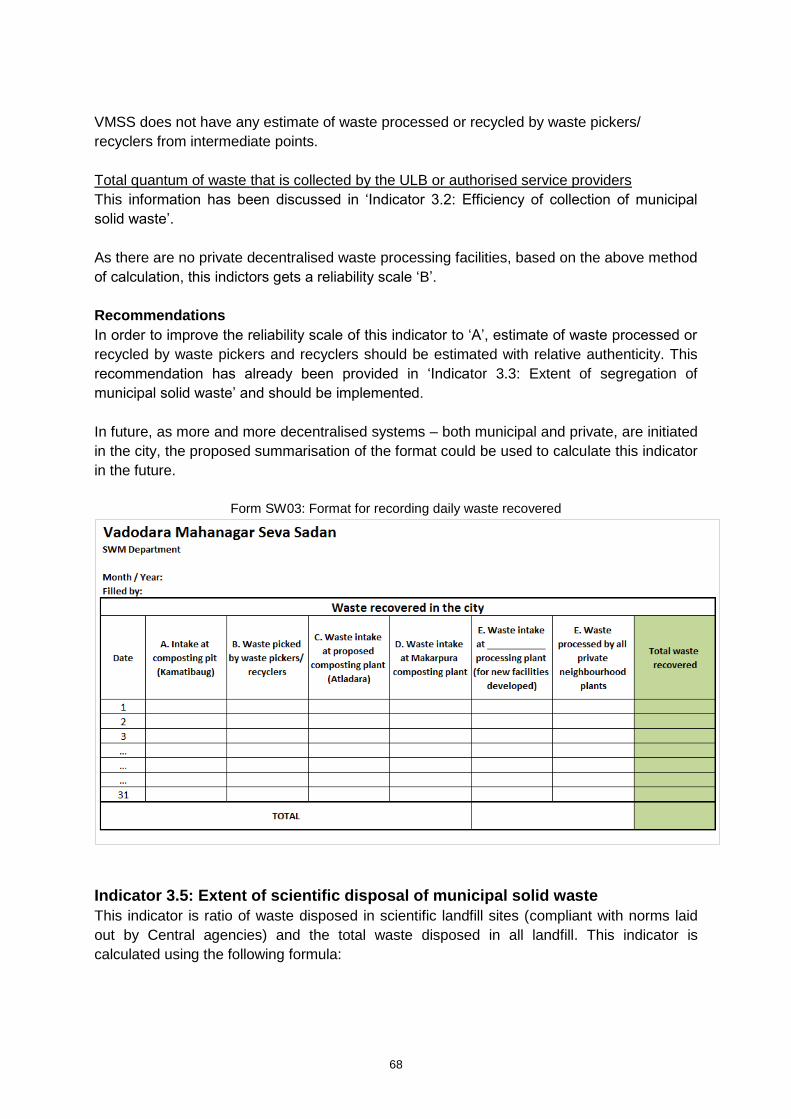
68
VMSS does not have any estimate of waste processed or recycled by waste pickers/
recyclers from intermediate points.
Total quantum of waste that is collected by the ULB or authorised service providers
This information has been discussed in ‘Indicator 3.2: Efficiency of collection of municipal
solid waste’.
As there are no private decentralised waste processing facilities, based on the above method
of calculation, this indictors gets a reliability scale ‘B’.
Recommendations
In order to improve the reliability scale of this indicator to ‘A’, estimate of waste processed or
recycled by waste pickers and recyclers should be estimated with relative authenticity. This
recommendation has already been provided in ‘Indicator 3.3: Extent of segregation of
municipal solid waste’ and should be implemented.
In future, as more and more decentralised systems – both municipal and private, are initiated
in the city, the proposed summarisation of the format could be used to calculate this indicator
in the future.
Form SW03: Format for recording daily waste recovered
Indicator 3.5: Extent of scientific disposal of municipal solid waste
This indicator is ratio of waste disposed in scientific landfill sites (compliant with norms laid
out by Central agencies) and the total waste disposed in all landfill. This indicator is
calculated using the following formula:

69
Extent of scientific
disposal of waste =
Total waste disposed in ‘compliant’ landfills every
month X 100
Total waste disposed in all landfills in a month
Minimum frequency of measurement : Monthly
Smallest geographical jurisdiction for measurement : ULB Level
Total waste disposed in ‘compliant’ landfills every month
VMSS has engaged a landfill site operator and received a monthly report of inert waste
disposed in the landfill site. VMSS uses this information to calculate this indicator. The
reporting format submitted by the private operator has been provided below:
Figure 26 Format reporting quantity of waste disposed in complaint landfill site
Source: VMSS, 2013
The operator of scientific landfill site maintains records of operational practices, routines and
quality monitoring of the facility, and submits a monthly report to VMSS. A sample of quality
testing report has been provided below.

70
Figure 27 Report on quality testing at the complaint landfill site submitted by private opoerator to VMSS
Source: VMSS, 2013
Total waste disposed in all landfills in a month
This information should be compiled by totalling the waste disposed at the compliant landfill
site and at Atladara open dumping site. Alternatively, the total waste collected by VMSS can
be used for calculating this information. The total waste collected has already been
discussed in ‘Indicator 3.2: Efficiency of collection of municipal solid waste’.
Based on this method, the reliability scale of this indicator is ‘A’.
Recommendations
As the reliability scale of this indicator is ‘A’, there are no improvements proposed in the
existing information system.
71
Indicator 3.6: Efficiency in redressal of customer complaints
This indicator provides a measure of effective redressal of complaints related to solid waste
management within 24 hours of being lodged. The formula for this indicator is expressed as:
Efficiency in redressal
of customer
complaints
=
Total number of SWM-related complaints redressed within
the month X 100
Total number of SWM-related complaints received per
month
Minimum frequency of measurement : Monthly
Smallest geographical jurisdiction for measurement : Ward Level
Total number of SWM-related complaints redressed within the month
Same as ‘Indicator 1.7: Efficiency in redressal of customer complaints’ for water supply.
Total number of SWM-related complaints redressed within the month
Same as ‘Indicator 1.7: Efficiency in redressal of customer complaints’ for water supply.
Based on the calculation method adopted by VMSS, the reliability scale of this indicator is ‘B’
with the only gap of collation of manual and online complaints systems.
Recommendations
Same as ‘Indicator 1.7: Efficiency in redressal of customer complaints’ for water supply.
Indicator 3.7: Extent of cost recovery in SWM services
This indicator provides the financial operating health of the SWM department. This indicator
is calculated as a ratio of revenue earned from conservancy (taxes and charges) and
expenses made for providing the service to citizens, excluding capital expenditure. The
formula for this indicator is expressed as:
Cost recovery in
SWM services =
Total annual operating revenues X 100
Total annual operating expenses
Minimum frequency of measurement : Annually
Smallest geographical jurisdiction for measurement : ULB Level
Total annual operating revenues
Same as Indicator 2.8: Cost recovery in sewage management.
Total annual operating expenses
The total annual operating expenses include all expenses related to payments made to a)
service providers for SWM facilities/ services, and b) direct expenses in repair and
maintenance of equipment, energy/ fuel, staff salaries, consumables and transportation
related to SWM. All these expenses are recorded in the annual summation of budgets. The
actual operating expenses are for this indicator is calculated by identifying operational costs

72
from the budget heads of VMSS. A total of 24 budget items19 (codes) are summed to arrive
at this figure. However, there is lateral movement within VMSS’ staff while their salaries are
drawn from the original departments. This creates some inconsistency in calculating actual
operational expenses.
Although, basic principles of double-entry accounting system are followed, accrual based
accounting is not followed completely.
Based on the above method, this indicator receives reliability scale ‘B’.
Recommendations
Same as ‘Indicator 1.8: Cost recovery in water supply services’.
Indicator 3.8: Efficiency in collection of SWM charges
This indicator provides the efficiency of the ULB in collecting SWM related charges from the
citizen. This indicator is calculated as a ratio of demand raised (or billed) for conservancy
related taxes and charges and actual collection done by the ULB. The formula for this
indicator is expressed as:
Efficiency in
collection of SWM
charges
=
Current revenues collected in the
given year X 100
Total operating revenues billed during
the given year
Minimum frequency of measurement : Annually
Smallest geographical jurisdiction for measurement : Ward Level
Total operating revenues billed during the given year
This information is generated by VMSS in the annual DCB statement. VMSS uses the DCB
statement to calculate this indicator.
Current revenues collect in the given year
VMSS uses this information from the annual DCB statement.
Based on this method, the reliability scale of this indicator is ‘A’.
Recommendations
As the reliability scale of this indicator is ‘A’, there are no improvements proposed in the
existing information system.
19
The budget items (codes) used for calculating operational expenses in sewerage have been provided in Annexure 5.
73
7. Summary of recommendations and its implementation
Indicator-wise recommendations have been provided in the previous sections wherever
applicable. Some recommendations are to be implemented by the water supply, sewerage
and SWM department while the rest are to be implemented by other departments of VMSS.
This section provides a summary of all recommendations provided in this study alongwith the
roles and responsibilities of various departments of VMSS.
Process improvement, studies and surveys proposed
The following process improvement, studies and surveys have been recommended:
General (Accounts, EDP, TP and Revenue Department)
1. Strengthening of the existing SLB cell by employing a full-time coordinator.
2. Develop a software/ intranet system for collating data available on a municipal
MIS-like system and generating monitoring reports.
3. Digitise complaints logbooks placed at various ward offices and water supply
facilities in the city. Alternatively, where manual registers are maintained, a
computer should be installed and connected to the main online complaints system
of VMSS.
4. Ensure adherence to accrual based double-entry accounting system to ascertain
actual expenses and revenues for each year.
5. Document sharing of staff, machinery & equipment and consumables (such as
fuel, spares, etc.) and its related department-wise expenses incurred.
6. Modify the property tax re-assessment form to include information regarding
access to individual toilet in each property.
7. Digitise hand-drawn maps of the city (used by Revenue Dept. for property tax)
with property tax information linked as attributes.
8. Prepare estimates of the floating population for the city.
Water Supply Department 1. Conduct a sample survey at consumers’ end to assess the quantity of water
reaching the consumers, duration of supply and pressure at which the water is
supplied to the consumer.
2. Plan and conduct water quality tests using UMC’s MS Excel based tools in
compliance with CPHEEO norms.
3. Engages a 3rd party to conduct an independent periodic water quality assessment.
Sewerage Department i. Conduct a survey of private borewells in the city to assess quantity of water
produced by these and hence, quantity of sewerage generated.
ii. Conduct a survey of all public toilets in the city alongwith precise locations.
iii. Plan and conduct sewage quality testing in compliance with CPHEEO norms.
iv. Work in close coordination with the Water Supply Department to ascertain the
exact quantity of sewage generated based on the water supplied to the city.
SWM Department 1. Conduct a sample survey on quarterly basis for various types of waste generators
to ascertain the average per capita waste generation.
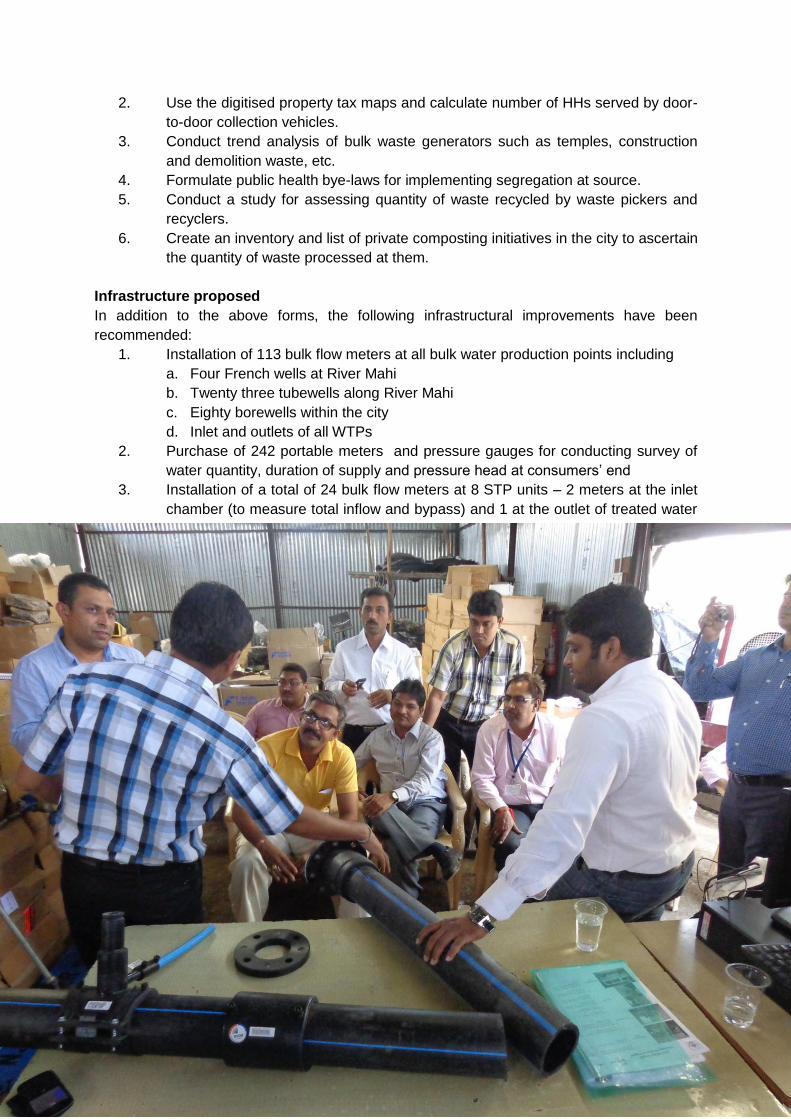
74
2. Use the digitised property tax maps and calculate number of HHs served by door-
to-door collection vehicles.
3. Conduct trend analysis of bulk waste generators such as temples, construction
and demolition waste, etc.
4. Formulate public health bye-laws for implementing segregation at source.
5. Conduct a study for assessing quantity of waste recycled by waste pickers and
recyclers.
6. Create an inventory and list of private composting initiatives in the city to ascertain
the quantity of waste processed at them.
Infrastructure proposed
In addition to the above forms, the following infrastructural improvements have been
recommended:
1. Installation of 113 bulk flow meters at all bulk water production points including
a. Four French wells at River Mahi
b. Twenty three tubewells along River Mahi
c. Eighty borewells within the city
d. Inlet and outlets of all WTPs
2. Purchase of 242 portable meters and pressure gauges for conducting survey of
water quantity, duration of supply and pressure head at consumers’ end
3. Installation of a total of 24 bulk flow meters at 8 STP units – 2 meters at the inlet
chamber (to measure total inflow and bypass) and 1 at the outlet of treated water
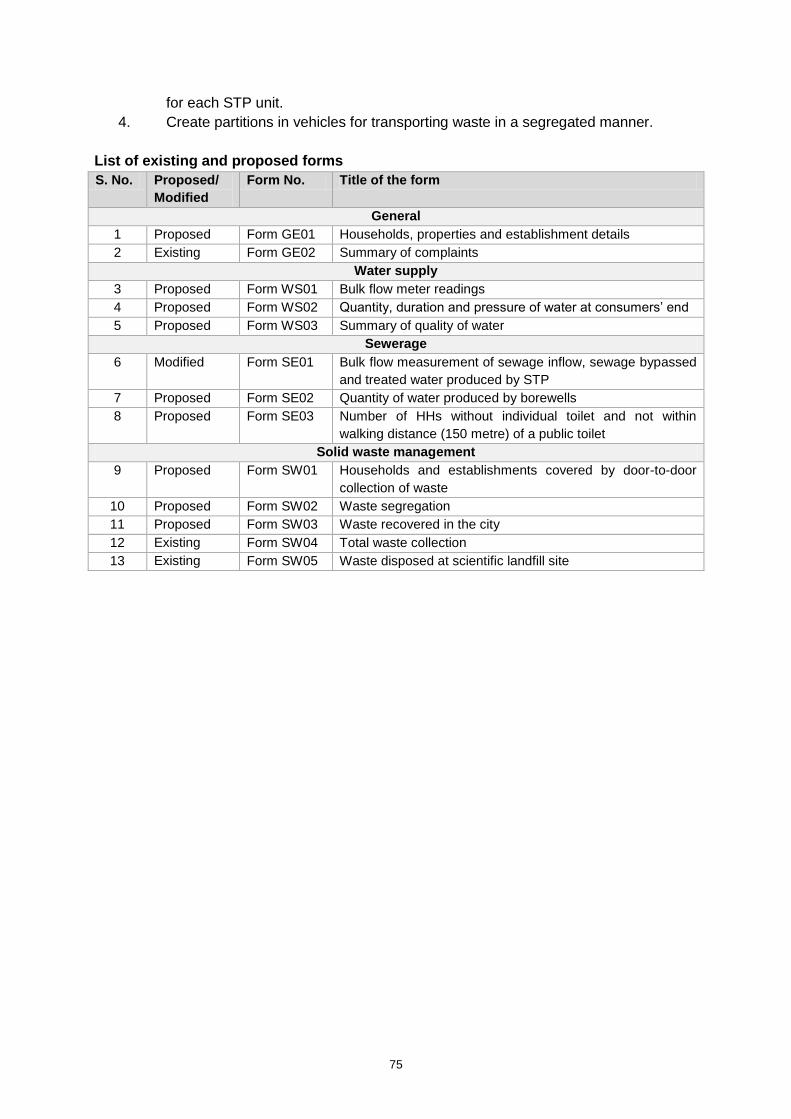
75
for each STP unit.
4. Create partitions in vehicles for transporting waste in a segregated manner.
List of existing and proposed forms
S. No. Proposed/
Modified
Form No. Title of the form
General
1 Proposed Form GE01 Households, properties and establishment details
2 Existing Form GE02 Summary of complaints
Water supply
3 Proposed Form WS01 Bulk flow meter readings
4 Proposed Form WS02 Quantity, duration and pressure of water at consumers’ end
5 Proposed Form WS03 Summary of quality of water
Sewerage
6 Modified Form SE01 Bulk flow measurement of sewage inflow, sewage bypassed
and treated water produced by STP
7 Proposed Form SE02 Quantity of water produced by borewells
8 Proposed Form SE03 Number of HHs without individual toilet and not within
walking distance (150 metre) of a public toilet
Solid waste management
9 Proposed Form SW01 Households and establishments covered by door-to-door
collection of waste
10 Proposed Form SW02 Waste segregation
11 Proposed Form SW03 Waste recovered in the city
12 Existing Form SW04 Total waste collection
13 Existing Form SW05 Waste disposed at scientific landfill site

76
Table 8 Proposed indicator-wise forms used for data inputs

77
Budget for implementation of ISIP
The following table provides a detailed budget estimate for implementation of the recommendations of this ISIP. The key categories of
budgeting are:
i. Computerisation
ii. Strengthening of SLB cell
iii. Improvements in information system for water supply
iv. Improvements in information system for sewerage
v. Improvements in information system for SWM
The costs are either one-time costs (such as infrastructure) or annual recurring costs (such as salaries, consumables, etc.). The total amount
required for implementation is INR 6.07 crores for the first year and an annual recurring cost of INR 2.33 crores.
All figures in INR.
Calculations are based on prevailing rates as of 2013-14. Detailed estimates should be prepared based on applicable Schedule of Rates.
Items Unit Quantity Rate Amount (INR)
One-time/ Annual
Computerisation (A)
32,10,000
Digitisation of property tax maps sqkm 160.0 10,000 16,00,000 One-time
Cost of modifications to property tax re-assessment form No cost - - - One-time
Improving complaints mechanism
Installation of computers at 12 ward offices No. 12.0 35,000 4,20,000 One-time
Installation of computers at 31 WDS No. 31.0 35,000 10,85,000 One-time
Installation of computers at 3 WTPs No. 3.0 35,000 1,05,000 One-time
Strengthening of SLB cell (B)
14,80,000
Salary of SLB Coordinator (Annual) Lumpsum 1.0 4,80,000 4,80,000 Annual
Software for ISIP Lumpsum 1.0 10,00,000 10,00,000 One-time
Water Supply (C)
3,94,20,000
Implementing accrual based double entry accounting No cost
- - Annual
Accounting based on sharing of staff and resources No cost
- - Annual

78
Items Unit Quantity Rate Amount (INR)
One-time/ Annual
Consumers' end sample survey for quantity, duration and pressure (Yearly)
Portable consumer meters No. 242.0 3,000 7,26,000 One-time
Pressure gauges No. 242.0 2,000.0 4,84,000 One-time
Personnel salary (Annual) Personnel 242.0 60,000 1,45,20,000 Annual
Compliance to water quality monitoring as per CPHEEO (Yearly)
Annual cost of personnel for sampling at consumers' end Personnel 5.0 1,20,000 6,00,000 Annual
Consumables for sampling Monthly 12.0 10,000 1,20,000 Annual
Lab test costs No cost - - - Annual
Independent water quality testing Monthly 12.0 10,000 1,20,000 Annual
Study for preparing estimates of floating population (yearly) No. 1.0 5,00,000 5,00,000 Annual
Installation of bulk flow meters
-
At 4 French wells (meter + automatic meter reading device) No. 4.0 2,00,000 8,00,000 One-time
At 23 tubewells (meter + automatic meter reading device) No. 23.0 2,00,000 46,00,000 One-time
At 80 borewells (meter + automatic meter reading device) No. 80.0 2,00,000 1,60,00,000 One-time
At outlets of 3 WTPs (meter + automatic meter reading device) No. 3.0 2,00,000 6,00,000 One-time
Software for meter readings Lumpsum 1.0 3,50,000 3,50,000 One-time
Sewerage (D)
1,01,50,000
Cost of modifications to property tax re-assessment form Lumpsum 1.0 - -
Survey of all public toilets in the city Lumpsum 1.0 10,00,000 10,00,000 One-time
Installation of bulk flow meters
Installation of bulk flow meters at inlets and outlets of all STP units (meter + automatic meter reading device)
No. 24.0 2,00,000 48,00,000 One-time
Software for meter readings Lumpsum 1.0 3,50,000 3,50,000 One-time
Survey of private borewells Lumpsum 1.0 30,00,000 30,00,000 Annual
Sewage quality testing compliance with CPHEEO Lumpsum 1.0 10,00,000 10,00,000 Annual
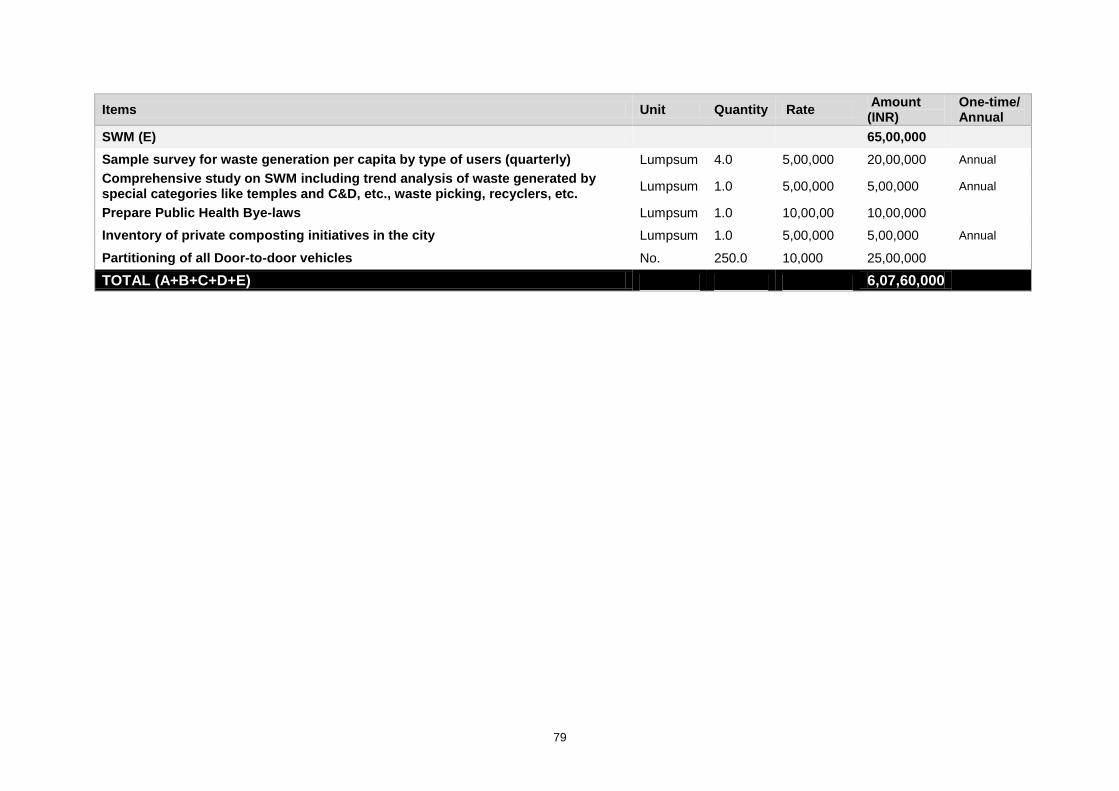
79
Items Unit Quantity Rate Amount (INR)
One-time/ Annual
SWM (E)
65,00,000
Sample survey for waste generation per capita by type of users (quarterly) Lumpsum 4.0 5,00,000 20,00,000 Annual
Comprehensive study on SWM including trend analysis of waste generated by special categories like temples and C&D, etc., waste picking, recyclers, etc.
Lumpsum 1.0 5,00,000 5,00,000 Annual
Prepare Public Health Bye-laws Lumpsum 1.0 10,00,00 10,00,000
Inventory of private composting initiatives in the city Lumpsum 1.0 5,00,000 5,00,000 Annual
Partitioning of all Door-to-door vehicles No. 250.0 10,000 25,00,000
TOTAL (A+B+C+D+E) 6,07,60,000

80
8. Way forward
This ISIP identifies the gaps in existing information system of VMSS to calculate reliable SLB
indicators for water supply, sewerage and SWM sectors. The plan also defines roles and
responsibilities of each department and outlines overall estimate for each recommendation.
While implementing the recommendations, UMC suggests that the following activities be
undertaken
1. Explore technological options for automated SMS/ GPRS based meter/ valve
operation data recordings mechanisms and assess their suitability for water supply
system in VMSS20.
2. Design dashboards for staff at various levels (Junior Engg., Deputy Executive Engg.,
Executive Engg., Additional City Engg., City Engg., Municipal Commissioner, etc.)
based on their needs.
3. Design/ modify/ augment internal data flow and reporting within VMSS.
Municipal information improvement is the first step which VMSS has taken towards
managing its resources and taking a step towards smart city. World-over cities are utilising
‘big data’ to improve their service delivery to the citizens. VMSS should study how cities
around the world are adopting smart city concepts to improve their services.
20
Based on the existing situation assessment, it revealed that VMSS has minimal reliable data recording practices/ equipment, and hence most of the indicators fall in reliability grade D. In order to implement any ISIP initiative, a bulk metering to assess the total quantity of water supplied is absolutely essential. With this premise, in order to proceed with the ISIP the following hardware/ equipment installations are necessary
1. Installation of bulk meters at all sources (4 French Wells & 100+ tubewells) and 27 WDS 2. Installation of automatic (SMS/ GPRS based) data recording devices and software at all bulk
meters 3. Installation of bulk meters and devices to record valve operation timings for 2000+ valves in
the distribution network alongwith installation of SMS/ GPRS based automatic recording devices
4. Software for data compilation, processing and reporting

81
Bibliography
Census of India. (2011). Provisional Population Totals Paper 2 of 2011 India Series 1. Retrieved November 14, 2011, from Census of India: http://www.censusindia.gov.in/2011-prov-results/paper2/data_files/india/paper2_at_a_glance.pdf
Ministry of Urban Development. (2009). Handbook of Service Level Benchmarking. New Delhi: Government of India.
PAS. (2013). Data checklist for calculation of SLB indicators, Vadodara Mahanagar Seva Sadan. Unpublished. Vadodara: Performance Assessment System.
Raosoft, Inc. (2014). Sample size calculator. Retrieved July 09, 2014, from Raosoft: http://www.raosoft.com/samplesize.html
Vadodara Mahanagar Seva Sadan. (2011, June). Water Supply in Vadodara. Vadodara.
Vadodara Mahanagar Seva Sadan. (2013a). Data provided by VMSS during various meetings, discussions and field visits. Vadodara, Gujarat, India: Unpublished Data.
Vadodara Mahanagar Seva Sadan. (2013b). Revised Budget 2012-13 and Draft Budget 2013-14 for Standing Committee Resolution. Accounts Department. Vadodara: Vadodara Mahanagar Seva Sadan.
Vadodara Mahanagar Seva Sadan. (2014). Municipality to Municipal Corporation. Retrieved July 07, 2014, from Vadodara Mahanagar Seva Sadan: https://vmc.gov.in/Introduction.aspx
Vadodara Mahanagar Seva Sadan. (No Year). Understanding VMC: Political Structure - Administrative Wing. (Microtech IT Systems Pvt. Ltd.) Retrieved August 08, 2013, from Vadodara Mahanagar Seva Sadan: http://www.vmcegov.com/administrative_wing.aspx

82
Annexures
Annexure 1 List of water distribution stations in Vadodara
Zone S. No. Tank name Population
(2011)
Command area
(sqkm)
Water supplied
daily (MLD)
SZ
1 Gajarawadi 58,226 4.37 13.04
2 Kapurai* 58,842 6.62 -
3 Nalanda 52,231 3.31 12.49
4 Bapod 23,553 1.31 1.27
5 Tarsali 52,484 7.55 12.59
6 Manjalpur 43,857 6.57 11.27
7 GIDC 29,593 5.13 1.89
8 South GIDC 61,103 12.11 2.94
EZ
1 Panigate 81,515 3.74 30.55
2 Warashia booster 10,191 1.06 2.97
3 Ajwa 122,052 5.53 20.33
4 Airport booster 47,651 5.38 6.16
5 Sayajipura* 87,680 5.26 -
6 North harni* 28,158 3.18 -
NZ
1 Lalbaug 91,641 8.01 19.34
2 Jail 58,611 4.37 15.42
3 Sayajibaug 44,208 3.08 7.37
4 Vehiclepool booster 9,947 0.49 -
5 Harni 64,676 4.28 19.40
6 Sama 64,312 7.19 11.33
7 Extra* 28,358 3.16 -
8 Chhani Village* 59,327 6.61 -
9 Chhani Jakat 39,800 4.43 12.36
WZ
1 Subhanpura 55,896 3.71 16.04
2 Gorwa 48,259 2.77 11.68
3 Wadiwadi 57,450 3.27 6.85
4 Harinagar 54,652 5.54 13.76
5 Gayatrinagar 57,415 6.77 13.86
6 Kalali 70,382 7.07 3.64
7 Tandalja 56,274 6.69 14.19
8 Akota 48,150 5.28 13.08
Total 16,66,494 153.84 293.82
Note: * represents the WDS zones in which water distribution network and stations are either under construction or are non-functional.
Source: VMSS, 2013

83
Annexure 2 Map showing command areas of various water distribution stations in Vadodara
Source: VMSS, 2013
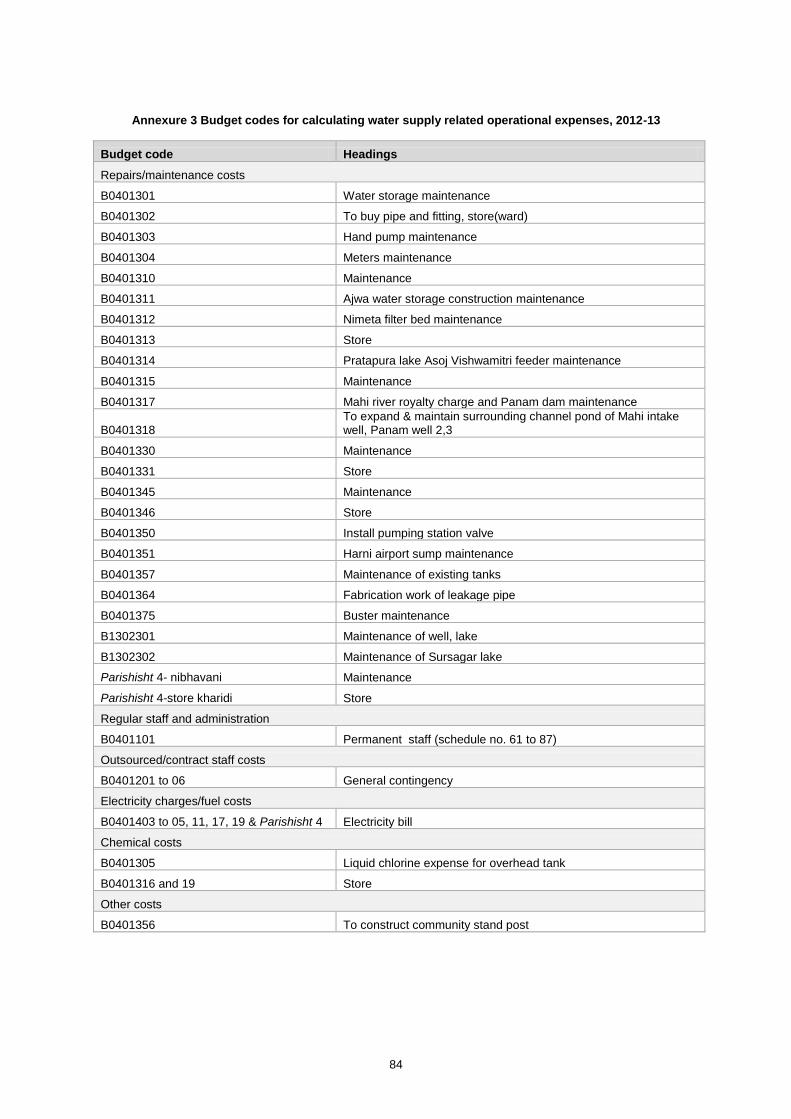
84
Annexure 3 Budget codes for calculating water supply related operational expenses, 2012-13
Budget code Headings
Repairs/maintenance costs
B0401301 Water storage maintenance
B0401302 To buy pipe and fitting, store(ward)
B0401303 Hand pump maintenance
B0401304 Meters maintenance
B0401310 Maintenance
B0401311 Ajwa water storage construction maintenance
B0401312 Nimeta filter bed maintenance
B0401313 Store
B0401314 Pratapura lake Asoj Vishwamitri feeder maintenance
B0401315 Maintenance
B0401317 Mahi river royalty charge and Panam dam maintenance
B0401318 To expand & maintain surrounding channel pond of Mahi intake well, Panam well 2,3
B0401330 Maintenance
B0401331 Store
B0401345 Maintenance
B0401346 Store
B0401350 Install pumping station valve
B0401351 Harni airport sump maintenance
B0401357 Maintenance of existing tanks
B0401364 Fabrication work of leakage pipe
B0401375 Buster maintenance
B1302301 Maintenance of well, lake
B1302302 Maintenance of Sursagar lake
Parishisht 4- nibhavani Maintenance
Parishisht 4-store kharidi Store
Regular staff and administration
B0401101 Permanent staff (schedule no. 61 to 87)
Outsourced/contract staff costs
B0401201 to 06 General contingency
Electricity charges/fuel costs
B0401403 to 05, 11, 17, 19 & Parishisht 4 Electricity bill
Chemical costs
B0401305 Liquid chlorine expense for overhead tank
B0401316 and 19 Store
Other costs
B0401356 To construct community stand post

85
Annexure 4 Budget codes for calculating sewerage related operational expenses, 2012-13
Budget code Headings
Regular staff and administration
B0501101
Permanent staff(schedule no. 88)
Permanent staff on work site (schedule no. 89) sewage laboratory staff
Permanent staff(schedule no. 90)
B0502101 Permanent staff(schedule no. 91)
Permanent staff on work site (schedule no. 92) sewage laboratory staff
Outsourced /contract staff costs
B0501201 General contingency
B0501202 General contingency
B0502201 General contingency
B0502202 General contingency
Electricity charges /fuel costs
B0501401 Electricity bill
B0502421 Electricity bill
Parisist 6 electricity Electricity bill
Chemicals costs
B0501330 Sewage laboratory chemicals and glassware maintenance
B0501303 Store
B0502344 Store(ward)
Others (specify)
B0501329 Inspection fee
B0502342 Water prevention and control pollution cess act 1987
B0504301 Maintenance of toilet & urinal electric light and connection in chawl, tribal areas, slums (ward)
B0504302 Sulabh toilets
Budget code Headings
Repairs/maintenance costs
B0503301 Gutter maintenance by ward
B0501301 To buy oil and equipment
B0501302 Underground sewerage maintenance
B0501328 Pumping station maintenance
B0502301 To buy oil and equipment
B0502343 Temporary pump maintenance
B0503302 Store(ward)
B0503303 Underground sewerage maintenance by ward
B0503304 Store
B0503305 Drainage line cleaning by ward
B0503306 Store(ward)
B0503307 Drainage pressure and gravity line maintenance and inspection, emergency work
B0503308 Store(ward)
B1303301 Storm water drainage maintenance
B1303302 Store
Parisist 6 nibhavani Maintenance

86
Budget code Headings
Parisist 6 store kharidi Store(ward)
Contractor costs for O&M
B1303201 General contingency
B0503309 Drainage line cleaning and to run contract basis temporary electric & diesel pump
Annexure 5 Budget codes for calculating SWM related operational expenses, 2012-13
Budget code Headings
Regular staff and administration
B0701101 Road sweeping staff
B0702101 Permanent staff (sch-103,104)
B0703101 Permanent staff (sch-105)
Outsourced /contract staff costs
B0702310 Door to door contract expenses
Electricity charges /fuel costs
B0702302 Electricity expenses for composting plant
Chemicals costs
B0701301 Store purchase
B0701302 Purchase bleaching, powder, phenyl, etc.
Others (specify)
B0702201 Contingency
B0702202 SWM contingency
B1603310 Scholarship for SWM employee
Repairs/maintenance costs
B0702301 Container removal expenses
B0702302 Compost manure plant
B0702303 Container platform maintenance
B0702304 Dustbin, handcarts, container maintenance
B0702305 Machinery maintenance
B0702307 Transfer site maintenance
B0702308 Miscellaneous store purchase for repair and maintenance
B0702309 Scientific disposal expenses
B0702311 Scientific disposal of solid waste according to SWM rule 2000 expenses
B0703101 Vehicle repair expenses
B0703102 Tyre tube for vehicle
Contractor costs for O&M
B0702306 Transportation contract for waste picking from ward
B0702310 Door to door contract expenses
B0702312 Vehicle on contract

87
Urban Management Centre
C/o. 3rd
Floor, AUDA Building, Usmanpura
Ahmedabad, Gujarat, India
T: +91 79 27546403/ 5303
www.umcasia.org