information technology - anchorage, alaska information technology (it) department’s primary...
TRANSCRIPT

ApplicationServices
DataServices
Reprographics
Application Services
Information Technology
TechnologyServices
Financial Services
Infrastructure Assets Enterprise Services
Database Services
AdministrativeServices
GIS Services
Chief Fiscal Officer
Information TechnologyAdministration
Desktop Services
Enterprise Resource Planning Services
Telecommunications
Projects & Procurement
PeopleSoft Loans Records Management Network Services
2016 Approved General Government Operating Budget
IT - 1

Information Technology Description The Information Technology (IT) Department’s primary responsibility is the planning, management and improvement of the technology infrastructure, telecommunications, and business applications that support the Municipality's business objectives. The IT Department also provides printing, graphics and reprographic services, records management and mail courier services to all municipal departments. The IT Department provides the overall leadership, oversight, and direction for individual municipal departments and the enterprise as a whole to more cost-effectively and efficiently deliver services to their customers through information technology and business process automation.
Divisions • Information Technology Administration Division
o Provides Administrative support for the IT Department and to Municipality departments. Manage IT Finances Manage the IT purchase approval process Manage IT Projects Manage Software Compliance and Licensing Set and Administer Cyber Security Policies and Procedures Manage MOA cell phone, mobile device, and long distance contracts Assist IT Customers
• Application Services Division
o Provide software configuration, administration, development and support services to municipal departments. Production Support - implement, integrate, test, troubleshoot, administer, and
support applications and databases Implementation and Upgrade Projects - analysis, requirements elicitation,
coding, and deploying applications and interfaces
• Technology Services Division o Provide a computing environment that meets the needs of each department.
Service Desk support Desktop services and support Voice and data network service and support Enterprise level computing services and support Data resources management and development Administer, maintain and secure municipal data assets Monitor and Administer Cyber Security Provide administrative support to ITD staff
• Data Services
o Deliver Professional print and courier services, and records management oversight that is in alignment with the policies, business requirements, and the objectives of MOA. Provide print production, digital copies and graphic design to municipal agencies Provide secure and reliable courier services to all municipal agencies Provide orderly identification, management, retention, preservation and disposal
of MOA records
2016 Approved General Government Operating Budget
IT - 2

Department Goals that Contribute to Achieving the Mayor’s Mission:
Administration – Make city government more efficient, accessible, transparent, and responsive to the citizens of Anchorage
• Reduce the total of IT operational cost as a percentage of overall MOA operational cost. • Improve IT service delivery and the development of processes, standards and policies by
applying industry best practices frameworks.
Strengthen Anchorage’s Economy – Build a city that attracts and retains a talented workforce, the most innovative companies, and provides a strong environment for economic growth
• Deliver innovative municipal services to MOA departments and citizens via technology.
2016 Approved General Government Operating Budget
IT - 3
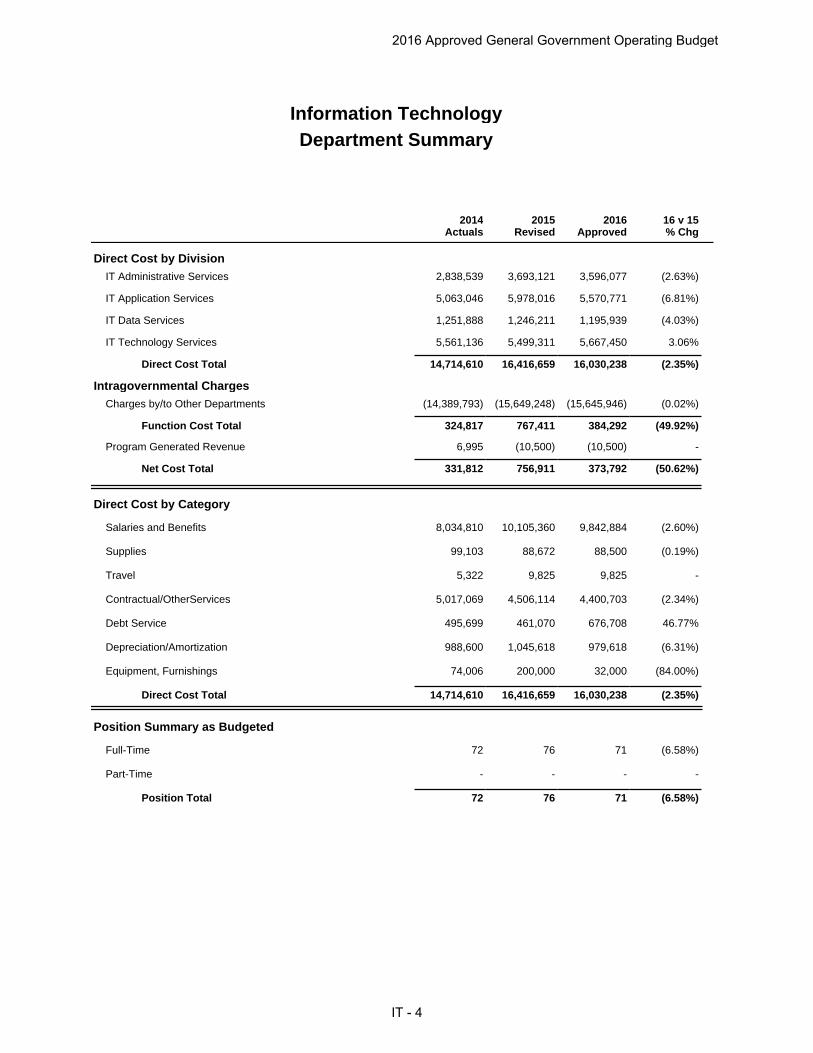
Direct Cost by DivisionIT Administrative Services 2,838,539 3,693,121 3,596,077 (2.63%)
IT Application Services 5,063,046 5,978,016 5,570,771 (6.81%)
IT Data Services 1,251,888 1,246,211 1,195,939 (4.03%)
IT Technology Services 5,561,136 5,499,311 5,667,450 3.06%
Direct Cost Total 14,714,610 16,416,659 16,030,238 (2.35%)
Intragovernmental ChargesCharges by/to Other Departments (14,389,793) (15,649,248) (15,645,946) (0.02%)
Function Cost Total 324,817 767,411 384,292 (49.92%)
Program Generated Revenue 6,995 (10,500) (10,500) -
Net Cost Total 331,812 756,911 373,792 (50.62%)
Direct Cost by Category
Salaries and Benefits 8,034,810 10,105,360 9,842,884 (2.60%)
Supplies 99,103 88,672 88,500 (0.19%)
Travel 5,322 9,825 9,825 -
Contractual/OtherServices 5,017,069 4,506,114 4,400,703 (2.34%)
Debt Service 495,699 461,070 676,708 46.77%
Depreciation/Amortization 988,600 1,045,618 979,618 (6.31%)
Equipment, Furnishings 74,006 200,000 32,000 (84.00%)
Direct Cost Total 14,714,610 16,416,659 16,030,238 (2.35%)
Position Summary as Budgeted
Full-Time 72 76 71 (6.58%)
Part-Time - - - -
Position Total 72 76 71 (6.58%)
Information TechnologyDepartment Summary
2015Revised
2016Approved
2014Actuals
16 v 15% Chg
2016 Approved General Government Operating Budget
IT - 4
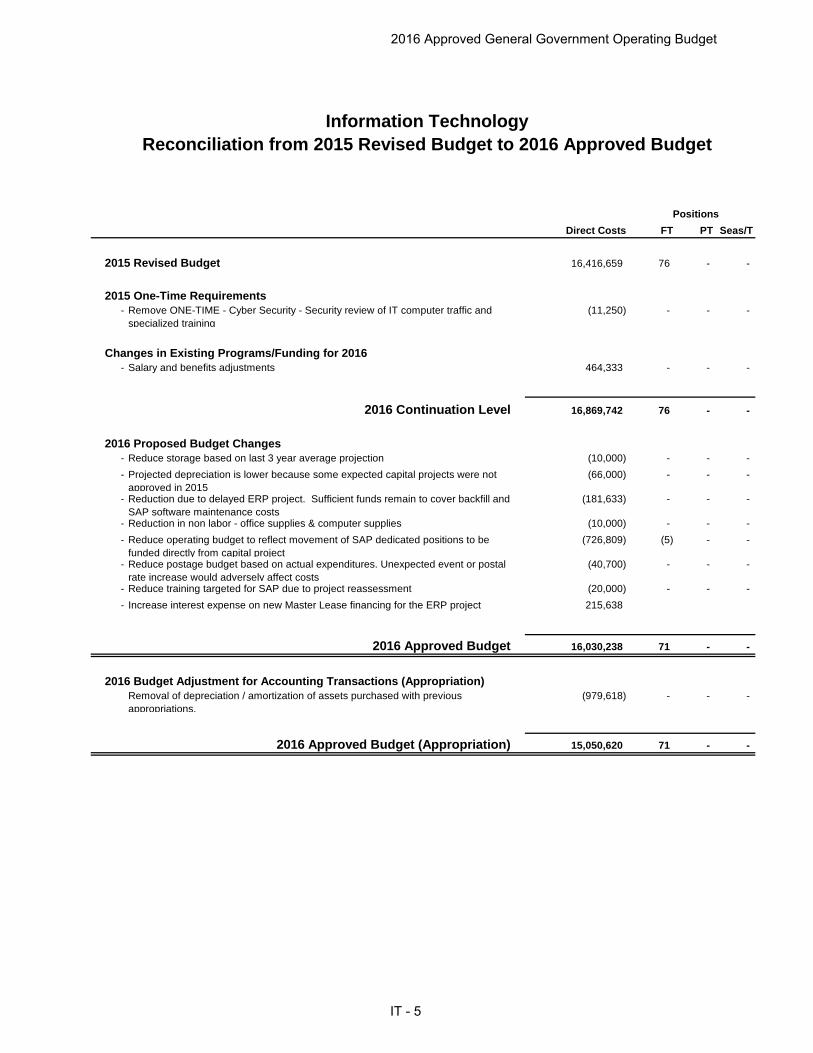
Direct Costs FT PT Seas/T
16,416,659 76 - -
- Remove ONE-TIME - Cyber Security - Security review of IT computer traffic and specialized training
(11,250) - - -
- Salary and benefits adjustments 464,333 - - -
16,869,742 76 - -
- Reduce storage based on last 3 year average projection (10,000) - - - - Projected depreciation is lower because some expected capital projects were not
approved in 2015(66,000) - - -
- Reduction due to delayed ERP project. Sufficient funds remain to cover backfill and SAP software maintenance costs
(181,633) - - -
- Reduction in non labor - office supplies & computer supplies (10,000) - - - - Reduce operating budget to reflect movement of SAP dedicated positions to be
funded directly from capital project(726,809) (5) - -
- Reduce postage budget based on actual expenditures. Unexpected event or postal rate increase would adversely affect costs
(40,700) - - -
- Reduce training targeted for SAP due to project reassessment (20,000) - - - - Increase interest expense on new Master Lease financing for the ERP project 215,638
2016 Approved Budget 16,030,238 71 - -
Removal of depreciation / amortization of assets purchased with previous appropriations.
(979,618) - - -
2016 Approved Budget (Appropriation) 15,050,620 71 - -
2016 Budget Adjustment for Accounting Transactions (Appropriation)
2016 Proposed Budget Changes
Reconciliation from 2015 Revised Budget to 2016 Approved Budget
Positions
2016 Continuation Level
Information Technology
Changes in Existing Programs/Funding for 2016
2015 Revised Budget
2015 One-Time Requirements
2016 Approved General Government Operating Budget
IT - 5

2014Actuals
2015Revised
2016Approved
16 v 15% Chg
Direct Cost by Category
Salaries and Benefits 1,677,041 2,292,144 2,403,542 4.86%
Supplies 24,826 37,260 25,000 (32.90%)
Travel 5,322 9,825 9,825 -
Contractual/Other Services 411,514 487,176 356,756 (26.77%)
Equipment, Furnishings 7,078 - - -
Manageable Direct Cost Total 2,125,781 2,826,405 2,795,123 (1.11%)
Debt Service 72,312 80,000 80,000 -
Depreciation/Amortization 640,446 786,716 720,954 (8.36%)
Non-Manageable Direct Cost Total 712,758 866,716 800,954 (7.59%)
Direct Cost Total 2,838,539 3,693,121 3,596,077 -
Intragovernmental Charges
Charges by/to Other Departments (2,970,268) (3,550,794) (3,594,886) 1.24%
Function Cost Total (131,729) 142,327 1,191 (99.16%)
Program Generated Revenue by FundFund 607000 - Information Technology (10,204) - - -
Program Generated Revenue Total (10,204) - - -
(121,525) 142,327 1,191 (99.16%)Net Cost Total
Position Summary as BudgetedFull-Time 15 17 17 -
Position Total 15 17 17 -
Information TechnologyDivision Summary
(Fund Center # 145400, 141179, 142500, 141100, 142000, 144000, 145401, 147300)
IT Administrative Services
2016 Approved General Government Operating Budget
IT - 6

Information TechnologyDivision Detail
IT Administrative Services
(Fund Center # 145400, 141179, 142500, 141100, 142000, 144000, 145401, 147300)
Net CostDirect Cost Total 2,838,539 3,693,121 3,596,077 (2.63%)
Charges by/to Other Departments Total (2,970,268) (3,550,794) (3,594,886) 1.24%
Program Generated Revenue Total 10,204 - - -
Net Cost Total (121,525) 142,327 1,191 (99.16%)
2014Actuals
2015Revised
2016Approved
16 v 15% Chg
Direct Cost by CategorySalaries and Benefits 1,677,041 2,292,144 2,403,542 4.86%
Supplies 24,826 37,260 25,000 (32.90%)
Travel 5,322 9,825 9,825 -
Contractual/Other Services 411,514 487,176 356,756 (26.77%)
Equipment, Furnishings 7,078 - - -
Manageable Direct Cost Total 2,125,781 2,826,405 2,795,123 (1.11%)
Debt Service 72,312 80,000 80,000 -
Depreciation/Amortization 640,446 786,716 720,954 (8.36%)
Non-Manageable Direct Cost Total 712,758 866,716 800,954 (7.59%)
Direct Cost Total 2,838,539 3,693,121 3,596,077 (2.63%)
Intragovernmental ChargesCharges by/to Other Departments (2,970,268) (3,550,794) (3,594,886) 1.24%
Program Generated Revenue440010 - GCP CshPool ST-Int(MOA/ML&P) (55,925) - - -
440020 - CIP Csh Pools ST Int 18,010 - - -
440080 - UnRlzd Gns&Lss Invs(MOA/AWWU) 711 - - -
450010 - Contributions from Other Funds 27,000 - - -
Program Generated Revenue Total (10,204) - - -
Position Detail as Budgeted2014 Revised 2015 Revised 2016 Approved
Full Time Part Time Full Time Part Time Full Time Part Time
Accountant 1 - 1 - 1 -
Computer Operations Officer - - 2 - 2 -
Director 1 - 1 - 1 -
Executive Assistant I 1 - 1 - 1 -
Information Center Consultant II - - 1 - 1 -
Information Technology Mgr 2 - - - - -
IT Director - - - - 1 -
Management Systems Officer II 1 - 1 - 1 -
Office Associate 1 - 1 - 1 -
Principal Admin Officer - - 1 - 1 -
SAP - Business Analyst - - - - 1 -
SAP - Project Manager - OCM - - 1 - - -
Senior Admin Officer 1 - - - - -
2016 Approved General Government Operating Budget
IT - 7

Position Detail as Budgeted2014 Revised 2015 Revised 2016 Approved
Full Time Part Time Full Time Part Time Full Time Part Time
Senior Staff Accountant 1 - 1 - 1 -
Senior Systems Analyst 4 - 3 - 2 -
Systems Analyst 1 - - - - -
Technology Analyst 1 - 3 - 3 -
Position Detail as Budgeted Total 15 - 17 - 17 -
2016 Approved General Government Operating Budget
IT - 8

2014Actuals
2015Revised
2016Approved
16 v 15% Chg
Direct Cost by Category
Salaries and Benefits 2,168,270 3,702,864 3,308,002 (10.66%)
Supplies 706 - - -
Travel - - - -
Contractual/Other Services 2,435,149 1,645,722 1,632,089 (0.83%)
Equipment, Furnishings 34,118 168,000 - (100.00%)
Manageable Direct Cost Total 4,638,243 5,516,586 4,940,091 (10.45%)
Debt Service 423,387 381,070 596,708 56.59%
Depreciation/Amortization 1,416 80,360 33,972 (57.73%)
Non-Manageable Direct Cost Total 424,803 461,430 630,680 36.68%
Direct Cost Total 5,063,046 5,978,016 5,570,771 -
Intragovernmental Charges
Charges by/to Other Departments (5,057,345) (5,438,868) (5,570,773) 2.43%
Function Cost Total 5,701 539,148 (2) (100.00%)
Program Generated Revenue by FundFund 607000 - Information Technology 3,175 - - -
Program Generated Revenue Total 3,175 - - -
2,526 539,148 (2) (100.00%)Net Cost Total
Position Summary as BudgetedFull-Time 25 28 23 (17.86%)
Position Total 25 28 23 (17.86%)
Information TechnologyDivision Summary
(Fund Center # 145600, 145500, 145679, 145100)
IT Application Services
2016 Approved General Government Operating Budget
IT - 9

Information TechnologyDivision Detail
IT Application Services
(Fund Center # 145600, 145500, 145679, 145100)
Net CostDirect Cost Total 5,063,046 5,978,016 5,570,771 (6.81%)
Charges by/to Other Departments Total (5,057,345) (5,438,868) (5,570,773) 2.43%
Program Generated Revenue Total (3,175) - - -
Net Cost Total 2,526 539,148 (2) (100.00%)
2014Actuals
2015Revised
2016Approved
16 v 15% Chg
Direct Cost by CategorySalaries and Benefits 2,168,270 3,702,864 3,308,002 (10.66%)
Supplies 706 - - -
Travel - - - -
Contractual/Other Services 2,435,149 1,645,722 1,632,089 (0.83%)
Equipment, Furnishings 34,118 168,000 - (100.00%)
Manageable Direct Cost Total 4,638,243 5,516,586 4,940,091 (10.45%)
Debt Service 423,387 381,070 596,708 56.59%
Depreciation/Amortization 1,416 80,360 33,972 (57.73%)
Non-Manageable Direct Cost Total 424,803 461,430 630,680 36.68%
Direct Cost Total 5,063,046 5,978,016 5,570,771 (6.81%)
Intragovernmental ChargesCharges by/to Other Departments (5,057,345) (5,438,868) (5,570,773) 2.43%
Program Generated Revenue408240 - Miscellaneous Revenues(Port) 3,000 - - -
440040 - Other Short-Term Interest 175 - - -
Program Generated Revenue Total 3,175 - - -
Position Detail as Budgeted2014 Revised 2015 Revised 2016 Approved
Full Time Part Time Full Time Part Time Full Time Part Time
Application Services Supvr 1 - 1 - 1 -
Business Analyst 1 - - - - -
Data Base Administrator II 1 - 1 - 1 -
Database Admin II 3 - 2 - 2 -
GIS Technician III 1 - - - - -
Principal Admin Officer 3 - - - - -
SAP - Business Analyst - - 3 - - -
SAP - Systems Business Analyst - - 1 - - -
SAP Analyst 1 - - - - -
Senior Systems Analyst 2 - 6 - 5 -
Systems Analyst 10 - 14 - 14 -
Systems Programmer I 2 - - - - -
Position Detail as Budgeted Total 25 - 28 - 23 -
2016 Approved General Government Operating Budget
IT - 10

2014Actuals
2015Revised
2016Approved
16 v 15% Chg
Direct Cost by Category
Salaries and Benefits 690,139 624,658 625,086 0.07%
Supplies 47,457 43,992 56,610 28.68%
Travel - - - -
Contractual/Other Services 505,239 577,561 514,243 (10.96%)
Equipment, Furnishings 9,053 - - -
Manageable Direct Cost Total 1,251,888 1,246,211 1,195,939 (4.03%)
Debt Service - - - -
Non-Manageable Direct Cost Total - - - -
Direct Cost Total 1,251,888 1,246,211 1,195,939 -
Intragovernmental Charges
Charges by/to Other Departments (830,424) (857,451) (817,838) (4.62%)
Function Cost Total 421,464 388,760 378,101 (2.74%)
Program Generated Revenue by FundFund 101000 - Areawide General 32 5,500 5,500 -
Program Generated Revenue Total 32 5,500 5,500 -
421,432 383,260 372,601 (2.78%)Net Cost Total
Position Summary as BudgetedFull-Time 6 6 6 -
Position Total 6 6 6 -
Information TechnologyDivision Summary
(Fund Center # 142379, 142371, 147100, 142400, 142300, 147200)
IT Data Services
2016 Approved General Government Operating Budget
IT - 11

Information TechnologyDivision DetailIT Data Services
(Fund Center # 142379, 142371, 147100, 142400, 142300, 147200)
Net CostDirect Cost Total 1,251,888 1,246,211 1,195,939 (4.03%)
Charges by/to Other Departments Total (830,424) (857,451) (817,838) (4.62%)
Program Generated Revenue Total (32) (5,500) (5,500) -
Net Cost Total 421,432 383,260 372,601 (2.78%)
2014Actuals
2015Revised
2016Approved
16 v 15% Chg
Direct Cost by CategorySalaries and Benefits 690,139 624,658 625,086 0.07%
Supplies 47,457 43,992 56,610 28.68%
Travel - - - -
Contractual/Other Services 505,239 577,561 514,243 (10.96%)
Equipment, Furnishings 9,053 - - -
Manageable Direct Cost Total 1,251,888 1,246,211 1,195,939 (4.03%)
Debt Service - - - -
Non-Manageable Direct Cost Total - - - -
Direct Cost Total 1,251,888 1,246,211 1,195,939 (4.03%)
Intragovernmental ChargesCharges by/to Other Departments (830,424) (857,451) (817,838) (4.62%)
Program Generated Revenue406490 - DWI Impnd/Admin Fees - 500 500 -
406625 - Reimbursed Cost-NonGrant Funded 32 5,000 5,000 -
Program Generated Revenue Total 32 5,500 5,500 -
Position Detail as Budgeted2014 Revised 2015 Revised 2016 Approved
Full Time Part Time Full Time Part Time Full Time Part Time
Reprographics Supervisor 1 - 1 - 1 -
Reprographics Tech III 3 - 3 - 3 -
Senior Admin Officer 1 - 1 - 1 -
Senior Courier 1 - 1 - 1 -
Position Detail as Budgeted Total 6 - 6 - 6 -
2016 Approved General Government Operating Budget
IT - 12

2014Actuals
2015Revised
2016Approved
16 v 15% Chg
Direct Cost by Category
Salaries and Benefits 3,499,359 3,485,694 3,506,253 0.59%
Supplies 26,114 7,420 6,890 (7.14%)
Travel - - - -
Contractual/Other Services 1,665,168 1,795,655 1,897,615 5.68%
Equipment, Furnishings 23,757 32,000 32,000 -
Manageable Direct Cost Total 5,214,398 5,320,769 5,442,758 2.29%
Debt Service - - - -
Depreciation/Amortization 346,739 178,542 224,692 25.85%
Non-Manageable Direct Cost Total 346,739 178,542 224,692 25.85%
Direct Cost Total 5,561,136 5,499,311 5,667,450 -
Intragovernmental Charges
Charges by/to Other Departments (5,531,756) (5,802,135) (5,662,449) (2.41%)
Function Cost Total 29,381 (302,824) 5,001 (101.65%)
Program Generated Revenue by FundFund 607000 - Information Technology 2 5,000 5,000 -
Program Generated Revenue Total 2 5,000 5,000 -
29,379 (307,824) 1 (100.00%)Net Cost Total
Position Summary as BudgetedFull-Time 26 25 25 -
Position Total 26 25 25 -
Information TechnologyDivision Summary
(Fund Center # 148172, 148300, 148200, 148171, 148100, 148272, 148273, 148271)
IT Technology Services
2016 Approved General Government Operating Budget
IT - 13

Information TechnologyDivision Detail
IT Technology Services
(Fund Center # 148172, 148300, 148200, 148171, 148100, 148272, 148273, 148271)
Net CostDirect Cost Total 5,561,136 5,499,311 5,667,450 3.06%
Charges by/to Other Departments Total (5,531,756) (5,802,135) (5,662,449) (2.41%)
Program Generated Revenue Total (2) (5,000) (5,000) -
Net Cost Total 29,379 (307,824) 1 (100.00%)
2014Actuals
2015Revised
2016Approved
16 v 15% Chg
Direct Cost by CategorySalaries and Benefits 3,499,359 3,485,694 3,506,253 0.59%
Supplies 26,114 7,420 6,890 (7.14%)
Travel - - - -
Contractual/Other Services 1,665,168 1,795,655 1,897,615 5.68%
Equipment, Furnishings 23,757 32,000 32,000 -
Manageable Direct Cost Total 5,214,398 5,320,769 5,442,758 2.29%
Debt Service - - - -
Depreciation/Amortization 346,739 178,542 224,692 25.85%
Non-Manageable Direct Cost Total 346,739 178,542 224,692 25.85%
Direct Cost Total 5,561,136 5,499,311 5,667,450 3.06%
Intragovernmental ChargesCharges by/to Other Departments (5,531,756) (5,802,135) (5,662,449) (2.41%)
Program Generated Revenue406450 - Mapping Fees - 5,000 5,000 -
440040 - Other Short-Term Interest 2 - - -
Program Generated Revenue Total 2 5,000 5,000 -
Position Detail as Budgeted2014 Revised 2015 Revised 2016 Approved
Full Time Part Time Full Time Part Time Full Time Part Time
Computer Operations Supvr 2 - 1 - 1 -
Computer Operator III 2 - 2 - 2 -
Info Center Consultant I 1 - 1 - 1 -
Info Center Consultant II 6 - 7 - 7 -
Network Analyst 3 - 3 - 3 -
Network Technician II 1 - 1 - 1 -
Network Technician III 2 - 2 - 2 -
Systems Analyst 5 - 5 - 5 -
Systems Programmer I 1 - 1 - 1 -
Technical Support Manager 2 - 2 - 2 -
Technology Analyst 1 - - - - -
Position Detail as Budgeted Total 26 - 25 - 25 -
2016 Approved General Government Operating Budget
IT - 14

Anchorage: Performance. Value. Results
2016 Approved General Government Operating Budget
IT - 15

Information Technology Department Anchorage: Performance. Value. Results.
Mission
Provide state-of-the-art, structured, controlled and secured computing environment that delivers responsible and cost-efficient services to Municipal Departments and the community at large.
Core Services
• IT Infrastructure (Network, Email, Servers) • Application Development and Support (PeopleSoft, Hansen, CAMA) • Web Services (Intranet, Internet) • Mail/Courier Services • Phones • Reprographics • Data Services • Records Management • Desktop Support • Security
Accomplishment Goals
• Reduce the total of IT operational cost as a percentage of overall MOA operational cost.
• Deliver innovative municipal services to MOA departments and citizens via technology.
• Provide excellent Customer Service. • Improve IT service delivery and the development of processes, standards and
policies by applying industry best practice frameworks. Performance Measures
Explanatory Information IT has undertaken an enterprise move toward establishing a ‘best-practice’ approach to IT standardization—from security policies and change management to adopting new technologies. We have developed a roadmap to transform IT that serves as the action plan for how we will deliver MOA IT services at a lower cost.
Progress in achieving goals measured by:
2016 Approved General Government Operating Budget
IT - 16

Measure #1: IT operational cost as a percentage of the total Municipal Operating Budget (excludes AWWU and ML&P cost). The Gartner Key Metrics indicate that for a government entity our size ($500M to $1B) the overall average for IT operational cost is 3.6%. Our current percentage is 3.5% of the total operating budget.
IT Ops Budget as 3.5% of Total MOA Ops Budget
2014 2015 Year
3.8% 3.5%
Perc
enta
ge
2016 Approved General Government Operating Budget
IT - 17
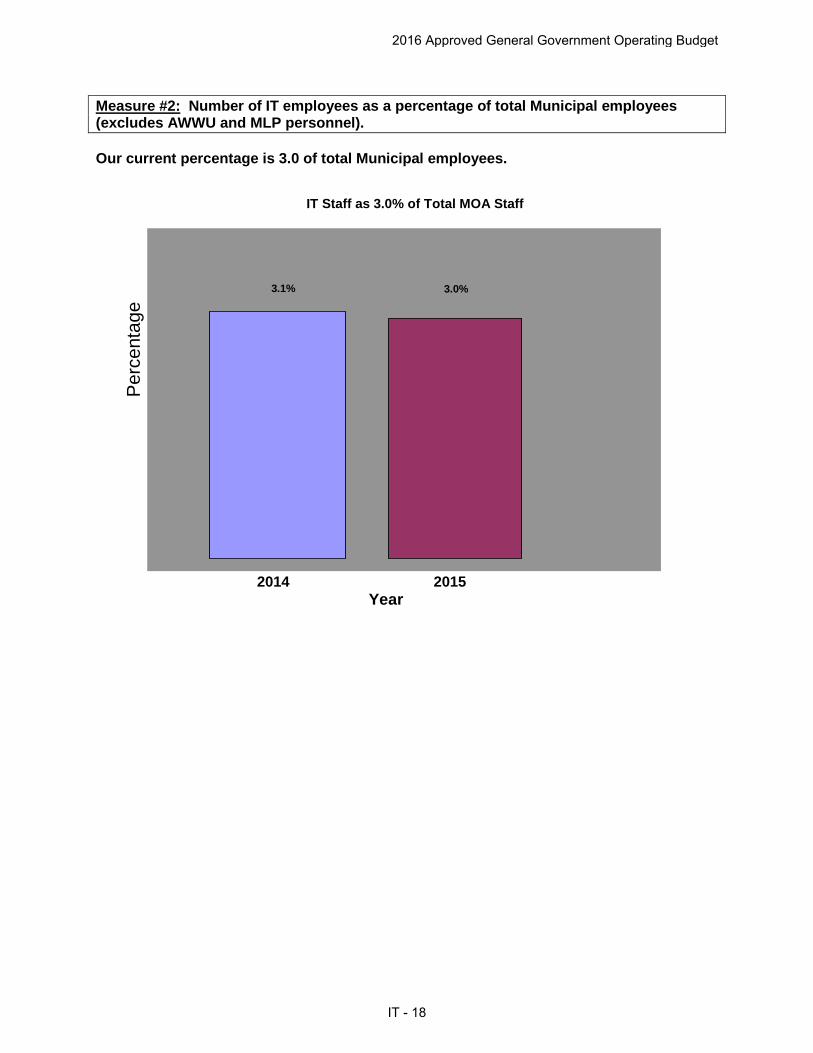
Measure #2: Number of IT employees as a percentage of total Municipal employees (excludes AWWU and MLP personnel). Our current percentage is 3.0 of total Municipal employees.
2014 2015 Year
3.0% 3.1%
Per
cent
age
IT Staff as 3.0% of Total MOA Staff
2016 Approved General Government Operating Budget
IT - 18
Application Services Division Information Technology Division
Anchorage: Performance. Value. Results. Purpose
Provide professional software development and support services to municipal departments.
Division Direct Services
• Production Support—implement, integrate, test, troubleshoot, administer, and support applications. Including training and application hosting.
• New Development—analysis, requirements gathering, coding, testing, and deploying custom in-house developed applications and interfaces.
Accomplishment Goals
• Reduce the total of IT spend as a percentage of overall MOA operational spend. • Deliver new municipal services to citizens via technology. • Provide excellent Customer Service. • Improve IT service delivery and the development of processes, standards and
policies by applying industry best practice frameworks. Performance Measures
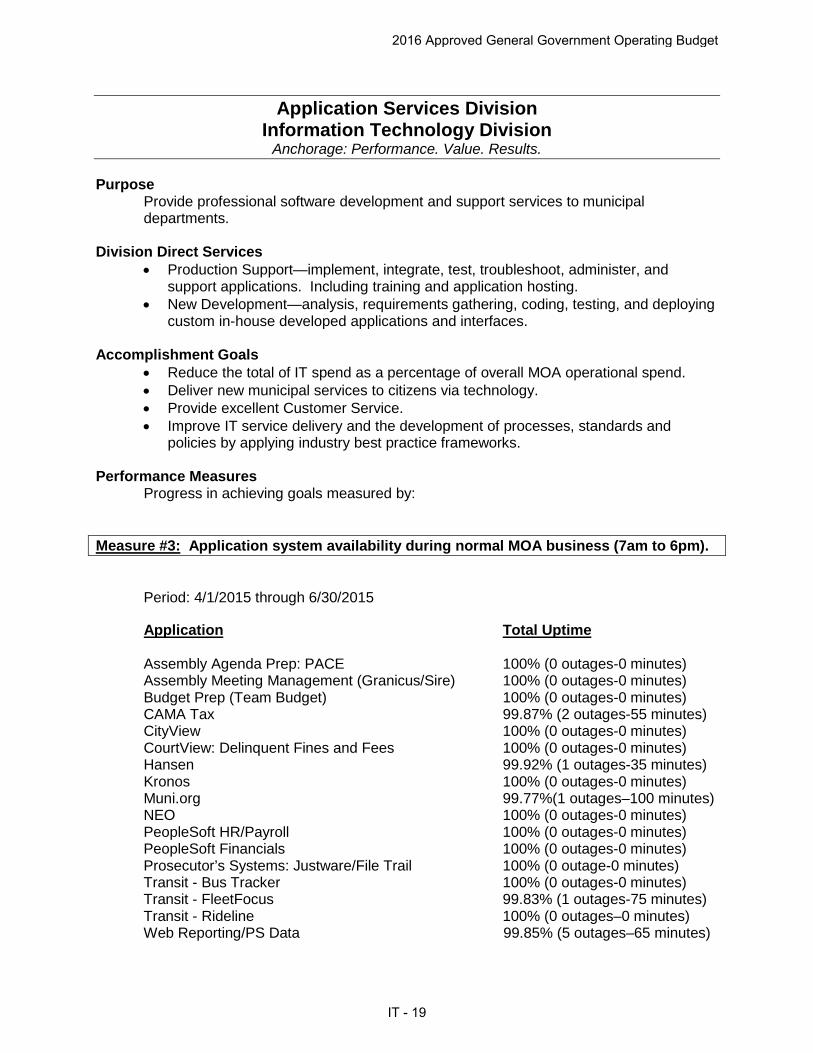
Progress in achieving goals measured by: Measure #3: Application system availability during normal MOA business (7am to 6pm).
Period: 4/1/2015 through 6/30/2015
Application Total Uptime Assembly Agenda Prep: PACE 100% (0 outages-0 minutes) Assembly Meeting Management (Granicus/Sire) 100% (0 outages-0 minutes) Budget Prep (Team Budget) 100% (0 outages-0 minutes) CAMA Tax 99.87% (2 outages-55 minutes) CityView 100% (0 outages-0 minutes) CourtView: Delinquent Fines and Fees 100% (0 outages-0 minutes) Hansen 99.92% (1 outages-35 minutes) Kronos 100% (0 outages-0 minutes) Muni.org 99.77%(1 outages–100 minutes) NEO 100% (0 outages-0 minutes) PeopleSoft HR/Payroll 100% (0 outages-0 minutes) PeopleSoft Financials 100% (0 outages-0 minutes) Prosecutor’s Systems: Justware/File Trail 100% (0 outage-0 minutes) Transit - Bus Tracker 100% (0 outages-0 minutes) Transit - FleetFocus 99.83% (1 outages-75 minutes) Transit - Rideline 100% (0 outages–0 minutes) Web Reporting/PS Data 99.85% (5 outages–65 minutes)
2016 Approved General Government Operating Budget
IT - 19

Data Services Division Information Technology Department
Anchorage: Performance. Value. Results. Purpose
Deliver data services that are in alignment with the business requirements and the objectives of MOA, by using the most secure, efficient and cost effective methods.
Division Direct Services
• Administer, maintain and secure municipal data assets. • Provide print production, digital copies and graphic design to all municipal agencies. • Provide secure and reliable courier services to all municipal agencies. • Provide orderly identification, management, retention, preservation and disposal of
MOA records. Accomplishment Goals
• Reduce the total of IT spend as a percentage of overall MOA operational spend. • Deliver innovative municipal services to citizens via technology. • Provide excellent Customer Service. • Improve IT service delivery and the development of processes, standards and
policies by applying industry best practice frameworks. Performance Measures
Explanatory Information. Progress in achieving goals measured by:
Measure #4: Percent of time spent on tasks.
2016 Approved General Government Operating Budget
IT - 20

Measure #5: Percent of Annual Records Retention Schedules updated. Performance Measures Provides the quarterly progress made in updating departmental RRS which are currently in their update cycle. The progress varies by department depending on a number of factors that include: how out of date the current retention schedule is, whether the department has been absorbed into another department through a departmental reorganization, the amount of resources able to be put toward the update process by the department, and how close they are to RRS completion.
Emergency Services facilitated in developing a more formal records retentions program as a result accomplishing an enormous increase in their completion goal.
2016 Approved General Government Operating Budget
IT - 21

Technology Services Division Information Technology Department
Anchorage: Performance. Value. Results. Purpose
Provide a computing environment that meets the needs of each department. Division Direct Services
• Service Desk support. • Desktop services and support. • Voice and data network service and support. • Enterprise level computing services and support. • Data resources management and development.
Accomplishment Goals
• Reduce the total of IT spend as a percentage of overall MOA operational spend. • Deliver innovative municipal services to citizens via technology. • Provide excellent Customer Service. • Improve IT service delivery and the development of processes, standards and
policies by applying industry best practice frameworks. Performance Measures
Progress in achieving goals measured by:
2016 Approved General Government Operating Budget
IT - 22

Measure #6: Percentage change in overall KiloWatt Hours IT systems consume.
PDPW
Watts Baseline 2013 2 Qtr
2013 3 Qtr
2013 4 Qtr
2014 1 Qtr
2014 2 Qtr
2014 3 Qtr
2014 4 Qtr
2015 1 Qtr
2015 2 Qtr
Server 8200 4900 4900 4900 4900 4900 4900 4900 4900 4900 Storage 2500 200 200 200 200 200 200 200 200 200 Network 450 450 450 450 450 450 450 450 450 450
Total 11150 5550 5550 5550 5550 5550 5550 5550 5550 5550
City Hall
Watts Baseline 2013 2 Qtr
2013 3 Qtr
2013 4 Qtr
2014 1 Qtr
2014 2 Qtr
2014 3 Qtr
2014 4 Qtr
2015 1 Qtr
2015 2 Qtr
Server 9375 5200 4500 3900 3900 3900 3900 3900 7500 5200 Storage 2600 2400 2400 200 200 200 200 200 2400 2400 Network 825 600 450 450 450 450 450 450 600 600
Total 12800 8200 7350 4550 4550 4550 4550 4550 10500 8200
EOC
Watts Baseline 2013 2 Qtr
2013 3 Qtr
2013 4 Qtr
2014 1 Qtr
2014 2 Qtr
2014 3 Qtr
2014 4 Qtr
2015 1 Qtr
2015 2 Qtr
Server 7775 6950 6950 6950 6950 6950 6950 6950 6950 6950 Storage 1800 3000 3000 3000 3000 3000 3000 3000 3000 3000 Network 1100 1400 1400 1400 1400 1400 1400 1400 1400 1400
Total 10675 11350 11350 11350 11350 11350 11350 11350 11350 11350
HHS
Watts Baseline 2013 2 Qtr
2013 3 Qtr
2013 4 Qtr
2014 1 Qtr
2014 2 Qtr
2014 3 Qtr
2014 4 Qtr
2015 1 Qtr
2015 2 Qtr
Server 4500 3125 3125 3125 3125 3125 3125 3125 3125 3125 Storage 800 800 800 800 800 800 800 800 800 800 Network 750 750 750 750 750 750 750 750 750 750
Total 6050 4675 4675 4675 4675 4675 4675 4675 4675 4675
DDC
Watts Baseline 2013 2 Qtr
2013 3 Qtr
2013 4 Qtr
2014 1 Qtr
2014 2 Qtr
2014 3 Qtr
2014 4 Qtr
2015 1 Qtr
2015 2 Qtr
Server 16250 18100 18100 18100 18100 18100 18100 18100 18100 18100 Storage 4100 5300 5300 5300 5300 5300 5300 5300 5300 5300 Network 3000 4100 4100 4100 4100 4100 4100 4100 4100 4100
Total 23350 27500 27500 27500 27500 27500 27500 27500 27500 27500
2016 Approved General Government Operating Budget
IT - 23

Measure #7: Percentage change in the cost of voice and data communications combined.
$0.00$100,000.00$200,000.00$300,000.00$400,000.00$500,000.00$600,000.00$700,000.00$800,000.00$900,000.00
$1,000,000.00$1,100,000.00$1,200,000.00$1,300,000.00$1,400,000.00$1,500,000.00$1,600,000.00
CELLPHONES
AT&T STIPENDS ACSVOICE
and DATA
ACS LONGDISTANCE
ACS EVDO Totals
Estimated Annual
2nd Qtr 2013
3rd Qtr 2013
4rd Qtr 2013
1st Qtr 2014
3rd Qtr 2014
4rd Qtr 2014
1st Qtr 2015
2nd Qtr 2015
Cost by Provider
2nd Qtr 2013
3rd Qtr 2013
4rd Qtr 2013
1st Qtr 2014
3rd Qtr 2014
4th Qtr 2014
1st Qtr 2015
2nd Qtr 2015
Estimated Annual
ACS (CELL PHONES) 45,567 46,898 46,852 42,652 49,526 43,221 47,214 46,654 187,736 AT&T (SMART PHONES) 12,009 10,773 8,097 9,966 10,491 10,090 10,121 8,913 38,068 STIPENDS 22,128 21,532 24,921 27,473 29,383 25,465 17,779 32,345 100,248 ACS VOICE and DATA 220,768 236,324 214,695 275,523 222,186 260,404 263,823 274,685 1,077,017 ACS LONG DISTANCE 4,633 5,185 4,171 5,122 4,163 3,870 3,839 4,118 15,914 ACS EVDO 31,657 25,029 25,367 42,351 21,226 27,294 21,847 23,456 90,606 TOTALS 336,763 345,739 324,103 403,086 336,974 370,342 364,624 390,170 1,509,588
2016 Approved General Government Operating Budget
IT - 24

Measure #8: Time to close open problem tickets.
2016 Approved General Government Operating Budget
IT - 25
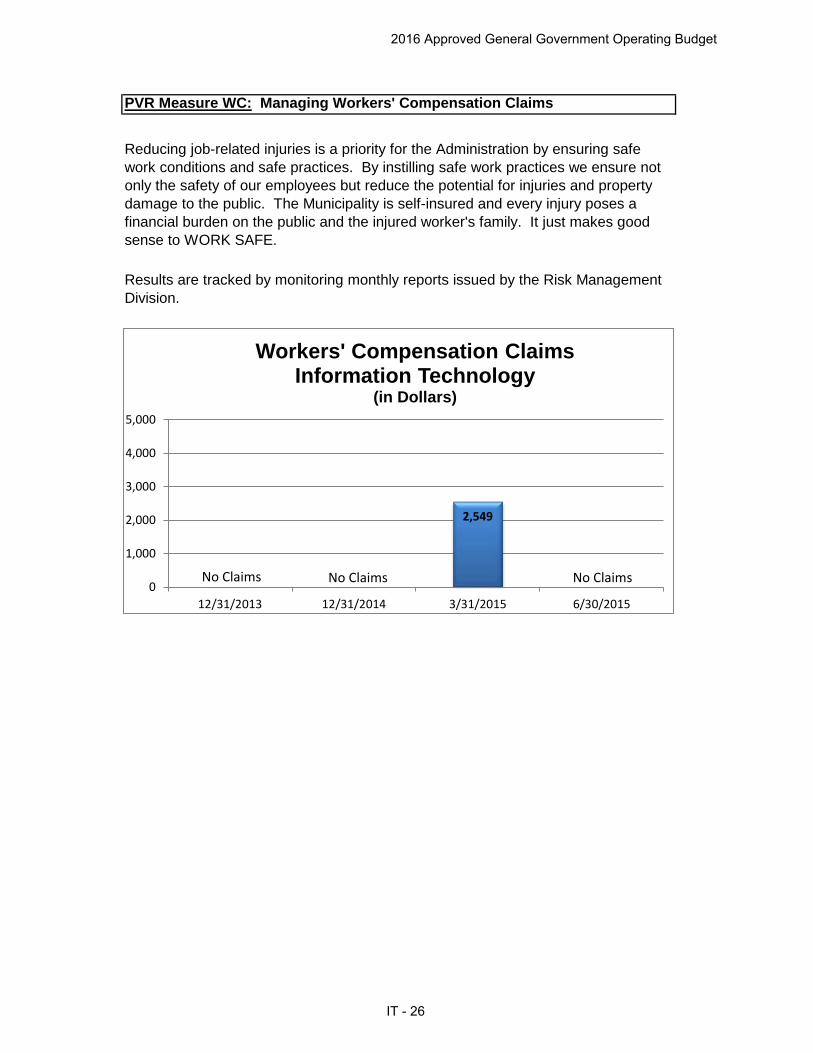
PVR Measure WC: Managing Workers' Compensation Claims
No Claims
Reducing job-related injuries is a priority for the Administration by ensuring safe work conditions and safe practices. By instilling safe work practices we ensure not only the safety of our employees but reduce the potential for injuries and property damage to the public. The Municipality is self-insured and every injury poses a financial burden on the public and the injured worker's family. It just makes good sense to WORK SAFE.
Results are tracked by monitoring monthly reports issued by the Risk Management Division.
2,549
0
1,000
2,000
3,000
4,000
5,000
12/31/2013 12/31/2014 3/31/2015 6/30/2015
Workers' Compensation Claims Information Technology
(in Dollars)
No ClaimsNo ClaimsNo Claims
2016 Approved General Government Operating Budget
IT - 26