further information - department of industry, innovation ... · further information for more...
TRANSCRIPT

Further Information
For more information on data or government initiatives please access the
report from the Department’s website at:
www.industry.gov.au/oce
Chapter Authors
Resources and energy overview: Marco Hatt
Macroeconomic outlook: Kristy Krautler and David Thurtell
Steel, iron ore and nickel: Monica Philalay
Metallurgical and thermal coal: Gayathiri Bragatheswaran
Oil and gas: Nikolai Drahos
Uranium and zinc: Mark Gibbons
Gold and copper: Joseph Moloney
Aluminium, alumina, bauxite: Thuong Nguyen
Resources and Energy Major Projects (Appendix):
Nikolai Drahos, Marco Hatt and Monica Philalay
Acknowledgements
The authors would like to acknowledge the contributions of:
David Thurtell
Mark Cully
Tim Bradley
David Whitelaw
Laura Ling
Katya Golobokova
Ken Colbert
Cover image source: Shutterstock
© Commonwealth of Australia 2016
ISSN 1839-5007 [ONLINE]
Vol. 5, no. 5
This work is copyright. Apart from any use as permitted under the
Copyright Act 1968, no part may be reproduced or altered by any process
without prior written permission from the Australian Government. Requests
and inquiries concerning reproduction and rights should be addressed to:
Department of Industry, Innovation and Science, GPO Box 9839, Canberra
ACT 2601 or by emailing [email protected]
Creative Commons licence
With the exception of the Coat of Arms, this publication is licensed under a
Creative Commons Attribution 3.0 Australia Licence.
Creative Commons Attribution 3.0 Australia Licence is a standard form
license agreement that allows you to copy, distribute, transmit and adapt
this publication provided that you attribute the work.
A summary of the licence terms is available from:
http://creativecommons.org/licenses/by/3.0/au/deed.en
The full licence terms are available from:
http://creativecommons.org/licenses/by/3.0/au/legalcode
The Commonwealth’s preference is that you attribute this publication (and
any material sourced from it) using the following wording:
Source: Licensed from the Commonwealth of Australia under a Creative
Commons Attribution 3.0 Australia Licence.
Resources and Energy Quarterly December 2016 2
Foreword 4
Resources and energy overview 5
Macroeconomic outlook 16
Steel 22
Iron ore 28
Metallurgical coal 35
Thermal coal 41
Gas 49
Oil 57
Uranium 64
Gold 71
Aluminium, alumina and bauxite 78
Copper 90
Nickel 97
Zinc 102
Trade summary charts 107

Resources and Energy Quarterly December 2016 4
ForewordHigher prices for steel-making raw materials and thermal coal, and
increased LNG export volumes, are expected to see Australia’s resource
and energy export earnings increase by 30 per cent in 2016–17, to a
record $204 billion.
Continued growth in demand from China’s steel sector, as well as
disruptions to the supply of a number of resource commodities, have
boosted prices. The world economy appears to be picking up speed. At the
same time, significant investment in Australia’s productive capacity has
supported strong growth in LNG export volumes.
Unfortunately, the high prices that are expected to bolster Australia’s
resources and energy export earnings in 2016–17 are not expected to last.
The combination of slowing demand growth from China’s steel sector and
increased global supplies, are expected to lower export unit values in
2017–18.
However, the production phase of the mining boom will continue, with
export volumes forecast to increase in each of Australia’s top five resource
and energy commodities in 2017–18. Most significantly, LNG export
volumes are forecast to grow a further 28 per cent in 2017–18.
Overall, the value Australia’s resource and energy exports are forecast to
be steady in 2017–18 at around $202 billion.
The annual Resources and Energy Major Projects publication — published
as an appendix to this report — highlights the ongoing transition from the
investment phase to the production phase of the mining boom.
The value of committed projects fell by 12 per cent over twelve months to
October 2016, and the outlook for resources and energy investment
remains subdued over the short to medium term. The mega projects that
have been a key driving force of the investment boom have reached, or are
close to reaching, completion.
Despite recent high prices, expectations of challenging operating and
market conditions have resulted in delays to final investment decisions for
many projects, as producers divert their focus to reducing costs and
ensuring the commercial viability of existing assets.
Nevertheless, the overall prospects and opportunities for further
investment in Australia’s resources and energy sector remain broadly
positive. Australia has many high quality mineral and petroleum deposits,
which can be developed when the price cycle rebounds.
Mark Cully
Chief Economist
Department of Industry, Innovation and Science


Resources and Energy Quarterly December 2016 6
Revisions to the outlook
The value of Australia’s resources and energy exports is forecast to
increase by 30 per cent in 2016–17, to a record $204 billion, before
declining marginally (by 0.9 per cent to $202 billion) in 2017–18.
Figure 1.1 shows that the new 2016–17 forecast represents a 16 per cent
upward revision from the previous estimate made in September. The
2017–18 forecast represents an upward revision of 3 per cent from the
previous forecast for that year — which was made in March.
The change to the 2016–17 forecast primarily reflects — in order of
significance — increased metallurgical coal, iron ore and thermal coal
export earnings, which combined account for 92 per cent of the revision.
The effect of supply disruptions on benchmark metallurgical coal prices
and thermal coal spot prices was much sharper than previously expected,
and will flow into Australia’s export revenues in the coming few quarters.
The supply disruptions, which include the now largely reversed
government-mandated output restrictions in China, are temporary. Prices
are expected to decline over the outlook period as supply returns to the
market.
Higher-than-expected steel production in China (a major source of
demand) also affected metallurgical coal and iron ore prices. As steel
production in China slows, metallurgical coal and iron ore prices are
expected to decline over the next one to two years.
The decline in the price of steel-making materials are forecast to be offset
by a 56 per cent increase in LNG export values. The sharp rise in export
values follows the large investment in Australia's LNG production capacity
over the past decade.
Figure 1.1: Export earnings
Source: ABS (2016) International Trade in Goods and Services, 5368.0; Department of Industry, Innovation and Science (2016)
120
130
140
150
160
170
180
190
200
210
220
2009–10 2011–12 2013–14 2015–16 2017–18
A$ b
illion
Mar–16 forecast Jun–16 forecast Sep–16 forecast Dec–16 forecast

Resources and Energy Quarterly December 2016 7
Global resource and energy market summary
Over the past year, Australia has generally gained market share of
global resource commodities supply. The gains have come as a result of
a large investment in new capacity over the past decade, low production
costs and the relatively high quality of Australia’s resources. Global
consumption grew in 2016 for most of the resource and energy
commodities that Australia produces. However, the rate of growth was
slow compared to the boom times of just a few years ago.
Benchmark prices for Australia’s largest export commodities have
increased noticeably in recent months — particularly the steel-making
commodities, metallurgical coal and iron ore. Crude oil prices — to
which LNG contract prices are linked — also increased in the December
quarter, as did the prices of copper and zinc.
In broad terms, benchmark steel-making commodity prices are forecast
to lose most of their 2016 gains in 2017, while prices for heating, power
and transport fuels and other metals are expected to increase slightly
over the next two years. Gold prices are forecast to be stable.
A temporary resurgence in Chinese steel production and supply
disruptions in key producing countries, contributed to strong price
increases for steel-making and construction raw materials in 2016.
However, prices are forecast to decline in 2017, as the demand for steel
from China’s residential construction sector falls and as supply rises.
The value of the US dollar and global commodity prices (denominated in
US dollars) typically move in opposite directions, as shown in Figure 1.3.
However, in the month or so after the 9 November US election, while the
US dollar (trade weighted) index rose sharply, commodity prices were
largely stable in US dollar terms. The break in the correlation appears
partly due to President-elect Trump’s infrastructure spending and tax cut
proposals, viewed as likely to raise world resource consumption.
The effect of the US election outcome on Australia’s resource and export
earnings is uncertain
The effect of a Donald Trump Presidency on Australia’s resources and
energy export earnings is highly uncertain. In his campaign, President-
elect Trump pledged to cut taxes and raise spending on infrastructure,
which should raise the United States’ demand for goods and services.
Figure 1.2: Commodity prices
Figure 1.3: Global commodity prices and the US dollar
Note: S&P GSCI Commodity Price Index is based on a global basket of commodity
prices. Therefore, movements in this index may differ from an index based on the price of
Australia’s commodity exports.
Source: Bloomberg (2016) Federal Reserve, Standard and Poors
90
95
100
105
110
115
120
125
130
135200
300
400
500
600
700
800
900
1000
Dec-06 Dec-08 Dec-10 Dec-12 Dec-14 Dec-16
Index (
invert
ed s
cale
)
Index
S&P GSCI Commodity Price Index US$ broad index (rhs)
Note: Heating, power and transport fuels includes Brent oil, thermal coal and uranium.
Steel and steel product making includes iron ore, metallurgical coal, nickel and zinc.
Other metals includes copper, alumina and alumina. The components are 2016–17
export share weighted.
Source: Bloomberg (2016); Department of Industry, Innovation and Science (2016)
0
20
40
60
80
100
120
140
160
Dec-10 Dec-12 Dec-14 Dec-16 Dec-18
Index,
Decem
ber
2010 =
100
Heating, power and transport Steel and steel product making
Gold Other metals

Resources and Energy Quarterly December 2016 8
Some of these goods may be sourced from raw materials produced in
Australia — if the US does not increase its own mine output to meet
demand.
Mr Trump has also voiced support for the US coal industry, which has
been squeezed by the impact of both policy change under the Obama
Administration and low natural gas prices. It is unlikely that increased US
coal production would pose much of a threat to Australian exports.
Base metal price moves point to a rise in industrial production growth
Reflecting the sluggish pace of growth in the world economy, global
industrial production grew by 1.5 per cent year-on-year in September.
However, as shown by Figure 1.4, recent moves in base metals prices
and some leading indicators (see Macroeconomic Outlook) point to
stronger growth in world industrial production over the first half of 2017.
Monetary conditions in the major world economies remain loose in
historical terms.
Speculation in futures markets has increased again
Futures trading activity and spot price volatility has increased again in
the last four months of 2016, particularly in the markets for iron ore,
thermal and coking coal, zinc, steel, nickel and tin. This follows a large
spike in the number of trades in the March and June quarters of 2016;
the volume of iron ore futures trades on the Dalian Commodity
Exchange averaged nearly 600 million tonnes a day in March and April
2016 — equivalent to a third of the world’s production of iron ore in an
entire year.
While fundamentals of supply and demand in these markets may partly
explain price movements, the heightened amount of money used in
speculation may also be to blame. Such volatility adds to the difficulty of
forecasting short term movements in commodity prices.
Figure 1.4: World industrial production vs LME Index growth
Source: Bloomberg (2016) CPB Netherlands Bureau for Economic Policy Analysis,
London Metals Exchange
Figure 1.5: Monthly number of futures contracts traded
Source: Bloomberg (2016) Dalian Commodity Exchange and Zhengzhou Commodity
Exchange
0
20
40
60
80
100
120
140
160
180
200
0
2
4
6
8
10
12
14
16
18
20
Nov-14 May-15 Nov-15 May-16 Nov-16
Millions
Millions
Thermal coal Coking coal Iron ore (rhs)
-75
-50
-25
0
25
50
75
100
-15
-10
-5
0
5
10
15
20
Jul-96 Jul-99 Jul-02 Jul-05 Jul-08 Jul-11 Jul-14 Jul-17
Per
cent
Per
cent
World industrial production LME Index (rhs)
Resources and Energy Quarterly December 2016 9
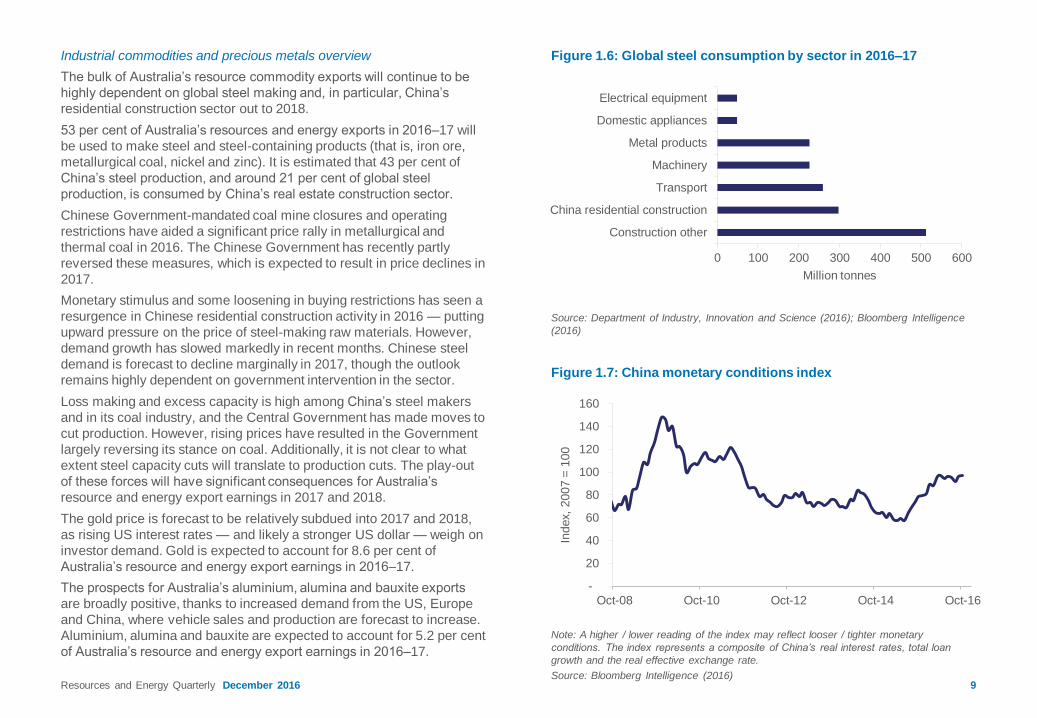
Industrial commodities and precious metals overview
The bulk of Australia’s resource commodity exports will continue to be
highly dependent on global steel making and, in particular, China’s
residential construction sector out to 2018.
53 per cent of Australia’s resources and energy exports in 2016–17 will
be used to make steel and steel-containing products (that is, iron ore,
metallurgical coal, nickel and zinc). It is estimated that 43 per cent of
China’s steel production, and around 21 per cent of global steel
production, is consumed by China’s real estate construction sector.
Chinese Government-mandated coal mine closures and operating
restrictions have aided a significant price rally in metallurgical and
thermal coal in 2016. The Chinese Government has recently partly
reversed these measures, which is expected to result in price declines in
2017.
Monetary stimulus and some loosening in buying restrictions has seen a
resurgence in Chinese residential construction activity in 2016 — putting
upward pressure on the price of steel-making raw materials. However,
demand growth has slowed markedly in recent months. Chinese steel
demand is forecast to decline marginally in 2017, though the outlook
remains highly dependent on government intervention in the sector.
Loss making and excess capacity is high among China’s steel makers
and in its coal industry, and the Central Government has made moves to
cut production. However, rising prices have resulted in the Government
largely reversing its stance on coal. Additionally, it is not clear to what
extent steel capacity cuts will translate to production cuts. The play-out
of these forces will have significant consequences for Australia’s
resource and energy export earnings in 2017 and 2018.
The gold price is forecast to be relatively subdued into 2017 and 2018,
as rising US interest rates — and likely a stronger US dollar — weigh on
investor demand. Gold is expected to account for 8.6 per cent of
Australia’s resource and energy export earnings in 2016–17.
The prospects for Australia’s aluminium, alumina and bauxite exports
are broadly positive, thanks to increased demand from the US, Europe
and China, where vehicle sales and production are forecast to increase.
Aluminium, alumina and bauxite are expected to account for 5.2 per cent
of Australia’s resource and energy export earnings in 2016–17.
Figure 1.6: Global steel consumption by sector in 2016–17
Source: Department of Industry, Innovation and Science (2016); Bloomberg Intelligence
(2016)
Figure 1.7: China monetary conditions index
Note: A higher / lower reading of the index may reflect looser / tighter monetary
conditions. The index represents a composite of China’s real interest rates, total loan
growth and the real effective exchange rate.
Source: Bloomberg Intelligence (2016)
-
20
40
60
80
100
120
140
160
Oct-08 Oct-10 Oct-12 Oct-14 Oct-16
Index,
2007 =
100
0 100 200 300 400 500 600
Construction other
China residential construction
Transport
Machinery
Metal products
Domestic appliances
Electrical equipment
Million tonnes
Resources and Energy Quarterly December 2016 10
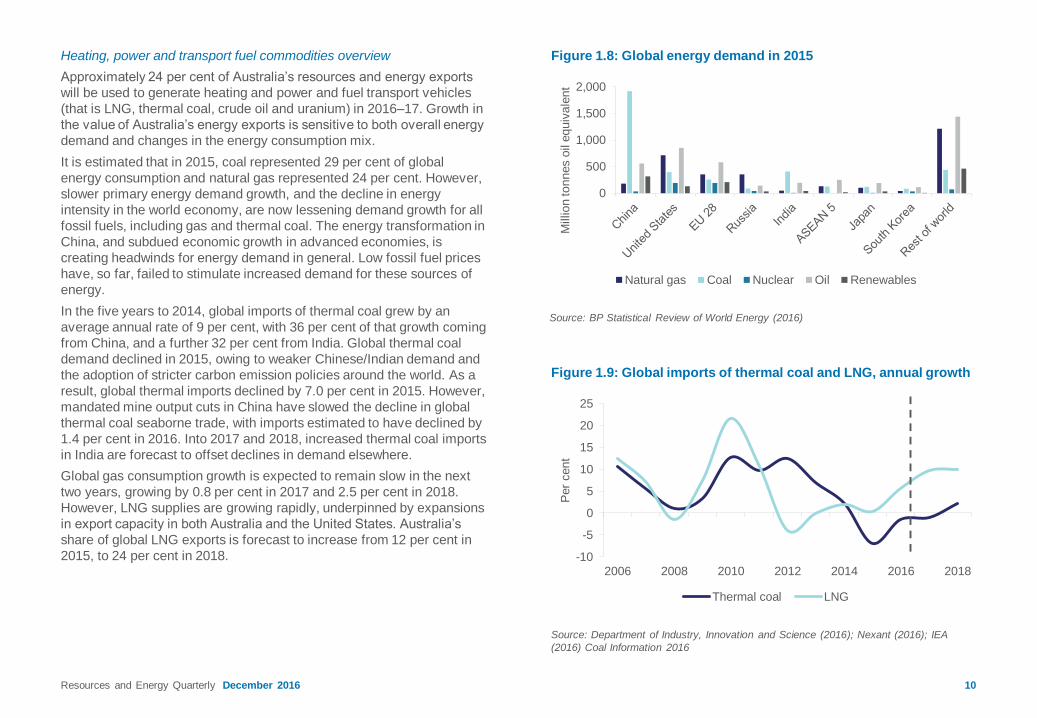
Heating, power and transport fuel commodities overview
Approximately 24 per cent of Australia’s resources and energy exports
will be used to generate heating and power and fuel transport vehicles
(that is LNG, thermal coal, crude oil and uranium) in 2016–17. Growth in
the value of Australia’s energy exports is sensitive to both overall energy
demand and changes in the energy consumption mix.
It is estimated that in 2015, coal represented 29 per cent of global
energy consumption and natural gas represented 24 per cent. However,
slower primary energy demand growth, and the decline in energy
intensity in the world economy, are now lessening demand growth for all
fossil fuels, including gas and thermal coal. The energy transformation in
China, and subdued economic growth in advanced economies, is
creating headwinds for energy demand in general. Low fossil fuel prices
have, so far, failed to stimulate increased demand for these sources of
energy.
In the five years to 2014, global imports of thermal coal grew by an
average annual rate of 9 per cent, with 36 per cent of that growth coming
from China, and a further 32 per cent from India. Global thermal coal
demand declined in 2015, owing to weaker Chinese/Indian demand and
the adoption of stricter carbon emission policies around the world. As a
result, global thermal imports declined by 7.0 per cent in 2015. However,
mandated mine output cuts in China have slowed the decline in global
thermal coal seaborne trade, with imports estimated to have declined by
1.4 per cent in 2016. Into 2017 and 2018, increased thermal coal imports
in India are forecast to offset declines in demand elsewhere.
Global gas consumption growth is expected to remain slow in the next
two years, growing by 0.8 per cent in 2017 and 2.5 per cent in 2018.
However, LNG supplies are growing rapidly, underpinned by expansions
in export capacity in both Australia and the United States. Australia’s
share of global LNG exports is forecast to increase from 12 per cent in
2015, to 24 per cent in 2018.
Figure 1.8: Global energy demand in 2015
Source: BP Statistical Review of World Energy (2016)
Figure 1.9: Global imports of thermal coal and LNG, annual growth
Source: Department of Industry, Innovation and Science (2016); Nexant (2016); IEA
(2016) Coal Information 2016
0
500
1,000
1,500
2,000
Million tonnes o
il e
quiv
ale
nt
Natural gas Coal Nuclear Oil Renewables
-10
-5
0
5
10
15
20
25
2006 2008 2010 2012 2014 2016 2018P
er
cent
Thermal coal LNG

Resources and Energy Quarterly December 2016 11
Australia overview
Export earnings forecast to reach record high before steadying
Growth in the volume of Australia’s exports of resource and energy
commodities was mixed in the September quarter 2016 (year-on-year).
LNG, gold, alumina and iron ore exports grew, while exports of coal and
base metals exports generally declined.
Export volumes of LNG increased by 50 per cent year-on-year, due to
the commencement of Australia Pacific LNG, Gladstone LNG and
Gorgon LNG projects. Bauxite export volumes increased by 23 per cent,
due to increased alumina production in China and supply reductions in
Malaysia and Indonesia. Gold export volumes increased by 9.6 per cent,
partly driven by the ramp up in production at Newmont Mining’s
Boddington mine. Iron ore exports increased by 3.3 per cent, supported
by production ramping up at Hancock Prospecting’s Roy Hill Mine, as
well as production increases at Fortescue Metals and Rio Tinto.
By contrast, zinc exports fell by 47 per cent year-on-year in September
quarter 2016, because of mine cutbacks by Glencore and the closure of
MMG Limited’s Century Zinc mine. Nickel ore exports (metal content)
declined by 29 per cent, as several mines were placed under ‘care and
maintenance’. Copper exports also declined, down by 16 per cent.
Coking coal exports declined by 3.3 per cent, because of weather and
infrastructure disruptions in Queensland, while thermal coal exports
declined by 0.4 per cent.
The outlook for Australia’s resources and energy exports is positive, with
export earnings forecast to increase 30 per cent in 2016–17, to a
nominal record of $204 billion, before steadying in 2017–18. The
strongest growth in export earnings over the two years to 2017–18 will
come from LNG, which is forecast to increase by 124 per cent, from $17
billion in 2015–16 to $37 billion in 2017–18, as recently completed
projects ramp up output and projects under construction come online.
Growth in bulk commodities volumes are also expected to contribute to
higher export earnings over the outlook period — despite the expected
unwinding of most of 2016’s price gains. Export earnings from iron ore,
metallurgical coal, and thermal coal exports, are forecast to increase a
combined 23 per cent, to $101 billion, in the two years to 2017–18.
Figure 1.10: Year-on-year growth in export volumes by commodity
Source: ABS (2016) International Trade in Goods and Services, 5368.0; Department of
Industry, Innovation and Science (2016)
Figure 1.11: Australia’s resources and energy export earnings
Source: ABS (2016) International Trade in Goods and Services, 5368.0; Department of
Industry, Innovation and Science (2016)
-60 -40 -20 0 20 40 60
ZincNickel
CopperMetallurgical coal
Thermal coalIron oreAlumina
GoldLNG
Per cent
September quarter 2016 September quarter 2017
0
20
40
60
80
100
120
140
1997–98 2001–02 2005–06 2009–10 2013–14 2017–18
2016–17 A
$ b
illion
Energy Resources

Resources and Energy Quarterly December 2016 12
Resource and energy exports to support nominal GDP growth
In recent years, Australia’s nominal GDP has been increasingly affected
by resource and energy export earnings — reflecting the increased
share of mining in Australia’s economy.
However, declining commodity prices saw the Australian mining sector’s
share of Australia’s gross domestic product (GDP) fall to 6.0 per cent in
2015–16, its lowest share since 2004–05. This should turn around in the
next few quarters — higher commodity prices and further increases in
export volumes of Australia’s largest export commodities, are expected
to see the mining sector make a larger contribution to Australia’s
economy in 2016–17.
Capital expenditure declines and the investment pipeline thins
The mining boom continues to transition from the ‘investment phase’ to
the ‘production phase’, with the commodity price outlook too low to
incentivise a strong rebound in capital expenditure. Despite the
improvement in commodity prices in 2016, they remain well below levels
reached in the investment phase. Additionally, the price gains of 2016
are expected to be largely unwound over the next 18-24 months.
Private capital expenditure in the mining sector declined by 35 per cent
year-on-year in the September quarter 2016, to $9.7 billion. This was the
lowest level in six years, although it remains well above levels observed
prior to the onset of the mining boom.
The Resources and Energy Major Projects publication — an appendix to
this report — reflects the decline in capital investment. The total value of
committed resource and energy projects in the investment pipeline —
those where a final investment decision has been taken and construction
activity is likely underway — has fallen by 12 per cent over the 12
months to October 2016, to $195 billion.
Moreover, the progression of projects to the committed stage is slowing,
as producers divert focus from developing new projects to reducing
costs, and to ensuring the commercial viability of existing assets. Final
investment decisions for many projects have been delayed to 2017 or
later, with project owners weighing up factors such as the price cycle,
access to infrastructure and cost competitiveness in Australia. As a
result, the outlook for resources and energy investment remains
subdued over the short to medium term.
Source: ABS (2016) National Accounts, 5206.0; ABS (2016) International Trade in Goods
and Services, 5368.0; Department of Industry, Innovation and Science (2016)
Figure 1.13: Private mining capital expenditure
Source: ABS (2016) Private New Capital Expenditure and Expected Expenditure, 5625.0
0
5
10
15
20
25
30
Sep-12 Sep-13 Sep-14 Sep-15 Sep-16
A$ b
illion
Building and structures Equipment, Plant and Machinery
-2
0
2
4
6
8
10
12
-40
-20
0
20
40
60
80
Sep-91 Sep-96 Sep-01 Sep-06 Sep-11 Sep-16
Per
cent
Per
cent
Resources and energy export earnings Nominal GDP (rhs)
Figure 1.12: Australia’s nominal GDP vs resource and energy
export earnings, year-on-year change

Resources and Energy Quarterly December 2016 13
Exploration expenditure continues to fall
The pace of decline in mineral exploration expenditure — which has
usually declined by over ten per cent year-on-year since late 2012 —
has slowed considerably in recent quarters. Mineral exploration fell by
only 3.7 per cent in the September quarter 2016, to $380 million. By
contrast, petroleum exploration expenditure continued to decline rapidly,
falling by 39 per cent year-on-year, to $355 million.
Gold and copper were the only minerals to record increased exploration
expenditure in the September quarter 2016. Gold exploration
expenditure increased by 19 per cent year-on-year, to $159 million,
while copper exploration expenditure increased by 15 per cent to $35
million. Coal exploration expenditure was the largest contributor to the
overall decline, falling 34 per cent year-on-year to $37 million. The
decline in iron ore exploration expenditure has slowed considerably in
recent quarters, falling by only 2.9 per cent to $80 million in the
September quarter 2016.
Minerals exploration expenditure increased year-on-year in Victoria (up
23 per cent to $7.9 million), New South Wales (up 8.5 per cent to $32
million) and Western Australia (up 6.7 per cent to $249 million) in the
September quarter 2016. This was offset by declines in Northern
Territory (down 34 per cent to $22 million), Queensland (down 28 per
cent to 55 million), Tasmania (down 18 per cent to $3.2 million) and
South Australia (down 5.5 per cent to $10 million).
The generally subdued long term outlook for growth in commodity prices
makes substantive increases in exploration expenditure over the outlook
period unlikely.
Mining employment is at its lowest level in over five years
Trend employment in the mining sector declined by 2.7 per cent in
August 2016, to 216,000 — the lowest level since February 2011. In the
year to August 2016, the largest fall in mining industry employment
occurred in Queensland, where employment declined by 9 per cent to
61,100 persons. Employment is likely to decline further over the outlook
period, as major projects move into the less labour-intensive production
phase of the mining boom.
Figure 1.14: Australia’s exploration expenditure
Source: ABS (2016) Actual and Expected Private Mineral Exploration, 8412.0
Figure 1.15: Mining sector employment
Source: ABS (2016) Labour Force Australia, 6291.0.55.003
0
50
100
150
200
250
300
Aug–01 Aug–04 Aug–07 Aug–10 Aug–13 Aug–16
Thousand p
ers
ons
0
500
1,000
1,500
2,000
2,500
Sep–12 Sep–13 Sep–14 Sep–15 Sep–16
A$ m
illio
n
Minerals Petroleum

2016–17 fPer cent
2017–18 f
volume EUV value volume EUV value
p p p p q q
6 23 30 6 -13 -8
p p p q q
2 99 102 0 -33 -33
p p p p p p
42 1 43 28 21 56
p p p q q
4 21 25 0 -5 -5
p p p q q q
5 5 11 -2 -1 -2
q p q p p
-9 2 -6 0 13 13
p p p p p p
2 12 14 21 16 40
p q q p p
3 -5 -3 0 4 4
p p p p p
3 0 3 3 1 3
q p p q q
-38 61 0 5 -7 -3
q p q p p p
-14 5 -9 18 8 27
p q q p q p
5 -7 -3 18 -4 13
Resources and Energy Quarterly December 2016 14
Notes: f Forecast; EUV is export Unit Value
Figure 1.16: Australia’s major resources and
energy commodity exports
Source: ABS (2016) International Trade in Goods and Services, 5368.0;
Department of Industry, Innovation and Science (2016)
A$1.5b
A$2.9b
A$2.6b
A$3.5b
A$6.1b
A$8.7b
AS8.5b
A$16.9b
A$17.4b
A$37.0b
A$26.7b
A$57.0b
A$1.3b
A$2.2b
A$2.6b
A$3.3b
A$5.8b
A$6.2b
A$7.6b
A$17.4b
A$18.4b
A$23.7b
A$40.0b
A$62.2b
A$1.4b
A$2.5b
A$2.6b
A$3.2b
A$6.0b
A$5.4b
A$8.1b
A$15.7b
A$14.7b
A$16.5b
A$19.8b
A$47.8b
0 10 20 30 40 50 60 70 80
Titanium and zircon
Nickel
Zinc
Aluminium
Alumina
Crude oil
Copper
Gold
Thermal coal
LNG
Metallurgical coal
Iron ore
2015–16 2016–17 f 2017–18 f

Resources and Energy Quarterly December 2016 15
Table 1.2: Australia’s resources and energy commodity exports, selected commodities
Notes: f Forecast
Source: ABS (2016) International Trade in Goods and Services, 5368.0; Department of Industry, Innovation and Science (2016)
Table 1.1: Outlook for Australia’s resources and energy commodities
Notes: b In current financial year Australian dollars; f Forecast
Source: ABS (2016) International Trade in Goods and Services, 5368.0; Department of Industry, Innovation and Science (2016)
unit 2015–16 2016–17 f Per cent change 2017–18 f Per cent change
Value of exports
Resources and energy A$m 157,374 203,946 29.6 202,155 –0.9
– real b A$m 159,971 203,946 27.5 197,899 –3.0
Energy A$m 59,741 91,544 53.2 93,391 2.0
– real b A$m 60,727 91,544 50.7 91,425 –0.1
Resources A$m 97,633 112,402 15.1 108,764 –3.2
– real b A$m 99,244 112,402 13.3 106,474 –5.3
Volume Value
unit 2016–17 f 2017–18 f Per cent change 2016–17 f 2017–18 f Per cent change
Alumina kt 18,211 18,211 0.0 5,843 6,106 4.5
Aluminium kt 1,490 1,532 2.8 3,350 3,463 3.4
Copper kt 981 1,024 4.4 7,579 8,549 12.8
Gold t 323 317 -1.6 17,353 16,929 –2.4
Iron ore Mt 832 879 5.6 62,230 57,021 –8.4
Nickel kt 186 219 18.1 2,245 2,855 27.2
Zinc kt 941 985 4.7 2,634 2,552 –3.1
LNG Mt 52 67 28.5 23,713 37,000 56.0
Metallurgical coal Mt 191 191 -0.3 39,988 26,661 –33.3
Thermal coal Mt 208 208 0.2 18,370 17,395 –5.3
Oil kbd 244 295 20.8 6,221 8,723 40.2
Uranium t 7,141 7,850 9.9 907 995 9.8


Resources and Energy Quarterly December 2016 17
Overview
Recent months have seen signs of a recovery in the world industrial
production cycle — the major driver of resource commodity demand
growth and prices. The prospect of a more stimulatory US fiscal policy is
adding to the chance of an even stronger recovery in 2017. Forthcoming
elections in several large European countries, and scheduled leadership
change in China through 2017, pose uncertainties to the forecast
outlook. Further out, a withdrawal of extremely loose monetary policy in
the United States and the prospect of increasing foreign trade
protectionism, could largely offset the ongoing benefits of any US fiscal
stimulus.
United States
From likely growth of around 1.75 per cent in 2016, US GDP growth is
forecast to improve to 2.3 per cent in 2017 and 3.0 per cent in 2018.
These forecasts are based on assumed increased infrastructure
spending and significant tax cuts for households and corporations.
A sharp rebound in US year bond yields has been the most notable
trend on global financial markets in recent months. Along with the
prospective fiscal stimulus, rising commodity prices and signs of
stronger growth have helped raise US inflation expectations. September
quarter US GDP was revised up to 3.2 per cent (seasonally-adjusted
annualised rate), driven by a rebound in consumption. The prospect of
this growth continuing is supported by US consumer confidence
readings, which rose sharply in November. The manufacturing sector
also showed signs of growth in November, with both the ISM and Markit
PMI rising to 53.2 and 54.1 index points, respectively. Growth in the
sector has been driven by rising demand for goods from both consumers
and businesses. Although the higher US dollar has hurt exports, it has
also reduced import costs, at a time when inflation pressures are rising.
Construction spending has also shown strong gains, rising to a 7-month
high of US$1.2 trillion (annualised rate) in October, due to increases in
public construction spending and in private residential spending.
Housing starts also jumped 25.5 per cent in October (seasonally
adjusted, annualised rate), the highest pace since August 2007.
Figure 2.1: World PMI vs growth in world industrial production
Source: Netherland CPB (2016) World Trade Monitor September; Markit (2016) JP
Morgan Global Manufacturing PMI
Figure 2.2: Growth in world steel production vs industrial production
Source: Netherlands CPB( 2016) World Trade Monitor September ; International Iron and
Steel Institute (2016) World Total Steel Production Data
-15
-10
-5
0
5
10
35
40
45
50
55
60
2000 2002 2004 2006 2008 2010 2012 2014 2016
Per
cent
Index p
oin
ts
World PMI World industrial production, lagged 2 months (rhs)
-30
-20
-10
0
10
20
30
40
-15
-10
-5
0
5
10
15
20
1992 1996 2000 2004 2008 2012 2016
Per
cent
World industrial output, 2-month lag World steel production (RHS)

Resources and Energy Quarterly December 2016 18
China
Chinese GDP growth is expected to continue to ease modestly, to 6.4
per cent in 2017 and 6.1 per cent in 2018. The Chinese government
continues to use various policy levers to keep growth firm, as the
economy transitions away from export and investment-led growth to
consumption-led growth. However, with a leadership change expected at
the 19th National People’s Congress — to be held in late 2017 — there
may be a renewed focus on strong growth at the expense of structural
reform. A further significant decline in the Yuan over the past few
months will help to sustain economic growth of the Chinese economy in
2017.
Recent data for the manufacturing sector supports signs of continuing
stabilisation in the economy. Both leading manufacturing leading indices
(the official PMI and Caixin PMI) suggest a significant strengthening in
the manufacturing sector in the coming few months. The manufacturing
sector appears to be benefiting from the government’s stimulus
measures earlier this year, and from an emerging economic recovery in
China’s main trading partners.
The (stop-start nature of the) Chinese housing market continues to be a
concern, as house prices surge in China’s 70 major cities. Despite some
tightening of regulations on house purchases in a range of tier 2 and
tier 3 cities, and instructions from the Chinese central bank to reduce
bank credit, investment in real estate grew strongly in the year to
October. Construction is likely to slow over the next few months, as
policy measures bite, providing less support for economic growth.
Europe
Following an initial sell-off on the back of the Brexit referendum,
European markets have settled. Industrial production in the Euro area
showed steady growth in September, increasing 1.2 per cent
year-on-year. Recent readings of the Euro area composite PMI point to
GDP growth continuing at current levels over the next few months.
Source: OECD (2016) China Composite Leading Index Total Trend Restored Stock;
National Bureau of Statistics, China (2016) China Leading Index
Figure 2.4: Euro area GDP growth vs composite PMI
Source: Eurostat (2016) Euro Area Gross Domestic Product; Markit (2016) Eurozone
Composite PMI
Figure 2.3: Growth in Chinese industrial production vs OECD
leading indicator for China
-6
-4
-2
0
2
4
6
35
40
45
50
55
60
65
2007 2008 2009 2010 2011 2012 2013 2014 2015 2016
Per
cent
Index p
oin
ts
Euro area composite PMI Euro area GDP growth
0
5
10
15
20
25
2007 2008 2009 2010 2011 2012 2013 2014 2015 2016
Per
cent
OECD Leading indicator for China Chinese industrial production
Resources and Energy Quarterly December 2016 19
GDP growth for the Euro area is expected to be 1.6 per cent in 2017 and
1.7 per cent in 2018, little changed from recent years. However, there
remain some risks to future growth. Once Article 50 is triggered and the
two-year UK-EU exit negotiation process begins, uncertainty may weigh
on consumer and business confidence. Moreover, oil prices appear to
have bottomed, and the European Central Bank appears unlikely to
loosen monetary policy substantially further.
Results of the recent referendum in Italy have created additional
uncertainty, with the Italian Prime Minister to resign following the
outcome. However, markets remained stable, with minimal disruption
aside from a short-lived drop in value for the Euro.
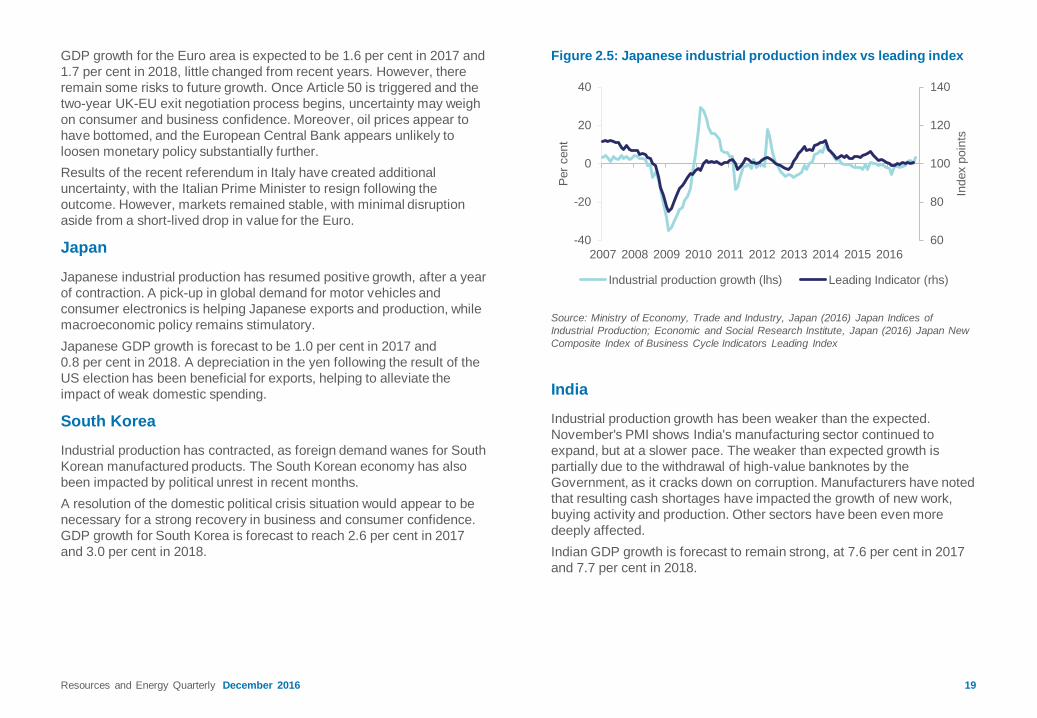
Japan
Japanese industrial production has resumed positive growth, after a year
of contraction. A pick-up in global demand for motor vehicles and
consumer electronics is helping Japanese exports and production, while
macroeconomic policy remains stimulatory.
Japanese GDP growth is forecast to be 1.0 per cent in 2017 and
0.8 per cent in 2018. A depreciation in the yen following the result of the
US election has been beneficial for exports, helping to alleviate the
impact of weak domestic spending.
South Korea
Industrial production has contracted, as foreign demand wanes for South
Korean manufactured products. The South Korean economy has also
been impacted by political unrest in recent months.
A resolution of the domestic political crisis situation would appear to be
necessary for a strong recovery in business and consumer confidence.
GDP growth for South Korea is forecast to reach 2.6 per cent in 2017
and 3.0 per cent in 2018.
India
Industrial production growth has been weaker than the expected.
November's PMI shows India's manufacturing sector continued to
expand, but at a slower pace. The weaker than expected growth is
partially due to the withdrawal of high-value banknotes by the
Government, as it cracks down on corruption. Manufacturers have noted
that resulting cash shortages have impacted the growth of new work,
buying activity and production. Other sectors have been even more
deeply affected.
Indian GDP growth is forecast to remain strong, at 7.6 per cent in 2017
and 7.7 per cent in 2018.
Figure 2.5: Japanese industrial production index vs leading index
Source: Ministry of Economy, Trade and Industry, Japan (2016) Japan Indices of
Industrial Production; Economic and Social Research Institute, Japan (2016) Japan New
Composite Index of Business Cycle Indicators Leading Index
60
80
100
120
140
-40
-20
0
20
40
2007 2008 2009 2010 2011 2012 2013 2014 2015 2016
Index p
oin
ts
Per
cent
Industrial production growth (lhs) Leading Indicator (rhs)

Resources and Energy Quarterly December 2016 20
Table 2.1: Key world macroeconomic assumptions
Notes: a Assumption; b Change from previous period; c Weighted using 2012 purchasing power parity (PPP) valuation of country gross domestic product by IMF; d Indonesia, Malaysia,
Philippines, Thailand and Vietnam; e Excludes Hong Kong
Source: IMF (2016) World Economic Outlook; OECD (2016) Economic Outlook
Per cent 2014 2015 2016 a 2017 a 2018 a
Economic growth b
Advanced economies 1.9 2.1 1.6 1.8 1.8
United States 2.4 2.6 1.5 2.3 3.0
Japan 0.0 0.5 0.8 1.0 0.8
European Union 28 1.6 2.3 1.9 1.7 1.8
Germany 1.6 1.5 1.7 1.4 1.4
France 0.6 1.3 1.3 1.3 1.6
United Kingdom 3.1 2.2 1.8 1.1 1.7
South Korea 3.3 2.6 2.7 2.6 3.0
Chinese Taipei 3.9 0.6 1.0 1.7 1.9
Emerging economies 4.6 4.0 4.2 4.6 4.8
Non-OECD Asia 6.8 6.6 6.5 6.3 6.3
South East Asia d 4.6 4.8 4.8 5.1 5.2
China e 7.3 6.9 6.7 6.4 6.1
India 7.2 7.6 7.4 7.6 7.7
Latin America &
Caribbean1.0 –0.0 –0.6 1.6 2.1
Middle East 2.6 2.2 3.2 3.2 3.4
World c 3.4 3.2 3.1 3.4 3.6
Inflation rate b
United States 2.2 0.1 1.1 1.8 2.2
21
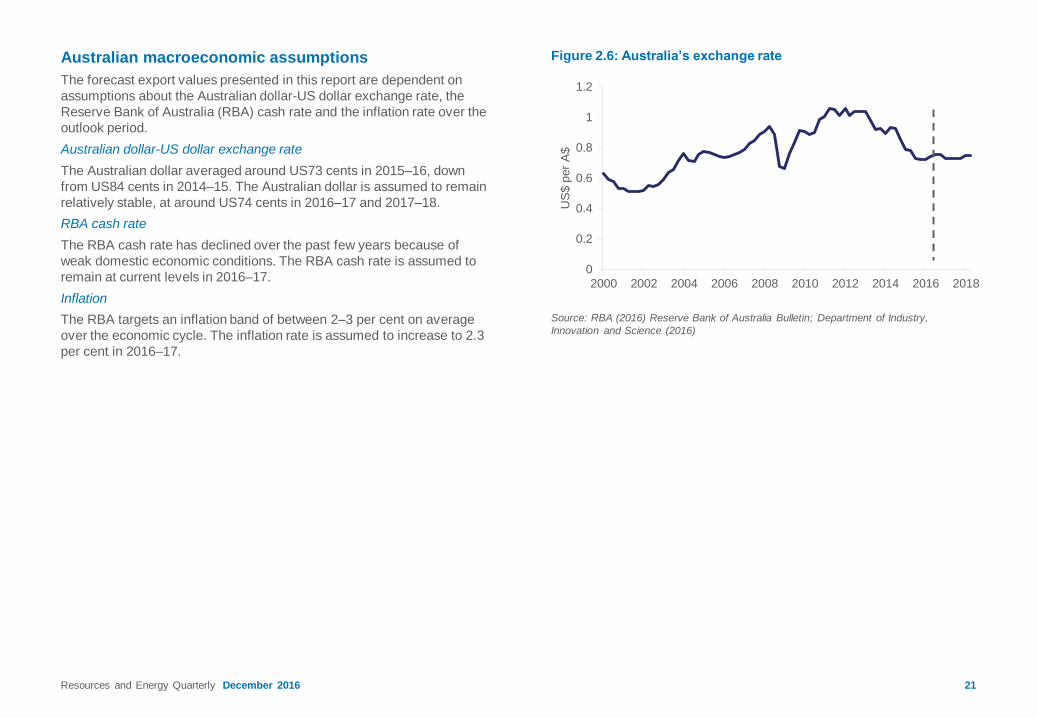
Australian macroeconomic assumptions
The forecast export values presented in this report are dependent on
assumptions about the Australian dollar-US dollar exchange rate, the
Reserve Bank of Australia (RBA) cash rate and the inflation rate over the
outlook period.
Australian dollar-US dollar exchange rate
The Australian dollar averaged around US73 cents in 2015–16, down
from US84 cents in 2014–15. The Australian dollar is assumed to remain
relatively stable, at around US74 cents in 2016–17 and 2017–18.
RBA cash rate
The RBA cash rate has declined over the past few years because of
weak domestic economic conditions. The RBA cash rate is assumed to
remain at current levels in 2016–17.
Inflation
The RBA targets an inflation band of between 2–3 per cent on average
over the economic cycle. The inflation rate is assumed to increase to 2.3
per cent in 2016–17.
Figure 2.6: Australia’s exchange rate
Source: RBA (2016) Reserve Bank of Australia Bulletin; Department of Industry,
Innovation and Science (2016)
0
0.2
0.4
0.6
0.8
1
1.2
2000 2002 2004 2006 2008 2010 2012 2014 2016 2018
US
$ p
er
A$
Resources and Energy Quarterly December 2016


Resources and Energy Quarterly December 2016 23
Market summary
Global steel production is forecast to grow by 0.1 per cent in 2017, and
by 1.0 per cent in 2018, to reach 1.6 billion tonnes. Steel production in
China is forecast to decline, as residential construction slows,
representing a significant risk to suppliers of raw materials to the steel
sector in China. In contrast, India’s steel production is forecast to
continue to grow strongly, with India set to become the second largest
producer in the world by the end of 2018. Steel production in the United
States and European Union is also expected to grow over the outlook
period, supported by rising domestic demand and by anti-dumping
measures against low price steel imports from China.
Steel production and consumption
China’s steel production forecast to decline in 2017 and 2018
In the four months to October, steel production increased 3.5 per cent
year-on-year, supported by increased steel consumption, up 5.8 per cent
over the same period. In contrast to previous expectations that China’s
steel production would decline in 2016, annual production is now
estimated to have grown slightly (by 0.9 per cent), to reach 811 million
tonnes. Production is forecast to decline by 2.0 per cent and 2.5 per cent
in 2017 and 2018, respectively.
The recent increase in China’s steel production has occurred despite
accelerating capacity cuts in recent months. These cuts have totalled 88
million tonnes in the year to date, almost double the target of 45 million
tonnes. However, a large share of the capacity cuts were to plants that
had already been idled, while production growth at remaining plants has
been incentivised by higher steel prices, improved margins and strong
demand.
Recent steel consumption growth has been driven by the construction
sector and investment in infrastructure. Residential property sales were
up 28 per cent year-on-year in the three months to October, while
infrastructure fixed asset investment increased 19 per cent. A 24 per
cent increase in automobile production — supported by a cut in the
sales tax on small passenger cars — also drove higher steel demand.
Figure 3.1: World steel production, annual change
Source: Bloomberg (2016) World Steel Association; Department of Industry, Innovation
and Science (2016)
Source: Bloomberg (2016) National Bureau of Statistics China
-100
-50
0
50
100
2012 2013 2014 2015 2016 2017 2018
Million tonnes
China India Japan
South Korea United States European Union
Rest of world World
-10
-5
0
5
10
15
20
-20
0
20
40
60
Oct-10 Apr-12 Oct-13 Apr-15 Oct-16
Per
cent
Per
cent
Residential buildings sold Steel production (rhs)
Figure 3.2: China’s property sales and steel production, year-on-
year change

Resources and Energy Quarterly December 2016 24
Steel exports decreased 15 per cent year-on-year in the three months to
October, the largest decline since mid-2011. An increasing number of
antidumping duties against China’s steel products have been imposed
by the European Union, United States and India.
The forecast decline in Chinese steel production over the outlook period
is underpinned by an expected slowdown in residential construction, and
to a lesser extent, ongoing capacity cuts, industry consolidation and
increasingly stringent environmental regulations.
Government measures to cool the housing market in Tier 1 and 2 cities
have already had a noticeable effect on house prices. There is also a
persistent large oversupply of housing stock in smaller cities. A
slowdown in construction — which accounts for around 72 per cent of
domestic steel use — will weigh on steel prices and production, and as a
result, the demand for raw materials. The pace and extent of the
slowdown in residential construction, and potential for further
government stimulus measures, represent the key risks to the outlook.
Falling steel demand from the residential construction sector will only be
partially offset by increased demand from other sectors, including in the
machinery, automobile and appliances sectors. Infrastructure investment
will be a key source of demand growth, with the National Development
and Reform Commission and the Ministry of Transport planning to spend
RMB4.7 trillion on 303 infrastructure projects in the period to end 2018.
India to become world’s second largest steel producer
Steel production in India increased 8.7 per cent year-on-year in the
September quarter 2016, as producers continued to ramp up output in
anticipation of growing demand from the government’s infrastructure
development plans and the ‘Make in India’ campaign. In 2016, steel
output is estimated to have risen by 6.8 per cent to 95 million tonnes.
India is forecast to become the world’s second largest steel maker by
the end of 2018, with output forecast to grow by 7.0 per cent in 2017 and
8.3 per cent in 2018 to 110 million tonnes.
Domestic steel output will continued to be supported by a range of
policies (such as safeguard duties, minimum import price mechanisms
and anti-dumping duties imposed on a range of steel products) that have
already resulted in substantially reduced imports. Iron and steel imports
declined by 28 per cent year-on-year in the four months to October.
Source: Bloomberg (2016) National Bureau of Statistics China; Bloomberg (2016) Antaike
Source: Bloomberg (2016) World Steel Association; Bloomberg (2016) Reserve Bank of
India
0
1000
2000
3000
4000
-2
-1
0
1
2
3
4
Oct-13 Oct-14 Oct-15 Oct-16
RM
B
Per
cent
First tier Second tier Third tier Rebar price (rhs)
Figure 3.3: China property prices (month-on-month ch.) and steel price
(rebar)
-5
0
5
10
15
-50
0
50
100
150
Jul-14 Jan-15 Jul-15 Jan-16 Jul-16
Per
cent
Per
cent
Steel imports Steel production (rhs)
Figure 3.4: India’s steel production and imports, year-on-year ch.

Resources and Energy Quarterly December 2016 25
Japan’s steel production to remain stable over 2017 and 2018
Steel production in Japan increased 0.6 per cent year-on-year in the four
months to October. Demand for steel was supported by a strong
recovery in housing starts, up 9.2 and 11 per cent year-on-year in
August and September, respectively. After a sluggish year of growth,
there were also signs of a recovery in industrial production and
manufacturing, both up 1.4 per cent year-on-year in September.
However, steel production in Japan is expected to continue to be
adversely effected by sluggish domestic economic growth and export
demand in the next two years. Production in 2016 as a whole is
estimated to have declined by 0.4 per cent, and is forecast to remain
largely unchanged over 2017 and 2018, at around 104 million tonnes.
South Korea’s steel industry undergoing restructuring
South Korea’s steel production increased 0.6 per cent year-on-year in
the four months to October, but is estimated to have decreased by 1.6
per cent in 2016 as a whole. The domestic steel industry has been
adversely affected by a downturn in its shipbuilding and automobile
industries.
Steel production is forecast to increase marginally, in 2017 and 2018, by
1.2 and 1.3 per cent, respectively, to reach 70 million tonnes. South
Korea’s two largest steel producers will benefit from a range of
government policies aimed at facilitating restructuring in the sector.
These policies include fast-tracked merger and acquisitions procedures,
tax benefits and financial assistance for research and development.
United States steel production forecast to grow over 2017 and 2018
Steel production in the United States declined by 4.3 per cent in the four
months to October, and is estimated to have declined by 1.6 per cent for
2016 as a whole.
Despite high anti-dumping duties on a range of steel products, and a
strong recovery in the Dodge construction index (up 32 per cent year-on-
year in August and September), steel production has been affected by
subdued domestic demand conditions in the manufacturing and
automobile sectors.
Source: Bloomberg (2016) World Steel Association; Bloomberg (2016) Ministry of
Economy, Trade and Industry, Japan
Source: Bloomberg (2016) World Steel Association; Bloomberg (2016) US Federal
Reserve
-12
-8
-4
0
4
8
12
Jan-14 Sep-14 May-15 Jan-16 Sep-16
Per
cent
Steel production Industrial production
Figure 3.5: Japan’s steel production and industrial production, y/y ch.
-20
-15
-10
-5
0
5
10
15
-8
-6
-4
-2
0
2
4
6
Jan-12 Jan-13 Jan-14 Jan-15 Jan-16P
er
cent
Industrial production Steel production (rhs)
Figure 3.6: US steel production and industrial production, y/y ch.

Resources and Energy Quarterly December 2016 26
Steel production in the United States is forecast to grow by 7 per cent
and 13 per cent in 2017 and 2018, respectively. The large upward
revision from the previous quarter is underpinned by the President-elect
Trump’s plans for higher infrastructure spending and more protectionist
trade policies, which will boost domestic steel demand and production.
However, there is a some uncertainty surrounding the delivery of all the
pledges made during the election campaign.
Steel production in the European Union forecast to grow in 2017-18
Steel production in the European Union declined by 1.0 per cent in the
four months to October, and is estimated to have declined by 4.2 per
cent for 2016 as a whole. Demand conditions remained soft, with
subdued growth in construction (up 0.7 per cent year-on-year in the
three months to October) and industrial production (up 1.1 per cent over
the same period).
Production is forecast to grow by 2.5 per cent per annum over the
outlook period, to reach 167 million tonnes in 2018, close to the
historical average. Steel production is expected to be supported by the
imposition of anti-dumping duties on steel imports. Following the Brexit
result, there is a higher potential for the EU to pursue policies that
protect the domestic industry — the United Kingdom has historically led
a small group of countries opposed to trade restrictions.
Australia’s steel exports increased while imports decreased in the
September quarter
Australia’s steel production is estimated to have increased by 2.8 per
cent year-on-year in the September quarter 2016, to 1.3 million tonnes.
This represents just 0.3 per cent of total global production. At the same
time, apparent steel consumption (production plus imports less exports)
is estimated to have fallen by 16 per cent to 1.6 million tonnes, as a
result of further contraction in the construction industry.
Australia’s imports of steel declined 41 per cent year-on-year to 479,000
tonnes in the September quarter, while import unit values declined by 29
per cent over the same period. Despite concern over low-cost imports of
steel products from China, imports from China decreased by 4.6 per
cent in the September quarter to 76,000 tonnes. Imports from Japan
decreased by 9.2 per cent to 28,000 tonnes over the same period.
The volume of Australia’s steel exports increased by 3.8 per cent year-
on-year in the September quarter to 207,000 tonnes. Despite adverse
rulings on Australian steel imports to the US, exports to the US
increased by 17 per cent year-on-year in the September quarter, to
48,000 tonnes. Total export unit values decreased by 1.2 per cent over
the same period, as a result of lower global steel prices.
Australia has two major steel producers, Arrium Steel and BlueScope
Steel. Steel production at Arrium’s Whyalla plant was affected by the
power outage in South Australia at the start of the December quarter,
with an estimated $10 million in losses. Arrium Steel is currently under
voluntary administration, with final bids for its sale due in December
2016. Recent cost-cutting activities at BlueScope Steel have resulted in
higher margins — even amid high metallurgical coal and iron ore prices
— providing some stability to Australia’s steel production.
Figure 3.7: Australia’s steel production, exports and imports
Source: ABS (2016) International Trade, Australia, cat. no. 5465.0; Department of
Industry, Innovation and Science (2016); Company reports and presentations
0.0
0.5
1.0
1.5
2.0
Sep-10 Sep-11 Sep-12 Sep-13 Sep-14 Sep-15 Sep-16
Million tonnes
Production Exports Imports

Resources and Energy Quarterly December 2016 27
Table 3.2: World steel production
Notes: f Forecast s Estimate
Source: Bloomberg (2016) World Steel Association; Department of Industry, Innovation and Science (2016)
Table 3.1: World steel consumption
Notes: e Estimate f Forecast
Source: Bloomberg (2016) World Steel Association; Department of Industry, Innovation and Science (2016)
Million tonnes 2015 2016 s 2017 f 2018 f Per cent change
European Union 28 167 168 170 174 1.2
United States 108 107 112 118 5.0
Brazil 24 16 14 13 –11.7
Russia 45 41 40 39 –2.6
China 700 707 692 683 –2.0
Japan 68 67 66 66 –1.5
South Korea 58 57 56 56 –0.9
India 89 94 102 110 8.2
World steel consumption 1,617 1,617 1,620 1,636 0.2
Million tonnes 2015 2016 s 2017 f 2018 f Per cent change
European Union 28 166 159 163 167 2.5
United States 79 78 83 94 12.8
Brazil 33 30 28 27 –3.5
Russia 71 70 69 69 –0.5
China 804 811 795 775 –2.5
Japan 105 105 104 104 –0.0
South Korea 70 69 69 70 1.3
India 89 95 102 110 8.3
World steel production 1,620 1,620 1,622 1,638 1.0


Resources and Energy Quarterly December 2016 29
Market summary
Australia’s iron ore export values are forecast to increase by 30 per cent
in 2016–17, to reach $62 billion. This represents an upward revision
from the previous forecast of $54 billion, due to the recent unexpected
strength in the iron ore price. The iron ore price (FOB Australia) is
forecast to average US$58 a tonne in 2016–17, supported by a
resurgence in China’s steel production and speculative trading. The iron
ore price is forecast to decline to average US$49 a tonne in 2017–18, as
demand cools and supply grows. As a result, export values are forecast
to decline by 8.4 per cent in 2017–18, to $57 billion.
Prices
Iron ore spot price forecast to decline from two year highs to reflect
weaker fundamentals
The rally in the iron ore spot price (FOB Australia) has continued since
the last Resources and Energy Quarterly, averaging US$66 a tonne in
November and exceeding US$75 a tonne in mid-December. This gain
took the price to a 26-month high. The rally reflects a combination of
fundamental drivers and speculative trading. However, with the likely
moderation of these factors over the outlook period, the iron ore price is
still forecast to decline, to average US$53 in 2017 and US$49 in 2018.
The iron ore price has been supported by the resurgence of China’s
steel sector, where improved demand conditions have boosted margins
and production. A sharp increase in metallurgical coal prices has also
supported the demand for imports of high quality iron ore, which requires
the use of less metallurgical coal in the steel-making process. The
growing premium for high quality iron ore is reflected in the widening gap
between the 58 per cent and 62 per cent iron ore price indices.
The rally has occurred despite a steady increase in China’s port stocks
through the year. Stocks exceeded 100 million tonnes in December, a
two-year high and up 23 per cent year-on-year. The magnitude of the
price rise also reflected heightened speculative activity, with a sharp
increase in iron ore futures traded on the Dalian Commodity Exchange.
The increased speculation came on the back of the US election outcome
and an NDRC announcement that capacity cuts in the steel sector had
been exceeded. Investor demand for US dollar-denominated assets has
also rose, due to the decline in the Chinese Yuan.
Figure 4.1: Quarterly iron ore price, FOB Australia
Source: Bloomberg (2016) Metal Bulletin; Department of Industry, Innovation and Science
(2016)
Source: Bloomberg (2016) Dalian Commodity Exchange; Bloomberg (2016) Metal Bulletin
Figure 4.2: Daily volume of iron ore futures contracts traded and
the iron ore spot price, FOB Australia
0
40
80
120
160
200
2011 2012 2013 2014 2015 2016 2017 2018
2016 U
S$
a tonne
0
200
400
600
800
1,000
1,200
0
20
40
60
80
Dec-14 Jun-15 Dec-15 Jun-16 Dec-16
Million tonnes
US
$ a
tonne
Spot price (FOB Australia) Futures contracts volumes (rhs)
30
The forecast price of US$53 a tonne in 2017 has been revised up from
the previous forecast of US$45 a tonne. Some short term support is
expected at the start of 2017: increased profitability in the Chinese steel
sector will combine with likely seasonal disruption to supply from
Australia, where a more active cyclone season is forecast.
However, the forecast decline in the price — to an average of US$49 a
tonne in 2018 — will ultimately be driven by growing low-cost supply on
the seaborne market and more subdued growth in global demand.
World trade
World trade in iron ore is forecast to grow by 5.5 per cent and 2.5 per
cent in 2017 and 2018, respectively. The seaborne market is forecast to
remain well supplied, with rising low-cost output from Australia and
Brazil. China’s iron ore imports are forecast to grow, displacing lower-
grade domestic production.
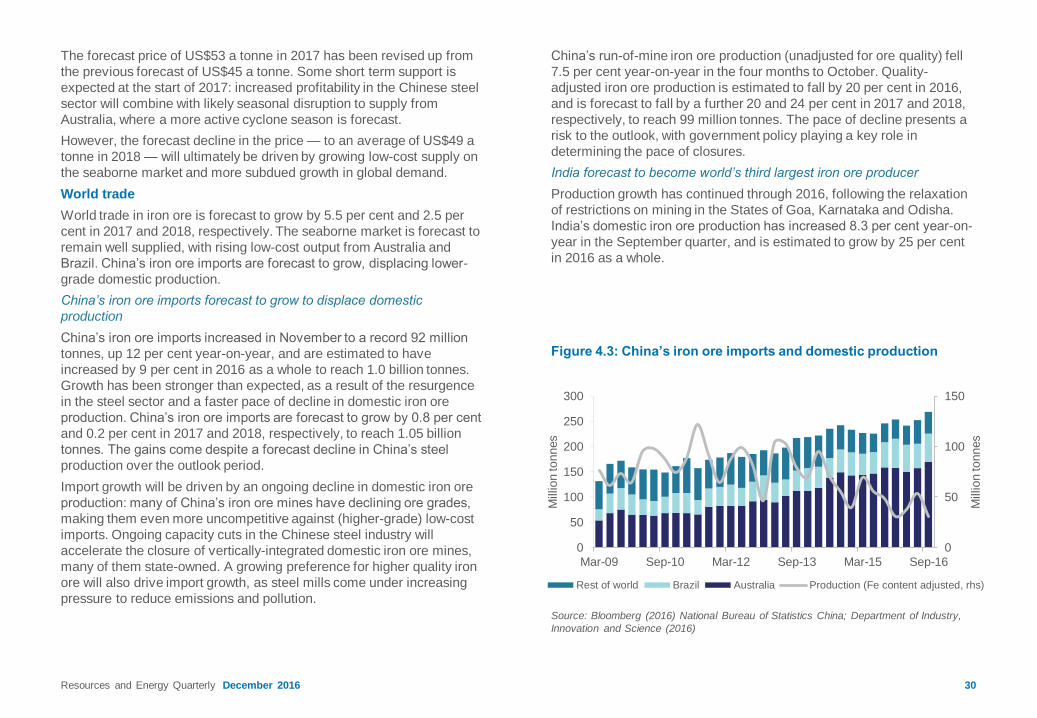
China’s iron ore imports forecast to grow to displace domestic
production
China’s iron ore imports increased in November to a record 92 million
tonnes, up 12 per cent year-on-year, and are estimated to have
increased by 9 per cent in 2016 as a whole to reach 1.0 billion tonnes.
Growth has been stronger than expected, as a result of the resurgence
in the steel sector and a faster pace of decline in domestic iron ore
production. China’s iron ore imports are forecast to grow by 0.8 per cent
and 0.2 per cent in 2017 and 2018, respectively, to reach 1.05 billion
tonnes. The gains come despite a forecast decline in China’s steel
production over the outlook period.
Import growth will be driven by an ongoing decline in domestic iron ore
production: many of China’s iron ore mines have declining ore grades,
making them even more uncompetitive against (higher-grade) low-cost
imports. Ongoing capacity cuts in the Chinese steel industry will
accelerate the closure of vertically-integrated domestic iron ore mines,
many of them state-owned. A growing preference for higher quality iron
ore will also drive import growth, as steel mills come under increasing
pressure to reduce emissions and pollution.
China’s run-of-mine iron ore production (unadjusted for ore quality) fell
7.5 per cent year-on-year in the four months to October. Quality-
adjusted iron ore production is estimated to fall by 20 per cent in 2016,
and is forecast to fall by a further 20 and 24 per cent in 2017 and 2018,
respectively, to reach 99 million tonnes. The pace of decline presents a
risk to the outlook, with government policy playing a key role in
determining the pace of closures.
India forecast to become world’s third largest iron ore producer
Production growth has continued through 2016, following the relaxation
of restrictions on mining in the States of Goa, Karnataka and Odisha.
India’s domestic iron ore production has increased 8.3 per cent year-on-
year in the September quarter, and is estimated to grow by 25 per cent
in 2016 as a whole.
Figure 4.3: China’s iron ore imports and domestic production
Source: Bloomberg (2016) National Bureau of Statistics China; Department of Industry,
Innovation and Science (2016)
0
50
100
150
0
50
100
150
200
250
300
Mar-09 Sep-10 Mar-12 Sep-13 Mar-15 Sep-16
Million tonnes
Million tonnes
Rest of world Brazil Australia Production (Fe content adjusted, rhs)
Resources and Energy Quarterly December 2016
Resources and Energy Quarterly December 2016 31
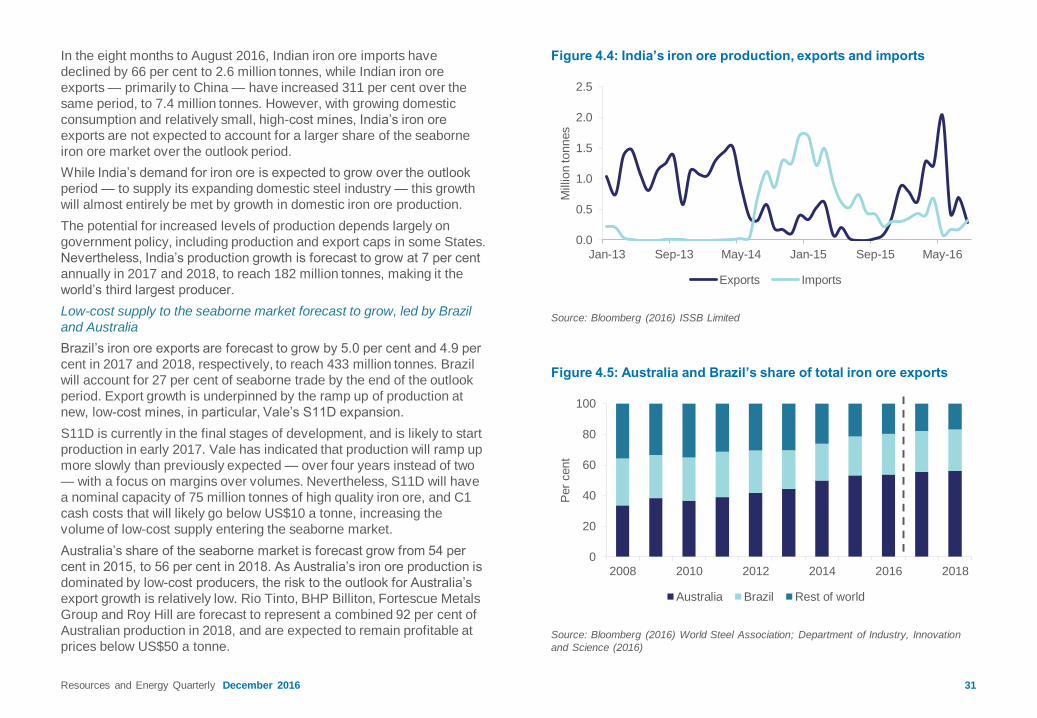
In the eight months to August 2016, Indian iron ore imports have
declined by 66 per cent to 2.6 million tonnes, while Indian iron ore
exports — primarily to China — have increased 311 per cent over the
same period, to 7.4 million tonnes. However, with growing domestic
consumption and relatively small, high-cost mines, India’s iron ore
exports are not expected to account for a larger share of the seaborne
iron ore market over the outlook period.
While India’s demand for iron ore is expected to grow over the outlook
period — to supply its expanding domestic steel industry — this growth
will almost entirely be met by growth in domestic iron ore production.
The potential for increased levels of production depends largely on
government policy, including production and export caps in some States.
Nevertheless, India’s production growth is forecast to grow at 7 per cent
annually in 2017 and 2018, to reach 182 million tonnes, making it the
world’s third largest producer.
Low-cost supply to the seaborne market forecast to grow, led by Brazil
and Australia
Brazil’s iron ore exports are forecast to grow by 5.0 per cent and 4.9 per
cent in 2017 and 2018, respectively, to reach 433 million tonnes. Brazil
will account for 27 per cent of seaborne trade by the end of the outlook
period. Export growth is underpinned by the ramp up of production at
new, low-cost mines, in particular, Vale’s S11D expansion.
S11D is currently in the final stages of development, and is likely to start
production in early 2017. Vale has indicated that production will ramp up
more slowly than previously expected — over four years instead of two
— with a focus on margins over volumes. Nevertheless, S11D will have
a nominal capacity of 75 million tonnes of high quality iron ore, and C1
cash costs that will likely go below US$10 a tonne, increasing the
volume of low-cost supply entering the seaborne market.
Australia’s share of the seaborne market is forecast grow from 54 per
cent in 2015, to 56 per cent in 2018. As Australia’s iron ore production is
dominated by low-cost producers, the risk to the outlook for Australia’s
export growth is relatively low. Rio Tinto, BHP Billiton, Fortescue Metals
Group and Roy Hill are forecast to represent a combined 92 per cent of
Australian production in 2018, and are expected to remain profitable at
prices below US$50 a tonne.
Figure 4.4: India’s iron ore production, exports and imports
Source: Bloomberg (2016) ISSB Limited
Figure 4.5: Australia and Brazil’s share of total iron ore exports
Source: Bloomberg (2016) World Steel Association; Department of Industry, Innovation
and Science (2016)
0.0
0.5
1.0
1.5
2.0
2.5
Jan-13 Sep-13 May-14 Jan-15 Sep-15 May-16
Million tonnes
Exports Imports
0
20
40
60
80
100
2008 2010 2012 2014 2016 2018P
er
cent
Australia Brazil Rest of world

Resources and Energy Quarterly December 2016 32
Australia’s production, exports and exploration
Exploration activity remains subdued
Australia’s iron ore exploration expenditure decreased by 2.9 per cent
year-on-year and increased 3.9 per cent quarter-on-quarter in the
September quarter, to $80 million. Exploration expenditure for iron ore
remains at historical lows, as companies focus on cutting costs and
maintaining existing assets.
Australia’s iron ore export values grew by 5.4 per cent in the September
quarter
In the September quarter, Australia’s iron ore production grew by 2.5 per
cent year-on-year, to 220 million tonnes. Exports volumes grew by 3.5
per cent to 206 million tonnes over the same period, while export values
grew 5.4 per cent to $14 billion, supported by higher prices. There was
strong growth in exports at the start of the December quarter, with iron
ore shipments from Port Hedland up 10 per cent year-on-year in
November at 41 million tonnes.
Australia’s exports values are forecast to grow strongly in 2016–17 but
decline in 2017–18
Australia’s iron ore production is forecast to increase by 3.7 per cent to
880 million tonnes in 2016–17 and by 4.9 per cent in 2017–18 to reach
923 million tonnes, supported by productivity improvements and the
continued ramp up of expansions. Roy Hill, the final new major iron ore
development, is expected to reach nameplate capacity of 55 million
tonnes in early 2017.
Australia’s iron ore exports volumes are forecast to increase 5.9 per cent
to 832 million tonnes in 2016–17 and 5.6 per cent to 879 million tonnes
in 2017–18. Export values are forecast to increase by 30 per cent in
2016–17 to reach $62 billion, revised up from the previous forecast of
$54 billion, due to the recent and unexpected strength in the iron ore
price. However, as the iron ore price is forecast to decline over the
outlook period, export values are forecast to decrease by 8.4 per cent in
2017–18 to $57 billion.
Figure 4.6: Forecast iron ore production and cash losses in 2018
Source: AME Group (2016); Department of Industry, Innovation and Science (2016)
Figure 4.7: Australia’s iron ore exports volumes and values
Source: ABS (2016) International Trade, Australia, cat. no. 5465.0; Department of
Industry, Innovation and Science (2016)
0
10
20
30
40
50
60
70
80
0
200
400
600
800
1,000
2007–08 2009–10 2011–12 2013–14 2015–16 2017–18
2016–17 $
billion
Million tonnes
Export volume Export value (rhs)
0
10
20
30
40
50
60
70
0
200
400
600
800
1000
Australia Brazil India China Rest ofworld
Per
cent
Million tonnes
Iron ore production Loss making share of production (rhs)
Resources and Energy Quarterly December 2016 33
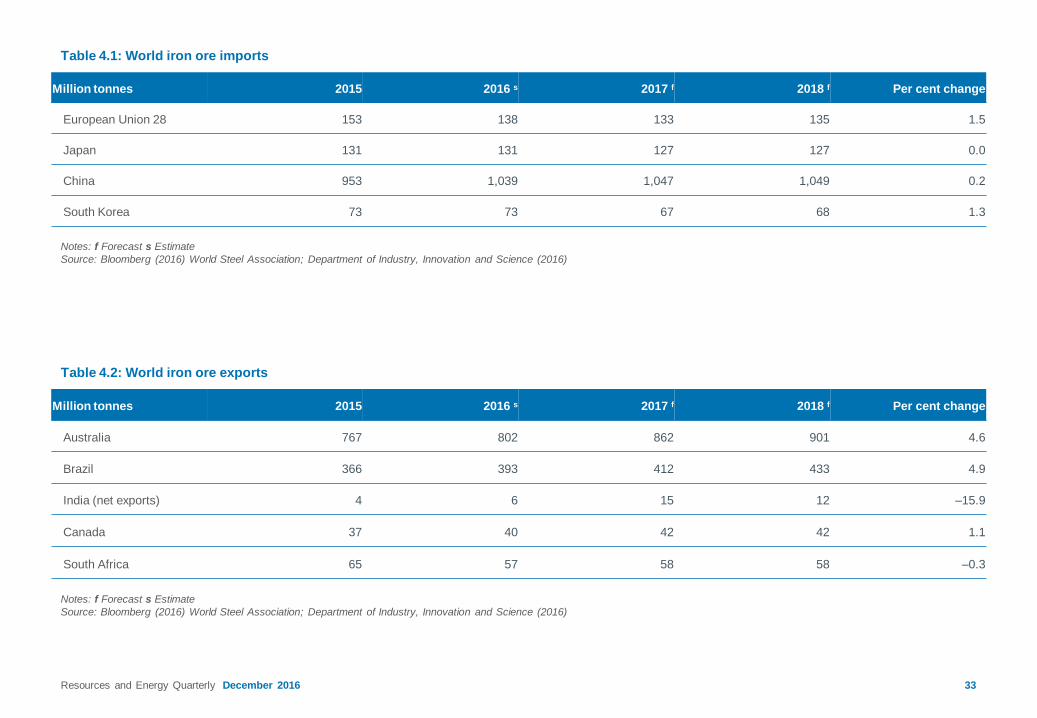
Table 4.2: World iron ore exports
Notes: f Forecast s Estimate
Source: Bloomberg (2016) World Steel Association; Department of Industry, Innovation and Science (2016)
Table 4.1: World iron ore imports
Notes: f Forecast s Estimate
Source: Bloomberg (2016) World Steel Association; Department of Industry, Innovation and Science (2016)
Million tonnes 2015 2016 s 2017 f 2018 f Per cent change
European Union 28 153 138 133 135 1.5
Japan 131 131 127 127 0.0
China 953 1,039 1,047 1,049 0.2
South Korea 73 73 67 68 1.3
Million tonnes 2015 2016 s 2017 f 2018 f Per cent change
Australia 767 802 862 901 4.6
Brazil 366 393 412 433 4.9
India (net exports) 4 6 15 12 –15.9
Canada 37 40 42 42 1.1
South Africa 65 57 58 58 –0.3

34
Table 4.3: Iron ore outlook
Notes: b FOB Australian basis c Spot price, 62 per cent iron content basis d In current calendar year US dollars g Crude steel equivalent. Crude steel is defined as the first solid state of
production after melting. In ABS Australian Harmonized Export Commodity Classification, crude steel equivalent includes most items from 7206 to 7307, excluding ferrous waste and scrap and
ferroalloys h In current Australian financial year dollars f Forecast s Estimate
Source: ABS (2016) International Trade in Goods and Services, 5368.0; World Steel Association (2016); AME Group (2016); Company Reports;
Department of Industry, Innovation and Science (2016)
unit 2015 2016 s 2017 f 2018 f Per cent change
World
Iron ore prices bc
– nominal US$/t 50.3 52.7 52.7 48.8 –7.4
– real d US$/t 50.9 52.7 51.6 46.7 –9.4
2014–15 2015–16 2016–17 f 2017–18 f Per cent change
Australia
Production
Iron and steel gs Mt 4.74 4.97 5.04 4.79 –5.0
Iron ore Mt 786.7 848.6 879.8 923.0 4.9
Exports
Iron and steel gs Mt 0.92 0.77 0.90 0.89 –1.1
– nominal value A$m 719 598 696 674 –3.2
– real value h A$m 741 608 696 660 –5.2
Iron ore Mt 747.7 786.0 832.2 878.7 5.6
– nominal value A$m 54,519 47,768 62,230 57,021 –8.4
– real value h A$m 56,184 48,556 62,230 55,820 –10.3
Resources and Energy Quarterly December 2016

0
50
100
150
200
250
300
350
400
Dec-02 Dec-05 Dec-08 Dec-11 Dec-14 Dec-17
2016 U
S$ a
tonne
Resources and Energy Quarterly December 2016 36
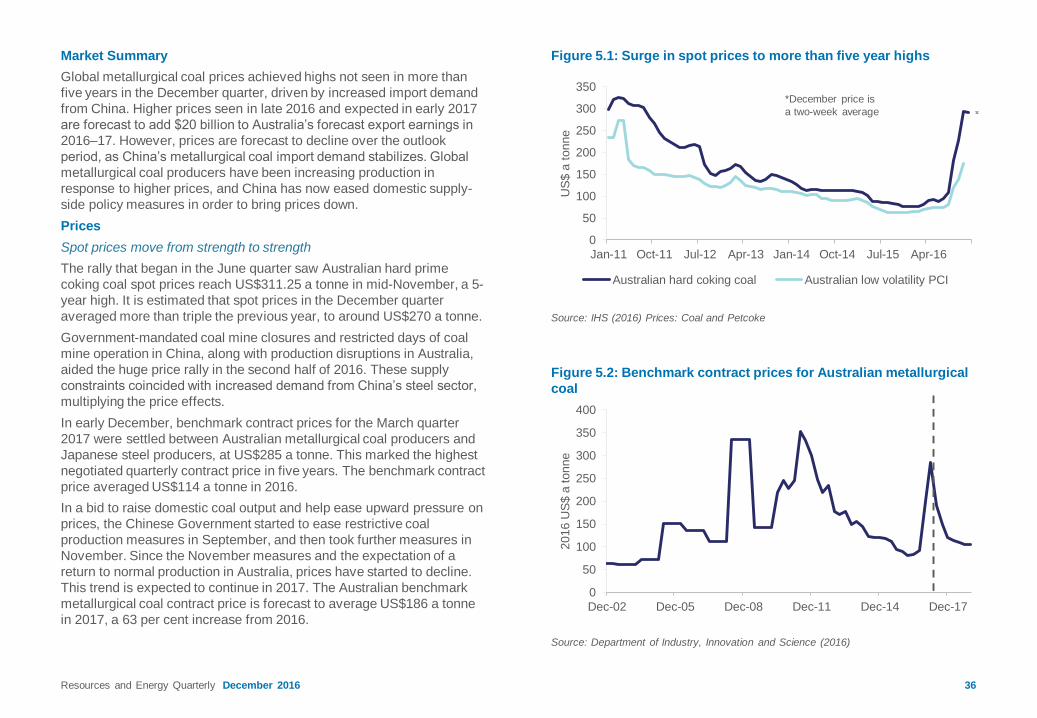
Market Summary
Global metallurgical coal prices achieved highs not seen in more than
five years in the December quarter, driven by increased import demand
from China. Higher prices seen in late 2016 and expected in early 2017
are forecast to add $20 billion to Australia’s forecast export earnings in
2016–17. However, prices are forecast to decline over the outlook
period, as China’s metallurgical coal import demand stabilizes. Global
metallurgical coal producers have been increasing production in
response to higher prices, and China has now eased domestic supply-
side policy measures in order to bring prices down.
Prices
Spot prices move from strength to strength
The rally that began in the June quarter saw Australian hard prime
coking coal spot prices reach US$311.25 a tonne in mid-November, a 5-
year high. It is estimated that spot prices in the December quarter
averaged more than triple the previous year, to around US$270 a tonne.
Government-mandated coal mine closures and restricted days of coal
mine operation in China, along with production disruptions in Australia,
aided the huge price rally in the second half of 2016. These supply
constraints coincided with increased demand from China’s steel sector,
multiplying the price effects.
In early December, benchmark contract prices for the March quarter
2017 were settled between Australian metallurgical coal producers and
Japanese steel producers, at US$285 a tonne. This marked the highest
negotiated quarterly contract price in five years. The benchmark contract
price averaged US$114 a tonne in 2016.
In a bid to raise domestic coal output and help ease upward pressure on
prices, the Chinese Government started to ease restrictive coal
production measures in September, and then took further measures in
November. Since the November measures and the expectation of a
return to normal production in Australia, prices have started to decline.
This trend is expected to continue in 2017. The Australian benchmark
metallurgical coal contract price is forecast to average US$186 a tonne
in 2017, a 63 per cent increase from 2016.
Figure 5.1: Surge in spot prices to more than five year highs
Source: IHS (2016) Prices: Coal and Petcoke
Figure 5.2: Benchmark contract prices for Australian metallurgical
coal
Source: Department of Industry, Innovation and Science (2016)
0
50
100
150
200
250
300
350
Jan-11 Oct-11 Jul-12 Apr-13 Jan-14 Oct-14 Jul-15 Apr-16
US
$ a
tonne
Australian hard coking coal Australian low volatility PCI
*December price is
a two-week average

Resources and Energy Quarterly December 2016 37
In 2018, Australian benchmark metallurgical coal contract prices are
forecast to decline 42 per cent to US$109 a tonne. The forecast for
declining prices is partly attributable to a rise in production in China and
other major exporting countries, and softer Chinese import demand.
World trade
In 2017, world metallurgical coal trade is forecast to be little changed
from 2016, at 314 million tonnes. A decline in metallurgical coal demand
for steel production in China will be offset by increased import demand
from India and ASEAN economies. In 2018, world metallurgical coal
trade is forecast to stay similar.
China’s metallurgical coal imports continue to grow
China’s metallurgical coal imports increased 54 per cent year-on-year in
the three months to October 2016. The increase in imports was driven
by China’s mandated coal mine capacity closures. Capacity closures
seem to have affected metallurgical coal output more than thermal coal,
as the enforcement of cutbacks appear to have been largely enforced in
the Shanxi region — where metallurgical coal production is high. Output
in the Shanxi province was also adversely affected by bad weather in
the September quarter, exacerbating the supply squeeze on Chinese
steel mills.
In 2017, China’s metallurgical coal imports are forecast to decline by 11
per cent, to 51 million tonnes. This decline reflects expectations of a less
heavy-handed approach to capacity closures by the Chinese
Government, and lower demand from China’s steel sector — as China’s
construction sector begins to cool. China’s metallurgical coal imports are
expected to decline by 3.9 per cent in 2018, to 49 million tonnes.
However, there is upside risk to this import forecast, with China’s
property market possibly holding up better than expected.
India’s metallurgical coal imports forecast to increase
Relative to the previous year, India’s metallurgical coal imports declined
by 15 per cent, in the September quarter, as high prices started to bite
home. The decline follows a 1.8 per cent year-on-year increase in the
first half of 2016. After declining in 2016 — due to high metallurgical coal
prices — India’s metallurgical coal imports are forecast to increase by 12
per cent in 2017, to 55 million tonnes, and by a further 3.6 per cent in
2018, to 57 million tonnes.
Figure 5.3: Major metallurgical coal importers
Notes: f Forecast
Source: IEA (2016) Coal information 2016; Department of Industry, Innovation and
Science (2016)
Figure 5.4: China, India and Japan’s metallurgical coal imports
Source: IHS (2016) Coal imports by country and type
0
10
20
30
40
50
60
India South Korea China Japan EU
Million tonnes
2015 2018 f
0
1
2
3
4
5
6
7
8
9
Jun-11 Jun-12 Jun-13 Jun-14 Jun-15 Jun-16M
illion tonnes
China India Japan
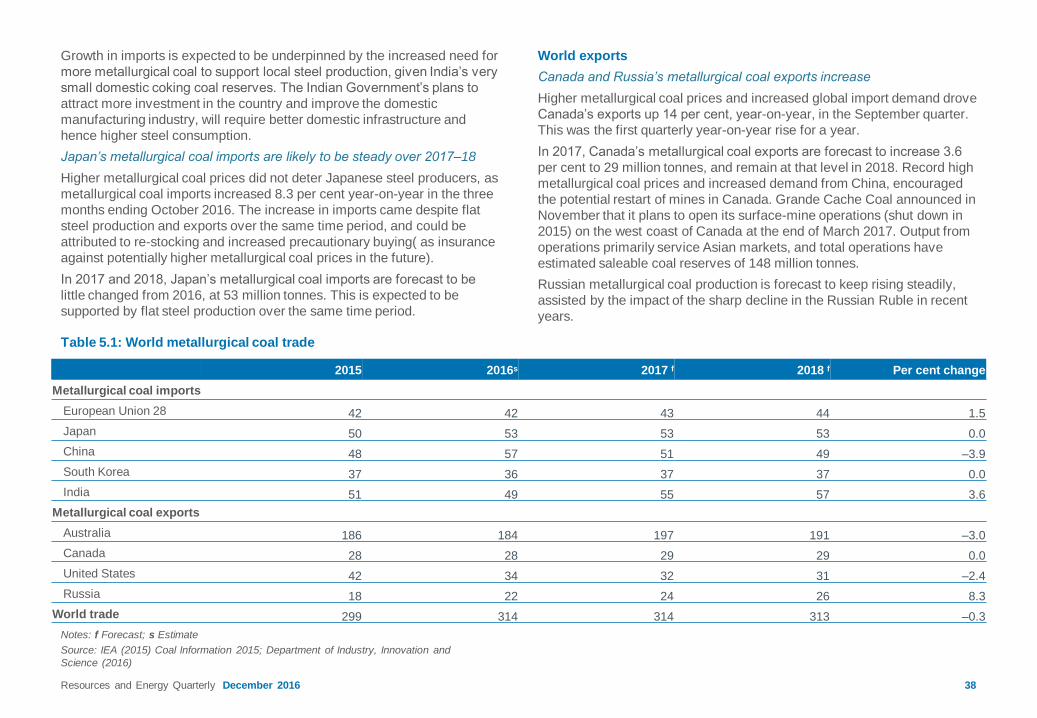
Resources and Energy Quarterly December 2016 38
Growth in imports is expected to be underpinned by the increased need for
more metallurgical coal to support local steel production, given India’s very
small domestic coking coal reserves. The Indian Government’s plans to
attract more investment in the country and improve the domestic
manufacturing industry, will require better domestic infrastructure and
hence higher steel consumption.
Japan’s metallurgical coal imports are likely to be steady over 2017–18
Higher metallurgical coal prices did not deter Japanese steel producers, as
metallurgical coal imports increased 8.3 per cent year-on-year in the three
months ending October 2016. The increase in imports came despite flat
steel production and exports over the same time period, and could be
attributed to re-stocking and increased precautionary buying( as insurance
against potentially higher metallurgical coal prices in the future).
In 2017 and 2018, Japan’s metallurgical coal imports are forecast to be
little changed from 2016, at 53 million tonnes. This is expected to be
supported by flat steel production over the same time period.
World exports
Canada and Russia’s metallurgical coal exports increase
Higher metallurgical coal prices and increased global import demand drove
Canada’s exports up 14 per cent, year-on-year, in the September quarter.
This was the first quarterly year-on-year rise for a year.
In 2017, Canada’s metallurgical coal exports are forecast to increase 3.6
per cent to 29 million tonnes, and remain at that level in 2018. Record high
metallurgical coal prices and increased demand from China, encouraged
the potential restart of mines in Canada. Grande Cache Coal announced in
November that it plans to open its surface-mine operations (shut down in
2015) on the west coast of Canada at the end of March 2017. Output from
operations primarily service Asian markets, and total operations have
estimated saleable coal reserves of 148 million tonnes.
Russian metallurgical coal production is forecast to keep rising steadily,
assisted by the impact of the sharp decline in the Russian Ruble in recent
years.
Table 5.1: World metallurgical coal trade
Notes: f Forecast; s Estimate
Source: IEA (2015) Coal Information 2015; Department of Industry, Innovation and
Science (2016)
2015 2016s 2017 f 2018 f Per cent change
Metallurgical coal imports
European Union 28 42 42 43 44 1.5
Japan 50 53 53 53 0.0
China 48 57 51 49 –3.9
South Korea 37 36 37 37 0.0
India 51 49 55 57 3.6
Metallurgical coal exports
Australia 186 184 197 191 –3.0
Canada 28 28 29 29 0.0
United States 42 34 32 31 –2.4
Russia 18 22 24 26 8.3
World trade 299 314 314 313 –0.3
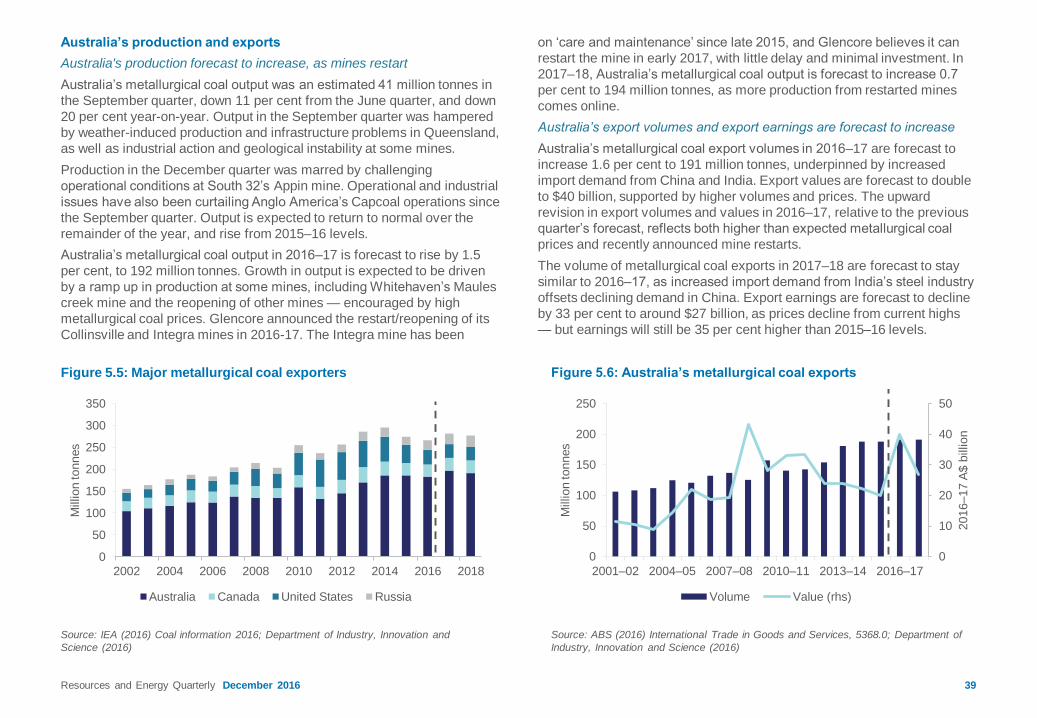
Resources and Energy Quarterly December 2016 39
Australia’s production and exports
Australia's production forecast to increase, as mines restart
Australia’s metallurgical coal output was an estimated 41 million tonnes in
the September quarter, down 11 per cent from the June quarter, and down
20 per cent year-on-year. Output in the September quarter was hampered
by weather-induced production and infrastructure problems in Queensland,
as well as industrial action and geological instability at some mines.
Production in the December quarter was marred by challenging
operational conditions at South 32’s Appin mine. Operational and industrial
issues have also been curtailing Anglo America’s Capcoal operations since
the September quarter. Output is expected to return to normal over the
remainder of the year, and rise from 2015–16 levels.
Australia’s metallurgical coal output in 2016–17 is forecast to rise by 1.5
per cent, to 192 million tonnes. Growth in output is expected to be driven
by a ramp up in production at some mines, including Whitehaven’s Maules
creek mine and the reopening of other mines — encouraged by high
metallurgical coal prices. Glencore announced the restart/reopening of its
Collinsville and Integra mines in 2016-17. The Integra mine has been
on ‘care and maintenance’ since late 2015, and Glencore believes it can
restart the mine in early 2017, with little delay and minimal investment. In
2017–18, Australia’s metallurgical coal output is forecast to increase 0.7
per cent to 194 million tonnes, as more production from restarted mines
comes online.
Australia’s export volumes and export earnings are forecast to increase
Australia’s metallurgical coal export volumes in 2016–17 are forecast to
increase 1.6 per cent to 191 million tonnes, underpinned by increased
import demand from China and India. Export values are forecast to double
to $40 billion, supported by higher volumes and prices. The upward
revision in export volumes and values in 2016–17, relative to the previous
quarter’s forecast, reflects both higher than expected metallurgical coal
prices and recently announced mine restarts.
The volume of metallurgical coal exports in 2017–18 are forecast to stay
similar to 2016–17, as increased import demand from India’s steel industry
offsets declining demand in China. Export earnings are forecast to decline
by 33 per cent to around $27 billion, as prices decline from current highs
— but earnings will still be 35 per cent higher than 2015–16 levels.
Figure 5.6: Australia’s metallurgical coal exports
Source: ABS (2016) International Trade in Goods and Services, 5368.0; Department of
Industry, Innovation and Science (2016)
Figure 5.5: Major metallurgical coal exporters
Source: IEA (2016) Coal information 2016; Department of Industry, Innovation and
Science (2016)
0
50
100
150
200
250
300
350
2002 2004 2006 2008 2010 2012 2014 2016 2018
Million tonnes
Australia Canada United States Russia
0
10
20
30
40
50
0
50
100
150
200
250
2001–02 2004–05 2007–08 2010–11 2013–14 2016–17
2016–17 A
$ b
illion
Million tonnes
Volume Value (rhs)

40
Table 5.2: Australia’s metallurgical coal outlook
Notes: f Forecast; d Contract price assessment for high-quality hard coking coal; e In current calendar year US dollars; h In current financial year Australian
dollars; s Estimate
Source: ABS (2016) International Trade in Goods and Services, 5368.0; Department of Industry, Innovation and Science (2016)
Units 2015 2016 s 2017 f 2018 f Per cent change
Contract prices d
– nominal US$/t 102.1 114.4 186.3 108.8 –41.6
– real e US$/t 103.3 114.4 182.2 104.1 –42.9
Units 2014–15 2015–16 2016–17 f 2017–18 f Per cent change
Australia
Production Mt 194.1 189.3 192.1 193.5 0.7
Export volume Mt 188 188 191 191 –0.3
– nominal value A$m 21,813 19,803 39,988 26,661 –33.3
– real value h A$m 22,479 20,130 39,988 26,099 –34.7
Resources and Energy Quarterly December 2016


Resources and Energy Quarterly December 2016 42
Market summary
Thermal coal prices increased further in the first half of the December
quarter, driven by China’s supply side reform policies and lower output
from Indonesia. An easing in China’s restrictive domestic coal production
policies resulted in a slight decline in prices from mid-November. With
likely further easing in Chinese Government coal production policies and
increased production from Indonesia, it is expected that seaborne
thermal coal prices will pull back over the outlook period. With higher
prices and export volumes, Australia’s export values are forecast to
increase in 2016–17 before stabilising in 2017–18.
Prices
Prices decline from multi-year highs in the second half of the quarter
Benchmark thermal coal prices continued to increase over the first half
of the fourth quarter, rising to near five year highs. Australia’s
benchmark Newcastle free on board (FOB) spot price hit highs not seen
since March quarter, 2012, reaching US$110 a tonne before falling back.
The fall back in prices as the quarter progressed can be attributed to the
Chinese Government’s easing of domestic coal production policies and
increased output from Indonesia. The move by Beijing sought to reverse
the effects of its previously mandated capacity closures (supply reform),
which had contributed to coal shortages in China and large upswings in
global thermal coal prices.
The JFY 2017 (April 2017 to March 2018) benchmark price, to be
negotiated early next year, is forecast to increase 22 percent to US$75 a
tonne. The increase will reflect the price recovery in spot prices relative
to the previous year. With an easing of China’s capacity cuts likely to
continue, and an expected decline in India’s import growth, a gradual
decline in spot and contract thermal coal prices is expected over the
outlook period. The JFY 2018 benchmark price is forecast to decline by
11 per cent to US$67 a tonne, reflective of the forecast decline in spot
prices in 2017–18.
Figure 6.1: Thermal coal spot prices
Source: IHS Inc. (2016) MCR prices-steam coal, metallurgical coal and petcoke
Figure 6.2: JFY thermal coal contract prices
Source: Department of Industry, Innovation and Science (2016)
0
20
40
60
80
100
120
140
160
Dec-11 Dec-12 Dec-13 Dec-14 Dec-15 Dec-16
US
$ a
tonne
Newcastle 6000kcal Richards Bay 6000kcal QHD 5800kcal
0
20
40
60
80
100
120
140
2008 2009 2010 2011 2012 2013 2014 2015 2016 2017 2018
2016 U
S$ a
tonne

Resources and Energy Quarterly December 2016 43
World trade
World thermal coal trade is forecast to decline 1.4 per cent in 2016 to
1.03 billion tonnes, as lower demand in India offsets the spike in demand
from China. Global import demand in 2017 is forecast to decline by 0.9
per cent to 1.02 billion tonnes, due to lower imports from China and
India. In 2018, global import demand is expected to increase 0.9 per
cent from 2017, to 1.03 billion tonnes. This increase will be driven by
growth in demand from India, offsetting import declines in China.
World imports
China’s thermal coal imports reverse trend in 2016
Until the second half of 2016, China’s thermal coal imports had been in
trend decline since 2014. This decline owed much to China’s slowing
economic growth and its ongoing gradual transition from an industrial
economy to a less-energy intensive services economy.
China’s imports of thermal coal increased by around 29 per cent year-
on-year in the three months to October 2016. This was largely driven by
cuts in domestic coal mine capacity — part of the government’s supply
side reforms. The capacity cuts coincided with increased demand over
China’s warm summer, which saw total industry and residential
electricity consumption increase 9.5 per cent year on year in the
September quarter.
To reduce upward pressure on thermal coal prices and ensure sufficient
supply, China started to ease its restrictive coal supply side measures in
September. Stronger measures were subsequently implemented in mid-
November, which are now seen as having contributed to the decline in
global prices as the calendar year came to an end. In mid-November,
China’s Government allowed all mines that meet safety standards to
produce for 330 working days in a year, an extension from the originally
enforced 276 days. At this stage, this production schedule is only
permitted until mid-March 2017, which may provide China with sufficient
coal stocks at coal power plants as summer approaches. Furthermore,
Beijing has sought to facilitate annual contract negotiations and enforce
a benchmark price mechanism that is more favourable for generators.
Figure 6.3: Major thermal coal importers
Notes: f Forecast
Source: IEA (2016) Coal Information 2016; Department of Industry, Innovation and
Science (2016)
Figure 6.4: China and India’s thermal coal imports
Source: IHS (2016) Coal imports by country and type
0
50
100
150
200
250
EU 27 Japan China India South Korea
Million tonnes
2015 2018 f
0
5
10
15
20
25
Jan-07 Jan-09 Jan-11 Jan-13 Jan-15M
illion tonnes
China India

Resources and Energy Quarterly December 2016 44
In 2017, China’s thermal coal imports are forecast to decline by 2.4 per
cent, to 160 million tonnes. The Chinese Government is expected to
continue to cut capacity into 2017, but at a less frenzied pace than seen
in 2016. Less restrictive domestic supply side policies in 2017, combined
with a possible return to normal weather conditions (requiring less
electricity consumption), is expected to reduce China’s thermal coal
import demand.
In 2018, thermal coal imports are forecast to decline marginally from
2017 levels, to 159 million tonnes. This decline will come on the back of
the cessation of further capacity cuts and a minor increase in coal
generation capacity.
India continues to seek lower dependence on thermal coal imports
In 2015, India’s thermal coal imports declined for the first time since
2003. This decline continued into 2016. Imports in the September
quarter declined 37 per cent, year-on-year.
Imports are forecast to decline 3.7 per cent in 2017, to 155 million
tonnes. This decline is likely to be driven by the Indian Government’s
desire to reduce the country’s dependence on imports, but limited by
India’s growing energy needs. The commitment by state-owned Coal
India (responsible for more than 80 per cent of the country’s coal
production) to increase output is expected to support a decline in
imports. In November, the company released a medium term strategy
(spanning to 2019–20) to Parliament. The plan highlighted the
company’s intent to increase its project numbers and employ mass
production technologies.
In 2018, India’s thermal coal imports are forecast to increase 1.3 per
cent to 157 million tonnes. This increase will be underpinned by nearly
100 new coal fired power plants currently under construction and
scheduled to come online by the end of 2018. However, growth in
imports in 2018 could be restricted by continued strong production from
Coal India and delays in power sector reform.
Higher thermal coal prices reduce import attractiveness in Japan
Japan’s thermal coal imports declined 1.8 per cent year-on-year in the
three months ending October 2016, due to higher thermal coal prices.
This decline follows a steady year-on-year pace in the first half of 2016.
Currently, there are three nuclear power reactors operating in Japan.
Around 17 reactors are awaiting approval for restart. There is a
possibility that at least three more nuclear power plants could restart by
the end of 2018. However, any adverse effect nuclear restarts may have
on coal imports is likely to be outweighed by the Japanese
Government’s focus on increasing the share of coal in the power
generation mix.
Coal imports are forecast to increase by 0.7 per cent in 2017, to 141
million tonnes, and by 0.7 per cent in 2018, to 142 million tonnes. These
increases are supported by the stabilisation of thermal coal prices, and
the Japanese Government’s plan to gradually raise coal’s share of the
power generation mix — to be the largest generator of power by 2019.
South Korea's thermal coal imports increase on the back of nuclear
power plant shutdowns
South Korea’s thermal coal imports increased 3.9 per cent year-on-year
in the three months ending October 2016. The increase can be largely
attributed to the precautionary shutdown of four nuclear power plants in
September, due to an earthquake. This increase follows a 6.0 per cent
year-on-year decline in the seven months ended July 2016.
Figure 6.5: Japan and South Korea’s thermal coal imports
Source: IHS (2016) Coal imports by country and type
0
2
4
6
8
10
12
14
16
Jan-07 Jan-09 Jan-11 Jan-13 Jan-15
Million tonnes
Japan South Korea

Resources and Energy Quarterly December 2016 45
Imports in 2017 are forecast to increase by 1.0 per cent, to 100 million
tonnes, and to be stable in 2018. An increase in imports in 2017 will be
supported by increased coal-fired power generation capacity. Around
thirteen coal-fired power plants currently under construction are
expected to be online by the end of 2017.
World thermal coal exports
Indonesia’s producers expected to increase output in 2017
Following a year-on-year decline in thermal coal exports in the first half
of the year — due to bad weather and loading delays — Indonesian coal
producers were able to respond to higher thermal coal prices in late
2016. Exports registered a 3.3 per cent year-on-year increase in the
September quarter, and Indonesian coal producers seem on track to
slightly increase output in 2017.
Indonesia’s thermal coal exports are forecast to increase modestly in
2017, to 341 million tonnes, in response to higher thermal coal prices.
However, exports are likely to decline by 3.2 per cent in 2018, to 330
million tonnes. The decline in 2018 is likely to reflect lower thermal coal
prices and the Indonesian Government’s mandated domestic coal
obligation — requiring domestic coal power plants to fulfil most of the
country’s coal-fired power-generation needs. However, the country’s
power program seems behind schedule, due to a lack of investment.
Roughly 20 gigawatts of coal-fired generation capacity is now expected
to be online by 2020, as opposed to the previously announced target of
35 gigawatts. The lower-than-expected domestic requirement for thermal
coal could result in higher Indonesian exports.
Russian thermal coal exports continue to increase
Exports of thermal coal from Russia increased at an annual compound
rate of 6.2 per cent from 2012 to 2015. Continuing this trend, exports
increased 7.8 per cent year-on-year in the September quarter, supported
by higher thermal coal prices and the sharply weaker Russian Ruble.
Russia’s thermal coal exports are forecast to continue to increase in
2017, supported by higher thermal coal prices and the competitive
nature of Russian supply. Exports are forecast to increase 1.4 per cent
in 2017, to 142 million tonnes. Russia’s thermal coal export volumes in
2018 are expected to be similar to 2017.
Figure 6.6: Major thermal coal exporters
Notes: f Forecast
Source: IEA (2016) Coal Information 2016; Department of Industry, Innovation and
Science (2016)
Figure 6.7: Indonesia and Russia thermal coal exports
Source: IHS (2016) Coal imports by country and type
0
50
100
150
200
250
300
350
400
Indonesia Australia Russia Colombia South Africa
Million tonnes
2015 2018 f
0
2
4
6
8
10
12
14
16
18
Jan-12 Oct-12 Jul-13 Apr-14 Jan-15 Oct-15 Jul-16M
illion tonnes
Indonesia Russia
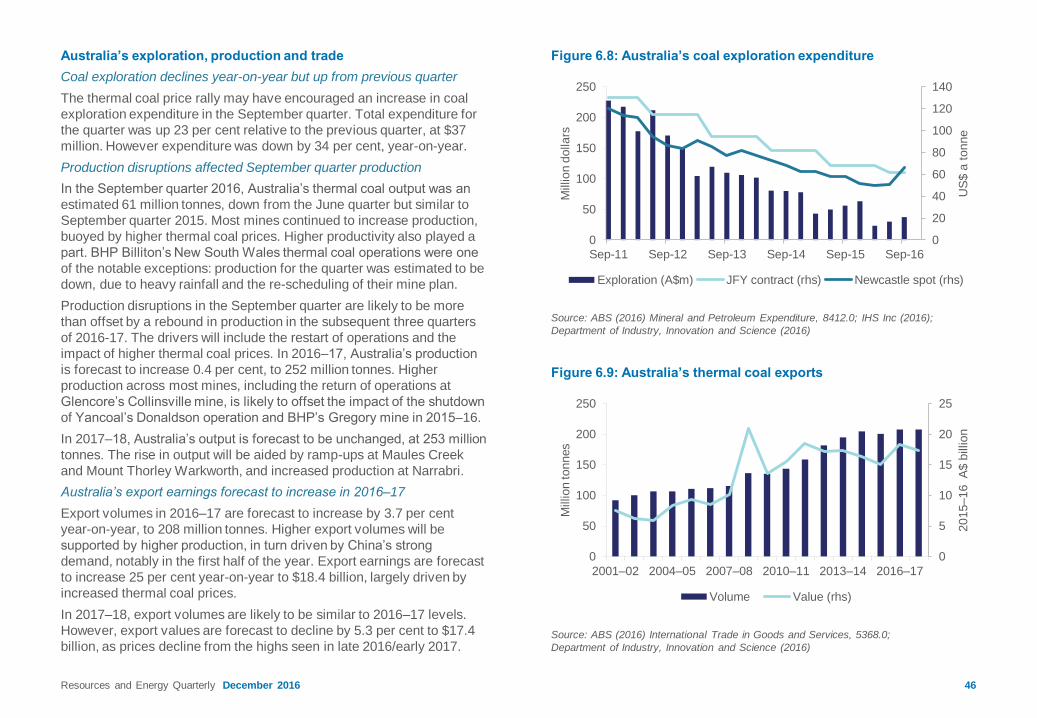
Resources and Energy Quarterly December 2016 46
Australia’s exploration, production and trade
Coal exploration declines year-on-year but up from previous quarter
The thermal coal price rally may have encouraged an increase in coal
exploration expenditure in the September quarter. Total expenditure for
the quarter was up 23 per cent relative to the previous quarter, at $37
million. However expenditure was down by 34 per cent, year-on-year.
Production disruptions affected September quarter production
In the September quarter 2016, Australia’s thermal coal output was an
estimated 61 million tonnes, down from the June quarter but similar to
September quarter 2015. Most mines continued to increase production,
buoyed by higher thermal coal prices. Higher productivity also played a
part. BHP Billiton’s New South Wales thermal coal operations were one
of the notable exceptions: production for the quarter was estimated to be
down, due to heavy rainfall and the re-scheduling of their mine plan.
Production disruptions in the September quarter are likely to be more
than offset by a rebound in production in the subsequent three quarters
of 2016-17. The drivers will include the restart of operations and the
impact of higher thermal coal prices. In 2016–17, Australia’s production
is forecast to increase 0.4 per cent, to 252 million tonnes. Higher
production across most mines, including the return of operations at
Glencore’s Collinsville mine, is likely to offset the impact of the shutdown
of Yancoal’s Donaldson operation and BHP’s Gregory mine in 2015–16.
In 2017–18, Australia’s output is forecast to be unchanged, at 253 million
tonnes. The rise in output will be aided by ramp-ups at Maules Creek
and Mount Thorley Warkworth, and increased production at Narrabri.
Australia’s export earnings forecast to increase in 2016–17
Export volumes in 2016–17 are forecast to increase by 3.7 per cent
year-on-year, to 208 million tonnes. Higher export volumes will be
supported by higher production, in turn driven by China’s strong
demand, notably in the first half of the year. Export earnings are forecast
to increase 25 per cent year-on-year to $18.4 billion, largely driven by
increased thermal coal prices.
In 2017–18, export volumes are likely to be similar to 2016–17 levels.
However, export values are forecast to decline by 5.3 per cent to $17.4
billion, as prices decline from the highs seen in late 2016/early 2017.
Figure 6.8: Australia’s coal exploration expenditure
Source: ABS (2016) Mineral and Petroleum Expenditure, 8412.0; IHS Inc (2016);
Department of Industry, Innovation and Science (2016)
Figure 6.9: Australia’s thermal coal exports
Source: ABS (2016) International Trade in Goods and Services, 5368.0;
Department of Industry, Innovation and Science (2016)
0
20
40
60
80
100
120
140
0
50
100
150
200
250
Sep-11 Sep-12 Sep-13 Sep-14 Sep-15 Sep-16
US
$ a
tonne
Million d
ollars
Exploration (A$m) JFY contract (rhs) Newcastle spot (rhs)
0
5
10
15
20
25
0
50
100
150
200
250
2001–02 2004–05 2007–08 2010–11 2013–14 2016–17
2015–16
A$ b
illion
Million tonnes
Volume Value (rhs)

47
Table 6.1: Thermal coal
Notes: b Japanese Fiscal Year (JFY), starting 1 April, fob Australia basis. Australia–Japan average contract price assessment for steaming coal with a calorific value of 6700 kcal/kg gross air
dried; c In current JFY dollars; d In current financial year Australian dollars, f Forecast; s Estimate
Sources: ABS (2016) International Trade in Goods and Services, 5368.0; IEA (2016) Coal Information 2016; Coal Services Pty Ltd (2016); Queensland Department of Natural Resources and
Mines (2016) Quarterly Coal Production; Company Reports; Department of Industry, Innovation and Science (2016)
unit 2015 2016 s 2017 f 2018 f Per cent change
World
Contract prices b
– nominal US$/t 68 62 75 67 –10.7
– real c US$/t 69 62 74 64 –12.6
Coal trade Mt 1,047 1,033 1,024 1,033 0.9
Imports
Asia Mt 707 712 706 729 3.3
China Mt 156 164 160 159 –0.6
Chinese Taipei Mt 57 58 59 61 3.4
India Mt 171 161 155 157 1.3
Japan Mt 141 140 141 142 0.7
South Korea Mt 98 99 100 100 0.0
Europe Mt 244 224 221 217 –2.0
European Union 27 Mt 191 168 163 159 –2.6
other Europe Mt 53 57 58 58 –0.0
Exports
Australia Mt 202 200 208 208 0.1
Colombia Mt 81 85 88 95 8.0
Indonesia Mt 366 340 341 330 –3.2
Russia Mt 133 140 142 142 0.0
South Africa Mt 77 82 83 85 2.4
United States Mt 25 19 19 18 –5.3
2014–15 2015–16 2016–17 f 2017–18 f Per cent change
Australia
Production Mt 251.5 250.8 251.8 252.7 0.3
Export volume Mt 204.5 200.4 207.8 208.1 0.2
– nominal value A$m 16,057 14,700 18,370 17,395 –5.3
– real value d A$m 16,548 14,942 18,370 17,029 –7.3
Resources and Energy Quarterly December 2016


Resources and Energy Quarterly December 2016 49
Market summary
The value of Australia’s LNG exports is forecast to increase by 50 per cent
a year to $37 billion in 2017–18, supported by higher LNG prices and
export volumes. LNG contract prices, under which most Australian LNG is
sold, are forecast to increase in line with oil prices. Export volumes are
expected to increase by 35 per cent a year to 2017–18, as the four
remaining LNG projects under construction come online. Australian
producers are expected to capture an increasing share of imports into
major markets in North East Asia, as long-term LNG import contracts
commence. The forecast for export earnings has been revised up,
reflecting an improved outlook for oil prices.
Prices
Prices for Australian LNG have increased, driven by rising contract prices
The price of Australian LNG delivered to major markets in North East Asia
increased between July and October of 2016. The price of LNG into
Japan, Australia’s largest market and the world’s largest importer,
averaged US$7.05 a gigajoule October, up from US$6.13 in July. The
uptick in prices reflects the effect of the oil price rally during the first half of
2016. Most Australian LNG delivered into Asia is sold under contracts
linked to the Japanese Customs-cleared Crude (JCC) oil price by a time
lag of three to four months.
The average price for Australian LNG delivered to North East Asia is
expected to have remained largely unchanged over the last few months of
2016. The JCC oil price remained broadly stable in August and September
at around US$45 a barrel, and its lagged effect on LNG contract prices is
expected to be seen in the coming months. LNG contract prices are then
expected to rise over 2017 and 2018, in line with the forecast for a
recovery in oil prices to over US$60 a barrel.
Spot prices have also increased, but the rally is expected to be temporary
While the increase in the average price of Australian LNG has primarily
been driven by contract prices, spot prices have also increased over the
past few months. The North East Asian spot price climbed from lows of
Figure 7.2: North East Asian LNG spot price
Source: Argus Media (2016)
Figure 7.1: Price of Australian LNG delivered to key markets
Source: Argus Media (2016)
0
4
8
12
16
20
Jun-12 Mar-13 Dec-13 Sep-14 Jun-15 Mar-16 Dec-16
US
$ a
gig
ajo
ule
0
20
40
60
80
0
4
8
12
16
20
Apr-15 Jul-15 Oct-15 Jan-16 Apr-16 Jul-16 Oct-16
US
$ a
barr
el
US
$ a
gig
ajo
ule
Japan China South Korea JCC oil price (rhs)

50
US$4.16 a gigajoule in April to average US$6.91 a gigajoule in
November — its highest level in a year. Cold weather prompted strong
spot market buying from North East Asian economies, while the
suspension of operations at nuclear plants in South Korea — following
an earthquake — also contributed to increased demand for LNG. The
recent rally in spot prices is expected to be temporary, with the entry of
new capacity in the US and Australia ensuring that the market remains
well supplied.
The implications of a potential divergence between contract and spot
LNG prices remain to be seen. One scenario is that buyers reduce LNG
purchases to ‘take-or-pay’ levels, and seek to buy larger volumes on the
spot market. A divergence between spot and contract prices would also
encourage buyers’ efforts to renegotiate pricing mechanisms in LNG
contracts. India’s Petronet has reportedly renewed efforts to renegotiate
the pricing formula for supplies from Australia’s Gorgon LNG project.
World trade
World LNG imports are forecast to increase by 10 per cent a year to
reach 306 million tonnes in 2018. Growth will be driven by demand in
emerging Asia and Europe, and enabled by a major expansion of LNG
export infrastructure in Australia and the US.
World imports
Prospects for import growth in traditional demand centres remain
subdued
Japan’s LNG imports increased 3.2 per cent year-on-year in the three
months to October 2016. Imports received support from the uptick in
thermal coal prices, with which LNG competes in electricity generation,
and the start-up of long-term LNG contracts with Australian producers.
Japan’s LNG imports are estimated to have declined by 2.5 per cent in
2016 — a more modest decline than forecast in September.
Figure 7.3: Global liquefaction capacity vs LNG imports
Source: Nexant World Gas Model (2016)
Figure 7.4: LNG import forecasts
Source: Nexant World Gas Model (2016); Department of Industry, Innovation and Science
(2016)
0
50
100
150
200
250
300
350
2012 2013 2014 2015 2016 2017 2018
Million tonnes
Global liquefaction capacity World imports
0
15
30
45
60
75
90
Japan SouthKorea
China Rest ofAsia
Europe Rest ofworld
Million tonnes
2016 2018
Resources and Energy Quarterly December 2016

51
Japan’s LNG imports are forecast to fall by 2.1 per cent a year to 80
million tonnes in 2018. Subdued energy demand, a forecast decline in
thermal coal prices, the expansion of renewable capacity, and the restart
of nuclear capacity are all expected to weigh on LNG imports. In
November, Japan’s Nuclear Regulation Authority ruled that Kyushu
Electric Power’s Genkai’s No. 3 and 4 reactors had met post-Fukushima
safety rules, one of the main requirements to restart operations. These
would be the fourth and fifth reactors out of Japan’s fleet of 42 to restart
post-Fukushima. In November, there were 17 applications for reactor
restarts before the Nuclear Regulation Authority.
The timing and scale of nuclear restarts remains a key uncertainty
affecting the outlook. The three reactors currently operating have had to
overcome legal challenges to their restart, while two reactors that
restarted in early 2016 were forced to shut down in June following a
court injunction. The earthquake in November that disrupted the spent
fuel pool cooling system in Fukushima Daiichi plant unit 3 has only
added to public concern about nuclear power in Japan.
South Korea’s LNG imports remained broadly unchanged year-on-year
in the three months to October 2016. LNG imports received support from
the shut down of nuclear power plants in South Korea following an
earthquake in September. South Korea’s LNG imports are forecast to
decline by 1.7 per cent in 2016.
Growth in South Korea’s LNG imports is expected to remain subdued
over the outlook period. LNG will continue to face competition from other
energy sources, as South Korea expands both its nuclear and coal-fired
power capacity.
Emerging Asia will be a key source of growth
China’s LNG imports increased by 59 per cent year-on-year in the three
months to October 2016. Domestic production and pipeline imports also
rose, suggesting robust growth in gas consumption. LNG imports were
driven by the ramp up of purchasing commitments with Australian
producers, temporary disruptions to pipeline supplies, and strong pre-
winter buying from utilities. China’s LNG imports are estimated to have
increased by 28 per cent in 2016.
Figure 7.5: Growth in the LNG imports of key markets
Source: Argus Media (2016); Department of Industry, Innovation and Science (2016)
Notes: data for India is for Jan-Aug 2015 and Jan-Aug 2016.
Figure 7.6: Japan’s LNG imports
Source: Nexant World Gas Model (2016); Department of Industry, Innovation and Science
(2016)
0 10 20 30 40 50 60 70 80
India
Taiwan
China
South Korea
Japan
Million tonnes
Jan-Oct 2016 Jan-Oct 2015
0
20
40
60
80
100
2008 2010 2012 2014 2016 2018M
illion tonnes
Australia US South East Asia Middle East Other
Resources and Energy Quarterly December 2016

52
China’s LNG imports are forecast to rise by 34 per cent a year, to 43
million tonnes in 2018. China is aiming to raise the share of gas in its
energy mix from 5 per cent to 10 per cent by 2020, with policy efforts
directed at the electricity generation and transport sectors. LNG will play
an important role in servicing rising gas demand, with China having agreed
to contracts requiring large LNG imports over the next few years.
The deferral of Line D, the fourth and final pipeline in the China-Central
Asia gas pipeline network, should support LNG imports. The pipeline was
expected to have a capacity of 30 billion cubic metres a year — equivalent
to around half of China’s total gas imports in 2015. Both domestic output
and pipeline imports are expected to grow alongside LNG imports.
Import growth in other emerging Asian economies is also expected to
support demand. Expectations of persistent low spot prices continue to
encourage countries in Asia to expand LNG import infrastructure. Import
growth will be facilitated by floating storage regasification unit (FSRU)
technology, which allows small volumes of LNG to be received
economically by less mature import markets.
Europe’s LNG imports are set to increase
Europe is expected to be another key source of demand growth to 2018.
LNG imports are forecast to increase by 21 per cent a year, to reach 65
million tonnes in 2018. Production in Europe is expected to fall, partly as a
result of lower production at Europe’s largest natural gas field —
Groningen in the Netherlands. In September, the Dutch parliament
approved a government proposal to lower the annual production cap at the
Groningen gas field from 27 to 24 billion cubic metres from October 2016.
The policy is aimed at reducing the frequency and intensity of earthquakes
associated with production from the field.
Figure 7.8: China’s LNG imports
Source: Nexant World Gas Model (2016); Department of Industry, Innovation and Science
(2016)
Figure 7.7: China’s quarterly LNG and pipeline imports
Source: CEIC (2016)
0
2
4
6
8
10
Sep-07 Mar-09 Sep-10 Mar-12 Sep-13 Mar-15 Sep-16
Million tonnes
LNG Pipeline
0
10
20
30
40
50
2008 2010 2012 2014 2016 2018M
illion tonnes
Australia South East Asia Middle East Other
Resources and Energy Quarterly December 2016
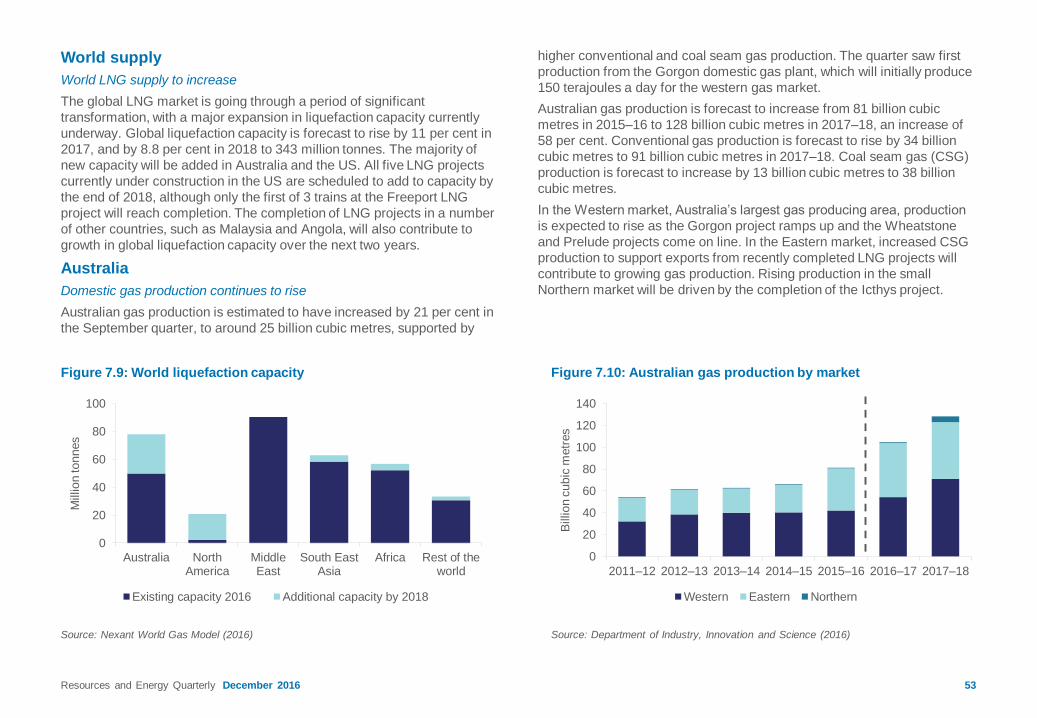
53
World supply
World LNG supply to increase
The global LNG market is going through a period of significant
transformation, with a major expansion in liquefaction capacity currently
underway. Global liquefaction capacity is forecast to rise by 11 per cent in
2017, and by 8.8 per cent in 2018 to 343 million tonnes. The majority of
new capacity will be added in Australia and the US. All five LNG projects
currently under construction in the US are scheduled to add to capacity by
the end of 2018, although only the first of 3 trains at the Freeport LNG
project will reach completion. The completion of LNG projects in a number
of other countries, such as Malaysia and Angola, will also contribute to
growth in global liquefaction capacity over the next two years.
Australia
Domestic gas production continues to rise
Australian gas production is estimated to have increased by 21 per cent in
the September quarter, to around 25 billion cubic metres, supported by
higher conventional and coal seam gas production. The quarter saw first
production from the Gorgon domestic gas plant, which will initially produce
150 terajoules a day for the western gas market.
Australian gas production is forecast to increase from 81 billion cubic
metres in 2015–16 to 128 billion cubic metres in 2017–18, an increase of
58 per cent. Conventional gas production is forecast to rise by 34 billion
cubic metres to 91 billion cubic metres in 2017–18. Coal seam gas (CSG)
production is forecast to increase by 13 billion cubic metres to 38 billion
cubic metres.
In the Western market, Australia’s largest gas producing area, production
is expected to rise as the Gorgon project ramps up and the Wheatstone
and Prelude projects come on line. In the Eastern market, increased CSG
production to support exports from recently completed LNG projects will
contribute to growing gas production. Rising production in the small
Northern market will be driven by the completion of the Icthys project.
Figure 7.10: Australian gas production by market
Source: Department of Industry, Innovation and Science (2016)
Figure 7.9: World liquefaction capacity
Source: Nexant World Gas Model (2016)
0
20
40
60
80
100
Australia NorthAmerica
MiddleEast
South EastAsia
Africa Rest of theworld
Million tonnes
Existing capacity 2016 Additional capacity by 2018
0
20
40
60
80
100
120
140
2011–12 2012–13 2013–14 2014–15 2015–16 2016–17 2017–18B
illion c
ubic
metr
es
Western Eastern Northern
Resources and Energy Quarterly December 2016

54
Australia’s LNG export earnings and volumes to increase
The value of Australia’s LNG exports increased by 8 per cent year-on-
year to $4.6 billion in the September quarter 2016. The result was driven
by higher export volumes. Export unit values of Australian LNG declined,
with (linked) oil prices in mid-2016 remaining lower than a year earlier.
Australia’s LNG export volumes increased by 50 per cent year-on-year
in the September quarter, to around 12 million tonnes. Three LNG plants
have commenced production over the past year — Gorgon, Australia
Pacific LNG and Gladstone LNG. Australian exporters have increased
their share of imports in the key markets of Japan, South Korea and
China. In the September quarter, Australia accounted for 57 per cent of
China’s imports, up from 36 per cent a year earlier.
The value of Australia’s LNG exports is forecast to increase by 50 per
cent a year to $37 billion in 2017–18, as a result of increasing LNG
prices and higher export volumes. LNG contract prices, under which
most Australian LNG is sold, are expected to increase as oil prices
recover.
However, while the outlook for LNG export prices to 2017–18 is positive,
growth in LNG export prices is expected to be subdued in year-on-year
terms in 2016–17. The lagged JCC price (which determines LNG
contract prices) fell less sharply in 2015–16 than other oil prices, and is
also forecast to recover less quickly than other oil prices in 2016–17.
Australia’s LNG export volumes are forecast to increase by 35 per cent a
year between 2015–16 and 2017–18, to 67.3 million tonnes. The four
LNG projects currently under construction are expected to commence
production by mid-2018, bringing Australia’s LNG export capacity to
around 87 million tonnes. However, some uncertainty surrounds the
timing of Shell’s Prelude project in the Browse Basin, where start up
could be complicated by the cyclone season — which runs from
November to April.
Increased exports to Japan, South Korea and China are expected to
drive the rise in Australia’s export volumes. Australian producers are
expected to capture an increasing share of these countries’ imports with
the commencement of a number of long-term contracts over the outlook
period.
Figure 7.11: Australia’s LNG exports
Source: ABS (2016) International Trade in Goods and Services, 5368.0; Department of
Industry, Innovation and Science (2016)
Figure 7.12: Brent and Japanese Customs-cleared Crude oil prices
Source: ABS (2016) International Trade in Goods and Services, 5368.0; Department of
Industry, Innovation and Science (2016)
0
5
10
15
20
25
30
35
40
0
10
20
30
40
50
60
70
80
2007–08 2009–10 2011–12 2013–14 2015–16 2017–18
A$ b
illion
Million tonnes
Volume Value (right axis)
0
10
20
30
40
50
60
70
Sep-15 Dec-15 Mar-16 Jun-16 Sep-16 Dec-16 Mar-17 Jun-17
US
$ a
barr
el
Brent crude JCC (3 month lag)
Resources and Energy Quarterly December 2016

55
Table 7.1: LNG outlook
Notes: b Production includes both sales gas and gas used in the production process (i.e. plant use) as well as ethane; c Gas production from Bayu-Undan Joint Production Development Area is
not included in Australia’s production. Browse basin production associated with the Ichthys project is classified as Northern market; d 1 million tonnes of LNG is equivalent to approximately 1.36
billion cubic metres of gas; e In current financial year Australian dollars.; g 1 MMBtu is equivalent to 1.055 GJ; f Forecast; s Estimate
Source: ABS (2016) International Trade, cat. no. 5368.0; Company reports; Department of Industry, Innovation and Science (2016)
unit 2014–15 2015–16 2016–17 f 2017–18 f Per cent change
Australia
Production b Bcm 66.4 81.2 104.5 128.3 22.7
– Eastern market Bcm 25.3 38.6 49.5 51.9 4.9
– Western market Bcm 40.4 42.0 54.4 71.1 30.8
– Northern market c Bcm 0.7 0.6 0.7 5.3 697.6
LNG export volume d Mt 25.0 36.9 52.4 67.3 28.5
– nominal value A$m 16,895 16,546 23,713 37,000 56.0
– real value e A$m 17,411 16,819 23,713 36,221 52.7
LNG export unit value g
– nominal value US$/MMBtu 11.3 6.5 6.7 8.1 20.9
– real value e US$/MMBtu 11.6 6.6 6.7 8.0 18.3
– nominal value A$/GJ 12.8 8.5 8.6 10.4 21.5
– real value e A$/GJ 13.2 8.6 8.6 10.2 18.9
Resources and Energy Quarterly December 2016


57
Market summary
The value of Australia’s crude oil and condensate exports is forecast to
increase by 27 per cent a year over the forecast period, to $8.7 billion in
2017–18, supported by higher volumes and prices. Growth in export
volumes will be supported by the ramp-up of condensate production at a
number of new LNG projects. Oil prices are forecast to increase over the
outlook period, as global consumption starts to outpace production,
drawing down global stocks. Global supply is expected to be constrained
by the implementation of recently-agreed OPEC production targets, and
falling output in a number of non-OPEC producing countries. Non-OECD
economies are expected to (continue to) drive growth in global demand.
Prices
Oil prices increase following OPEC agreement
The price of Brent crude averaged an estimated US$51 a barrel in the
December quarter, slightly above the previous forecast of US$49 a barrel.
Oil prices increased to over US$50 a barrel in October, after OPEC
announced a production target of 32.5–33.0 million barrels a day on 28
September. Oil prices then declined in November, following
announcements from key producers that seemed to undermine the
likelihood of OPEC agreeing to a successful implementation plan.
On 30 November, OPEC members agreed to individual production targets
to reduce the cartel’s crude oil output to 32.5 million barrels a day — 1.2
million barrels a day lower than October 2016 levels. The agreement will
take effect from 1 January 2017. The largest cuts will be shouldered by
Saudi Arabia, followed by Iraq, the United Arab Emirates and Kuwait. As
part of the agreement, non-OPEC countries agreed to reduce production
by 558,000 barrels a day, of which Russia will contribute 300,000 barrels a
day. OPEC has stated that the duration of the agreement is six months,
with the possibility of a six month extension should soft market conditions
persist.
Figure 8.2: Annual oil prices
Bloomberg (2016), Brent and West Texas Intermediate spot prices; Department of
Industry, Innovation and Science (2016)
Figure 8.1: Recent movement in oil prices
Source: Bloomberg (2016), Brent and West Texas Intermediate spot prices
0
20
40
60
80
100
120
2003 2006 2009 2012 2015 2018
US
$ a
barr
el
Brent West Texas Intermediate0
10
20
30
40
50
60
70
Dec-2015 Mar-2016 Jun-2016 Sep-2016 Dec-2016
US
$ a
barr
el
Brent West Texas Intermediate
Resources and Energy Quarterly December 2016
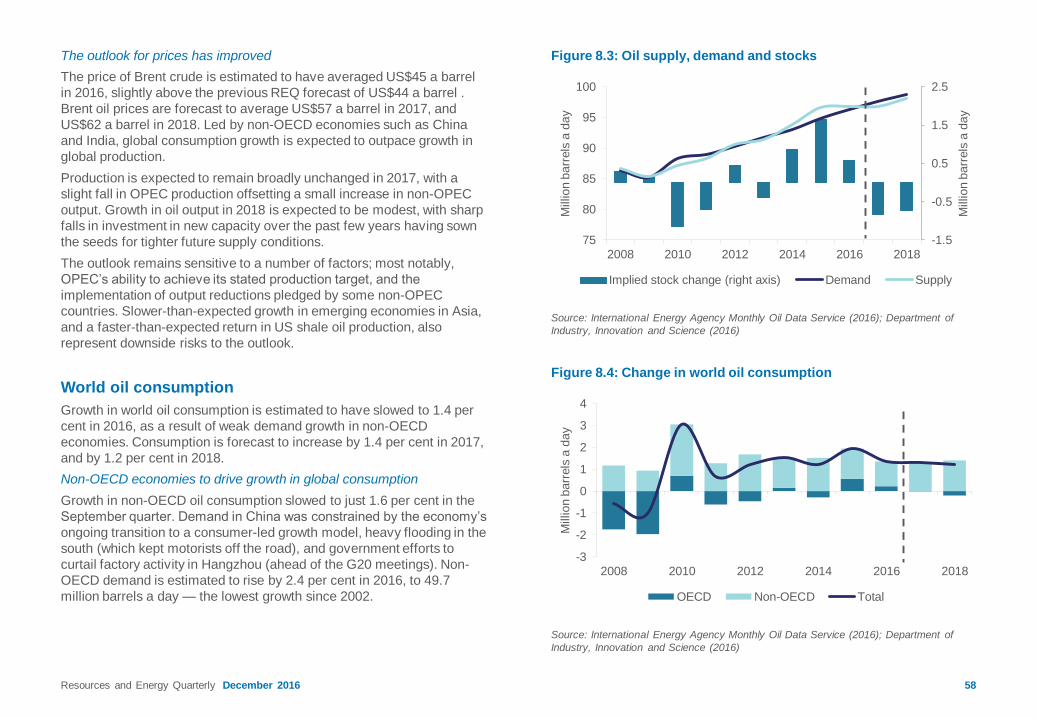
58
The outlook for prices has improved
The price of Brent crude is estimated to have averaged US$45 a barrel
in 2016, slightly above the previous REQ forecast of US$44 a barrel .
Brent oil prices are forecast to average US$57 a barrel in 2017, and
US$62 a barrel in 2018. Led by non-OECD economies such as China
and India, global consumption growth is expected to outpace growth in
global production.
Production is expected to remain broadly unchanged in 2017, with a
slight fall in OPEC production offsetting a small increase in non-OPEC
output. Growth in oil output in 2018 is expected to be modest, with sharp
falls in investment in new capacity over the past few years having sown
the seeds for tighter future supply conditions.
The outlook remains sensitive to a number of factors; most notably,
OPEC’s ability to achieve its stated production target, and the
implementation of output reductions pledged by some non-OPEC
countries. Slower-than-expected growth in emerging economies in Asia,
and a faster-than-expected return in US shale oil production, also
represent downside risks to the outlook.
World oil consumption
Growth in world oil consumption is estimated to have slowed to 1.4 per
cent in 2016, as a result of weak demand growth in non-OECD
economies. Consumption is forecast to increase by 1.4 per cent in 2017,
and by 1.2 per cent in 2018.
Non-OECD economies to drive growth in global consumption
Growth in non-OECD oil consumption slowed to just 1.6 per cent in the
September quarter. Demand in China was constrained by the economy’s
ongoing transition to a consumer-led growth model, heavy flooding in the
south (which kept motorists off the road), and government efforts to
curtail factory activity in Hangzhou (ahead of the G20 meetings). Non-
OECD demand is estimated to rise by 2.4 per cent in 2016, to 49.7
million barrels a day — the lowest growth since 2002.
Figure 8.3: Oil supply, demand and stocks
Source: International Energy Agency Monthly Oil Data Service (2016); Department of
Industry, Innovation and Science (2016)
Figure 8.4: Change in world oil consumption
Source: International Energy Agency Monthly Oil Data Service (2016); Department of
Industry, Innovation and Science (2016)
-1.5
-0.5
0.5
1.5
2.5
75
80
85
90
95
100
2008 2010 2012 2014 2016 2018
Million b
arr
els
a d
ay
Million b
arr
els
a d
ay
Implied stock change (right axis) Demand Supply
-3
-2
-1
0
1
2
3
4
2008 2010 2012 2014 2016 2018M
illion b
arr
els
a d
ay
OECD Non-OECD Total
Resources and Energy Quarterly December 2016
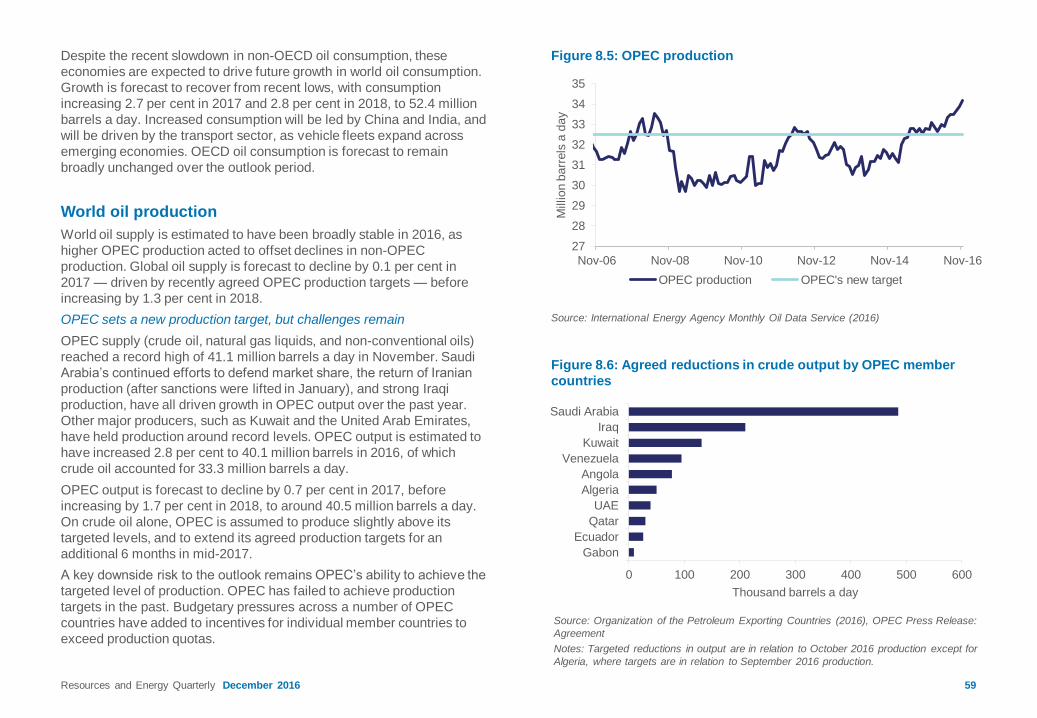
59
Despite the recent slowdown in non-OECD oil consumption, these
economies are expected to drive future growth in world oil consumption.
Growth is forecast to recover from recent lows, with consumption
increasing 2.7 per cent in 2017 and 2.8 per cent in 2018, to 52.4 million
barrels a day. Increased consumption will be led by China and India, and
will be driven by the transport sector, as vehicle fleets expand across
emerging economies. OECD oil consumption is forecast to remain
broadly unchanged over the outlook period.
World oil production
World oil supply is estimated to have been broadly stable in 2016, as
higher OPEC production acted to offset declines in non-OPEC
production. Global oil supply is forecast to decline by 0.1 per cent in
2017 — driven by recently agreed OPEC production targets — before
increasing by 1.3 per cent in 2018.
OPEC sets a new production target, but challenges remain
OPEC supply (crude oil, natural gas liquids, and non-conventional oils)
reached a record high of 41.1 million barrels a day in November. Saudi
Arabia’s continued efforts to defend market share, the return of Iranian
production (after sanctions were lifted in January), and strong Iraqi
production, have all driven growth in OPEC output over the past year.
Other major producers, such as Kuwait and the United Arab Emirates,
have held production around record levels. OPEC output is estimated to
have increased 2.8 per cent to 40.1 million barrels in 2016, of which
crude oil accounted for 33.3 million barrels a day.
OPEC output is forecast to decline by 0.7 per cent in 2017, before
increasing by 1.7 per cent in 2018, to around 40.5 million barrels a day.
On crude oil alone, OPEC is assumed to produce slightly above its
targeted levels, and to extend its agreed production targets for an
additional 6 months in mid-2017.
A key downside risk to the outlook remains OPEC’s ability to achieve the
targeted level of production. OPEC has failed to achieve production
targets in the past. Budgetary pressures across a number of OPEC
countries have added to incentives for individual member countries to
exceed production quotas.
Figure 8.5: OPEC production
Source: International Energy Agency Monthly Oil Data Service (2016)
Figure 8.6: Agreed reductions in crude output by OPEC member
countries
Source: Organization of the Petroleum Exporting Countries (2016), OPEC Press Release:
Agreement
Notes: Targeted reductions in output are in relation to October 2016 production except for
Algeria, where targets are in relation to September 2016 production.
27
28
29
30
31
32
33
34
35
Nov-06 Nov-08 Nov-10 Nov-12 Nov-14 Nov-16
Million b
arr
els
a d
ay
OPEC production OPEC's new target
0 100 200 300 400 500 600
Gabon
Ecuador
Qatar
UAE
Algeria
Angola
Venezuela
Kuwait
Iraq
Saudi Arabia
Thousand barrels a day
Resources and Energy Quarterly December 2016
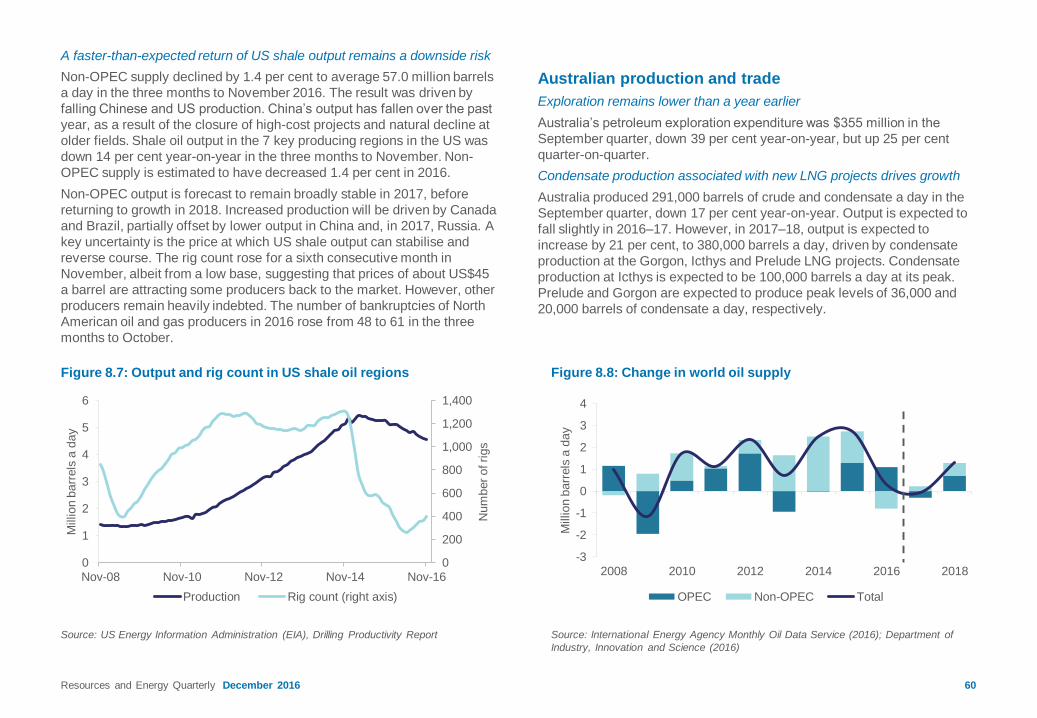
60
A faster-than-expected return of US shale output remains a downside risk
Non-OPEC supply declined by 1.4 per cent to average 57.0 million barrels
a day in the three months to November 2016. The result was driven by
falling Chinese and US production. China’s output has fallen over the past
year, as a result of the closure of high-cost projects and natural decline at
older fields. Shale oil output in the 7 key producing regions in the US was
down 14 per cent year-on-year in the three months to November. Non-
OPEC supply is estimated to have decreased 1.4 per cent in 2016.
Non-OPEC output is forecast to remain broadly stable in 2017, before
returning to growth in 2018. Increased production will be driven by Canada
and Brazil, partially offset by lower output in China and, in 2017, Russia. A
key uncertainty is the price at which US shale output can stabilise and
reverse course. The rig count rose for a sixth consecutive month in
November, albeit from a low base, suggesting that prices of about US$45
a barrel are attracting some producers back to the market. However, other
producers remain heavily indebted. The number of bankruptcies of North
American oil and gas producers in 2016 rose from 48 to 61 in the three
months to October.
Australian production and trade
Exploration remains lower than a year earlier
Australia’s petroleum exploration expenditure was $355 million in the
September quarter, down 39 per cent year-on-year, but up 25 per cent
quarter-on-quarter.
Condensate production associated with new LNG projects drives growth
Australia produced 291,000 barrels of crude and condensate a day in the
September quarter, down 17 per cent year-on-year. Output is expected to
fall slightly in 2016–17. However, in 2017–18, output is expected to
increase by 21 per cent, to 380,000 barrels a day, driven by condensate
production at the Gorgon, Icthys and Prelude LNG projects. Condensate
production at Icthys is expected to be 100,000 barrels a day at its peak.
Prelude and Gorgon are expected to produce peak levels of 36,000 and
20,000 barrels of condensate a day, respectively.
Figure 8.8: Change in world oil supply
Source: International Energy Agency Monthly Oil Data Service (2016); Department of
Industry, Innovation and Science (2016)
Figure 8.7: Output and rig count in US shale oil regions
Source: US Energy Information Administration (EIA), Drilling Productivity Report
-3
-2
-1
0
1
2
3
4
2008 2010 2012 2014 2016 2018M
illion b
arr
els
a d
ay
OPEC Non-OPEC Total
0
200
400
600
800
1,000
1,200
1,400
0
1
2
3
4
5
6
Nov-08 Nov-10 Nov-12 Nov-14 Nov-16
Num
ber
of ri
gs
Million b
arr
els
a d
ay
Production Rig count (right axis)
Resources and Energy Quarterly December 2016

61
Increasing prices and volumes to support export earnings growth
The value of Australia’s exports of crude oil and condensate declined 23
per cent year-on-year in the September quarter, to $1.3 billion. Lower
prices compounded reduced export volumes, which fell in line with
production.
The value of Australia’s exports of crude oil and condensate is forecast
to increase to $8.7 billion in 2017–18, supported by both higher prices
and export volumes. The forecast for export earnings has been revised
up by $1.2 billion since the March REQ, reflecting an improved outlook
for prices.
Australian refineries to remain under pressure
Australia’s refined production declined by 2.2 per cent to 453,000 barrels
a day in the September quarter. Australian refineries are expected to
remain under pressure over the outlook period, as global refining
capacity expands. Capacity expansions will be driven by investments in
non-OECD economies in the Middle East and Asia, particularly China.
Figure 8.9: Australia’s petroleum exploration expenditure
Source: ABS (2016) Mineral and Petroleum Exploration Expenditure, 8412.0
Figure 8.10: Australia’s exports of crude and condensate
Source: ABS (2016) International Trade in Goods and Services, 5368.0; Department of
Industry, Innovation and Science (2016)
0
200
400
600
800
1,000
1,200
1,400
1,600
1,800
Sep-06 Sep-08 Sep-10 Sep-12 Sep-14 Sep-16
A$ m
illio
n0
3
6
9
12
15
0
100
200
300
400
500
2002–03 2005–06 2008–09 2011–12 2014–15 2017–18
A$ b
illion
Thousand b
arr
els
a d
ay
Volume Value (right axis)
Resources and Energy Quarterly December 2016

Resources and Energy Quarterly December 2016 62
Table 8.1: Oil outlook
Notes: b Number of days in a year is assumed to be exactly 365. A barrel equals 158.987 litres; c In current calendar year US dollars; d In current financial year Australian dollars; e Naturally
occurring; g Excludes LPG; f Forecast; h Domestic sales of marketable products; s Estimate
Source: ABS (2016) International Trade in Goods and Services, Australia, cat. no. 5368.0; IEA (2016) Monthly Oil Market Report; Department of Industry, Innovation and Science (2016)
World Unit 2015 2016 s 2017 f 2018 f Per cent change
Production b mb/d 96.6 96.9 96.8 98.1 1.3
Consumptionb mb/d 94.9 96.3 97.6 98.8 1.2
WTI crude oil price
Nominal US$/bbl 48.9 43.3 56.3 61.1 8.5
Real c US$/bbl 49.4 43.3 55.1 58.5 6.1
Brent crude oil price
Nominal US/$bbl 52.5 44.8 57.2 61.9 8.3
Real c US$/bbl 53.1 44.8 55.9 59.3 6.0
Australia Unit 2014–15 2015–16 2016–17 f 2017–18 f Per cent change
Crude and condensate
Production b kb/d 328 317 314 380 21.1
Export volume b kb/d 261 239 244 295 20.8
Nominal value A$m 8,656 5,444 6,221 8,723 40.2
Real value d A$m 8,921 5,534 6,221 8,539 37.3
Imports b kb/d 426 342 338 322 –4.5
LPG
Production be kb/d 57 53 55 65 18.3
Export volume b kb/d 36 34 37 44 18.2
Nominal value A$m 807 547 641 949 48.2
Real value d A$m 831 556 641 929 45.0
Refined products
Refinery production b kb/d 527 445 429 419 -2.4
Exports bg kb/d 12 10 14 9 –33.8
Imports b kb/d 504 593 596 622 4.2
Consumption bh kb/d 951 955 953 965 1.3


64
Market summary
Australian uranium production is forecast to decrease by around 7 per cent
in 2016–17, as uranium prices slide to historic lows. Domestic exploration
for uranium deposits also remained low in September quarter 2016, as
prices fell further below ‘break-even’ level.
Conditions for suppliers will be difficult over the short to medium term. A
range of long-term contracts are set to expire over the next 12-18 months,
with buyers seeking to lock in prices for future contracts that will make it
hard for many suppliers to continue operating. However, reactor
construction in China, India, Russia and South America continues at a
rapid pace, and while high uranium inventories may restrain prices for a
time, higher global demand is likely to start putting upward pressure on
prices by late 2017.
Prices
High inventories and abundant supply continue to weigh on prices
The uranium spot price has fallen steadily over 2016, as inventories
continue to build, and progress in bringing Japanese nuclear reactors back
on line remains slow. At the end of November, the uranium spot price was
US$18.00 a pound — down by almost 50 per cent since the start of the
year, and well below the production cost in most mines. The long-term
contract price also declined to US$33.00 a pound, down 25 per cent from
the start of 2016.
For 2016 as a whole, the uranium spot price is forecast to decrease by 30
per cent, averaging US$25.50 a pound. Supply cuts and higher demand
are likely to bring about some price recovery in the latter half of 2017, but
prices over 2017 are nonetheless expected to remain low in historical
terms, at around $US23.20 a pound. In 2018, spot markets are likely to
come under pressure, as growing reactor construction in China and India
increases demand. Spot prices in 2018 are expected to lift to around $31 a
pound, with most price pressure occurring in the second half of the year.
Sixteen new reactors were commissioned during 2016: nine of these were
in China, with the remainder in South Korea, India, Russia and the United
States. One reactor in Japan also resumed operation in August. In 2017,
further reactors will commence operation in China and India, and some
existing reactors in Japan are also expected to return to operation.
Figure 9.2: Outlook, quarterly uranium prices
Source: Cameco Corporation (2016) Uranium Spot Price; Ux Consulting (2016) Uranium
Market Outlook.
0
20
40
60
80
100
120
140
1999 2002 2005 2008 2011 2014 2017U
S$ a
pound
Spot Price
Figure 9.1: Uranium prices, monthly
Source: Cameco Corporation (2016) Uranium Spot and Long Term Prices.
0
20
40
60
80
100
120
140
160
2006 2008 2010 2012 2014 2016
US
$ a
pound
Spot Long term
Resources and Energy Quarterly December 2016

65
Although prices are currently low in historical terms, several factors will
work to lift them over the next two years. Low prices have seen
exploration activity virtually cease, which will constrict supply in the long
term. Utilities are currently favouring spot prices over long-term
contracts, but any significant drop in supply will see a push back into
long-term contracts, which are likely to raise realised prices. While
progress in restoring Japanese reactors remains sluggish, more than 50
reactors are under construction in China. These reactors are expected to
come on-line at an increasingly rapid rate.
Consumption
China, India, Russia and South Korea to drive consumption growth
Growth in uranium consumption is largely driven by the development of
new nuclear power generation capacity. Commissioning a new reactor
requires substantially more uranium for its initial core than refuelling
existing operating plants. Subsequent annual requirements decrease as
a reactor reaches a ‘steady-state’ level of operation. Most reactors are
refuelled every one to two years, when a quarter to a third of the fuel
assemblies are replaced.
World uranium consumption is estimated to have increased by 4.0 per
cent in 2016, driven by the start-up of new reactors in China, India,
Russia, South Korea and the United States. Some uplift is also expected
from potential reactor restarts in Japan, as well as moderate output
increases at existing reactors in advanced economies.
China has brought 9 new reactors online during 2016, and was working
to bring a tenth online before the end of the year. Outside China, ten
additional reactors were expected to be completed by the end of 2016 —
six in India, and one each in Russia, the US, Pakistan, and South Korea.
These reactors will have a combined capacity of 8,072 megawatts.
Japan successfully restarted Units 1 and 2 at the Sendai nuclear plant
back in 2015. However, progress in restarting the remaining 24 reactors
that have applied for approval has been very slow. The timetable for
further restarts is likely to be slow and difficult to predict, due to
uncertainties related to political and legal decisions, and the effect of
public opinion. It is anticipated that between three and six reactors will
re-open over the next two years.
Figure 9.3: World nuclear power generation
Source: International Energy Agency (2015); World Nuclear Association (2016).
0
500
1,000
1,500
2,000
2,500
3,000
3,500
2000 2003 2006 2009 2012 2015 2018
Terr
aw
att
hours
OECD Non-OECD
Figure 9.4: New nuclear capacity
Source: World Nuclear Association (2016).
0
10
20
30
40
50
60
70
China OtherAsia
EasternEurope
NorthAmerica
WesternEurope
Africa –Middle East
SouthAmerica
Gig
aw
att
s e
lectr
ic
Under Construction Planned
Resources and Energy Quarterly December 2016

66
Consumption in France in 2017 is uncertain, impacted by safety checks
on a significant number of nuclear power plants. World uranium
consumption is forecast to increase by 5.8 per cent in 2017 to 84,000
tonnes, before rising further, to 86,400 tonnes in 2018. Higher demand
reflects an array of new capacity under construction. A total of 22 new
reactors with a total capacity of 22,444 megawatts are scheduled for
completion in 2017. These include eight new reactors in China, totalling
8,510 megawatts; two new reactors in South Korea, totalling 2,680
megawatts; and two new reactors in Russia, totalling 2,199 megawatts.
Other new reactors are scheduled for completion in India, Pakistan,
Slovakia, and the United Arab Emirates (UAE).
Production
Mine production to increase in 2016 and 2017
World uranium production is forecast to increase by 1.5 per cent in 2016,
to 72,700 tonnes. Production is rising at key US mines, including the
Peninsula Energy’s Lance mine, the Nichols Range mine, and the White
Mesa mine in Utah. Cameco’s Cigar Lake mine in Canada is also
expanding production significantly, as are the Inkai and Budenovakoye
mines in Kazakhstan.
World uranium supply is increasingly being driven by uranium
inventories held by nuclear utilities and secondary market supplies
(where existing stocks are traded). In late 2015, Ux Consulting estimated
that there were sufficient inventories held by nuclear utilities to cover
forward demand for around five years in Japan, two and a half years in
both the United States and Europe, and around seven years in China. It
is expected that uranium producers will focus on reducing output and
cutting costs over the next eighteen months, with high-cost mines likely
to scale back or close. New projects are expected to remain on hold until
price increases improve their commercial viability.
World uranium production is forecast to increase by 3.7 per cent in 2017,
to 75,400 tonnes, underpinned by continued increases in production at
CGN/Swakop Uranium’s Husab mine in Namibia, and the Lance and
Cigar Lake mines in North America. Production is expected to rise to
78,427 tonnes in 2018, as additional production comes on line in
Namibia and Canada.
Figure 9.5: World uranium consumption (U3O8)
Source: International Energy Agency (2016); World Nuclear Association (2016).
0
10
20
30
40
50
60
70
80
90
100
2000 2003 2006 2009 2012 2015 2018
Thousand tonnes
Figure 9.6: World uranium production (U3O8)
Source: Nuclear Energy Agency (2015); Ux Consulting (2016) Uranium Market Outlook;
World Nuclear Association (2016).
0
5
10
15
20
25
30
Kazakhstan Africa Canada Other AustraliaT
housand tonnes
2005 2010 2015 2020
Resources and Energy Quarterly December 2016

67
Australia’s exploration, production and exports
Exploration expenditure remains historically low
After steep falls in recent years, Australia’s uranium exploration
expenditure recovered slightly in the September quarter, lifting by 14 per
cent to $4.9 million. Despite the rise, exploration remains under one-
tenth of the level recorded during 2009 and 2010, reflecting the effect of
historically low uranium prices.
Exploration totalled $17.1 million over the first three quarters of 2016.
This compares to $33.3 million over the first three quarters of 2015.
Australia’s production to fall in 2016–17
Australia’s uranium production is forecast to decrease by around 6.8 per
cent in 2016–17, to 7,141 tonnes, as production gradually shifts back
down to normal levels at the Olympic Dam and ERA Ranger facilities.
These facilities had previously recorded spikes in production, after
operational disruptions in 2014–15. Expected strong production at the
BHP Olympic Dam mine and a ramp-up of production at Quasar
Resources’ Four Mile Mine, are expected to support a rebound in
production to 7,850 tonnes in 2017–18.
Australian producers may face tighter conditions in the medium term, as
long-term supply contracts expire. It is likely that a greater share of
global demand will be met from the spot market in 2017, due to the
historical low in prices. The price is currently below the cost of
production for most miners.
Nuclear power growth across Asia to drive Australia’s uranium exports
Australia exported 7,837 tonnes of U308 in 2015–16 — a substantial
increase on the volume exported in 2014–15. However, export values
were somewhat disappointing, at $A959 million. This reflects the impact
of ongoing weak prices. Export volumes are expected to ease slightly in
2016–17, to 7,141 tonnes. In line with lower export volumes, export
earnings are forecast to decline over the outlook period, falling to $907
million. Stronger production is expected to lift export volumes to 7,850
tonnes in 2017–18, while export values are expected to rise to $995
million, driven by volumes as well as an expected recovery in prices.
Figure 9.7: Uranium supply–demand balance (U3O8)
Source: International Atomic Energy Agency (IAEA); Ux Consulting (2016); World Nuclear
Association (2016).
0
20
40
60
80
100
2010 2012 2014 2016 2018 2020
Thousand tonnes
Consumption Primary Production
Figure 9.8: Australia’s uranium exploration
Source: ABS (2016) Mineral and Petroleum Exploration, cat. no. 8412.0; Cameco
Corporation (2016) Uranium Spot Price.
0
10
20
30
40
50
60
70
0
10
20
30
40
50
60
70
Jun-10 Jun-11 Jun-12 Jun-13 Jun-14 Jun-15 Jun-16
US
$ a
pound
A$ m
illio
n
Exploration expenditure Uranium price (rhs)
Resources and Energy Quarterly December 2016

68
Although the outlook for exports remains tight in the short term, there is
still strong potential for future growth in key regions, including North
America, Western Europe, and Southeast Asia. In particular, future
export growth is likely to be supported by increasing demand from
China, where consumption is expected to rise strongly in coming years
— as a string of new reactors commence operation.
Although exports to Japan are expected to remain subdued, there could
be risks to the upside in the event that the pace of re-opening reactors is
faster than anticipated. Australia may also have greater opportunities to
export uranium to Ukraine in the future, as the two governments have
recently concluded a new supply agreement.
Figure 9.9: Australia’s uranium production
Source: BHP Billiton (2016) Operational Review; Department of Industry, Innovation and
Science (2016); Energy Resources of Australia (2016) ASX Announcement – Operations
Review; Company media announcements (2016).
Figure 9.10: Australia’s uranium exports
Source: Australian Safeguards and Non–Proliferation Office (2015); Department of
Industry, Innovation and Science (2016).
0
200
400
600
800
1,000
1,200
1,400
0
2
4
6
8
10
12
14
1999-00 2002-03 2005-06 2008-09 2011-12 2014-15 2017-18
2015–16 A
$ m
illio
n
Thousand tonnes
Volume Value (rhs)
0
2
4
6
8
10
12
14
1999-00 2002-03 2005-06 2008-09 2011-12 2014-15 2017-18
Thousand tonnes
Resources and Energy Quarterly December 2016

69
Table 9.1: Uranium outlook
b Includes Niger, Namibia, South Africa, Malawi and Zambia. c In current calendar year US dollars. d In current financial year Australian dollars. f forecast s estimate
Source: Department of Industry, Innovation and Science (2016); Cameco Corporation (2016); Company reports (2016); Ux Consulting (2016) Uranium Market Outlook.
World unit 2015 2016 s 2017 f 2018 f Per cent change
Production kt 71.6 72.7 75.4 78.4 4.0
Africa b kt 8.9 9.5 11.3 12.9 14.0
Canada kt 15.7 15.9 16.2 16.7 2.8
Kazakhstan kt 28.1 28.1 28.1 28.1 0.0
Russia kt 3.6 3.6 4.0 4.2 5.7
Consumption kt 76.3 79.4 84.0 86.4 2.8
China kt 10.6 13.8 17.1 17.5 2.3
European Union 28 kt 22.7 22.2 22.4 24.3 8.7
Japan kt 0.2 0.5 1.2 2.1 80.1
Russia kt 6.0 6.1 6.6 6.9 4.6
United States kt 22.7 23.0 22.5 22.1 –1.9
Spot price
– nominal US$/lb 36.5 25.5 23.2 31.3 34.9
– real c US$/lb 36.9 25.5 22.7 29.9 32.0
Australia unit 2014–15 2015–16 2016–17 f 2017–18 f Per cent change
Production t 6,496 7,889 7,141 7.850 9.9
Export volume t 5,515 7,837 7,141 7,850 9.9
– nominal value A$m 532 959 907 995 9.8
– real value d A$m 548 975 907 974 7.5
Average nominal price A$/kg 96.4 122.4 127.0 126.8 –0.1
– real d A$/kg 99.4 124.4 127.0 124.1 –2.2
Resources and Energy Quarterly December 2016


71
Market summary
Gold prices declined noticeably in the December quarter 2016. The
stronger US dollar, along with a push into equity markets, saw
investment flows out of the gold market. Rising US interest rates will
remain a key headwind for gold prices, as they act to push the US dollar
higher.
Fabrication consumption has been subdued, largely due to higher prices
throughout most of 2016. Jewellery consumption is expected to increase
in the short term, as several cultural events encourage retail purchases
in key Asian markets. High Australian dollar gold prices and relatively
high imports of unwrought gold in the September quarter 2016, point to
higher Australian export earnings in 2016–17. Earnings from gold are
forecast to increase by 4 per cent in 2017–18 to $17 billion.
Prices
Gold prices fall on rising US dollar
The London Bullion Market Association (LBMA) gold price declined
during the December quarter, to average about US$1,235 a troy ounce
in the December quarter 2016. Investor demand was affected by a
stronger US dollar and high anticipation of the December hike in the Fed
Funds rate by the US Federal Reserve. Gold performed its safe haven
role during the unexpected US election result — briefly rising to over
$US1,330 per troy ounce on the day of the election. However, the
subsequent announcement of infrastructure investment favoured a
stronger US dollar and higher US equities, and gold declined thereafter.
Gold prices are expected to be lacklustre over the next eighteen months.
Drivers will be improved economic conditions, rising US interest rates
and a stronger US dollar. Gold is forecast to average US$1,200 a troy
ounce in 2017, down from an average of US$1,250 a troy ounce in 2016.
Rising inflation and high equity valuations will be the key upside risks to
the outlook for gold prices. Jewellery consumption and central bank
purchases should be encouraged by the relatively low gold price.
Figure 10.1: Quarterly LBMA gold prices
Source: LBMA (2016) Gold Price PM; Department of Industry, Innovation and Science
(2016)
Figure 10.2: Recent movement in gold prices
Source: LBMA (2016) Gold Price PM
1,000
1,100
1,200
1,300
1,400
Jan-15 May-15 Sep-15 Jan-16 May-16 Sep-16U
S$ a
tro
y o
unce
Gold price (PM) 100 Day Moving Average
0
400
800
1,200
1,600
2,000
Dec-01 Dec-04 Dec-07 Dec-10 Dec-13 Dec-16
US
$ a
tro
y o
unce
Actual Forecast
Resources and Energy Quarterly December 2016

72
The gold price is forecast to average US$1,180 per troy ounce in 2018,
as investors look to other assets as economic conditions improve.
However, historically high debt levels across Europe, Japan, US and
China will provide some investor interest in gold as a safe haven asset.
World consumption
Global gold consumption was subdued in 2016. Total consumption in the
first three quarters of 2016 was 18 per cent lower than same period in
2011 (the peak) — continuing a long term steady decline since then.
World consumption is forecast to increase by 2 per cent a year to 2,908
tonnes in 2018.
Jewellery consumption remains lacklustre
After hitting a 16-year low in the June quarter, gold jewellery
consumption staged a modest recovery in the September quarter.
Swings in Indian gold demand drove the global picture. The recent
demonetisation of high value Indian currency notes is expected to
dampen Indian gold sales in the short term, as the majority of gold
transactions in India are cash-based.
Jewellery consumption — which accounts for 80 per cent of total
fabricated demand — is expected to improve over the outlook period.
Continued economic growth in India and China — the world’s two major
jewellery markets — will likely encourage higher discretionary spending
on gold. Jewellery consumption is forecast to increase by 3 per cent in
2017, more than offsetting a forecast 6 per cent decline in technology
use.
Gold consumption in electronics declined 8 per cent year-on-year in the
September quarter. Producers substituted cheaper metals for gold in
industrial applications throughout much of 2016, as high gold prices
diminished their relative attractiveness.
Investor demand falls as US dollar rises
Investment demand declined 28 per cent quarter-on-quarter in the
September quarter, led by a strong decline in demand for bullion-backed
Exchange Traded Funds (ETFs). ETF holdings rose strongly in the first
half of 2016, but declined by 47 per cent in the September quarter.
Despite the recent decline, ETF inventories remain at a four year high.
Figure 10.3: Correlation of gold price to US: dollar, equities,
interest rates and inflation
Source: LBMA (2016) Gold Price PM; Thompson Reuters (2016) US dollar major
currency index; S&P 500 composite index; Federal funds target rate and US CPI – all
items less food & energy.
-100
-60
-20
20
60
100
1980 1986 1992 1998 2004 2010 2016
Per
cent
USD SP500 Interest rate CPI (core)
Figure 10.4: ETF gold holdings and gold spot price
Source: Bloomberg (2016) ETF Gold Holdings and Spot Gold Price
40
45
50
55
60
65
70
1,000
1,100
1,200
1,300
1,400
Dec-14 Apr-15 Aug-15 Dec-15 Apr-16 Aug-16
Million tro
y o
unces
US
$ a
tro
y o
unce
Known ETF holdings (rhs) LBMA gold price
Resources and Energy Quarterly December 2016

73
Central bank demand is expected to increase over the outlook period, led
by purchases from Russia and China. Central bank buying will provide
support for gold prices during 2017.
World production
Lower mine production offset by recycled supply
Total gold supply increased moderately in 2016, as an increase in recycled
output offset a decline in mine production. World mine production is
forecast to increase by 1.3 per cent in 2016, to 3,263 tonnes. World mine
production is forecast to increase by 1.7 per cent, to just over 3,318 tonnes
in 2017, then decline to 3,109 tonnes in 2018.
World mine production decreased by just 1 per cent year-on-year in the
first three quarters of 2016. World mine production has largely plateaued,
as increased capacity at various operations is offset by cost-cutting
measures — enacted in line with falling prices over the last several years.
In contrast, recycled output increased by 12 per cent year-on-year, adding
a further 980 tonnes to supply in the first three quarters of 2016.
The surprise US election result and the US economic landscape will
have a mixed impact on investor demand over the next two years. US
President-elect Trump’s pledge of stronger fiscal stimulus has increased
expectations of higher economic growth and higher inflation in the US. If
US economic growth does improve significantly, this may discourage
investment in gold, as investors expect equities to offer higher returns.
Historically, gold has been viewed as an inflation hedge. US interest
rates are expected to increase over the forecast period, discouraging
investment in gold. Rising US interest rates put upward pressure on the
US dollar, which makes gold more expensive for non-US investors to
buy. The past decade has shown a strong (inverse) correlation between
the US gold price and US real bond yields.
Central bank demand for gold declined 55 per cent year-on-year over
the first three quarters of 2016. However, official sector purchases
remain historically high, as emerging markets continue to diversify
reserves with non US dollar-denominated assets.
Figure 10.5: US dollar gold price and real bond yields
Source: LBMA (2016) Gold Price PM; Thompson Reuters (2016) US Federal Reserve
Inflation linked 10 year bond yield
-2
-1
0
1
2
3500
800
1,100
1,400
1,700
2,000
Dec-06 Dec-08 Dec-10 Dec-12 Dec-14 Dec-16
Yie
ld p
er
cent
US
$ a
tro
y o
unce
Gold price US real bond yield (inverse rhs)
Figure 10.6: Global gold consumption
0
1,000
2,000
3,000
4,000
5,000
2006 2007 2008 2009 2010 2011 2012 2013 2014 2015
Tonnes
Fabricated Investment
Source: World Gold Council (2016) Gold Demand Trends Full Year 2015
Resources and Energy Quarterly December 2016

74
Mine production declined substantially in Asia and North America year-
on-year in the first three quarters of 2016. Indonesian production
declined by 10 per cent to 90 tonnes over the same period. Production at
Indonesia’s Grasberg mine declined by 28 per cent to 18 tonnes, due to
lower ore grades. Grasberg’s owners expect production to rise in 2017,
due to increased access to higher grade sections of the open pit.
Mexico’s production fell 13 per cent year-on-year for the nine months
ending September 2016.
Gold recycling boosts world supply
World recycled supply continued to increase in the first three quarters of
2016, boosting total world gold supply. Over 336 tonnes of recycled
supply came onto the market during the September quarter. Scrap
responded to higher prices throughout most of 2016. Recycled supply is
expected to taper in 2017, as lower prices discourage trading.
Australia’s production and exports
Exploration expenditure improves
Australia’s gold exploration expenditure increased 19 per cent year-on-
year to $160 million in the September quarter 2016. Gold exploration
expenditure has been rising steadily since March 2014. The rise in
expenditure has been motivated by higher profit margins relative to
many other resources. Gold exploration has also been encouraged from
a rising domestic gold price due to exchange rate effects over most of
the last three years.
Exploration expenditure continued to increase in Western Australia rising
7 per cent quarter-on-quarter in the September quarter 2016. Western
Australia remains the largest centre of gold exploration activity in
Australia, attracting 70 per cent of total national gold exploration
expenditure. Gold exploration expenditure rose strongly by 51 per cent
in New South Wales to 11 million in the September quarter — the
highest level since June 2013. Expenditure in Queensland remained
steady at 12 million, while the Northern Territory declined 28 per cent
quarter-on-quarter to 9 million in the September quarter.
Production increases in the September quarter
Australia’s gold mine production is forecast to increase by 2.8 per cent in
2016–17, to 292 tonnes. The increase is due to the faster than expected
ramp up in production from several larger mines. Production is forecast
to increase by 3.5 per cent in 2017–18, to 302 tonnes.
Australia’s gold production increased by 2.2 per cent year-on-year in the
September quarter 2016. The higher output was achieved despite wet
weather disrupting several mines in NSW, Victoria and South Australia.
In the September quarter, Newmont’s Boddington mine in Western
Australia increased production by 7.3 per cent year-on-year to 6.8
tonnes — a record high for Australia’s largest gold mine.
Newcrest’s Cadia Valley increased 9.3 per cent to over 6 tonnes in the
September quarter, due to increased output from the ramp up of Cadia
East. Newcrest lifted estimates for Cadia Valley to produce 23 to 26
tonnes in 2016–17. Production at the Kalgoorlie Super Pit was better
than expected in the September quarter. Output increased to 5.9 tonnes,
due to better ore grades.
Figure 10.6: Australia’s gold exploration expenditure
Source: LBMA (2016) Gold Price PM; ABS (2016) Mineral and Petroleum Exploration,
8412.0
0
400
800
1,200
1,600
2,000
0
50
100
150
200
250
Mar-2012 Sep-2013 Mar-2015 Sep-2016
US
$ a
tro
y o
unce
A$ m
illio
n
Exploration expenditure LBMA Gold Price (rhs)
Resources and Energy Quarterly December 2016

75
Figure 10.7: Australia’s gold exports
Source: ABS (2016) International Trade, 5465.0; Department of Industry, Innovation and
Science (2016)
Export volumes of gold near record high
Australia’s gold exports increased 25 per cent year-on-year to $5.2
billion in the September quarter of 2016. The increase was due to higher
production, supported by higher imports of unwrought and semi-
manufactured gold for processing. Export volumes increased 10 per cent
over the same period, to 92 tonnes.
The forecast for Australia’s gold exports in 2016–17 has been revised
upwards to 323 tonnes. The increase is due to the higher than expected
exports in the September quarter. Higher processing of imported
unwrought gold was driven by higher prices during the second and third
quarters. Imported unwrought gold is expected to taper over the outlook
period, due to lower prices. Export volumes are forecast to total 317
tonnes in 2017–18, due to higher domestic production. The value of
Australia’s gold exports is forecast to total $17 billion in 2017–18, as
higher production offsets the impact of lower gold prices.
Figure 10.8: US dollar versus Australian dollar gold price
Source: LBMA (2016) Gold Price PM; Bloomberg (2016) Australian Dollar Spot Price
0
400
800
1200
1600
2000
2005 2006 2007 2008 2009 2010 2011 2012 2013 2014 2015 2016
Dollars
Spot price(US$) Spot price (A$)
0
100
200
300
400
500
0
4
8
12
16
20
2001–02 2005–06 2009–10 2013–14 2017–18
Tonnes
A $
billions
Volumes (rhs) Values
Resources and Energy Quarterly December 2016

76
Table 10.1: Gold outlook
Notes: b Includes jewellery consumption and industrial applications; c London Bullion Market Association PM price; d In current calendar year US dollars; e In current financial year Australian
dollars; f Forecast; s Estimate.
Source: Sources: ABS (2016) International Trade, 5465.0; London Bullion Market Association (2016) gold price PM; World Gold Council (2016); Department of Industry, Innovation and Science.
World unit 2015 2016 s 2017 f 2018 f Per cent change
Fabrication
Consumption b t 2,731 2,786 2,845 2,908 2.2
Mine production t 3,221 3,263 3,318 3,109 –6.3
Price c
– nominal US$/oz 1,160 1,250 1,200 1,180 –1.7
– real d US$/oz 1,173 1,250 1,174 1,130 –3.8
Australia 2014–15 2015–16 2016–17 f 2017–18 f Per cent change
Mine Production t 275 285 292 302 3.5
Export volume t 278 306 323 317 –1.6
– nominal value A$m 13,048 15,687 17,353 16,929 –2.4
– real value e A$m 13,446 15,946 17,353 16,573 –4.5
Price
– nominal A$/oz 1,468 1,602 1,667 1,659 –0.5
– real e A$/oz 1,513 1,628 1,667 1,625 –2.6
Resources and Energy Quarterly December 2016


78
AluminiumMarket summary
The outlook for Australia’s aluminium exports remains positive, thanks to
increased demand from the US, Europe and China, where vehicle sales
and production are projected to increase in 2016–17 and 2017–18. As a
result, Australia’s aluminium exports are forecast to rise 3.4 per cent in
2016–17 and 2.8 per cent in 2017–18, to 1.49 and 1.53 million tonnes,
respectively. Export earnings for 2016–17 and 2017–18 are forecast to
increase at an annual rate of 3.4 per cent to $3.4 billion and $3.5 billion,
respectively.
However, both the power outage on 1 December 2016 and the
termination of the hedge contract between the Portland smelter and AGL
in August 2017, present risks to Australia’s production assessment.
Without a new favourable power agreement in place before August
2017, Portland’s production is likely to be adversely affected, reducing
Australia’s production and export capacity. Moreover, there are
uncertainties about the changes that the Trump administration will
implement after 20 January 2017. These changes will have direct and
indirect impacts on export markets and opportunities for Australian
aluminium.
Prices
Aluminium prices to continue to rise
The average London Metals Exchange (LME) spot aluminium price has
increased 15 per cent (year-to-date to average US$1,592 a tonne) from
the end of 2015, mainly driven by increased consumption in China, the
world’s largest aluminium consumer.
Economic activity in aluminium-intensive industries in China, notably
transport and construction, has continued to drive growth in aluminium
consumption. From the supply side, higher aluminium prices have
encouraged facility restarts in China, the world’s largest aluminium
producer. However, the pace of supply increase in China has been
largely in line with expectations, due to supply discipline imposed by the
government’s ‘supply-side reform’ policy.
Figure 11.1: Annual aluminium prices and stocks
Source: LME (2016) spot prices; Department of Industry, Innovation and Science (2016)
0
500
1,000
1,500
2,000
2,500
3,000
0
2
4
6
8
10
12
2008 2010 2012 2014 2016 2018
2016 U
S$ a
tonne
Weeks o
f consum
ption
Stocks Prices
Figure 11.2: Growth in world aluminium consumption and
industrial production
Source: International Aluminium Institute (2016); Netherlands CPB ( 2016) World Trade
Monitor September
-6
-3
0
3
6
9
12
-8
-4
0
4
8
12
16
1992 1995 1998 2001 2004 2007 2010 2013
Per
cent
Per
cent
World aluminium consumption World industrial production
Resources and Energy Quarterly December 2016

Resources and Energy Quarterly December 2016 79
LME stocks have continued to decline over the past quarter, and are
now 2.1 million tonnes. However, the pace of decline in stocks has
slowed, as global production resumes growing. For 2016 as a whole,
prices are forecast to average US$1,586 a tonne.
The proposed increased in infrastructure spending by US President-
elect Donald Trump is likely to push aluminium prices higher in the short
term. Aluminium prices are forecast to increase 3.7 and 3.3 per cent in
2017 and 2018, to average US$1,645 and US$1,700 a tonne,
respectively. Other drivers will be firm demand from China and the
global automotive sector, which are projected to outweigh increased
production associated with capacity restarts in China.
Consumption
World aluminium consumption to remain strong
World aluminium consumption is estimated to have grown by 5.0 per
cent in 2016, to 60 million tonnes, supported by stronger demand from
automotive producers in China, North America and Western Europe. In
China, the government’s decision to cut the tax on small cars by 50 per
cent from October 2015 to the end of 2016, has boosted car sales by 6.7
per cent in the first half of 2016. Car sales in the US have been
recovering since 2010. Sales rose 1.7 per cent in the first three quarters
of 2016 to nearly 16 million units, and are estimated to have continued to
grow over the remainder of 2016, supported by improved economic
growth and labour markets. In Europe, car sales in the first half of 2016
increased by 6.4 per cent year-on-year, driven by low interest rates and
improvements in consumer confidence. Growth in global car sales is
forecast to have increased by 3.0 per cent in 2016; a slight moderation is
likely in 2017 and 2018.
China is now the world’s largest automotive market, both in terms of
demand and supply. In 2016, China’s vehicle sales are forecast to
increase 13 per cent, with growth forecast to accelerate over the next
few years. By 2020, over 200 million vehicles will be on Chinese roads,
and annual vehicle sales are forecast to reach 35 million units.
The global construction sector is also expected to contribute to a
projected increase in aluminium consumption over the short term. In the
US, the ambitious infrastructure program (highways, bridges, tunnels,
Figure 11.3: World aluminium consumption
Source: World Bureau of Metal Statistics (2016); Department of Industry, Innovation and
Science (2016)
0
10
20
30
40
50
60
70
2008 2010 2012 2014 2016 2018
Million tonnes
Asia Europe Americas Africa Oceania
Figure 11.4: Aluminium end-use by sector
Source: United States Geological Survey
0
10
20
30
40
Per
cent
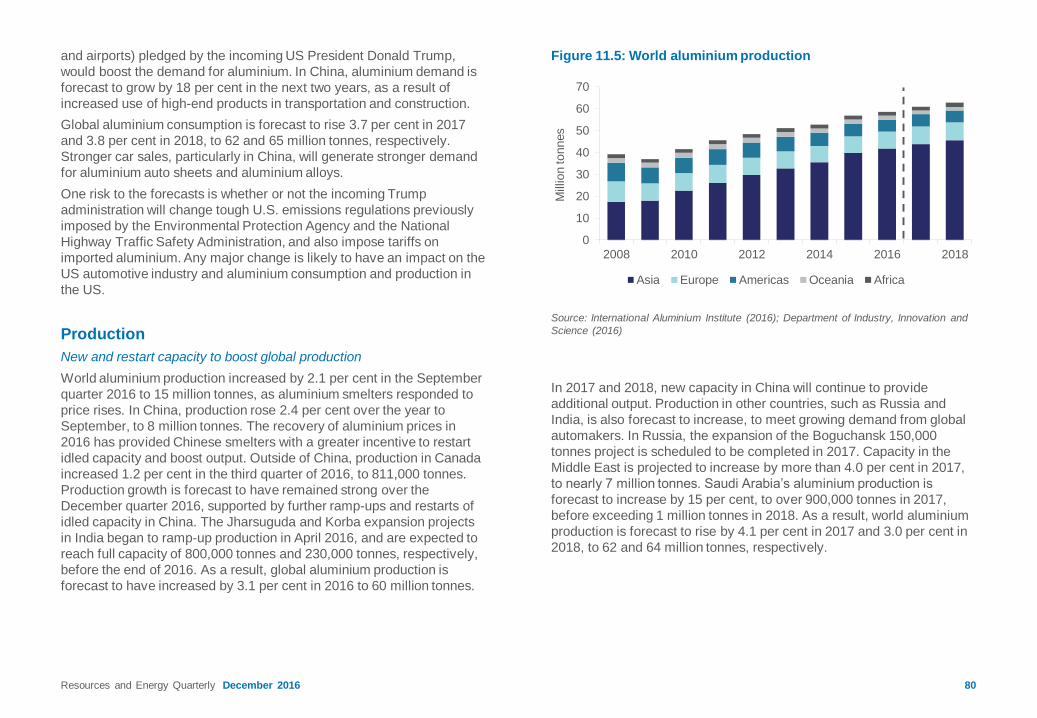
Resources and Energy Quarterly December 2016 80
and airports) pledged by the incoming US President Donald Trump,
would boost the demand for aluminium. In China, aluminium demand is
forecast to grow by 18 per cent in the next two years, as a result of
increased use of high-end products in transportation and construction.
Global aluminium consumption is forecast to rise 3.7 per cent in 2017
and 3.8 per cent in 2018, to 62 and 65 million tonnes, respectively.
Stronger car sales, particularly in China, will generate stronger demand
for aluminium auto sheets and aluminium alloys.
One risk to the forecasts is whether or not the incoming Trump
administration will change tough U.S. emissions regulations previously
imposed by the Environmental Protection Agency and the National
Highway Traffic Safety Administration, and also impose tariffs on
imported aluminium. Any major change is likely to have an impact on the
US automotive industry and aluminium consumption and production in
the US.
Production
New and restart capacity to boost global production
World aluminium production increased by 2.1 per cent in the September
quarter 2016 to 15 million tonnes, as aluminium smelters responded to
price rises. In China, production rose 2.4 per cent over the year to
September, to 8 million tonnes. The recovery of aluminium prices in
2016 has provided Chinese smelters with a greater incentive to restart
idled capacity and boost output. Outside of China, production in Canada
increased 1.2 per cent in the third quarter of 2016, to 811,000 tonnes.
Production growth is forecast to have remained strong over the
December quarter 2016, supported by further ramp-ups and restarts of
idled capacity in China. The Jharsuguda and Korba expansion projects
in India began to ramp-up production in April 2016, and are expected to
reach full capacity of 800,000 tonnes and 230,000 tonnes, respectively,
before the end of 2016. As a result, global aluminium production is
forecast to have increased by 3.1 per cent in 2016 to 60 million tonnes.
In 2017 and 2018, new capacity in China will continue to provide
additional output. Production in other countries, such as Russia and
India, is also forecast to increase, to meet growing demand from global
automakers. In Russia, the expansion of the Boguchansk 150,000
tonnes project is scheduled to be completed in 2017. Capacity in the
Middle East is projected to increase by more than 4.0 per cent in 2017,
to nearly 7 million tonnes. Saudi Arabia’s aluminium production is
forecast to increase by 15 per cent, to over 900,000 tonnes in 2017,
before exceeding 1 million tonnes in 2018. As a result, world aluminium
production is forecast to rise by 4.1 per cent in 2017 and 3.0 per cent in
2018, to 62 and 64 million tonnes, respectively.
Figure 11.5: World aluminium production
Source: International Aluminium Institute (2016); Department of Industry, Innovation and
Science (2016)
0
10
20
30
40
50
60
70
2008 2010 2012 2014 2016 2018
Million tonnes
Asia Europe Americas Oceania Africa

Resources and Energy Quarterly December 2016 81
Australia’s production and exports
Production to remain steady but facing challenges
In 2016–17, Australia’s aluminium production is forecast to remain at 1.6
million tonnes, with some uncertainty due to the impact on production of
a power outage at the Portland smelter on 1 December 2016.
The power contract between the Victorian Government and Alcoa’s
Portland smelter expired in November 2016. Portland Aluminium
secured a 20-year contract with AGL to supply power from November
2016. However, this new contract is to be terminated in August 2017,
because of a significant rise in the price of power to the Portland
smelter.
The early termination of the power supply contract between Portland
smelter and AGL presents a risk to Australia’s aluminium production in
2017–18. Without a new favourable power agreement in place before
August 2017, Portland’s production — accounting for about 18 per cent
of Australian aluminium production — could be adversely affected, and
reduce Australia’s production. Our forecast is for 2017-18 production to
remain at 1.6 million tonnes.
Increased aluminium demand from the automotive industry provides
more ore opportunities for Australia’s exports
Australia’s aluminium exports are estimated to increase by 3.4 per cent
in 2016–17 and by 2.8 per cent in 2017–18, to 1.49 and 1.53 million
tonnes, respectively. Exports will be supported by increased demand
from the automotive sector in South Korea, the US, Europe and China.
The outlook for global motor vehicle production and sales is very bright,
and this in turn, is providing more opportunities for Australian aluminium
exports. As a result, export earnings for 2016–17 and 2017–18 are
forecast to rise at an annual rate of 3.4 per cent to $3.4 billion and $3.5
billion, respectively.
There are uncertainties about the changes that the Trump administration
will implement after 20 January 2017. These changes will have the
potential to impact directly and indirectly on commodities, including
export markets and opportunities for Australian aluminium. Therefore,
the forecasts have more than usual uncertainty.
Figure 11.6: Australia’s aluminium production
Source: Department of Industry, Innovation and Science (2016)
0.0
0.5
1.0
1.5
2.0
2007–08 2009–10 2011–12 2013–14 2015–16 2017–18
Million tonnes
Figure 11.7: Australia’s aluminium exports
Source: ABS (2016) International Trade in Goods and Services, 5368.0; Department of
Industry, Innovation and Science (2016)
0
1
2
3
4
5
6
0.0
0.5
1.0
1.5
2.0
2007–08 2009–10 2011–12 2013–14 2015–16 2017–18
2016-1
7 A
$ b
illion
Million tonnes
Volume Value (rhs)

Resources and Energy Quarterly December 2016 82
AluminaMarket summary
The prospect for Australia’s alumina exports is broadly positive,
supported by increased demand from China following aluminium smelter
restarts in that country during 2016. Exports are forecast to increase by
3 per cent in 2016–17 to 18 million tonnes, and remain at that level in
2017–18, as production capacity constraints kick in. Export earnings are
forecast to fall 2.5 per cent in 2016–17 to $5.8 billion, due to price falls in
the first quarter of 2016–17. Nevertheless, export earnings will rise in
2017–18, with a forecast increase of 4.5 per cent to $6.1 billion.
Prices
Aluminium production supports alumina prices in 2017 and 2018
The average FOB Australia alumina price has increased by 30 per cent
since December 2015, to around US$266 a tonne (November 2016
average), driven by reduced supply from China, the world’s largest
alumina producer, and increased global aluminium production. For 2016
as a whole, alumina prices are forecast to average US$236 a tonne,
supported by aluminium production growth.
In 2017 and 2018, the projected growth in global aluminium production is
expected to support higher alumina prices, which are forecast to
increase to an average of US$245 and US$253 a tonne, respectively.
However, the risk to alumina prices remains to the downside: the rise in
prices in 2016 has encouraged refinery restarts in China, and may spur
production increases. Another potential impact is from increased
aluminium scrap recovery in China. If alumina prices continue to rise in
the short term, it may induce higher levels of aluminium recycling; this
would reduce primary aluminium production, reducing alumina demand.
Consumption
Growth in global alumina consumption continues
World alumina consumption is estimated to have grown by 2.4 per cent
in 2016, to 116 million tonnes. Global aluminium smelting capacity
increased 2.7 million tonnes in the first nine months of 2016, and
consuming an additional 4.4 million tonnes of alumina. In China,
the recovery of aluminium prices has provided Chinese aluminium
smelters with a greater incentive to restart idled capacity and boost
aluminium output. In the September quarter 2016, Chinese aluminium
production increased 2.4 per cent to 8 million tonnes. In India, alumina
demand is expected to increase to around 1.5 million tonnes per annum
in 2016, as Vedanta expands aluminium production at Jharsuguda and
Korba. In the Middle East, Saudi Arabia is forecast to increase its
alumina consumption to around 1.5 million tonnes in 2016. The rise in
alumina consumption largely reflects the Government’s plan to expand
the aluminium sector and diversify the economy away from oil.
Global alumina consumption is forecast to increase 4.3 and 3.3 per cent
in 2017 and 2018, to 121 and 125 million tonnes, respectively. The gains
are in line with the growth in aluminium supply. New capacity and the re-
start of idled aluminium capacity in China will continue to provide support
for alumina demand. Outside of China, the increased alumina demand is
expected to come from India, where increased public investment in
Figure 11.8: Annual alumina price
Source: Bloomberg (2016) alumina monthly price; Department of Industry, Innovation and
Science (2016)
0
100
200
300
400
2008 2010 2012 2014 2016 2018
2016 U
S$ a
tonne (
FO
B
Austr
alia)

Resources and Energy Quarterly December 2016 83
infrastructure, reforms in the power sector and stronger rural demand,
are expected to see the country’s aluminium production register double-
digit growth. In the Middle East, alumina consumption is projected to rise
at annual rate of 3.0 per cent over the next two years. Saudi Arabia’s
aluminium production is forecast to increase by 15 per cent in 2018, to
over 1.0 million tonnes. Southeast Asia is an emerging aluminium
industry, supported by cheap power costs for aluminium smelting.
Aluminium smelters in Malaysia and Indonesia — operated by Press
Metal and Inalum — are the main sources of alumina demand in this
region. Further upside in global alumina demand will be boosted by
expansions at both the Inalum and Press Metal facilities, and new
aluminium projects in Vietnam and Brunei.
Production
Alumina production to rise in response to high prices
World alumina production increased by 2.1 per cent in the September
quarter 2016, to 29 million tonnes, as alumina refineries responded to
high alumina prices in the June quarter 2016. In China, producers were
very quick to bring idled capacity back into production, raising output by
2.8 per cent in the September quarter to 15 million tonnes. Outside of
China, the 1 million tonnes per annum Well Harvest plant in Indonesia
commenced operation in the June quarter 2016. Production growth
appears to have remained strong in the second half of 2016, supported
by increased aluminium smelting capacity. As a result, global alumina
production for 2016 is forecast to increase by 0.9 per cent to 116 million
tonnes.
In 2017 and 2018, world alumina output is forecast to rise by 4.3 and 3.5
per cent, to 121 and 125 million tonnes, respectively. Growth will be
supported by continued capacity restarts in China and new capacity in
other parts of the world. The 2 million tonnes per annum Al Taweelah
refinery project in the Middle East, which is owned and operated by
Emirates Global Aluminium, is expected to begin operation in the
December quarter 2017. The 2 million tonnes per annum Lanjigarh
refinery project in India is also expected to be operating in 2017, subject
to bauxite availability. Other new/expansion projects in Indonesia, China,
Vietnam and India, are expected to come online over the forecast period,
adding 18 million tonnes per year to global alumina capacity.
Figure 11.9: World alumina consumption
Source: AME Group (2016); Department of Industry, Innovation and Science (2016)
0
20
40
60
80
100
120
140
2008 2010 2012 2014 2016 2018
Million tonnes
Asia Europe Americas Oceania Africa
Figure 11.10: World alumina production
Source: International Aluminium Institute (2016); Department of Industry, Innovation and
Science (2016)
0
20
40
60
80
100
120
140
2008 2010 2012 2014 2016 2018M
illion tonnes
Asia Oceania Americas Europe Africa

Resources and Energy Quarterly December 2016 84
Australia’s production and exports
Australia’s alumina production remains steady
In 2016–17 and 2017–18, Australia’s annual alumina production is
forecast to be steady at 20.7 million tonnes, assuming no major
disruptions or expansions at existing operations. Alumina mines in
Western Australia account for 67 per cent of Australian alumina
production, and the remaining 33 per cent is located in Queensland.
Aluminium alumina export capacity to be constrained by production
capacity
Australia’s alumina exports are forecast to increase by 3.0 per cent in
2016–17 to 18 million tonnes, underpinned by increased demand from
China following aluminium smelter restarts during 2016. Australia is the
principal alumina supplier to China, accounting for 55 per cent of China’s
total imported alumina. However, over this forecast period, export
earnings are forecast to fall by 2.5 per cent to $5.8 billion, due to an 8
per cent fall in alumina prices in the first quarter of 2016–17.
In 2017–18, Australia’s alumina exports are forecast to remain at 18.2
million tonnes, due to constraints in production capacity. Over the
forecast period, Australia’s alumina production is forecast to be
unchanged at 20.7 million tonnes. It is estimated that 2.5 million tonnes
(12 per cent) of Australia’s alumina production are consumed
domestically, and 18.2 million tonnes (88 per cent) are exported. As a
result, there is no room for a further rise in exports. Export earnings are
forecast to rise by 4.5 per cent in 2017–18 to $6.1 billion, driven by
higher alumina prices.
Figure 11.11: Australia’s alumina production
Source: Department of Industry, Innovation and Science (2016)
0
5
10
15
20
25
2007–08 2009–10 2011–12 2013–14 2015–16 2017–18
Million tonnes
Figure 11.12: Australia’s alumina exports
Source: ABS (2016) International Trade in Goods and Services, 5368.0; Department of
Industry, Innovation and Science (2016)
0
2
4
6
8
0
4
8
12
16
20
2007–08 2009–10 2011–12 2013–14 2015–16 2017–18
2016-1
7 A
$ b
illion
Million tonnes
Volume Value (rhs)
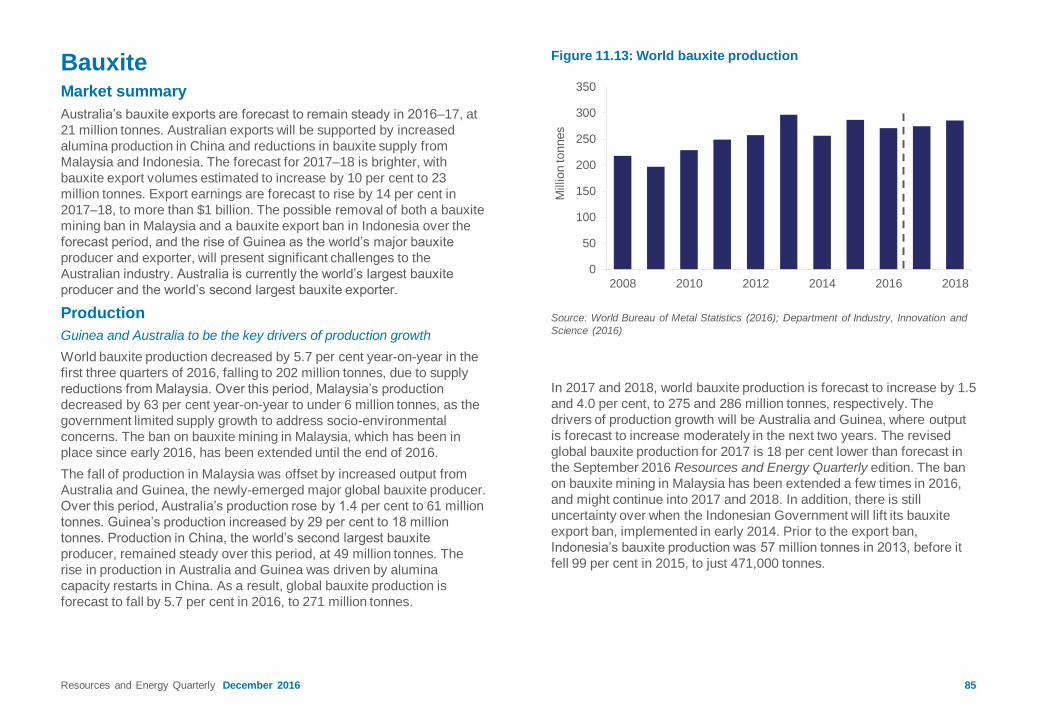
Resources and Energy Quarterly December 2016 85
BauxiteMarket summary
Australia’s bauxite exports are forecast to remain steady in 2016–17, at
21 million tonnes. Australian exports will be supported by increased
alumina production in China and reductions in bauxite supply from
Malaysia and Indonesia. The forecast for 2017–18 is brighter, with
bauxite export volumes estimated to increase by 10 per cent to 23
million tonnes. Export earnings are forecast to rise by 14 per cent in
2017–18, to more than $1 billion. The possible removal of both a bauxite
mining ban in Malaysia and a bauxite export ban in Indonesia over the
forecast period, and the rise of Guinea as the world’s major bauxite
producer and exporter, will present significant challenges to the
Australian industry. Australia is currently the world’s largest bauxite
producer and the world’s second largest bauxite exporter.
Production
Guinea and Australia to be the key drivers of production growth
World bauxite production decreased by 5.7 per cent year-on-year in the
first three quarters of 2016, falling to 202 million tonnes, due to supply
reductions from Malaysia. Over this period, Malaysia’s production
decreased by 63 per cent year-on-year to under 6 million tonnes, as the
government limited supply growth to address socio-environmental
concerns. The ban on bauxite mining in Malaysia, which has been in
place since early 2016, has been extended until the end of 2016.
The fall of production in Malaysia was offset by increased output from
Australia and Guinea, the newly-emerged major global bauxite producer.
Over this period, Australia’s production rose by 1.4 per cent to 61 million
tonnes. Guinea’s production increased by 29 per cent to 18 million
tonnes. Production in China, the world’s second largest bauxite
producer, remained steady over this period, at 49 million tonnes. The
rise in production in Australia and Guinea was driven by alumina
capacity restarts in China. As a result, global bauxite production is
forecast to fall by 5.7 per cent in 2016, to 271 million tonnes.
In 2017 and 2018, world bauxite production is forecast to increase by 1.5
and 4.0 per cent, to 275 and 286 million tonnes, respectively. The
drivers of production growth will be Australia and Guinea, where output
is forecast to increase moderately in the next two years. The revised
global bauxite production for 2017 is 18 per cent lower than forecast in
the September 2016 Resources and Energy Quarterly edition. The ban
on bauxite mining in Malaysia has been extended a few times in 2016,
and might continue into 2017 and 2018. In addition, there is still
uncertainty over when the Indonesian Government will lift its bauxite
export ban, implemented in early 2014. Prior to the export ban,
Indonesia’s bauxite production was 57 million tonnes in 2013, before it
fell 99 per cent in 2015, to just 471,000 tonnes.
Figure 11.13: World bauxite production
Source: World Bureau of Metal Statistics (2016); Department of Industry, Innovation and
Science (2016)
0
50
100
150
200
250
300
350
2008 2010 2012 2014 2016 2018
Million tonnes

Resources and Energy Quarterly December 2016 86
Australia’s production and exports
Australia’s bauxite production to grow modestly
In 2016–17 and 2017–18, Australia’s bauxite production is forecast to
grow by 1.0 and 5.6 per cent, to 83 and 87 million tonnes, respectively.
The gains will come from increased production by the major producers,
and the expected production commencement of Metro Mining’s Bauxite
Hills mine in Queensland in the June quarter of 2018. Over the forecast
period, the rise in bauxite production is expected to be all exported, as
producers respond to increased demand from global alumina refineries,
particularly from China.
Australia’s bauxite exports positive but facing challenges
In 2016–17, Australia’s bauxite exports are forecast to remain at 21
million tonnes, an upward revision of 8 per cent from the forecast in the
September quarter 2016 edition. Australia’s bauxite exports to China
increased by 18 per cent in the September quarter 2016, and are
estimated to increase further over the remainder of 2016–17, supported
by increased alumina production in China and supply reductions from
Malaysia and Indonesia. As a result, export earnings have been revised
up by 5.0 per cent from the September 2016 forecast, to $926 million.
Australia’s bauxite exports are forecast increase strongly in 2017–18,
rising by 10 per cent to 23 million tonnes, as demand for Australian
bauxite rises to accommodate alumina capacity restarts and new
refineries in China. The uncertainty on the timing of lifting bauxite export
bans in Malaysia and Indonesia is a contributing factor to the expected
increase in Australia’s bauxite exports. Australia’s bauxite export
earnings are forecast to increase by 14 per cent in 2017–18, to more
than $1 billion.
The risk to this assessment is the possibility of the lifting of the bauxite
mining ban in Malaysia and the bauxite export ban in Indonesia over the
forecast period. In Malaysia, the government is facing pressure from
local authorities to remove the ban on bauxite mining, as a slump in
mining royalties hits local government revenues. With rising bauxite
stockpiles from Kuantan’s port, the Malaysian government recently
issued temporary export permits to producers, to allow them to export
bauxite to China.
Figure 11.14: Australia’s bauxite production
Source: Department of Industry, Innovation and Science (2016)
0
20
40
60
80
100
2007–08 2009–10 2011–12 2013–14 2015–16 2017-18
Million tonnes
Figure 11.15: Australia’s bauxite exports
Source: ABS (2016) International Trade in Goods and Services, 5368.0; Department of
Industry, Innovation and Science (2016)
0.0
0.2
0.4
0.6
0.8
1.0
1.2
0
5
10
15
20
25
2007–08 2009–10 2011–12 2013–14 2015–16 2017-18
2016-1
7 A
$ b
illion
Million tonnes
Volume Value (rhs)
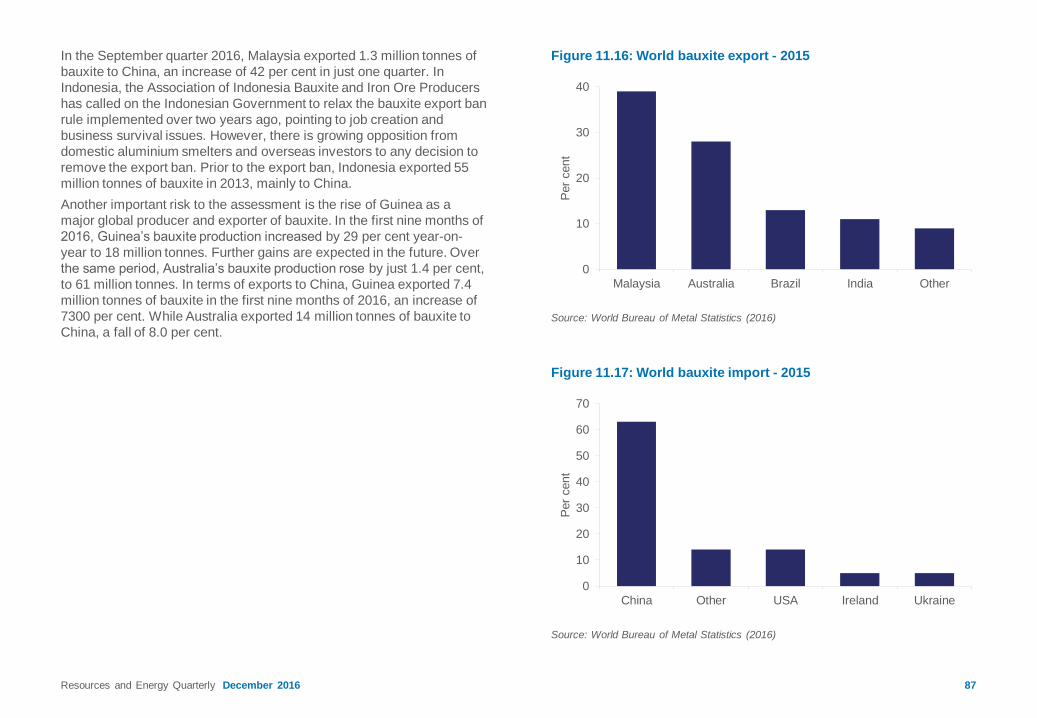
Resources and Energy Quarterly December 2016 87
In the September quarter 2016, Malaysia exported 1.3 million tonnes of
bauxite to China, an increase of 42 per cent in just one quarter. In
Indonesia, the Association of Indonesia Bauxite and Iron Ore Producers
has called on the Indonesian Government to relax the bauxite export ban
rule implemented over two years ago, pointing to job creation and
business survival issues. However, there is growing opposition from
domestic aluminium smelters and overseas investors to any decision to
remove the export ban. Prior to the export ban, Indonesia exported 55
million tonnes of bauxite in 2013, mainly to China.
Another important risk to the assessment is the rise of Guinea as a
major global producer and exporter of bauxite. In the first nine months of
2016, Guinea’s bauxite production increased by 29 per cent year-on-
year to 18 million tonnes. Further gains are expected in the future. Over
the same period, Australia’s bauxite production rose by just 1.4 per cent,
to 61 million tonnes. In terms of exports to China, Guinea exported 7.4
million tonnes of bauxite in the first nine months of 2016, an increase of
7300 per cent. While Australia exported 14 million tonnes of bauxite to
China, a fall of 8.0 per cent.
Figure 11.16: World bauxite export - 2015
Source: World Bureau of Metal Statistics (2016)
Figure 11.17: World bauxite import - 2015
0
10
20
30
40
Malaysia Australia Brazil India Other
Per
cent
Source: World Bureau of Metal Statistics (2016)
0
10
20
30
40
50
60
70
China Other USA Ireland Ukraine
Per
cent

Resources and Energy Quarterly December 2016 88
Table 11.1: Aluminium, alumina and bauxite
Notes: b Producer and LME stocks; c LME cash prices for primary aluminium; d In current calendar year US dollars; e In current financial year Australian dollars; f Forecast; s Estimate
Sources: ABS (2016) International Trade in Goods and Services, 5368.0; AME Group (2016); Department of Industry, Innovation and Science (2016); International Aluminium Institute (2016);
World Bureau of Metal Statistics (2016)
World unit 2015 2016 s 2017 f 2018 f Per cent change
Primary aluminium
Production kt 57,890 59,660 62,087 63,919 3.0
Consumption kt 57,120 60,001 62,240 64,584 3.8
Closing stocks b kt 7,197 6,857 6,704 6,039 -9.9
– weeks of consumption 6.6 5.9 5.6 4.9 -13.2
Prices
World aluminium c
– nominal US$/t 1,663 1,586 1,645 1,700 3.3
USc/lb 75.4 71.9 74.6 77.1 3.3
– real d US$/t 1,682 1,586 1,609 1,627 1.1
USc/lb 76.3 71.9 73.0 73.8 1.1
Alumina spot
– nominal US$/t 301 236 245 253 3.4
– real d US$/t 304 236 239 242 1.2
Australia 2014–15 2015–16 2016–17 f 2017–18 f Per cent change
Production
Primary aluminium kt 1,647 1,647 1,643 1,643 0.0
Alumina kt 19,895 20,550 20,675 20,675 0.0
Bauxite Mt 80.3 81.7 82.6 87.2 5.6
Consumption
Primary aluminium kt 214 206 153 111 -27.4
Exports
Primary aluminium kt 1,432 1,442 1,490 1,532 2.8
– nominal value A$m 3,823 3,241 3,350 3,463 3.4
– real value e A$m 3,940 3,294 3,350 3,390 1.2
Alumina kt 17,363 17,676 18,211 18,211 0.0
– nominal value A$m 6,353 5,995 5,843 6,106 4.5
– real value e A$m 6,547 6,094 5,843 5,977 2.3
Bauxite kt 20,204 20,971 21,006 23,189 10.4
– nominal value A$m 934 992 926 1,059 14.4
– real value e A$m 962 1,008 926 1,037 12.0
Total value
– nominal A$m 11,110 10,228 10,119 10,628 5.0
– real e A$m 11,449 10,397 10,119 10,405 2.8


Market summary
World copper prices have staged a remarkable turnaround in the final
quarter of 2016. The rise has been driven by higher consumption in
China’s construction sector and lower-than-expected mine supply in the
September quarter. Australian production fell 7.6 per cent year-on-year
in the September quarter, but is expected to rise in 2017. Australia’s
copper exports increased by 1 per cent year-on-year in the September
quarter. Copper exports are forecast to increase in 2017–18 with
earnings rising by 13 per cent to 8.6 billion and volumes (in metal-
content terms) increasing 4 per cent to 1 million tonnes .
Prices
Copper prices rebounded sharply as 2016 came to a close
The London Metal Exchange (LME) copper price rose rapidly during
October and November, reaching a one-year high of US$5,935 per
tonne. Several factors contributed to the sudden rise. Expansionary
monetary and fiscal policy in China throughout 2016, greatly improved
demand for copper from the construction sector. Supply disruptions led
to worse-than-expected September quarter output by several key
miners. The possibility of highly stimulatory US fiscal policy in 2017 has
also raised expectations for copper consumption in 2017.
Copper demand remains heavily reliant on government stimulus
programs in countries such as China. Any further depreciation in the
RMB may also subdue Chinese copper demand. Purchasing Managers
Indices in Manufacturing — important leading indicators for copper —
suggest improved economic conditions, at least over the short-term, in
the US, Eurozone and China. The LME price is forecast to average
US$6,000 per tonne in 2017, as demand growth improves — supported
by stronger economic growth in emerging economies. Growing supply is
expected to outweigh demand towards the end of the outlook, and the
price is expected to decline, to average US$5,700 per tonne in 2018.
Several key risks remain to the outlook for copper prices in the near
term. The US dollar is expected to rise, making copper more expensive
to non-US consumers. On the supply side, mine production remains at
an all-time high, and new records are likely to be set, on the back of
mine expansions and restarts.
Figure 12.1: Annual copper prices and stocks
Source: LME (2016) spot price; World Bureau of Metal Statistics (2016) World Metal
Statistics
Figure 12.2: Recent movement in copper prices
Source: LME (2016) official cash copper price
4000
4500
5000
5500
6000
6500
Jun–15 Sep–15 Dec–15 Mar–16 Jun–16 Sep–16 Dec–16U
S$ a
tonne
Daily 100 day moving average
0
2
4
6
8
10
12
14
0
2,000
4,000
6,000
8,000
10,000
12,000
1970 1976 1982 1988 1994 2000 2006 2012 2018
Weeks o
f c
onsum
ption
US
$ a
tonne
Stocks (rhs) Price
Resources and Energy Quarterly December 2016

91
World consumption
Copper consumption increases
World refined copper consumption increased 3 per cent year-on-year in
the September quarter, to over 5.7 million tonnes. September quarter
consumption was lower than the record high set in the June quarter
2016. Consumption is expected to rebound in the December quarter,
taking the total for the year to 23.4 million tonnes, up 3 per cent on 2015.
Copper consumption in China declined 8 per cent quarter-on-quarter in
the September quarter, to 2.8 million tonnes. China’s copper
consumption remains near historic highs, and is expected to increase in
2017. China’s construction sector was boosted by government stimulus
earlier in the year, and construction continued to rise in October. So far
this year, over 137,000 square meters of commercial buildings have
commenced construction — 8 per cent higher than in October last year.
China continues to invest heavily in its power grid, to keep pace with
rising electricity demand. Total capital investment in the power grid
construction was 28 per cent higher than October last year.
In the US, copper consumption declined 2 per cent quarter-on-quarter in
the September quarter. Copper consumption in the US remains 40 per
cent lower than the 2000 peak, largely due to a sectoral shift away from
manufacturing. Despite this long-term trend, recent construction data
points to stronger copper consumption over the outlook period. New
house starts in the US increased by 23 per cent year-on-year in October,
and houses under construction reached an 8-year high. New housing
permits have risen each month since March this year, and reached a
one-year high in October. Rising housing permits indicate that the
construction sector will continue to strengthen as 2017 begins.
In Europe, refined copper consumption declined by 10 per cent quarter-
on-quarter in the September quarter. The decline was due to lower
consumption in Germany and Russia, which fell by 7 and 30 per cent
quarter-on-quarter, respectively. The decline is Russia is largely due to
softer housing construction, which declined by 13 per cent year-on-year
in October.
Figure 12.3: World industrial production and copper consumption
Source: World Bureau of Metal Statistics (2016) World refined copper consumption YoY
% change; World Bank (2016) World industrial production YoY % change
-20
-10
0
10
20
Sep–98 Sep–01 Sep–04 Sep–07 Sep–10 Sep–13 Sep–16
Year-
on-y
ear
% c
hange
Industrial production Refined Consumption
Figure 12.4: Refined quarterly copper consumption
Source: World Bureau of Metal Statistics (2016)
0
700
1,400
2,100
2,800
3,500
0
200
400
600
800
1000
1995 1998 2001 2004 2007 2010 2013 2016
Kiloto
nnes
Kiloto
nnes
Germany Japan USA China (rhs)
Resources and Energy Quarterly December 2016

92
Increased investment in infrastructure and construction in the US and
the emerging economies, is expected to drive much of the growth in
copper consumption over the next two years. Copper consumption is
forecast to rise by 2 per cent in 2017 to 24 million tonnes, and to rise by
a further 3 per cent in 2018, to 24.6 million tonnes.
World production
World mine copper production remains historically high
World mine production was lower than expected in the September
quarter of 2016, but remains high in historical terms. World mined
copper production in 2016 is estimated at 20.1 million tonnes, up 4.5%
on 2015.
Canada, United States, Chile and the Democratic Republic of Congo all
had lower production quarter-on-quarter in the September quarter.
Output at the world’s largest copper mine, Escondida in Chile, declined
by 19 per cent quarter-on-quarter, to 218,000 tonnes. The decline was
due to operational disruptions and lower ore grades. In Kazahstan, the
new Bozshakol and Aktogay mines — operated by KAZ Minerals —
produced a combined 24,000 tonnes of copper in the September
quarter. Bozshakol is expected to produce 100,000 tonnes in 2017, while
Aktogay is expected to be fully operational in the first half of 2017.
Several new, large-scale operations and existing expansions are
expected to commence production in 2018. Notably, First Quantum
Minerals remains on track for a phased commissioning of the Cobre
Panama copper mine in 2018 — expected to produce over 300,000
tonnes annually.
In addition, the current higher copper prices are encouraging producers
to recommence operations. In early December, Glencore announced
their intention to restart the Katanaga mine in the Democratic Republic
of Congo by late 2017, and the recommencement of production at their
Mopani mine in Zambia by late 2018.
As further new mines commence production and others expand, copper
mine production is forecast to rise by 3 per cent in 2017 to 21 million
tonnes, and rise by 4 per cent in 2018 to 21.8 million tonnes.
Figure 12.5: Mine production year-on-year per cent change
Source: World Bureau of Metal Statistics (2016)
Figure 12.6: Global quarterly mine production
Source: World Bureau of Metal Statistics (2016)
-8
-4
0
4
8
12
16
Sep–04 Sep–06 Sep–08 Sep–10 Sep–12 Sep–14 Sep–16
Per
cent
Mine Production YoY
0
500
1,000
1,500
2,000
2,500
3,000
3,500
4,000
Sep–96 Sep–00 Sep–04 Sep–08 Sep–12 Sep–16
Million tonnes
Europe Asia Chile Peru
Resources and Energy Quarterly December 2016

93
World refined copper production rises in September
World refined copper production increased by 4 per cent quarter-on-
quarter in the September quarter, to over 6 million tonnes. Refined copper
output has been boosted by historically high mine supply. Refined copper
output is estimated to have hit a new high of 23.6 million tonnes in 2016.
In the September quarter, refined production in China increased by 8 per
cent quarter-on-quarter, to just under 2.2 million tonnes. Over the past two
decades, Chinese copper producers have greatly expanded their refinery
capacity, from 200,000 tonnes per quarter in 1995 to over 2 million tonnes
per quarter in 2016. In contrast, Chilean refined copper production peaked
at 835,000 tonnes per quarter in 2009, and has since drifted lower. Chile’s
refined copper production fell 3 per cent quarter-on-quarter in the
September quarter, to 639,000 tonnes. Refined production in India
increased 23 per cent quarter-on-quarter in September, to 206,000 tonnes.
World refined production is forecast to increase by 2.5 per cent in 2017, to
24 million tonnes. As world mine supply rises, refined production is
forecast to increase by 4 per cent to 25 million tonnes in 2018.
Australia’s production and exports
Exploration expenditure increases for third consecutive quarter
Australia’s copper exploration expenditure increased by 8 per cent quarter-
on-quarter in the September quarter 2016, to over $35 million. The
increase was largely due to increased expenditure in Queensland and
Western Australia. In South Australia, expenditure declined by 36 per cent
quarter-on-quarter, to $5 million. The decline is attributed to severe
weather during the September quarter. Despite improving each quarter in
2016, copper exploration remains at historically low levels. Current copper
exploration expenditure is around 60 per cent lower than 2012 levels.
Expenditure is expected to rise in 2017, as higher prices in the December
quarter of 2016 and signs of further price rises encourage new exploration.
Production declines in third quarter
Australia’s mine production decreased by 6 per cent quarter-on-quarter, to
227,000 tonnes in the September quarter. The decline was due to lower
production in Queensland and Western Australia. Production in South
Australia and New South Wales was steady.
Figure 12.8: Australia’s copper production
Source: Department of Industry, Innovation and Science (2016)
Figure 12.7: Australia’s copper exploration expenditure
Source: ABS (2016) Mineral and Petroleum Exploration, 8412.0
0
20
40
60
80
100
120
140
Sep–10 Sep–12 Sep–14 Sep–16
A$ m
illio
n
0
200
400
600
800
1000
1200
2005–06 2007–08 2009–10 2011–12 2013–14 2015–16T
onnes
NSW QLD WA SA TAS
Resources and Energy Quarterly December 2016

94
Production at Australia’s largest copper mine, Olympic Dam was 41,000
tonnes in the September quarter. This was down 26 per cent year-on-
year. September quarter output was barely impacted by a State-wide
power outage, which knocked out the mine’s power supply for 15 days
— starting in the last few days of September. Glencore’s Mount Isa
mine in Queensland recorded a 2 per cent quarter-on-quarter drop in
output in the September quarter. OZ Minerals announced the successful
completion of their pre-feasibility study for Carrapateena project. OZ
Minerals expects the mine to produce 61,000 tonnes of copper and
63,000 ounces of gold annually.
Australian production is forecast to decline by 2 per cent in 2016–17, to
951,000 tonnes. Production at Olympic Dam is expected to rise over the
outlook period, as zones of higher grade ore are mined. Additional
supply from CuDeco’s Rocklands and REX Minerals Hillside operations
are expected to contribute to higher production in 2017. Production is
forecast to increase by 4.4 per cent in 2017–18, to 994,000 tonnes.
Refined copper exports fall
Australia’s copper export earnings declined by 8 per cent quarter-on-
quarter in the September quarter, to $1.1 billion. The decline was due to
lower export volumes of copper ores and concentrates, which fell by 6
per cent in the September quarter, to 424,000 tonnes. The quarterly
decline was driven by lower export volumes of copper ores and
concentrates to China, Japan, South Korea and Taiwan. Exports of
copper ores and concentrates to the Philippines and India rose by
40,000 and 27,000 tonnes, respectively. Exports to the Philippines were
impacted by lower domestic production. The decline in exports to China
is expected to be reversed over the outlook period.
Australia’s copper exports (in metal-content terms) are forecast to
decline by 6.7 per cent in 2016–17, to 981,000 tonnes. Copper exports
remain supported by historically high consumption in China, which
accounts for 47 per cent of Australia’s copper exports. Australia’s
copper exports are forecast to decrease by 6.5 per cent in 2016–17 to
$7.6 billion, due to lower output. Copper exports are forecast to rise by 4
per cent in 2017–18, to 1 million tonnes (in metal-content terms). These
exports will be valued at $8.6 billion (up 13 per cent).
Figure 12.9: Australia’s annual copper exports
Source: Department of Industry, Innovation and Science (2016)
0
2,000
4,000
6,000
8,000
10,000
2005–06 2008–09 2011–12 2014–15 2017–18
0
200
400
600
800
1,000
1,200
2015–16 A
$ m
illio
n
Thousand tonnes
Volume Value
Figure 12.10: US dollar versus Australian dollar copper price
Source: LME (2016) official cash copper price; Bloomberg (2016) AUD/USD exchange
rate
4,000
5,000
6,000
7,000
8,000
9,000
Apr–15 Aug–15 Dec–15 Apr–16 Aug–16 Dec–16D
ollars
Spot price US$ Spot price A$
Resources and Energy Quarterly December 2016

95
Table 12.1: Copper outlook
Notes: b In current calendar year US dollars; c Quantities refer to gross weight of all ores and concentrates; d In current financial year Australian dollars; f Forecast; s Estimate.
Source: Sources: ABS (2016) International Trade, 5465.0; LME (2016) spot price; World Bureau of Metal Statistics (2016) World Metal Statistics; Department of Industry, Innovation and
Science.
World Unit 2015 2016 2017 f 2018 f Per cent change
Production
– mine kt 19,330 20,203 20,820 21,670 4.1
– refined kt 23,052 23,589 23,943 24,921 4.1
Consumption kt 22,757 23,419 24,200 24,632 1.8
Closing stocks kt 924 1,095 838 1,126 34.4
– weeks of consumption 2.1 2.4 1.8 2.4 32.0
Price
– nominal US$/t 5,678 4,828 6,000 5,700 –5.0
US$/lb 258 219 272 259 –5.0
– real b US$/t 5,743 4,828 5,871 5,457 –7.0
US$/lb 261 219 266 248 –7.0
Australia 2014–15 2015–16 2016–17 f 2017–18 f Per cent change
Mine output kt 955 969 951 994 4.4
Refined outputkt
454 509 496 478 –3.6
Exports
– ores and cons c kt 2,056 1,872 1,738 1,906 9.6
– refined kt 423 507 463 462 –0.3
Export value
– nominal A$m 8,468 8,105 7,579 8,549 12.8
– real d A$m 8,727 8,239 7,579 8,369 10.4
Resources and Energy Quarterly December 2016


Resources and Energy Quarterly December 2016 97
Market summary
Australia’s nickel export earnings are forecast to decrease by 9 per cent
in 2016–17, to $2.2 billion. Despite the recent rally in the nickel price, the
decline in export earnings is underpinned by weak domestic production,
with several operations placed on care and maintenance earlier in the
year. A recovery in Australia’s nickel exports earnings is expected in
2017–18, with export values forecast to increase by 27 per cent, to $2.9
billion. The rise in export earnings will be driven by a forecast increase in
the price and the ramp up of production at the new Nova mine.
Prices and stocks
Nickel price forecast to increase over the outlook period
The London Metal Exchange (LME) nickel price steadily increased over
the four months to November, averaging US$10,479 a tonne. By the end
of November, the price had reached a 14 month high of US$11,583 a
tonne. The price rallied following concerns of supply side disruptions —
after the suspension of operations at nickel mines in the Philippines —
and as the market examined the implications for demand of Donald
Trump’s presidency win for US infrastructure spending. The price was
also buoyed by stainless steel production growth in China.
While stocks remain relatively high — with combined LME and SHFE
stocks at 471,000 tonnes at the start of December — there were 11
consecutive weeks of declining stocks to the start of December, the first
substantial decline since SHFE nickel trading commenced in April 2015.
China’s port stocks of nickel have also declined, down by 3.7 per cent to
15,200 tonnes at the end of November.
The nickel price is forecast to increase modestly through the outlook
period, averaging US$11,050 a tonne in 2017 and US$11,900 a tonne in
2018, driven by a tightening market. The risks are to the upside on these
forecasts. Consumption growth will be supported by continued
infrastructure investment in China, India and the United States, and
strong growth in stainless steel production in China. Disruptions to mine
supply from the Philippines will also provide support to the price.
However, there is uncertainty around the enforcement of mine
suspensions in the Philippines, and the pace at which output from newly
built smelters can grow in Indonesia.
Figure 13.1: Nickel LME spot price
Source: Bloomberg (2016) London Metal Exchange
Figure 13.2: Nickel stocks and price
Source: Bloomberg (2016) London Metal Exchange; International Nickel Study Group
(2016); Department of Industry, Innovation and Science (2016)
0
5,000
10,000
15,000
20,000
25,000
Jan-13 Jul-13 Jan-14 Jul-14 Jan-15 Jul-15 Jan-16 Jul-16
US
$ a
tonne
0
2
4
6
8
10
12
14
16
0
5,000
10,000
15,000
20,000
25,000
30,000
35,000
40,000
2000 2003 2006 2009 2012 2015 2018
Weeks o
f consum
ption
US
$ a
tonne
Weeks of consumption (rhs) Price

Resources and Energy Quarterly December 2016 98
World consumption
World nickel consumption to grow through 2017 and 2018
World refined nickel consumption is estimated to have increased by 6.0
per cent in 2016, to just over 2 million tonnes. Consumption is forecast
to increase by 2.4 per cent and 3.3 per cent in 2017 and 2018,
respectively, to 2.1 million tonnes.
World refined nickel consumption increased by 7.9 per cent year-on-year
to 500,000 tonnes in the September quarter. The rise was primarily
driven by increased consumption from China, up 11 per cent year-on-
year, to 268,000 tonnes. China’s production of nickel-bearing stainless
steel — which accounts for about 65 per cent of nickel use — increased
by 15 per cent year-on-year in the September quarter, supported by the
resurgence of the construction sector, higher infrastructure investment
and increased production of automobiles, machinery and appliances.
Increased consumption in the United States (up 5.7 per cent year-on-
year in the September quarter) has been supported by firm domestic
stainless steel production. Anti-dumping measures on a range of
stainless steel productions has resulted in imports of stainless steel
products declining by 27 per cent year-on-year in the September
quarter.
While world nickel consumption is forecast to grow at a more moderate
pace over the outlook period — weighed down by slowing residential
construction activity in China — this is expected to be offset by
increased demand for higher quality stainless steels and alloys in
infrastructure investment in China, India and the United States.
World production
World mine production supported by ramp up in Indonesia and New
Caledonia
World mine production is estimated to have decreased by 6.2 per cent in
2016, to just over 2 million tonnes. Mine output is forecast to increase by
3.9 per cent and 1.7 per cent in 2017 and 2018, respectively, to 2.1
million tonnes.
World mine production declined by 1.0 per cent year-on-year in the
September quarter, to 568,000 tonnes. Declining production in Russia
and Australia was partially offset by increased production in New
Caledonia (up 29 per cent to 58,000 tonnes) and Indonesia (up 39 per
cent to 45,000 tonnes). Production also increased in the Philippines (up
9.5 per cent to 170,000 tonnes), despite 18 mines being recommended
for suspension following an environmental audit earlier in the year.
The actual effect of these Filipino suspensions on mined nickel exports
over the outlook period, and consequently, whether there will be a
shortage of mined supply, depends on how the Philippines government
enforces the suspensions. If they are enforced, it then becomes a matter
of whether the affected mines can address issues and resume
operations ahead of the mid-year seasonal ramp up of production.
Nevertheless, increased mine output over the outlook period will be
driven by increased production in New Caledonia and Indonesia, as
mines continue to ramp up.
Figure 13.3: World refined nickel consumption
Source: International Nickel Study Group (2016); Department of Industry, Innovation and
Science (2016)
0.0
0.5
1.0
1.5
2.0
2.5
2008 2010 2012 2014 2016 2018M
illion tonnes
China EU US Japan South Korea India Rest of world

Resources and Energy Quarterly December 2016 99
World refined production forecast to grow in 2017 and 2018
World refined production is estimated to have decreased by 2.8 per cent
in 2016, but is forecast to increase by 2.3 per cent annually in 2017 and
2018, to just over 2 million tonnes.
World production of refined nickel decreased 0.2 per cent year-on-year
in the September quarter, to 492,000 tonnes. Production increased in
Indonesia (up 191 per cent to 27,000 tonnes) and New Caledonia (up 30
per cent to 26,000 tonnes). There was a substantial decline in Russia’s
nickel production (down 24 per cent to 43,500 tonnes), as Norilsk Nickel
decommissioned their nickel plant, as part of an ongoing plan to upgrade
facilities.
Growth in refined nickel production over the outlook period will be
supported by the continued ramp up of operations in Indonesia, however
power shortages, poor infrastructure and other issues will constrain the
pace of this growth.
Australia’s exploration, production and exports
Exploration activity remains subdued
Exploration expenditure remains at historical lows as a result of low
nickel prices, which have reduced the feasibility of new projects and
incentives to explore. Nickel and cobalt exploration expenditure
increased 16 per cent quarter-on-quarter in the September quarter, to
$12.3 million. The year-on-year move was a decline of 16 per cent in the
September quarter.
Mine production boosted by new Nova mine
Australia’s mined nickel production decreased by 21 per cent year-on-
year in the September quarter to 46,000 tonnes, and is forecast to
decline by 7.4 per cent to 200,000 tonnes in 2016–17. Production at
Glencore’s Murrin Murrin operation declined in the September quarter,
due to lower grades. Panoramic Resources’ and Mincor’s nickel mines
were placed on ‘care and maintenance’ earlier in the year, with the
companies focused on preserving cash balances and cutting costs.
Partially offsetting this was increased production at BHP Billiton’s Nickel
West operations, due to higher grade ore at Mt Keith, the ramp up of
mining at Leinster, and the ramp up of Independence Group’s new Nova
mine (which began production in the December quarter).
Mined nickel production is forecast to increase by 17 per cent in 2017–
18, to 234,000 tonnes. The Nova mine is expected to reach full capacity
by mid-2017. Poseidon Nickel’s Silver Swan mine is also expected to
commence production, with the company progressing key pre-
production activities, pending a sustained recovery in the nickel price.
Export volumes and values
The effects of mines and refineries being placed on ‘care and
maintenance’ — due to low prices — has been reflected in declining
nickel exports. In the September quarter, Australia’s nickel exports
declined by 29 per cent year-on-year to 42,000 tonnes (metal content),
while the value of Australia’s exports declined by 43 percent to $448
million. Export values in 2016–17 as a whole are forecast to decline by 9
per cent to $2.2 billion, due to declining volumes (down by 14 per cent to
186,000 tonnes).
A recovery in Australia’s nickel exports is expected in 2017–18, with
export values forecast to increase by 27 per cent to $2.9 billion,
supported by increasing export volumes (up 18 per cent to 219,000
tonnes) and higher forecast prices.
Figure 13.4: Australia’s nickel export volumes and values
Source: ABS (2016) International trade in goods and services, cat. no. 8412.0;
Bloomberg (2016) London Metal Exchange; Department of Industry, Innovation and
Science (2016)
0
1
2
3
4
5
6
0
50
100
150
200
250
300
350
2007–08 2009–10 2011–12 2013–14 2015–16 2017–18
2016–17 A
$ b
illion
Thousand tonnes
Volume Value (rhs)

Resources and Energy Quarterly December 2016 100
Table 13.1: Nickel outlook
Notes: b In current calendar year US dollars c Nickel content of domestic mine production d Includes metal content of ores and concentrates, intermediate products and nickel metal
e In current financial year Australian dollars f forecast s estimate
Source: ABS (2016) International Trade in Goods and Services, cat. No. 5368.0; Company reports and presentations; International Nickel Study Group (2016); Bloomberg (2016) London Metal
Exchange; World Bureau of Metal Statistics (2016); Department of Industry, Innovation and Science (2016)
World unit 2015 2016 s 2017 f 2018 f Per cent change
Production
– mine kt 2,147 2,009 2,076 2,135 2.8
– refined kt 1,979 1,923 1,976 2,022 2.3
Consumption kt 1,890 2,003 2,051 2,117 3.3
Stocks kt 554 473 399 304 –23.8
– weeks of consumption 15.2 12.3 10.1 7.5 –26.2
Price LME
– nominal US$/t 11,839 9,559 11,050 11,900 7.7
USc/lb 537 434 501 540 7.7
– real b US$/t 11,975 9,559 10,812 11,393 5.4
USc/lb 543 434 490 517 5.4
Australia unit 2014–15 2015–16 2016–17 f 2017–18 f Per cent change
Production
– mine cs kt 245 216 200 234 17.0
– refined kt 115 128 111 112 0.4
– intermediate kt 82 53 39 44 12.0
Export volume ds kt 255 215 186 219 18.1
– nominal value s A$m 3,583 2,478 2,245 2,855 27.2
– real value es A$m 3,692 2,519 2,245 2,795 24.5


Resources and Energy Quarterly December 2016 102
Market summary
Zinc prices have rallied noticeably further since the last Resources and
Energy Quarterly, providing Australian miners with a greater incentive to
restart idled capacity and lift output.
Australia’s current zinc exports remains relatively weak, following the
closure of MMG’s Century mine in late 2015. In 2015–16, mined zinc
production in Australia decreased by 28 per cent. Export volumes of ore
and concentrates fell by 24 per cent to 2.2 million tonnes and export
earnings declined by 15 per cent, to $2.6 billion. Export earnings are
forecast to remain roughly stable in 2016–17 and 2017–18, with price
effects making up for lower volumes.
Prices
Zinc prices outperform as demand outstrips supply
LME zinc prices rose strongly in October and November, almost
reaching US$3,000 a tonne at their peak. Helping to drive the rally was
speculation that a surge in US infrastructure spending would see
shortages in the market. The market is now focusing on the likelihood of
Glencore soon reversing the mine production closures/cutbacks it
implemented in 2015.
After a decline in the early part of the year, SHFE zinc stocks are
decreasing, edging down 1.0 per cent year-on-year in value terms over
the first 11 months of 2016. SHFE stocks reached a 9-month low at the
end of August, falling to 190,579 tonnes.
Prices are expected to average just over US$2,000 a tonne over 2016.
This represents an upward revision from the September edition.
From current levels, the risks to the price outlook are definitely to the
downside, with the potential for a supply response from new or existing
mines. The price of zinc is forecast to remain relatively high in 2017, with
a year-on-year increase of 6.2 per cent (to an average of US$2,138 a
tonne) expected. Average prices are subsequently expected to edge
down, to just under $2,000 over 2018.
Figure 14.1: Zinc daily price
Source: LME (2016) zinc spot price
1,200
1,600
2,000
2,400
2,800
Dec-11 Dec-12 Dec-13 Dec-14 Dec-15 Dec-16
US
$ a
tonne
LME spot price 90 day moving
Figure 14.2: Annual zinc prices and weeks of stocks
Source: LME (2016) zinc spot price; Department of Industry, Innovation and Science
(2016)
0
1,000
2,000
3,000
4,000
0
2
4
6
8
10
2002 2004 2006 2008 2010 2012 2014 2016 2018
2016 U
S$ a
tonne
Weeks o
f sto
cks
Stocks (lhs) Price (rhs)

Resources and Energy Quarterly December 2016 103
World consumption
Global zinc consumption to ease
World refined zinc consumption is estimated to have eased slightly in
2016, to 13.4 million tonnes. This represents a 2.8 per cent decline from
the total for 2015, with the result largely driven by lower demand in China.
China accounts for almost half of global zinc demand, and slowing
momentum in the Chinese construction sector is reducing demand for a
range of metal inputs.
In 2017, zinc consumption is expected to decline by a further 3.5 per cent,
as Chinese demand continues to decline. Over the longer term, demand in
India is likely to play a greater role, with a significant pipeline of
construction emerging across many Indian cities. Increased demand
globally for zinc as an alloy for automotive, electrical and household
materials is also expected to provide longer-term support for zinc
producers.
World production
Global mined zinc production to edge down in 2017
Global zinc production is estimated to have declined by 2.1 per cent in
2016, to 13.2 million tonnes. This reflects a range of mine closures and
production cuts by major zinc producers, in response to soft prices in 2015.
Glencore’s decision to close 500,000 tonnes of zinc capacity from its
operations — in Australia, Kazakhstan and the US — from the second half
of 2015, has contributed to the fall in global output.
In 2017, zinc production is forecast to decline by a further 3.9 per cent, to
12,666 tonnes. Most of the decline is expected to come about due to lower
production in China, with some offsetting rises occurring in Australia,
Canada and non-China Asia. Ongoing falls in Chinese output are expected
to reduce global production to 12,165 tonnes in 2018.
Production risks are primarily weighted to the upside: should Glencore
resume production at its partially closed mines — in response to higher
zinc prices — an additional 500,000 tonnes of capacity may re-enter the
market.
Recovering ore and concentrate supply supports refined production
World refined zinc production is estimated to have declined by 2.9 per cent
in 2016, reflecting a reduced availability of zinc ore and concentrates. In
particular, production in India has dropped sharply, as a result of low
output from Vedanta’s mines and smelters. Longer term production of zinc
ore and concentrates production will rely, in part, on the recovery in zinc
prices being sustained.
Australia’s zinc exploration, production and exports
Exploration expenditure was modest in the September quarter
Australia’s expenditure on silver, lead and zinc exploration totalled $11.9
million in the September quarter 2016. This is virtually unchanged from the
June quarter, but down by 27 per cent from a year ago. Exploration
remains relatively low, reflecting uncertainty over long-term prices.
0
500
1,000
1,500
2,000
2,500
0
5
10
15
20
25
Sep-11 Sep-12 Sep-13 Sep-14 Sep-15 Sep-16
US
$ a
tonne
A$ m
illio
n
Silver, lead, and zinc exploration expenditure Zinc price (rhs)
Source: ABS (2016) Mineral and Petroleum Exploration, 8412.0; LME (2016) zinc spot
price

Resources and Energy Quarterly December 2016 104
Australia’s mined zinc production reduced with Century mine closure
Australia’s mined zinc production fell by just over one-quarter in 2015–
16, to 1.2 million tonnes (metal content). Driving the decline was the
processing of final ores from the Century mine in January 2016, and the
curtailment of production at other mines — in response to low prices.
However, the recent price response to global production cuts has
encouraged Australia’s mined zinc producers to boost output in the
September quarter 2016. Production in the September quarter increased
by 4.2 per cent quarter on quarter, to 210,000 tonnes. Glencore’s Mount
Isa mine increased its production by 13 per cent in the quarter, while the
Independence Group’s Jaguar mine increased its production by 15 per
cent.
In 2016–17, Australia’s mined zinc production is forecast to decrease by
22 per cent to 0.9 million tonnes, as the full effects of MMG’s Century
mine closure and curtailed production at other mines are realised. Risks
are balanced to the upside, with the potential for Glencore to boost its
capacity in Australia in response to higher prices. Production in 2017–18
is expected to lift by around 2.5 per cent.
Australia’s refined production remains flat
Australia’s refined zinc production increased 8 per cent in the September
quarter 2016 to 120 thousand tonnes, driven up by rising output from the
Nyrstar Hobart smelter and Korea Zinc Townsville smelter. Refined
production for 2015–16 declined by 8 per cent to nearly 459,000 tonnes.
Australia’s refined zinc production is forecast to edge up by 1.7 per cent
in 2016–17. Production over 2017–18 is expected to be roughly stable,
at around 463,000 tonnes, as the redevelopment of Nyrstar’s Port Pirie
smelter offsets declines in output elsewhere.
Australia’s zinc exports are constrained due to mine closures
In 2016–17, Australia’s zinc export volumes are forecast to decline by 9
per cent to 918,000 tonnes, due to supply constraints. However, export
earnings are forecast to actually lift slightly, due to the rally in the price.
Exports are expected to recover in volume terms in 2017–18, with an
increase to 1.021 million tonnes forecast. This may understate total
exports, should Glencore resume activity at its Australian mines.
Figure 14.4: Australia’s mine production by state
Source: Company reports; Department of Industry, Innovation and Science (2016)
0
200
400
600
800
1,000
1,200
1,400
1,600
1,800
2001–02 2005–06 2009–10 2013–14 2017-18
Thousand tonnes
QLD NT NSW WA TAS SA
Figure 14.5: Australia’s zinc exports
0
1,200
2,400
3,600
4,800
6,000
0
400
800
1,200
1,600
2,000
2001–02 2005–06 2009–10 2013–14 2017-18
2016-1
7 A
$ b
illion
Thousand tonnes
Volume Value (rhs)
Source: ABS (2016) International Trade in Goods and Services, 5368.0; Department of
Industry, Innovation and Science (2016)

105
Table 14.1: Zinc outlook
Notes: b In current calendar year US dollars; c Quantities refer to gross weight of all ores and concentrates; d In current financial year Australian dollars; f Forecast s estimate
Source: ABS (2016) International Trade in Goods and Services, 5368.0; Company reports; International Lead Zinc Study Group (2016); London Metal Exchange (2016); World Bureau of Metal
Statistics (2016); Department of Industry, Innovation and Science (2016)
World unit 2015 2016 s 2017 f 2018 f Per cent change
Production
– mine kt 13,464 13,180 12,666 12,165 -4.0
– refined kt 13,897 13,361 12,893 12,445 -3.5
Consumption kt 13,747 13,361 12,893 12,445 -3.5
Stocks kt 1,570 1,694 1,604 1,593 0.0
– weeks of consumption 6.0 6.3 5.8 5.7 3.6
Price LME
– nominal US$/t 1,932 2,013 2,138 1,979 -7.4
USc/lb 88 91 97 90 -7.4
– real b US$/t 1,944 2,012 2,118 1,940 -8.4
USc/lb 88 91 96 88 -8.4
Australia unit 2014–15 2015–16 2016–17 f 2017–18 f Per cent change
Mined output kt 1,656 1,197 939 963 2.5
Refined output kt 501 459 467 463 -0.9
Export volume
– ore and conc. c kt 2,919 2,226 2,134 2,373 11.2
– refined kt 329 497 315 326 3.3
– total metallic content kt 1,389 1,009 918 1,021 11.3
Export value
– nominal A$m 3,073 2,626 2,582 2,552 -3.1
– real d A$m 3,116 2,627 2,595 2,467 -4.9
Resources and Energy Quarterly December 2016


Source: ABS (2016) International Trade in Goods and Services, 5368.0
Source: ABS (2016) International Trade in Goods and Services, 5368.0Source: ABS (2016) International Trade in Goods and Services, 5368.0
Figure 15:1: Contribution to GDP
Note: GDP levels are chain volume measures. Industry shares are in current prices.
Source: ABS(2016) Australian National Accounts, National Income, Expenditure &
Production, 5204.0.
37
107
59
26 6 8
62
0
20
40
60
80
Agriculture,forestry and
fishing
Mining Manufacturing Building andconstruction
Services
Per
cent
2005–06 2015–16
GDP: $1228.9 b
GDP: $1617 b
14 1410
6 5 4 4
43
23
117 6 5 5 4
39
0
40
80
ChinaUnited States
JapanThailand
GermanySouth Korea
MalaysiaOther
Per
cent
2005-06 2015-16
Imports: $218.4 b
Imports: $267.5 b
Figure 15.2: Principal markets for Australia's total imports, 2016–17
dollars
35
23
85
9
26
20
14 1311 10
5 4
16
28
0
10
20
30
40
South KoreaJapan
SingaporeMalaysia
IndonesiaMiddle East
Other AsiaOther
Per
cent
2005-06 2015-16
Imports: $40.7 b
Imports: $38 b
Figure 15.3: Principal markets for Australia’s resources and energy
imports, 2016–17 dollars
20
128 6 6 5 5
38
31
14
7 5 4 4 4
31
0
20
40
60
China Japan SouthKorea
UnitedStates
India NewZealand
UnitedKingdom
OtherP
er
cent
2005-06 2015-16
Exports: $198.8 b
Exports: $247.3 b
Figure 15.4: Principal markets for Australia's total exports, 2016–17
dollars
107Resources and Energy Quarterly December 2016
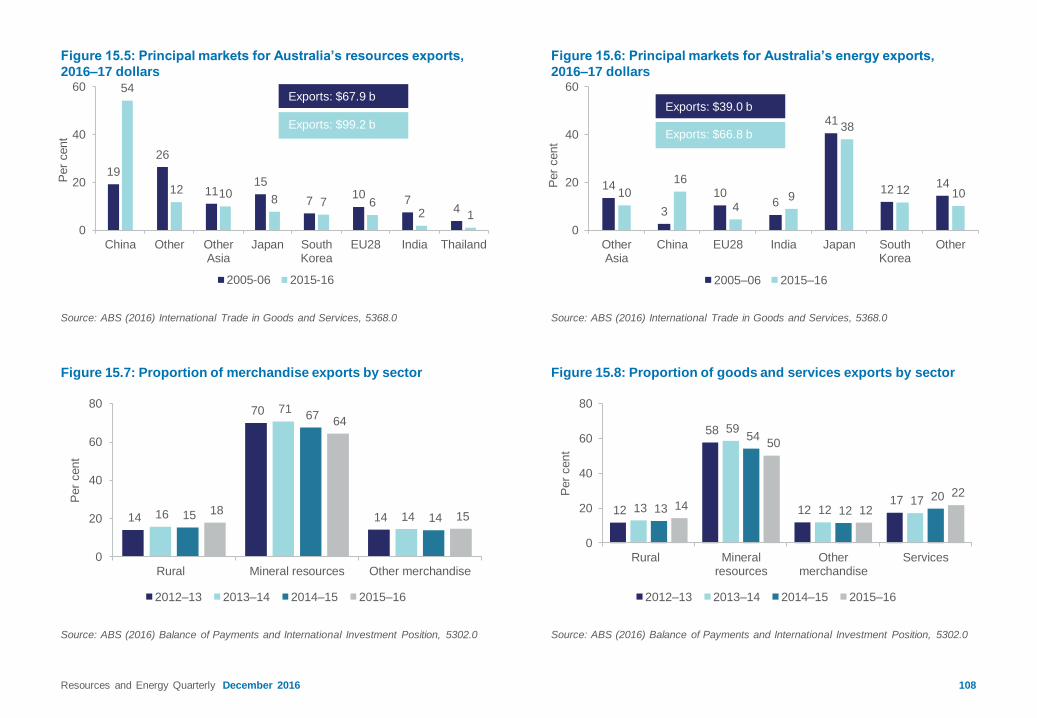
108
Source: ABS (2016) International Trade in Goods and Services, 5368.0
Figure 15.8: Proportion of goods and services exports by sector
Source: ABS (2016) Balance of Payments and International Investment Position, 5302.0
Figure 15.7: Proportion of merchandise exports by sector
Source: ABS (2016) Balance of Payments and International Investment Position, 5302.0
Source: ABS (2016) International Trade in Goods and Services, 5368.0
19
26
1115
710
74
54
12 108 7 6
2 1
0
20
40
60
China Other OtherAsia
Japan SouthKorea
EU28 India Thailand
Per
cent
2005-06 2015-16
Exports: $67.9 b
Exports: $99.2 b
Figure 15.5: Principal markets for Australia’s resources exports,
2016–17 dollars
14
3
106
41
1214
1016
49
38
12 10
0
20
40
60
OtherAsia
China EU28 India Japan SouthKorea
Other
Per
cent
2005–06 2015–16
Exports: $39.0 b
Exports: $66.8 b
Figure 15.6: Principal markets for Australia’s energy exports,
2016–17 dollars
14
70
1416
71
1415
67
1418
64
15
0
20
40
60
80
Rural Mineral resources Other merchandise
Per
cent
2012–13 2013–14 2014–15 2015–16
12
58
1217
13
59
1217
13
54
12
2014
50
12
22
0
20
40
60
80
Rural Mineralresources
Othermerchandise
ServicesP
er
cent
2012–13 2013–14 2014–15 2015–16
Resources and Energy Quarterly December 2016

Resources and Energy Quarterly December 2016 109
Table 15.2: Principal markets for Australia’s metallurgical coal exports, 2016–17 dollars
Source: ABS (2016) International Trade in Goods and Services, 5368.0
Table 15.1: Principal markets for Australia’s thermal coal exports, 2016–17 dollars
Source: ABS (2016) International Trade in Goods and Services, 5368.0
unit 2011–12 2012–13 2013–14 2014–15 2015–16
Japan $m 9,046 8,327 8,040 7,317 6,955
South Korea $m 3,216 2,912 2,892 2,738 2,549
China $m 2,993 3,077 3,621 2,820 1,761
Taiwan $m 2,001 1,792 1,731 1,822 1,602
Malaysia $m 392 292 361 602 487
Thailand $m 188 255 302 281 319
Total $m 18,850 17,409 17,510 16,548 14,942
unit 2011–12 2012–13 2013–14 2014–15 2015–16
India $m 7,115 4,939 5,043 5,169 4,691
Japan $m 9,714 6,412 5,765 4,755 4,433
China $m 3,946 4,958 6,139 4,920 3,939
South Korea $m 4,218 2,616 2,576 2,453 2,122
Taiwan $m 2,023 1,243 1,221 1,175 987
Netherlands $m 1,396 1,047 1,052 858 930
Total $m 33,805 24,154 24,375 22,479 20,130

Resources and Energy Quarterly December 2016 110
Table 15.4: Principal markets for Australia’s gold exports, 2016–17 dollars
Source: ABS (2016) International Trade in Goods and Services, 5368.0
Table 15.3: Principal markets for Australia’s oil and gas exports, 2016–17 dollars
Source: ABS (2016) International Trade in Goods and Services, 5368.0
unit 2011–12 2012–13 2013–14 2014–15 2015–16
Japan $m 14,202 15,537 16,595 15,644 11,638
China $m 3,998 2,918 830 1,147 4,064
South Korea $m 1,919 2,335 1,481 1,336 2,331
Singapore $m 3,004 2,897 2,408 2,217 899
Thailand $m 1,076 886 1,720 1,306 710
India $m 651 380 526 399 673
Total $m 27,400 27,784 30,067 27,162 22,910
unit 2011–12 2012–13 2013–14 2014–15 2015–16
China $m 4,693 6,444 8,474 7,166 8,909
United Kingdom $m 4,980 2,817 671 601 4,004
Singapore $m 1,236 1,017 2,383 3,209 1,215
Thailand $m 1,770 1,368 466 925 258
Switzerland $m 37 308 361 15 76
Turkey $m 71 502 563 162 49
Total $m 17,026 16,210 13,637 13,446 15,932

Resources and Energy Quarterly December 2016 111
Table 15.6: Principal markets for Australia’s aluminium exports, 2016–17 dollars
Source: ABS (2016) International Trade in Goods and Services, 5368.0
Table 15.5: Principal markets for Australia’s iron ore exports, 2016–17 dollars
Source: ABS (2016) International Trade in Goods and Services, 5368.0
unit 2011–12 2012–13 2013–14 2014–15 2015–16
China $m 47,861 45,152 59,778 43,389 39,381
Japan $m 11,975 9,276 10,130 6,901 4,766
South Korea $m 7,121 5,305 6,391 4,171 3,099
Taiwan $m 1,976 1,611 1,792 1,337 1,038
Indonesia $m 0 0 116 220 184
India $m 0 51 43 112 6
Total $m 69,037 61,449 78,270 56,184 48,554
unit 2011–12 2012–13 2013–14 2014–15 2015–16
South Korea $m 645 729 714 792 1,133
Japan $m 1,456 1,081 1,168 1,501 708
Taiwan $m 409 491 465 504 303
Thailand $m 361 392 318 295 273
China $m 209 161 244 52 95
Indonesia $m 333 268 205 141 96
Total $m 4,181 3,528 3,647 3,940 3,291

Resources and Energy Quarterly December 2016 112
Table 15.7: Principal markets for Australia’s copper exports, 2016–17 dollars
Source: ABS (2016) International Trade in Goods and Services, 5368.0
unit 2011–12 2012–13 2013–14 2014–15 2015–16
China $m 2,749 3,269 4,128 3,757 3,642
Japan $m 1,636 1,739 1,703 2,050 1,452
Malaysia $m 773 728 641 543 627
India $m 1,598 1,195 991 828 520
South Korea $m 948 472 613 376 498
Philippines $m 21 151 299 265 225
Total $m 9,361 8,660 9,126 8,727 8,258