information technology exports and regional … 4.pdf · better understand the competitive effect...
TRANSCRIPT

Asia-Pacific Development Journal Vol. 24, No. 1, June 2017
83
INFORMATION TECHNOLOGY EXPORTS AND REGIONAL
DEVELOPMENT IN THE LEADING STATES:
A SHIFT-SHARE ANALYSIS OF INDIA
Girija V. Nachnani and A.M. Swaminathan*
India has adopted a balanced growth strategy driven by its large internalmarket, which entails making a major commitment to the endogenousdevelopment model. Previously, the country’s development plans werebuilt around the supply-side and import substitution approach. In theearly 1980s, the economy of India experienced structural changes, as thegross domestic product growth rate steadily increased, and then in theearly 1990s, the country leapfrogged into a development policy centredon information technology, which led to the development of a globallycompetitive information technology (IT) sector. IT has helped states inIndia to develop through intersectoral linkages with several services andthe multiplier effect. This makes it interesting to review the impact ofgrowth of IT on development in states where IT development isprominent. As states have not been equal beneficiaries, a shift-shareanalysis was carried out to arrive at these imbalances for the period2004/05-2008/09 and 2009/10-2013/14. The results of a shift in the shareshow that regional variations in software exports can largely be attributedto a regional component. In addition, the results of ordinary least squaresestimation point out that existing infrastructure is overstressed, namelythat there is excessive pressure on teledensity, a shortage of power anda large population, which is making it difficult for regions to sustaina high level of specialization.
* Girija V. Nachnani, Associate Professor and Research Scholar, Smt. MMK College of Commerce andEconomics, Mumbai – 400050 (e-mail: [email protected]), and A.M. Swaminathan, AssociateProfessor, Mumbai School of Economics and Public Policy (Autonomous), University of Mumbai, thirdfloor, Ranade Bhavan, Vidyanagari post, Mumbai – 400098 (e-mail: [email protected]).
Asia-Pacific Development Journal Vol. 24, No. 1, June 2017
84
JEL classification: L69, R10, R11, R15.
Keywords: Information technology, leading states, regional imbalance, shift-share,
Granger causality.
I. INTRODUCTION
The major theoretical concepts and planning applications from the mid-
twentieth century originated from Rostow (1960), who dealt with a five-stage model of
economic development, Perroux (1950), who pioneered the growth pole theory, and
Hirschman (1958), who focused on balanced verses unbalanced growth, and in the
1970’s, the East Asia export promotion model. About that time, the neoclassical
growth theory emphasized that growth and development were largely a function of
labour and capital factor price differentials, that is, comparative advantage among
countries and/or regions. Later, Solow (1959) showed that factor price differentials
account for only about 50 per cent of the variance in economic growth, while the other
50 per cent was because of technological change. However, in the mid-1980s, the
“New Growth Theory”, as it is now called, focused on endogenous factors, that is,
local conditions, such as leadership, labour force characteristics, innovation patterns
and institutional capacity. Throughout that time, supply side or hard infrastructure,
including social overhead investment in human capital (education and training), was
the primary focus.
Contrary to those prevailing models, India implemented a different course of
action. It adopted a balanced growth strategy driven by the country’s large internal
market. In contemporary terms, this was a very large commitment to an endogenous
model for its development strategy. For the first 40 years, the five-year development
plans were built around a largely supply-side and import substitution approach. During
that period, the economy went through changes with the gross domestic product
(GDP) growth rate steadily increasing from an average of 3.5 per cent per year during
the first three decades of planning (1950 to 1980) to 5.4 per cent during the 1980s.
The reforms in the 1990 have led to positive growth results. The country’s GDP
increased from 5.7 per cent during the 1990s to slightly little less than 8 per cent
during the 2000s. Its average annual rate of real per capita income growth also
increased from about 1.3 per cent in the 1960s and 1970s to about 3.6 per cent in the
1990s and 5.9 per cent in the 2000s (India, Planning Commission, 2013).
During the early 1990s, India leapfrogged in a significant way into IT-oriented
economic development (although the origins of this industry can be traced to the
mid-1980s). It developed a globally competitive information technology (IT) services
Asia-Pacific Development Journal Vol. 24, No. 1, June 2017
85
industry, which has continued to grow. The generic term “information technology”
sector broadly consists of three segments: (a) IT software: software customization,
such as coding and testing, IT consulting, system integration, network infrastructure
management and product development; (b) business process management, which
covers back office jobs, starting from low-end functions, such as call centres and
routine data processing, to more knowledge-intensive applications related to, for
example, engineering design, multimedia and graphics, medical and legal
transcriptions, insurance claim processing and inventory management; and (c) IT
hardware, such as assembling of computers and peripherals.
The key verticals of the IT industry, namely banking, financial services and
insurance, telecom, government, manufacturing, education and health care, are
driving growth across sectors. Research studies by Arora and Athreye (2002), Kumar
(2005) and Chatterji (2013) reviewed the potential of the IT industry as a tool for
development. IT has been instrumental in supporting the development of different
states in India, but not all states in the country have benefited from it. As IT is directly
related to trade and communication and indirectly related to a number of sectors,
including among them, transportation, banking and insurance, the development of the
IT sector clearly leads to the development of related sectors, such as travel, tourism,
real-estate, education and e-governance. This, in turn, benefits the local community
and business through the generation of additional economic opportunities, jobs and
incomes. Therefore, the present study is aimed at studying the impact of the growth of
the IT sector on the regional development in different states. Using a shift-share
analysis for two periods, 2004/05 to 2008/09 and 2009/10 to 2013/14, for the top ten
IT-exporting states, and with the results of the shift-share analysis using the ordinary
least squares method, the study looks into the imbalances stemming from the impact
of IT and the causes behind them. Thus, this study provides a picture of regional
development in these areas. The results of shift-share analysis show that regional
variations in software exports were largely due to the regional component. The
examination of industry mix shows that in such states as Karnataka, Tamil Nadu and
Uttar Pradesh, an increase in export earnings occurred because of a favourable
industry mix. The results on ordinary least square estimation indicates that the
existing infrastructure is overstressed, namely that there is excessive pressure on
teledensity and a shortage of power and that the high population makes it difficult for
regions to sustain a high level of specialization.
In the remainder of this study, section II consists of a literature review,
section III provides a discussion on the approach to the study, section IV deals with
the methodology and section V covers the database. Empirical results and analysis is
dealt with in section VI and section VII contains a discussion on the policy
implications. Section VIII concludes the paper.

Asia-Pacific Development Journal Vol. 24, No. 1, June 2017
86
II. REVIEW OF LITERATURE
The literature review deals with studies that have improved the shift-share
analysis theoretically and some with empirical applications. Estaban-Marquillas
(1972), Arcelus (1984), and Casler (1989) dealt with theoretical improvement of the
shift-share analysis. Haynes and Dinc (1997), Liu, Yao and Zhang (1999), and
Randall (1973) dealt with empirical application of shift-share analysis.
Estaban-Marquillas (1972) introduced a new concept of the allocation effect to
better understand the competitive effect under shift-share analysis. Arcelus (1984)
introduced the concept of allocation effect to accommodate the degree of
specialization in a region. Casler (1989) tried to deflect the criticism of shift-share
analysis by developing a labour demand model within regions, which is consistent
with the theory behind the model. Using the concept of unbalanced growth and certain
assumptions, he found that his model was adapted to correspond to shift-share
formulation, which, in turn, made the assumptions underlying shift-share analysis
obvious and clarified the economic interpretations and analysis of the shift-share
effects. He also showed that by slightly modifying the model, the linkage effect
between various industries and regions and the national economy could be specified.
Using theoretical arguments, he arrived at the conclusion that “arguments against
definitions within theory are far more tenuous where these definitions aid in achieving
stated research goals”. Continuing with the theoretical arguments, he managed to
come up with the formation of models from which both spatial and a spatial economics
can be integrated and the balanced growth framework or linkage framework can be
predicted.
Haynes and Dinc (1997) studied the growth in output and looked into the
change in productivity on employment while extending the analysis of shift-share
analysis. The authors tried to separate the effects of changes in output and
productivity by modifying the Rigby-Anderson extension. Here the contribution of
labour and capital to productivity growth were separated for analysing the regional
economic performance. They assessed whether the observed changes in employment
were because of changes in output or in productivity by using twenty manufacturing
sectors at the two-digit level, in twelve states of the United States of America. The
results showed that in both, the regions changed during the investigation period
because of output growth, new investment in physical capital and improvement in
technology. The authors are of the view that the crucial role of labour productivity in
employment change cannot be ignored.
Randall (1973), in his empirical study based on the shift-share model analysis
on employment change in West Central Scotland for the period 1959-1968, found that
if the differential decline could be attributed to one or two establishments that was

Asia-Pacific Development Journal Vol. 24, No. 1, June 2017
87
manufacturing a distinctive product or targeting a particular market, the negative
differential component reflected general factors applicable to most firms in the region.
With access to disaggregated data one could have attributed this to structural factors.
The author highlighted that another important criticism of shift-share analysis was its
failure to take into account intersectoral linkages within the regional economy. A
negative differential component can be attributed to linkages to declining specific
industries and therefore was a concealed structural effect. However, in the absence of
regional input-output data, testing those arguments was difficult. Finally, the author
pointed out that despite those limitations, the usefulness of the technique should not
be discredited. From the policymaking point of view, it was necessary to provide valid
generalizations that could form the basis of policy measures.
Liu, Yao and Zhang (1999) carried out an empirical study on economic growth
and structural changes in employment and investment in China. The authors analyses
the impact of the multitier and multistage development strategy of former Chinese
leader Deng Xiaoping on economic growth in Chinese regions in terms of GDP,
employment and investment for a ten-year period covering 1985-1994 using a basic
shift-share model. The two objectives of the strategy of Deng was to create a few
rapidly growing centres, which would serve as a model for the rest of the country to
follow. The authors made use of the Randall (1973) concept of net relative change,
the difference between actual change and the national component, which is regarded
as an index of relative performance of regions.
After reviewing literature on industry clusters, it appears that the importance of
industrial “clustering” in space has long been recognized by regional scientists and
economists, such as Marshall and Marshall (1920), Hoover (1948), Isard, (1956),
Porter (1998), Lundequist and Power (2002), Stimson, Stough and Roberts (2006).
The influential book Competitive Advantage of Nations, which was written by Michael
Porter in 1990, is considered to have triggered the current intense policy interest in
industry clusters. Perhaps the reason why this discussion on clustering resonates so
strongly with policymakers is that it echoes much of the literature that preceded it and
it analyses the linkages between business organization, strategy, and location (with
the help of the diamond model) in a lucid manner.
Much of the recent debate recognizes industry clusters as an agglomeration of
competing and collaborating industries in a region involving strong interplay between
firms and their stakeholders, willingness of the members to share and nurture key
technologies and business knowledge, which drives innovation based on locally
embedded collective skills of the people and policy interventions. Reviews have also
indicated that the proximity of firms and institutions in one location leads to better
coordination and trust. Authors have emphasized that knowledge-based elements are
the key determinants of the strength of a cluster. The higher the degree of knowledge

Asia-Pacific Development Journal Vol. 24, No. 1, June 2017
88
integration among firms leads to increased competitiveness among member firms
globally and the greater economic performance of the industrial clusters. Although
governments play a crucial role in the initial development of an industry, the ongoing
inflow of talent, technology and capital have an accelerated effect on the development
of industrial clusters. In addition, because industry clusters are built around core
export-oriented firms, they bring new wealth into the region and help drive the region’s
economic growth.
In a review of the IT industries in India, studies by Basrur and Chawla (1999)
pointed out that in the 1980’s advanced countries were experiencing a “software
crisis” in terms of demand for software services rising more rapidly than its supply.
This triggered the globalization of production. During that time, India made
a successful entry into the global software industry based on its comparatively low
cost of professional technical manpower. The extensive use of English as a second
language gave India a further competitive advantage in trading its software services
with the advanced industrial economies. Initially, the majority of the firms in the
country’s software industry acted as body shoppers, but gradually in the 1990s a few
pioneering Indian firms, such as Tata Consultancy Services, were able to leverage
their technical and project management skills to successfully complete turnkey
projects for large corporations.
During the 1990s, based on inputs from the industry body, the National
Association of Software and Services, which was founded in 1988, the government
began to support the industry proactively. First, the establishment in 1990 of the
software technology parks provided high speed data communication facilities and
financial incentives to firms to provide offshore services. Second, the economic
reforms of 1991 induced a major shift in economic policies, including the devaluation
of the Indian rupee, trade liberalization and openness to foreign investment. Tariffs
and other taxes that had been plaguing the industry were reduced. In addition, in the
1990s IBM returned to India, which sent a positive signal to other global majors that
the country’s IT industry was set to be a significant player. Third, the telecom sector
was deregulated in the mid-1990s, which facilitated participation from the private
sector and multinational corporations. A subsequent review of policies has
encouraged the rapid adoption of new technologies, allowing the industry to reap the
benefits of free market competition, improved service quality and declining tariffs.
Along with this, several new IT firms were started. During that decade, TCS, Infosys,
and Wipro also emerged as market leaders (KPMG and CII, 2012).
In mid-1990s the IT enabled services/business process outsourcing/business
process management industry emerged in India. The industry initially specialized in
voice-led work. However, many of business process management services that could
be performed remotely, such as customer care, payment services, administration,

Asia-Pacific Development Journal Vol. 24, No. 1, June 2017
89
human resources, finance and content development, were developed and continued
to expand.
Indian business process management players have quickly broadened and
deepened the services they offer, which range from data entry and medical
transcription to niche areas and expert knowledge services, such as those in legal,
pharmaceutical marketing, research (equity and financial) and analytics and drafting
patent documents, in order to remain the world’s premier destination for backoffice
services.
The business process management industry has had as a social impact, as
noted by, for example, Business World and the BPO Industry Report, in terms of its
large-scale employment of the educated workforce (graduates and undergraduates)
from all areas of concentration. A job in a business process outsourcing does not
require an illustrious academic record and professional qualifications, but instead
more weight is placed on soft skills, such as language proficiency, adaptability and
learning ability. Women recruits also constitute 40 per cent of its workforce. The
industries’ most visible social impact has been its multiplier effects or spillover effects
in terms of jobs created for other industries, such as human resources services,
catering, transport, telecom equipment, real estate, IT services and office equipment.
The business process outsourcing industry has economically empowered young
adults and their high disposable income has led to an increase in the demand for
costly consumer durables. The industry has created a burgeoning demand for real
estate for office and housing space. This in turn has increased demand for, among
others, real estate consultants, architects, builders, engineers, security agencies and
landscaping professionals. The business process outsourcing has fueled demand for
small vehicles, such as cars and vans, as well as for drivers. These vehicles are
plying 24/7/365. The industry has also boosted the airline industry with movement of
business process outsourcing professionals initially for business purposes and later
for leisure. This has indirectly given a boost to the tourism industry. A large expatriate
population is now living in such cities as Bangalore, Chennai, Delhi and Mumbai.
The industry has surged ahead and grown by leaps and bounds starting in
2000. The firms in India offering IT services1 have evolved from providing application
development and maintenance to emerge as full-service players that provide testing
services, infrastructure services, consulting and system integration. Within those
operations, IT outsourcing has grown rapidly in the following segments: remote
1 Indian IT services are categorized into: (a) project based: IT consulting, systems integration; customapplication development; network consulting and integration; and software testing; (b) outsourcing:application management; information system outsourcing; service oriented architecture (SOA) and webservices; and (c) support and training.

Asia-Pacific Development Journal Vol. 24, No. 1, June 2017
90
infrastructure management; application management; and testing and service oriented
architecture (NASSCOM, 2010). The industry’s vertical market mix2 is well balanced
across several mature and emerging sectors. In 2013 mature outsourcing verticals-
banking financial services and insurance, telecom and manufacturing contributed
more than 75 per cent of the country’s exports in terms of value (NASSCOM, 2013).
To sustain its growth and take it to the next level, the country’s IT business process
management companies have recalibrated their strategies and shifted their focus from
cost competitiveness (current linear model) to providing increased value in terms of
domain expertise and being more efficient by adopting a non-linear growth model. The
levers of this model are: intellectual property; cloud computing; platform business
process outsourcing; non-linear pricing models; delivery accelerators; branding; and
mergers and acquisitions. Notably, however, the effect of some of the levers are
disruptive, such as cloud products and mergers and acquisition, and other could be
incremental, such as pricing models and branding (KPMG and CII, 2012).
In addition, a review of studies on IT clusters in India by Van Dijk (2003),
Vijayabasker and Krishnaswamy (2004), Ramachandran and Ray (2005), Sawhney
(2006), Kumar (2005), Chandrasekhar (2005), Basant (2006), Balatchandirane
(2007), Khomiakova (2007) and Chatterji (2013) shows that there has been
a concerted effort to study the IT industry in India through the prism of regional cluster
development. The researchers analysed IT clusters around the following key
metropolitan regions: Mumbai, Bangalore, Hyderabad, Chennai, Kolkata, Delhi,
Gurgaon, Noida and Pune. They asserted that globalization was behind the
impressive growth of the IT sector and the expansion of the sector put it in
a favourable light among the administrative and political elite of India. They point out
that success of the sector has been supported by a combination of factors, including
among them, the large pool of science, mathematics and engineering graduates,
software firms having ISO 9000, six sigma, SEI3 CMM,4 SEI CMMI, PCMM5
2 Vertical wise breakup for the year 2013 BFSI (41 per cent); telecom (18 per cent); manufacturing(16 per cent); retail (10 per cent); health care (5 per cent); travel and transport (3 per cent); constructionand utilities (2 per cent); media, publishing and entertainment (2 per cent ); and others (2 per cent).3 SEI CMM: Software Engineering Institute, Capability Maturity Model of the United States (SEI-CMM)certification at level 5.4 The purpose of Capability Maturity Model Integration (CMMI) is to guide organizations in their effortsto improve processes and enhance their ability to manage the development, acquisition, andmaintenance of products and services. CMMI places proven practices into a structure and helpsorganizations assess their maturity and process area capabilities, establish priorities for improvement andimplement these improvements.5 People CMM or PCMM is a process targeted at managing and developing an organization’sworkforce. The maturity framework of CMM for software. The aim of PCMM is to radically improve theability of software organizations to attract, develop, motivate, organize and retain the personnel neededto continuously improve an organization’s staff to develop effective teams and successfully manage thehuman resources of an organization.

Asia-Pacific Development Journal Vol. 24, No. 1, June 2017
91
certification, an early bird advantage, diaspora, expertise, entrepreneurial dynamism
and government support. The formation of IT clusters and the benefits in the form of
locational economies have not only made the IT industry globally competitive but it
also has had a positive impact on the local economy in the form of large tax collection
and job creation in diverse sectors, such as transportation, hospitality and consumer
durables, and in spinoffs, such as hardware, electrical products, instrumentation,
embedded systems, new start-ups and the biotechnology industry. The expanding IT
sector has resulted in an increase in demand for office space, premium residential
townships, hotels, shopping malls, educational institutions and specialty hospitals.
The sector has been a crucial driving force behind the spatial expansion of major
cities in India. Furthermore, as metropolitan areas are attracting IT investments and
jobs are being created, pressure is being put on infrastructure, real estate costs are
escalating, new socioeconomic conflicts are brewing with local residents over land
and livelihood issues and demand for IT professionals is increasing. These are among
the challenges the IT industry must deal with to gain momentum for further growth.
Although the states of India are operating within the same national level
macroeconomic environment, there are substantial variations in regional economic
development outcomes. This can be attributed to differences among civil society and
local- and state-level political and economic cultures and institutions.
III. APPROACH TO THE STUDY
The IT business process management sector has registered tremendous
growth over the past 15 years, achieving an iconic status around the world and
a reputation for its reliable and cost-effective delivery of services. India is recognized
as the outsourcing destination of choice in the world. The major developed markets
are sourcing IT business processing management services from India to improve their
competitive edge. Indian IT companies have set up more than 600 delivery centres
around the world and are providing services in more than 200 cities across
78 countries. As a proportion of national GDP, the sector revenue has increased from
1.2 per cent in fiscal year 1997/98 to nearly 9.5 per cent in fiscal year 2014/15. Its IT
business process management revenue is projected to reach $150 billion, with
$98 billion from exports and $48 billion from the domestic market. Exports account for
a 67 per cent share of the revenue. E-commerce is driving the rapid growth of the
domestic IT business process management sector. The domestic market is expected
to get a further boost from the Government’s focus on “Digital India” and “Make in
India”. India continues to maintain a leadership position in the global sourcing arena,
accounting for almost 55 per cent of the global sourcing market size in 2015, as
compared to 52 per cent in 2012 (NASSCOM, 2015).

Asia-Pacific Development Journal Vol. 24, No. 1, June 2017
92
The total employment associated with IT software and services was estimated
to be 3.5 million in 2015. The indirect and induced employment attributed by
the sector is estimated at about 10 million. Indirect employment is generated in
several ancillary industries, such as those related to telecom, power, construction,
transportation, corporate real estate, residential townships, shopping malls, specialty
hospitals, catering, security and housekeeping. Induced employment is being driven
by consumption expenditure of employees on food, clothing, recreation, and
consumer durables including automobiles, health and other services.
The Indian IT business process management industry has emerged as one of
the most dynamic sectors in the economic development of India and is responsible for
the global recognition of India as a “soft” power. In addition to fueling the economy,
the IT business process management industry has been influencing the lives of the
people through active direct and indirect contributions to various socioeconomic
parameters, such as employment, standard of living and diversity. The IT industry in
India is centred on a few clusters to reap the benefits of agglomeration economies.
The clusters in Bangalore, Mumbai, Delhi along with its suburbs, Noida and Gurgaon,
Hyderabad, Chennai, Pune and Kolkata have helped to spur the emergence
of a globally competitive IT industry. Other cities, such as Thiruvananthapuram
and Ahmedabad, are in the process of becoming up as popular locations for
clusters (Khomiakova, 2007). The spillover of the software industry for balanced
regional development hinges on the availability of skilled labour, high speed data
communication links and built-up floor space. Research studies, such as that of Surie
(2005), point out that the success of the software industry depends on whether the
benefits of IT are accessible to a wider population. To bridge the digital divide and to
support the diffusion of IT to improve productivity, the state has to play a more
proactive role. These observations have prompted the authors of this study to
investigate the extent to which the IT sector is contributing to regional development in
the ten states and the extent of imbalances, if any. To examine the above, the
shift-share method was used. This method is a popular tool for analysing regional
growth or decline over time. It has been widely used since the 1960s to assess
a region’s overall performance relative to other regions by focusing on output,
employment and investment by industry sector. The method was introduced in Dunn
(1960) and Ashby (1968) and has been extensively discussed in Casler (1989) and
Randall (1973). A recent discussion and application of the method is found in Stimson,
Stough and Roberts (2006) and Liu, Yao and Zhang (1999). In addition, to analyse the
causes behind the states strength/weakness, the study uses an endogenous growth
model solved by using the ordinary least squares method. Added to this, the present
study also tries to analyse the extent to which per capita income of a state and its IT
exports are causing one another in three main states mainly Karnataka, Andhra
Pradesh and Tamil Nadu by using the Granger causality test.

Asia-Pacific Development Journal Vol. 24, No. 1, June 2017
93
IV. METHODOLOGY
The study mainly uses two methods: a shift-share analysis; and econometrics –
ordinary least squares estimation and Granger causality test.
Method I: Shift-share analysis
The shift-share method is a technique that uses a sectoral decomposition to
examine the regional growth/decline. The method makes it possible to assess the
overall performance of a region relative to others. In addition, the method also allows
for an assessment of the relative importance of an industry sector in the region and
helps to identify industrial sectoral problems in a region. Particularly, this method is
used to demonstrate how the industry structure could affect regional and local
economies and thereby help in reviewing regional trends and advising policymakers
on targets to industries.
The variable decomposed using this method could be, for example, income,
employment, value added and number of establishments (Haynes and Dinc, 1997).
Thus, the shift-share model decomposes, for example, regional growth/decline of
GDP, investment, and employment into three components while measuring them.
These relate to:
• National share:6 by national share, the measure tries to explain that portion
of the GDP/exports/employment, change attributable to national trends
• Industry mix:7 by industry share, the measure tries to explain that portion of
the GDP/exports/employment, change attributable to industrial composition
or mix of the region, and
• Regional shift:8 that portion of the GDP/exports/employment, change that
is related to the regional advantage or competitiveness in the region is
considered as the regional shift component.
6 Measures the change (growth or decline) in total GDP/exports/employment of an industry at thenational level.7 Measures the industry composition of the region, namely to what extent the region specializes inindustries that are growing rapidly or slowly nationally.8 Measures the change in a particular regional industry’s GDP/exports/employment, namely growth ordecline in a regional industry because locational advantages and disadvantages.

Asia-Pacific Development Journal Vol. 24, No. 1, June 2017
94
Literature reviews that supported the earlier models using shift-share analysis
were those of Perloff and Wingol (1961) and Dunn (1960). The former is said to have
focused on total regional employment, which had only two components. These relate
to total shift and differential shift. The total shift is expressed as:
TS ≡ Σi ei, t – Σi ei, t – 1 ( ) (1)
and the differential shift is expressed as
DS ≡ Σi ei, t – 1 ( – ) (2)
Here while e refers to the regional employment, E refers to national employment. The
subscript i refers to the industry. The subscripts t-1 and t refer to the initial and end
periods considered in a study. Dunn (1960) captured the proportionality effect by
introducing differential rates of growth in individual industries within the shift-share
model. This is said to be equivalent to the industry composition or mix effect, referred
earlier. Ashby (1968) introduced a three component model of regional change. These
three components were national share (NS), industry mix (IM) and regional shift (RS).
In the present study the variables IT exports9 are to be decomposed. Thus, the
model for IT exports is as follows:
Expressing the above symbolically we have the following equations:
∆xi ≡ xi, t – xi, t –1 ≡ NSi + IMi + RSi (3)
Here
NSi ≡ xi, t – 1 ( -1) (4)
IMi ≡ xi, t – 1 ( – ) (5)
RSi ≡ xi, t – 1 ( – ) (6)
Thus, the symbol ∆ refers to change and xi refers to IT exports in different
regions. Xi refers to IT exports at the national level, namely total Software of
Technology Parks of India (STPI) exports, and X refers to total of all India non-factor
services (NFS) exports. Subscript i refers to IT exports and the subscript t and t-1
refers to the end and base period, respectively. NS refers to the national share, IM
refers to the industry mix and RS refers to the regional share.
9 As data pertaining to the IT sector alone are available only for exports, the study analyses the ITexports under a shift-share analysis.
ei, t
ei, t–1
Et
Et–1
Xt
Xt–1
Xi, t
Xi, t–1
Xt
Xt–1
Xi, t
Xi, t–1
Xi, t
Xi, t–1
Ei, t
Ei, t–1

Asia-Pacific Development Journal Vol. 24, No. 1, June 2017
95
Now following Randall (1973), the above equation 1 could be written as
∆xi – NSi ≡ IMi + RSi (7)
Here the left hand side is the difference between the actual change and the
national component. If the national component is deducted from the actual, the net
result is the net relative change of exports over the base period. Thus, this equation
is called the net relative change (NRC).
Method II: Econometrics – ordinary least squares
An endogenous growth model is attempted in econometrics by using ordinary
least squares estimation. As the shift-share analysis only identifies the region or
country as factors responsible for growth, the study was intended to go deeper to find
out the specific regional factors responsible for the regional influences in the growth of
IT. The growth or decline that takes place in different regions could be the result of
favourable or unfavourable external environment or regional endogenous factors,
such as the locational advantages and disadvantages. However, to measure
endogenous growth, there is no universally available variable. Review says that the
regional shift (RS) component derived from the shift-share analysis can serve as
a reasonable proxy to act as a dependent variable in a model of endogenous growth.
The model is thus developed to identify the endogenous factors leading to spatial
variation in the performance of the software sector across leading states in India.
Considering the regional shift component as the dependent variable, an
ordinary least squares regression is being run by using five independent variables,
namely enrolment in higher education, population, location quotient, electricity
consumption and teledensity. Here it is hypothesized that the five independent
variables are the determinants of endogenous growth that may account for spatial
variations in IT performance across Indian states. In other words, it could be said that
these independent variables in the model are assumed to serve as potential regional
endogenous factors that might influence software export sector performance.
Explaining the influence of these potential factors it is seen that the success of the
software industry depends on the following.
First, the existence of skilled workers. It is often proposed that regional growth
is enhanced in certain regions by the existence of skilled workers, the availability of
employment opportunities, opportunities for a wide range of skills and the existence of
higher income jobs. The IT sector is no exception to this. However, it also calls for
Asia-Pacific Development Journal Vol. 24, No. 1, June 2017
96
highly skilled personnel. Therefore, the variable, state-wise enrolment10 in higher
education, was incorporated in the model to assess those effects.
Second, population is used as a dynamic measure of the size of the region.
Third, the study investigates the nature of the software industry structure in the
10 states and the effect of the industry’s specialization on the region’s endogenous
growth. An appropriate measure to this effect could be the location quotient, which is
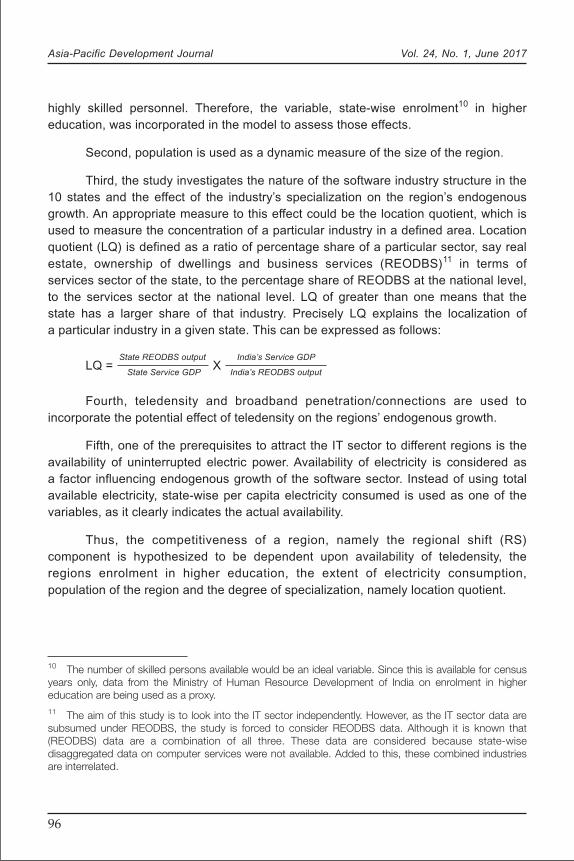
used to measure the concentration of a particular industry in a defined area. Location
quotient (LQ) is defined as a ratio of percentage share of a particular sector, say real
estate, ownership of dwellings and business services (REODBS)11 in terms of
services sector of the state, to the percentage share of REODBS at the national level,
to the services sector at the national level. LQ of greater than one means that the
state has a larger share of that industry. Precisely LQ explains the localization of
a particular industry in a given state. This can be expressed as follows:
LQ = State REODBS output
X India’s Service GDP
Fourth, teledensity and broadband penetration/connections are used to
incorporate the potential effect of teledensity on the regions’ endogenous growth.
Fifth, one of the prerequisites to attract the IT sector to different regions is the
availability of uninterrupted electric power. Availability of electricity is considered as
a factor influencing endogenous growth of the software sector. Instead of using total
available electricity, state-wise per capita electricity consumed is used as one of the
variables, as it clearly indicates the actual availability.
Thus, the competitiveness of a region, namely the regional shift (RS)
component is hypothesized to be dependent upon availability of teledensity, the
regions enrolment in higher education, the extent of electricity consumption,
population of the region and the degree of specialization, namely location quotient.
10 The number of skilled persons available would be an ideal variable. Since this is available for censusyears only, data from the Ministry of Human Resource Development of India on enrolment in highereducation are being used as a proxy.11 The aim of this study is to look into the IT sector independently. However, as the IT sector data aresubsumed under REODBS, the study is forced to consider REODBS data. Although it is known that(REODBS) data are a combination of all three. These data are considered because state-wisedisaggregated data on computer services were not available. Added to this, these combined industriesare interrelated.
State Service GDP India’s REODBS output

Asia-Pacific Development Journal Vol. 24, No. 1, June 2017
97
The linear model for ordinary least squares estimation is expressed as follows:
Y = C + aX1 + bX2 + cX3 + dX4 + eX5 + ε
With reference to the variables, the above equation could be expressed as:
RSi = EHE i + POPi + LQi + ECi +TDi + ε
Here Y(RSi ) is the regional shift component derived from the shift-share
analysis of growth in IT exports, X1(EHEi ) refers to enrolment in higher education,
X2(POPi ) refers to population, X3(LQi) refers to location quotient, X4(ECi ) refers to
electricity consumption, X5(TDi ) refers to teledensity, ε is the error term and a, b, c, d
and e are coefficient of the variables. A direct relationship between dependent
variable and the independent variables is assumed and a regression is run to produce
the results in the next chapter.
Method II: Econometrics – Granger causality test
As regional development is closely related to positive higher growth in per
capita income of that region, a causal relationship between regions’ per capita income
and IT exports is studied to determine how IT exports have contributed towards the
development of IT hubs and improved the standard of living of the population in the
region. To test the bi-directional causality between two variables the standard Granger
causality test (Granger, 1969) was used in the present study. The theory of causation
states that if the past values of variable Y improve the forecast of variable X, then it
can be said that variable Y Granger causes variable X and vice versa. The Granger
causality model is given as below:
Xt = α0 + α1Xt-k + ........ + αnXt-n + β1Yt-1 + ........ + βnYt-n (1)
Yt = α0 + α1Yt-1 + ........ + αnYt-n + β1Xt-1 + ........ + βnXt-n (2)
Here Xt and Yt are all possible pairs of (XY) series. The null hypothesis H0 for equation
(1) is δl = 0 for all l’s against the alternative hypothesis H1: δl ≠ 0 for some l’s. Similarly,
for equation (2) H0: θl = 0 for all l’s against H1: θl ≠ 0 for some l’s. Thus, it can be
stated that the Granger causality test is to see how many lags of Yt are jointly
significant in an equation of Xt and vice versa. To test the joint significance of
coefficients F-test is applied.
The Granger test is sensitive to the lag length selection hence the robustness
of result of the test is subject to optimal lag selection. Akaike information criterion
(Akaike, 1974) is commonly used for lag length selection of optimal lag structure.
To avoid the probability of spurious regression, the Granger causality test is applied

Asia-Pacific Development Journal Vol. 24, No. 1, June 2017
98
only on stationary series. To test the presence of unit root in a series Augmented
Dickey-Fuller Test is commonly used (Dickey and Fuller, 1979). The Granger causality
test is valid only if the variables in question are not co-integrated (Engle and Granger,
1987). Hence, it is important to check the stationarity of each of the variables and the
co-integrating relation between the concerned variables before Granger causality test
is performed.
Thus, to understand the interrelationships between the different components of
the endogenous growth model, causality testing is undertaken. Aiming to see whether
the state’s change in per capita income are the result of changes in IT exports and
changes in the real estate, ownership dwellings and other business services sector, it
is assumed that the null hypothesis to be tested as change in a state’s IT exports
does not influence the change in per capita income of the respective state. To test it
bi-directionally entails looking to ascertain if change in IT exports causes the change
in state’s per capita income or change in state’s per capita income causes change in
IT exports of the state.12 Similarly, by considering the null hypothesis to be tested as
change in GDP of REODBS sector of state do not influence the change in per capita
income of the respective state and testing it bi-directionally whether change in GDP of
REODBS sector of state causes change in state’s per capita income or change in
state’s per capita income causes change in GDP of REODBS sector of state is
determined.
V. DATABASE13
Information technology export data under the title “State-wise Software Exports
made by registered units through STPI for last three years in Rupees Crore” are
published in STPI annual reports. STPI annual reports for 2006/07, 2007/08, and
2009/10 have been used. Higher education data were procured from the 2008/09
annual report. Following the change in the format of data dissemination in the annual
reports of the Ministry of Human Resource Development of India after 2008/09,
Indiastat.com data were used for the years 2008/09, 2009/10, 2010/11 and 2012/13
on “state-wise enrolment of students in higher education”, which compiles the data
from the reports of the ministry. State-wise data on teledensity per thousand
population for the years 2006/07 to 2010/11 were collected from Infrastructure
Statistics 2013 and data for the year 2012 from Infrastructure Statistics 2014. Instead
12 Only the top three southern states, Karnataka, Andhra Pradesh and Tamil Nadu, have been donebecause of a time constraint. It could be extended to other states in later work.13 Database has been kept brief to reduce the bulk of the paper. It could be given to interested readerson request.
Asia-Pacific Development Journal Vol. 24, No. 1, June 2017
99
of making use of state-wise per capita electricity consumption, state-wise data under
access “Industrial Electricity Consumption” (gigawatt hour) for the years 2005/06 to
2009/10 from Infrastructure Statistics 2013. Data for the 2011/12 are taken from
Infrastructure Statistics 2013. Sector wise GDP14 data are collected from the state
GDP series published by the Central Statistical Organization, India. All India GDP data
sector wise are collected from the site of Ministry of Statistics and Programme
Implementation of India. The 1993/94 and 1999/00 series data for those states are
adjusted for 2004/05 prices and the whole data set of the states as well as central
data used are for 2004/05 prices.
VI. EMPIRICAL RESULTS AND ANALYSIS
The results of the shift-share analysis were arrived at by fitting the data into the
models/formulas and calculations of different components of the model using excel
sheets. These were then tabulated as different tables. Ordinary least squares
estimation was carried out for the two different periods using four different models for
each period in Excel. A Granger causality test between change in IT exports and
change in per capita income of state and vice versa and change in per capita income
of state and change in GDP of the REODBS sector and vice versa was done in
EViews. Only two lags are used for arriving at the results.
Results of the shift-share analysis on information technology exports by states
2004/05 and 2008/09
In the shift-share analysis of IT export revenue of ten states in India for
2004/05 and 2008/09, it can be seen in table 1A that overall total STPI exports
increased by 122 per cent and total non-factor service exports increased by 99.9 per
cent.15 During this period, except for Delhi, which recorded a negative actual change,
in absolute terms, software export revenue for other states had increased. Software
export revenue witnessed a relative decline, namely a negative net relative change
(NRC) in Delhi, Haryana and Punjab. This decline was mainly influenced by the
regional component, with industry mix constituting a negative contribution.
14 Although specific IT sector data were not accessible, a Granger causality test with the data onREODBS was undertaken, as this includes the share of the IT industry. It was not possible to get thestate-wise breakup of such data.15 The results do not reflect to what extent NFS exports have increased. However, since suchinformation is calculated. It has been mentioned.
Asia-Pacific Development Journal Vol. 24, No. 1, June 2017
100
The reasons for the negative net relative change in the results for the three
states, Delhi, Haryana and Punjab, are obviously seen in the findings of NASSCOM
and a study carried out by NASSCOM and A T Kearney (2008), which pointed out that
as far as Delhi is concerned, industry participants perceive the government to be
bureaucratic with little focus on the IT business process management. An example of
the Government’s apathy is that policy drafted in 2000 has not been updated. Delhi
needs to address problems of power, water shortage, local connectivity and crime to
attract the IT business process management industry.
Furthermore, the same report states that in Haryana, Gurgaon has experienced
growth as an IT business process management16 hub because of its proximity to Delhi
and seven operational special economic zones. The report has seen an outsourcing
boom in the business process management segment on account of the good English
speaking skills of its people. This boom has led to the mushrooming of malls,
restaurants and entertainment facilities. The growth of the IT industry is restricted
because of frequent power shortages, lack of local connectivity and a high crime rate,
which lead to high operational costs. Although real estate space is available, the
government needs to develop commercial space to allow plug and play facilities.
In Punjab, the report of NASSCOM and A T Kearney (2008) points out that the
state needs to enhance the visibility of locations, such as Ludhiana and Mohali, by
investing in engineering and technical education, and improving English language
proficiency. In Punjab transport connectivity whether it is local, national and
international is poor and needs to be improved in order to attract the IT business
process management industry. Both commercial and residential complexes need to
be developed in the space available.
During this period, software exports from the IT-dominated states of Andhra
Pradesh, Karnataka, Maharashtra and Tamil Nadu increased by large amount even
though they began from a high base in 2004/05. States, such as Gujarat and Kerala
recorded a large increase in net relative change because their exports in the base
year were low.
16 NASSCOM has rebranded the information technology enabled services/business processoutsourcing to business process management in 2012.
Asia-Pacific Development Journal Vol. 24, No. 1, June 2017
101
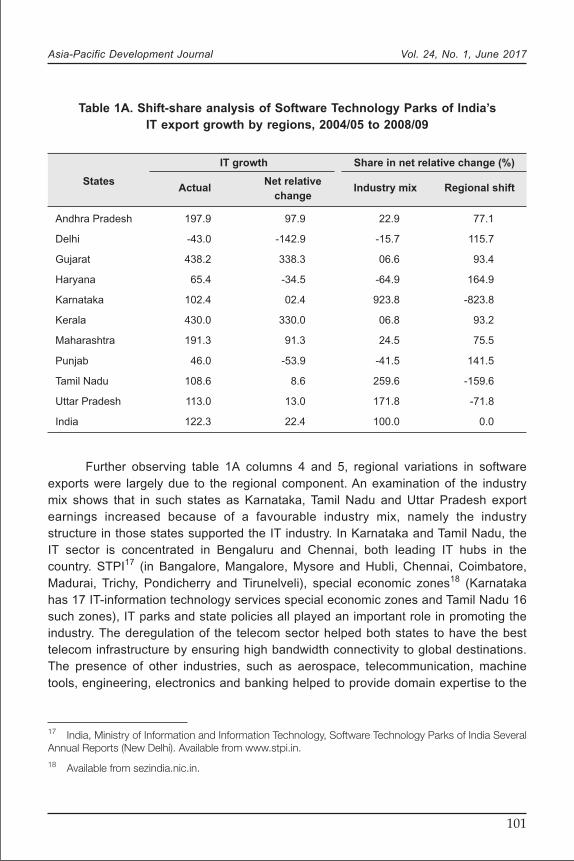
Further observing table 1A columns 4 and 5, regional variations in software
exports were largely due to the regional component. An examination of the industry
mix shows that in such states as Karnataka, Tamil Nadu and Uttar Pradesh export
earnings increased because of a favourable industry mix, namely the industry
structure in those states supported the IT industry. In Karnataka and Tamil Nadu, the
IT sector is concentrated in Bengaluru and Chennai, both leading IT hubs in the
country. STPI17 (in Bangalore, Mangalore, Mysore and Hubli, Chennai, Coimbatore,
Madurai, Trichy, Pondicherry and Tirunelveli), special economic zones18 (Karnataka
has 17 IT-information technology services special economic zones and Tamil Nadu 16
such zones), IT parks and state policies all played an important role in promoting the
industry. The deregulation of the telecom sector helped both states to have the best
telecom infrastructure by ensuring high bandwidth connectivity to global destinations.
The presence of other industries, such as aerospace, telecommunication, machine
tools, engineering, electronics and banking helped to provide domain expertise to the
Table 1A. Shift-share analysis of Software Technology Parks of India’s
IT export growth by regions, 2004/05 to 2008/09
IT growth Share in net relative change (%)
StatesActual
Net relativeIndustry mix Regional shift
change
Andhra Pradesh 197.9 97.9 22.9 77.1
Delhi -43.0 -142.9 -15.7 115.7
Gujarat 438.2 338.3 06.6 93.4
Haryana 65.4 -34.5 -64.9 164.9
Karnataka 102.4 02.4 923.8 -823.8
Kerala 430.0 330.0 06.8 93.2
Maharashtra 191.3 91.3 24.5 75.5
Punjab 46.0 -53.9 -41.5 141.5
Tamil Nadu 108.6 8.6 259.6 -159.6
Uttar Pradesh 113.0 13.0 171.8 -71.8
India 122.3 22.4 100.0 0.0
17 India, Ministry of Information and Information Technology, Software Technology Parks of India SeveralAnnual Reports (New Delhi). Available from www.stpi.in.18 Available from sezindia.nic.in.

Asia-Pacific Development Journal Vol. 24, No. 1, June 2017
102
IT sector. Both states offered good physical and social infrastructure, which was the
prime factor behind the recruitment of talented professionals both domestically and
from multinationals. Excessive concentration of IT business process management
companies in those locations has led to traffic congestion, rising real estate and
labour costs, a shortage of hotel rooms and high attrition.
Further observing table 1A column 4, it can be noted that the positive net
relative change for Karnataka, Tamil Nadu and Uttar Pradesh may be attributed to
a favourable industry mix. This can be explained by the results of the NASSCOM and
A T Kearney study, which points out that IT business process outsourcing firms were
of the view that the government of Karnataka had not supported the growth of the IT
sector sufficiently and is riding on the boom that started a decade ago. The same
report mentioned that the government of Tamil Nadu support for IT business process
management development in Chennai had lessened with more attention being
focused on other locations in the state, namely Coimbatore, Madurai and Trichy.
As far as IT in Uttar Pradesh is concerned, the report indicated that the state
government strived to leverage central government policies relating to e-governance,
wide area networks, high speed telecom links and central agencies, such as those of
STPI and special economic zones to build software technology parks and IT enabled
services special economic zones. For Uttar Pradesh to emulate the success of Noida
in other tier II and tier III cities, the local government needs to (i) develop the
Lucknow-Kanpur corridor19 on the lines of Noida-Greater Noida; (ii) improve
connectivity, the social and living environment and recreational facilities, (iii) provide
commercial and residential space and (iv) change the negative perception of careers
in the business process management industry.
For the second period 2009/10 to 2013/14 the shift-share analysis presented in
table 1B shows that the actual increase in IT export revenue was negative in seven
out of the ten states and the net relative change was negative for all the states. These
variations are due to the industry mix, which is quite obvious from the change in
structure from STPI to special economic zones which is explained below. The possible
reason for the decline in IT exports from STPI units as pointed out in their annual
19 Uttar Pradesh Infrastructure & Industrial Development Principal Secretary Surya Pratap Singh, who isalso the chairman and chief executive officer of the Lucknow Industrial Development Authority recentlyapproved the Draft Master Plan 2031 of an integrated industrial township on the Lucknow-Kanpurhighway, spanning 30,000 hectares during a recent board meeting. He also said: “There is tremendouspotential of developing Lucknow-Kanpur industrial corridor on the lines of Noida and Greater Noida, asrobust transport infrastructure is already present in the area. However, we have to hasten the process ofdevelopment in view of rapidly growing urbanization and aspirations of people of the state capital”. Thecomments are available from www.travelnewsdigest.in.
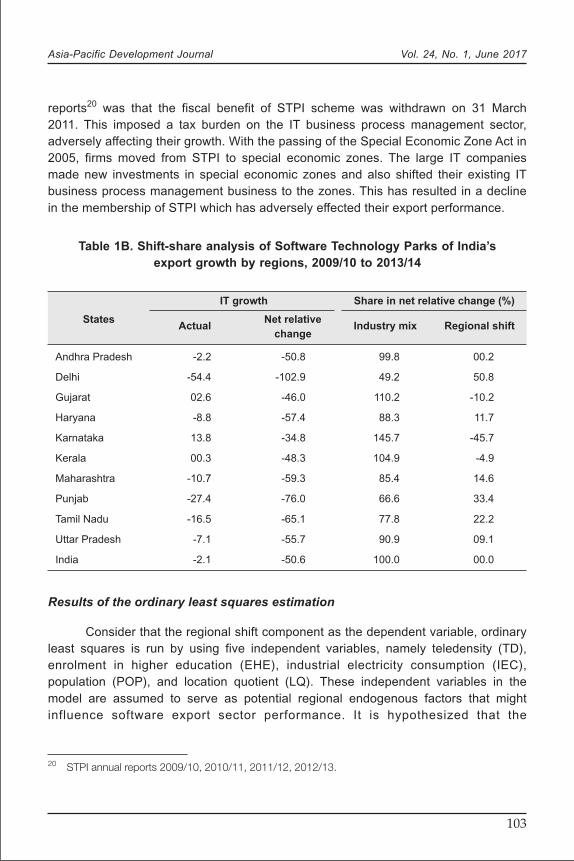
Asia-Pacific Development Journal Vol. 24, No. 1, June 2017
103
reports20 was that the fiscal benefit of STPI scheme was withdrawn on 31 March
2011. This imposed a tax burden on the IT business process management sector,
adversely affecting their growth. With the passing of the Special Economic Zone Act in
2005, firms moved from STPI to special economic zones. The large IT companies
made new investments in special economic zones and also shifted their existing IT
business process management business to the zones. This has resulted in a decline
in the membership of STPI which has adversely effected their export performance.
20 STPI annual reports 2009/10, 2010/11, 2011/12, 2012/13.
Table 1B. Shift-share analysis of Software Technology Parks of India’s
export growth by regions, 2009/10 to 2013/14
IT growth Share in net relative change (%)
StatesActual
Net relativeIndustry mix Regional shift
change
Andhra Pradesh -2.2 -50.8 99.8 00.2
Delhi -54.4 -102.9 49.2 50.8
Gujarat 02.6 -46.0 110.2 -10.2
Haryana -8.8 -57.4 88.3 11.7
Karnataka 13.8 -34.8 145.7 -45.7
Kerala 00.3 -48.3 104.9 -4.9
Maharashtra -10.7 -59.3 85.4 14.6
Punjab -27.4 -76.0 66.6 33.4
Tamil Nadu -16.5 -65.1 77.8 22.2
Uttar Pradesh -7.1 -55.7 90.9 09.1
India -2.1 -50.6 100.0 00.0
Results of the ordinary least squares estimation
Consider that the regional shift component as the dependent variable, ordinary
least squares is run by using five independent variables, namely teledensity (TD),
enrolment in higher education (EHE), industrial electricity consumption (IEC),
population (POP), and location quotient (LQ). These independent variables in the
model are assumed to serve as potential regional endogenous factors that might
influence software export sector performance. It is hypothesized that the
Asia-Pacific Development Journal Vol. 24, No. 1, June 2017
104
competitiveness of a region, namely the regional shift (RS) component is dependent
upon availability of teledensity, the region’s enrolment in higher education figures, the
extent of industrial electricity consumption, population of the region and the degree of
specialization, i.e. location quotient.
The four models for the first period 2004/05 and 2008/09 are as follows:
Model 1 – Data used for EHE, LQ, POP, IEC and TD are averages during the
period 2004/05 and 2008/2009. For two states, Maharashtra and Tamil Nadu,
teledensity are for the corresponding capitals/cities, Mumbai and Chennai.
Model 2 – Data used for EHE, LQ, POP, IEC and TD are the average during
the period 2004/05 and 2008/09. Unlike model 1, here teledensity data are for all
states, cities are not considered.
Model 3 and Model 4 – Data used for EHE, LQ, POP, IEC and TD are for any
random year and teledensity data are for all states.
The results in table 2 show that in three out of the four models, the results are
significant. One explanatory variable, enrolment in higher education is significant and
positively related to the dependent variable. However, the other four explanatory
variables, namely population, location quotient, industrial electricity consumption and
teledensity show significant results with a negative relationship with the dependent
variable.
In observing table 2, it appears that in all the models in the first period –
2004/05 to 2008/09, location quotient, namely regional specialization, was significant
(at a level of 5 per cent), but was negative. A unit increase in the location quotient
decreased the regional competitiveness by more than 270 units, clearly indicating that
regional specialization had reached a saturation level in the prominent IT hubs, such
as Bengaluru, Chennai and Hyderabad. Excessive concentration of IT business
process companies in those locations had led to traffic congestion, rising real estate
and labour costs, a shortage of hotel rooms and high attrition. This had also been
supported by Pais and others (2006) who found that because of a heavy
concentration of IT clusters in a particular region, demand for hotels and restaurants
had increased, leading to high hotel occupancy rates and average room rates. This
reflected the lack of local policy measures relating to, for example, transport
infrastructure, land availability and real estate construction.

Asia-Pacific Development Journal Vol. 24, No. 1, June 2017
105
Table 2. Results of ordinary least squares using regional shift as
a dependent variable, 2004/05 to 2008/09
Model Intercept EHE LQ POP IEC TD
Model 1 313.81** 7.07*** -260.61** -5.53** -0.90* -1.85**
Adjusted R2 0.73
F 5.90
Model 2 196.51 3.62* -163.26 -2.68 -0.68 -1.14
Adjusted R2 0.29
F 1.75
Model 3 322.45** 5.91** -233.81** -5.32** -1.55* -2.37**
Adjusted R2 0.65
F 4.46
Model 4 387.57** 6.82** -277.56** -6.08** -1.88* -2.68**
Adjusted R2 0.66
F 4.63
Notes: Significance codes *** 0.01, ** 0.05, * 0.1.
EHE, enrolment in higher education; LQ, location quotient; POP, population; IEC, industrial electricity
consumption; TD, teledensity.
In the case of enrolment in higher education, the models showed that the
variable was significant at the 1 per cent or 5 per cent levels. A unit increase in
enrolment in higher education was said to increase regional competitiveness by
a minimum of 5.91 units. The easy availability of skilled labour related to the IT sector
is very evident from the results. This is also substantiated with data brought out in the
IT review chapter, which indicated that the ten states accounted for about 80 per cent
of the country’s authorized Engineering and Technology and Masters in Computer
Applications degree granting institutions and sanctioned intake.
The variable population, although significant at a 5 per cent level, is negative,
indicating that a unit increase in population reduces competitiveness by at least
6.1 units. The negative effects of excessive population are very much reflected here.
The industrial electricity consumption variable is significant at 10 per cent and
is negative, implying a unit increase in it resulting in a decrease in regional
competitiveness by a minimum of 1.9 units. The results bring about a clear picture of
the supply-demand mismatch of electricity, the mismatch between electricity
requirement and electricity availability. Lack of availability of electricity to the required

Asia-Pacific Development Journal Vol. 24, No. 1, June 2017
106
level is indicated and any increase in demand for electricity beyond this level
would affect the regional competitiveness. Teledensity is significant at the 5 per cent
level and negative, indicating a unit increase in teledensity would lead to a decrease
in local competitiveness by 2.7 units. This is obvious from the fact that
telecommunication (fiber optic communication) has now become a basic need,
therefore its effective coverage through efficient infrastructure need not be
overemphasized. According to the Telecom Regulatory Authority of India (TRAI, 2011),
an increase in demand for communication infrastructure (adequate bandwidth at
affordable prices) can be attributed to increased Internet usage, e-commerce,
e-governance, e-banking, e-entertainment, e-health, convergence of information,
communication and entertainment sectors, voice, video and data traffic, among
others. The government’s initiative aimed at bridging the digital divide and improving
broadband connectivity through its ambitious National Optical Fiber Network project
aiming at extending broadband access to the country’s 250,000 gram panchayats by
2016 is expected to further increase demand for communication infrastructure.21 This
requires each state and local government to be proactive in the provision of
communication infrastructure, which includes giving permission, among other things,
for right of way,22 and the erection of towers, and mobile virtual network operators. All
these factors clearly indicate the extraordinary demand in this sector, which is implied
in the result.
The Telecom Regulatory Authority of India (TRAI) also has mentioned that in
order to avoid any inconvenience caused by repeated digging, the central and state
roadways authority may consider laying ducts and conduits while roads are being built
to facilitate the laying of other cables when required. However, cities in India are to
a greater extent unplanned wherein the systematic laying of electric cables, fiber optic
cables, and water and gas pipelines is a rare phenomenon. The lack of coordination
between those sectors often leads to congestion, which ultimately results in
diseconomies. The results also highlight this.
Overall, it could be said that, except for enrolment in higher education, the
variables have shown an inverse relationship which contradicts the hypothesis of
a positive relationship, clearly indicating the diseconomies related to those variables.
The results point out that the existing infrastructure is overstressed, caused by
excessive pressure on teledensity, a shortage of power and the high population,
making it difficult for regions to sustain a high level of specialization.
21 Available from www.indian infrastructure.com.22 Right of way permission is granted to licensed telecom operators and registered infrastructureproviders for laying telecom cables and ducts under, over, along, across, in or upon a property vested inor under the control or management of a local authority or of any person including public authority, publiccorporation and autonomous body.

Asia-Pacific Development Journal Vol. 24, No. 1, June 2017
107
For the second period 2009/10 and 2013/14, there are four other models,
which are as follows:
Model 1 – Data used for EHE, LQ, POP, IEC and TD are the average during
the period 2009/10 and 2013/14. For one state, Maharashtra teledensity data are for
the corresponding capital/city, Mumbai.
Model 2 – Data used for EHE, LQ, POP, IEC and TD are the average during
the period 2009/10 and 2013/14. In this model teledensity data are for the states, no
city is considered.
Model 3 – Data used for EHE, LQ, POP, IEC and TD are for a single year. For
one state, Maharashtra, teledensity data are for the corresponding capital city,
Mumbai.
Model 4 – Data used for EHE, LQ, POP, IEC and TD are for a single year. In
this model, teledensity data are for all states.
In table 3 it can be seen that the regression/ordinary least squares results in all
the models in the second period – 2009/10 to 2013/14 – showing the variable location
quotient, an industry concentration significant at the 5 per cent or 10 per cent levels.
Regional competitiveness would increase by a minimum of 132 units for every one
unit increase in location quotient. This clearly indicates that reducing the
concentration beyond the optimum level would surely help in improving the results.
The fact in the second period is the decrease in STPI membership. The decline in
exports from STPI registered units since 2009/10 is because of the decline in
membership in STPI. The reason behind this is that the fiscal benefit of an income tax
exemption (10A) of the STPI scheme ended on 31 March 2011. The withdrawal of
such tax holidays has resulted in increased taxes payments and surcharges required
from the IT and IT enabled services. This has adversely affected the growth of the
sector. Although the Special Economic Zone Act was passed in 2005, as per the STPI
annual report, the movement of firms to special economic zones was said to be in
2009 in order to take advantage of incentives associated with special economic
zones. Larger IT companies initiated new investments in special economic zones and
also shifted their existing IT and IT enabled services business to those zones. This
has resulted in a decline in membership of STPI, which has affected their overall
export performance. Nevertheless, the change has had its own advantage in that the
decline in STPI membership of IT firms led to a reduction in congestion in those
locations, resulting in optimal utilization of existing resources. Thus, the significant
location quotient gave a positive result.

Asia-Pacific Development Journal Vol. 24, No. 1, June 2017
108
Table 3. Results of ordinary least squares using regional shift as
a dependent variable, 2009/10 and 2013/14
Model Intercept EHE LQ POP IEC TD
Model 1 -60.42 -1.95095 131.9975* -0.885695 0.679031 -0.78907
Adjusted R2 0.19
F 1.44
Model 2 -65.37 -3.26658* 160.5587** 1.882268 0.77609 -1.17819
Adjusted R2 0.16
F 1.34
Model 3 -57.37 -2.34407* 136.669* 1.228093 0.646763 -1.08226
Adjusted R2 0.32
F 1.44
Model 4 -42.70 -2.61429* 143.8488* 1.301374 0.499578 -1.31423
Adjusted R2 0.20
F 1.45
Notes: Significance codes: ***0.01, **0.05, *0.1.
EHE, enrolment in higher education; LQ, location quotient; POP, population; IEC, industrial electricity
consumption; TD, teledensity.
In the case of enrolment in higher education three out of the four models show
the variable to be significant, at the 10 per cent level, and negative. A unit increase in
enrolment in higher education is said to decrease regional competitiveness by
a minimum of 3.27 units. The considerable increase in engineering colleges and
lucrative jobs/white collar jobs in IT and IT enabled services firms and the
opportunities to move to the United States and Europe have prompted a number of
students, especially those from the southern states, to attain graduate or post-
graduate degrees in software engineering. This has led to a large supply of human
resources in this sector. The results also support this fact.
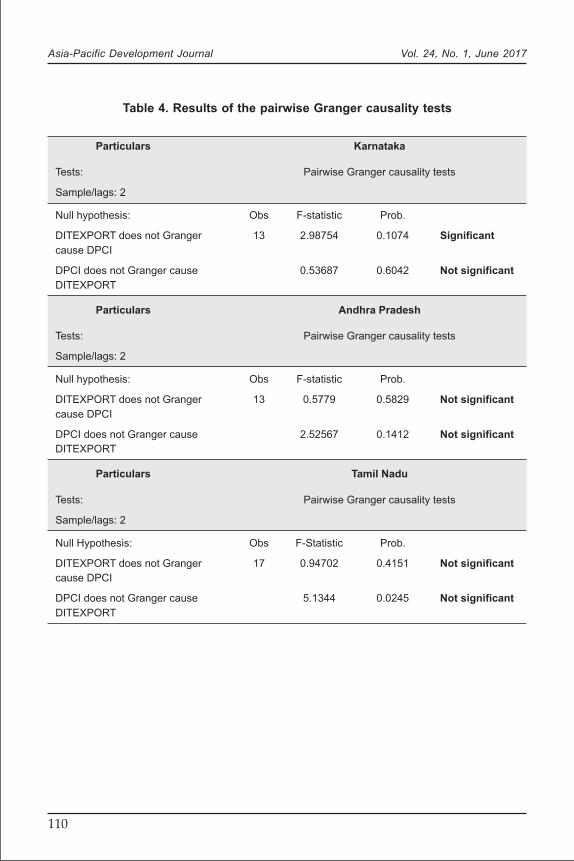
Results of Granger causality
The results of the Granger causality in table 4 indicate that in the three states
reviewed, per capita income of the state does not influence IT exports of that state.
However, with regard to IT exports influencing the per capita income, there are no
significant results for the states Andhra Pradesh and Tamil Nadu, but for Karnataka,
the results are significant, indicating that IT exports of Karnataka influence the per
capita income of the state. The supportive facts behind this seems to be that the

Asia-Pacific Development Journal Vol. 24, No. 1, June 2017
109
Bengaluru cluster has played a vital role in innovation and upgrading value as
contemplated by Porter (1998). This has been possible because the most
sophisticated buyers are part of this cluster. It has been shown that the growth of
many research firms and academic institutions over a long period has led to the
formation of an educated, cosmopolitan population in Bengaluru with a stronger
influence on policy framing than in other Indian cities. Bengaluru has a history of
proactive planning and consultative and participatory policymaking in the form of
implementation of the Panchayati Raj Act, the Nagarpalika Act and the Bengaluru
Agenda Task Force and the establishment of the Karnataka Lokayukta Institution,
which strengthened the ability of local bodies to determine local development
priorities, influence the direction of funding allocation, increased targeting of services
to local needs and desires and increased transparency. Participatory models increase
the citizens’ direct involvement in the deliberation, formulation, implementation and
monitoring of public policy. The Bengaluru IT cluster has been nurtured by active
venture capitalists and some degree of interfirm cooperation, largely outside the
purview of large bureaucratic firms and financial institutions. All this has made it more
attractive and easier for foreign customers to source from different vendors. However,
in the case of Andhra Pradesh and Tamil Nadu, the initiatives of the respective state
led to the development of the IT business process management industry. Policy
initiatives and e-governance initiatives are behind the emergence of the Hyderabad
and Chennai IT hubs in India.
In the case of causality between GDP of REODBS and per capita income of
the states in Andhra Pradesh and Tamil Nadu, some significance is evident whereas it
is totally insignificant in the case of Karnataka in which neither REODBS influence per
capita income of Karnataka nor per capita income of Karnataka influence GDP of
REODBS sector (table 5).
In the case of Andhra Pradesh, GDP of REODBS does not influence per capita
income, but per capita income influences GDP of REODBS. In the case of Tamil
Nadu, GDP of REODBS and per capita income are influenced by one another. Andhra
Pradesh and Tamil Nadu have adopted a low-key IT policy that strongly focuses on
social and regional equity and extends incentives to women and backward caste
entrepreneurs to set up IT centres in small towns. This has led to brain drain from the
two states, Andhra Pradesh and Tamil Nadu, resulting in an increase in remittances
and investment in real estate, which could be a valid reason for REODBS to influence
the per capita income of the state.
Asia-Pacific Development Journal Vol. 24, No. 1, June 2017
110
Table 4. Results of the pairwise Granger causality tests
Particulars Karnataka
Tests: Pairwise Granger causality tests
Sample/lags: 2
Null hypothesis: Obs F-statistic Prob.
DITEXPORT does not Granger 13 2.98754 0.1074 Significant
cause DPCI
DPCI does not Granger cause 0.53687 0.6042 Not significant
DITEXPORT
Particulars Andhra Pradesh
Tests: Pairwise Granger causality tests
Sample/lags: 2
Null hypothesis: Obs F-statistic Prob.
DITEXPORT does not Granger 13 0.5779 0.5829 Not significant
cause DPCI
DPCI does not Granger cause 2.52567 0.1412 Not significant
DITEXPORT
Particulars Tamil Nadu
Tests: Pairwise Granger causality tests
Sample/lags: 2
Null Hypothesis: Obs F-Statistic Prob.
DITEXPORT does not Granger 17 0.94702 0.4151 Not significant
cause DPCI
DPCI does not Granger cause 5.1344 0.0245 Not significant
DITEXPORT

Asia-Pacific Development Journal Vol. 24, No. 1, June 2017
111
Table 5. Results of the pairwise Granger causality tests
Particulars Karnataka
Tests: Pairwise Granger causality tests
Sample/lags: 2
Null hypothesis: Obs F-statistic Prob.
DREALESTATE does not Granger 13 0.69554 0.5266 Not significant
cause DPCI
DPCI does not Granger cause 0.41204 0.6756 Not significant
DREALESTATE
Particulars Andhra Pradesh
Tests: Pairwise Granger causality tests
Sample/lags: 2
Null hypothesis: Obs F-statistic Prob.
DREALESTATE does not Granger 14 0.35091 0.5656 Not significant
cause DPCI
DPCI does not Granger cause 16.9085 0.0017 Significant
DREALESTATE
Particulars Tamil Nadu
Tests: Pairwise Granger causality tests
Sample/lags: 2
Null hypothesis: Obs F-statistic Prob.
DREALESTATE does not Granger 17 3.40485 0.0674 Significant
cause DPCI
DPCI does not Granger cause 7.40399 0.008 Significant
DREALESTATE
VII. POLICY IMPLICATIONS
For the IT sector to develop fully, there must be demand for IT both nationally
and internationally. The IT sector in India is more an export-oriented sector. The
disproportionality in growth between the export and domestic segments needs to be
corrected. In the last couple of years, e-commerce has been driving the rapid growth
of the IT business process management domestic industry. Almost all industries
leverage the benefits of IT. Synergies are prevalent with banking, financial services

Asia-Pacific Development Journal Vol. 24, No. 1, June 2017
112
and insurance, manufacturing, retail, telecommunication, health care and government,
all of which constitute the key business verticals of the industry. This integration needs
to be further strengthened for IT to act as a powerful facilitator and catalyst of growth.
This would help to generate employment opportunities and contribute towards the
development of the region where it is located.
VIII. CONCLUSION
Thus, it could be seen that the results of the shift-share analysis of IT export
revenue of ten states in India for the period 2004/05 showed that software exports
trended higher from the IT-dominated regions, namely Andhra Pradesh, Karnataka,
Maharashtra and Tamil Nadu. Other states, such as Gujarat and Kerala were depicted
to have experienced a large increase in net relative change, mainly because their
exports in the base year were low.
Regional variations in software exports were largely due to the regional
component (regional shift). The examination of the industry mix shows that in some
states, including Karnataka, Tamil Nadu and Uttar Pradesh, an increase in export
earnings occurred on the back of a favourable industry mix. In Karnataka and Tamil
Nadu, the IT parks and state policies, among other aspects, played an important role
in promoting the industry. The deregulation of the telecom sector helped both states to
have the best telecom infrastructure, which ensured high bandwidth connectivity to
global destinations. The presence of other industries, such as aerospace,
telecommunication, machine tools, engineering, electronics and banking helped to
provide domain expertise to the IT sector. In addition, both states offered good
physical and social infrastructure, which was the prime driver for attracting talent both
domestically and from multinational corporations. Excessive concentration of IT
business process management companies in these locations led to traffic congestion,
rising real estate and labour cost, a shortage of hotel rooms and high attrition. The
analysis also indicated that the positive net relative change for Karnataka, Tamil Nadu
and Uttar Pradesh was due to a favourable industry mix.
The results of ordinary least squares estimation showed that in three out of the
four models the results were significant. One explanatory variable, enrolment in higher
education was significant and positively related to the dependent variable. However,
the other four explanatory variables, namely population, location quotient, industrial
electricity consumption and teledensity, showed significant results with a negative
relationship with the dependent variable. Location quotient, namely regional
specialization although significant (at a 5 per cent level) was negative. In the case of
enrolment in higher education, all the models showed the variable to be significant.
The easy availability of skilled labour related to the IT sector was shown to be very

Asia-Pacific Development Journal Vol. 24, No. 1, June 2017
113
obvious from the results. The negative effects of an excessive population were
reflected here. The industrial electricity consumption variable was significant and
negative, bringing about a clear picture of a supply-demand mismatch of electricity.
Lack of availability of electricity to the required level was indicated and any increase in
demand for electricity beyond this level would very likely affect the regional
competitiveness.
The cases which indicated that teledensity was significant and negative
showed the problems in unplanned cities in India in which the systematic laying of
electric cables, fiber optic cables, and water and gas pipelines is a rare phenomenon.
There are situations in which there is lack of coordination between these sectors
congestion often occurs, which ultimately results in diseconomies. The results also
highlight this. Overall, it can be said that except for enrolment in higher education, all
other variables had an inverse relationship, which contradicted the authors’
hypothesis of a positive relationship, clearly indicating the diseconomies related to
those variables. The results pointed out that the existing infrastructure was
overstressed as there was excessive pressure on teledensity, a shortage of power
and high population making it difficult for regions to sustain a high level of
specialization.
The Granger causality test pointed out that Karnataka showed significant
results, indicating that IT exports of Karnataka influenced the per capita income of the
state. In the case of Andhra Pradesh, per capita income influenced the GDP of
REODBS and for Tamil Nadu, both GDP of REODBS and per capita income were
influenced by one another.
Asia-Pacific Development Journal Vol. 24, No. 1, June 2017
114
REFERENCES
Akaike, Hirotugu (1974). A new look at the statistical model identification. IEEE Transactions on
Automatic Control, vol. 19, No. 6, pp. 716-723.
Arcelus, Francisco J. (1984). An extension of shift-share analysis. Growth and Change, vol. 15, No. 1,pp. 3-8.
Arora, Ashish, and Suma Athreye (2002). The software industry and India’s economic development.Information Economics and Policy, vol. 14, No. 2, pp. 253-273.
Ashby, Lowell D. (1968). The shift and share analysis: a reply. Southern Economic Journal, vol. 34,No. 3, pp. 423-425.
Balatchandirane, G. (2007). IT clusters in India. Discussion Paper, No. 85. Chiba, Japan: Institute ofDeveloping Economies.
Basant, Rakesh. (2006). Bangalore clusters: evolution, growth and challenges. Woring Paper,No. 2006-05-02. Ahmadabad, India: Indian Institution of Management.
Basrur, N.P., and Seema Chawla (1999). Trade in software services: from international trade toteletrade. In Europe and Developing Countries in the Globalised Information Economy,S. Mitter and M. Bastos, eds. Routledge.
Casler, Stephen D. (1989). A theoretical context for shift and share analysis. Regional Studies,
vol. 23, No. 1, pp. 43-48.
Chandrasekhar, C.P. (2005). The diffusion of information technology and implications fordevelopment: a perspective based on the Indian experience. In ICTs and Indian Economic
Development: Economy, Work, Recreation, A. Saith and M. Vijayabaskar, eds. New Delhi:Sage Publications.
Chatterji, Tathagata (2013). Localizing production of the globalised knowledge enclaves: the role ofthe sub-national states in development of the IT-ITES clusters in India. In The Economic
Geography of the IT Industry in the Asia Pacific Region, Philip Cooke, Glen Searle andKevin O’Connor, eds. Oxon, United Kingdom: Routledge.
Dickey, David A., and Wayne A. Fuller (1979). Distribution of the estimates for autoregression timeseries with a unit root. Journal of American Statistical Association, vol. 74, No. 366a,pp. 427-431.
Dunn, Edgar S. (1960). A statistical and analytical technique for regional analysis. Regional Science
Association, vol. 6, No. 1, pp. 97-112.
Engle, Robert F., and Clive W.J. Granger (1987). Co-integration and error correction: representation,estimation, and testing. Econometrica, vol. 55, No. 2 (March), pp. 251-276.
Estaban-Marquillas, Joan Maria (1972). A reinterpretation of shift-share analysis. Regional Urban
Economics, vol. 2, No. 3, pp. 249-255.
Granger, Clive W.J. (1969). Investigating causal relations by econometric models and cross-spectralmethods. Econometrica, vol. 37, No. 3, pp. 424-438.
Haynes, Kingsley E., and Mustafa Dinc (1997). Productivity change in manufacturing regions:a multifactor/shift-share approach. Growth and Change, vol. 28, No. 2, pp. 201-221.
Hirschman, Albert O. (1958). The Strategy of Economic Development. New Haven, CT: YaleUniversity Press.
Asia-Pacific Development Journal Vol. 24, No. 1, June 2017
115
Hoover, Edgar M. (1948). The Location of Economic Activity. New York: McGraw-Hill.
India, Planning Commision (2013). Report of the working-group on the estimation of investment, itscomposition and trend for the twelfth five-year plan (2012-13 to 2016-17) . New Delhi.
Isard, Walter (1956). Location and Space Economy. Cambridge, MA: MIT Press.
Khomiakova, Tatiana (2007). Information technology clusters in India. Transition Studies Review,
vol. 14, No. 2, pp. 355-378.
Klynveld Peat Marwick Goerdeler (KPMG), and Confederation of Indian Industry (CII) (2012).Non-linear Models: Driving the Next Phase of Growth of the Indian IT Industry.
Kumar, Nagesh (2005). Indian Software Industry Development: National and International
Perspectives, A.S. Vijayabaskar, ed. New Delhi: Sage Publications India.
Liu, Aying, Shujie Yao, and Zongyi Zhang (1999). Economic growth and structural changes inemployment and investment in China, 1985-94. Economics of Planning, vol. 32, No. 3,pp. 171-190.
Lundequist, Per, and Dominic Power (2002). Putting Porter into practice? Practices of regional clusterbuilding: evidence from Sweden. European Planning Studies, vol. 10, No. 6, pp. 685-704.
Marshall, Alfred, and Mary Paley Marshall (1920). Principals of Economics. London: Macmillan.
National Association of Software and Services Companies (NASSCOM) (2010). Strategic Review.
New Delhi.
(2013). Strategic Review. Delhi.
(2015). Strategic Review. Delhi.
National Association of Software and Services Companies (NASSCOM), and A T Kearney (2008).Location roadmap for IT-BPO growth: assessment of 50 leading cities. Available from http://akwl.org/wp-content/uploads/2016/01/nasscom_report.pdf.
Pais, J., and others (2006). Employment Implications of Growing Exports of Services. New Delhi:Institute for Studies in Industrial Development.
Perloff, Harvey S., and Lowdon Wingo Jr. (1961). Natural resource endowment and regionaleconomic growth. In Natural Resources and Economoc Growth, J.J. Spengler, ed.Washington, D.C.
Perroux, Francois (1950). Economic space: theory and applications. Quaterly Journal of Economics,
vol. 64, No. 1, pp. 89-104.
Porter, Michael E. (1998). Clusters and the New Economics of Competition. Harvard Business
Review, vol. 76, No. 6. pp. 77-90.
Ramachandran, Kavil, and Sougat Ray (2005). Formation of information technology clusters: how latemovers follow models diffrent from early movers. Working Paper Series. Indian School ofBusiness. Available from https://pdfs.semanticscholar.org/0291/233aa0209610880b954ba7dae5be1ff5b85e.pdf.
Randall, J.N. (1973). Shift-share analysis as a guide to the employment performance of West CentralScotland. Scottish Journal of Political Economy, vol. 20, No. 1, pp. 1-26.
Rostow, Walt W. (1960). The Stages of Economic Growth: A Non-Communist Manifesto. London:Cambridge University Press.

Asia-Pacific Development Journal Vol. 24, No. 1, June 2017
116
Sawhney, Aparna (2005). An analysis of factors responsible for the Indian information technologysector growth: signalling quality. In Information Communication Technology and Economic
Development, T. Thatchenkery and R. Stough, eds. Massachusetts: Edward Elgar.
Software Technology Parks of India (STPI) (2011). Annual Reports 2009-10. New Delhi.
(2012). Annual Reports 2010-11. New Delhi.
(2013). Annual Reports, 2011-12, New Delhi.
(2014). Annual Reports 2012-13. New Delhi.
Solow, Robert M. (1959). A contribution to the theory of economic growth. Quaterly Journal of
Economics, vol. 70, pp. 65-94.
Stimson, Robert J., Roger R. Stough, and Brian H. Roberts (2006). Regional Economic Development:
Analysis and Planning Strategy, 2nd ed. New York: Springer.
Surie, G. (2005). Development through knowledge: capability replication in global innovationcommunities. In Information Communiction Technology and Economic Development,
T. Thatchenkery and R. Stough, eds. Massachusetts: Edward Elgar.
Telecom Regulatory Authority of India (TRAI) (2011). Recommendations on TelecommunicationsInfrastructure Policy. Available from www.trai.gov.in.
Van Dijk, Meine Peter (2003). Government policy with respect to an information technology cluster inBangalore, India. The European Journal of Development Research, vol. 15, No. 2,pp. 93-108.
Vijayabaskar, M., and Girij Krishnaswamy (2004). Understanding growth dynamism and itsconstraints in hig-technology clusters in developing countries: a study of Bangalore,Southern India. In Innovation, Learning and Technological Dynamism of Developing
Countries, S. Mani and H. Romijn, eds. New York: United Nations University Press.