informational barriers to market access: …
TRANSCRIPT

Discussion Paper
INFORMATIONAL BARRIERS TO MARKET ACCESS: EXPERIMENTAL EVIDENCE FROM LIBERIAN FIRMS
Jonas Hjort, Vinayak Iyer, and Golvine de Rochambeau
SCIENCES PO ECONOMICS DISCUSSION PAPER
No. 2020-09

Informational Barriers to Market Access:
Experimental Evidence from Liberian Firms∗
Jonas Hjort
Columbia U. & BREAD
& CEPR & NBER
Vinayak Iyer
Columbia U.
Golvine de Rochambeau
Sciences Po
July 30, 2020
Abstract
Evidence suggests that firms in poor countries stagnate because they cannot accessgrowth-conducive markets. We hypothesize that overlooked heterogeneity in market-ing ability distorts market access. To investigate, we gave a random subset of Liberianfirms vouchers for a week-long program that teaches how to sell to corporations, gov-ernments, and other large buyers. Firms that participate win about three times asmany contracts, but only firms with access to the Internet benefit. We use a simplemodel and variation in online and offline demand to show evidence that this is be-cause ICT dampens traditional information frictions, but not marketing barriers.
∗[email protected], [email protected], [email protected] thank Vittorio Bassi, Katarzyna Bilicka, Dave Donaldson, Amit Khandelwal, Andrea Prat, Eric Ver-hoogen, and seminar participants at Columbia, Cornell, Essex, the Graduate Institute of Geneva, the IndianStatistical Institute, Yale, Sciences Po, Zurich, and the webinar series on Firms, Markets, and Development(FIMAD) for helpful comments; Junyi Que for stellar research assistance; the IGC for financial support; IPAand Q&A Liberia for great field-work; and Building Markets for data-sharing and great collaboration. Theproject was registered in the AEA RCT Registry, ID 0002264.
1

1 Introduction
Firms in poor countries often grow slowly (Bloom et al., 2010; Hsieh & Klenow, 2014; Ver-hoogen, 2020). One class of explanations focuses on productivity—the cost firms incurto produce goods and services—and another on ability to access markets. In the formerline of research, many studies attempt to make firms more productive by loosening vari-ous production contraints, such as access to credit and management practices. The resultshave been mixed (McKenzie & Woodruff, 2014; Quinn & Woodruff, 2019).1 The otherstrand of the literature instead assesses the importance of demand constraints. Thereis growing evidence that access to bigger and more quality-sensitive markets can raisefirm growth (Verhoogen, 2008; Syverson, 2011; Hornbeck & Rotemberg, 2019; Goldberg &Reed, 2020), and small firms in particular appear to benefit from selling to large buyers(Hoekman & Sanfilippo, 2018; Alfaro-Urena et al., 2019; Abebe et al., 2020).
Why are some firms better able to access desirable markets than others? What are thefactors that influence market access? The existing literature in large part considers infras-tructure, tariffs, and other traditional trade costs that affect different types of firms dif-ferently (see e.g. De Loecker & Goldberg, 2014; Donaldson & Hornbeck, 2016). However,ability to market products appears to vary substantially even across firms of similar sizeand productivity that are located near each other. This suggests that overlooked formsof access barriers may constrain growth. The literature on information frictions in poorcountries points towards one (Jensen, 2007; Allen, 2014; Startz, 2018; Atkin et al., 2017b).Studies that experimentally vary contract allocation find, in particular, that randomly cho-sen small firms can successfully supply large buyers (Ferraz et al., 2016; Atkin et al., 2017a;Carrillo et al., 2019). But firms themselves must normally sell their goods and services inthe marketplace. Might heterogeneity in their ability to do so—marketing ability—distortaccess to markets?
In this paper we experimentally enhance Liberian firms’ ability to market their prod-ucts to corporations, governments, and other large buyers. This is to our knowledge thefirst attempt to investigate how exogenous variation in individual firms’ ability to accessa particular market affects their growth. The source of demand we focus on—buyers thatpurchase goods and services through tenders and other formal contracts—is an especiallyimportant one: public procurement alone makes up roughly 12 percent of worldwideGDP and more in low-income countries (Bosio et al., 2020). Our analysis begins to charac-terize how limited marketing ability and its interaction with more widely studied forms
1The training and input programs that have shown bigger impacts on firm growth have generally beentailored to individual firms and/or very expensive (see e.g. Bloom et al. (2013) and Bruhn et al. (2018), andMcKenzie & Woodruff (2014); Quinn & Woodruff (2019); Verhoogen (2020) for discussion.)
2

of information frictions excludes productive suppliers from growth opportunities.The paper has five parts. First we present a simple theoretical framework in which a
firm’s probability of winning both formal bidding processes—tenders—and non-tenderformal contracts the firm pursues depends on its underlying ability to identify and appealto buyers’ preferences. We then estimate the average impact of a seven-day training pro-gram that teaches Liberian firms how to construct good bids on tenders from large buyers.Next we show how the impact of the program varies with access to the Internet. We thenuse the model to illustrate why marketing knowledge may interact with firms’ technolog-ical ability both (i) to access contracts that are publicized online—typically tenders—and(ii) to search for information about, be found by, and communicate with tender and non-tender buyers through ICT. Finally, we take advantage of trained firms’ differential expo-sure to online demand shocks—arbitrary variation over time in the share of tenders thatare publicized online—and the fact that we observe the composition of contracts firmswin. This helps us empirically test for the online market access and search and communicationchannels through which ICT may mediate the impact of marketing ability on sales.
With 14 employees on average, the firms in our sample are by local standards medium-sized. The sample is drawn from a registry of firms in Monrovia—Liberia’s capital city—which is maintained by Building Markets, the non-profit we work with. To be included inthe registry, firms have to be formally registered and active. The sample firms come froma wide range of sectors, including “Construction and Renovation” (23 percent), “Food andBeverages” (15 percent), “Home Essentials” (13 percent), and “Handicrafts and Artisans”(12 percent). Like most small and medium-sized firms in poor countries, they have lit-tle experience supplying to large buyers and instead sell mostly to final consumers, thusstruggling to build reputation (Macchiavello & Morjaria, 2015). Twelve percent held a con-tract awarded through a formal bidding process in the six months preceding the baselinesurvey.2
The seven day-long Winning-contracts training our analysis focuses on aims to changethis. Run by the non-profit, it teaches firms how to bid on tenders from corporations,government entities, and other large buyers. The training is not sector-specific and fo-cuses exclusively on how to participate and succeed in the procurement market. One partteaches fundamentals of bidding and common buyer preferences such as favoring “green”suppliers.3 A second part provides practice and feedback on mock bids.
2A policy goal of the Government of Liberia is to steer public procurement contracts towards smaller,domestic firms. In 2014, they passed the “Small Business Empowerment Act”, which mandates all govern-ment entities to allocate at least 25 percent of their total procurement budget to Liberian-owned small andmedium-sized firms. However, very few government entities are in compliance with the law.
3This example is illustrative. Most firms in our sample use little energy and would therefore be consid-
3
The research team first visited the firms in the treatment group from June to August of2016.4 Research assistants gave the firms’ managers a free voucher to attend the trainingand information about otherwise similar firms which took the training in the past. Thenon-profit then ran training sessions throughout the study period. The encouragement(voucher+information) persuaded about 20 percent of firms in the treatment group to takethe training. They mostly did so during July – September 2016. Endline data collectiontook place from March – June 2017.
We use a simple model to frame our analysis. A buyer selects a supplier from a setof bidders based on requested prices and auxiliary features such as engaging in environ-mentally friendly production. Buyers don’t have perfect information about bidders so thewinning supplier can earn rents. These depend not only on production costs, but alsomarketing ability. Since tender-winning knowledge may also improve firms’ ability towin non-tender formal contracts, the impact of the training on effort devoted respectivelyto bidding on tenders and pursuing other contracts is ambiguous.
In the first part of our empirical analysis, we show that firms that learn how to markettheir products to large buyers bid on more tenders; win more tenders; and win contractsof higher quality. Firms in the treatment group that take the training are for example morethan twice as likely to win a contract lasting longer than six months. We also find that en-hanced contract-winning knowledge significantly increases the number of contracts firmswin through other means than formal tenders. Winning more and higher-quality contractsappears to ultimately improve firm performance. Our estimates suggest that treated firmsthat take the training earn about USD 10,000 in revenue from contracts over the course ofsix months above and beyond a control group mean of about USD 5,000, although thisestimate is not statistically significant. The overall impact of the Winning-contracts train-ing suggests that allocative efficiency may be considerably greater if all firms were able tocompetitively pursue formal contracts.5
In the second part of our analysis, we estimate how the benefits of enhanced marketingability vary with Internet connectivity. If contract-winning knowledge constrains accessto desirable buyers by amplifying information frictions, we a priori expect the impact ofWinning-contracts training to positively interact with firms’ access to ICT. Conversely, theInternet and similar technologies may themselves allow firms to overcome informational
ered “green”, but few were aware of this before taking the training.4We measure the initial characteristics of firms in the sample frame using pre-baseline periodical surveys
conducted by the non-profit. These were also used to stratify the randomization.5This is because the training program expands the set of potential contract-winners. The experiment was
not designed to test the program’s market-wide efficiency consequences. However, our findings suggestthat these would likely be positive if contracts tend to be awarded to the most productive suppliers whenall suppliers have the ability to effectively convey their qualifications to buyers (see Section 4).
4

barriers to marketing their products, in which case we would expect a negatively signedinteraction effect. The distinction is important because Internet access is rapidly expand-ing in poor countries.
We find that the Winning-contracts training raises the number of tenders firms bid on,total contracts won, non-tender contracts won, and revenue from contracts only amongfirms that use the Internet for business purposes at baseline. A double-LASSO regulariza-tion procedure suggests that Internet use is the strongest predictor in our baseline data ofa large treatment effect of the training (Chernozhukov et al., 2018). Simultaneously includ-ing interactions between the treatment and other observable proxies for firm type that maycorrelate with Internet access barely affects the estimated coefficient on training×Internet.
To guide our investigation of the mechanisms underlying these results, we expand thetheoretical framework to include ICT. In our model, Internet access can “convert” mar-keting ability into sales for two reasons. First, through directly expanded market access:some contracts, and in particular many tenders, are only publicized online. Second, by fa-cilitating suppliers’ ability to search for information about, be found by, and communicatewith buyers, whether or not the buyers publicize their contracts online. Firms with Inter-net access are then expected to bid on and win more tenders when their tender-winningknowledge is enhanced, while the effect on effort pursuing non-tender contracts is am-biguous. The latter effect is expected to be positive when online demand is low becauseof the search and communication function of Internet.
To test these predictions, we take advantage of variation over time in the share of ten-ders that are publicized online and offline (for example in newspapers). Treated firms aredifferentially exposed to (relative) online demand shocks because they take the Winning-contracts training at different times.6
We find evidence pointing towards a role for Internet’s search and communication func-tion in converting marketing ability into sales. In particular, the benefits of the Winning-contracts training are concentrated among firms with Internet access even when online de-mand is low. At such times ICT-connected firms with enhanced contract-winning knowl-edge win more non-tender contracts.
We further find evidence that Internet’s online market access function also helps firmswith enhanced marketing ability win formal contracts. Specifically, firms with Internetaccess win both more non-tender contracts and more tenders after learning how to craftcompetitive bids if online demand is high. Trained firms with Internet access also win
6We show that, relative to the time variation in online and offline tender postings, the timing of firmstaking the Winning-contracts training appears arbitrary. Since firms themselves choose when to take thetraining, we nevertheless instrument for a firm’s training date with the date the research team first visitedthe firm. The first visit date was unrelated to contract demand shocks.
5

higher-quality contracts when online demand is high, perhaps reflecting a difference be-tween the attributes of tender and non-tender contracts. These shifts due to online de-mand shocks appear to persist in the longer-run—after the shocks themselves—pointingtowards learning-by-doing dynamics in tender-winning (see also Foster et al., 2016; Atkinet al., 2017a).
In sum this paper documents that many productive firms face a limited market be-cause they don’t know how to sell their products to growth-conducive buyers. Liberiansuppliers need both such marketing ability and the technology necessary to interact withlarge buyers to win more formal contracts. The implied inequality of opportunity mayhelp explain the slow average growth of firms in poor countries.
We contribute to three related strands of the literature on information frictions andaccess to markets in the developing world. First, this paper documents the dramatic con-sequences of an overlooked informational barrier to selling to large buyers. We build onresearch on knowledge constraints that estimates how complex forms and procedures pre-vent disadvantaged individuals from conveying productive qualifications (see e.g. Jensen,2010; Bettinger et al., 2012; Kling et al., 2012; Chetty & Saez, 2013).7 We add to growing evi-dence that informational barriers can be surprisingly costly to overcome also for firms (seee.g. Atkin et al., 2017b; Almunia et al., 2019), and that information-constrained sales andmarketing procedures may be especially consequential (Anderson et al., 2018; DellaVigna& Gentzkow, 2019; Hortacsu et al., 2019).8 By documenting that large demand-side clientsin effect speak another language than small firms, we connect the information-constraineddecision-making literature with work on market access and firm growth.
Conversely, we advance the literature on the causes and consequences of access tobuyers by establishing a particular reason why productive firms in developing countriesrarely participate in growth-conducive value chains.9 That access to demand can be im-
7Recent studies also suggest that supply-side—worker—variation in ability to convey productive qual-ifications to buyers—employers—severely distorts labor markets in developing countries (Hardy & Mc-Casland, 2017; Abebe et al., 2019; Bassi & Nansamba, 2019; Carranza et al., 2019).
8We know of one other paper that experimentally varies the marketing ability of firms in a poor country:Anderson et al. (2018). Their focus differs from ours: they study small-scale retail entrepreneurs ratherthan medium-sized, multi-sector formal firms, and analyze the impact of an intensive 10-week training,rather than a short program narrowly focused on accessing a particular market. However, Anderson et al.(2018)’s results are consistent with ours in that they find remarkably large impacts of marketing ability onsales and profits in South Africa. Some similarly hands-on consulting programs studied in the literature—e.g. in Bruhn et al. (2018)—include marketing among multiple modules in a tailored and/or broad trainingpackage, but do not study the impact of enhanced marketing ability itself.
9In addition to the more empirical work cited above—see Verhoogen (2008), Foster et al. (2016), andPozzi & Schivardi (2016) for examples, and Syverson (2011); De Loecker & Goldberg (2014) for overviews ofrelated literatures—there is a burgeoning theoretical literature focusing on how demand forces affect firmdynamics (see e.g. Drozd & Nosal, 2012; Gourio & Rudanko, 2014; Arkolakis et al., 2018), and a growingbody of work on industrial policy (see e.g. Lee, 2017; Lane, 2019).
6

portant for firm growth—a belief commonly reflected in policy (Lederman et al., 2010)—ismost clearly shown in studies that exploit random or quasi-random allocation of contracts(Ferraz et al., 2016; Atkin et al., 2017a; Carrillo et al., 2019). This paper to our knowledgeprovides the first direct evidence on why some firms are able to sell goods and services toa particular market while similar firms in the same location are not.10
Finally, we begin to unpack how lack of information distorts input markets. Infor-mation frictions have first-order consequences for firms in developing countries (Jensen,2007; Allen, 2014; Jensen & Miller, 2018; Hjort & Poulsen, 2019). Prior studies documentthe distortions arising from classical frictions—constrained contracting, matching, andsearch—in low-information markets (see e.g. Startz, 2018; Mitra et al., 2018; Hansmanet al., 2019). We instead show how firms’ own ability to sell goods and services affectparticipation in input markets, and how such marketing ability interacts with traditionalinformation frictions that Internet’s online market access and search and communication func-tions can help overcome.11
2 Context and Experimental Design
In this section we describe the context Liberian firms operate in, and the design of theexperiment we use to investigate how informational barriers to marketing goods and ser-vices affect their access to demand.
2.1 Firms and procurement by large buyers in Liberia
Most firms in Liberia are small. In 2013, the country conducted a national economic cen-sus aimed at counting all businesses with a solid physical structure. The census reportsdata on about 21,500 firms and confirms common observations from other low-incomeeconomies. The average firm has 7.3 employees, 63 percent have less than three employ-ees, and 98.5 percent have less than 50.
The non-profit we work with attempts to record all formal tenders in Liberia. In 2016,it recorded 1,381 tenders. Summary statistics of these tenders are shown in Table 1. A little
10As noted above, research on causes of market access has focused on traditional forms of trade barriersthat differentially constrain the sales of firms of different types, for example those located in different areas(see e.g. Faber, 2014; Atkin & Donaldson, 2015; Donaldson & Hornbeck, 2016; Hornbeck & Rotemberg, 2019).
11Most existing research focuses on how buyers’ access to information affects market outcomes like pricedispersion and pass-through (see e.g. Aker, 2010). Jensen (2007) and Mitra et al. (2018) are closer to thispaper in that they analyze how suppliers’ access to information affects market outcomes. This paper is alsorelated to Hjort & Poulsen (2019), but unlike them, we document why Internet connectivity can help firmsin poor countries’ access markets.
7

more than half are from public sector buyers such as ministries; a small minority (about2 percent) from private companies; and the remainder from international organizations.Most tenders are posted publicly: 57 percent in newspapers and another 31 percent online.Twelve percent are publicized only through word-of-mouth.12 Anecdotally, many largebuyers report that they have a hard time finding small and medium-sized suppliers thatmeet the requirements to fulfill their contracts.
2.2 Sample
The sampling frame for the experiment we carried out was Building Markets’ directoryof active firms in Liberia. The organization’s goal is to integrate local small and medium-sized firms into value chains by enabling them to win contracts. They maintain onlinedirectories of thousands of firms in several developing countries, akin to the Yellow Pages.The Liberian directory included more than 4,000 firms in 2017.
To be included in the sample, firms had to:
• Be listed on the non-profit’s business directory
• Have at least one employee in addition to the owner
• Be located in Monrovia, the capital city
• Have not already taken the Winning-contracts training
In addition, since a lot of firms closed down after the 2014-2016 West African Ebola out-break, only firms that had been in contact with the non-profit after April 2015 (when theoutbreak subsided) were included in the sampling frame.
The firms in the sample span many different sectors, the largest being “Constructionand Renovation” (23 percent), “Food and Beverages” (16 percent), and “Home Essen-tials” (13 percent). We show this and other summary statistics from before the experimentstarted in Table 2. These data come from periodical surveys the non-profit carries out tokeep track of the firms in its directory. The mean number of employees is 14, and there ishuge variation in this measure of firm size: the standard deviation is 43. Ninety percentof the firms have at least one Liberian owner. Thirty-four percent of the managers speakat least one local language in addition to Liberian English.
Relative to all firms in Liberia’s economic census, firms with between five and 20employees are over-represented in our sample, while the smallest and bigger firms are
12Public sector buyers publicize 85 percent of their tenders in newspapers and 14 percent online. In-ternational organizations publicize 32 percent of their tenders in newspapers and 45 percent online. Theremaining tenders are only advertised through word-of-mouth.
8

under-represented. This is shown in Panel A of Figure 1. Relative instead to otherwisecomparable firms which had participated in the non-profit’s Winning-contracts trainingin the past—those that satisfy the other three sample requirements above—firms withfewer than 10 employees are overrepresented in our sample, as shown in Panel B.13
The firms in the sample have little experience supplying to large buyers. Twenty-one percent bid on one or more tenders in the six months before being interviewed, and12 percent won one or more tenders. The average success rate—tenders won relative totenders the firm bid on—is 32 percent.
2.3 The Winning-contracts training
We randomly assigned firms in the sample to treatment (772 firms) and control (420 firms)groups. The randomization was stratified on number-of-employees bins, sector, and thegeographical zone within Monrovia in which the firm is located. The treatment and con-trol groups are balanced, as shown in the first two columns of Table 3.
The research team visited the treatment group firms starting in June 2016 and gaveeach one a voucher allowing one person from the firm to attend the Winning-contractstraining for free.14 The firms were also asked to answer a survey and given informationabout the training. This information included the training’s content, as well as statisticson how participation correlated with bidding and various measures of success for firmslike theirs in the past, as measured in data from the non-profit’s periodical surveys.15
The training content focuses exclusively on how to bid on and win formal contracts.It is not aimed at raising a firm’s productivity: neither of the two training sessions aresector-specific, and there is no mention of management practices, financial planning, orproduct development. There is also no mention of how use of the Internet can help firms.
The first training session lasts five days and is referred to as General Procurement train-ing. This session teaches participants the fundamentals of the process of bidding on ten-ders: how to find tenders and how to bid. The General Procurement session also providesinformation about supplier and bid characteristics that many buyers require or put weighton when awarding a contract. Examples include environmental awareness, ethical behav-
13More precisely, the benchmark firms in Panel B include both the firms in our sample and those that arelisted on the non-profit’s business directory; have at least one employee, and are located in Monrovia, buthave taken the Winning-contracts training in the past. Doing so cost a fee of about USD 50.
14The voucher did not have an expiration date and could be used when desired.15As specified in the pre-analysis plan, the voucher was combined with different statistics on how par-
ticipation correlated with bidding on and winning contracts in the past in several different sub-treatmentsused to encourage firms to attend the training. However, we do not observe differences in effects of thesesub-treatments in either take-up or effect of the treatment. In the analysis presented here, all sub-treatmentsare combined.
9

ior, and sensitivity to cultural differences or persons with disabilities. Clarifying these isan important aspect of the training because many participants say that they find such aux-iliary buyer preferences confusing. For example, most small and medium-sized firms inLiberia use little energy and therefore would be considered “green” businesses, but manyfail to mention this in their bids.
Completing the first week of training is required to participate in the second trainingsession, called Bid Compilation training. This session lasts two days and offers a hands-on toolkit for producing bids. Participants do exercises in which they examine a mocktender, prepare a draft bid, learn to communicate with procurement officers, and undergoevaluation of their bid. The second training session in essence teaches firms how to engagewith buyers at the different stages of the tender process.
Almost all firms in the sample that took the training did so from June 2016 to Novem-ber 2016.16 The non-profit offered two to three training sessions per month dependingon demand, and a total of eight training sessions. On average 32 attendees from firms in11 different sectors participated in each training session. Figure 2 summarizes the experi-mental design and the timeline of the experiment.
2.4 Data
Our analysis is based on data collected in three rounds: pre-baseline, baseline, and end-line. Firms listed in the non-profit’s directory are asked to answer a phone survey everythree to six months. The data collected through these phone surveys were made avail-able to the research team. We refer to the last round before the data collection for theexperiment itself as the pre-baseline data.
The research team collected the baseline data starting in June 2016. When researchassistants visited firms in the treatment group to give them the training voucher, they alsoasked the firms to answer a survey. By construction, this baseline data round only coversthe firms in the treatment group.
Lastly, the research team attempted to re-interview all firms in the full sample for anendline survey conducted from March to June 2017. Out of the 1,192 firms in the sample,we successfully (re-) surveyed 831 firms: 295 in the control group, and 533 in the treatmentgroup. The survey team’s use of a battery of tracking techniques—both phone and in-person search, GPS devices, flexible scheduling of interviews, etc—kept attrition low. Thefirms which answered the endline survey are slightly different from firms which did not.17
16Three firms took the training in January 2017.17This is shown in Appendix Table A.1. Appendix Table A.2 shows that the treatment and control groups
are balanced also in the sample of firms that were interviewed at endline, as well as summary statistics for
10

However, there was no differential attrition across the treatment and control groups, asshown in the last two columns of Table 3.
3 Conceptual Framework Part 1: Bidding on Contracts
In this section we present a simple model that illustrates how firms may benefit fromenhanced marketing knowledge.
A buyer selects a supplier from bids submitted by firms in an auction. The bids statethe price and/or the quality of the products on offer, but also auxiliary features such asthe firm’s environmental awareness. Certain features may be required, while auxiliaryfeatures are substitutable. For example, conditional on the bidder being able to providea certain quality, a buyer might be willing to choose a higher price bid if the bidder re-ports great environmental awareness. The tender market is also marked by informationasymmetry since buyers don’t have perfect information about bidders. Therefore win-ning bidders can earn rents, the size of which depend not only on the firm’s productioncosts but also their knowledge of buyers’ preferences over auxiliary features—marketingknowledge.
We now formalize these ideas in a simple bidding model.
3.1 Model set-up
A firm benefits from two types of contracts: those that are won through tenders in anauction, and non-tender contracts that do not require formal bidding. Its profit can thusbe written as
Nr(a, b) + π(e, s)− βc(e+ kb) (1)
whereN is the total number of open tenders and r(a, b) the expected rent extracted from abid. r depends on a, the tender-winning knowledge of the firm, and b, the number of bidssubmitted—a measure of the firm’s effort to win contracts through tenders. Nr(a, b) isthus the firm’s expected rent over all open tenders. π(e, s) is the profit a firm makes fromnon-tender contracts. π is a function of e, the firms’ efforts to win contracts outside of thetender market, and s, the firm’s non-tender contract-winning knowledge. The functionc(e+ kb) measures the cost of seeking contracts for the firm. k measures the relative costof effort devoted to winning contracts in the tender markets to that in non-tender markets.c depends on the weighted sum of the firm’s marketing effort in and out of the tendermarket, and its weight in the profit function is β.
firms in this restricted sample.
11

We make standard assumptions on the shape of the functions r, π and c. r is increasingin the number of tenders the firm bids on and its tender-winning knowledge (ra, rb > 0)and concave in a and b (raa, rbb < 0). We also assume that tender-winning knowledgeand bidding effort are complementary, so that the marginal rent from an additional bid ishigher if firms have higher tender-winning knowledge (rab > 0). Similarly, we assume πis increasing (πe, πs > 0) and concave in both arguments (πee, πss < 0) and that knowledgeand effort are complementary (πes ≥ 0). We assume the cost function to be increasing(c′ > 0) and convex (c′′ > 0).
3.2 Winning-contracts training
We think of both tender-winning knowledge and non-tender contract-winning knowl-edge as functions of a general marketing ability α. This ability represents, for example,the firm’s capacity to identify and appeal to buyers’ preferences, or to convey the firm’sproductive qualifications to buyers. Naturally, we suppose both forms of knowledge s(α)and a(α) to be increasing and concave in the general ability α.
Proposition 1. The effect of Winning-contracts training on a firm’s profits is unambiguouslypositive. However, with no further assumptions on s′(α) and a′(α), the effect of the training onthe number of tenders the firm bids on and its effort pursuing non-tender contracts is ambiguous.
Proof. Firms choose the number of tenders to bid on and the effort pursuing non-tendercontracts to maximize profits, and satisfy the first order conditions:
Nrb − βkc′ = 0
πe − βc′ = 0
The Jacobian matrix J(b, e) is
[Nrbb − βk2c′′ −βkc′′
−βkc′′ πee − βc′′
]whose determinant is
D = Nrbb(πee − βc′′)− βk2c′′πee > 0
By the Implicit Function Theorem, there exist unique continuously differentiable functionsb(N ,α, β, k) and e(N ,α, β, k) over an open set, such that
bα = − 1D{Nrbaaα(πee − βc′′) + πessαβkc
′′} (2)
eα = − 1D{Nrbaaαβkc′′ + (Nrbb − βk2c′′)πessα} (3)
12

The first term in the bracket of (2) is negative while the second term is positive. Withno further assumptions, whether or not Winning-contracts training increases the numberof tenders firms bid on is thus ambiguous. Similarly, the sign of the effect on the effort towin non-tender contracts is also ambiguous.
Let V (α, b∗(α), e∗(α)) denote the maximized profit of the firm. By the Envelope Theo-rem, the effect of the training on profit is therefore
dV
dα= Nraaα +Nrbbα + πeeα + πssα − βc′(eα + kbα)
= Nraaα + πssα + bα[Nrb − βkc′] + eα[πe − βc′]
= Nraaα + πssα > 0
where the inequality is given by the FOCs.
Proposition (1) shows that enhanced contract-winning knowledge is expected to in-crease firms’ profit. The impact of Winning-contracts training may come from biddingon more tenders, exerting greater effort to win non-tender contracts, or both, dependingon the relative increase in the marginal payoff to the two sales activities caused by thetraining. This intuition is further developed in the following proposition:
Proposition 2. Winning-contracts training increases the number of tenders firms bid on if (i) theeffect of the training on tender-winning knowledge is significantly bigger than the effect on non-tender contract-winning knowledge, (ii) the demand in the tender market is sufficiently large, and(iii) the search and communication costs necessary to win contracts are sufficiently small.
Proof. From (1) we have that
bα > 0 ⇐⇒ Nrbaaα(βc′′ − πee) > πessαβkc
′′ (4)
The larger N—the number of open tenders—the more likely the above inequality is tohold, which shows part (ii) of Proposition 2.
Inequality (4) can be re-written
aα > Csα
where C = πeskc′′
Nrba(c′′−πeeβ ). This shows that the inequality holds if the effect of Winning-
contracts training on tender-winning knowledge aα is significantly bigger than the effecton non-tender contract-winning knowledge sα, which shows part (i) of Proposition 2.
13
Further, since πee < 0, the denominator of C is larger when β is small. Therefore, thesmaller the cost of seeking contracts β, the more likely bα is to be positive, which showspart (iii) of Proposition 2.
Given a small increase in the general marketing ability underlying both types of salesknowledge, firms reassign their efforts between pursuing non-tender contracts and bid-ding on tenders, depending on the new marginal payoff to these two types of effort. If theincrease in general marketing ability improves tender-winning knowledge more, firmswill shift effort from non-tender markets to the tender market.
3.3 Information frictions
The framework presented in this section focuses on a different form of information fric-tions than existing research: variation in marketing knowledge resulting in a “wedge” inthe rents from contracts that differs across equally productive firms. However, the intu-ition underlying the model also suggests that such distortionary variation in marketingknowledge may interact with traditional information frictions and in particular the tech-nologies used to dampen them in the modern economy. On the one hand, informationtechnology may reduce the benefits of enhanced contract-winning knowledge if the Inter-net and other ICTs themselves allow firms to overcome informational barriers to market-ing their products. On the other hand, information technology may increase the marginalbenefit of enhanced contract-winning knowledge if firms with access to such technologycan more easily find and bid on suitable contracts: firms that use the Internet may in ef-fect have access to a bigger market and more easily be able to search for and communicatewith buyers, for example. We investigate this empirically in Section 5 and return to theunderlying theoretical intuition in Section 6. Before doing so, we test propositions 1 and2 in the data from the experiment.
4 Average Impact of Winning-contracts Training
In this section we show that the opportunity to learn how to sell goods and services tolarge buyers induces Liberian firms to bid on and win more and higher-quality contracts.In Section 5 we explore heterogeneity in the impact of the Winning-contracts training wedocument in this section.
Where relevant we show results from both Intent-to-treat (ITT) regressions of the out-comes of interest on treatment status and Treatment-on-the-treated (TOT) regressions like
14

the following:yi = β0 + β1Winning-contracts Trainingi + γXi + εi (5)
Here yi is a measure of firm i’s expectations, behavior, or performance measured at end-line. Xi is a set of controls measured before the experiment, including fixed effects for afirm’s sector(s), location, and size bin fixed effects: we show results both with and with-out including these. Winning-contracts Trainingi is an indicator variable equal to one forfirms that participate in the training, and β1 is the coefficient of interest. We present tableswith TOT estimates in the top panel, and ITT estimates in the bottom panel.
4.1 Take-up of training and expectations
Firms in the treatment group are significantly more likely to attend the Winning-contractstraining. Those in the control group were not encouraged to attend the training, but fourcontrol group firms independently decided to pay to participate. Columns (1) and (2) ofTable 4 show that the treatment—that is, the voucher and encouragement to attend thetraining—increases the probability that a firm participates by 19-20 percentage points, asrecorded in the non-profit’s attendance sheet.18 Given this relatively high but incompletetake-up, the ITT estimates of impact are scaled down in magnitude relative to the TOTestimates that follow, but generally of similar statistical significance.
At endline, firms that were induced to participate in Winning-contracts training by thetreatment expect to bid on and win more tenders in the future. Trained firms expect tobid on about one—or 40-50 percent—more tenders in the coming six months, and to winabout 55 percent more of the tenders the firm bids on. We show this in Table 5.
4.2 Number of contracts won
Small- and medium-sized Liberian firms rarely bid on contracts awarded through a formaltender process. The control group firms in our sample bid on 0.35 tenders during the pastsix months on average. Winning a tender is even more rare: control group firms won anaverage of 0.16 contracts through a formal bidding process in the past six months.
18These numbers are for the first part of the Winning-contracts training, the General Procurement session.Panel A of Appendix Table A.3 shows the same coefficient for the second session, on Bid Compilation.Eighty-five percent of the firms that attend the first session also attend the second session, and treatmentincreases the probability of attending the second session by 17 percent (and to self-report participating inany type of training by about 15 percent, as we also show in Appendix Table A.3). In the results that follow,we estimate TOT effects for firms that embark on the Winning-contracts training. Note also that, followingAbadie et al. (2017), we present robust standard errors as there are neither sampling design nor experimentaldesign reasons for clustering in our context, although our results are robust to clustering at the sector level.
15

Enhanced contract-winning knowledge markedly increases in the number of contractsfirms bid on and win. We show this in Table 6. First, as seen in columns (1) and (2), firmsthat are encouraged to participate in Winning-contracts training bid on 0.16 more tendersin the past six months—an increase of nearly 50 percent compared to the control group.19
The estimated impact is even larger, as expected, for treated firms which took the training.We find a large positive impact also on the total number of contracts won. Firms that
take the Winning-contracts training because of the randomized encouragement win morethan one additional formal contract over the course of six months—an increase of over200 percent—as we show in columns (3) and (4) of Table 6. It thus appears that firms thatlearn how to market their products to large buyers can access a market that otherwisecomparable firms cannot.
The benefits of enhanced contract-winning knowledge extend beyond a greater abilityto win tenders, consistent with the framework in Section 3. To see this, we look at contractswon through other means than a tender process—those that do not require a formal bid—in columns (7) and (8) of Table 6. Being encouraged to participate in Winning-contractstraining raises the number of non-tender contracts won by about 60 percent compared tothe control group. As shown in columns (5) and (6), treated firms also win 53 percentmore contracts through formal bidding processes, though this estimate is only marginallystatistically significant.
4.3 Quality of contracts won
Learning how to market goods and services to large buyers increases not only the quan-tity, but also the quality of contracts Liberian firms win. First, treated firms that take theWinning-contracts training more than double their chances of winning long-lasting (sixmonths or more) contracts, our primary measure of contract quality. We show this inPanel A of Table 7.
Second, participating in the training also doubles firms’ chances of winning contractsfrom international clients, from 29 to 58 percent. We show this in Appendix Table A.4. Ex-porting often enables firm “upgrading” (Atkin et al., 2017a; Verhoogen, 2020), and grow-ing evidence suggests that supplying to foreign buyers operating in the home market cansimilarly benefit firms in poor countries (Abebe et al., 2020; Alfaro-Urena et al., 2019).
Finally, we find that firms that learn how to market their products to large buyers bid
19The first column of Appendix Table A.4 shows results on the extensive margin of bidding on tenders.The probability of bidding on any tenders is estimated to increase by about 75 percent. This estimate is notstatistically significant, but the magnitude suggests that the training likely positively affects the extensivemargin as well.
16

on and win a greater proportion of all tenders advertised for goods and services the firmspecializes in. We show this in Appendix Table A.4. The outcome variable is now thenumber of tenders a firm bids on or wins as a proportion of the total number advertisedwithin the primary sector the firm operates in, as measured in the non-profit’s database oftenders. The proportion of all own-sector contracts bid on and won is respectively around500 and 600 percent higher among firms induced to take the Winning-contracts trainingby the randomized encouragement.
4.4 Revenue earned
Learning how to market products to large buyers—and bidding on and winning moreformal contracts—appears to ultimately increase firms’ revenue considerably. We showthis in Panel B of Table 7. The estimates suggest that the total value of contracts won isaround USD 10,000, or 200 percent, higher in treated firms that take the Winning-contractstraining. Although remarkably large, this estimate is not statistically significant, perhapsbecause—as is common in firm surveys—many managers were unwilling to answer ques-tions about the value or sources of their contracts.20
The evidence we have presented in Section 4 shows that learning how to access largebuyer markets is remarkably beneficial for small- and medium-sized Liberian firms. Firmsthat are given the opportunity to participate in Winning-contracts training expect to bidon and win more tenders, and do in fact bid on and win more tender and non-tendercontracts, and contracts of higher quality. These gains may come in part at the expense ofstatus quo contract-winners. The firms that would have won the relevant formal contractshad treated firms not learned to compete for contracts are most likely larger firms outsideof our sample—the experimental design minimized any direct impact on control groupfirms.21 While the experiment was not designed to test the market-wide consequencesof Winning-contracts training, the results in this section point towards possible allocativeefficiency improvements from removing informational barriers to market access. Sup-pose that contracts will tend to be awarded to the most productive firms if every firm inthe economy has the ability to bid. If so, the treatment effects we have shown—Winning-
20We treat such missing values as zeroes. Firms in the treatment group were 21 percent more likely not toanswer value-of-contracts-won questions, suggesting that we may be underestimating the impact on valueof contracts won.
21Recall from Sub-section 2.4 that the research team did not collect data from the control group until theendline, suggesting that control group firms were most likely unaware that another group of firms wasbeing taught how to bid on tenders. Combined with control group firms rarely bidding on—and even morerarely winning—formal contracts in the status quo, this suggests that increased bidding on and winningcontracts by treatment group firms generally did not come at the expense of control group firms.
17

contracts training enabling some firms that ex ante lack sufficient contract-winning knowl-edge to bid on and win contracts—may reduce misallocation if scaled up.22
In the next section we show how a firm’s contract-winning knowledge interacts withits ability to access contracts and search for and communicate with buyers through theInternet.
5 How the Impact of Winning-contracts Training Varies with
Information Technology
In this section we show evidence that, in Liberia, only firms with access to modern infor-mation technology—the Internet—benefit from learning how to market their products tolarge buyers.
If complex input procurement procedures limit access to large buyers by amplifyinginformation frictions, we expect the Winning-contracts training to interact with suppliers’ability to find contracts and communicate with buyers. In the baseline survey, firms wereasked how often they use the Internet for business purposes. Respondents could choosebetween seven answers, ranging from “Every Day” to “Never”. The distribution of an-swers is shown in Figure 3. There is wide variation in access, with about 45 percent offirms reporting that they use the Internet for business purposes daily and 30 percent thatthey never do so.
Firms that use the Internet for business purposes are typically larger, and bid on andwin more tenders at baseline, as we show in Appendix Table A.5. Such firms also reportto find it easier to access tenders; to have sufficient time to prepare bids; and to betterunderstand the requirements in tender documents.
We now explore how the impact of Winning-contracts training differs for firms withaccess to the Internet. In Sub-section 5.2 we investigate whether any such heterogeneityis due only to differences between the types of firms that do and don’t have access to theInternet or also to the technology itself.
22In general, the impact of programs favoring potential bidders that a priori are unlikely to win contractson participation in procurement auctions and the price buyers ultimately pay is theoretically ambiguous (seee.g. McAfee & McMillan, 1989; Best et al., 2019). However, auction theory also suggests that the documentedincrease in the pool of potential bidders likely makes buyers better off and may improve allocative efficiencyif buyers award their contracts to the most qualified bidder.
18

5.1 Number and quality of contracts won and Internet access
The impact of Winning-contracts training is markedly different for firms with Internetaccess. To show this, we estimate the following regression:
yi = β0 + β1Winning-contracts trainingi (6)
+ β2Winning-contracts trainingi × Interneti + γXi + εi
We normalize the recorded measure of firms’ Internet use to unit scale so that Interneti = 1if firm i uses the Internet for business purposes every day at baseline and Interneti = 0 ifthe firm never does so at baseline.23 We restrict attention to the ITT results hereafter forsimplicity.
Winning-contracts training induces firms that use the Internet daily to bid on 0.5-0.7additional tenders over the course of six months, compared to the treatment’s impact onbidding by firms without Internet access. In fact, the estimates from (6) indicate that theopportunity to learn how to bid on formal tenders has no impact on the number of tendersfirms that do not use the Internet bid on. At baseline firms had bid on 0.35 tenders in thepast six months. The relative and total effect for firms with Internet access is thus large.We show these results in Table 8.24
Winning-contracts training also enables firms with Internet access to win more con-tracts, but has no such effect for firms that do not use the Internet. Columns (3)-(8) of Table8 show that the total number of contracts won; the number of contracts won through a ten-der; and the number of non-tender contracts won all tend to double or triple when a firmwith Internet access is encouraged to learn how to bid on and win tenders. In contrast,contracts won are unaffected for treated firms that do not use the Internet.
The impact of enhanced marketing ability on the quality of contracts won as measuredby contract length is considerably greater for firms that use the Internet. Such firms are26 percentage points or around twice as likely to win a contract lasting longer than sixmonths if encouraged to learn how to bid on tenders, as seen in Panel A of AppendixTable A.6. Firms that use the Internet also bid on and win a greater proportion of all
23Here Xi includes Interneti so that β2 captures the pure interaction effect.24Interestingly, the estimated effect of the treatment for firms without access to the Internet on most of
the outcomes in Table 8 is negative, though small in magnitude and statistically insignificant. A possibleexplanation is that participating in Winning-contracts training leads firms without Internet access to diverttheir sales effort from bidding on particular tenders that they are especially likely to win towards attempt-ing to win more non-tender formal contracts (consistent with the model in Section 3). Since such firmsultimately do not win more non-tender formal contracts after taking the training—the estimated effect onnon-tender contracts won is zero or slightly positive, though imprecisely estimated—this could explain apossible decrease in total contracts won, in addition to in bidding on and winning tenders.
19

tenders advertised for goods and services the firm specializes in. However, we do not findevidence that the increase in the probability of winning a contract from an internationalbuyer is greater for firms that use the Internet.
Learning how to access large buyers has a remarkably big ultimate impact on the valueof contracts won for firms with Internet access, but little effect for firms without Internetaccess. In Panel B of Appendix Table A.6 we show that treated firms that use the Internetwin contracts worth about USD 10,000 or 200 percent more than control firms, while theimpact on contract revenue is small and statistically insignificant for firms that do not usethe Internet. The average impact on revenue we documented in Section 4 is thus drivenentirely by firms with access to a technology that helps them search for, be found by, andcommunicate with buyers.
5.2 Use of the Internet versus differential access by firm type
We now show evidence suggesting that Internet technology itself helps firms use theirmarketing ability to win contracts from large buyers. To do so, we start by repeating re-gression (6) with additional controls included. These capture the interaction between theWinning-contracts training and a wide range of baseline firm characteristics that may cor-relate with Internet access: firm size as measured by employment, the firm’s counties ofoperation, the gender of the owner, sectors the firm operates in, languages used for busi-ness, the geographical zone the firm is located in, and the extent to which the firm bids ontenders at baseline.25 With these interactions included we continue to find, as in Table 8,that the increase in tender bids submitted, total number of contracts won, contracts wonthrough a tender, and the total value of contracts won is significantly greater for firmsthat use the Internet. The estimated coefficient on Winning-contracts trainingi× Interneti,shown in Appendix Table A.7, is in fact bigger in magnitude with these additional inter-action terms included.
We next show that Internet access is in fact the best predictor of firms’ conditionalaverage treatment effect (CATE) among the full set of firm characteristics captured in thedata we use.26 Following the LASSO procedure in Chernozhukov et al. (2018), we estimatethe best linear predictor of the CATE of the treatment on the number of tenders a firm bidson as follows:
1. We first split the full sample into two parts, the auxiliary sample and the main sample.
25Recall from the introduction that we measure the initial characteristics of firms using pre-baseline peri-odical surveys conducted by the non-profit that are available both for the treatment and control groups.
26The additional firm characteristics we interacted the treatment with in Appendix Table A.7 cover a widerange, but nevertheless represent a selection of such characteristics subjectively chosen by the authors.
20

The two are used respectively as the training set and the hold-out set.
2. We then use a LASSO regression of the number of bids on baseline observables es-timated on the control group part of the auxiliary sample to predict the number ofbids for the full auxiliary sample (control and treatment). A second LASSO regres-sion of number of bids on (i) the predicted output of the first LASSO regression and(ii) the interaction of treatment and baseline observables selects variables which bestpredict the heterogeneity of the treatment effect observed.
3. We then test the predictive power of the heterogeneity variables selected in the aux-iliary sample in step 2 on the main sample. Predicted number of bids is generatedon the main sample using the variables selected in step 2 with their associated coef-ficients from the auxiliary sample. The observed number of bids in the main sampleis regressed on the predicted number of bids based on the auxiliary sample. This al-lows us to test whether variables selected in step 2 accurately describe the observedheterogeneity in treatment effects.27
4. Finally, we run a cross-validation procedure wherein the main sample is used as thetraining set and the auxiliary sample as the hold-out set.
The results of this procedure depends on the random split of the sample. We thusbootstrap by repeating the procedure 100 times. Since each of these includes two estima-tions, the total number of LASSO estimations is 200. Out of these 200 estimations, 196were validated by the test for the hold-out set heterogeneity variables as good predictorsof heterogeneity. Appendix Table A.8 shows how many times each firm characteristic wasselected in the set of variables that best explain heterogeneity in treatment effects in thetraining set. Internet access is by far the variable selected the most times, 194.
In sum, the evidence in Appendix Tables A.7 and A.8 suggests that, in isolation, thebroader ways in which firms with and without Internet access differ are unlikely to fullyexplain the trainingi × Interneti interaction effect. The instrumental functions of Internettechnology itself appear to also help “connected” firms use contract-winning knowledgeto better access markets.
27A variable is said to accurately describe the observed heterogeneity if the p-value of its coefficient onthe main sample is smaller than 0.01.
21

6 Conceptual Framework Part 2: Bidding on Contracts with
and without Information Technology
In this section, we build on the framework introduced in Section 3 to formalize intuitionfor why firms with access to information technology may benefit more from marketingability.
6.1 Information technology
We consider two general ways in which information technology such as the Internetcan give firms a better starting point for accessing markets—greater potential for win-ning contracts. First, firms that invest in information technology are able to access somecontracts—a set of tenders—that can only be accessed online, directly expanding the mar-ket they face.28 Second, information technology reduces search and communication fric-tions, for example making it easier to correspond with buyers and possible to visit themin person less frequently. Online market access can be modeled by simply decomposingthe total number of tenders N as Non + Noff , where Non is the number of tenders onlyavailable online, and Noff is the number of tenders also available to firms not investingin Internet access. Easier search and communication can be modeled as a difference in β, theweight in front of the cost function. If we denote the firm’s Internet access choice by i, wecan now write the profit function in (1) with:
N =
Non +Noff i = 1
Noff i = 0
and
β =
β1 i = 1
β0 i = 0
with β1 < β0.
28The non-profit notifies the suppliers in its registry that belong to the relevant sector by SMS whenever atender is published. This system operates separately from our experiment, and both treatment and controlgroup firms receive such notifications. It is thus not surprising that Winning-contracts training itself hadno impact on the probability that a supplier in our sample reports to have found out about a tender fromthe non-profit. The reason why SMS notifications leave scope for Internet access helping firms find suitabletenders to bid on may be that the firms in our sample generally find the SMS notifications unhelpful. Fewsuppliers report to have found out about a tender they bid on from the non-profit, and many told us thatthey treat the SMS notifications as spam.
22
Proposition 3. The interactive effect of Winning-contracts training and Internet access on thenumber of tenders firms bid on is unambiguously positive, while that on effort to win non-tendercontracts is ambiguous. This last effect depends on the magnitude of the (a) greater (online) marketaccess and (b) lower search and communication costs firms with Internet access face.
Proof. The interactive effect of training and Internet is given by comparing bα betweenfirms with and without Internet access. From the Mean Value Theorem, this is given by:
bα(N1, β1)− bα(N0, β0) = bαN (N , β)Non + bαβ(N , β)∆β (7)
where (N , β) is a point between (N0, β0) and (N1, β1). Further, we have ∆β = β1− β0 < 0and we have that:
bαβ = −πessαkc′′Nrbbπee + k2c′′Nrbaaαπ
2ee
D2 < 0
bαN =(πee − βc′′)βkc′′(rbaaαkπee + rbbπessα)
D2 > 0
Therefore, (7) is positive.Similarly, the difference in the treatment effect on effort pursuing non-tender contracts
is given by :
eα(N1, β1)− eα(N0, β0) = eαNNon + eαβ∆β (8)
Since eαβ and eαN are both negative, the sign of (8) depends on the relative magnitude ofeach term.
Corollary 4. (1) Online Market Access Channel : If the impact of Winning-contracts trainingfor firms with Internet access is larger following an increase in online demand, then the onlinemarket access channel must exist.(2) Search and Communication Channel : If the effect of Winning-contracts training for firmswith Internet access is larger than that for firms without Internet access for non-tender contracts,then the search and communication channel must exist. This holds regardless of the level of onlinedemand.
Intuitively, if the Internet did not help convert marketing ability into access to buyersvia an online market access effect then online demand shocks should not differentiallybenefit trained Internet firms compared to non-Internet firms. Conversely, if the Internetdid not help convert marketing ability into access to buyers via a search and communi-cation channel then trained Internet firms should not have a comparative advantage in
23

winning non-tender contracts compared to non-Internet firms.
Proof. Proof of (1):The effect of an increase in online demand ∂Non on the interactive effect of the Winning-contracts training and Internet access, assuming that ∂bαβ ' 0, can be written
∂[bα(N1, β1)− bα(N0, β0)] = bαN∂Non + ∂bαNNon (9)
baN is decreasing in N so that ∂bαN < 0. So if the equation (9) above is positive, then it hasto be that ∂Non > 0: there is an online market access channel of the Internet.
Proof of (2):In equation (8), the first term eαNNon is negative, while the second term eαβ∆β is positive.Hence, if (8) is positive overall, it has to be that eαβ∆β > 0 and Internet firms benefit fromlower search and communication costs (i.e. ∆β < 0).
It is worth noting that this framework can easily be extended to a context where firms’general marketing ability α is endogenously influenced by firms’ experience in apply-ing to and winning contracts. Suppose for example that contract-winning is subject tolearning-by-doing effects. The intuition underlying the predictions laid out in this sectionthen implies that firms with Internet access which take the Winning-contracts trainingwin more contracts also in the long-run if they experience positive demand shocks earlyon. We investigate this possibility empirically in Sub-section 7.2. Before doing so, we testProposition 3 and Corollary 4 by exploiting variation in the composition of demand overtime.
7 Why the Impact of Winning-contracts Training Varies with
Information Technology
In this section we show evidence that Liberian firms that learn how to sell their products tolarge buyers can use the Internet to win formal contracts both because additional tendersare accessible online and because suppliers can search for and communicate with buyersonline.
In Section 4 we saw evidence that learning how to bid on and win formal tendersalso improves firms’ ability to win non-tender contracts. The framework in sections 3and 6 then predicts that Winning-contracts training should unambiguously increase effortto win non-tender contracts if the Internet facilitates market access through a search andcommunication function, especially when online tender demand is low. If in addition it
24

does so through an online market access function, the framework predicts that effort biddingon tenders may increase when online tender demand is high. To investigate, we thus usethe non-profit’s database of tenders published in Liberia. It records the date a tender ispublicized, the medium it is publicized through (newspaper, online or other), and therelevant supplier sector(s).
7.1 Online market access, search, and communication
Figure 4 shows the variation across time in the number of tenders publicized in 2016 foran average sector in Liberia. About one-third of tenders are publicized online, but thisproportion varies markedly from week to week. We use this variation to construct firm-specific online demand shocks. Non-tender contracts are rarely publicized online or inother public fora; contracts that are publicized online are almost always awarded througha formal tender process.
To investigate how firms’ effort pursuing contracts and bidding on tenders changeswith online demand, we estimate the following regression:
yi = β0 + β1Winning-contracts Trainingi (10)
+ β2Winning-contracts Trainingi ×Online Demandi
+ β3Winning-contracts Trainingi × Interneti
+ β4Winning-contracts Trainingi × Interneti ×Online Demandi
+ β5Interneti + γXi + εi
Here Online demandi is defined as the number of tenders for firm i’s sector(s) that arepublicized online in the three months after the firm’s training. Each supplier can—andmost do—list two sectors in the registry, and we include any that they list in the construc-tion of Online demandi. Individual firms are thus assigned the demand corresponding toone out of a wide array of sector combinations during the period after taking the training.We use “sector” as shorthand for these sectors and sector-combinations corresponding tofirms.
Xi is a set of controls that includes the ones used in previous sections.29 Here Xi
additionally includes the number of tenders for firm i’s sector(s) that are publicized offlinein the three months after the firm’s training (defined analogously to Online demandi) sothat we focus on relative online demand in the analysis.30
29These are employment, counties of operation, gender of the owner, sector fixed effects, languages usedfor business, geographical zone fixed effects, and the number of submitted bids, all measured at baseline.
30Note also that we specifically focus on variation in online demand when a firm’s marketing abil-
25

The effect of an increase in online demand is identified by within-sector variation infirms’ training timing since we control for sector fixed effects. Firms which took the train-ing earlier may have experienced more or less online demand in the three months periodfollowing their training than firms which took the training later. A possible concern withexploiting this across-firm variation is that particular types of firms may be able to forecastfuture online demand and choose when to take the Winning-contracts training accord-ingly. Note first that our measure of firm-specific online demand shocks is uncorrelatedwith firms’ behavior and performance at baseline, as shown in Appendix Table A.9. Nev-ertheless, we next construct an instrument for post-training online demand by exploitingthe arbitrary order in which firms were visited and encouraged to participate.31 Specifi-cally, we instrument our online demand measure with the number of online tenders pub-lished in the three-months period that starts 40 days after the date of the encouragementvisit—the average number of days between encouragement and the last day of training.
Appendix Table A.10 shows that our instrumented online demand shock variable isnot correlated with training take-up, suggesting that training dates endogenously timedto match variation in demand does not confound our IV regressions. Note also that ourfocus on post-training and post-encouragement demand does not imply an assumptionthat time variation in demand does not matter for control group firms which do not takethe training. Instead the assumption is simply that the timing of the encouragement visitis essentially random. To see this, recall that these demand variables are defined andcalculated at the sector level and that we include sector fixed effects in the regression.
We find evidence that Liberian firms with Internet access can use marketing knowl-edge to access the large buyer market both because information technology allows themto find expressions-of-interest that are otherwise out of reach and also because ICT facil-itates search for and communication with buyers. We show this in Table 9. Since neitherthe variable Online Demandi nor Interneti are dummy variables, we show the averagetreatment effect for the group of firms with access to the Internet and with a positive on-line demand shock in the table footer for easier interpretation of the results.32
In Column (1) we find that newly-trained Internet firms bid on a significantly highernumber of tenders during an online demand shock, while firms without Internet access do
ity is enhanced—here, by the Winning-contracts training—consistent with the model in sections 3 and6. Since post-training demand is undefined for firms which do not take the training, the termsOnline Demandi and Interneti ×Online Demandi are included in (10) only through their interaction withWinning-contracts Trainingi.
31The order in which the firms were visited was determined by the logistics of the surveying effort andthus unrelated to contract demand shocks.
32The average treatment effect computed is the sum of the table’s coefficients for each variable multipliedby the average value of that variable when the variable is positive.
26

not. Internet firms also win more tenders at such times, as shown in Column (3). Follow-ing part (1) of Corollary 4 in Section 6, the fact that an online demand shock exclusivelybenefits Internet firms points towards the online market access effect of the Internet.
Column (4) of Table 9 shows that Internet firms win significantly more non-tendercontracts than non-Internet firms as a result of Winning-contracts training, regardless ofthe level of online demand. Following part (2) of Corollary 4, this points towards thesearch and communication effect of the Internet, which facilitates finding, bidding on, andwinning both online and offline contracts. Trained firms with Internet access win morenon-tender contracts also when online demand is high.
Contracts that are won through tenders may be of particular importance, as they areused by buyers that small and medium-sized firms are otherwise unlikely to gain accessto. In Table 9 we also show that firms that use the Internet and have learned how tocompetitively bid on formal contracts win significantly more high-quality, long-lastingcontracts when relative online demand is high. The estimates in Column (5) suggest thatsuch firms are on average twice as likely to win high quality contracts as firms in thecontrol group.
When viewed through the lens of the framework in sections 3 and 6, the results in Ta-ble 9 indicate that both greater online market access and easier search and communicationfor “connected” firms help explain the positive interaction effect between the Winning-contracts training and Internet access we established in Section 5. A natural question toask is whether these results may in part reflect fluctuations in total rather than online de-mand. In Appendix Table A.11 we repeat (10) but define the demand shock to includeboth online and offline tenders. The results are qualitatively similar to those in Table 9. Inlight of our framework, insofar as the results in Table 9 are driven in part by total demand,these patterns in Appendix Table A.11 simply point towards the search and communica-tion channel, with little to say about online market access. Since we control for offlinedemand in (10), we find the interpretation above more plausible.
7.2 Learning-by-doing dynamics in contract-winning
We now show that demand shocks appear to affect also the longer-run trajectory of ICT-connected firms that have learned how to sell their products to large buyers. In Sub-section 7.1 we saw that Winning-contracts training induces this particular group—firmswith access to the Internet—to win more tenders in the months after training when agreater share of demand is online during these same months. To explore learning-by-doing dynamics in contract-winning, in this sub-section we restrict attention to bids and
27

contracts won several months after the period during which we measure demand shocks—during the three months before the endline interview.33
We find evidence indicating that short-run online demand shocks may increase the ex-tent to which firms with access to the Internet win more tenders because they have learnedhow to craft formal bids even in the longer run. We show this in Table 10. Such learning-by-doing dynamics are not seen for other firms—neither those that lack access to the In-ternet, nor those that have not learned how to bid on formal tenders. This points towardslonger-run benefits of ability to appeal to large buyers with early access to demand. Theestimates in Table 10 are smaller than those in Table 9 and not statistically significant, butthe patterns are otherwise similar, with one important difference. Firms with access to theInternet that experience an online demand shock soon after Winning-contracts trainingdo not win more non-tender contracts nor more total contracts in the longer run. They do,however, appear to bid on and win more tenders. This suggests that learning-by-doingdynamics in contract-winning may be especially forceful for formal tenders.34
In Section 5 we saw that marketing knowledge and the technological ability to accessand interact with buyers positively interact, together increasing Liberian firms’ sales. Inthis section we have shown that they do so both because Internet use directly expandsthe size of the market firms face, and because it facilitates search and communicationwith buyers. We have also shown that firms that are given the opportunity to win for-mal tenders tend to keep winning tenders also in the longer run (see also Atkin et al.,2017a). These results suggest that the Internet dampens traditional information frictions,but—perhaps surprisingly—not marketing barriers that prevent information-constrainedsuppliers in low-income countries from selling to growth-conductive large buyers. Thismay make such barriers the limit to many firms’ market in an increasingly online world.
33At endline, we asked firms for the dates since the baseline interview on which they bid on tenders andwon contracts. For a subset of tenders, we also observe the opening and closing dates. Ninety percent ofthe tenders in our sample are open for bidding less that 30 days, with a mean of 15 days. The tenders thatform part of short-run demand shocks as we measure them and the ones that form part of the outcome weconsider in this sub-section are thus very unlikely to overlap.
34Note that, while Table 10 is otherwise identical to Table 9 except with the outcome measured during alater period of time, Table 10 does not include the Quality of Contracts outcome from Table 9. The reasonis that we cannot be sure when the reported high quality contracts—contracts that last for six months ormore—are won. The endline survey simply asked if the firm had ever won such a contract. We thus takethe conservative approach of assuming that high quality contracts are won in the short run rather than thelong run as defined here.
28

8 Conclusion
Growing evidence suggests that many productive firms stagnate because of constrainedaccess to existing demand. Small firms in poor countries rarely win contracts from largebuyers—a particularly growth-conducive form of demand—instead choosing to sell di-rectly to final consumers. In this paper we uncover an overlooked part of the explana-tion. We do so through a randomized-controlled trial of a week-long training programthat teaches disadvantaged Liberian firms how to sell their products to large buyers bybidding on formal tenders. We show that learning how to market products to govern-ments, corporations, and other large buyers—the details of tender procedures, auxiliaryfeatures of bids many buyers put weight on, and so on—enables Liberian firms to winmore and higher-quality tender and non-tender contracts. This suggests that small andmedium-sized firms face informational barriers to accessing markets that differ from tra-ditional forms of information frictions. However, we also find that distortionary variationin marketing ability interacts with more widely studied information frictions. Convertingcontract-winning knowledge into market access appears to be difficult without moderninformation technology. We show that the treatment effect of the Winning-contracts train-ing we study is found only among firms that use the Internet, both because such firmscan access a bigger market and because they can more easily search for and communicatewith buyers. We thus begin to unpack how information frictions distort input marketsand thereby exclude firms in poor countries from value chains.
29

ReferencesABADIE, ALBERTO, ATHEY, SUSAN, IMBENS, GUIDO W., & WOOLDRIDGE, JEFFREY. 2017.
When Should You Adjust Standard Errors for Clustering? NBER working paper no. 24003.
ABEBE, GIRUM, CARIA, STEFANO, & ORTIZ-OSPINA, ESTEBAN. 2019. The Selection OfTalent: Experimental and Structural Evidence From Ethiopia. EDRI working paper.
ABEBE, GIRUM, MCMILLAN, MARGARET, & SERAFINELLI, MICHEL. 2020. Foreign Di-rect Investment and Knowledge Diffusion in Poor Locations: Evidence from Ethiopia. NBERworking paper no. 24461.
AKER, JENNY. 2010. Information from Markets Near and Far: Mobile Phones and Agri-cultural Markets in Niger. American Economic Journal: Applied Economics, 2, 46–59.
ALFARO-URENA, ALONSO, MANELICI, ISABELA, & VASQUEZ, JOSE P. 2019. The Effectsof Joining Multinational Supply Chains: New Evidence from Firm-to-Firm Linkages. CentralBank of Costa Rica mimeo.
ALLEN, TREB. 2014. Information Frictions in Trade. Econometrica, 82(6), 2041–2083.
ALMUNIA, MIGUEL, HJORT, JONAS, KNEBELMANN, JUSTINE, & TIAN, LIN. 2019. Strate-gic or Confused Firms? Evidence from “Missing” Transactions in Uganda. CUNEF workingpaper.
ANDERSON, STEPHEN J., CHANDY, RAJESH, & ZIA, BILAL. 2018. Pathways to Profits: TheImpact of Marketing vs. Finance Skills on Business Performance. Management Science,64(12), 5559–5583.
ARKOLAKIS, C., PAPAGEORGIOU, T., & TIMOSHENKO, O. 2018. Firm Learning andGrowth. Review of Economic Dynamics, 27, 146–168.
ATKIN, DAVID, & DONALDSON, DAVE. 2015. Who’s Getting Globalized? The Size and Natureof Intranational Trade Costs. NBER Working Paper No. 21439.
ATKIN, DAVID, OSMAN, ADAM, & KHANDELWAL, AMIT K. 2017a. Exporting and FirmPerformance: Evidence from a Randomized Trial. Quarterly Journal of Economics, 132(3),551–615.
ATKIN, DAVID, CHAUDHRY, AZAM, CHAUDRY, SHAMYLA, KHANDELWAL, AMIT K., &VERHOOGEN, ERIC. 2017b. Orgnizational Barriers to Technology Adoption: Evidencefrom Soccer-Ball Producers in Pakistan. The Quarterly Journal of Economics, 123(3), 1101–1164.
BASSI, VITTORIO, & NANSAMBA, AISHA. 2019. Screening and Signaling Non-CognitiveSkills: Experimental Evidence from Uganda. USC working paper.
BEST, M. C., HJORT, J., & SZAKONYI, D. 2019. Individuals and Organizations as Sources ofState Effectiveness. NBER working paper no. 23350.
BETTINGER, ERIC P., LONG, BRIDGET TERRY, OREOPOULOS, PHILIP, & SANBONMATSU,LISA. 2012. The Role of Application Assistance and Information in College Decisions:Results from the H&R Block FAFSA Experiment. Quarterly Journal of Economics, 127(3),1205–1242.
30

BLOOM, NICHOLAS, MAHAJAN, APRAJIT, MCKENZIE, DAVID, & ROBERTS, JOHN. 2010.Why Do Firms in Developing Countries Have Low Productivity? American EconomicReview: Papers and Proceedings, 100(2), 619–623.
BLOOM, NICHOLAS, EIFERT, BENN, MAHAJAN, APRAJIT, MCKENZIE, DAVID, &ROBERTS, JOHN. 2013. Does Management Matter? Evidence from India. The QuarterlyJournal of Economics, 128(1), 1–51.
BOSIO, ERICA, DJANKOV, SIMEON, GLAESER, EDWARD L., & SHLEIFER, ANDREI. 2020.Public Procurement in Law and Practice. NBER Working Paper No. 27188.
BRUHN, MIRIAM, KARLAN, DEAN, & SCHOAR, ANTOINETTE. 2018. The Impact of Con-sulting Services on Small and Medium Enterprises: Evidence from a Randomized Trialin Mexico. Journal of Political Economy, 2(126), 635–687.
CARRANZA, ELIANA, ROBERT GARLICK, ORKIN, KATE, & RANKIN, NEIL. 2019. JobSearch and Hiring with Two-sided Limited Information about Workseekers’ Skills. World Bankworking paper.
CARRILLO, PAUL, DONALDSON, DAVE, POMERANZ, DINA, & SINGHAL, MONICA. 2019.Allocative Efficiency in Firm Production: A Nonparametric Test Using Procurement Lotteries.GWU working paper.
CHERNOZHUKOV, VICTOR, DEMIRER, MERT, DUFLO, ESTHER, & FERNANDEZ-VAL,IVAN. 2018. Generic Machine Learning Inference on Heterogenous Treatment Effects in Ran-domized Experiments. NBER Working Paper No. 24678.
CHETTY, RAJ, & SAEZ, EMMANUEL. 2013. Teaching the tax code: Earnings responses toan experiment with EITC recipients. American Economic Journal: Applied Economics, 5(1),1–31.
DE LOECKER, JAN, & GOLDBERG, PINELOPI KOUJIANOU. 2014. Firm Performance in aGlobal Market. Annual Review of Economics, 6, 201–227.
DELLAVIGNA, STEFANO, & GENTZKOW, MATTHEW. 2019. Uniform Pricing in US RetailChains. The Quarterly Journal of Economics, 134(4), 2011–2084.
DONALDSON, DAVE, & HORNBECK, RICHARD. 2016. Railroads and American EconomicGrowth: A “Market Access" Approach. Quarterly Journal of Economics, 131(2), 799–858.
DROZD, L. A., & NOSAL, J. B. 2012. Understanding International Prices: Customers asCapita. American Economic Review, 102(1), 364–95.
FABER, BENJAMIN. 2014. Trade Integration, Market Size, and Industrialization: Evidencefrom China’s National Trunk Highway System. Review of Economic Studies, 81(February),1046–70.
FERRAZ, C, FINAN, F, & SZERMAN, D. 2016. Procuring Firm Growth: The Effects of Govern-ment Purchases on Firm Dynamics. NBER working paper 21219.
FOSTER, LUCIA, HALTIWANGER, JOHN, & SYVERSON, CHAD. 2016. The Slow Growth ofNew Plants: Learning about Demand. Economica, January, 201–227.
GOLDBERG, PINELOPI K., & REED, TRISTAN. 2020. Income Distribution, International Inte-gration, and Sustained Poverty Reduction. NBER Working Paper No. 27286.
31

GOURIO, F., & RUDANKO, L. 2014. Customer capital. Review of Economic Studies, 81(3),1102–1136.
HANSMAN, C., HJORT, J., LEON, G., & TEACHOUT, M. 2019. Vertical Integration, Sup-plier Behavior, and Quality Upgrading among Exporters. forthcoming, Journal of PoliticalEconomy.
HARDY, MORGAN, & MCCASLAND, JAMIE. 2017. Are Small Firms Labor Constrained? Ex-perimental Evidence from Ghana. NYU working paper.
HJORT, JONAS, & POULSEN, JONAS. 2019. The Arrival of Fast Internet and Employmentin Africa. American Economic Review, 109(3), 1032–1079.
HOEKMAN, B, & SANFILIPPO, M. 2018. Firm Performance and Participation in Public Pro-curement: Evidence from Sub-Saharan Africa. CEPR Discussion Paper No DP12752.
HORNBECK, RICHARD, & ROTEMBERG, MARTIN. 2019. Railroads, Reallocation, and the Riseof American Manufacturing. NBER Working Paper No. 26594.
HORTACSU, ALI, LUCO, FERNANDO, PULLER, STEVEN L., & ZHU, DONGNI. 2019. DoesStrategic Ability Affect Efficiency? Evidence from Electricity Markets. American Eco-nomic Review, 109(2), 4302–4342.
HSIEH, CHANG-TAI, & KLENOW, PETER. 2014. The Life Cycle of Plants in India andMexico. Quarterly Journal of Economics, 129(3), 1035–1084.
JENSEN, ROBERT. 2007. The Digital Provide: Information (Technology), Market Perfor-mance and Welfare in the South Indian Fisheries Sector. Quarterly Journal of Economics,122, 879–924.
JENSEN, ROBERT. 2010. The (perceived) returns to education and the demand for school-ing. Quarterly Journal of Economics, 125(2), 515–548.
JENSEN, ROBERT, & MILLER, NOLAN. 2018. Market Integration, Demand and the Growthof Firms: Evidence from a Natural Experiment in India. American Economic Review,108(12), 3583–3625.
KLING, JEFFREY, MULLAINATHAN, SENDHIL, SHAFFIR, ELDAR, VERMEULEN, LEE, &WROBEL, MARIAN V. 2012. Comparison friction: Experimental evidence from medi-care drug plans. Quarterly Journal of Economics, 127(1), 199–235.
LANE, NATHAN. 2019. The New Empirics of Industrial Policy. Monash working paper.
LEDERMAN, D., OLARREAGA, M., & PAYTON, L. 2010. Export promotion agencies: Dothey work? Journal of Development Economics, 91, 257–265.
LEE, M. 2017. Government Purchases, Firm Growth and Industry Dynamics. Mimeo UCSD.
MACCHIAVELLO, ROCCO, & MORJARIA, AMEET. 2015. The Value of Relationships: Ev-idence from a Supply Shock to Kenyan Rose Exports. The American Economic Review,105(9), 2911–2945.
MCAFEE, PRESTON R., & MCMILLAN, JOHN. 1989. Government procurement and inter-national trade. Journal of International Economics, 26(3), 291–308.
32

MCKENZIE, DAVID, & WOODRUFF, CHRISTOPHER. 2014. What Are We Learning fromBusiness Training and Entrepreneurship Evaluations around the Developing World?The World Bank Research Observer, 29(1), 48–82.
MITRA, SANDIP, MOOKHERJEE, DILIP, TORERO, MAXIMO, & VISARIA, SUJATA. 2018.Asymmetric information and middleman margins: An experiment with Indian potatofarmers. Review of Economics and Statistics, 100(1), 1–13.
POZZI, A., & SCHIVARDI, F. 2016. Demand or Productivity: What Determines FirmGrowth? RAND Journal of Economics, 47(3), 608–630.
QUINN, SIMON, & WOODRUFF, CHRISTOPHER. 2019. Experiments and Entrepreneurshipin Developing Countries. Annual Review of Economics, 11, 225–248.
STARTZ, MEREDITH. 2018. The Value of Face-to-face: Search and Contracting Problems inNigerian Trade. Stanford working paper.
SYVERSON, C. 2011. What Determines Productivity? Journal of Economic Literature, 49(2),326–365.
VERHOOGEN, ERIC. 2008. Trade, Quality Upgrading and Wage Inequality in the MexicanManufacturing Sector. Quarterly Journal of Economics, 123, 489–530.
VERHOOGEN, ERIC. 2020. Firm-Level Upgrading in Developing Countries. Columbia Uni-versity working paper.
33

FIGURE 1: SIZE OF FIRMS IN THE SAMPLE
Panel A : Sample vs Census Firms
Panel B : Sample vs Other Firms on Registry
The two panels in this figure compare the size of firms in the sample with firms in the census (Panel A)and other firms listed in the non-profit’s directory who have more than one employee and are located inMonrovia (Panel B). In both panels, bars show the share of firms in our sample in each category and theshare of the comparison sample.
34

FIGURE 2: TIMELINE AND EXPERIMENTAL DESIGN
Panel A : Timeline
Panel B : Randomization Design
Open, Baseline Firms
1,260 Firms
Control Firms
634 Firms
Firms that Responded to Endline Survey &
Gave Consent
831 - 5 = 826 Firms
Control Firms
295 Firms
Untrained Firms
290 Firms
Trained Firms
5 Firms
Encouraged Firms
533 Firms
Untrained Firms
391 Firms
Trained Firms
142 Firms
Treated Firms
620 Firms
Randomization Occurs
Building Markets Training Building Markets Training
Endline Survey
Panel C : Example of Timeline for one firm
Panel A shows the timeline of the experiment evaluated in this paper. The experiment spanned from June2016 to June 2017, with some pre-baseline interviews conducted before April 2016 by the non-profit. Panel Bshows the number of firms in the sample at every step of the experiment. Open baseline firms are the firmswhich were in the non-profits’ directory, which never took the training, which have at least one employeeand which are located in Monrovia. These firms were randomly selected for treatment or control. For theendline survey, the research team tried to reach these firms and was able to track down and interview only66% of them. Out of the 533 firms which interviewed at endline that were in the treatment group (theencouraged firms), 142 firms had taken the training. Panel C shows the timeline for a particular firm.
35
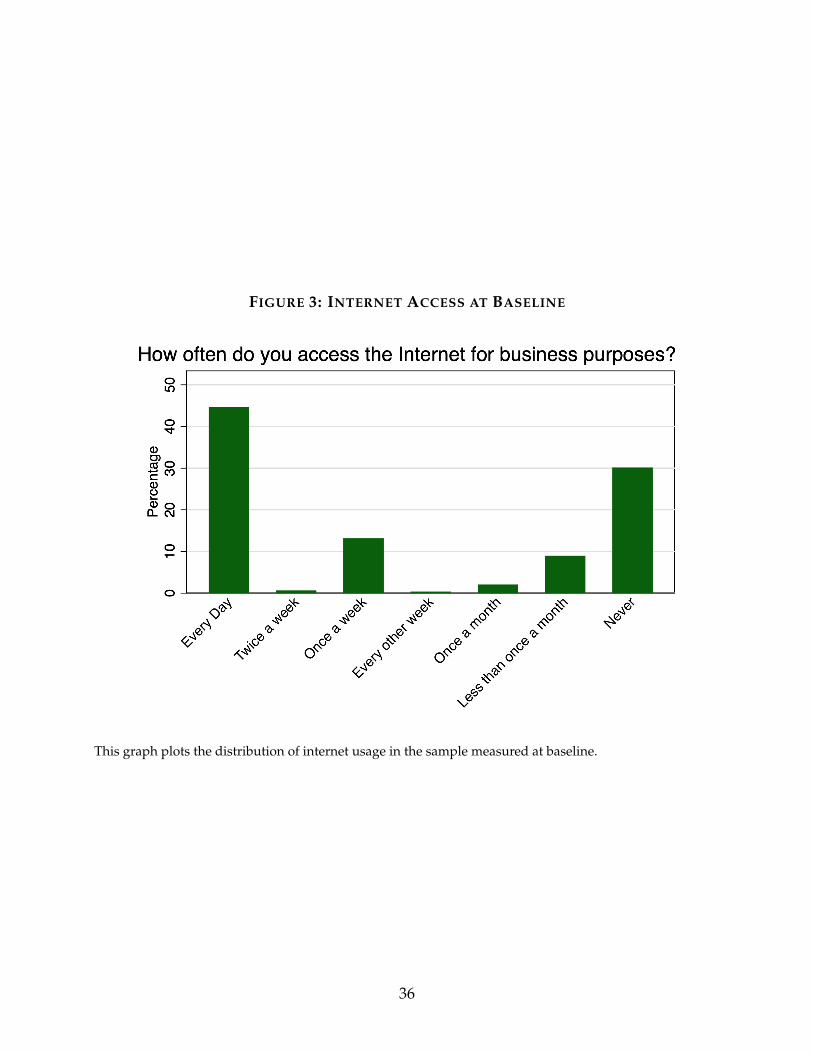
FIGURE 3: INTERNET ACCESS AT BASELINE
This graph plots the distribution of internet usage in the sample measured at baseline.
36

FIGURE 4: TIME SERIES OF TENDERS
This figure plots the time series of tenders published in 2016 from the non-profit’s database aggregated ata weekly level. The trend for tenders published online and offline are plotted separately. The dotted linesrepresent the period of time when firms were encouraged to take the training while the solid lines mark thetime period when the firms in our sample took the training.
37

TABLE 1: SUMMARY STATISTICS ON TENDERS
Mean
Buyer
Public Sector Buyers 0.51
International Organizations 0.47
Source
Newspaper 0.57
Website 0.31
Word of mouth 0.12
Sectors
Construction and Renovation 0.23
Automotive 0.11
Business and Consulting 0.10
Printing and Copying 0.09
This table presents summary statistics of 1,381 tenders published in Liberia in 2016. The data is based on adatabase of tenders compiled by the non-profit.
38

TABLE 2: SUMMARY STATISTICS ON SAMPLE FIRMS
Mean SD Observations
Sectors
Construction and Renovation 0.23 (0.42) 1192
Food and Beverages 0.16 (0.36) 1192
Home Essentials 0.13 (0.33) 1192
Handicrafts and Artisans 0.11 (0.32) 1192
Business and Consulting Services 0.09 (0.29) 1192
Owner Nationality
Liberian 0.90 (0.30) 1192
Lebanese 0.05 (0.21) 1192
Nigerian 0.02 (0.14) 1192
Indian 0.01 (0.11) 1192
Other
Total Number of Employees 14.19 (42.62) 1187
Bid on a tender in the past 6 months (Y=1; N=0) 0.21 (0.40) 847
Number of tenders bid on in the past 6 months 0.65 (1.62) 847
Won a tender in the past 6 months (Y=1; N=0) 0.12 (0.32) 876
Number of tenders won in the past 6 months 0.30 (1.16) 876
Proportion of tenders won (conditional on applying) 0.32 (0.37) 174
Ever won a contract lasting 6 months or more 0.76 (0.43) 179
Speaks at least one Liberian local language 0.34 (0.47) 1192
Accessed Internet for business purposes(1=Every day ; 7= Never) 3.61 (2.67) 1118
This table presents summary statistics of firms in the sample. The data is based on interviews conducted bythe non-profit. A nationality of the business is determined if at least one of the owners has that particularnationality. The number of employees includes the owner or manager of the firm.
39

TABLE 3: BALANCE TABLE
Full Sample Restricted Sample
Diff.(T - C)
Std.Error
Diff.(T - C)
Std.Error
Sectors
Construction and Renovation -0.00 0.03 -0.02 0.03
Food and Beverages -0.02 0.02 0.02 0.03
Home Essentials 0.00 0.02 0.02 0.03
Handicrafts and Artisans 0.00 0.02 0.00 0.02
Business and Consulting Services 0.00 0.02 0.02 0.02
Owner Nationality
Liberian -0.01 0.02 -0.01 0.02
Lebanese -0.00 0.01 0.00 0.01
Nigerian -0.00 0.01 -0.00 0.01
Indian -0.00 0.01 -0.00 0.01
Other
Total Number of Employees -1.79 2.59 -0.66 2.73
Bid on a tender in the past 6 months (Y=1; N=0) -0.02 0.02 -0.03 0.03
Number of tenders bid on in the past 6 months -0.08 0.12 -0.13 0.15
Won a tender in the past 6 months (Y=1; N=0) -0.01 0.02 -0.01 0.03
Number of tenders won in the past 6 months 0.09 0.08 0.14 0.11
Proportion of tenders won (conditional on applying) -0.02 0.06 -0.04 0.07
Ever won a contract lasting 6 months or more -0.04 0.07 0.01 0.09
Speaks at least one Liberian local language -0.01 0.03 -0.06 0.03
Accessed Internet for business purposes(1=Every day ; 7= Never) 0.04 0.17 0.03 0.20
This table presents balance between firms of the treatment and control groups. "Full Sample" refers to thetotal sample at baseline, "Restricted Sample" refers to firms who responded to the endline survey. The datais based on phone interviews conducted by the non-profit. A nationality of the business is determined ifat least one of the owners has that particular nationality. The number of employees includes the owner ormanager of the firm.
40

TABLE 4: EFFECT OF VOUCHER + ENCOURAGEMENT ON TRAINING TAKE-UP
Winning-Contracts Training
(1) (2)
Voucher + Encouragementfor Training
0.19*** 0.20***(0.02) (0.02)
Controls NO YESControl Group Mean 0.01 0.01Observations 1192 1143
Standard errors are in parentheses and are robust. This table presents coefficients of the regression oftraining take-up as recorded by the non-profit on encouragement. Controls include employment, countiesof operation, gender of the owner, sectors, languages used for business, geographical zone and the numberof submitted bids. All controls are measured before baseline.
41

TABLE 5: EFFECT OF WINNING-CONTRACTS TRAINING ON EXPECTED FUTURE BID-DING ON AND WINNING TENDERS
How many tenders do youexpect your firm to bid on
in the next 6 months?
Of these, howmany do you
expect you will win?
(1) (2) (3) (4)
Treatment-on-the-Treated
Winning-ContractsTraining
0.85* 1.00** 0.86** 0.83**(0.46) (0.44) (0.40) (0.38)
Intent-to-Treat
Voucher +Encouragement
0.22* 0.28** 0.22** 0.23**(0.12) (0.12) (0.10) (0.11)
Controls NO YES NO YESControl Group Mean 2.04 2.04 1.51 1.51Observations 788 753 788 753
Standard errors are in parentheses and are robust. This table shows results from estimating Equation (5).The top panel presents the Treatment-on-the-Treated while the bottom panel presents the Intent-to-Treatestimates of attending the training. Controls include employment, counties of operation, gender of theowner, sectors, languages used for business, geographical zone and the number of submitted bids. Allcontrols are measured before baseline. All outputs are referring to the period of 6 months preceding theinterview. Columns (1) & (2) refer to the refer to the expectations of the manager about the future bids ofthe firm. Columns (3) & (4) refer to the expectations of the manager about the firm’s future contracts wonthrough tenders.
42

TA
BL
E6:
EFF
EC
TO
FW
INN
ING
-CO
NT
RA
CT
ST
RA
ININ
GO
NC
ON
TR
AC
TS
BID
-ON
AN
DC
ON
TR
AC
TS
WO
N
#of
tend
ers
bid
onTo
tal#
ofco
ntra
cts
won
#of
tend
ers
won
#of
cont
ract
sw
onw
/ote
nder
(1)
(2)
(3)
(4)
(5)
(6)
(7)
(8)
Trea
tmen
t-on
-the
-Tre
ated
Win
ning
-Con
trac
tsTr
aini
ng0.
53*
0.59
**1.
19**
*1.
01**
*0.
240.
28*
0.95
***
0.72
**(0
.30)
(0.2
6)(0
.38)
(0.3
5)(0
.17)
(0.1
6)(0
.31)
(0.2
9)
Inte
nt-t
o-Tr
eat
Vouc
her
+En
cour
agem
ent
0.14
*0.
16**
0.31
***
0.28
***
0.06
0.08
*0.
25**
*0.
20**
(0.0
8)(0
.07)
(0.0
9)(0
.10)
(0.0
4)(0
.05)
(0.0
8)(0
.08)
Con
trol
sN
OY
ESN
OY
ESN
OY
ESN
OY
ESC
ontr
olG
roup
Mea
n0.
350.
350.
480.
480.
150.
150.
330.
33O
bser
vati
ons
787
752
788
753
789
754
788
753
Stan
dard
erro
rsar
ein
pare
nthe
ses
and
are
robu
st.
This
tabl
esh
ows
resu
lts
from
esti
mat
ing
Equa
tion
(5).
The
top
pane
lpre
sent
sth
eTr
eatm
ent-
on-
the-
Trea
ted
whi
leth
ebo
ttom
pane
lpre
sent
sth
eIn
tent
-to-
Trea
tes
tim
ates
ofth
eef
fect
oftr
aini
ngfo
rfir
ms
who
took
the
trai
ning
.C
ontr
ols
incl
ude
empl
oym
ent,
coun
ties
ofop
erat
ion,
gend
erof
the
owne
r,se
ctor
s,la
ngua
ges
used
for
busi
ness
,geo
grap
hica
lzon
ean
dth
enu
mbe
rof
subm
itte
dbi
ds.
All
cont
rols
are
mea
sure
dbe
fore
base
line.
All
outp
uts
are
refe
rrin
gto
the
peri
odof
6m
onth
spr
eced
ing
the
inte
rvie
w.
Col
umns
(1)
&(2
)re
fer
toth
enu
mbe
rof
bids
subm
itte
dfo
rte
nder
s.C
olum
ns(3
)to
(8)
refe
rto
the
num
ber
ofco
ntra
cts
won
over
all,
thro
ugh
ate
nder
proc
ess
and
wit
hout
ate
nder
proc
ess.
43

TABLE 7: EFFECT OF WINNING-CONTRACTS TRAINING ON THE QUALITY OF ANDREVENUE FROM CONTRACTS WON
PANEL A : QUALITY OF CONTRACTS
Won Long Lasting Contract
(1) (2)
Treatment-on-the-Treated
Winning-ContractsTraining
0.33** 0.30***(0.13) (0.11)
Intent-to-Treat
Voucher +Encouragement
0.08*** 0.08***(0.03) (0.03)
Controls NO YESControl Group Mean 0.23 0.23Observations 789 754
PANEL B : REVENUE FROM CONTRACTS(1) (2)
Treatment-on-the-Treated
Winning-ContractsTraining
11058.0 10362.3(7989.81) (6473.52)
Intent-to-Treat
Voucher +Encouragement
2866.0 2843.4(2067.38) (1852.81)
Controls NO YESControl Group Mean 5322.46 5322.46Observations 789 754
Standard errors are in parentheses and are robust. This table shows results from estimating Equation (5).Panel A presents the Treatment-on-the-Treated and the Intent-to-Treat estimates of the effect of training onthe quality of contracts for firms who attended the training. Quality of contracts is measured as whetherfirms won long lasting contracts i.e. contracts for longer than 6 months. Panel B presents the results forTreatment-on-the-Treated and Intent-to-Treat estimates of the training on the revenue from contracts. Con-trols include employment, counties of operation, gender of the owner, sectors, languages used for business,geographical zone and the number of submitted bids. All controls are measured before baseline. All out-puts are referring to the period of 6 months preceding the interview. Appendix Table (A.4) reports resultsfor additional measures of contract quality.
44

TA
BL
E8:
HO
WT
HE
EFF
EC
TO
FW
INN
ING
-CO
NT
RA
CT
ST
RA
ININ
GV
AR
IES
WIT
HIN
TE
RN
ET
AC
CE
SS
#of
tend
ers
bid
onTo
tal#
ofco
ntra
cts
won
#of
tend
ers
won
#of
cont
ract
sw
onw
/ote
nder
(1)
(2)
(3)
(4)
(5)
(6)
(7)
(8)
Vouc
her
+En
cour
agem
ent
for
Trai
ning
-0.0
6-0
.13*
0.05
-0.0
6-0
.04
-0.0
60.
10-0
.00
(0.0
7)(0
.07)
(0.1
4)(0
.14)
(0.0
4)(0
.05)
(0.1
1)(0
.12)
Vouc
her
+En
cour
agem
ent
×In
tern
et
0.49
***
0.70
***
0.48
**0.
65**
*0.
24**
0.31
***
0.24
0.33
*(0
.18)
(0.1
9)(0
.23)
(0.2
4)(0
.11)
(0.1
2)(0
.19)
(0.2
0)
Con
trol
sN
OY
ESN
OY
ESN
OY
ESN
OY
ESC
ontr
olG
roup
Mea
n0.
350.
350.
480.
480.
150.
150.
330.
33O
bser
vati
ons
739
710
740
711
741
712
740
711
Stan
dard
erro
rsar
ein
pare
nthe
ses
and
are
robu
st.T
his
tabl
esh
ows
resu
lts
from
esti
mat
ing
Equa
tion
(6).
Con
trol
sin
clud
eem
ploy
men
t,co
unti
esof
oper
atio
n,ge
nder
ofth
eow
ner,
sect
ors,
lang
uage
sus
edfo
rbus
ines
s,ge
ogra
phic
alzo
nean
dth
enu
mbe
rofs
ubm
itte
dbi
ds.A
llco
ntro
lsar
em
easu
red
befo
reba
selin
e.C
olum
ns(1
)&(2
)ref
erto
the
num
ber
ofbi
dssu
bmit
ted
for
tend
ers.
Col
umns
(3)t
o(8
)ref
erto
the
num
ber
ofco
ntra
cts
won
over
all,
thro
ugh
ate
nder
proc
ess
and
wit
hout
ate
nder
proc
ess.
45

TA
BL
E9:
HO
WT
HE
EFF
EC
TO
FW
INN
ING
-CO
NT
RA
CT
ST
RA
ININ
GV
AR
IES
WIT
HIN
TE
RN
ET
AC
CE
SS
AN
DO
NL
INE
DE
-M
AN
DS
HO
CK
S
#of
tend
ers
bid
onTo
tal#
ofco
ntra
cts
#of
tend
ers
won
#of
cont
ract
sw
onw
/ote
nder
Won
long
-las
ting
ontr
act
(1)
(2)
(3)
(4)
(5)
Vouc
her
+En
cour
agem
ent
for
Trai
ning
-0.2
0-0
.31
0.05
3-0
.36*
*-0
.02
(0.1
8)(0
.21)
(0.0
9)(0
.18)
(0.0
6)
Vouc
her
+En
cour
agem
ent
×O
nlin
eD
eman
d-0
.02
0.02
-0.0
80.
09-0
.02
(0.1
1)(0
.08)
(0.0
5)(0
.08)
(0.0
3)
Vouc
her
+En
cour
agem
ent
×In
tern
et-0
.17
0.43
-0.1
60.
58**
0.07
(0.3
7)(0
.31)
(0.1
8)(0
.27)
(0.1
1)
Vouc
her
+En
cour
agem
ent
×O
nlin
eD
eman
d×
Inte
rnet
0.24
*0.
020.
15**
-0.1
30.
06*
(0.1
4)(0
.09)
(0.0
6)(0
.08)
(0.0
3)
Con
trol
sY
ESY
ESY
ESY
ESY
ESC
ontr
olM
ean
0.35
0.48
0.15
0.33
0.23
Obs
erva
tion
s71
071
171
271
171
2C
ompu
ted
ATE
(Int
erne
t,+v
eD
eman
d)1.
440.
360.
270.
120.
26T
his
tabl
esh
ows
resu
lts
from
esti
mat
ing
Equa
tion
(10)
.Itp
rese
nts
the
hete
roge
neit
yof
trea
tmen
teff
ectw
ith
resp
ectt
oIn
tern
etac
cess
atba
selin
ean
dth
eon
line
dem
and
shoc
k.St
anda
rd
erro
rsar
ein
pare
nthe
ses
and
are
robu
st.C
ontr
ols
incl
ude
empl
oym
ent,
coun
ties
ofop
erat
ion,
gend
erof
the
owne
r,se
ctor
s,la
ngua
ges
used
for
busi
ness
,geo
grap
hica
lzon
e,th
enu
mbe
r
ofsu
bmit
ted
bids
,tot
alnu
mbe
rof
tend
ers
publ
ishe
din
the
sect
orfr
omth
epr
edic
ted
date
oftr
aini
ng,s
hare
ofdi
ffer
entt
ypes
ofte
nder
sin
the
sect
or(t
ende
rsfr
omlo
calo
rin
tern
atio
nal
orga
niza
tion
s,lo
calo
rin
tern
atio
nalg
over
nmen
ts,l
ocal
orin
tern
atio
nalp
riva
tefir
ms,
loca
lor
inte
rnat
iona
lNG
Os.
All
cont
rols
are
mea
sure
dbe
fore
base
line.
Col
umns
(1)
refe
rsto
the
num
ber
ofbi
dssu
bmit
ted
for
tend
ers.
Col
umns
(2)
to(4
)re
fer
toth
enu
mbe
rof
cont
ract
sw
onov
eral
l,th
roug
ha
tend
erpr
oces
san
dw
itho
uta
tend
erpr
oces
s.C
olum
n(5
)re
fers
to
whe
ther
firm
sw
ona
cont
ract
last
ing
long
erth
an6
mon
ths.
46
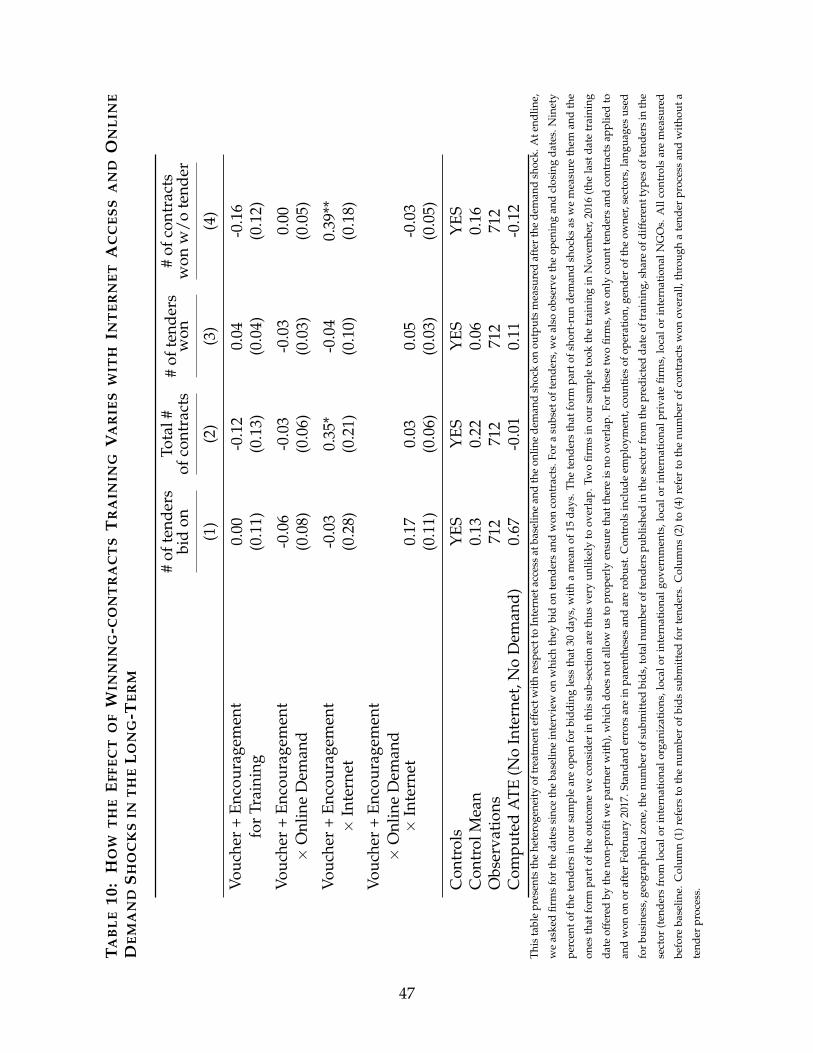
TA
BL
E10
:H
OW
TH
EE
FFE
CT
OF
WIN
NIN
G-C
ON
TR
AC
TS
TR
AIN
ING
VA
RIE
SW
ITH
INT
ER
NE
TA
CC
ES
SA
ND
ON
LIN
ED
EM
AN
DS
HO
CK
SIN
TH
EL
ON
G-T
ER
M
#of
tend
ers
bid
onTo
tal#
ofco
ntra
cts
#of
tend
ers
won
#of
cont
ract
sw
onw
/ote
nder
(1)
(2)
(3)
(4)
Vouc
her
+En
cour
agem
ent
for
Trai
ning
0.00
-0.1
20.
04-0
.16
(0.1
1)(0
.13)
(0.0
4)(0
.12)
Vouc
her
+En
cour
agem
ent
×O
nlin
eD
eman
d-0
.06
-0.0
3-0
.03
0.00
(0.0
8)(0
.06)
(0.0
3)(0
.05)
Vouc
her
+En
cour
agem
ent
×In
tern
et-0
.03
0.35
*-0
.04
0.39
**(0
.28)
(0.2
1)(0
.10)
(0.1
8)
Vouc
her
+En
cour
agem
ent
×O
nlin
eD
eman
d×
Inte
rnet
0.17
0.03
0.05
-0.0
3(0
.11)
(0.0
6)(0
.03)
(0.0
5)
Con
trol
sY
ESY
ESY
ESY
ESC
ontr
olM
ean
0.13
0.22
0.06
0.16
Obs
erva
tion
s71
271
271
271
2C
ompu
ted
ATE
(No
Inte
rnet
,No
Dem
and)
0.67
-0.0
10.
11-0
.12
Thi
sta
ble
pres
ents
the
hete
roge
neit
yof
trea
tmen
teff
ectw
ith
resp
ectt
oIn
tern
etac
cess
atba
selin
ean
dth
eon
line
dem
and
shoc
kon
outp
uts
mea
sure
daf
ter
the
dem
and
shoc
k.A
tend
line,
we
aske
dfir
ms
for
the
date
ssi
nce
the
base
line
inte
rvie
won
whi
chth
eybi
don
tend
ers
and
won
cont
ract
s.Fo
ra
subs
etof
tend
ers,
we
also
obse
rve
the
open
ing
and
clos
ing
date
s.N
inet
y
perc
ento
fthe
tend
ers
inou
rsa
mpl
ear
eop
enfo
rbi
ddin
gle
ssth
at30
days
,wit
ha
mea
nof
15da
ys.T
hete
nder
sth
atfo
rmpa
rtof
shor
t-ru
nde
man
dsh
ocks
asw
em
easu
reth
eman
dth
e
ones
that
form
part
ofth
eou
tcom
ew
eco
nsid
erin
this
sub-
sect
ion
are
thus
very
unlik
ely
toov
erla
p.Tw
ofir
ms
inou
rsa
mpl
eto
okth
etr
aini
ngin
Nov
embe
r,20
16(t
hela
stda
tetr
aini
ng
date
offe
red
byth
eno
n-pr
ofitw
epa
rtne
rw
ith)
,whi
chdo
esno
tallo
wus
topr
oper
lyen
sure
that
ther
eis
noov
erla
p.Fo
rth
ese
two
firm
s,w
eon
lyco
untt
ende
rsan
dco
ntra
cts
appl
ied
to
and
won
onor
afte
rFe
brua
ry20
17.S
tand
ard
erro
rsar
ein
pare
nthe
ses
and
are
robu
st.C
ontr
ols
incl
ude
empl
oym
ent,
coun
ties
ofop
erat
ion,
gend
erof
the
owne
r,se
ctor
s,la
ngua
ges
used
for
busi
ness
,geo
grap
hica
lzon
e,th
enu
mbe
rof
subm
itte
dbi
ds,t
otal
num
ber
ofte
nder
spu
blis
hed
inth
ese
ctor
from
the
pred
icte
dda
teof
trai
ning
,sha
reof
diff
eren
ttyp
esof
tend
ers
inth
e
sect
or(t
ende
rsfr
omlo
calo
rin
tern
atio
nalo
rgan
izat
ions
,loc
alor
inte
rnat
iona
lgov
ernm
ents
,loc
alor
inte
rnat
iona
lpri
vate
firm
s,lo
calo
rin
tern
atio
nalN
GO
s.A
llco
ntro
lsar
em
easu
red
befo
reba
selin
e.C
olum
n(1
)ref
ers
toth
enu
mbe
rof
bids
subm
itte
dfo
rte
nder
s.C
olum
ns(2
)to
(4)r
efer
toth
enu
mbe
rof
cont
ract
sw
onov
eral
l,th
roug
ha
tend
erpr
oces
san
dw
itho
uta
tend
erpr
oces
s.
47

A Appendix
TABLE A.1: ATTRITION
Not Interviewed Interviewed Diff. P-Val.
Sectors
Construction and Renovation 0.20 0.25 -0.05∗∗ 0.04
Food and Beverages 0.16 0.16 0.00 0.97
Home Essentials 0.12 0.13 -0.01 0.69
Handicrafts and Artisans 0.11 0.12 -0.01 0.58
Business and Consulting Services 0.08 0.10 -0.02 0.22
Owner Nationality
Liberian 0.87 0.92 -0.04∗∗ 0.02
Lebanese 0.05 0.04 0.01 0.29
Nigerian 0.04 0.01 0.02∗∗ 0.01
Indian 0.01 0.01 -0.01 0.18
Other
Total Number of Employees 12.08 15.11 -3.03 0.26
Bid on a tender in the past 6 months (Y=1; N=0) 0.17 0.22 -0.05 0.12
Number of tenders bid on in the past 6 months 0.55 0.70 -0.14 0.23
Won a tender in the past 6 months (Y=1; N=0) 0.09 0.13 -0.04∗ 0.07
Number of tenders won in the past 6 months 0.19 0.35 -0.15∗ 0.07
Proportion of tenders won (conditional on applying) 0.29 0.33 -0.04 0.57
Ever won a contract lasting 6 months or more 0.82 0.73 0.09 0.21
Speaks at least one Liberian local language 0.30 0.36 -0.05∗ 0.07
Accessed Internet for Business Purposes(1 = Every day ; 7 = Never) 3.69 3.57 0.12 0.48
Treatment Group 0.67 0.64 0.03 0.34This table presents differential attrition between firms who responded to endline interviews and firms who did not. The data is based
on phone interviews conducted by the non-profit. A nationality of the business is determined if at least one of the owners has that
particular nationality. The number of employees includes the owner or manager of the firm.
48

TABLE A.2: SUMMARY STATISTICS OF NON - ATTRITERS
Mean SD Observations
Sectors
Construction and Renovation 0.25 (0.43) 828
Food and Beverages 0.16 (0.36) 828
Home Essentials 0.13 (0.34) 828
Handicrafts and Artisans 0.12 (0.32) 828
Business and Consulting Services 0.10 (0.30) 828
Owner Nationality
Liberian 0.92 (0.28) 828
Lebanese 0.04 (0.20) 828
Nigerian 0.01 (0.11) 828
Indian 0.01 (0.12) 828
Other
Total Number of Employees 15.11 (45.69) 825
Bid on a tender in the past 6 months (Y=1; N=0) 0.22 (0.41) 587
Number of tenders bid on in the past 6 months 0.70 (1.65) 587
Won a tender in the past 6 months (Y=1; N=0) 0.13 (0.34) 609
Number of tenders won in the past 6 months 0.35 (1.31) 609
Proportion of tenders won (conditional on applying) 0.33 (0.37) 129
Ever won a contract lasting 6 months or more 0.73 (0.45) 119
Speaks at least one Liberian local language 0.36 (0.48) 828
Accessed Internet for Business Purposes(1 = Every day ; 7 = Never) 3.57 (2.67) 741
This table presents summary statistics of firms who responded to the endline survey. The data is based onphone interviews conducted by the non-profit. A nationality of the business is determined if at least one ofthe owners has that particular nationality. The number of employees includes the owner or manager of thefirm.
49

TABLE A.3: EFFECT OF VOUCHER + ENCOURAGEMENT ON TRAINING TAKE-UP
PANEL A : BASED ON ATTENDANCE
General ProcurementTraining (Part 1/2)
Bid CompilationTraining (Part 2/2)
(1) (2) (3) (4)
Voucher + Encouragementfor Training
0.19*** 0.20*** 0.16*** 0.17***(0.02) (0.02) (0.01) (0.02)
Controls NO YES NO YESControl Group Mean 0.01 0.01 0.01 0.01Observations 1192 1143 1192 1143
PANEL B : SELF-REPORTED
Did Your Firm GoThrough Training
How Many TrainingSessions did
Your Firm Attend
(1) (2) (3) (4)
Voucher + Encouragementfor Training
0.14*** 0.16*** 0.33*** 0.36***(0.04) (0.04) (0.11) (0.11)
Controls NO YES NO YESControl Group Mean 0.51 0.51 0.68 0.68Observations 789 754 789 754
Standard errors are in parentheses and are robust. This table presents coefficients of the regression oftraining take-up as recorded by the non-profit on encouragement. Controls include employment, countiesof operation, gender of the owner, sectors, languages used for business, geographical zone and the numberof submitted bids. All controls are measured at baseline. Panel A measures training attendance using datacollected by the non-profit, while Panel B measures attendance based on self-reported attendance by theFirms. Columns (1) to (4) refer to the two parts of the training delivered by the non-profit. Columns (1)and (2) refer to the “General Procurement” training. Column (3) and (4) refer to the “Bid Compilation”training. The General Procurement training is a requirement for the Bid Compilation training. Panel Brefers to training take-up as reported by the firm. This includes all types of training, not only the trainingstudied in the scope of this paper.
50

TA
BL
EA
.4:E
FFE
CT
OF
WIN
NIN
G-C
ON
TR
AC
TS
TR
AIN
ING
ON
BID
DIN
GO
NT
EN
DE
RS
,PR
OP
OR
TIO
NO
FA
LL
RE
LE
VA
NT
TE
ND
ER
SB
ID-O
NA
ND
WO
N,A
ND
ON
WO
RK
ING
WIT
HIN
TE
RN
AT
ION
AL
CL
IEN
TS
Bid
onte
nder
sin
the
past
6m
onth
s
Prop
orti
onof
all
rele
vant
tend
ers
bid
on
Prop
orti
onof
all
rele
vant
tend
ers
won
Ever
wor
ked
wit
hin
tern
atio
nalc
lient
s
(1)
(2)
(3)
(4)
(5)
(6)
(7)
(8)
Trea
tmen
t-on
-the
-Tre
ated
Win
ning
-Con
trac
tsTr
aini
ng0.
090.
130.
05**
0.05
**0.
02*
0.02
**0.
31**
0.29
**(0
.11)
(0.1
0)(0
.02)
(0.0
2)(0
.01)
(0.0
1)(0
.13)
(0.1
2)
Inte
nt-t
o-Tr
eat
Vouc
her
+En
cour
agem
ent
0.02
0.04
0.01
**0.
01**
0.01
*0.
01**
0.08
**0.
08**
(0.0
3)(0
.03)
(0.0
1)(0
.01)
(0.0
0)(0
.00)
(0.0
3)(0
.03)
Con
trol
sN
OY
ESN
OY
ESN
OY
ESN
OY
ESC
ontr
olG
roup
Mea
n0.
170.
170.
010.
010.
000.
000.
290.
29O
bser
vati
ons
787
752
787
752
789
754
789
754
Stan
dard
erro
rsar
ein
pare
nthe
ses
and
are
robu
st.
This
tabl
esh
ows
resu
lts
from
esti
mat
ing
Equa
tion
(5).
The
top
pane
lpre
sent
sth
eTr
eate
don
the
Trea
ted
Esti
mat
ew
hile
the
bott
ompa
nelp
rese
nts
the
Inte
ntto
Trea
tes
tim
ate.
Con
trol
sin
clud
eem
ploy
men
t,co
unti
esof
oper
atio
n,ge
nder
ofth
eow
ner,
sect
ors,
lang
uage
sus
edfo
rbu
sine
ss,g
eogr
aphi
calz
one
and
the
num
ber
ofsu
bmit
ted
bids
.All
cont
rols
are
mea
sure
dat
base
line.
All
outp
uts
are
refe
rrin
gto
the
peri
odof
6m
onth
spr
eced
ing
the
inte
rvie
w.C
olum
ns(1
)&(2
)ref
erto
whe
ther
the
firm
subm
itte
dbi
dsfo
rte
nder
s.C
olum
ns(3
)&
(4)r
efer
toth
epr
opor
tion
ofte
nder
sth
efir
map
plie
dto
over
tota
lnum
ber
ofte
nder
sin
its
sect
or(s
).C
olum
ns(5
)&(6
)ref
erto
the
prop
orti
onof
tend
ers
the
firm
won
over
tota
lnum
ber
ofte
nder
sin
its
sect
or(s
).C
olum
ns(7
)&(8
)ref
erto
whe
ther
the
firm
ever
wor
ked
wit
hin
tern
atio
nalc
lient
s.
51

TA
BL
EA
.5:B
AS
EL
INE
CO
RR
EL
AT
ION
BE
TW
EE
NFI
RM
CH
AR
AC
TE
RIS
TIC
SA
ND
INT
ER
NE
TA
CC
ES
S
Tota
l#of
empl
oyee
s#
ofte
nder
sbi
don
#of
tend
ers
won
#of
cont
ract
sw
onw
/ote
nder
Abi
lity
toac
cess
tend
ers
easi
ly(1
-10)
(1)
(2)
(3)
(4)
(5)
Inte
rnet
14.0
5***
1.06
***
0.32
***
0.08
1.93
***
(3.9
2)(0
.14)
(0.0
6)(0
.12)
(0.5
3)
Con
stan
t5.
09**
*0.
13**
0.04
*0.
50**
*5.
71**
*(1
.04)
(0.0
6)(0
.02)
(0.0
8)(0
.39)
Obs
erva
tion
s54
654
654
454
626
5St
anda
rder
rors
are
inpa
rent
hese
san
dar
ero
bust
.Th
ista
ble
look
sat
the
corr
elat
ion
ofba
selin
eIn
tern
etus
age
wit
hfir
mch
arac
teri
stic
sco
rrel
ated
wit
hun
obse
rvab
lefir
mqu
alit
y.A
llva
riab
les
are
mea
sure
dat
base
line.
52

TABLE A.6: HOW EFFECT OF WINNING-CONTRACTS TRAINING ON CONTRACT QUAL-ITY VARIES WITH INTERNET ACCESS
PANEL A : QUALITY OFCONTRACTS
Won Long Lasting contract
(1) (2)
Voucher + Encouragementfor Training
-0.01 -0.03(0.04) (0.04)
Voucher +Encouragement× Internet
0.21*** 0.26***(0.08) (0.08)
Controls NO YESControl Group Mean 0.23 0.23Observations 741 712
PANEL B : REVENUE FROMCONTRACTS
(1) (2)
Voucher +Encouragement
-812.82 -1431.60(742.22) (1121.16)
Voucher +Encouragement× Internet
9917.22** 10523.54**(4454.00) (4281.64)
Controls NO YESControl Group Mean 5322.46 5322.46Observations 741 712
Standard errors are in parentheses and are robust. The table presents results from estimating Equation(5) Controls include employment, counties of operation, gender of the owner, sectors, languages used forbusiness, geographical zone and the number of submitted bids. All controls are measured at baseline. Alloutputs are referring to the period of 6 months preceding the interview. In Panel A, the outcome variable isan indicator for whether or not the firm ever had a contract longer than 6 months. In Panel B, the outcomevariable is the revenue from contracts over the past 6 months.
53

TA
BL
EA
.7:
HO
WE
FFE
CT
OF
WIN
NIN
G-C
ON
TR
AC
TS
TR
AIN
ING
VA
RIE
SW
ITH
INT
ER
NE
TA
CC
ES
SC
ON
TR
OL
LIN
GFO
RIN
TE
RA
CT
ION
WIT
HO
TH
ER
FIR
MC
HA
RA
CT
ER
IST
ICS
#of
tend
ers
bid
onTo
tal#
ofco
ntra
cts
#of
tend
ers
won
#of
cont
ract
sw
onw
/ote
nder
Won
long
last
ing
cont
ract
Rev
enue
from
cont
ract
s(U
SD)
(1)
(2)
(3)
(4)
(5)
(6)
V+
Efo
rTr
aini
ng0.
19-0
.18
0.02
-0.2
0-0
.06
-171
1.25
(0.2
1)(0
.31)
(0.1
2)(0
.27)
(0.0
9)(4
401.
27)
Vouc
her
+En
cour
agem
ent
×In
tern
et
0.41
*0.
52*
0.29
***
0.23
0.28
***
9649
.83*
**(0
.21)
(0.2
6)(0
.11)
(0.2
2)(0
.09)
(355
2.41
)
Con
trol
sY
ESY
ESY
ESY
ESY
ESY
ESC
ontr
ols
Inte
ract
edw
/Tr
eate
men
tY
ESY
ESY
ESY
ESY
ESY
ESC
ontr
olG
roup
Mea
n0.
350.
480.
150.
330.
2353
22.4
6O
bser
vati
ons
739
740
741
740
741
741
Stan
dard
erro
rsar
ein
pare
nthe
ses
and
are
robu
st.
Con
trol
sin
clud
eem
ploy
men
t,co
unti
esof
oper
atio
n,ge
nder
ofth
eow
ner,
sect
ors,
lang
uage
sus
edfo
rbu
sine
ss,g
eogr
aphi
calz
one
and
the
num
ber
ofsu
bmit
ted
bids
.A
llco
ntro
lsar
em
easu
red
atba
selin
e.Th
ein
tera
ctio
nof
allc
ontr
ols
wit
htr
eatm
enta
real
soin
clud
ed.C
olum
n(1
)ref
ers
toth
enu
mbe
rof
bids
subm
itte
dfo
rte
nder
s.C
olum
ns(2
)to
(4)r
efer
toth
enu
mbe
rof
cont
ract
sw
onov
eral
l,th
roug
ha
tend
erpr
oces
san
dw
itho
uta
tend
erpr
oces
s.C
olum
n(5
)ref
ers
tow
heth
erfir
ms
won
long
term
cont
ract
sw
hile
colu
mn
(6)r
efer
sto
the
tota
lval
ueof
cont
ract
sw
onby
firm
s.
54

TA
BL
EA
.8:R
ES
ULT
SO
FL
AS
SO
PR
OC
ED
UR
E
Var
iabl
eTi
mes
_Kep
tA
vera
ge_C
oeffi
cien
tO
fthe
tota
lnum
ber
ofem
ploy
ees,
how
man
yar
epe
rman
ente
mpl
oyee
s?1
0.00
260
Oft
heto
taln
umbe
rof
empl
oyee
,how
man
yar
ete
mpo
rary
empl
oyee
s?1
0.00
590
Oft
heto
taln
umbe
rof
empl
oyee
sho
wm
any
are
fam
ilym
embe
rsof
the
owne
r(s)
?0
.H
ave
you
ever
resp
onde
dto
ate
nder
orsu
bmit
ted
abi
d?99
0.03
10A
tlea
ston
eof
the
owne
rsha
san
Am
eric
o-Li
beri
anna
me
0.
Hav
eyo
ure
spon
ded
toa
tend
eror
subm
itte
da
bid
inth
epa
st6
mon
ths?
670.
0438
Num
ber
ofte
nder
ssu
bmit
ted
inth
epa
stsi
xm
onth
s55
0.01
07N
umbe
rof
cont
ract
sw
onth
roug
hte
nder
sin
the
past
six
mon
ths
780.
0553
Do
you
impo
rt?
0.
Hav
eyo
uev
erha
da
cont
ract
sfo
rth
ego
vern
men
t?0
.H
ave
you
ever
had
aco
ntra
cts
for
anN
GO
?10
0.04
87H
ave
you
ever
had
aco
ntra
cts
for
anin
tern
atio
nalc
lient
?46
0.03
78H
owof
ten
doyo
uus
eth
eIn
tern
etfo
rbu
sine
sspu
rpos
es?
194
0.12
2T
his
tabl
epr
esen
tsth
ere
sult
sof
the
LASS
Opr
oced
ure
deve
lopp
edin
sect
ion
5.3.
2.Th
eLA
SSO
esti
mat
ion
pred
icts
wha
tvar
iabl
es,i
nter
acte
dw
ith
trea
tmen
t,be
stex
plai
nth
ehe
tero
gene
ity
ifth
eef
fect
obse
rved
.Th
efir
stco
lum
nsh
ows
the
num
ber
ofti
mes
each
vari
able
was
kept
out
ofth
e20
0LA
SSO
esti
mat
ions
.The
seco
ndco
lum
nsh
ows
the
aver
age
coef
ficie
ntof
each
vari
able
s,ac
cros
sLA
SSO
proc
edur
es.
55

TA
BL
EA
.9:B
AS
EL
INE
CO
RR
EL
AT
ION
BE
TW
EE
NFI
RM
CH
AR
AC
TE
RIS
TIC
SA
ND
INT
ER
NE
T-B
AS
ED
DE
MA
ND
SH
OC
K
Tota
l#of
empl
oyee
s#
ofte
nder
sbi
don
#of
tend
ers
won
#of
cont
ract
sw
onw
/ote
nder
Abi
lity
toac
cess
tend
ers
easi
ly(1
-10)
(1)
(2)
(3)
(4)
(5)
Onl
ine
Dem
and
Shoc
k-0
.05
0.01
0.00
0.00
0.01
(0.1
0)(0
.01)
(0.0
0)(0
.01)
(0.0
2)
Con
stan
t11
.96*
**0.
64**
*0.
20**
*0.
52**
*6.
90**
*(1
.70)
(0.0
6)(0
.03)
(0.0
5)(0
.18)
Obs
erva
tion
s58
258
258
058
228
5St
anda
rder
rors
are
inpa
rent
hese
san
dar
ero
bust
.Thi
sta
ble
show
sth
eco
rrel
atio
nbe
twee
nth
esh
are
ofte
nder
spu
blis
hed
onlin
ein
the
wee
kbe
fore
the
enco
urag
emen
tand
base
line
char
acte
rist
ics.
56
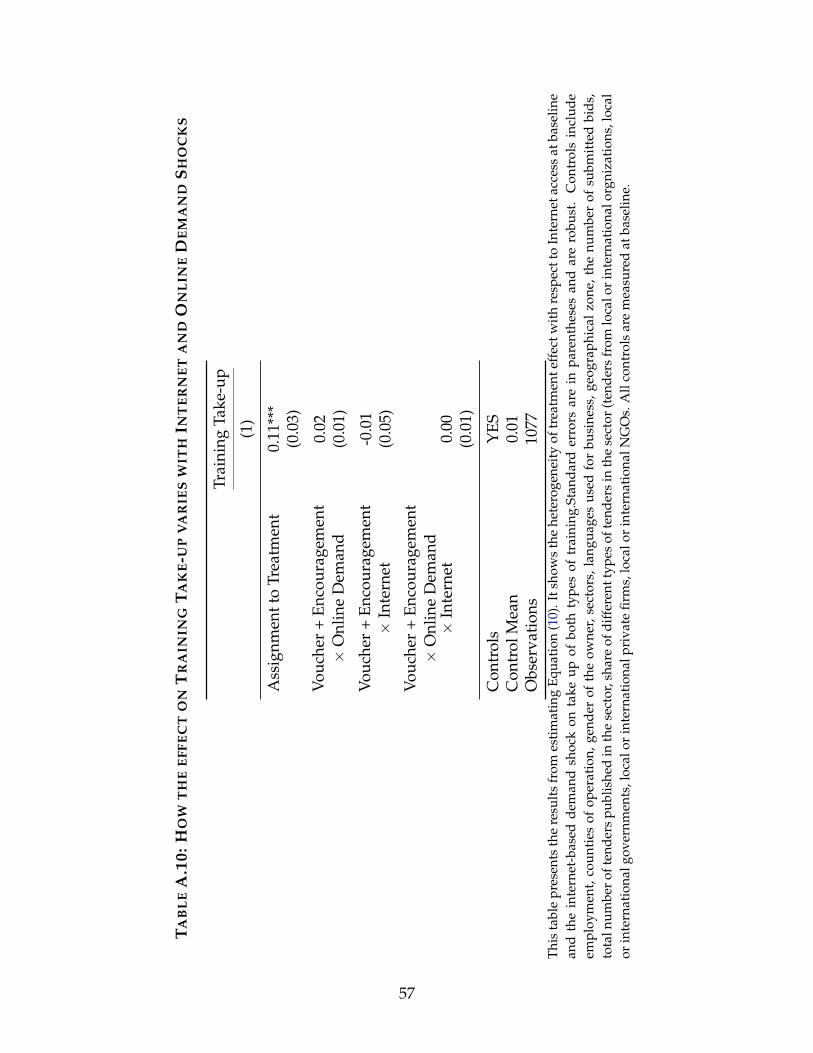
TA
BL
EA
.10:
HO
WT
HE
EFF
EC
TO
NT
RA
ININ
GT
AK
E-U
PV
AR
IES
WIT
HIN
TE
RN
ET
AN
DO
NL
INE
DE
MA
ND
SH
OC
KS
Trai
ning
Take
-up
(1)
Ass
ignm
entt
oTr
eatm
ent
0.11
***
(0.0
3)
Vouc
her
+En
cour
agem
ent
×O
nlin
eD
eman
d0.
02(0
.01)
Vouc
her
+En
cour
agem
ent
×In
tern
et-0
.01
(0.0
5)
Vouc
her
+En
cour
agem
ent
×O
nlin
eD
eman
d×
Inte
rnet
0.00
(0.0
1)
Con
trol
sY
ESC
ontr
olM
ean
0.01
Obs
erva
tion
s10
77T
his
tabl
epr
esen
tsth
ere
sult
sfr
omes
tim
atin
gEq
uati
on(1
0).I
tsho
ws
the
hete
roge
neit
yof
trea
tmen
teff
ectw
ith
resp
ectt
oIn
tern
etac
cess
atba
selin
ean
dth
ein
tern
et-b
ased
dem
and
shoc
kon
take
upof
both
type
sof
trai
ning
.Sta
ndar
der
rors
are
inpa
rent
hese
san
dar
ero
bust
.C
ontr
ols
incl
ude
empl
oym
ent,
coun
ties
ofop
erat
ion,
gend
erof
the
owne
r,se
ctor
s,la
ngua
ges
used
for
busi
ness
,geo
grap
hica
lzo
ne,t
henu
mbe
rof
subm
itte
dbi
ds,
tota
lnum
ber
ofte
nder
spu
blis
hed
inth
ese
ctor
,sha
reof
diff
eren
ttyp
esof
tend
ers
inth
ese
ctor
(ten
ders
from
loca
lor
inte
rnat
iona
lorg
niza
tion
s,lo
cal
orin
tern
atio
nalg
over
nmen
ts,l
ocal
orin
tern
atio
nalp
riva
tefir
ms,
loca
lor
inte
rnat
iona
lNG
Os.
All
cont
rols
are
mea
sure
dat
base
line.
57

TA
BL
EA
.11:
HO
WT
HE
EFF
EC
TO
FW
INN
ING
-CO
NT
RA
CT
ST
RA
ININ
GV
AR
IES
WIT
HIN
TE
RN
ET
AC
CE
SS
AN
DO
VE
RA
LL
DE
MA
ND
SH
OC
KS
#of
tend
ers
bid
onTo
tal#
ofco
ntra
cts
#of
tend
ers
won
#of
cont
ract
sw
onw
/ote
nder
Won
long
-las
ting
cont
ract
(1)
(2)
(3)
(4)
(5)
Vouc
her
+En
cour
agem
ent
for
Trai
ning
-0.3
0-0
.43*
*-0
.01
-0.4
1**
-0.0
6(0
.22)
(0.2
1)(0
.08)
(0.1
8)(0
.07)
Vouc
her
+En
cour
agem
ent
×To
talD
eman
d0.
020.
05*
-0.0
10.
05**
0.00
(0.0
3)(0
.02)
(0.0
1)(0
.02)
(0.0
1)
Vouc
her
+En
cour
agem
ent
×In
tern
et0.
010.
51-0
.11
0.61
**0.
13(0
.38)
(0.3
2)(0
.17)
(0.2
6)(0
.11)
Vouc
her
+En
cour
agem
ent
×To
talD
eman
d×
Inte
rnet
0.04
-0.0
20.
03**
-0.0
5*0.
01(0
.04)
(0.0
3)(0
.02)
(0.0
3)(0
.01)
Con
trol
sY
ESY
ESY
ESY
ESY
ESC
ontr
olM
ean
0.35
0.48
0.15
0.33
0.23
Obs
erva
tion
s71
071
171
271
171
2C
ompu
ted
ATE
(Int
erne
t,+v
eD
eman
d)0.
280.
350.
130.
220.
14T
his
tabl
esh
ows
resu
lts
from
esti
mat
ing
Equa
tion
(10)
.Itp
rese
nts
the
hete
roge
neit
yof
trea
tmen
teff
ectw
ith
rspe
ctto
Inte
rnet
acce
ssat
base
line
and
the
onlin
ede
man
dsh
ock.
Stan
dard
erro
rsar
ein
pare
nthe
ses
and
are
robu
st.C
ontr
ols
incl
ude
empl
oym
ent,
coun
ties
ofop
erat
ion,
gend
erof
the
owne
r,se
ctor
s,la
ngua
ges
used
for
busi
ness
,geo
grap
hica
lzon
e,th
enu
mbe
r
ofsu
bmit
ted
bids
,tot
alnu
mbe
rof
tend
ers
publ
ishe
din
the
sect
orfr
omth
epr
edic
ted
date
oftr
aini
ng,s
hare
ofdi
ffer
entt
ypes
ofte
nder
sin
the
sect
or(t
ende
rsfr
omlo
calo
rin
tern
atio
nal
orga
niza
tion
s,lo
calo
rin
tern
atio
nalg
over
nmen
ts,l
ocal
orin
tern
atio
nalp
riva
tefir
ms,
loca
lor
inte
rnat
iona
lNG
Os.
All
cont
rols
are
mea
sure
dbe
fore
base
line.
Col
umns
(1)
refe
rsto
the
num
ber
ofbi
dssu
bmit
ted
for
tend
ers.
Col
umns
(2)
to(4
)re
fer
toth
enu
mbe
rof
cont
ract
sw
onov
eral
l,th
roug
ha
tend
erpr
oces
san
dw
itho
uta
tend
erpr
oces
s.C
olum
n(5
)re
fers
to
whe
ther
firm
sw
onlo
ngte
rmco
ntra
cts
i.e.c
ontr
acts
long
erth
ansi
xm
onth
s.
58

59