informe semestral.pdf
TRANSCRIPT
TITLE (40–50 CHARACTERS)SUBTITLE (40-50 CHARACTERS)
UNAUDITED INTERIM REPORT AND ACCOUNTS BLACKROCK STRATEGIC FUNDS (BSF)
R.C.S. Luxembourg: B 127481
30 NOVEMBER 2013


Unaudited Interim Report and Accounts 1
Contents
Subscriptions may be made only on the basis of the current Prospectus, together with the most recent audited annual report and accounts and unaudited interim report and accounts. Copies are
available from the Investor Services Centre, the Transfer Agent, the Manager or any of the Distributors.
BSF Chairman’s Letter to Shareholders 2
BSF Investment Adviser’s Report 4
Board of Directors 6
Management and Administration 6
Statement of Net Assets 7
Three Year Summary of Net Asset Values 11
Statement of Operations and Changes in Net Assets 15
Statement of Changes in Shares Outstanding 19
Portfolio of Investments BlackRock Americas Diversified Equity Absolute Return Fund 22
BlackRock Asia Extension Fund 45
BlackRock Emerging Markets Absolute Return Fund 49
BlackRock Emerging Markets Allocation Fund 52
BlackRock Emerging Markets Flexi Dynamic Bond Fund 59
BlackRock Euro Dynamic Diversified Growth Fund 61
BlackRock European Absolute Return Fund 64
BlackRock European Constrained Credit Strategies Fund 67
BlackRock European Credit Strategies Fund 79
BlackRock European Diversified Equity Absolute Return Fund 92
BlackRock European Opportunities Extension Fund 103
BlackRock Fixed Income Strategies Fund 106
BlackRock Fund of iShares – Conservative 114
BlackRock Fund of iShares – Dynamic 115
BlackRock Fund of iShares – Growth 116
BlackRock Fund of iShares – Moderate 117
BlackRock Global Absolute Return Bond Fund 118
BlackRock Latin American Opportunities Fund 146
BlackRock Mining Opportunities Fund 148
Notes to the Financial Statements 150
General Information 159

2 BlackRock Strategic Funds (BSF)
BSF Chairman’s Letter to ShareholdersNovember 2013
Dear Shareholder,
I am writing to update you on the activities of BlackRock Strategic Funds (“the Company”), a Luxembourg UCITS Fund range
providing clients with access to BlackRock investment products that seek to take full advantage of the expanded investment
powers incorporated in the UCITS directive. This report covers a six month period from 1 June 2013 to 30 November 2013.
After some strong gains seen earlier in the year, equity returns moderated over the period as concerns about a potential ‘tapering’
(reduction) of quantitative easing (“QE”) purchases led to profit-taking by market participants. Anxiety over the sustainability of
the rate of China’s economic growth also weighed on markets, particularly those of the Asia Pacific region. Elsewhere, Japanese
equities continued to perform well, supported by strong optimism about the direction of the country’s economic policies.
Having initially also benefited from global central banks’ buying of bonds in significant quantities, fixed income investors seemed
to increasingly favour higher yielding bonds as many areas of the government bond markets began looking fully valued. Concerns
over the timing of QE tapering subsequently led to a sharp rise in bond yields. Global government bonds ended the period in
negative performance territory, while UK index-linked gilts and investment grade corporate bonds proved somewhat more
resilient.
Over the period, there were a number of important regulatory developments, which are expected to affect the way fund providers
service their clients and communicate with them. They included:
� The European Securities and Markets Authority (ESMA) published guidelines aimed at enhancing investor protection,
including additional disclosures being provided to all investors. In addition, new risk management obligations relating to the
use of collateral could result in lower permissible exposures to certain counterparties and governments.
� The European Market Infrastructure Regulation (EMIR) will deliver mandatory clearing through central counterparties as
it attempts to increase the resilience of the market and its participants. The requirements apply to all counterparties who
engage in over-the-counter derivative business. The use of central counterparties and the associated compliance burden
imposed could also result in an increase in trading costs.
� A US law, the Foreign Account Tax Compliance Act (FATCA) is expected to have far-reaching consequences in many other
global jurisdictions. Financial institutions, including asset managers, will be required to obtain information on clients in
order to identify whether a withholding tax is payable. The tax is intended to prevent US investors circumventing US taxation
requirements through the use of non-US investments.
The performance of the Funds is covered in more detail in the separate Investment Adviser's report, which also sets out some
views regarding our investment outlook.
Overall, the assets under management in the BlackRock Strategic Funds range have increased from USD3,937.0m to USD5,614.9m,
which reflected the continued ‘risk-on’ sentiment among market participants over the period.
One of the fastest-growing Funds within the range was the multi-asset BlackRock Euro Dynamic Diversified Growth Fund, which
increased from EUR160.5m to EUR359.9m over the six months. The BlackRock Emerging Markets Flexi Dynamic Bond Fund,
which was launched during the six month period, reached USD80.1m.
It was a very good period for the BlackRock Global Absolute Return Bond Fund (“GARBF”), which increased in size from
EUR111.7m to EUR187.5m. This was during a period which was generally difficult for bond investors. GARBF targets positive
returns in all market conditions by extracting relative value from a very broad range of fixed income-related investment strategies,
some of them traditional actively managed, and some of them based on quantitative models. GARBF also uses derivatives to
enhance its risk-management capabilities. At times, these financial instruments are used to quickly build protection (hedge)
against sudden market movements.
The largest Fund in the BSF range, the BlackRock European Absolute Return Fund, grew from EUR1,203.6m to EUR1,504.3m over
the period. Having reached its capacity, the Fund is now closed to new subscriptions.
Another one of our flagship bond Funds, BlackRock Fixed Income Strategies Fund (“FISF”), grew from EUR113.0m to EUR179.7m.
The Fund aims to offer attractive returns at lower volatility than the underlying market by investing across different European
fixed income sectors. FISF is able to go actively short duration (reverse its sensitivity to interest rate changes) and protect clients’
capital during periods of rising interest rates.

Unaudited Interim Report and Accounts 3
BSF Chairman’s Letter to ShareholdersNovember 2013 continued
The BlackRock European Credit Strategies Fund also attracted good flows for the period under review as it grew from EUR766.7m
to EUR1,104.1m.
Funds which experienced a reduction in size over the reporting period included BlackRock Americas Diversified Equity Absolute
Return Fund, which declined from USD235.1m to USD186.2m, BlackRock Latin American Opportunities Fund, which declined from
USD169.7m to USD146.0m and BlackRock Mining Opportunities Fund, which declined from USD10.3m to USD9.1m.
BlackRock is fully committed to remaining at the forefront of the European Mutual Funds Industry by bringing innovative
investment products to our clients and is actively working on adding other Funds to the range as our product development
process brings forward appropriate investment opportunities for clients.
On 12 June 2013, we launched the BlackRock Emerging Markets Flexi Dynamic Bond Fund, which seeks to maximise total return
by taking long, synthetic long and synthetic short positions in predominantly fixed income securities. We also launched the
BlackRock Emerging Markets Allocation Fund on 15 November 2013. The Fund seeks to achieve total returns over the investment
cycle by investing in a broad range of asset classes that provide exposure to factors that are positively correlated with growth
in Emerging Markets (“EM”). Such asset classes include equity securities, fixed and floating-rate debt instruments, derivatives,
other investment companies, including affiliated and unaffiliated mutual funds and Exchange-Traded Funds “(ETF”),
currency- and commodity-related instruments and structured products.
The BlackRock European Opportunities Absolute Return Fund was closed in July 2013 following a number of large redemptions,
which led to a fall in the Funds’ assets to under €1 million, rendering it commercially unviable. Therefore, it was decided that it
was in the best interests of shareholders to close this Fund and distribute redemption proceeds to shareholders.
Should you have any questions on any of this material, please contact us via our website: www.blackrockinternational.com
Yours faithfully,
Nicholas C.D. Hall
Chairman

4 BlackRock Strategic Funds (BSF)
BSF Investment Adviser’s Report
Performance Overview
1 June 2013 – 30 November 2013
Market OverviewThe period was underpinned by a growing belief in the
market that economic recovery in the US was solidifying,
despite the level of unemployment remaining high. But
sentiment faded somewhat after the Federal Reserve (“Fed”)
Chairman Ben Bernanke indicated that the bank’s
USD85 billion-a-month asset purchase programme might be
scaled back should economic data continue to improve.
Nevertheless, global equities gained over the six months,
with most developed regions finishing in positive territory.
Emerging Markets and Asia Pacific were particularly weak
amid concerns over economic growth and what the end of
the era of ‘easy money’ might mean for capital flows.
The picture in fixed income markets was quite different as
they largely failed to move forward, with weak returns across
most bond sectors, driven in part by the aforementioned
concerns over the Fed’s potential tapering of its QE
programme. The agitation this caused exposed the level of
reliance on liquidity injections that had flooded into asset
markets since the financial crisis in 2008.
Fund PerformanceEquities continued to produce relatively strong performance,
with the MSCI All-Country World Index up by 10.5% over the
period in US dollar terms.
Among the key global equity markets, North America
provided the strongest returns, supported by continuing
improvement in economic indicators. Europe ex UK and
Emerging Markets closed the period in positive territory but
underperformed the broader global equity market, with Latin
America particularly weak.
In fixed income markets, both government and corporate
bonds posted declines as bond yields rose and expectations
grew regarding Fed tapering.
The performance data to which we refer in the following
comments is for the primary share class, stated in the base
currency of each respective Fund.
Equity Fund PerformancePerformance of the equity-based Funds within the
BlackRock Strategic Funds range has been mixed but
predominantly positive. The best-performing fund was the
BlackRock European Opportunities Extension Fund, which
produced an absolute positive return of 21.8% over the
period, significantly outperforming its benchmark, the S&P
Europe BMI Index (Developed Markets only), which rose by
9.5%. This Fund seeks to outperform by blending a portfolio
of high conviction long positions with the flexibility to
establish synthetic short positions.
Another particularly strong performer during the period was
the BlackRock European Diversified Equity Absolute Return
Fund, which gained 10.1%, compared to 0.1% for its
benchmark, 3 Month Euribor Index. The Fund invests in a
very diversified range of stocks and can therefore seek to
take advantage of a wide range of opportunities. It typically
exploits long and short positions in as many as 1,500–2,000
European stocks, ranging from small to large companies.
The BlackRock Asia Extension Fund gained 5.9%,
outperforming its benchmark, the MSCI All Country Asia ex
Japan Index, which rose by 4.2%. Having reached its
capacity, the Fund is now closed to new subscriptions. The
BlackRock Americas Diversified Equity Absolute Return Fund
produced a positive absolute return of 2.8%, outperforming
its benchmark, LIBOR 3 Month Index, which was up 0.1%.
The largest Fund in the BSF range, the BlackRock European
Absolute Return Fund, produced a positive return of 1.7%
over the period and outperformed its benchmark, the
3 month Euro Libor Rate, which was up by 0.08%.
The weakest performers included the BlackRock Latin
American Opportunities Fund, which declined by 9.8% and
underperformed its benchmark, the MSCI EM Latin America
Index, which was down by 5.1% over the period. Despite the
recent underperformance, the investment team believes that
their positioning in the region currently provides a good entry
point for long-term investors.
Another notable underperformer over the period was the
BlackRock Mining Opportunities Fund, which declined by
7.6%, compared to a fall of 2.1% for its benchmark, the HSBC
Global Mining Total Return Index. The mining sector and
other cyclical areas have struggled as global economic
growth remained weak.
Bond Fund PerformanceThe best-performing bond fund within the range was
BlackRock European Credit Strategies Fund, which gained
2.3%, compared to 0.1% of the 3 Month Euribor Index.
The Fund seeks to achieve a positive absolute return for
investors in different market environments. It seeks to
achieve its investment objective by taking long and short risk
positions in fixed income transferable securities and
fixed-income related securities (including derivatives)
issued by companies, governments and agencies.
The other two funds within the range managed to the same
benchmark, BlackRock European Constrained Credit
Strategies Fund gained by 1.7% and BlackRock Global
Absolute Return Bond Fund fell by 0.2%.
Unaudited Interim Report and Accounts 5
BSF Investment Adviser’s Report
Performance Overview
1 June 2013 – 30 November 2013 continued
One of our flagship bond funds, BlackRock Fixed Income
Strategies Fund, produced an absolute positive return of
1.5% over the same period.
Mixed Fund PerformanceThe BlackRock Euro Dynamic Diversified Growth Fund
produced an absolute return of 1.5% over the six months,
outperforming its benchmark, the Euro Overnight Index
Average, which returned 0.0%.
Fund of Funds PerformanceThe BlackRock Funds of iShares Range, which was
launched in September 2010, offers investors four
diversified, multi-asset class funds for different risk
appetites: Conservative, Moderate, Growth and Dynamic.
The funds deliver their objectives via a combination of the
asset-allocation expertise of BlackRock and subsequent
investment in BlackRock’s award-winning iShares Exchange
Traded Funds (“ETF”) range. All four funds achieved levels of
risk appropriate to their respective profiles.
The best-performing fund in this range was the BlackRock
Fund of iShares – Dynamic, which delivered an absolute
return of 4.5%, which was followed by the BlackRock Fund
of iShares – Growth (+2.8%), the BlackRock Fund of iShares
– Moderate (+1.1%) and, finally, the BlackRock Fund of
iShares – Conservative (-0.5%).
OutlookOur assumption is that equity and bond markets have been
driven heavily in 2013 by macroeconomic liquidity, and that
this will change in 2014, albeit only slightly. This will mean
changing outcomes for investors.
Our central scenario is that economic growth will be slow in
all major regions, policy will gradually tighten, and the
volatility in bond yields will steadily increase.
We would agree that some areas in equity markets are
looking fully valued, but in our view we are not in asset
‘bubble’ territory. Indeed, we believe that equities can rise
further from current levels, and that they still represent
better value than cash and bonds. However, further gains will
need to come alongside corporate earnings growth. Given the
current environment of slow economic growth, sluggish wage
growth and lacklustre consumer spending, that may not be
easy for companies to achieve.
In conclusion, we believe that economic and market
conditions should continue to improve. And while many
investors continue to sit on the sidelines, there are still
opportunities to be found, and in our view the risks of not
investing outweigh the risks of being in the market.
December 2013

6 BlackRock Strategic Funds (BSF)
Board of Directors 1 Management
and Administration continued
Nicholas C.D. Hall (Chairman)
Frank P. Le Feuvre
Alexander C. Hoctor-Duncan
Francine Keiser
Geoffrey D. Radcliffe
Bruno Rovelli2
1 All Directors are non-executive Directors.
2 Appointed 20 November 2013
Management
and Administration
Management CompanyBlackRock (Luxembourg) S.A.
6D, route de Trèves
L-2633 Senningerberg
Grand Duchy of Luxembourg
Investment Advisers BlackRock Financial Management, Inc.,
Park Avenue Plaza
55 East 52nd Street
New York, NY 10055
USA
BlackRock Institutional Trust Company N.A.
400 Howard Street
San Francisco CA 94105
USA
BlackRock Investment Management, LLC
100 Bellevue Parkway
Wilmington
Delaware 19809
USA
BlackRock Investment Management (UK) Limited
12 Throgmorton Avenue
London EC2N 2DL
United Kingdom
BlackRock (Singapore) Limited
#18-01 Twenty Anson
20 Anson Road
Singapore, 079912
Sub-Investment AdvisersBlackRock Asset Management North Asia Limited*
16/F Cheung Kong Center
2 Queen’s Road Central
Hong Kong
BlackRock Investment Management (Australia) Limited
Level 18, 120 Collins Street
Melbourne 3000
Australia
BlackRock Japan Co., Ltd.
1-8-3 Marunouchi
Chiyoda-ku
Tokyo 100-8217
Japan
Principal DistributorBlackRock (Channel Islands) Limited
One Waverley Place
Union Street
St. Helier
Jersey JE1 0BR
Channel Islands
EnquiriesIn the absence of other arrangements, enquiries regarding
the Company should be addressed as follows:
Written Enquiries:
BlackRock Investment Management (UK) Limited,
c/o BlackRock (Luxembourg) S.A.
P.O. Box 1058
L-1010 Luxembourg
Grand Duchy of Luxembourg
All other enquiries:
Telephone: + 44 207 743 3300,
Fax: + 44 207 743 1143
Email: [email protected]
Custodian and Fund AccountantState Street Bank Luxembourg S.A.
49, avenue J.F. Kennedy
L-1855 Luxembourg
Grand Duchy of Luxembourg
Transfer Agent and RegistrarJ.P. Morgan Bank Luxembourg S.A.
6C, route de Trèves
L-2633 Senningerberg
Grand Duchy of Luxembourg
Independent AuditorsDeloitte Audit, S.à.r.l.
560, rue de Neudorf
L-2220 Luxembourg
Grand Duchy of Luxembourg
Legal AdviserLinklaters LLP
35, avenue J.F. Kennedy
L-1855 Luxembourg
Grand Duchy of Luxembourg
Paying AgentsA list of Paying Agents is to be found on page 159.
Registered Office49, avenue J.F. Kennedy
L-1855 Luxembourg
Grand Duchy of Luxembourg
* Appointed on 04 October 2013

Unaudited Interim Report and Accounts 7
The notes on pages 150 to 158 form an integral part of these financial statements.
Statement of Net Assets as at 30 November 2013
BlackRock Strategic
Funds Combined
BlackRock Americas
Diversified Equity
Absolute Return
Fund
BlackRock Asia
Extension Fund
BlackRock Emerging
Markets Absolute
Return Fund
BlackRock Emerging
Markets Allocation
Fund*
Note USD USD USD USD USD
Assets
Securities portfolio at cost 4,091,978,170 167,533,230 31,262,464 11,173,983 43,068,442
Unrealised appreciation/(depreciation) 154,402,068 10,434 1,341 63,972 (104,409)
Securities portfolio at market value 4,246,380,238 167,543,664 31,263,805 11,237,955 42,964,033
Cash at bank 2(a) 336,973,999 18,132,431 3,799,925 6,466,317 7,555,272
Time Deposits 1,118,953,645 – – – –
Due from broker 14 30,249,993 – 586,463 276,082 –
Dividend receivable on contracts for difference 8,908,779 1,709,719 1,956,857 – 38,107
Interest and dividends receivable 31,532,706 97,610 15,654 6,027 366,249
Interest receivable on swaps 342,721 2,069 – – –
Receivable for investments sold 2(a) 152,779,371 73,392,008 – 238,465 –
Receivable for Fund shares subscribed 44,762,767 761,585 – 74,690 –
Unrealised appreciation on:
Open Exchange traded futures contracts 2(d) 2,193,053 588,920 18,708 – 26,508
Open Forward foreign exchange transactions 2(d) 9,591,743 968,163 167 50,608 –
Contracts for difference 2(d) 46,088,758 10,036,983 2,944,181 – –
Market value of swaps 4,007,440 151,036 – – –
Market value of purchased options/swaptions 2,722,174 – – – –
Other assets 90,178 – – 3,734 644
Total assets 6,035,577,565 273,384,188 40,585,760 18,353,878 50,950,813
Liabilities
Cash owed to bank 2(a) 299,873 – – – –
Interest payable on contracts for difference 3,812,255 3,253,903 135,369 – –
Due to broker 14 86,346,424 79,897,838 – – 24,184
Interest payable on swaps 1,114,474 – – 10,143 –
Dividend payable on contracts for difference 470,981 – – 9,994 –
Payable for investments purchased 2(a) 227,111,294 – 1,507,026 206,105 1,038,552
Payable for Fund shares redeemed 22,360,150 3,176,001 – – –
Unrealised depreciation on:
Open Futures exchange traded contracts 2(d) 16,665,369 – – 7,260 –
Open Forward foreign exchange transactions 2(d) 228,381 – – – –
Contracts for difference 2(d) 490,928 – – 337,017 153,911
Market value of swaps 1,581,641 – – – –
Market value of written options/swaptions 2,220,466 – – – –
Other liabilities 57,968,569 902,642 655,307 159,275 39,508
Total liabilities 420,670,805 87,230,384 2,297,702 729,794 1,256,155
Total net assets 5,614,906,760 186,153,804 38,288,058 17,624,084 49,694,658
* The Fund commenced trading on 15 November 2013.

8 BlackRock Strategic Funds (BSF)
Statement of Net Assetsas at 30 November 2013 continued
BlackRock Emerging
Markets Flexi Dynamic
Bond Fund**
BlackRock Euro
Dynamic Diversified
Growth Fund
BlackRock European Absolute
Return Fund
BlackRock European
Constrained Credit
Strategies Fund
BlackRock European
Credit Strategies
Fund
Note USD EUR EUR EUR EUR
Assets
Securities portfolio at cost 65,099,866 325,598,271 518,469,712 149,044,124 1,098,179,132
Unrealised appreciation/(depreciation) (2,644,163) 12,009,817 53,711,382 4,305,061 37,460,630
Securities portfolio at market value 62,455,703 337,608,088 572,181,094 153,349,185 1,135,639,762
Cash at bank 2(a) 16,592,016 18,335,712 140,124,764 4,787,334 12,419,021
Time Deposits – – 802,290,000 12,000,107 –
Due from broker 14 – 494,987 7,825,795 86,748 –
Dividend receivable on contracts
for difference – – – – –
Interest and dividends receivable 1,048,311 204,113 602,615 2,349,393 16,684,201
Interest receivable on swaps 317,694 16,862 – – –
Receivable for investments sold 2(a) – – 8,233,629 3,551,528 21,865,081
Receivable for Fund shares subscribed 5,050 870,039 – – 6,115,948
Unrealised appreciation on:
Open Exchange traded futures contracts 2(d) 5,657 1,140,803 – – –
Open Forward foreign exchange transactions 2(d) 47,144 1,611,451 231,064 410,991 3,508,309
Contracts for difference 2(d) – – 18,657,583 – –
Market value of swaps 1,670,746 1,605,272 – – –
Market value of purchased options/swaptions – 1,036,992 – 80,394 670,062
Other assets – 11,503 – – –
Total assets 82,142,321 362,935,822 1,550,146,544 176,615,680 1,196,902,384
Liabilities
Cash owed to bank 2(a) – – – – –
Interest payable on contracts for difference – – 257,331 – –
Due to broker 14 1,849,505 – – – 2,006,821
Interest payable on swaps – – – 127,961 426,982
Dividend payable on contracts for difference – – 338,722 – –
Payable for investments purchased 2(a) – 1,399,306 7,788,528 8,711,986 72,835,109
Payable for Fund shares redeemed – 4,834 11,878,791 36,130 1,562,421
Unrealised depreciation on:
Open Futures exchange traded contracts 2(d) – – 10,023,634 164,238 1,836,015
Open Forward foreign exchange transactions 2(d) – – – – –
Contracts for difference 2(d) – – – – –
Market value of swaps – – – 489,345 24,785
Market value of written options/swaptions – 1,092,325 – 9,836 81,978
Other liabilities 185,904 534,238 15,561,097 2,172,143 14,024,412
Total liabilities 2,035,409 3,030,703 45,848,103 11,711,639 92,798,523
Total net assets 80,106,912 359,905,119 1,504,298,441 164,904,041 1,104,103,861
** The Fund commenced trading on 12 June 2013.
Unaudited Interim Report and Accounts 9
The notes on pages 150 to 158 form an integral part of these financial statements.
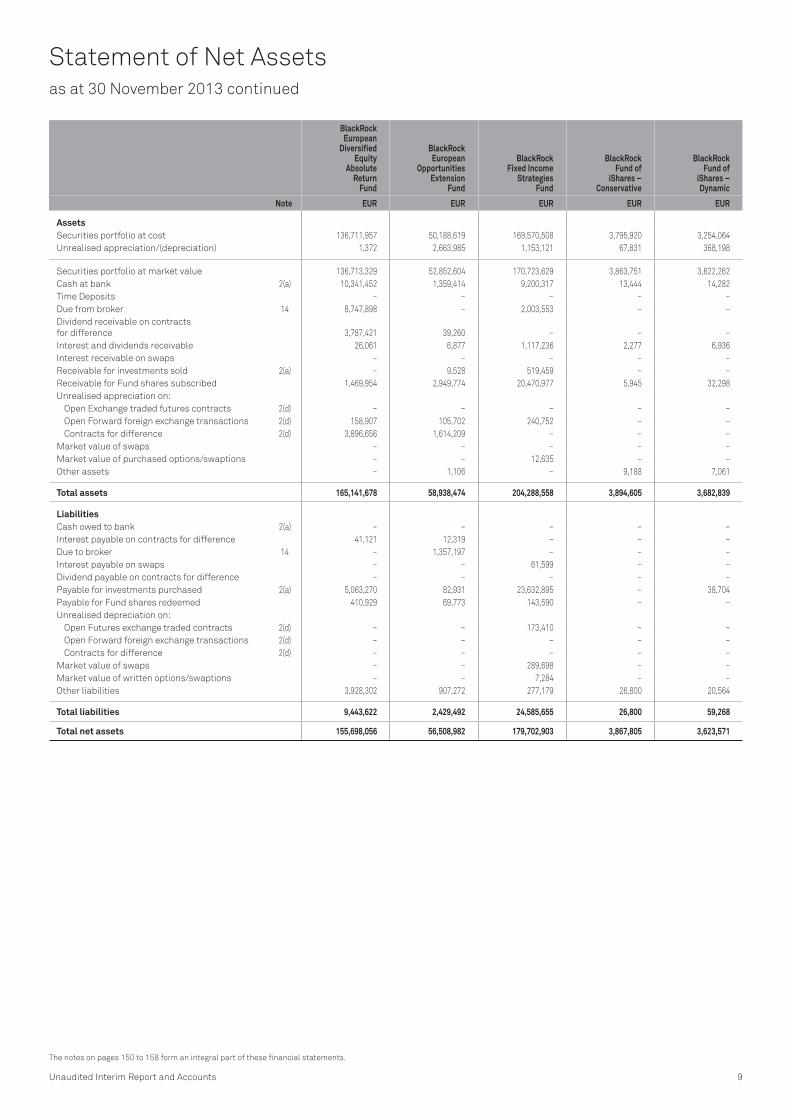
Statement of Net Assetsas at 30 November 2013 continued
BlackRock European
Diversified Equity
Absolute Return
Fund
BlackRock European
Opportunities Extension
Fund
BlackRock Fixed Income
Strategies Fund
BlackRock Fund of
iShares – Conservative
BlackRock Fund of
iShares – Dynamic
Note EUR EUR EUR EUR EUR
Assets
Securities portfolio at cost 136,711,957 50,188,619 169,570,508 3,795,920 3,254,064
Unrealised appreciation/(depreciation) 1,372 2,663,985 1,153,121 67,831 368,198
Securities portfolio at market value 136,713,329 52,852,604 170,723,629 3,863,751 3,622,262
Cash at bank 2(a) 10,341,452 1,359,414 9,200,317 13,444 14,282
Time Deposits – – – – –
Due from broker 14 8,747,898 – 2,003,553 – –
Dividend receivable on contracts
for difference 3,787,421 39,260 – – –
Interest and dividends receivable 26,061 6,877 1,117,236 2,277 6,936
Interest receivable on swaps – – – – –
Receivable for investments sold 2(a) – 9,528 519,459 – –
Receivable for Fund shares subscribed 1,469,954 2,949,774 20,470,977 5,945 32,298
Unrealised appreciation on:
Open Exchange traded futures contracts 2(d) – – – – –
Open Forward foreign exchange transactions 2(d) 158,907 105,702 240,752 – –
Contracts for difference 2(d) 3,896,656 1,614,209 – – –
Market value of swaps – – – – –
Market value of purchased options/swaptions – – 12,635 – –
Other assets – 1,106 – 9,188 7,061
Total assets 165,141,678 58,938,474 204,288,558 3,894,605 3,682,839
Liabilities
Cash owed to bank 2(a) – – – – –
Interest payable on contracts for difference 41,121 12,319 – – –
Due to broker 14 – 1,357,197 – – –
Interest payable on swaps – – 61,599 – –
Dividend payable on contracts for difference – – – – –
Payable for investments purchased 2(a) 5,063,270 82,931 23,632,895 – 38,704
Payable for Fund shares redeemed 410,929 69,773 143,590 – –
Unrealised depreciation on:
Open Futures exchange traded contracts 2(d) – – 173,410 – –
Open Forward foreign exchange transactions 2(d) – – – – –
Contracts for difference 2(d) – – – – –
Market value of swaps – – 289,698 – –
Market value of written options/swaptions – – 7,284 – –
Other liabilities 3,928,302 907,272 277,179 26,800 20,564
Total liabilities 9,443,622 2,429,492 24,585,655 26,800 59,268
Total net assets 155,698,056 56,508,982 179,702,903 3,867,805 3,623,571

10 BlackRock Strategic Funds (BSF)
Statement of Net Assetsas at 30 November 2013 continued
BlackRock Fund of
iShares – Growth
BlackRock Fund of
iShares – Moderate
BlackRock Global
Absolute Return
Bond Fund
BlackRock Latin
American Opportunities
Fund
BlackRock Mining
Opportunities Fund
Note EUR EUR EUR USD USD
Assets
Securities portfolio at cost 7,304,054 12,175,964 188,093,902 141,388,518 11,217,874
Unrealised appreciation/(depreciation) 678,954 624,397 (522,224) 6,040,244 (2,009,602)
Securities portfolio at market value 7,983,008 12,800,361 187,571,678 147,428,762 9,208,272
Cash at bank 2(a) 17,390 43,197 10,731,723 2,361,268 –
Time Deposits – – 8,500,006 – –
Due from broker 14 – – 2,449,644 – –
Dividend receivable on contracts
for difference – – – – –
Interest and dividends receivable 12,083 13,459 985,966 48,178 16,190
Interest receivable on swaps – – – – –
Receivable for investments sold 2(a) – – 23,035,654* 1,326,048 13,459
Receivable for Fund shares subscribed 2,342 153,086 224,972 – –
Unrealised appreciation on:
Open Exchange traded futures contracts 2(d) – – – – –
Open Forward foreign exchange transactions 2(d) – – – – 35
Contracts for difference 2(d) – – – – 239,706
Market value of swaps – – – – –
Market value of purchased options/swaptions – – 200,369 – –
Other assets 11,335 14,877 8,007 – –
Total assets 8,026,158 13,024,980 233,708,019 151,164,256 9,477,662
Liabilities
Cash owed to bank 2(a) – – – – 299,873
Interest payable on contracts for difference – – – – 350
Due to broker 14 – – – – –
Interest payable on swaps – – 195,496 – –
Dividend payable on contracts for difference – – – – 342
Payable for investments purchased 2(a) – 172,045 44,777,653* 594,992 47,259
Payable for Fund shares redeemed 11 23 – – –
Unrealised depreciation on:
Open Futures exchange traded contracts 2(d) – – 51,760 – –
Open Forward foreign exchange transactions 2(d) – – 167,933 – –
Contracts for difference 2(d) – – – – –
Market value of swaps – – 359,186 – –
Market value of written options/swaptions – – 440,047 – –
Other liabilities 34,536 45,219 230,377 4,599,323 71,124
Total liabilities 34,547 217,287 46,222,452 5,194,315 418,948
Total net assets 7,991,611 12,807,693 187,485,567 145,969,941 9,058,714
* Includes To be Announced (“TBA”), see Notes 2(a), for further details.

Unaudited Interim Report and Accounts 11
The notes on pages 150 to 158 form an integral part of these financial statements.
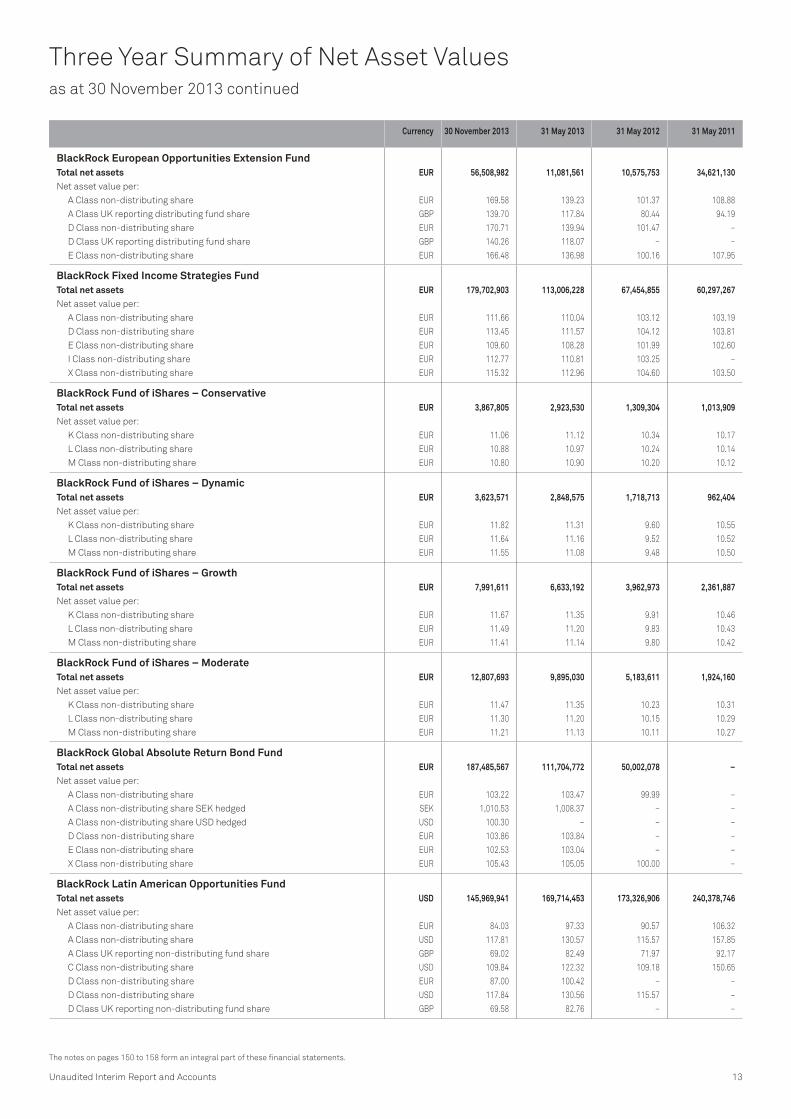
Three Year Summary of Net Asset Values as at 30 November 2013
Currency 30 November 2013 31 May 2013 31 May 2012 31 May 2011
BlackRock Americas Diversified Equity Absolute Return FundTotal net assets USD 186,153,804 235,107,890 6,805,522 –Net asset value per:
A Class non-distributing share AUD 121.14 112.33 – –
A Class non-distributing share USD 110.13 107.13 105.15 –
A Class non-distributing share EUR hedged EUR 109.65 106.99 105.07 –
A Class non-distributing share SEK hedged SEK 111.20 107.71 105.06 –
A Class UK reporting non-distributing fund share GBP 107.10 112.20 108.44 –
D Class UK reporting non-distributing fund share EUR hedged 1 EUR 109.94 106.90 104.81 –
X Class non-distributing share USD 112.73 107.98 – –
BlackRock Asia Extension FundTotal net assets USD 38,288,058 46,420,675 9,075,074 –Net asset value per:
A Class non-distributing share AUD 130.48 117.45 – –
A Class non-distributing share USD 119.14 112.54 90.70 –
A Class UK reporting non-distributing fund share GBP hedged GBP 118.75 112.13 90.73 –
D Class non-distributing share USD 119.95 113.06 90.77 –
E Class non-distributing share USD 118.28 111.94 90.59 –
X Class non-distributing share USD 104.62 – – –
BlackRock Emerging Markets Absolute Return FundTotal net assets USD 17,624,084 13,023,136 – –Net asset value per:
A Class non-distributing share USD 101.62 – – –
A Class non-distributing share EUR hedged EUR 100.02 – – –
D Class non-distributing share USD 106.54 103.90 – –
D Class non-distributing share EUR hedged EUR 105.96 103.47 – –
D Class UK reporting distributing fund share GBP hedged GBP 101.48 – – –
I Class non-distributing share EUR hedged EUR 106.71 104.03 – –
X Class non-distributing share USD 109.30 105.32 – –
BlackRock Emerging Markets Allocation Fund*Total net assets USD 49,694,658 – – –Net asset value per:
A Class non-distributing share USD 99.39 – – –
C Class non-distributing share USD 99.35 – – –
D Class non-distributing share USD 99.42 – – –
E Class non-distributing share USD 99.36 – – –
I Class non-distributing share USD 99.43 – – –
X Class non-distributing share USD 99.46 – – –
BlackRock Emerging Markets Flexi Dynamic Bond Fund**Total net assets USD 80,106,912 – – –Net asset value per:
A Class non-distributing share USD 98.92 – – –
D Class non-distributing share USD 99.61 – – –
D Class non-distributing share EUR hedged EUR 100.20 – – –
D Class UK reporting distributing fund share GBP 83.33 – – –
E Class non-distributing share USD 99.10 – – –
E Class non-distributing share EUR hedged EUR 99.78 – – –
X Class non-distributing share USD 101.26 – – –
BlackRock Euro Dynamic Diversified Growth FundTotal net assets EUR 359,905,119 160,499,726 66,828,783 17,761,370Net asset value per:
A Class non-distributing share EUR 109.42 107.83 99.03 102.16
A Class non-distributing share SEK hedged SEK 111.87 109.75 99.54 –
D Class non-distributing share EUR 111.14 109.20 99.69 102.22
E Class non-distributing share EUR 108.49 107.20 98.91 –
I Class non-distributing share EUR 112.08 109.99 100.17 102.45
I Class non-distributing share SEK hedged SEK 112.70 110.11 – –
X Class non-distributing share EUR 113.50 111.03 100.46 –
1 Class name changed, see Note 1, for further details.
* The Fund commenced trading on 15 November 2013.
** The Fund commenced trading on 12 June 2013.
12 BlackRock Strategic Funds (BSF)
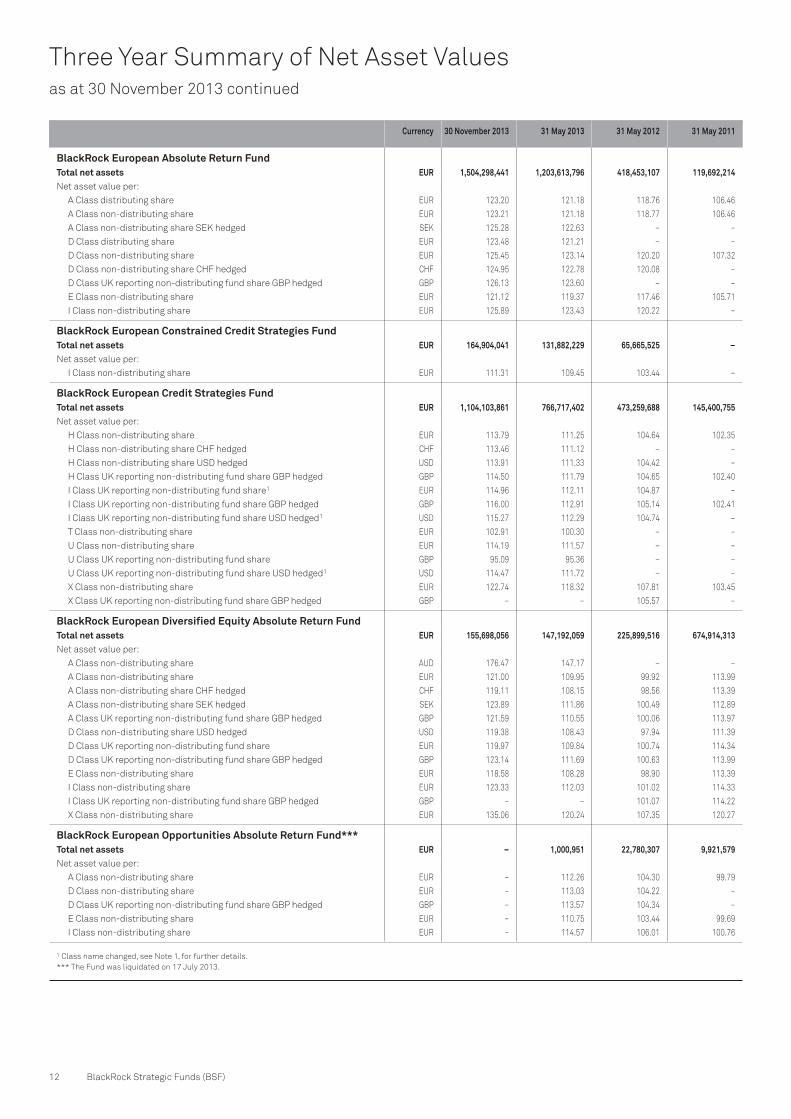
Three Year Summary of Net Asset Valuesas at 30 November 2013 continued
Currency 30 November 2013 31 May 2013 31 May 2012 31 May 2011
BlackRock European Absolute Return FundTotal net assets EUR 1,504,298,441 1,203,613,796 418,453,107 119,692,214Net asset value per:
A Class distributing share EUR 123.20 121.18 118.76 106.46
A Class non-distributing share EUR 123.21 121.18 118.77 106.46
A Class non-distributing share SEK hedged SEK 125.28 122.63 – –
D Class dis tributing share EUR 123.48 121.21 – –
D Class non-distributing share EUR 125.45 123.14 120.20 107.32
D Class non-distributing share CHF hedged CHF 124.95 122.78 120.08 –
D Class UK reporting non-distributing fund share GBP hedged GBP 126.13 123.60 – –
E Class non-distributing share EUR 121.12 119.37 117.46 105.71
I Class non-distributing share EUR 125.89 123.43 120.22 –
BlackRock European Constrained Credit Strategies FundTotal net assets EUR 164,904,041 131,882,229 65,665,525 –Net asset value per:
I Class non-distributing share EUR 111.31 109.45 103.44 –
BlackRock European Credit Strategies FundTotal net assets EUR 1,104,103,861 766,717,402 473,259,688 145,400,755Net asset value per:
H Class non-distributing share EUR 113.79 111.25 104.64 102.35
H Class non-distributing share CHF hedged CHF 113.46 111.12 – –
H Class non-distributing share USD hedged USD 113.91 111.33 104.42 –
H Class UK reporting non-distributing fund share GBP hedged GBP 114.50 111.79 104.65 102.40
I Class UK reporting non-distributing fund share 1 EUR 114.96 112.11 104.87 –
I Class UK reporting non-distributing fund share GBP hedged GBP 116.00 112.91 105.14 102.41
I Class UK reporting non-distributing fund share USD hedged 1 USD 115.27 112.29 104.74 –
T Class non-distributing share EUR 102.91 100.30 – –
U Class non-distributing share EUR 114.19 111.57 – –
U Class UK reporting non-distributing fund share GBP 95.09 95.36 – –
U Class UK reporting non-distributing fund share USD hedged 1 USD 114.47 111.72 – –
X Class non-distributing share EUR 122.74 118.32 107.81 103.45
X Class UK reporting non-distributing fund share GBP hedged GBP – – 105.57 –
BlackRock European Diversified Equity Absolute Return FundTotal net assets EUR 155,698,056 147,192,059 225,899,516 674,914,313Net asset value per:
A Class non-distributing share AUD 176.47 147.17 – –
A Class non-distributing share EUR 121.00 109.95 99.92 113.99
A Class non-distributing share CHF hedged CHF 119.11 108.15 98.56 113.39
A Class non-distributing share SEK hedged SEK 123.89 111.86 100.49 112.89
A Class UK reporting non-distributing fund share GBP hedged GBP 121.59 110.55 100.06 113.97
D Class non-distributing share USD hedged USD 119.38 108.43 97.94 111.39
D Class UK reporting non-distributing fund share EUR 119.97 109.84 100.74 114.34
D Class UK reporting non-distributing fund share GBP hedged GBP 123.14 111.69 100.63 113.99
E Class non-distributing share EUR 118.58 108.28 98.90 113.39
I Class non-distributing share EUR 123.33 112.03 101.02 114.33
I Class UK reporting non-distributing fund share GBP hedged GBP – – 101.07 114.22
X Class non-distributing share EUR 135.06 120.24 107.35 120.27
BlackRock European Opportunities Absolute Return Fund***Total net assets EUR – 1,000,951 22,780,307 9,921,579Net asset value per:
A Class non-distributing share EUR – 112.26 104.30 99.79
D Class non-distributing share EUR – 113.03 104.22 –
D Class UK reporting non-distributing fund share GBP hedged GBP – 113.57 104.34 –
E Class non-distributing share EUR – 110.75 103.44 99.69
I Class non-distributing share EUR – 114.57 106.01 100.76
1 Class name changed, see Note 1, for further details.
*** The Fund was liquidated on 17 July 2013.
Unaudited Interim Report and Accounts 13
The notes on pages 150 to 158 form an integral part of these financial statements.
Three Year Summary of Net Asset Valuesas at 30 November 2013 continued
Currency 30 November 2013 31 May 2013 31 May 2012 31 May 2011
BlackRock European Opportunities Extension FundTotal net assets EUR 56,508,982 11,081,561 10,575,753 34,621,130Net asset value per:
A Class non-distributing share EUR 169.58 139.23 101.37 108.88
A Class UK reporting distributing fund share GBP 139.70 117.84 80.44 94.19
D Class non-distributing share EUR 170.71 139.94 101.47 –
D Class UK reporting distributing fund share GBP 140.26 118.07 – –
E Class non-distributing share EUR 166.48 136.98 100.16 107.95
BlackRock Fixed Income Strategies FundTotal net assets EUR 179,702,903 113,006,228 67,454,855 60,297,267Net asset value per:
A Class non-distributing share EUR 111.66 110.04 103.12 103.19
D Class non-distributing share EUR 113.45 111.57 104.12 103.81
E Class non-distributing share EUR 109.60 108.28 101.99 102.60
I Class non-distributing share EUR 112.77 110.81 103.25 –
X Class non-distributing share EUR 115.32 112.96 104.60 103.50
BlackRock Fund of iShares – ConservativeTotal net assets EUR 3,867,805 2,923,530 1,309,304 1,013,909Net asset value per:
K Class non-distributing share EUR 11.06 11.12 10.34 10.17
L Class non-distributing share EUR 10.88 10.97 10.24 10.14
M Class non-distributing share EUR 10.80 10.90 10.20 10.12
BlackRock Fund of iShares – DynamicTotal net assets EUR 3,623,571 2,848,575 1,718,713 962,404Net asset value per:
K Class non-distributing share EUR 11.82 11.31 9.60 10.55
L Class non-distributing share EUR 11.64 11.16 9.52 10.52
M Class non-distributing share EUR 11.55 11.08 9.48 10.50
BlackRock Fund of iShares – GrowthTotal net assets EUR 7,991,611 6,633,192 3,962,973 2,361,887Net asset value per:
K Class non-distributing share EUR 11.67 11.35 9.91 10.46
L Class non-distributing share EUR 11.49 11.20 9.83 10.43
M Class non-distributing share EUR 11.41 11.14 9.80 10.42
BlackRock Fund of iShares – ModerateTotal net assets EUR 12,807,693 9,895,030 5,183,611 1,924,160Net asset value per:
K Class non-distributing share EUR 11.47 11.35 10.23 10.31
L Class non-distributing share EUR 11.30 11.20 10.15 10.29
M Class non-distributing share EUR 11.21 11.13 10.11 10.27
BlackRock Global Absolute Return Bond FundTotal net assets EUR 187,485,567 111,704,772 50,002,078 –Net asset value per:
A Class non-distributing share EUR 103.22 103.47 99.99 –
A Class non-distributing share SEK hedged SEK 1,010.53 1,008.37 – –
A Class non-distributing share USD hedged USD 100.30 – – –
D Class non-distributing share EUR 103.86 103.84 – –
E Class non-distributing share EUR 102.53 103.04 – –
X Class non-distributing share EUR 105.43 105.05 100.00 –
BlackRock Latin American Opportunities FundTotal net assets USD 145,969,941 169,714,453 173,326,906 240,378,746Net asset value per:
A Class non-distributing share EUR 84.03 97.33 90.57 106.32
A Class non-distributing share USD 117.81 130.57 115.57 157.85
A Class UK reporting non-distributing fund share GBP 69.02 82.49 71.97 92.17
C Class non-distributing share USD 109.84 122.32 109.18 150.65
D Class non-distributing share EUR 87.00 100.42 – –
D Class non-distributing share USD 117.84 130.56 115.57 –
D Class UK reporting non-distributing fund share GBP 69.58 82.76 – –

14 BlackRock Strategic Funds (BSF)
Three Year Summary of Net Asset Valuesas at 30 November 2013 continued
Currency 30 November 2013 31 May 2013 31 May 2012 31 May 2011
BlackRock Mining Opportunities FundTotal net assets USD 9,058,714 10,317,581 10,445,632 –Net asset value per:
D Class UK reporting non-distributing fund share GBP 73.51 85.63 – –
D Class UK reporting non-distributing fund share USD 76.84 83.16 99.48 –

Unaudited Interim Report and Accounts 15
The notes on pages 150 to 158 form an integral part of these financial statements.
Statement of Operations and Changes in Net Assetsfor the period ended 30 November 2013
BlackRock Strategic
Funds Combined
BlackRock Americas
Diversified Equity
Absolute Return
Fund
BlackRock Asia
Extension Fund
BlackRock Emerging
Markets Absolute
Return Fund
BlackRock Emerging
Markets Allocation
Fund*
BlackRock Emerging
Markets Flexi
Dynamic BondFund**
Note USD USD USD USD USD USD
Net assets at the beginning of the period(1) 4,035,235,332 235,107,890 46,420,675 13,023,136 – – IncomeBank interest 205,875 51,280 – – 1,147 –
Bond interest 39,886,934 103,169 13,144 – 37,638 1,293,308
Swap interest 307,285 – – – – 271,210
Dividends 4,304,855 – – 35,883 – –
Contracts for difference dividends 2(d) 2,565,786 610,227 1,272,055 – 38,107 –
Other income 40 – – – – –
Total income 2(c) 47,270,775 764,676 1,285,199 35,883 76,892 1,564,518
ExpensesBank interest 348,286 – 251,141 12,477 – 18,168
Contracts for difference interest 2(d) 7,382,476 2,278,883 – – – –
Swap interest 10,819,195 10,142 – – – –
Contracts for difference dividends 2(d) 1,002,155 – – 98,535 – –
Administration fees 5 4,434,919 119,577 62,449 14,961 4,791 37,780
Custodian and depositary fees 6 476,867 2,569 997 7,256 38 11,330
Custodian transaction fees 6 861,935 125,905 48,865 30,654 1,879 9,886
Luxembourg tax 8 831,337 20,490 9,450 2,783 4,051 13,940
Performance fees 7 19,780,174 352,638 91,456 54,343 – –
Distribution fees 4 393,033 – 156 – 3 24
Management fees 4 25,078,705 319,541 307,891 47,308 28,745 241,610
Less Management fee rebate 4 (93,985) – – – (644) –
Total expenses before reimbursement 71,315,097 3,229,745 772,405 268,317 38,863 332,738
Reimbursement of expenses 94,382 – – 3,734 – –
Total expenses after reimbursement 71,220,715 3,229,745 772,405 264,583 38,863 332,738
Net investment income/(deficit) (23,949,940) (2,465,069) 512,794 (228,700) 38,029 1,231,780 Net gain/(loss) realised on:
Investments 2(a) 76,415,806 63,802 (436) (68,106) 137 98,417
Contracts for difference 2(d) 23,531,836 (10,249,985) 1,173,788 743,982 (89,672) –
Futures exchange traded contracts 2(d) (23,824,859) 759,364 (12,378) (3,077) (19,018) (201,351)
Foreign currencies and forward foreign
exchange transactions 2(d) (23,102,784) 1,003,791 (1,333) 115,391 (1,657) 1,028,278
Swap transactions 2(d) 8,692,162 – – – – 137,692
Options contracts 2(d) (6,009,496) – – – – (68,692)
Net realised gain/(loss) for the period 55,702,665 (8,423,028) 1,159,641 788,190 (110,210) 994,344
Net change in unrealised appreciation/
(depreciation) on:
Investments 2(a) 46,391,221 (17,817) (5,014) 560,794 (104,409) (2,644,163)
Foreign currencies 300,120 – – 768 (1,349) (17,374)
Contracts for difference 2(d) 42,319,415 19,435,579 602,353 (561,609) (153,911) –
Open futures exchange traded contracts 2(d) (19,758,208) 212,120 18,708 (7,260) 26,508 5,657
Forward foreign exchange transactions 2(d) 16,039,410 1,085,782 252 (69,187) – 47,144
Swap transactions 2(d) (15,042,967) 151,036 – – – 96,680
Options contracts 2(d) (1,445,800) – – – – –
Net change in unrealised appreciation/(depreciation) for the period 68,803,191 20,866,700 616,299 (76,494) (233,161) (2,512,056)
Increase/(Decrease) in net assets as a result of operations 100,555,916 9,978,603 2,288,734 482,996 (305,342) (285,932)
Movements in share capitalNet receipts as a result of issue of shares 2,454,004,671 24,000,784 81,314 4,746,336 50,000,000 87,219,927
Net payments as a result of repurchase of shares (1,072,243,362) (82,933,473) (10,502,665) (628,384) – (6,827,083)
Increase/(Decrease) in net assets as a result of movements in share capital 1,381,761,309 (58,932,689) (10,421,351) 4,117,952 50,000,000 80,392,844
Foreign exchange adjustment 97,354,203 – – – – –
Net assets at the end of the period 5,614,906,760 186,153,804 38,288,058 17,624,084 49,694,658 80,106,912
* The Fund commenced trading on 15 November 2013.
** The Fund commenced trading on 12 June 2013.(1) The opening balance was combined using the average foreign exchange rates for the period (see Note 2(e)). The same net assets when converted using the average exchange rates for the
year ended 31 May 2013 reflected a figure of USD 3,936,993,045.

16 BlackRock Strategic Funds (BSF)
BlackRock Euro
Dynamic Diversified
Growth Fund
BlackRock European Absolute
Return Fund
BlackRock European
Constrained Credit
Strategies Fund
BlackRock European
Credit Strategies
Fund
BlackRock European
Diversified Equity
Absolute Return
Fund
Note EUR EUR EUR EUR EUR
Net assets at the beginning of the period(1) 160,499,726 1,203,613,796 131,882,229 766,717,402 147,192,059 IncomeBank interest 8,372 20,359 15,216 54,229 1,394
Bond interest 168,542 – 2,753,779 22,972,662 96,406
Swap interest 27,040 – – – –
Dividends 303,780 1,854,693 6,517 59,860 4,618
Contracts for difference dividends 2(d) – – – – 410,156
Other income – – – – –
Total income 2(c) 507,734 1,875,052 2,775,512 23,086,751 512,574
ExpensesBank interest – – – – –
Contracts for difference interest 2(d) – 1,816,706 – – 2,008,865
Swap interest – – 1,137,937 6,865,832 –
Contracts for difference dividends 2(d) – 677,339 – – –
Administration fees 5 124,963 2,094,585 35,741 321,266 217,330
Custodian and depositary fees 6 19,904 142,186 10,752 52,692 1,987
Custodian transaction fees 6 8,070 57,980 44,178 63,380 97,380
Luxembourg tax 8 27,236 360,504 8,630 76,038 37,747
Performance fees 7 – 5,056,748 594,655 5,828,704 2,351,313
Distribution fees 4 202 229,105 – – 24,347
Management fees 4 677,872 9,537,551 714,828 4,520,159 971,051
Less Management fee rebate 4 (11,797) – – – –
Total expenses before reimbursement 846,450 19,972,704 2,546,721 17,728,071 5,710,020
Reimbursement of expenses – – – – –
Total expenses after reimbursement 846,450 19,972,704 2,546,721 17,728,071 5,710,020
Net investment income/(deficit) (338,716) (18,097,652) 228,791 5,358,680 (5,197,446) Net gain/(loss) realised on:
Investments 2(a) (126,782) 31,295,296 2,588,681 16,821,195 18,735
Contracts for difference 2(d) – 6,271,646 – – 17,432,153
Futures exchange traded contracts 2(d) 781,443 (17,837,810) 134,417 (76,429) –
Foreign currencies and forward foreign
exchange transactions 2(d) 67,920 (1,430,298) (620,140) (7,105,697) (645,282)
Swap transactions 2(d) 220,803 – 404,107 4,681,546 –
Options contracts 2(d) 658,814 – (613,399) (4,375,494) –
Net realised gain/(loss) for the period 1,602,198 18,298,834 1,893,666 9,945,121 16,805,606
Net change in unrealised appreciation/
(depreciation) on:
Investments 2(a) 3,167,030 17,974,135 1,748,606 19,846,982 9,560
Foreign currencies 21,612 2,696 16,719 (20,596) 25,651
Contracts for difference 2(d) – 15,414,375 – – 558,360
Open futures exchange traded contracts 2(d) 512,214 (12,111,496) (349,112) (2,730,621) –
Forward foreign exchange transactions 2(d) 1,340,460 445,833 713,073 7,255,304 376,927
Swap transactions 2(d) 1,405,485 – (1,782,390) (10,696,631) –
Options contracts 2(d) (474,334) – (95,166) (877,202) –
Net change in unrealised appreciation/(depreciation) for the period 5,972,467 21,725,543 251,730 12,777,236 970,498
Increase/(Decrease) in net assets as a result of operations 7,235,949 21,926,725 2,374,187 28,081,037 12,578,658
Movements in share capitalNet receipts as a result of issue of shares 196,787,405 754,291,338 32,149,360 430,131,419 74,047,792
Net payments as a result of repurchase of shares (4,617,961) (475,533,418) (1,501,735) (120,825,997) (78,120,453)
Increase/(Decrease) in net assets as a result of movements in share capital 192,169,444 278,757,920 30,647,625 309,305,422 (4,072,661)
Foreign exchange adjustment – – – – –
Net assets at the end of the period 359,905,119 1,504,298,441 164,904,041 1,104,103,861 155,698,056
(1) The opening balance was combined using the average foreign exchange rates for the period (see Note 2(e)). The same net assets when converted using the average exchange rates for the
year ended 31 May 2013 reflected a figure of USD 3,936,993,045.
Statement of Operations and Changes in Net Assets for the period ended 30 November 2013 continued

Unaudited Interim Report and Accounts 17
The notes on pages 150 to 158 form an integral part of these financial statements.
BlackRock European
Opportunities Absolute
Return Fund***
BlackRock European
Opportunities Extension
Fund
BlackRock Fixed
Income Strategies
Fund
BlackRock Fund of
iShares – Conservative
BlackRock Fund of
iShares – Dynamic
Note EUR EUR EUR EUR EUR
Net assets at the beginning of the period(1) 1,000,951 11,081,561 113,006,228 2,923,530 2,848,575 IncomeBank interest – – – – –
Bond interest – – 1,559,772 – –
Swap interest – – – – –
Dividends – 79,595 403 35,079 28,997
Contracts for difference dividends 2(d) 10,188 63,435 – – –
Other income 30 – – – –
Total income 2(c) 10,218 143,030 1,560,175 35,079 28,997
ExpensesBank interest 943 41,818 7,086 – –
Contracts for difference interest 2(d) – – – – –
Swap interest – – 50,330 – –
Contracts for difference dividends 2(d) – – – – –
Administration fees 5 260 26,328 65,802 1,753 1,543
Custodian and depositary fees 6 470 745 10,742 4,436 4,288
Custodian transaction fees 6 10,430 36,511 65,900 8,580 4,448
Luxembourg tax 8 – 6,905 18,634 935 848
Performance fees 7 – 578,332 – – –
Distribution fees 4 171 11,857 11,352 339 2,139
Management fees 4 1,181 128,550 164,680 10,517 9,257
Less Management fee rebate 4 – – – (5,238) (6,887)
Total expenses before reimbursement 13,455 831,046 394,526 21,322 15,636
Reimbursement of expenses 9,061 27,131 – 10,737 6,712
Total expenses after reimbursement 4,394 803,915 394,526 10,585 8,924
Net investment income/(deficit) 5,824 (660,885) 1,165,649 24,494 20,073 Net gain/(loss) realised on:
Investments 2(a) – 1,121,878 1,268,462 6,150 11,013
Contracts for difference 2(d) 23,654 246,769 – – –
Futures exchange traded contracts 2(d) – – (104,339) – –
Foreign currencies and forward foreign
exchange transactions 2(d) 22,317 57,469 (448,120) (50) (211)
Swap transactions 2(d) – – (181,158) – –
Options contracts 2(d) – – 9 – –
Net realised gain/(loss) for the period 45,971 1,426,116 534,854 6,100 10,802
Net change in unrealised appreciation/
(depreciation) on:
Investments 2(a) – 1,876,760 272,808 (33,171) 121,772
Foreign currencies (1,338) (1,363) 32,875 10 31
Contracts for difference 2(d) (31,660) 1,169,476 – – –
Open futures exchange traded contracts 2(d) – – (243,009) – –
Forward foreign exchange transactions 2(d) (20,611) 133,396 500,759 – –
Swap transactions 2(d) – – 195,319 – –
Options contracts 2(d) – – 2,475 – –
Net change in unrealised appreciation/(depreciation) for the period (53,609) 3,178,269 761,227 (33,161) 121,803
Increase/(Decrease) in net assets as a result of operations (1,814) 3,943,500 2,461,730 (2,567) 152,678
Movements in share capitalNet receipts as a result of issue of shares 5,156 51,520,570 68,361,961 1,251,889 1,306,581
Net payments as a result of repurchase of shares (1,004,293) (10,036,649) (4,127,016) (305,047) (684,263)
Increase/(Decrease) in net assets as a result of movements in share capital (999,137) 41,483,921 64,234,945 946,842 622,318
Foreign exchange adjustment – – – – –
Net assets at the end of the period – 56,508,982 179,702,903 3,867,805 3,623,571
*** The Fund was liquidated on 17 July 2013.(1) The opening balance was combined using the average foreign exchange rates for the period (see Note 2(e)). The same net assets when converted using the average exchange rates for the
year ended 31 May 2013 reflected a figure of USD 3,936,993,045.
Statement of Operations and Changes in Net Assets for the period ended 30 November 2013 continued

18 BlackRock Strategic Funds (BSF)
BlackRock Fund of
iShares – Growth
BlackRock Fund of
iShares – Moderate
BlackRock Global
Absolute Return
Bond Fund
BlackRock Latin
American Opportunities
Fund
BlackRock Mining
Opportunities Fund
Note EUR EUR EUR USD USD
Net assets at the beginning of the period(1) 6,633,192 9,895,030 111,704,772 169,714,453 10,317,581 IncomeBank interest 31 – 5,738 11,741 1,177
Bond interest – – 1,215,391 42,491 20,478
Swap interest – – – – –
Dividends 72,675 118,796 – 767,200 79,836
Contracts for difference dividends 2(d) – – – – –
Other income – – – –
Total income 2(c) 72,706 118,796 1,221,129 821,432 101,491
ExpensesBank interest – – – – –
Contracts for difference interest 2(d) – – – – –
Swap interest – – 48,193 – –
Contracts for difference dividends 2(d) – – – – –
Administration fees 5 3,635 5,536 60,566 232,604 14,814
Custodian and depositary fees 6 4,954 5,066 972 103,782 5,110
Custodian transaction fees 6 7,448 8,762 47,613 10,840 19,324
Luxembourg tax 8 1,848 2,857 14,655 35,566 2,194
Performance fees 7 – – – 58,069 –
Distribution fees 4 1,154 328 369 17,491 –
Management fees 4 21,811 33,216 119,466 1,524,818 49,379
Less Management fee rebate 4 (15,352) (21,026) (9,666) – –
Total expenses before reimbursement 25,498 34,739 282,168 1,983,170 90,821
Reimbursement of expenses 7,676 6,631 – – –
Total expenses after reimbursement 17,822 28,108 282,168 1,983,170 90,821
Net investment income/(deficit) 54,884 90,688 938,961 (1,161,738) 10,670 Net gain/(loss) realised on:
Investments 2(a) 30,233 21,374 17,975 6,807,033 (1,289,930)
Contracts for difference 2(d) – – – – (29,651)
Futures exchange traded contracts 2(d) – – (1,148,489) – –
Foreign currencies and forward foreign
exchange transactions 2(d) (355) (361) (492,023) (11,008,551) (104,424)
Swap transactions 2(d) – – 1,286,984 – –
Options contracts 2(d) – – (123,094) – –
Net realised gain/(loss) for the period 29,878 21,013 (458,647) (4,201,518) (1,424,005)
Net change in unrealised appreciation/
(depreciation) on:
Investments 2(a) 153,268 53,219 (610,395) (11,317,086) 444,943
Foreign currencies 51 54 145,003 14,489 8,213
Contracts for difference 2(d) – – – – 170,270
Open futures exchange traded contracts 2(d) – – (80,129) – –
Forward foreign exchange transactions 2(d) – – 480,100 – 35
Swap transactions 2(d) – – (583,503) – –
Options contracts 2(d) – – 360,502 – –
Net change in unrealised appreciation/(depreciation) for the period 153,319 53,273 (288,422) (11,302,597) 623,461
Increase/(Decrease) in net assets as a result of operations 238,081 164,974 191,892 (16,665,853) (789,874)
Movements in share capitalNet receipts as a result of issue of shares 1,630,256 3,051,328 77,059,456 31,200,791 31,007
Net payments as a result of repurchase of shares (509,918) (303,639) (1,470,553) (38,279,450) (500,000)
Increase/(Decrease) in net assets as a result of movements in share capital 1,120,338 2,747,689 75,588,903 (7,078,659) (468,993)
Foreign exchange adjustment – – – – –
Net assets at the end of the period 7,991,611 12,807,693 187,485,567 145,969,941 9,058,714
(1) The opening balance was combined using the average foreign exchange rates for the period (see Note 2(e)). The same net assets when converted using the average exchange rates for the
year ended 31 May 2013 reflected a figure of USD 3,936,993,045.
Statement of Operations and Changes in Net Assets for the period ended 30 November 2013 continued

Unaudited Interim Report and Accounts 19
The notes on pages 150 to 158 form an integral part of these financial statements.
Statement of Changes in Shares Outstandingas at 30 November 2013
Shares outstanding at the beginning of
the periodSharesissued
Sharesrepurchased
Shares outstanding at the end of
the period
BlackRock Americas Diversified Equity Absolute Return FundA Class non-distributing share AUD 49 25,382 835 24,596
A Class non-distributing share USD 7,747 153 2,538 5,362
A Class non-distributing share EUR hedged 621 14,025 444 14,202
A Class non-distributing share SEK hedged 785,353 118,765 – 904,118
A Class UK reporting non-distributing fund share GBP 6,259 4,186 – 10,445
D Class UK reporting non-distributing fund share EUR hedged 263,631 57,175 39,159 281,647
X Class non-distributing share USD 1,701,980 75,042 699,805 1,077,217
BlackRock Asia Extension FundA Class non-distributing share AUD 166,870 – 66,145 100,725
A Class non-distributing share USD 204,292 602 – 204,894
A Class UK reporting non-distributing fund share GBP hedged 32 – – 32
D Class non-distributing share USD 40,876 – 25,725 15,151
E Class non-distributing share USD 548 57 – 605
X Class non-distributing share USD – 50 – 50
BlackRock Emerging Markets Absolute Return FundA Class non-distributing share USD – 10,584 161 10,423
A Class non-distributing share EUR hedged – 37 – 37
D Class non-distributing share USD 64,981 8,063 – 73,044
D Class non-distributing share EUR hedged 7,579 19,850 4,396 23,033
D Class UK reporting distributing fund share GBP hedged – 32 – 32
I Class non-distributing share EUR hedged 38 – – 38
X Class non-distributing share USD 49,840 – – 49,840
BlackRock Emerging Markets Allocation Fund*A Class non-distributing share USD – 499,750 – 499,750
C Class non-distributing share USD – 50 – 50
D Class non-distributing share USD – 50 – 50
E Class non-distributing share USD – 50 – 50
I Class non-distributing share USD – 50 – 50
X Class non-distributing share USD – 50 – 50
BlackRock Emerging Markets Flexi Dynamic Bond Fund**A Class non-distributing share USD – 350,101 – 350,101
D Class non-distributing share USD – 50 – 50
D Class non-distributing share EUR hedged – 35,899 35,860 39
D Class UK reporting distributing fund share GBP – 37 – 37
E Class non-distributing share USD – 252 – 252
E Class non-distributing share EUR hedged – 39 – 39
X Class non-distributing share USD – 467,903 19,250 448,653
BlackRock Euro Dynamic Diversified Growth FundA Class non-distributing share EUR 89,399 45,954 4,347 131,006
A Class non-distributing share SEK hedged 1,265,931 1,227,783 209,875 2,283,839
D Class non-distributing share EUR 217,214 43,142 1,382 258,974
E Class non-distributing share EUR 301 2,394 29 2,666
I Class non-distributing share EUR 779,122 626,508 12,744 1,392,886
I Class non-distributing share SEK hedged 329,073 234,389 – 563,462
X Class non-distributing share EUR 189,863 907,430 – 1,097,293
BlackRock European Absolute Return FundA Class distributing share EUR 185,603 66,301 37,001 214,903
A Class non-distributing share EUR 4,702,550 3,206,598 1,708,087 6,201,061
A Class non-distributing share SEK hedged 12,994 5,011 1,408 16,597
D Class distributing share EUR 94,725 16,735 14,792 96,668
D Class non-distributing share EUR 3,549,507 1,747,384 1,834,777 3,462,114
D Class non-distributing share CHF hedged 68,737 68,743 5,377 132,103
D Class UK reporting non-distributing fund share GBP hedged 115,604 19,510 27,489 107,625
E Class non-distributing share EUR 499,576 531,751 213,246 818,081
I Class non-distributing share EUR 642,945 462,361 5,170 1,100,136
* The Fund commenced trading on 15 November 2013.
** The Fund commenced trading on 12 June 2013.

20 BlackRock Strategic Funds (BSF)
Statement of Changes in Shares Outstandingas at 30 November 2013 continued
Shares outstanding at the beginning of
the periodSharesissued
Sharesrepurchased
Shares outstanding at the end of
the period
BlackRock European Constrained Credit Strategies FundI Class non-distributing share EUR 1,204,983 290,119 13,580 1,481,522
BlackRock European Credit Strategies FundH Class non-distributing share EUR 504,066 441,538 214,722 730,882
H Class non-distributing share CHF hedged 7,150 34,457 847 40,760
H Class non-distributing share USD hedged 94,894 158,857 6,860 246,891
H Class UK reporting non-distributing fund share GBP hedged 16,488 37,942 291 54,139
I Class UK reporting non-distributing fund share EUR 1 2,873,160 2,206,083 644,586 4,434,657
I Class UK reporting non-distributing fund share GBP hedged 1,038,394 534,186 36,208 1,536,372
I Class UK reporting non-distributing fund share USD hedged 1 850,338 329,128 211,667 967,799
T Class non-distributing share EUR 457,421 – – 457,421
U Class non-distributing share EUR 533 60,934 1,308 60,159
U Class UK reporting non-distributing fund share GBP 36 523 – 559
U Class UK reporting non-distributing fund share USD hedged 1 46 43,758 – 43,804
X Class non-distributing share EUR 1,022,586 – – 1,022,586
BlackRock European Diversified Equity Absolute Return FundA Class non-distributing share AUD 35,927 189 19,027 17,089
A Class non-distributing share EUR 115,031 215,692 101,173 229,550
A Class non-distributing share CHF hedged 1,490 – – 1,490
A Class non-distributing share SEK hedged 2,772,237 1,984,376 2,011,447 2,745,166
A Class UK reporting non-distributing fund share GBP hedged 7,746 4,064 362 11,448
D Class non-distributing share USD hedged 23,858 1,609 3,633 21,834
D Class UK reporting non-distributing fund share EUR 569,512 175,337 307,583 437,266
D Class UK reporting non-distributing fund share GBP hedged 46,784 10,606 5,550 51,840
E Class non-distributing share EUR 93,871 239 12,561 81,549
I Class non-distributing share EUR 112,205 2,589 – 114,794
X Class non-distributing share EUR 92 – – 92
BlackRock European Opportunities Absolute Return Fund***A Class non-distributing share EUR 2,621 46 2,667 –
D Class non-distributing share EUR 2,018 – 2,018 –
D Class UK reporting non-distributing fund share GBP hedged 1,158 – 1,158 –
E Class non-distributing share EUR 2,934 – 2,934 –
BlackRock European Opportunities Extension FundA Class non-distributing share EUR 62,317 185,428 58,656 189,089
A Class UK reporting distributing fund share GBP 3,668 2,680 – 6,348
D Class non-distributing share EUR 35 57,052 2,037 55,050
D Class UK reporting distributing fund share GBP 33 120 – 153
E Class non-distributing share EUR 13,799 75,749 5,721 83,827
BlackRock Fixed Income Strategies FundA Class non-distributing share EUR 54,822 260,346 15,172 299,996
D Class non-distributing share EUR 235,149 112,090 18,485 328,754
E Class non-distributing share EUR 16,579 152,236 3,395 165,420
I Class non-distributing share EUR 37 – – 37
X Class non-distributing share EUR 698,840 88,351 – 787,191
BlackRock Fund of iShares – ConservativeK Class non-distributing share EUR 253,634 111,257 27,925 336,966
L Class non-distributing share EUR 7,536 3,257 35 10,758
M Class non-distributing share EUR 1,784 280 – 2,064
BlackRock Fund of iShares – DynamicK Class non-distributing share EUR 179,456 109,585 7,517 281,524
L Class non-distributing share EUR 58,504 3,023 50,169 11,358
M Class non-distributing share EUR 15,074 500 1,509 14,065
1 Class name changed, see Note 1, for further details.
*** The Fund was liquidated on 17 July 2013.

Unaudited Interim Report and Accounts 21
The notes on pages 150 to 158 form an integral part of these financial statements.
Statement of Changes in Shares Outstandingas at 30 November 2013 continued
Shares outstanding at the beginning of
the periodSharesissued
Sharesrepurchased
Shares outstanding at the end of
the period
BlackRock Fund of iShares – GrowthK Class non-distributing share EUR 547,189 140,032 35,322 651,899
L Class non-distributing share EUR 23,492 4,811 5,773 22,530
M Class non-distributing share EUR 14,435 448 4,080 10,803
BlackRock Fund of iShares – ModerateK Class non-distributing share EUR 861,605 270,867 26,069 1,106,403
L Class non-distributing share EUR 6,745 857 46 7,556
M Class non-distributing share EUR 3,946 109 1,109 2,946
BlackRock Global Absolute Return Bond FundA Class non-distributing share EUR 230 66,789 139 66,880
A Class non-distributing share SEK hedged 59,301 23,059 11,933 70,427
A Class non-distributing share USD hedged – 50 – 50
D Class non-distributing share EUR 260,349 13,670 497 273,522
E Class non-distributing share EUR 939 1,055 240 1,754
X Class non-distributing share EUR 738,527 627,250 – 1,365,777
BlackRock Latin American Opportunities FundA Class non-distributing share EUR 129,140 4,040 37,011 96,169
A Class non-distributing share USD 790,784 74,862 239,593 626,053
A Class UK reporting non-distributing fund share GBP 326,906 105,154 739 431,321
C Class non-distributing share USD 37,553 – 10,199 27,354
D Class non-distributing share EUR 40 2,521 – 2,561
D Class non-distributing share USD 18,588 73,667 26,631 65,624
D Class UK reporting non-distributing fund share GBP 42 – – 42
BlackRock Mining Opportunities FundD Class UK reporting non-distributing fund share GBP 35 8 – 43
D Class UK reporting non-distributing fund share USD 124,022 387 6,592 117,817
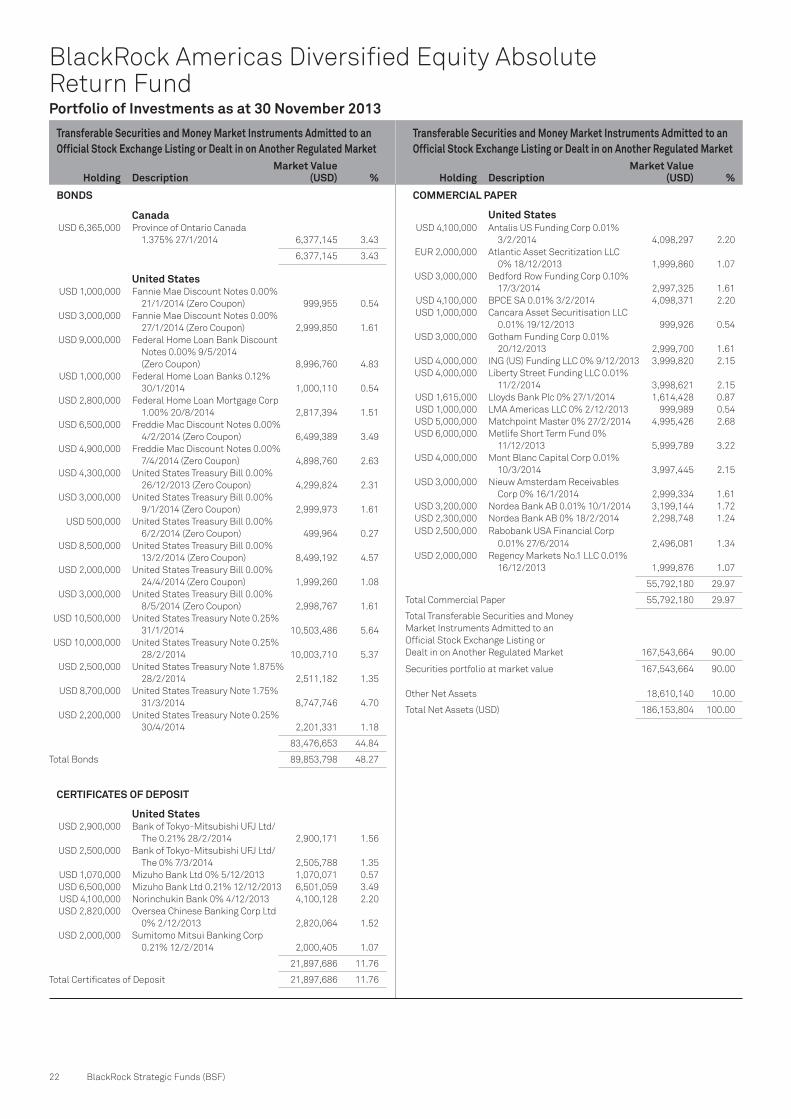
Transferable Securities and Money Market Instruments Admitted to an Official Stock Exchange Listing or Dealt in on Another Regulated Market
Transferable Securities and Money Market Instruments Admitted to an Official Stock Exchange Listing or Dealt in on Another Regulated Market
Holding Description Market Value
(USD) % Holding Description Market Value
(USD) %
22 BlackRock Strategic Funds (BSF)
BlackRock Americas Diversified Equity Absolute Return Fund
BONDS
Canada USD 6,365,000 Province of Ontario Canada
1.375% 27/1/2014 6,377,145 3.43
6,377,145 3.43
United States USD 1,000,000 Fannie Mae Discount Notes 0.00%
21/1/2014 (Zero Coupon) 999,955 0.54
USD 3,000,000 Fannie Mae Discount Notes 0.00%
27/1/2014 (Zero Coupon) 2,999,850 1.61
USD 9,000,000 Federal Home Loan Bank Discount
Notes 0.00% 9/5/2014
(Zero Coupon) 8,996,760 4.83
USD 1,000,000 Federal Home Loan Banks 0.12%
30/1/2014 1,000,110 0.54
USD 2,800,000 Federal Home Loan Mortgage Corp
1.00% 20/8/2014 2,817,394 1.51
USD 6,500,000 Freddie Mac Discount Notes 0.00%
4/2/2014 (Zero Coupon) 6,499,389 3.49
USD 4,900,000 Freddie Mac Discount Notes 0.00%
7/4/2014 (Zero Coupon) 4,898,760 2.63
USD 4,300,000 United States Treasury Bill 0.00%
26/12/2013 (Zero Coupon) 4,299,824 2.31
USD 3,000,000 United States Treasury Bill 0.00%
9/1/2014 (Zero Coupon) 2,999,973 1.61
USD 500,000 United States Treasury Bill 0.00%
6/2/2014 (Zero Coupon) 499,964 0.27
USD 8,500,000 United States Treasury Bill 0.00%
13/2/2014 (Zero Coupon) 8,499,192 4.57
USD 2,000,000 United States Treasury Bill 0.00%
24/4/2014 (Zero Coupon) 1,999,260 1.08
USD 3,000,000 United States Treasury Bill 0.00%
8/5/2014 (Zero Coupon) 2,998,767 1.61
USD 10,500,000 United States Treasury Note 0.25%
31/1/2014 10,503,486 5.64
USD 10,000,000 United States Treasury Note 0.25%
28/2/2014 10,003,710 5.37
USD 2,500,000 United States Treasury Note 1.875%
28/2/2014 2,511,182 1.35
USD 8,700,000 United States Treasury Note 1.75%
31/3/2014 8,747,746 4.70
USD 2,200,000 United States Treasury Note 0.25%
30/4/2014 2,201,331 1.18
83,476,653 44.84
Total Bonds 89,853,798 48.27
CERTIFICATES OF DEPOSIT
United States USD 2,900,000 Bank of Tokyo-Mitsubishi UFJ Ltd/
The 0.21% 28/2/2014 2,900,171 1.56
USD 2,500,000 Bank of Tokyo-Mitsubishi UFJ Ltd/
The 0% 7/3/2014 2,505,788 1.35
USD 1,070,000 Mizuho Bank Ltd 0% 5/12/2013 1,070,071 0.57
USD 6,500,000 Mizuho Bank Ltd 0.21% 12/12/2013 6,501,059 3.49
USD 4,100,000 Norinchukin Bank 0% 4/12/2013 4,100,128 2.20
USD 2,820,000 Oversea Chinese Banking Corp Ltd
0% 2/12/2013 2,820,064 1.52
USD 2,000,000 Sumitomo Mitsui Banking Corp
0.21% 12/2/2014 2,000,405 1.07
21,897,686 11.76
Total Certificates of Deposit 21,897,686 11.76
COMMERCIAL PAPER
United States USD 4,100,000 Antalis US Funding Corp 0.01%
3/2/2014 4,098,297 2.20
EUR 2,000,000 Atlantic Asset Secritization LLC
0% 18/12/2013 1,999,860 1.07
USD 3,000,000 Bedford Row Funding Corp 0.10%
17/3/2014 2,997,325 1.61
USD 4,100,000 BPCE SA 0.01% 3/2/2014 4,098,371 2.20
USD 1,000,000 Cancara Asset Securitisation LLC
0.01% 19/12/2013 999,926 0.54
USD 3,000,000 Gotham Funding Corp 0.01%
20/12/2013 2,999,700 1.61
USD 4,000,000 ING (US) Funding LLC 0% 9/12/2013 3,999,820 2.15
USD 4,000,000 Liberty Street Funding LLC 0.01%
11/2/2014 3,998,621 2.15
USD 1,615,000 Lloyds Bank Plc 0% 27/1/2014 1,614,428 0.87
USD 1,000,000 LMA Americas LLC 0% 2/12/2013 999,989 0.54
USD 5,000,000 Matchpoint Master 0% 27/2/2014 4,995,426 2.68
USD 6,000,000 Metlife Short Term Fund 0%
11/12/2013 5,999,789 3.22
USD 4,000,000 Mont Blanc Capital Corp 0.01%
10/3/2014 3,997,445 2.15
USD 3,000,000 Nieuw Amsterdam Receivables
Corp 0% 16/1/2014 2,999,334 1.61
USD 3,200,000 Nordea Bank AB 0.01% 10/1/2014 3,199,144 1.72
USD 2,300,000 Nordea Bank AB 0% 18/2/2014 2,298,748 1.24
USD 2,500,000 Rabobank USA Financial Corp
0.01% 27/6/2014 2,496,081 1.34
USD 2,000,000 Regency Markets No.1 LLC 0.01%
16/12/2013 1,999,876 1.07
55,792,180 29.97
Total Commercial Paper 55,792,180 29.97
Total Transferable Securities and Money
Market Instruments Admitted to an
Official Stock Exchange Listing or
Dealt in on Another Regulated Market 167,543,664 90.00
Securities portfolio at market value 167,543,664 90.00
Other Net Assets 18,610,140 10.00
Total Net Assets (USD) 186,153,804 100.00
Portfolio of Investments as at 30 November 2013

Holding DescriptionMarket Value
USD
Unrealisedappreciation/
(depreciation)USD Holding Description
Market ValueUSD
Unrealisedappreciation/
(depreciation)USD
Unaudited Interim Report and Accounts 23
The notes on pages 150 to 158 form an integral part of these financial statements.
BlackRock Americas Diversified Equity Absolute Return Fund continued
Bermuda (705) Nordic American Tankers Ltd (5,760) (61)
(5,760) (61)
Brazil (46,300) Abril Educacao SA (676,960) 38,743
22,300 AES Tiete SA 188,394 (19,983)
13,100 Agrenco Ltd 900 (1,534)
(119,100) Aliansce Shopping Centers SA (1,007,199) 147,360
(339,300) ALL - America Latina Logistica SA (1,128,815) 383,233
(17,000) Alpargatas SA (Pref) (109,101) 2,044
(148,400) AMBEV SA (1,111,009) 21,927
(114,800) Anhanguera Educacional
Participacoes SA (758,434) 1,091
(28,398) Arteris SA (232,109) 7,094
26,900 Autometal SA 202,313 (24,716)
(63,300) B2W Cia Digital (388,305) (146,557)
53,500 Banco Bradesco SA (Pref) 290,294 (32,105)
(6,930) Banco Bradesco SA (Pref) (91,835) (30,997)
25,800 Banco Daycoval SA (Pref) 100,010 (24,217)
40,400 Banco do Brasil SA 442,935 30,749
81,500 Banco do Estado do Rio Grande
do Sul SA 'B' (Pref) 475,460 (94,149)
11,700 Banco Industrial e Comercial SA (Pref) 37,468 6,240
(28,900) Banco Panamericano SA (Pref) (57,564) 15,790
(53,400) Banco Santander Brasil
SA/Brazil (Unit) (341,329) 35,114
123,600 BM&FBovespa SA 619,194 (124,201)
(66,700) BR Malls Participacoes SA (550,894) 316,941
(137,500) BR Properties SA (1,141,554) 228,475
65,800 Bradespar SA 707,290 (73,080)
(145,300) Brasil Brokers Participacoes SA (356,779) 86,679
63,800 Braskem SA 564,190 (2,637)
(25,600) BRF SA (560,464) 13,849
(137,300) CCR SA (1,079,186) 160,670
(68,200) CETIP SA - Mercados Organizados (744,213) 1,864
12,000 Cia Brasileira de Distribuicao
Grupo Pao de Acucar 563,451 (29,590)
(4,400) Cia de Gas de Sao Paulo 'A' (Pref) (112,932) 3,211
(4,800) Cia de Locacao das Americas (15,722) 8,169
53,300 Cia de Saneamento Basico do Estado
de Sao Paulo 557,825 (14,605)
(2,700) Cia de Saneamento de Minas
Gerais-COPASA (44,287) (1,356)
746 Cia Energetica de Minas Gerais
GER (Pref) 6,222 (529)
(9,900) Cia Ferro Ligas da Bahia - Ferbasa (58,010) 1,585
(27,500) Cia Hering (361,945) 240,998
(99,900) Cia Siderurgica Nacional SA (516,761) (70,959)
(38,900) Cielo SA (1,120,160) 50,246
38,800 Contax Participacoes SA (Pref) 55,464 (13,938)
47,000 Cosan SA Industria e Comercio 867,165 (27,217)
5,400 Cremer SA 37,090 705
116,500 Cyrela Brazil Realty SA
Empreendimentos e Participacoes 785,169 (39,152)
(2,300) Cyrela Commercial Properties SA
Empreendimentos e Participacoes (20,240) 7,980
258,400 Diagnosticos da America SA 1,310,025 (95,502)
118,900 Direcional Engenharia SA 634,440 (84,520)
(177,700) Duratex SA (1,032,102) (27,560)
(181,500) EcoRodovias Infraestrutura
e Logistica SA (1,133,645) 146,601
(73,800) Embraer SA (572,152) 13,991
(405,700) Eneva SA (513,765) 160,360
(110,500) Equatorial Energia SA (1,130,852) (60,700)
131,500 Estacio Participacoes SA 1,135,207 128,119
141,200 Eternit SA 542,494 (73,168)
330,300 Even Construtora e Incorporadora SA 1,137,156 (137,156)
83,400 Ez Tec Empreendimentos
e Participacoes SA 1,106,630 (59,387)
(1,600) Fertilizantes Heringer SA (5,687) 304
(17,800) Fibria Celulose SA (213,340) 10,967
(600) General Shopping Brasil SA (2,434) 159
72,300 Gerdau SA 564,558 (25,746)
68,300 GP Investments Ltd BDR 118,744 (27,604)
26,800 Grendene SA 209,269 (47,119)
(53,500) Grupo BTG Pactual (Unit) (645,583) 13,770
(139,660) Helbor Empreendimentos SA (497,608) 105,853
20,600 HRT Participacoes em Petroleo SA 6,544 (885)
21,700 Hypermarcas SA 174,755 (6,341)
26,000 Iguatemi Empresa de Shopping
Centers SA 266,864 (49,196)
(35,900) International Meal Co Holdings SA (309,762) 73,805
42,000 Iochpe-Maxion SA 464,082 (89,514)
18,000 Itau Unibanco Holding SA (Pref) 252,518 21,350
172,612 Itausa - Investimentos Itau SA 680,963 (12,880)
314,500 JBS SA 1,134,063 18,061
(72,400) JHSF Participacoes SA (142,966) 95,057
2,300 JSL SA 15,758 (77)
106,100 Klabin SA (Pref) 560,219 (55,428)
38,000 Laep Investments Ltd BDR 4,568 (2,423)
(12) Latam Airlines Group SA (13) (13)
(100) Latam Airlines Group SA BDR (1,588) (49)
(2,655) Localiza Rent a Car SA (38,808) 3,912
3,100 Lojas Americanas SA (Pref) 20,973 (1,563)
(500) LPS Brasil Consultoria de Imoveis SA (3,462) (155)
(9,500) Lupatech SA (2,977) 222
40,200 Magazine Luiza SA 145,821 (9,299)
(222,000) Magnesita Refratarios SA (567,032) 151,893
56,900 Mahle-Metal Leve SA Industria
e Comercio 679,038 (43,188)
(194,700) Marcopolo SA (487,272) 60,011
13,600 Metalurgica Gerdau SA (Pref) 132,877 (8,688)
(16,600) Mills Estruturas e Servicos
de Engenharia SA (222,188) 41,817
141,800 MRV Engenharia e Participacoes SA 565,496 (13,601)
(18,114) Multiplan Empreendimentos
Imobiliarios SA (399,915) 45,606
(9,500) Natura Cosmeticos SA (174,952) 574
(266,200) Odontoprev SA (1,082,170) 59,204
157,100 Oi SA 253,572 (32,127)
380,900 Oi SA (Pref) 582,101 (18,017)
(1,161,000) PDG Realty SA Empreendimentos
e Participacoes (832,312) 352,887
19,300 Petroleo Brasileiro SA 159,653 (3,084)
60,000 Porto Seguro SA 764,456 92,562
(400) Positivo Informatica SA (536) 172
39,500 Profarma Distribuidora de Produtos
Farmaceuticos SA 322,172 (14,001)
122,100 QGEP Participacoes SA 529,388 (85,449)
(7,500) Qualicorp SA (69,253) (17,079)
216,800 Randon Participacoes SA (Pref) 1,116,806 (12,939)
(67,500) Refinaria De Petroleos (Pref) (8,403) 1,794
(15,018) Refinaria De Petroleos
de Manguinhos SA (193) 632
(25,000) Rossi Residencial SA (23,181) 94
57,500 Santos Brasil Participacoes SA (Unit) 479,105 (236,831)
20,200 Saraiva SA Livreiros Editores (Pref) 216,871 (55,390)
1,400 SLC Agricola SA 11,743 (975)
19,200 Sonae Sierra Brasil SA 159,897 (32,714)
(39,200) Souza Cruz SA (392,421) 185,266
8,800 Sul America SA (Unit) 59,158 (4,203)
4,900 Suzano Papel e Celulose SA 'A' (Pref) 17,879 (1,748)
Contracts For Difference as at 30 November 2013
Brazil continued
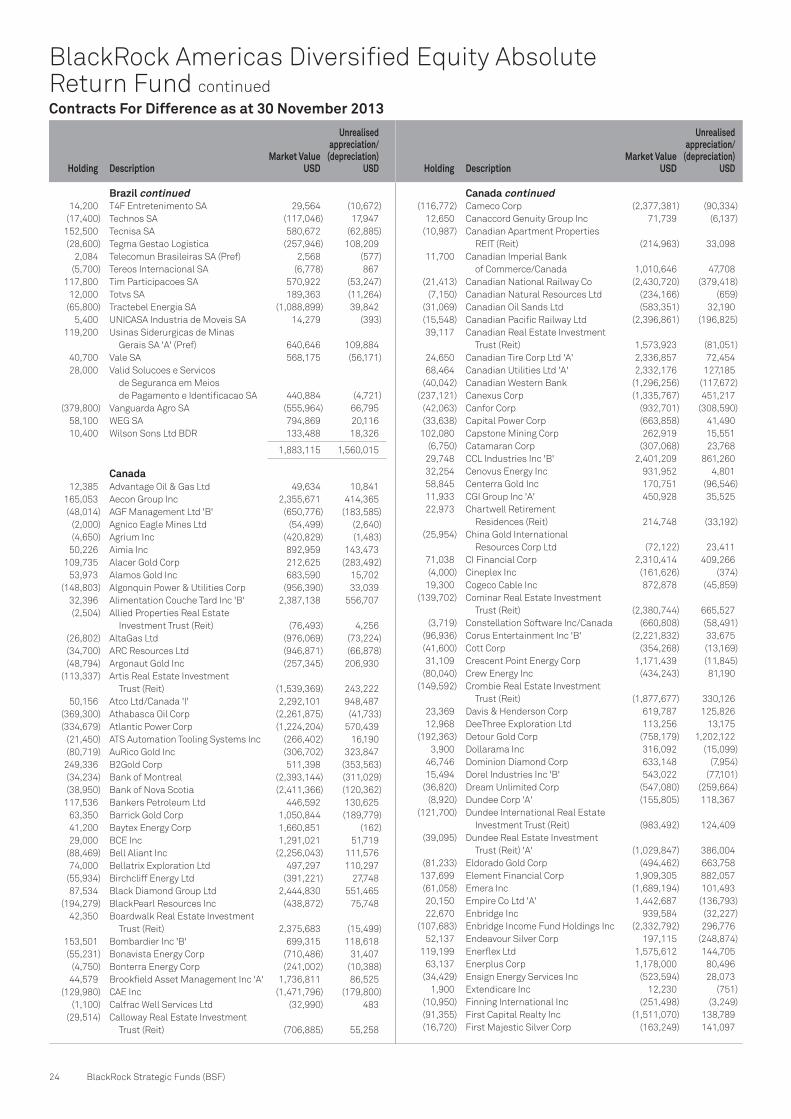
Holding DescriptionMarket Value
USD
Unrealisedappreciation/
(depreciation)USD Holding Description
Market ValueUSD
Unrealisedappreciation/
(depreciation)USD
24 BlackRock Strategic Funds (BSF)
BlackRock Americas Diversified Equity Absolute Return Fund continued
14,200 T4F Entretenimento SA 29,564 (10,672)
(17,400) Technos SA (117,046) 17,947
152,500 Tecnisa SA 580,672 (62,885)
(28,600) Tegma Gestao Logistica (257,946) 108,209
2,084 Telecomun Brasileiras SA (Pref) 2,568 (577)
(5,700) Tereos Internacional SA (6,778) 867
117,800 Tim Participacoes SA 570,922 (53,247)
12,000 Totvs SA 189,363 (11,264)
(65,800) Tractebel Energia SA (1,088,899) 39,842
5,400 UNICASA Industria de Moveis SA 14,279 (393)
119,200 Usinas Siderurgicas de Minas
Gerais SA 'A' (Pref) 640,646 109,884
40,700 Vale SA 568,175 (56,171)
28,000 Valid Solucoes e Servicos
de Seguranca em Meios
de Pagamento e Identificacao SA 440,884 (4,721)
(379,800) Vanguarda Agro SA (555,964) 66,795
58,100 WEG SA 794,869 20,116
10,400 Wilson Sons Ltd BDR 133,488 18,326
1,883,115 1,560,015
Canada 12,385 Advantage Oil & Gas Ltd 49,634 10,841
165,053 Aecon Group Inc 2,355,671 414,365
(48,014) AGF Management Ltd 'B' (650,776) (183,585)
(2,000) Agnico Eagle Mines Ltd (54,499) (2,640)
(4,650) Agrium Inc (420,829) (1,483)
50,226 Aimia Inc 892,959 143,473
109,735 Alacer Gold Corp 212,625 (283,492)
53,973 Alamos Gold Inc 683,590 15,702
(148,803) Algonquin Power & Utilities Corp (956,390) 33,039
32,396 Alimentation Couche Tard Inc 'B' 2,387,138 556,707
(2,504) Allied Properties Real Estate
Investment Trust (Reit) (76,493) 4,256
(26,802) AltaGas Ltd (976,069) (73,224)
(34,700) ARC Resources Ltd (946,871) (66,878)
(48,794) Argonaut Gold Inc (257,345) 206,930
(113,337) Artis Real Estate Investment
Trust (Reit) (1,539,369) 243,222
50,156 Atco Ltd/Canada 'I' 2,292,101 948,487
(369,300) Athabasca Oil Corp (2,261,875) (41,733)
(334,679) Atlantic Power Corp (1,224,204) 570,439
(21,450) ATS Automation Tooling Systems Inc (266,402) 16,190
(80,719) AuRico Gold Inc (306,702) 323,847
249,336 B2Gold Corp 511,398 (353,563)
(34,234) Bank of Montreal (2,393,144) (311,029)
(38,950) Bank of Nova Scotia (2,411,366) (120,362)
117,536 Bankers Petroleum Ltd 446,592 130,625
63,350 Barrick Gold Corp 1,050,844 (189,779)
41,200 Baytex Energy Corp 1,660,851 (162)
29,000 BCE Inc 1,291,021 51,719
(88,469) Bell Aliant Inc (2,256,043) 111,576
74,000 Bellatrix Exploration Ltd 497,297 110,297
(55,934) Birchcliff Energy Ltd (391,221) 27,748
87,534 Black Diamond Group Ltd 2,444,830 551,465
(194,279) BlackPearl Resources Inc (438,872) 75,748
42,350 Boardwalk Real Estate Investment
Trust (Reit) 2,375,683 (15,499)
153,501 Bombardier Inc 'B' 699,315 118,618
(55,231) Bonavista Energy Corp (710,486) 31,407
(4,750) Bonterra Energy Corp (241,002) (10,388)
44,579 Brookfield Asset Management Inc 'A' 1,736,811 86,525
(129,980) CAE Inc (1,471,796) (179,800)
(1,100) Calfrac Well Services Ltd (32,990) 483
(29,514) Calloway Real Estate Investment
Trust (Reit) (706,885) 55,258
(116,772) Cameco Corp (2,377,381) (90,334)
12,650 Canaccord Genuity Group Inc 71,739 (6,137)
(10,987) Canadian Apartment Properties
REIT (Reit) (214,963) 33,098
11,700 Canadian Imperial Bank
of Commerce/Canada 1,010,646 47,708
(21,413) Canadian National Railway Co (2,430,720) (379,418)
(7,150) Canadian Natural Resources Ltd (234,166) (659)
(31,069) Canadian Oil Sands Ltd (583,351) 32,190
(15,548) Canadian Pacific Railway Ltd (2,396,861) (196,825)
39,117 Canadian Real Estate Investment
Trust (Reit) 1,573,923 (81,051)
24,650 Canadian Tire Corp Ltd 'A' 2,336,857 72,454
68,464 Canadian Utilities Ltd 'A' 2,332,176 127,185
(40,042) Canadian Western Bank (1,296,256) (117,672)
(237,121) Canexus Corp (1,335,767) 451,217
(42,063) Canfor Corp (932,701) (308,590)
(33,638) Capital Power Corp (663,858) 41,490
102,080 Capstone Mining Corp 262,919 15,551
(6,750) Catamaran Corp (307,068) 23,768
29,748 CCL Industries Inc 'B' 2,401,209 861,260
32,254 Cenovus Energy Inc 931,952 4,801
58,845 Centerra Gold Inc 170,751 (96,546)
11,933 CGI Group Inc 'A' 450,928 35,525
22,973 Chartwell Retirement
Residences (Reit) 214,748 (33,192)
(25,954) China Gold International
Resources Corp Ltd (72,122) 23,411
71,038 CI Financial Corp 2,310,414 409,266
(4,000) Cineplex Inc (161,626) (374)
19,300 Cogeco Cable Inc 872,878 (45,859)
(139,702) Cominar Real Estate Investment
Trust (Reit) (2,380,744) 665,527
(3,719) Constellation Software Inc/Canada (660,808) (58,491)
(96,936) Corus Entertainment Inc 'B' (2,221,832) 33,675
(41,600) Cott Corp (354,268) (13,169)
31,109 Crescent Point Energy Corp 1,171,439 (11,845)
(80,040) Crew Energy Inc (434,243) 81,190
(149,592) Crombie Real Estate Investment
Trust (Reit) (1,877,677) 330,126
23,369 Davis & Henderson Corp 619,787 125,826
12,968 DeeThree Exploration Ltd 113,256 13,175
(192,363) Detour Gold Corp (758,179) 1,202,122
3,900 Dollarama Inc 316,092 (15,099)
46,746 Dominion Diamond Corp 633,148 (7,954)
15,494 Dorel Industries Inc 'B' 543,022 (77,101)
(36,820) Dream Unlimited Corp (547,080) (259,664)
(8,920) Dundee Corp 'A' (155,805) 118,367
(121,700) Dundee International Real Estate
Investment Trust (Reit) (983,492) 124,409
(39,095) Dundee Real Estate Investment
Trust (Reit) 'A' (1,029,847) 386,004
(81,233) Eldorado Gold Corp (494,462) 663,758
137,699 Element Financial Corp 1,909,305 882,057
(61,058) Emera Inc (1,689,194) 101,493
20,150 Empire Co Ltd 'A' 1,442,687 (136,793)
22,670 Enbridge Inc 939,584 (32,227)
(107,683) Enbridge Income Fund Holdings Inc (2,332,792) 296,776
52,137 Endeavour Silver Corp 197,115 (248,874)
119,199 Enerflex Ltd 1,575,612 144,705
63,137 Enerplus Corp 1,178,000 80,496
(34,429) Ensign Energy Services Inc (523,594) 28,073
1,900 Extendicare Inc 12,230 (751)
(10,950) Finning International Inc (251,498) (3,249)
(91,355) First Capital Realty Inc (1,511,070) 138,789
(16,720) First Majestic Silver Corp (163,249) 141,097
Contracts For Difference as at 30 November 2013
Canada continued Brazil continued

Holding DescriptionMarket Value
USD
Unrealisedappreciation/
(depreciation)USD Holding Description
Market ValueUSD
Unrealisedappreciation/
(depreciation)USD
Unaudited Interim Report and Accounts 25
The notes on pages 150 to 158 form an integral part of these financial statements.
BlackRock Americas Diversified Equity Absolute Return Fund continued
(38,400) First Quantum Minerals Ltd (650,767) 18,463
44,398 FirstService Corp/Canada 1,851,455 240,620
(79,373) Fortis Inc/Canada (2,342,929) 218,083
58,889 Fortuna Silver Mines Inc 199,265 (67,876)
6,350 Franco-Nevada Corp 254,960 (24,812)
(15,789) Freehold Royalties Ltd (332,793) 14,823
(51,471) Genivar Inc (1,536,833) (469,124)
69,860 Genworth MI Canada Inc 2,283,986 183,930
9,800 George Weston Ltd 740,372 (56,559)
94,258 Gibson Energy Inc 2,295,868 35,718
10,319 Gildan Activewear Inc 502,295 38,332
(28,650) Goldcorp Inc (646,656) 40,335
167,750 Gran Tierra Energy Inc 1,197,082 (56,862)
38,300 Granite Real Estate Investment
Trust (Reit) 1,295,974 (86,160)
(77,574) Great-West Lifeco Inc (2,415,939) (463,210)
(7,650) H&R Real Estate Investment
Trust (Reit) (154,157) (421)
(5,050) Home Capital Group Inc (404,573) (34,335)
(98,950) HudBay Minerals Inc (722,952) 59,088
6,000 Husky Energy Inc 169,962 (3,105)
51,010 IAMGOLD Corp 218,408 (380,772)
2,700 IGM Financial Inc 138,241 (388)
(57,003) Imperial Oil Ltd (2,423,436) (136,990)
9,800 Industrial Alliance Insurance &
Financial Services Inc 450,911 4,786
10,900 Intact Financial Corp 697,167 16,931
25,000 Intertape Polymer Group Inc 332,467 (28,673)
16,513 Jean Coutu Group PJC Inc/The 'A' 281,252 16,337
100,395 Just Energy Group Inc 705,991 (188,430)
68,221 Kelt Exploration Ltd 590,002 108,701
21,481 Keyera Corp 1,245,411 14,621
136,466 Kinross Gold Corp 643,635 (723,168)
1,350 Labrador Iron Ore Royalty Corp 40,219 (1,517)
53,225 Laurentian Bank of Canada 2,387,076 39,347
64,700 Legacy Oil + Gas Inc 376,092 (55,168)
(77,742) Lightstream Resources Ltd (409,652) 162,900
10,023 Linamar Corp 396,657 114,429
(4,300) Loblaw Cos Ltd (176,674) (475)
(50,338) Lundin Mining Corp (207,918) 13,847
(5,131) MacDonald Dettwiler & Associates Ltd (408,249) (46,805)
4,796 Magna International Inc 391,432 33,054
(88,409) Manitoba Telecom Services Inc (2,429,158) 390,063
6,979 Manulife Financial Corp 135,754 28,115
(148,369) Maple Leaf Foods Inc (2,382,599) (457,134)
201,529 Martinrea International Inc 1,664,805 (167,780)
26,250 Methanex Corp 1,627,103 47,551
4,000 Metro Inc 233,384 (18,378)
(7,088) Mullen Group Ltd (187,584) (36,939)
6,400 National Bank of Canada 559,123 29,368
98,466 Nevsun Resources Ltd 324,808 (29,348)
(74,601) New Gold Inc (391,338) 408,922
(34,450) Norbord Inc (1,048,478) (20,554)
34,175 North West Co Inc/The 861,481 55,863
(2,351) Northern Dynasty Minerals Ltd (2,778) 10,603
76,296 Northern Property Real Estate
Investment Trust (Reit) 2,005,474 (402,421)
15,741 Northland Power Inc 234,181 (53,587)
(179) NovaCopper Inc (365) (365)
(254,912) Novagold Resources Inc (592,707) 340,466
(57,800) NuVista Energy Ltd (387,883) (18,541)
24 OceanaGold Corp 40 (20)
(40,554) Onex Corp (2,208,621) (378,859)
(4,350) Open Text Corp (371,477) (21,568)
121,262 Osisko Mining Corp 497,426 (242,084)
(8,800) Pacific Rubiales Energy Corp (164,522) 29,241
9,643 Pan American Silver Corp 100,714 (79,781)
(1,510) Paramount Resources Ltd 'A' (52,236) (13,693)
1,100 Parkland Fuel Corp 18,954 (141)
18,647 Pason Systems Inc 397,086 72,575
74,598 Pembina Pipeline Corp 2,387,418 170,158
(260,939) Pengrowth Energy Corp (1,632,719) (310,358)
(70,196) Penn West Petroleum Ltd (603,102) 159,088
(58,050) Peyto Exploration &
Development Corp (1,740,403) (130,957)
(26,058) Poseidon Concepts Corp (6,650) 98,040
(38,950) Potash Corp of Saskatchewan Inc (1,235,135) (17,207)
80,310 Power Corp of Canada 2,466,231 382,715
(71,782) Power Financial Corp (2,450,629) (194,066)
(20,850) Precision Drilling Corp (194,508) 21,124
(200) Progressive Waste Solutions Ltd (5,163) (17)
96,802 Quebecor Inc 'B' 2,432,859 274,636
(90,783) Reitmans Canada Ltd 'A' (514,837) 458,141
(450) RioCan Real Estate Investment
Trust (Reit) (10,501) 6
(115,000) Ritchie Bros Auctioneers Inc (2,361,957) (171,021)
23,808 Rogers Communications Inc 'B' 1,074,060 (69,925)
(131,782) RONA Inc (1,619,250) (239,939)
34,500 Royal Bank of Canada 2,306,413 90,374
(30,750) Russel Metals Inc (816,997) 22,705
147,790 Sandvine Corp 377,158 27,377
(51,636) Saputo Inc (2,387,067) 48,870
124,475 Savanna Energy Services Corp 907,091 24,922
(147,755) Secure Energy Services Inc (2,279,170) (768,448)
105,529 SEMAFO Inc 281,278 (17,629)
(51,142) Shaw Communications Inc 'B' (1,188,641) (28,432)
17,425 Shawcor Ltd 653,026 (49,524)
(98,600) Sherritt International Corp (322,454) 27,988
(55,489) Silver Standard Resources Inc (330,417) 219,366
(25,150) Silver Wheaton Corp (532,001) 77,583
70,178 Silvercorp Metals Inc 179,093 (202,898)
(54,385) SNC-Lavalin Group Inc (2,428,820) (189,241)
26,262 Stantec Inc 1,699,832 597,842
(37,867) Sun Life Financial Inc (1,334,651) (226,447)
70,375 Suncor Energy Inc 2,443,170 208,040
223,356 Superior Plus Corp 2,353,894 (241,709)
92,199 Surge Energy Inc 553,368 237,132
(42,175) Tahoe Resources Inc (750,619) (30,648)
(33,894) Talisman Energy Inc (401,090) (4,459)
52,850 Teck Resources Ltd 'B' 1,284,785 (129,704)
51,306 TELUS Corp 1,822,866 684,012
(56,387) Thomson Reuters Corp (2,128,636) (389,683)
(33,485) Tim Hortons Inc (1,946,118) (132,455)
(17,100) TMX Group Ltd (850,959) (61,085)
(225,766) Torex Gold Resources Inc (202,720) 259,220
72,598 Toromont Industries Ltd 1,756,625 44,681
15,074 Toronto-Dominion Bank/The 1,381,593 54,201
(174,032) TransAlta Corp (2,327,555) 155,591
(7,550) TransCanada Corp (336,467) 3,727
154,687 Transcontinental Inc 'A' 2,422,650 388,778
63,385 TransForce Inc 1,507,940 281,645
145,071 TransGlobe Energy Corp 1,269,714 (157,856)
(120,700) Trican Well Service Ltd (1,445,434) 87,121
(16,050) Trilogy Energy Corp (407,621) (1,480)
104,589 Trinidad Drilling Ltd 978,668 203,139
(215,008) Turquoise Hill Resources Ltd (906,366) 291,352
(181,768) Veresen Inc (2,369,169) (184,622)
31,300 Vermilion Energy Inc 1,715,879 125,979
100,488 Vicwest Inc 1,208,136 (36,476)
(5,159) Wajax Corp (171,885) (2,746)
Contracts For Difference as at 30 November 2013
Canada continued Canada continued

Holding DescriptionMarket Value
USD
Unrealisedappreciation/
(depreciation)USD Holding Description
Market ValueUSD
Unrealisedappreciation/
(depreciation)USD
26 BlackRock Strategic Funds (BSF)
BlackRock Americas Diversified Equity Absolute Return Fund continued
18,188 West Fraser Timber Co Ltd 1,613,368 40,860
20,000 Westjet Airlines Ltd 517,391 119,453
(10,000) Westport Innovations Inc (213,138) 37,015
(41,311) Westshore Terminals
Investment Corp (1,341,241) (245,219)
126,714 Whitecap Resources Inc 1,539,012 421,636
(35,150) Wi-Lan Inc (113,955) (1,569)
38,606 Yamana Gold Inc 350,300 (367,528)
(318,514) 8,282,303
Chile 1,791 Antarchile SA 25,497 (1,788)
460,180 Banco de Chile 67,159 3,749
5,915 CAP SA 111,976 (5,252)
2,714 Cia Cervecerias Unidas SA 33,263 (2,617)
6,226 Coca-Cola Embonor SA 'B' (Pref) 13,500 (3,834)
253,247 Cruz Blanca Salud SA 167,133 (21,524)
40,533 Embotelladora Andina SA 'A' (Pref) 152,854 (50,405)
24,769 Embotelladora Andina SA 'B' (Pref) 120,961 (38,193)
11,246 Empresa Nacional
de Electricidad SA/Chile 16,243 (520)
(30,054) Empresas COPEC SA (413,678) (962)
305 Empresas Hites SA 236 –
190,520 Empresas Iansa SA 7,185 (6,869)
1,739,402 Enersis SA 537,875 (106,391)
8,903 ENTEL Chile SA 126,725 (3,737)
26,395 Forus SA 139,353 (2,416)
488 Inversiones Aguas Metropolitanas SA 840 (47)
119,941 Parque Arauco SA 211,454 (86,658)
15,519 PAZ Corp SA 7,901 (338)
430,200 Ripley Corp SA 324,465 (26,940)
25,022 Salfacorp SA 24,298 384
173,065 Sigdo Koppers SA 267,584 (15,418)
456,529 Sonda SA 1,099,251 (145,034)
3,042,075 (514,810)
Colombia 8,055 Avianca Holdings SA (Pref) 14,823 (4,522)
40,154 Cementos Argos SA 190,606 9,627
7,630 Cemex Latam Holdings SA 56,559 (5,094)
1,747 Grupo Argos SA 18,250 (619)
177 Grupo Aval Acciones y Valores 117 (2)
14 Grupo de Inversiones Suramericana SA 250 (24)
8,681 Grupo Nutresa SA 117,736 6,888
398,341 6,254
Mexico 247,849 Alfa SAB de CV 'A' 731,028 158,174
88,400 Alpek SA de CV 194,860 4,598
(220,292) Alsea SAB de CV (661,174) (75,893)
(721,000) America Movil SAB de CV 'L' (839,744) (75,384)
187,085 Arca Continental SAB de CV 1,169,963 (11,511)
(2,116,010) Axtel SAB de CV (618,143) 54,300
(149,379) Banregio Grupo Financiero SAB de CV (826,038) (47,470)
(19,500) Cemex SAB de CV (21,477) (304)
236,400 Cia Minera Autlan SAB de CV 'B' 158,673 (9,501)
(2,600) Coca-Cola Femsa SAB de CV 'L' (31,097) (1,698)
(63,300) Consorcio ARA SAB de CV (26,748) 208
(51,690) Controladora Comercial
Mexicana SAB de CV (208,956) 4,475
(475,534) Corp GEO SAB de CV 'B' (60,209) 107,692
(317,300) Desarrolladora Homex SAB de CV (58,810) 8,094
46,400 El Puerto de Liverpool SAB de CV 'C1' 511,185 22,597
(318,395) Empresas ICA SAB de CV (596,440) 3,547
305,198 Fibra Uno Administracion SA
de CV (Reit) 948,597 (13,221)
61,800 Fomento Economico Mexicano
SAB de CV 588,928 (9,017)
269,600 Genomma Lab Internacional
SAB de CV 'B' 776,058 121,502
(72,246) Gruma SAB de CV 'B' (501,450) 7,109
188,617 Grupo Aeromexico SAB de CV 259,675 (2,994)
174,000 Grupo Aeroportuario del Centro
Norte Sab de CV 594,565 (11,608)
113,507 Grupo Aeroportuario del Pacifico SAB
de CV 'B' 586,463 10,852
44,559 Grupo Aeroportuario del Sureste SAB
de CV 'B' 596,465 38,711
(353,487) Grupo Bimbo SAB de CV 'A' (1,102,730) 58,694
(85,204) Grupo Carso SAB de CV 'A1' (445,167) (4,331)
(145,330) Grupo Comercial Chedraui SA de CV (475,538) (19,491)
(7,110) Grupo Elektra SAB de CV (263,234) (31,255)
(44,000) Grupo Famsa SAB de CV 'A' (78,363) 874
(3,300) Grupo Financiero Banorte SAB
de CV 'O' (22,621) (1,017)
450,300 Grupo Financiero Inbursa SAB
de CV 'O' 1,178,063 51,470
394,259 Grupo Financiero Santander Mexico
SAB de CV 'B' 1,108,734 (93,853)
(104,505) Grupo Herdez SAB de CV (365,707) (12,558)
(250,900) Grupo Mexico SAB de CV 'B' (735,816) 24,821
22,609 Grupo Simec SAB de CV 'B' 83,636 267
(95,000) Grupo Televisa SAB 'CPO' (579,025) (5,880)
(203,453) Industrias CH SAB de CV (1,156,093) 154,575
(22,780) Industrias Penoles SAB de CV (575,114) 200,324
403,200 Kimberly-Clark de Mexico SAB
de CV 'A' 1,193,847 (24,452)
297,020 Megacable Holdings SAB de CV 'CPO' 995,674 40,582
(163,800) Mexichem SAB de CV (700,889) (13,149)
(236,385) Minera Frisco SAB de CV 'A1' (526,652) 236,662
15,600 OHL Mexico SAB de CV 40,991 (194)
(52,400) Organizacion Soriana SAB
de CV 'B' (167,143) (2,078)
96,758 Promotora y Operadora
de Infraestructura SAB de CV 1,136,528 (10,348)
29,800 Sare Holding SAB de CV 'B' 818 (296)
(396,082) TV Azteca SAB de CV 'CPO' (187,909) 62,623
(155,600) Urbi Desarrollos Urbanos SAB de CV (18,633) 260
(499,500) Wal-Mart de Mexico SAB de CV 'V' (1,305,255) 214,587
(301,424) 1,110,095
Peru 523 Grana y Montero SA 2,052 (405)
300,587 Minsur SA 138,337 (2,223)
58,304 Volcan Cia Minera SAA 'B' 23,505 (833)
163,894 (3,461)
Spain (18,330) Abertis Infraestructuras SA (389,498) (10,450)
(389,498) (10,450)
United States 5,182 1-800-Flowers.com Inc 'A' 25,703 1,767
30,480 1st Source Corp 972,312 220,568
437 AAON Inc 13,495 2,298
21,175 AAR Corp 666,801 296,805
(953) Abaxis Inc (34,622) 1,909
4,070 Abercrombie & Fitch Co 'A' 138,583 (2,238)
(20,763) ABIOMED Inc (598,390) (89,580)
2,668 ABM Industries Inc 74,517 4,238
6,822 Acacia Research Corp 101,989 (2,255)
(28,759) Acadia Healthcare Co Inc (1,344,196) (562,136)
Contracts For Difference as at 30 November 2013
Canada continued Mexico continued

Holding DescriptionMarket Value
USD
Unrealisedappreciation/
(depreciation)USD Holding Description
Market ValueUSD
Unrealisedappreciation/
(depreciation)USD
Unaudited Interim Report and Accounts 27
The notes on pages 150 to 158 form an integral part of these financial statements.
BlackRock Americas Diversified Equity Absolute Return Fund continued
(11,614) ACADIA Pharmaceuticals Inc (269,793) (49,789)
(5,030) Acadia Realty Trust (Reit) (130,780) (5,720)
(12,791) Accelerate Diagnostics Inc (169,481) (41,884)
6,891 Acceleron Pharma Inc 150,293 15
(716) Accenture Plc 'A' (55,827) 425
35,516 Access National Corp 559,377 66,576
(27,483) Acco Brands Corp (167,921) 30,374
45,044 Acco Brands Corp 275,219 (28,347)
(33,132) Accretive Health Inc (275,658) 110,665
(38,707) Accuray Inc (305,398) (73,011)
4,289 ACE Ltd 445,627 22,303
(600) AcelRx Pharmaceuticals Inc (5,532) (1,458)
3,140 Aceto Corp 67,667 35,714
(42,797) ACI Worldwide Inc (2,777,097) (488,009)
1,058 Acorda Therapeutics Inc 37,125 3,020
(43,126) Acorn Energy Inc (162,154) 140,561
4,686 Actavis Plc 762,834 27,196
(279) Actavis Plc (45,418) (4,711)
21,877 Activision Blizzard Inc 381,316 (6,344)
(12,268) Actuant Corp 'A' (480,292) (98,637)
(10,144) Acuity Brands Inc (1,048,687) 17,661
(9,336) Acxiom Corp (315,090) (3,086)
1,481 Adobe Systems Inc 84,299 1,043
(38,736) ADTRAN Inc (985,831) (114,028)
(3,965) Advanced Emissions Solutions Inc (227,988) (131,847)
13,330 Advanced Energy Industries Inc 324,186 84,683
(39,871) Advanced Micro Devices Inc (143,536) 3,949
(14,526) Advent Software Inc (512,768) (13,089)
17,242 Advent Software Inc 608,643 101,107
(16,659) Advisory Board Co/The (1,085,167) (178,582)
7,224 Aegerion Pharmaceuticals Inc 526,846 39,035
802 AerCap Holdings NV 16,834 69
51,621 Aeroflex Holding Corp 351,023 (41,655)
(15,999) Aeropostale Inc (159,190) 54,067
(13,975) Aerovironment Inc (417,573) (164,876)
6,169 AES Corp/VA 89,080 (5,182)
21,889 AFC Enterprises Inc 953,923 12,698
(18,428) Affymetrix Inc (155,717) (91,324)
(1,129) Aflac Inc (75,485) 700
6,310 AGCO Corp 367,053 2,785
(3,187) Agilent Technologies Inc (171,620) 1,874
(59,630) Agilysys Inc (745,375) (94,043)
829 Agios Pharmaceuticals Inc 14,922 (5,686)
17,344 AGL Resources Inc 812,220 (11,274)
5,497 AH Belo Corp 'A' 42,547 12,889
105,357 Air Lease Corp 3,350,353 155,016
889 Air Methods Corp 49,908 427
(13,364) Air Products & Chemicals Inc (1,464,828) 13,097
15,058 Aircastle Ltd 281,283 57,038
2,129 Airgas Inc 233,849 2,505
(5,260) AK Steel Holding Corp (29,561) (13,411)
(10,674) Akorn Inc (274,962) (54,145)
939 Alamo Group Inc 55,346 8,950
(2,265) Albany International Corp 'A' (83,624) (4,676)
6,109 Albany Molecular Research Inc 73,613 13,062
(1,685) Albemarle Corp (116,383) (2,032)
(68,148) Alcoa Inc (658,991) (43,615)
9,882 Alere Inc 323,438 67,901
6,019 Alexander & Baldwin Inc 228,421 585
838 Alexion Pharmaceuticals Inc 102,504 (1,433)
(5,965) Alexza Pharmaceuticals Inc (29,407) 4,719
(1,930) Alico Inc (74,730) 7,574
(15,941) Allegheny Technologies Inc (530,676) 7,333
(855) Allegiant Travel Co (97,043) (7,058)
27 Allergan Inc/United States 2,636 33
608 Alliance Data Systems Corp 148,072 117
3,287 Alliance Fiber Optic Products Inc 49,568 (10,497)
6,866 Alliance HealthCare Services Inc 198,977 44,300
7,870 Alliant Energy Corp 406,879 (10,923)
(5,676) Allied Nevada Gold Corp (18,504) 12,707
(313) Allison Transmission Holdings Inc (8,579) (413)
(10,044) Allscripts Healthcare Solutions Inc (150,861) –
10,935 Allstate Corp/The 595,848 (734)
(10,730) Alnylam Pharmaceuticals Inc (660,968) (75,994)
8,067 Alon USA Energy Inc 112,051 (25,803)
4,965 Alpha & Omega Semiconductor Ltd 37,337 (1,722)
(22,053) Alpha Natural Resources Inc (146,652) 18,780
15,048 Alphatec Holdings Inc 29,344 3,102
81,732 Altera Corp 2,653,838 29,798
10,337 Altisource Residential Corp 286,335 80,577
(196) Altra Holdings Inc (5,860) (687)
(1,188) AM Castle & Co (16,656) 3,591
4,908 AMAG Pharmaceuticals Inc 122,798 16,121
(2,622) Amazon.com Inc (1,024,179) (60,299)
3,019 Ambarella Inc 74,811 38,822
(80,095) AmBev SA ADR (598,310) 4,007
3,196 Ambit Biosciences Corp 39,950 (4,843)
7,862 AMC Networks Inc 'A' 504,269 (5,692)
14,960 Amdocs Ltd 606,030 (3,890)
(11,004) Amedisys Inc (182,556) (43,753)
(36,737) America Movil SAB de CV (853,768) (54,291)
(9,188) America's Car-Mart Inc/TX (386,264) 20,204
(2,158) American Axle & Manufacturing
Holdings Inc (43,138) (5,387)
(28,818) American Capital Agency Corp (589,904) 27,665
(8,666) American Capital Mortgage
Investment Corp (Reit) (166,214) 4,224
13,208 American Capital Mortgage
Investment Corp (Reit) 253,329 (14,470)
16,339 American Eagle Outfitters Inc 266,652 8,823
15,952 American Electric Power Co Inc 756,444 (6,700)
819 American Equity Investment
Life Holding Co 19,459 1,668
(2,561) American Financial Group Inc/OH (148,512) (4,928)
792 American Homes 4 Rent 'A' (Reit) 12,989 (364)
2,052 American International Group Inc 102,313 1,640
(27) American National Insurance Co (3,105) 31
8,622 American Pacific Corp 357,296 153,146
70,261 American Realty Capital
Properties Inc (Reit) 924,635 (8,291)
14,694 American States Water Co 426,640 281,715
(13,381) American Superconductor Corp (21,543) 22,380
653 American Vanguard Corp 18,748 3,273
782 American Water Works Co Inc 33,227 (540)
146 American Woodmark Corp 5,303 325
22,058 Ameris Bancorp 456,601 42,466
15,125 Amgen Inc 1,725,006 (8,933)
128,673 Amkor Technology Inc 770,751 253,977
(95,272) Amkor Technology Inc (570,679) (33,102)
16,848 AMN Healthcare Services Inc 233,513 27,027
5,637 Ampco-Pittsburgh Corp 103,721 1,821
404 Amphenol Corp 'A' 34,328 (30)
(7,807) Ampio Pharmaceuticals Inc (61,207) (33,397)
(3,065) Amtech Systems Inc (23,478) (5,160)
149 Amtrust Financial Services Inc 6,262 184
(82,823) Amyris Inc (222,794) 13,700
6,526 Anadarko Petroleum Corp 576,637 (14,317)
(23,380) Analog Devices Inc (1,136,969) 25,943
2,560 Angie's List Inc 32,768 1,702
11,129 AngioDynamics Inc 172,388 9,238
5,808 Anika Therapeutics Inc 202,583 140,099
4,636 ANN Inc 165,737 29,750
Contracts For Difference as at 30 November 2013
United States continued United States continued

Holding DescriptionMarket Value
USD
Unrealisedappreciation/
(depreciation)USD Holding Description
Market ValueUSD
Unrealisedappreciation/
(depreciation)USD
28 BlackRock Strategic Funds (BSF)
BlackRock Americas Diversified Equity Absolute Return Fund continued
(12,057) Annaly Capital Management
Inc (Reit) (122,740) 6,631
(3,542) Annie's Inc (162,649) 11,446
(160,837) Antares Pharma Inc (622,439) (56,645)
3,969 Anworth Mortgage Asset Corp (Reit) 17,702 (5,768)
4,404 AO Smith Corp 239,886 1,314
(4,591) Apache Corp (420,077) (2,743)
8,143 Apco Oil and Gas International Inc 126,787 16,937
645 Apogee Enterprises Inc 23,117 3,146
12,014 Apollo Education Group Inc 317,650 97,565
10,660 Apollo Residential Mortgage Inc (Reit) 161,286 (68,466)
(2,493) Apple Inc (1,371,574) (75,796)
49,494 Applied Industrial Technologies Inc 2,391,550 59,832
(79,755) Applied Materials Inc (1,382,952) 14,356
(18,296) Applied Micro Circuits Corp (230,713) (82,180)
23,364 Approach Resources Inc 492,046 (45,117)
(4,137) Approach Resources Inc (87,125) 21,411
(45,951) Aptargroup Inc (2,995,546) (106,371)
(430) Arabian American Development Co (4,481) (1,102)
4,360 Aratana Therapeutics Inc 81,837 16,995
11,696 Arbor Realty Trust Inc (REIT) 77,778 14,888
37,106 ARC Document Solutions Inc 319,483 227,119
(18,543) Arch Capital Group Ltd (1,094,593) (9,165)
(474) Arch Coal Inc (1,934) 4,778
2,188 Arcos Dorados Holdings Inc 'A' 26,147 1,059
1,000 Arctic Cat Inc 56,390 1,116
5,075 Arden Group Inc 'A' 648,230 (13,025)
24,759 Arena Pharmaceuticals Inc 161,676 20,604
236 Ares Commercial Real Estate Corp (Reit) 3,099 77
7,724 Argan Inc 178,502 39,071
10,585 Ariad Pharmaceuticals Inc 51,972 8,511
(112,767) ARMOUR Residential Inc (Reit) (444,302) 26,319
5,381 Armstrong World Industries Inc 285,785 5,181
1,326 Arqule Inc 3,196 274
11,623 Arrow Electronics Inc 598,817 (30,164)
(40,854) Arrow Financial Corp (1,127,979) (86,217)
(1,600) Arrowhead Research Corp (12,432) (783)
1,033 ArthroCare Corp 38,944 1,499
1,478 Arthur J Gallagher & Co 69,289 1,710
11,411 Artisan Partners Asset
Management Inc 'A' 697,212 69,347
56,599 Aruba Networks Inc 1,004,066 27,788
(13,237) Ascena Retail Group Inc (281,683) (290)
129 Ashford Hospitality Prime Inc (Reit) 2,657 2,657
645 Ashford Hospitality Trust Inc (Reit) 5,250 (2,788)
1,037 Ashland Inc 94,595 (560)
(5,231) ASML Holding NV/NY (491,086) (9,724)
34,926 Aspen Insurance Holdings Ltd 1,418,694 89,204
22,455 Aspen Technology Inc 893,709 38,623
(54,846) Associated Estates Realty Corp (Reit) (881,375) (12,414)
3,635 Assurant Inc 236,493 13,332
5,797 Assured Guaranty Ltd 137,969 1,217
(5,777) Astec Industries Inc (210,803) (8,523)
(13,711) Astoria Financial Corp (193,462) (55,655)
(4,813) Astronics Corp (249,554) (114,010)
(697) Astronics Corp 'B' (35,192) (35,192)
(3,552) athenahealth Inc (465,241) 8,773
10,310 Athlon Energy Inc 334,766 243
(1,596) Atlantic Tele-Network Inc (90,174) (5,017)
26,467 Atlas Air Worldwide Holdings Inc 1,021,891 2,284
(30,346) ATMI Inc (925,553) (114,804)
994 AtriCure Inc 16,073 4,446
126 Atrion Corp 35,048 10,723
9,983 Atwood Oceanics Inc 523,409 (14,322)
(5,971) Autoliv Inc (555,781) (22,147)
21,613 Auxilium Pharmaceuticals Inc 440,257 66,515
2,055 Avago Technologies Ltd 92,290 617
(3,040) AvalonBay Communities Inc (362,672) 2,797
9,198 AVEO Pharmaceuticals Inc 19,960 (17,787)
23,781 Avery Dennison Corp 1,161,464 13,317
8,658 AVG Technologies NV 149,437 (7,407)
(438) AVG Technologies NV (7,560) 74
144,994 Aviat Networks Inc 359,585 (84,246)
16,999 Avid Technology Inc 150,101 37,611
(35,213) Avis Budget Group Inc (1,295,838) (89,224)
46,598 Avista Corp 1,268,398 (12,020)
7,940 Aviv REIT Inc (Reit) 205,328 8,140
(444) Aviv REIT Inc (Reit) (11,482) (97)
6,339 Avon Products Inc 113,722 4,530
29,310 AVX Corp 400,081 61,453
(24,326) Aware Inc (143,523) (12,461)
16,865 Axcelis Technologies Inc 37,272 (874)
5,240 Axiall Corp 237,739 10,166
5,579 Axis Capital Holdings Ltd 277,555 3,124
47,764 AXT Inc 109,380 (32,695)
(28,271) AZZ Inc (1,381,604) (128,113)
(21,989) B&G Foods Inc (762,798) (8,118)
8,136 B/E Aerospace Inc 713,690 34,442
(42,449) Babcock & Wilcox Co/The (1,381,290) 1,817
(9,494) Badger Meter Inc (517,138) (101,473)
1,561 Baker Hughes Inc 89,196 (1,741)
(4,649) Balchem Corp (276,290) (18,565)
25,588 Ball Corp 1,290,147 5,484
4,979 Ballantyne Strong Inc 23,152 (5,247)
(4,190) Bally Technologies Inc (311,066) (9,390)
9,676 Banc of California Inc 123,369 (13,653)
4,155 Bancfirst Corp 232,888 49,772
98 Banco de Chile ADR 8,673 (68)
38,602 Banco Latinoamericano
de Comercio Exterior SA 1,033,376 198,423
(80,952) Banco Santander Brasil SA/Brazil ADR (520,521) 17,809
(25,285) Banco Santander Chile ADR (568,407) 17,954
(11,343) Bancolombia SA ADR (572,708) 30,226
(21,676) Bancorp Inc/DE (398,188) (100,013)
(7,456) BancorpSouth Inc (179,168) (61,782)
5,830 Bank Mutual Corp 39,527 3,088
(13,605) Bank of Hawaii Corp (806,096) (4,991)
(216) Bank of Marin Bancorp (9,742) (556)
(335) Bank of the Ozarks Inc (18,827) (69)
(1,672) BankFinancial Corp (16,202) (1,202)
5,231 Bankrate Inc 98,343 22,181
(1,075) BankUnited Inc (34,626) (1,000)
5,756 Banner Corp 251,134 72,992
(4,802) Barnes & Noble Inc (80,482) 4,093
(55,145) Barnes Group Inc (2,021,064) (31,079)
282 Barrett Business Services Inc 24,021 721
25,985 Baxter International Inc 1,773,996 21,648
(28,937) Bazaarvoice Inc (230,917) 53,484
(234) BBX Capital Corp 'A' (3,180) (88)
(18,113) Beacon Roofing Supply Inc (672,717) 26,006
(5,474) Beam Inc (371,192) 1,148
(1,314) Beazer Homes USA Inc (27,384) (2,659)
(26,383) bebe stores inc (155,396) (29,064)
495 Becton Dickinson and Co 53,960 15
10,943 Bel Fuse Inc 'B' 249,610 53,380
(40,616) Belden Inc (2,869,927) (132,488)
(22,125) Bemis Co Inc (863,981) 2,295
35,035 Benchmark Electronics Inc 807,907 119,275
3,821 Benefitfocus Inc 187,917 6,210
3,364 Best Buy Co Inc 134,291 3,041
46,251 BGC Partners Inc 'A' 269,181 23,371
16,135 Big 5 Sporting Goods Corp 306,242 8,183
Contracts For Difference as at 30 November 2013
United States continued United States continued

Holding DescriptionMarket Value
USD
Unrealisedappreciation/
(depreciation)USD Holding Description
Market ValueUSD
Unrealisedappreciation/
(depreciation)USD
Unaudited Interim Report and Accounts 29
The notes on pages 150 to 158 form an integral part of these financial statements.
BlackRock Americas Diversified Equity Absolute Return Fund continued
1,494 Big Lots Inc 57,235 3,702
(26,038) Bill Barrett Corp (702,505) 30,073
(268) Bio-Rad Laboratories Inc 'A' (33,063) (87)
(8,208) Bio-Reference Labs Inc (240,576) (7,440)
(539) BioCryst Pharmaceuticals Inc (3,234) 290
(58,333) BioDelivery Sciences International Inc (279,415) 1,925
(4,153) BioMarin Pharmaceutical Inc (293,451) (5,690)
28,312 BioScrip Inc 187,992 (128,628)
(2,368) Biotime Inc (9,212) 427
(563) Black Box Corp (15,663) (1,170)
(74,653) Black Diamond Inc (1,001,097) (286,071)
4,779 Black Hills Corp 241,674 6,415
(6,139) Blackbaud Inc (221,894) (50,475)
409 Blackstone Mortgage Trust
Inc 'A' (Reit) 10,577 421
3,112 Bloomin' Brands Inc 81,939 97
12,676 Blucora Inc 367,477 25,781
539 Blue Nile Inc 24,643 7,115
494 Bluebird Bio Inc 9,831 (3,906)
3,508 Blyth Inc 44,201 (10,720)
(5,850) BNC Bancorp (87,867) (7,928)
1,329 Bob Evans Farms Inc/DE 73,839 345
(1,881) Body Central Corp (7,505) 13,504
6,904 Boeing Co/The 932,454 (562)
3,536 Boise Cascade Co 88,789 (24,475)
3,164 BOK Financial Corp 202,211 4,856
(10,326) Bon-Ton Stores Inc/The (186,901) (50,467)
58,520 Booz Allen Hamilton Holding Corp 1,028,196 (15,968)
(106) Boston Beer Co Inc/The 'A' (26,250) (7,706)
1,554 Boston Scientific Corp 18,182 (213)
(4,206) Bottomline Technologies (DE) Inc (146,243) (7,882)
(6,229) Boyd Gaming Corp (70,263) (17,587)
4,070 BP Prudhoe Bay Royalty Trust 309,198 (14,643)
2,430 Brady Corp 'A' 75,549 5,029
31,960 Braskem SA ADR 564,733 (13,402)
1,122 Bravo Brio Restaurant Group Inc 17,840 365
(5,204) BRE Properties Inc (267,798) 8,365
(25,340) BRF SA (555,706) 23,830
(2,159) Bright Horizons Family Solutions Inc (76,126) 2,043
(633) Brightcove Inc (8,894) (3,385)
(16,663) Brink's Co/The (559,544) (11,929)
(7,107) Bristol-Myers Squibb Co (368,356) 4,193
9,337 Bristow Group Inc 751,255 (18,456)
7,938 Broadridge Financial Solutions Inc 304,978 14,189
(1,867) BroadSoft Inc (49,737) 12,025
(53,356) Brocade Communications Systems Inc (465,798) (34,462)
(3,893) Brookdale Senior Living Inc (112,741) 3,582
(2,385) Brookline Bancorp Inc (21,775) (1,736)
4,634 Brown & Brown Inc 147,083 (1,390)
561 Brown Shoe Co Inc 14,771 2,095
(832) Bruker Corp (16,024) 166
6,533 Brunswick Corp/DE 299,407 9,609
(1,061) Bryn Mawr Bank Corp (31,830) (2,702)
(11,661) BSB Bancorp Inc/MA (167,918) (4,391)
(1,804) Buckle Inc/The (95,828) (314)
252 Buckle Inc/The 13,386 209
(1,118) Buffalo Wild Wings Inc (168,594) (984)
19,116 Build-A-Bear Workshop Inc 178,926 54,696
9,072 Builders FirstSource Inc 66,498 12,197
3,498 Bunge Ltd 281,519 (1,988)
(23,187) Burger King Worldwide Inc (496,897) (44,701)
4,875 Burlington Stores Inc 138,450 843
(49,929) C&J Energy Services Inc (1,187,811) (151,052)
(5,012) Cabela's Inc (309,892) 8,871
(10,136) Cablevision Systems Corp 'A' (171,096) (19,765)
(34,361) Cabot Corp (1,681,627) (75,648)
(5,407) Cabot Microelectronics Corp (245,045) (5,143)
(1,745) Caesars Entertainment Corp (35,790) (1,117)
17,807 CafePress Inc 118,951 14,037
46,832 Calamos Asset Management Inc 'A' 526,860 65,565
3,520 CalAmp Corp 88,387 4,061
789 Calavo Growers Inc 24,214 1,487
6,736 Calix Inc 68,438 (5,511)
(45,299) Callidus Software Inc (493,759) (301,364)
12,862 Callon Petroleum Co 84,503 37,945
4,096 Cambrex Corp 80,159 31,841
(6,735) Camden National Corp (291,491) (24,421)
544 Camden Property Trust (Reit) 31,732 (832)
(15,657) Cameron International Corp (864,736) 4,347
(14,152) Campbell Soup Co (551,503) 48,824
(1,936) Canadian Solar Inc (55,834) 3,498
5,677 Cape Bancorp Inc 56,713 3,178
3,750 Capella Educations Co 247,950 47,133
23,037 Capital Bank Financial Corp 'A' 542,061 133,974
32,908 Capital Southwest Corp 1,136,971 1,031,567
(40,216) Capstead Mortgage Corp (485,005) 3,647
26,259 Capstead Mortgage Corp 316,684 5,853
(328) Cardinal Financial Corp (5,799) (254)
32,317 Cardinal Health Inc 2,100,605 3,002
393 Cardiovascular Systems Inc 13,421 1,640
19,494 Cardtronics Inc 840,971 200,747
12,215 Career Education Corp 61,319 23,052
6,760 CareFusion Corp 269,454 5,102
(4,163) CarMax Inc (210,731) (5,774)
1,445 Carmike Cinemas Inc 35,099 4,069
(4,977) Carpenter Technology Corp (301,855) 2,414
991 Carter's Inc 70,272 745
(20,516) Cass Information Systems Inc (1,280,198) (352,182)
14,061 Catamaran Corp 639,354 (16,325)
3,546 Cathay General Bancorp 98,543 10,083
29,171 Cbeyond Inc 162,774 (20,626)
35,468 CBL & Associates Properties Inc (Reit) 650,483 (20,217)
143 CBOE Holdings Inc 7,508 132
930 CBRE Group Inc 'A' 22,599 137
69,730 CBS Corp 'B' 4,107,794 (6,758)
(3,872) Ceco Environmental Corp (61,604) (6,741)
64,895 Cedar Realty Trust Inc (Reit) 375,742 6,798
533 Celgene Corp 86,399 5,858
(21,328) Cell Therapeutics Inc (41,163) (6,073)
(11,470) Celldex Therapeutics Inc (316,113) (34,362)
2,266 Cellular Dynamics International 34,896 (3,766)
7,221 Celsion Corp 28,017 (215,465)
(32,437) Cemex SAB de CV ADR (355,834) (4,986)
6,565 Centene Corp 392,718 24,816
1,577 Center Bancorp Inc 25,658 807
4,652 Centerstate Banks Inc 49,497 2,788
(4,375) Central European Media
Enterprises Ltd 'A' (11,025) 10,827
58,649 Central Garden and Pet Co 452,770 (107,403)
25,028 Central Garden and Pet Co 'A' 193,216 3,660
45,555 Central Pacific Financial Corp 920,211 105,517
(37,866) Century Aluminum Co (342,687) 33,127
1,195 Century Bancorp Inc/MA 'A' 41,753 1,148
12,917 Century Casinos Inc 67,168 (4,708)
53,097 Cenveo Inc 182,654 41,608
(39,008) Cepheid Inc (1,795,928) (172,265)
(5,718) Cerner Corp (330,100) (1,735)
(51,266) Cerus Corp (346,046) (145,979)
(3,606) CH Robinson Worldwide Inc (212,466) 3,822
(8,557) Charles River Laboratories
International Inc (443,852) 3,505
(29,703) Charles Schwab Corp/The (734,852) (9,505)
Contracts For Difference as at 30 November 2013
United States continued United States continued
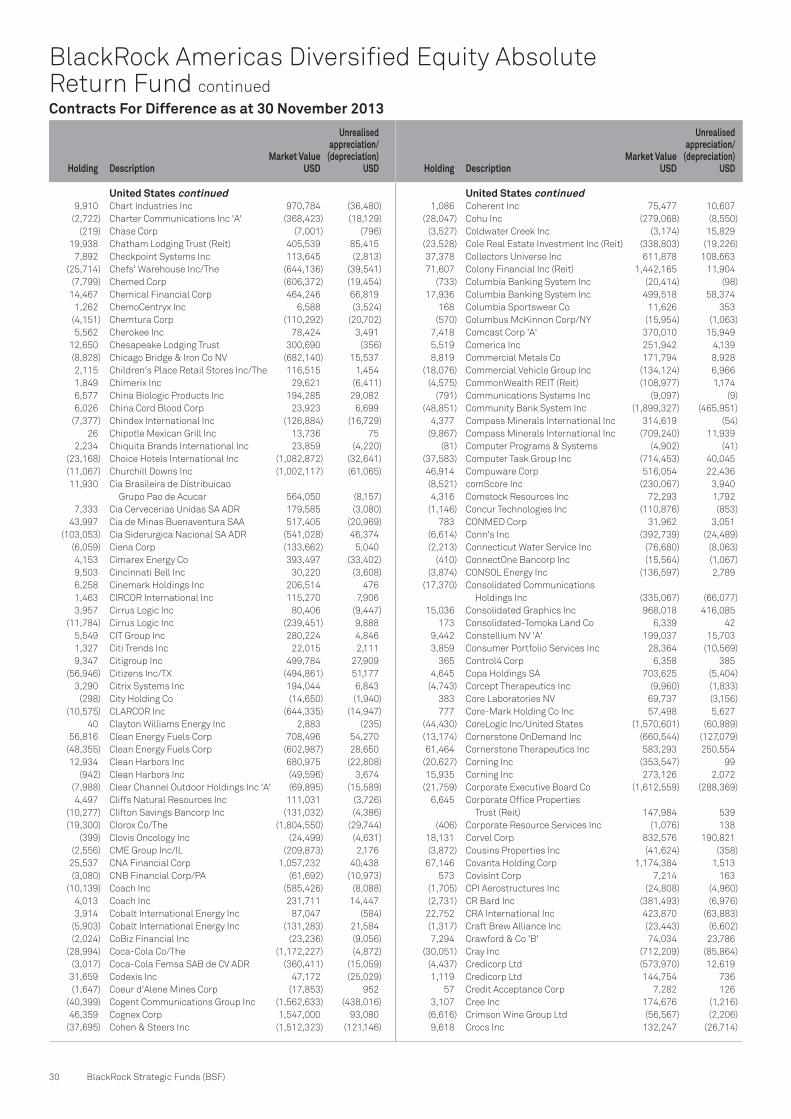
Holding DescriptionMarket Value
USD
Unrealisedappreciation/
(depreciation)USD Holding Description
Market ValueUSD
Unrealisedappreciation/
(depreciation)USD
30 BlackRock Strategic Funds (BSF)
BlackRock Americas Diversified Equity Absolute Return Fund continued
9,910 Chart Industries Inc 970,784 (36,480)
(2,722) Charter Communications Inc 'A' (368,423) (18,129)
(219) Chase Corp (7,001) (796)
19,938 Chatham Lodging Trust (Reit) 405,539 85,415
7,892 Checkpoint Systems Inc 113,645 (2,813)
(25,714) Chefs' Warehouse Inc/The (644,136) (39,541)
(7,799) Chemed Corp (606,372) (19,454)
14,467 Chemical Financial Corp 464,246 66,819
1,262 ChemoCentryx Inc 6,588 (3,524)
(4,151) Chemtura Corp (110,292) (20,702)
5,562 Cherokee Inc 78,424 3,491
12,650 Chesapeake Lodging Trust 300,690 (356)
(8,828) Chicago Bridge & Iron Co NV (682,140) 15,537
2,115 Children's Place Retail Stores Inc/The 116,515 1,454
1,849 Chimerix Inc 29,621 (6,411)
6,577 China Biologic Products Inc 194,285 29,082
6,026 China Cord Blood Corp 23,923 6,699
(7,377) Chindex International Inc (126,884) (16,729)
26 Chipotle Mexican Grill Inc 13,736 75
2,234 Chiquita Brands International Inc 23,859 (4,220)
(23,168) Choice Hotels International Inc (1,082,872) (32,641)
(11,067) Churchill Downs Inc (1,002,117) (61,065)
11,930 Cia Brasileira de Distribuicao
Grupo Pao de Acucar 564,050 (8,157)
7,333 Cia Cervecerias Unidas SA ADR 179,585 (3,080)
43,997 Cia de Minas Buenaventura SAA 517,405 (20,969)
(103,053) Cia Siderurgica Nacional SA ADR (541,028) 46,374
(6,059) Ciena Corp (133,662) 5,040
4,153 Cimarex Energy Co 393,497 (33,402)
9,503 Cincinnati Bell Inc 30,220 (3,608)
6,258 Cinemark Holdings Inc 206,514 476
1,463 CIRCOR International Inc 115,270 7,906
3,957 Cirrus Logic Inc 80,406 (9,447)
(11,784) Cirrus Logic Inc (239,451) 9,888
5,549 CIT Group Inc 280,224 4,846
1,327 Citi Trends Inc 22,015 2,111
9,347 Citigroup Inc 499,784 27,909
(56,946) Citizens Inc/TX (494,861) 51,177
3,290 Citrix Systems Inc 194,044 6,843
(298) City Holding Co (14,650) (1,940)
(10,575) CLARCOR Inc (644,335) (14,947)
40 Clayton Williams Energy Inc 2,883 (235)
56,816 Clean Energy Fuels Corp 708,496 54,270
(48,355) Clean Energy Fuels Corp (602,987) 28,650
12,934 Clean Harbors Inc 680,975 (22,808)
(942) Clean Harbors Inc (49,596) 3,674
(7,988) Clear Channel Outdoor Holdings Inc 'A' (69,895) (15,589)
4,497 Cliffs Natural Resources Inc 111,031 (3,726)
(10,277) Clifton Savings Bancorp Inc (131,032) (4,386)
(19,300) Clorox Co/The (1,804,550) (29,744)
(399) Clovis Oncology Inc (24,499) (4,631)
(2,556) CME Group Inc/IL (209,873) 2,176
25,537 CNA Financial Corp 1,057,232 40,438
(3,080) CNB Financial Corp/PA (61,692) (10,973)
(10,139) Coach Inc (585,426) (8,088)
4,013 Coach Inc 231,711 14,447
3,914 Cobalt International Energy Inc 87,047 (584)
(5,903) Cobalt International Energy Inc (131,283) 21,584
(2,024) CoBiz Financial Inc (23,236) (9,056)
(28,994) Coca-Cola Co/The (1,172,227) (4,872)
(3,017) Coca-Cola Femsa SAB de CV ADR (360,411) (15,059)
31,659 Codexis Inc 47,172 (25,029)
(1,647) Coeur d'Alene Mines Corp (17,853) 952
(40,399) Cogent Communications Group Inc (1,562,633) (438,016)
46,359 Cognex Corp 1,547,000 93,080
(37,695) Cohen & Steers Inc (1,512,323) (121,146)
1,086 Coherent Inc 75,477 10,607
(28,047) Cohu Inc (279,068) (8,550)
(3,527) Coldwater Creek Inc (3,174) 15,829
(23,528) Cole Real Estate Investment Inc (Reit) (338,803) (19,226)
37,378 Collectors Universe Inc 611,878 108,663
71,607 Colony Financial Inc (Reit) 1,442,165 11,904
(733) Columbia Banking System Inc (20,414) (98)
17,936 Columbia Banking System Inc 499,518 58,374
168 Columbia Sportswear Co 11,626 353
(570) Columbus McKinnon Corp/NY (15,954) (1,063)
7,418 Comcast Corp 'A' 370,010 15,949
5,519 Comerica Inc 251,942 4,139
8,819 Commercial Metals Co 171,794 8,928
(18,076) Commercial Vehicle Group Inc (134,124) 6,966
(4,575) CommonWealth REIT (Reit) (108,977) 1,174
(791) Communications Systems Inc (9,097) (9)
(48,851) Community Bank System Inc (1,899,327) (465,951)
4,377 Compass Minerals International Inc 314,619 (54)
(9,867) Compass Minerals International Inc (709,240) 11,939
(81) Computer Programs & Systems (4,902) (41)
(37,583) Computer Task Group Inc (714,453) 40,045
46,914 Compuware Corp 516,054 22,436
(8,521) comScore Inc (230,067) 3,940
4,316 Comstock Resources Inc 72,293 1,792
(1,146) Concur Technologies Inc (110,876) (853)
783 CONMED Corp 31,962 3,051
(6,614) Conn's Inc (392,739) (24,489)
(2,213) Connecticut Water Service Inc (76,680) (8,063)
(410) ConnectOne Bancorp Inc (15,564) (1,067)
(3,874) CONSOL Energy Inc (136,597) 2,789
(17,370) Consolidated Communications
Holdings Inc (335,067) (66,077)
15,036 Consolidated Graphics Inc 968,018 416,085
173 Consolidated-Tomoka Land Co 6,339 42
9,442 Constellium NV 'A' 199,037 15,703
3,859 Consumer Portfolio Services Inc 28,364 (10,569)
365 Control4 Corp 6,358 385
4,645 Copa Holdings SA 703,625 (5,404)
(4,743) Corcept Therapeutics Inc (9,960) (1,833)
383 Core Laboratories NV 69,737 (3,156)
777 Core-Mark Holding Co Inc 57,498 5,627
(44,430) CoreLogic Inc/United States (1,570,601) (60,989)
(13,174) Cornerstone OnDemand Inc (660,544) (127,079)
61,464 Cornerstone Therapeutics Inc 583,293 250,554
(20,627) Corning Inc (353,547) 99
15,935 Corning Inc 273,126 2,072
(21,759) Corporate Executive Board Co (1,612,559) (288,369)
6,645 Corporate Office Properties
Trust (Reit) 147,984 539
(406) Corporate Resource Services Inc (1,076) 138
18,131 Corvel Corp 832,576 190,821
(3,872) Cousins Properties Inc (41,624) (358)
67,146 Covanta Holding Corp 1,174,384 1,513
573 Covisint Corp 7,214 163
(1,705) CPI Aerostructures Inc (24,808) (4,960)
(2,731) CR Bard Inc (381,493) (6,976)
22,752 CRA International Inc 423,870 (63,883)
(1,317) Craft Brew Alliance Inc (23,443) (6,602)
7,294 Crawford & Co 'B' 74,034 23,786
(30,051) Cray Inc (712,209) (85,864)
(4,437) Credicorp Ltd (573,970) 12,619
1,119 Credicorp Ltd 144,754 736
57 Credit Acceptance Corp 7,282 126
3,107 Cree Inc 174,676 (1,216)
(6,616) Crimson Wine Group Ltd (56,567) (2,206)
9,618 Crocs Inc 132,247 (26,714)
Contracts For Difference as at 30 November 2013
United States continued United States continued

Holding DescriptionMarket Value
USD
Unrealisedappreciation/
(depreciation)USD Holding Description
Market ValueUSD
Unrealisedappreciation/
(depreciation)USD
Unaudited Interim Report and Accounts 31
The notes on pages 150 to 158 form an integral part of these financial statements.
BlackRock Americas Diversified Equity Absolute Return Fund continued
45,342 Cross Country Healthcare Inc 335,531 111,543
(650) Crosstex Energy Inc (21,411) (10,081)
1,894 Crown Castle International Corp 140,629 293
32,714 Crown Media Holdings Inc 'A' 107,629 31,696
890 CST Brands Inc 29,646 (240)
69,948 CTC Media Inc 884,143 181,640
(368) CTS Corp (6,694) 84
(23,346) CubeSmart (Reit) (378,672) (34,276)
(10,577) Cubic Corp (598,976) (43,760)
422 Cubist Pharmaceuticals Inc 29,004 255
(23,166) Cubist Pharmaceuticals Inc CVR (38,224) 214,072
14,698 Culp Inc 297,634 88,985
95,232 Cumberland Pharmaceuticals Inc 473,303 29,499
(31,726) Curis Inc (104,696) 16,096
32,010 Cutera Inc 301,854 (54,206)
(5,504) CVB Financial Corp (88,669) (448)
(4,870) Cvent Inc (160,710) (50)
2,234 Cvent Inc 73,722 (12,280)
(2,863) CVR Energy Inc (112,401) (3,769)
8,913 CVS Caremark Corp 601,984 17,113
(466) Cyan Inc (1,985) 1,661
6,180 Cyberonics Inc 430,313 121,970
(1,462) Cynosure Inc 'A' (37,413) (3,499)
7,771 CyrusOne Inc (Reit) 156,974 10,588
(3,124) CYS Investments Inc (Reit) (25,117) (37)
7,667 Cytec Industries Inc 684,280 24,611
(261) Daily Journal Corp (37,845) (5,544)
5,158 Daktronics Inc 79,536 27,675
(5,902) Darden Restaurants Inc (314,695) 1,062
46,695 Darling International Inc 962,384 5,420
(8,005) Datalink Corp (83,012) (1,573)
(233) Datawatch Corp (7,847) (1,609)
(14,399) DaVita HealthCare Partners Inc (861,204) (13,247)
6,836 Dawson Geophysical Co 215,949 1,015
9,337 Dean Foods Co 169,653 (14,172)
777 Deckers Outdoor Corp 63,629 9,936
(5,501) Deckers Outdoor Corp (450,477) (19,095)
1,602 Delek US Holdings Inc 47,932 (6,508)
(799) Delphi Automotive Plc (46,638) (1,146)
(2,746) Delta Air Lines Inc (79,936) (2,719)
28,607 Delta Apparel Inc 492,613 50,019
(544) Delta Natural Gas Co Inc (12,066) 298
243 Deltic Timber Corp 15,066 195
15,881 Deluxe Corp 799,608 222,802
(586) Deluxe Corp (29,505) (866)
13,794 Demand Media Inc 74,074 (19,162)
(2,791) Demandware Inc (159,785) (7,997)
6,419 Denbury Resources Inc 107,518 (5,713)
(40,516) Derma Sciences Inc (469,986) (14,758)
(124,018) Desarrolladora Homex SAB
de CV ADR (140,140) 50,532
105 Destination Maternity Corp 3,240 3
(75,111) Destination Xl Group Inc (522,773) (141,759)
9,154 Devon Energy Corp 556,197 2,269
(7,252) DeVry Education Group Inc (255,125) 432
(3,587) Diamond Foods Inc (89,567) (16,806)
(1,297) Diamond Hill Investment Group
Inc GRP (161,477) (27,302)
(31,103) Diamond Offshore Drilling Inc (1,867,424) 33,000
1,856 Diamond Resorts International Inc 33,222 (1,042)
1,403 Diamondback Energy Inc 68,747 (5,280)
3,167 Diana Shipping Inc 36,167 2,038
(7,889) Diebold Inc (269,173) (35,181)
1,099 Digi International Inc 12,638 1,480
1,605 Digimarc Corp 29,692 (3,153)
5,972 Digital Generation Inc 70,947 35,144
6,916 Digital Realty Trust Inc (Reit) 329,063 3,238
(4,308) DigitalGlobe Inc (171,329) (14,374)
(68,055) Dime Community Bancshares Inc (1,153,532) (67,476)
1,693 DineEquity Inc 142,601 1,376
44,788 Diodes Inc 915,467 (168,216)
7,844 DIRECTV 517,782 9,107
(8,943) DISH Network Corp 'A' (483,190) (27,634)
(2,800) Diversified Restaurant Holding Inc (16,072) 5,897
161,622 Dolan Co/The 113,152 (400,047)
557 Dollar General Corp 32,050 (958)
4,432 Dollar Tree Inc 247,527 (11,743)
27,839 Dominion Diamond Corp 376,940 (42,622)
14,707 Domino's Pizza Inc 1,019,342 6,890
2,245 Domtar Corp 193,676 1,010
(14,236) Dorman Products Inc (711,800) (59,101)
(3,535) Douglas Dynamics Inc (56,348) (5,649)
(15,589) DreamWorks Animation SKG Inc 'A' (497,367) 2,660
2,629 Dresser-Rand Group Inc 149,012 (443)
(2,428) Dresser-Rand Group Inc (137,619) 8,085
8,041 Dril-Quip Inc 874,137 (52,910)
(41,725) DryShips Inc (144,369) (13,010)
(7,176) DST Systems Inc (635,076) (8,468)
418 DTE Energy Co 27,989 (823)
(7,542) DTS Inc/CA (170,374) (14,999)
11,535 Ducommun Inc 292,758 43,406
(15,398) Dun & Bradstreet Corp/The (1,807,879) (34,598)
18,117 Dunkin' Brands Group Inc 893,168 29,107
67,799 DuPont Fabros Technology Inc (Reit) 1,595,310 (12,420)
(2,098) Durata Therapeutics Inc (26,099) (6,023)
(1,724) DXP Enterprises Inc (168,607) (29,628)
(32,148) Dyax Corp (264,578) (20,470)
(675) Dycom Industries Inc (19,271) 775
(31,752) Dynergy Inc (682,350) (14,982)
(26,591) E2open Inc (591,118) (73,682)
(2,313) Eagle Bancorp Inc (76,236) (10,662)
105,714 EarthLink Inc 561,341 (24,691)
(1,070) Eastern Insurance Holdings Inc (26,215) (4,149)
14,443 Eastman Chemical Co 1,113,555 (2,712)
(32,841) Eaton Vance Corp (1,385,562) 25,878
39,917 eBay Inc 2,015,010 38,951
40,766 Echelon Corp 95,392 (1,855)
6,897 Echo Global Logistics Inc 141,733 11,797
14,741 EchoStar Corp 'A' 727,911 7,336
(19,204) Education Management Corp (231,984) (392)
(44,977) Education Realty Trust Inc (Reit) (390,850) 74,077
2,995 Edwards Lifesciences Corp 196,682 2,037
2,596 eHealth Inc 117,157 71,581
(366) EI du Pont de Nemours & Co (22,568) 165
31,317 Einstein Noah Restaurant Group Inc 504,204 33,726
4,276 El Paso Electric Co 153,423 3,068
11,997 Electro Scientific Industries Inc 123,809 (7,231)
50,322 Electronic Arts Inc 1,117,148 (89,453)
9,181 Electronics For Imaging Inc 364,302 40,047
(201) Elephant Talk Communications Corp (187) 304
(14,123) Elizabeth Arden Inc (563,649) 85,387
(171) Ellie Mae Inc (4,831) 501
(18,592) Embraer SA (579,141) (5,835)
(752) EMC Corp/MA (17,950) 98
(194) EMC Insurance Group Inc (6,031) 257
(861) Emcore Corp (4,563) 85
(172) Emeritus Corp (3,856) (557)
(3,613) Emerson Electric Co (244,239) 1,337
(16,721) Empire Resorts Inc (81,097) 10,032
10,048 Employers Holdings Inc 327,866 36,541
13,160 Empresa Nacional de Electricidad
SA/Chile ADR 568,775 (18,391)
Contracts For Difference as at 30 November 2013
United States continued United States continued

Holding DescriptionMarket Value
USD
Unrealisedappreciation/
(depreciation)USD Holding Description
Market ValueUSD
Unrealisedappreciation/
(depreciation)USD
32 BlackRock Strategic Funds (BSF)
BlackRock Americas Diversified Equity Absolute Return Fund continued
(78,400) Empresas ICA SAB de CV ADR (589,568) (9,303)
1,382 Enanta Pharmaceuticals Inc 37,314 9,762
(4,036) Enbridge Energy Management LLC (116,479) (1,112)
(95) Encore Capital Group Inc (4,531) (21)
(6,874) Encore Wire Corp (343,081) (43,781)
(5,796) Endeavour International Corp (27,763) (8,400)
3,247 Endo Health Solutions Inc 218,556 7,878
(7,223) Endocyte Inc (80,681) (555)
(1,932) Endologix Inc (34,583) (251)
1,463 Endurance International Group 20,716 4,583
(417) Endurance Specialty Holdings Ltd (23,790) (196)
2,422 Energen Corp 174,529 (9,446)
(962) Energizer Holdings Inc (107,023) (3,554)
795 Energizer Holdings Inc 88,444 4,118
(9,780) Energy Recovery Inc (48,998) (6,193)
(254) Energy XXI Bermuda Ltd (6,901) 49
1,407 EnerNOC Inc 24,172 6,265
49,022 Enersis SA ADR 758,861 (103,410)
6,782 EnerSys Inc 485,862 19,301
3,175 Engility Holdings Inc 100,997 1,503
350 Ensign Group Inc/The 15,736 2,330
(2,142) Enstar Group Ltd (300,094) (8,498)
(11,588) Entegris Inc (127,236) (5,535)
10,362 Entegris Inc 113,775 11,798
(11,213) Entercom Communications Corp 'A' (117,400) (34,131)
2,429 Enterprise Financial Services Corp 47,948 9,672
12,464 Entravision Communications Corp 'A' 83,260 58,913
632 Envestnet Inc 25,286 2,926
12,504 Envivio Inc 37,137 14,997
125,335 Enzon Pharmaceuticals Inc 200,536 (76,135)
2,807 EOG Resources Inc 463,997 (17,067)
725 EPAM Systems Inc 25,868 568
(4,729) EPAM Systems Inc (168,731) (56,422)
410 Epiq Systems Inc 6,790 1,070
427 ePlus Inc 23,754 897
9,571 EPR Properties (Reit) 486,398 (8,901)
(51) Equifax Inc (3,438) 13
(1,602) Equinix Inc (258,114) 10,397
10,858 Equity Lifestyle Properties Inc (Reit) 387,848 (2,924)
87,383 Equity One Inc (Reit) 1,968,739 (70,295)
(3,231) Equity Residential (Reit) (167,915) (2,351)
(785) Erickson Air Crane Inc (14,899) (481)
(5,234) Erie Indemnity Co 'A' (376,220) (9,683)
(21,532) ESB Financial Corp (305,539) (40,615)
1,505 ESCO Technologies Inc 51,320 2,470
16,602 Essent Group Ltd 364,746 9,826
(21) Essex Property Trust Inc (Reit) (3,200) 79
755 Estee Lauder Cos Inc/The 'A' 57,033 1,412
967 Esterline Technologies Corp 85,870 16,295
(4,319) Ethan Allen Interiors Inc (132,464) 4,139
5,935 Euronet Worldwide Inc 286,008 88,068
65,649 EverBank Financial Corp 1,111,438 97,199
(46,588) EverBank Financial Corp (788,735) (80,051)
3,171 Everest Re Group Ltd 502,350 3,898
5,342 Evolution Petroleum Corp 65,386 1,470
3,407 Exa Corp 49,401 15,684
(15,787) Exact Sciences Corp (194,180) (23,371)
(11,810) ExamWorks Group Inc (342,018) (70,864)
(9,568) Exar Corp (116,825) (4,012)
15,282 EXCO Resources Inc 79,772 (3,336)
53,140 Exelis Inc 947,486 34,703
(37,241) Exelixis Inc (214,508) (37,159)
12,476 Exide Technologies 2,882 (16,111)
328 ExOne Co/The 17,551 328
(1,920) Expeditors International
of Washington Inc (84,038) (380)
16,622 Express Inc 407,073 52,768
4,531 Express Scripts Holding Co 306,069 10,014
(137) Extra Space Storage Inc (Reit) (5,784) 89
28,922 Extreme Networks Inc 201,442 42,315
(8,607) Exxon Mobil Corp (809,058) 10,931
1,359 Ezcorp Inc 'A' 15,887 (10,183)
5,727 F5 Networks Inc 470,473 731
14,830 Fabrinet 294,524 38,099
138 Facebook Inc 'A' 6,486 (277)
228 FactSet Research Systems Inc 25,983 262
(42,053) Fair Isaac Corp (2,474,399) (112,380)
(16,012) Fairpoint Communications Inc (146,670) 3,870
(167) Family Dollar Stores Inc (11,692) 2
1,073 Farmer Bros Co 21,932 6,257
(325) Farmers Capital Bank Corp (6,893) (282)
3,716 FARO Technologies Inc 204,789 76,781
22,256 FBR & Co 629,622 11,536
394 FEI Co 36,063 450
23,176 FelCor Lodging Trust Inc (Reit) 166,867 59,804
(457) Female Health Co/The (4,218) (23)
(17,748) Fibria Celulose SA ADR (214,928) (19,133)
(16,271) Fidelity National Financial Inc 'A' (475,601) (21,966)
1,725 Fidelity Southern Corp 29,946 3,198
(17,387) Fidus Investment Corp (375,907) (59,442)
2,878 Fiesta Restaurant Group Inc 141,914 2,460
(25,957) Fifth & Pacific Cos Inc (849,832) (59,961)
(1,360) Fifth Street Finance Corp (13,070) 1,694
10,894 Finisar Corp 226,377 (14,166)
495 FireEye Inc 19,097 2,412
(1,078) First American Financial Corp (28,869) (1,477)
(1,808) First Bancorp Inc/ME (32,454) (2,892)
(31,210) First BanCorp/Puerto Rico (200,056) (14,992)
(13,184) First Bancorp/Troy NC (222,414) (31,237)
2,021 First Busey Corp 12,207 1,199
(12,568) First Cash Financial Services Inc (802,153) (102,701)
9,627 First Citizens BancShares
Inc/NC 'A' 2,157,988 339,945
(221) First Connecticut Bancorp
Inc/Farmington CT (3,739) (475)
(1,063) First Defiance Financial Corp (28,818) (607)
(14,295) First Financial Bankshares Inc (957,765) (291,613)
(2,559) First Financial Corp/IN (94,043) (6,469)
406 First Financial Holdings Inc 26,865 2,383
766 First Financial Northwest Inc 8,265 (88)
(50,936) First Horizon National Corp (574,049) (5,499)
(8,394) First Industrial Realty Trust Inc (Reit) (147,399) (21,306)
1,688 First Interstate Bancsystem Inc 47,196 14,911
3,731 First Majestic Silver Corp 36,452 (2,100)
35,879 First Merchants Corp 761,711 165,426
(2,053) First Niagara Financial Group Inc (23,014) (144)
(1,795) First of Long Island Corp/The (76,736) (6,464)
15,566 First Republic Bank/CA 799,003 2,487
(5,400) First Solar Inc (323,352) (34,321)
488 Firsthand Technology Value Fund Inc 10,321 (279)
5,611 Five Prime Therapeutics Inc 53,304 (2,173)
4,992 Flagstar Bancorp Inc 91,468 17,856
(4,451) Flagstar Bancorp Inc (81,556) (6,312)
8,130 FleetCor Technologies Inc 993,486 51,221
2,682 Flextronics International Ltd 20,249 (161)
(2,265) Flotek Industries Inc (47,474) (105)
810 Flowserve Corp 58,352 1,733
(15,078) Fluidigm Corp (482,496) (226,476)
(3,337) Fluor Corp (261,254) 3,047
(18,211) FMC Corp (1,334,138) 30,634
61,560 FNB Corp/PA 784,274 103,359
Contracts For Difference as at 30 November 2013
United States continued United States continued

Holding DescriptionMarket Value
USD
Unrealisedappreciation/
(depreciation)USD Holding Description
Market ValueUSD
Unrealisedappreciation/
(depreciation)USD
Unaudited Interim Report and Accounts 33
The notes on pages 150 to 158 form an integral part of these financial statements.
BlackRock Americas Diversified Equity Absolute Return Fund continued
6,104 Fomento Economico Mexicano
SAB de CV 581,040 8,982
8,604 Foot Locker Inc 335,642 16,089
7,511 Forbes Energy Services Ltd 26,889 3,781
(40,312) Forest City Enterprises Inc 'A' (787,696) 8,869
(4,222) Forest Laboratories Inc (217,813) 296
6,197 Forest Laboratories Inc 319,703 23,692
26,315 Forestar Group Inc 511,037 (53,384)
(1,357) FormFactor Inc (7,409) 1,587
44,494 Fortegra Financial Corp 329,256 (7,680)
5,366 Fortinet Inc 92,242 (12,933)
(1,166) Forum Energy Technologies Inc (31,482) (2,693)
(12,793) Forward Air Corp (558,031) (83,807)
(2,898) Foster Wheeler AG (88,331) (2,927)
2,035 Foundation Medicine Inc 51,485 (19,151)
(8,839) Fox Chase Bancorp Inc (156,008) (4,102)
(12,175) Francesca's Holdings Corp (236,804) (16,234)
54,477 Frank's International NV 1,306,358 (248,981)
(7,677) Franklin Electric Co Inc (342,164) (99,718)
(40,234) Franklin Financial Corp/VA (824,797) (118,764)
15,023 Franklin Street Properties Corp 196,050 4,158
36,200 Freescale Semiconductor Ltd 528,520 9,889
(24,075) FreightCar America Inc (559,262) (103,099)
40,794 Fresh Del Monte Produce Inc 1,152,430 27,119
122 Fresh Market Inc /The 4,906 100
3,200 FriendFinder Networks Inc 96 (6,996)
1,822 FTD Cos Inc 60,035 60,035
(14,653) FTI Consulting Inc (657,041) (53,803)
453 Fuel Tech Inc 3,443 1,681
(34,335) FuelCell Energy Inc (47,726) 3,100
(3,279) Furiex Pharmaceuticals Inc (146,899) (8,496)
18,897 Fusion-io Inc 184,624 (629)
(14,438) Fusion-io Inc (141,059) 19,175
29,909 FutureFuel Corp 495,293 110,614
(24,222) FXCM Inc 'A' (402,812) (48,598)
4,648 G & K Services Inc 'A' 280,925 55,134
(150) G-III Apparel Group Ltd (9,045) (693)
(150,788) Gafisa SA ADR (447,840) (3,772)
299 Gain Capital Holdings Inc 2,733 (444)
525 GAMCO Investors Inc 'A' 44,063 5,880
29,797 GameStop Corp 'A' 1,439,493 (168,327)
17,637 Gannett Co Inc 480,256 3,493
(3,880) Garmin Ltd (189,965) (4,755)
(8,641) Gartner Inc (566,072) (5,769)
2,759 Gastar Exploration Ltd 16,444 9,372
367 Geeknet Inc 6,819 15
(10,476) Genco Shipping & Trading Ltd (27,028) 6,238
5,944 Generac Holdings Inc 316,161 18,308
712 General Communication Inc 'A' 7,070 1,511
(9,068) General Electric Co (242,569) 4,081
(68,390) General Growth Properties Inc (Reit) (1,424,564) 6,374
(7,230) Genesco Inc (543,479) (18,688)
(9,605) Genesee & Wyoming Inc 'A' (928,996) 10,373
(1,897) Genie Energy Ltd 'B' (30,788) (8,880)
(10,633) GenMark Diagnostics Inc (129,191) (2,800)
(9,397) Genomic Health Inc (329,459) 3,405
45,342 Genpact Ltd 811,622 (6,160)
1,291 Gentex Corp/MI 38,394 (219)
24,463 Gentherm Inc 588,091 181,065
(1,675) Gentiva Health Services Inc (20,787) (3,598)
1,043 Genworth Financial Inc 'A' 15,801 636
(1,232) Geospace Technologies Corp (105,940) (7,878)
73,620 Gerdau SA ADR 576,445 (14,760)
4,027 German American Bancorp Inc 121,172 10,087
(11,324) Getty Realty Corp (Reit) (210,060) 15,529
(31,517) Gevo Inc (57,361) 14,402
12,131 Gibraltar Industries Inc 213,627 (1,302)
38,948 Gilead Sciences Inc 2,921,100 276,414
8,427 Glacier Bancorp Inc 251,799 43,068
(165,600) Glimcher Realty Trust (Reit) (1,622,880) 209,003
28,931 Global Brass & Copper Holdings Inc 477,072 (13,844)
76,995 Global Cash Access Holdings Inc 743,002 214,074
10,800 Global Eagle Entertainment Inc 161,028 50,353
18,620 Global Geophysical Services Inc 26,999 (22,097)
(718) Global Indemnity Plc (19,135) (1,677)
(15,350) Global Payments Inc (970,734) 4,088
(838) Global Power Equipment Group Inc (16,375) (274)
3,020 Globe Specialty Metals Inc 54,330 2,968
(28,040) Globe Specialty Metals Inc (504,440) (5,453)
(471) Globecomm Systems Inc (6,646) (93)
9,837 Globus Medical Inc 'A' 190,543 6,847
(416) Globus Medical Inc 'A' (8,058) (705)
(12,969) Glu Mobile Inc (48,504) (14,230)
8,368 GNC Holdings Inc 'A' 502,749 10,564
19,034 Gogo Inc 508,208 283,306
(106,454) Gol Linhas Aereas Inteligentes SA ADR (473,720) (18,825)
(7,477) Golar LNG Ltd (272,985) 22,031
81,549 Gold Reserve Inc 277,267 45,032
2,686 Goldman Sachs Group Inc/The 453,182 30,937
(48,813) Golub Capital BDC Inc (909,386) (81,909)
26,580 Goodrich Petroleum Corp 499,172 (75,291)
14,241 Gordmans Stores Inc 147,252 (37,110)
(1,286) Gorman-Rupp Co/The (54,977) (18,849)
(49,299) GrafTech International Ltd (570,389) (179,567)
577 Graham Holdings Co 381,016 3,374
112,853 Gramercy Property Trust Inc (Reit) 596,992 236,283
2,511 Gran Tierra Energy Inc 17,903 3,114
13,390 Graphic Packaging Holding Co 120,376 6,251
(90,447) Great Lakes Dredge & Dock Corp (809,048) (182,503)
3,382 Great Northern Iron Ore Properties 247,901 7,319
520 Greatbatch Inc 21,258 2,130
(36,404) Green Dot Corp 'A' (885,345) (134,655)
4,106 Green Plains Renewable Energy Inc 69,966 2,196
2,860 Greenbrier Cos Inc/The 89,804 2,239
(144) Greenhill & Co Inc (7,959) (730)
(5,736) Griffin Land & Nurseries Inc (188,083) (3,914)
9,730 Griffon Corp 126,490 22,565
(2,153) Group 1 Automotive Inc (148,126) (654)
35,060 Groupon Inc 316,942 (43,968)
21,607 Grupo Aeroportuario del Centro
Norte Sab de CV ADR 588,791 (16,710)
5,805 Grupo Aeroportuario del Pacifico
SAB de CV ADR 299,248 3,773
4,475 Grupo Aeroportuario del Sureste
SAB de CV ADR 596,696 53,866
(13,834) Grupo Televisa SAB ADR (421,660) (7,867)
11,780 GSE Holding Inc 24,267 (7,309)
2,716 GSI Group Inc 29,604 8,864
2,275 GSI Technology Inc 15,720 383
1,846 GSV Capital Corp 19,752 4,722
(7,801) GT Advanced Technologies Inc (76,996) (52,347)
(1,483) Guess? Inc (50,496) (282)
(8,341) Guidance Software Inc (77,321) (4,962)
950 Guidewire Software Inc 44,935 291
20,851 Gulfmark Offshore Inc 'A' 1,027,537 (24,334)
762 Gyrodyne Co of America Inc (Reit) 55,001 (1,433)
(15,709) H&R Block Inc (441,580) 6,127
55,995 Hackett Group Inc/The 345,489 102,490
8,313 Haemonetics Corp 350,310 20,928
9,527 Hain Celestial Group Inc/The 788,836 (13,673)
40,603 Halcon Resources Corp 161,194 (757)
(15,707) Halcon Resources Corp (62,357) 21,727
Contracts For Difference as at 30 November 2013
United States continued United States continued

Holding DescriptionMarket Value
USD
Unrealisedappreciation/
(depreciation)USD Holding Description
Market ValueUSD
Unrealisedappreciation/
(depreciation)USD
34 BlackRock Strategic Funds (BSF)
BlackRock Americas Diversified Equity Absolute Return Fund continued
6,676 Hallador Energy Co 51,939 3,173
3,842 Halliburton Co 201,052 (14,984)
20,483 Hallmark Financial Services Inc 192,335 2,064
(7,615) Halozyme Therapeutics Inc (114,606) (32,841)
(3,669) Hancock Holding Co (130,176) (8,120)
19,889 Hanmi Financial Corp 408,321 131,348
(9,349) Hannon Armstrong Sustainable
Infrastructure Capital Inc (115,460) (6,699)
520 Hanover Insurance Group Inc/The 31,538 2,591
(86,140) Hansen Medical Inc (161,943) 41,405
37,935 Harbinger Group Inc 455,220 132,928
(220) Hardinge Inc (3,386) (24)
(1,152) Harman International Industries Inc (93,807) (368)
799 Harmonic Inc 6,160 312
85,270 Harte-Hanks Inc 677,044 118,513
2,190 Hartford Financial Services Group Inc 78,314 (27)
19,991 Harvard Apparatus Regenerative
Technology Inc 101,354 95,971
73,603 Harvard Bioscience Inc 333,422 (48,026)
7,396 Harvest Natural Resources Inc 26,774 (6,680)
3,138 Hasbro Inc 169,107 3,640
(1,730) Hasbro Inc (93,230) (2,087)
1,271 Haverty Furniture Cos Inc 36,821 6,023
(346) Haynes International Inc (18,888) (690)
69 HCI Group Inc 3,511 301
(3,877) HCP Inc (Reit) (143,682) 6,603
7,285 HD Supply Holdings Inc 153,568 1,603
(1,525) Health Care Inc (Reit) (86,086) 6,192
(286) Health Insurance Innovations Inc 'A' (3,432) (207)
(9,088) Health Management Associates Inc 'A' (119,144) 454
30,906 Health Net Inc/CA 944,487 79,694
(23,365) Healthcare Services Group Inc (685,529) (112,596)
(1,931) HealthStream Inc (64,766) (220)
(5,297) Healthways Inc (73,205) 30,809
(4,792) Heartland Express Inc (88,796) (5,155)
(165,878) Hecla Mining Co (487,681) 28,371
1,113 HEICO Corp 63,920 7,572
(5,096) Heidrick & Struggles International Inc (92,798) 1,069
(7,460) Helen of Troy Ltd (364,496) (12,629)
25,971 Helix Energy Solutions Group Inc 575,258 (5,048)
17,943 Hercules Offshore Inc 113,579 (312)
499 Heritage Financial Corp/WA 8,643 479
49,840 Heritage Financial Group Inc 879,676 76,616
40,365 Heritage Oaks Bancorp 321,709 56,358
(652) Heritage-Crystal Clean Inc (11,932) (560)
(2,929) Herman Miller Inc (94,079) (4,443)
(646) Hershey Co/The (63,211) 459
(1,648) Hertz Global Holdings Inc (39,568) (617)
9,419 Hertz Global Holdings Inc 226,150 3,108
101 Hexcel Corp 4,430 29
1,858 hhgregg Inc 27,833 14,334
(3,392) Hibbett Sports Inc (221,158) (26,215)
(24,551) Higher One Holdings Inc (243,055) (3,156)
(38,317) Hill-Rom Holdings Inc (1,589,772) (58,030)
459 Hillenbrand Inc 13,022 48
8,280 Hillshire Brands Co 276,966 6,376
(21,029) Hilltop Holdings Inc (500,490) (121,349)
(26,584) HMS Holdings Corp (612,761) (41,161)
(10,163) HNI Corp (407,028) (13,668)
(10,279) Hologic Inc (230,969) (9,365)
(3,500) Home Bancorp Inc (65,625) (2,795)
(4,293) Home BancShares Inc/AR (154,763) (5,385)
10,397 Home Federal Bancorp Inc/ID 159,074 15,978
46,453 HomeStreet Inc 974,584 (33,302)
(7,928) Honeywell International Inc (705,116) (2,537)
23,667 Horace Mann Educators Corp 729,654 215,585
6,534 Hormel Foods Corp 294,879 645
(26,544) Horsehead Holding Corp (400,284) (108,972)
(8,287) Hospira Inc (327,254) 1,250
35,052 Host Hotels & Resorts Inc (Reit) 648,111 (18,227)
(23,174) Hovnanian Enterprises Inc 'A' (117,956) 170
345 HSN Inc 20,162 292
199 Hub Group Inc 'A' 7,566 307
(39,397) Hudson City Bancorp Inc (369,544) (12,662)
(23,359) Hudson Valley Holding Corp (484,699) (64,250)
(3,748) Humana Inc (390,429) (22,113)
(16,164) Huntington Ingalls Industries Inc (1,336,278) (43,786)
(1,191) Hurco Cos Inc (31,550) (1,961)
(540) Hyperion Therapeutics Inc (13,073) (1,029)
1,577 Hyster-Yale Materials Handling Inc 129,156 56,299
10,091 IAC/InterActiveCorp 570,545 (11,498)
(32,588) ICG Group Inc (558,558) (176,958)
34,187 ICON Plc 1,307,653 (11,351)
3,465 Iconix Brand Group Inc 137,283 27,589
8,241 ICU Medical Inc 544,071 (67,624)
(41,652) Idenix Pharmaceuticals Inc (221,589) (48,686)
14,542 IDT Corp 'B' 323,269 106,667
102,636 II-VI Inc 1,686,309 (28,315)
(12,636) Illumina Inc (1,229,483) (27,945)
(42,700) Imax Corp (1,309,182) (51,545)
19,671 Immersion Corp 245,691 (38,951)
29,906 ImmunoCellular Therapeutics Ltd 102,279 39,907
(15,051) ImmunoGen Inc (220,949) 20,810
(31,875) Immunomedics Inc (139,294) 33,044
(780) Impax Laboratories Inc (18,525) (132)
10,492 Imperial Holdings Inc 67,044 4,182
(465) Imperva Inc (20,772) 508
(116,703) inContact Inc (871,771) (233,520)
(16,420) Incyte Corp Ltd (772,068) (43,492)
(3,106) Independence Holding Co (43,857) (2,637)
(56,349) Independent Bank Corp/Rockland MA (2,136,754) (289,930)
19,237 Independent Bank Group Inc 919,529 272,055
5,526 Infinera Corp 50,673 2,383
(28,626) Infinera Corp (262,500) (68,236)
(761) Infinity Pharmaceuticals Inc (11,164) 27
1,989 Infoblox Inc 62,315 (1,742)
(1,361) Informatica Corp (52,943) 828
11,346 ING US Inc 398,472 1,929
6,799 Ingersoll-Rand Plc 486,740 27,962
5,153 Ingles Markets Inc 'A' 136,967 23,201
32,628 Ingram Micro Inc 'A' 761,538 (20,882)
(20,596) Ingredion Inc (1,438,631) (14,985)
60,203 Inland Real Estate Corp (Reit) 647,784 146,567
(4,569) Innodata Inc (11,605) 2,775
10,382 Innophos Holdings Inc 497,402 6,861
(3,356) Innospec Inc (161,893) (4,949)
(480) Innovative Solutions & Support Inc (3,686) 26
17,568 Inphi Corp 219,776 61,845
(427) Insmed Inc (6,930) (829)
(8,176) Insulet Corp (301,286) (119,042)
366 Insys Therapeutics Inc 15,870 9,639
(19,538) Integra LifeSciences Holdings Corp (910,471) (94,213)
(163,555) Integrated Device Technology Inc (1,632,279) (184,105)
(70,407) Intel Corp (1,688,360) 7,810
42,400 Inteliquent Inc 485,056 369,397
(413) Intelsat SA (8,983) 773
(9,168) Inter Parfums Inc (337,932) (52,858)
(3,666) Interactive Intelligence Group Inc (238,583) (77,782)
(1,466) Intercept Pharmaceuticals Inc (77,024) (2,215)
(585) IntercontinentalExchange Group Inc (125,067) 872
(8,683) InterDigital Inc/PA (295,743) 44,627
13,828 Interface Inc 277,251 4,899
Contracts For Difference as at 30 November 2013
United States continued United States continued

Holding DescriptionMarket Value
USD
Unrealisedappreciation/
(depreciation)USD Holding Description
Market ValueUSD
Unrealisedappreciation/
(depreciation)USD
Unaudited Interim Report and Accounts 35
The notes on pages 150 to 158 form an integral part of these financial statements.
BlackRock Americas Diversified Equity Absolute Return Fund continued
24,500 Intermolecular Inc 139,160 (55,104)
18,190 InterMune Inc 252,659 23,470
(1,513) InterMune Inc (21,016) (7,445)
(7,118) Internap Network Services Corp (54,097) (10,842)
(28,731) International Bancshares Corp (756,200) (207,083)
10,905 International Game Technology 189,093 (5,452)
2,941 International Paper Co 137,286 3,382
4,612 International Rectifier Corp 112,625 4,201
(17,756) Interpublic Group of Cos Inc/The (309,487) (4,015)
14,333 Intersections Inc 111,367 (16,371)
822 InterXion Holding NV 18,232 97
9,257 Intevac Inc 58,875 7,844
(14,124) INTL. FCStone Inc (292,649) (23,010)
3,204 IntraLinks Holdings Inc 35,180 16,335
(40,981) Intrepid Potash Inc (635,206) 50,300
9,600 Intrexon Corp 214,944 13,653
8,522 Invacare Corp 190,126 64,491
3,831 InvenSense Inc 66,161 679
181 Invesco Ltd 6,349 224
(100) Invesco Mortgage Capital Inc (Reit) (1,507) 10
5,563 Invesco Mortgage Capital Inc (Reit) 83,834 (1,005)
5,086 Investment Technology Group Inc 99,686 37,930
788 Investors Real Estate Trust (Reit) 6,934 289
9,022 ION Geophysical Corp 33,472 (9,765)
(12,566) IPC The Hospitalist Co Inc (782,862) (19,663)
7,878 iRobot Corp 261,865 (2,214)
(1,706) iRobot Corp (56,707) 2,041
(16,849) Ironwood Pharmaceuticals Inc (194,437) 39,042
(8,962) Isis Pharmaceuticals Inc (353,909) (64,825)
(5,826) Isle of Capri Casinos Inc (47,715) (3,431)
(1,121) Isramco Inc (138,107) (22,799)
(15,753) iStar Financial Inc (Reit) (204,474) (12,951)
1,633 iStar Financial Inc (Reit) 21,196 2,025
20,804 Itau Unibanco Holding SA ADR (Pref) 291,464 (11,854)
(552) Itron Inc (23,454) 144
21,039 ITT Corp 862,599 6,287
(671) ITT Educational Services Inc (25,974) (3,882)
14,431 Ixia 186,737 (8,243)
39,362 IXYS Corp 490,844 117,115
86 J&J Snack Foods Corp 7,429 264
2,524 j2 Global Inc 122,767 (6,056)
15,100 Jack in the Box Inc 720,119 81,655
(4,270) Jamba Inc (50,301) (3,422)
1,718 Janus Capital Group Inc 18,709 1,678
(13,795) JC Penney Co Inc (139,743) 61,960
17,019 JDS Uniphase Corp 206,611 (4,896)
(19,001) JDS Uniphase Corp (230,672) 4,940
(25,471) JetBlue Airways Corp (226,819) (91,058)
(7,329) Jive Software Inc (80,619) (2,337)
(9,487) JMP Group Inc (63,563) (8,376)
5,038 John B Sanfilippo & Son Inc 130,283 35,400
47,326 John Bean Technologies Corp 1,402,743 446,711
(12,622) John Wiley & Sons Inc 'A' (636,275) (11,636)
4,061 Johnson Outdoors Inc 'A' 116,307 21,487
84,489 Jones Group Inc/The 1,191,295 44,032
532 Jones Lang LaSalle Inc 51,907 2,006
(2,669) Jones Lang LaSalle Inc (260,414) 1,231
(9,748) Jos A Bank Clothiers Inc (554,856) (50,366)
(19,833) Joy Global Inc (1,122,151) (12,678)
(10,587) JTH Holding Inc 'A' (249,853) (69,065)
3,982 Juniper Networks Inc 81,273 2,270
932 Kadant Inc 38,548 3,628
33,624 KaloBios Pharmaceuticals Inc 142,902 (67,178)
(6,703) Kandi Technologies Group Inc (47,725) (15,731)
(4,018) Kansas City Life Insurance Co (196,681) (21,381)
17,182 KapStone Paper and Packaging Corp 913,911 168,526
13,881 KAR Auction Services Inc 386,169 41,106
(1,120) KB Home (19,757) (1,102)
(15,427) KCAP Financial Inc (127,890) 3,940
(81,917) Kearny Financial Corp (854,394) (24,912)
(23,601) Kellogg Co (1,437,773) 39,669
(7,494) Kelly Services Inc 'A' (173,636) (56,335)
(34,929) Kemet Corp (209,574) (32,379)
(6,153) Kemper Corp (234,183) (23,455)
(3,843) Kennametal Inc (183,772) (1,688)
(35,392) Kennedy-Wilson Holdings Inc (724,828) (183,143)
(5,210) Keryx Biopharmaceuticals Inc (69,710) (31,736)
(40,631) Key Energy Services Inc (317,734) 14,502
4,957 Key Tronic Corp 52,247 511
23,613 KeyCorp 302,719 (1,620)
(67,968) KEYW Holding Corp/The (850,280) 130,179
26,271 Kforce Inc 534,615 116,893
(76) Kilroy Realty Corp (Reit) (3,847) 5
5,868 Kimball International Inc 'B' 87,903 20,042
(2,535) Kimberly-Clark Corp (276,721) (2,024)
11,599 Kimco Realty Corp (Reit) 239,983 (4,777)
(2,679) Kinder Morgan Management LLC (204,970) (3,268)
(20,893) Kindred Healthcare Inc (357,270) (17,755)
(61,698) KiOR Inc 'A' (144,373) 223,932
(4,678) Kirby Corp (442,024) 3,181
17,146 Kirkland's Inc 440,138 208,062
3,219 Kite Realty Group Trust (Reit) 20,988 4,014
(3,289) KLA-Tencor Corp (211,548) (1,900)
(1,952) KMG Chemicals Inc (35,604) 2,525
450 Knightsbridge Tankers Ltd 3,596 (147)
283 Knoll Inc 5,069 492
(8,146) Kohl's Corp (456,257) (10,982)
(78,795) Kopin Corp (315,968) (36,084)
(5,497) Koppers Holdings Inc (260,503) 1,538
21,471 Korn/Ferry International 494,048 49,329
(30,389) Kosmos Energy Ltd (318,781) 5,774
4,488 Kraft Foods Group Inc 239,839 1,750
2,452 Kraton Performance Polymers Inc 58,186 3,174
(17,510) Kratos Defense & Security Solutions Inc (116,792) (29,229)
(1,366) Krispy Kreme Doughnuts Inc (34,915) (188)
15,432 Kroger Co/The 647,681 (6,654)
(12,894) Kronos Worldwide Inc (216,748) (10,601)
46,135 Kulicke & Soffa Industries Inc 578,072 40,822
(4,820) Kulicke & Soffa Industries Inc (60,395) (195)
(1,730) KVH Industries Inc (24,687) (1,435)
(595) KYTHERA Biopharmaceuticals Inc (23,616) 2,956
(2,847) L Brands Inc (187,845) (3,758)
2,822 L&L Energy Inc 4,741 (5,944)
(3,405) La-Z-Boy Inc (99,971) (15,802)
(6,374) Laboratory Corp of America Holdings (651,933) 22,122
(976) Lancaster Colony Corp (85,429) (637)
242 Landec Corp 2,833 (376)
145 Landstar System Inc 8,143 (58)
7,615 Lannett Co Inc 234,466 150,949
(9,556) LaSalle Hotel Properties (Reit) (298,147) 2,244
(4,484) Latam Airlines Group SA (3,318) (3,318)
(34,939) Latam Airlines Group SA ADR (557,277) 16,895
9,299 Lawson Products Inc/DE 120,050 (4,634)
(6,092) Layne Christensen Co (101,493) 29,275
(3,366) LCNB Corp (59,948) 8,102
6,322 LDR Holding Corp 137,314 (5,680)
6,301 Lear Corp 522,983 16,131
13,384 Leggett & Platt Inc 402,725 (804)
(49,422) Level 3 Communications Inc (1,497,487) (158,830)
(57,082) Lexicon Pharmaceuticals Inc (136,426) (860)
(5,694) Libbey Inc (130,962) (20,071)
(424) Liberty Global Plc 'A' (35,998) (23)
Contracts For Difference as at 30 November 2013
United States continued United States continued

Holding DescriptionMarket Value
USD
Unrealisedappreciation/
(depreciation)USD Holding Description
Market ValueUSD
Unrealisedappreciation/
(depreciation)USD
36 BlackRock Strategic Funds (BSF)
BlackRock Americas Diversified Equity Absolute Return Fund continued
(188) Liberty Ventures 'A' (22,787) (606)
970 Life Time Fitness Inc 47,443 (253)
4,394 LifeLock Inc 75,577 4,311
(9,002) LifePoint Hospitals Inc (463,153) 1,440
(1,509) Lifevantage Corp (2,958) 596
642 Ligand Pharmaceuticals Inc 'B' 36,061 12,064
154,890 Lihua International Inc 851,895 104,970
83,144 Limelight Networks Inc 168,782 (17,515)
240 LIN Media LLC 'A' 6,233 318
3,380 Lindsay Corp 257,556 (9,178)
12,113 Linear Technology Corp 518,436 7,026
26,549 LinnCo LLC 824,081 30,969
56,661 Lions Gate Entertainment Corp 1,787,655 (131,075)
2,952 Liposcience Inc 13,166 (2,217)
(2,629) Liquidity Services Inc (59,231) 30,408
6,774 Liquidity Services Inc 152,618 4,359
5,546 Littelfuse Inc 484,110 44,645
795 Live Nation Entertainment Inc 14,509 659
(35,699) LivePerson Inc (435,171) (99,793)
(385) Loews Corp (18,284) 223
(7,925) Loral Space & Communications Inc (625,283) (131,268)
8,441 Lorillard Inc 435,724 (8,694)
33,082 Louisiana-Pacific Corp 539,567 (6,128)
(11,722) Louisiana-Pacific Corp (191,186) 469
3,222 Lowe's Cos Inc 153,528 (12,362)
(185) LSB Industries Inc (5,914) 215
(56,791) LSI Corp (460,007) 19,025
13,023 LSI Industries Inc 113,821 22,970
2,657 LTX-Credence Corp 19,237 4,329
5,895 Lumber Liquidators Holdings Inc 592,506 (20,767)
4,047 Luminex Corp 79,726 9,932
(3,296) Lumos Networks Corp (75,808) (1,791)
479 Lydall Inc 8,526 2,236
19,964 LyondellBasell Industries NV 'A' 1,556,992 (4,084)
4,479 M/A-COM Technology Solutions
Holdings Inc 71,664 8,577
(22,019) Macatawa Bank Corp (112,957) (3,455)
13,409 Mack-Cali Realty Corp (Reit) 274,884 (3,858)
7,455 Macquarie Infrastructure Co LLC 403,017 (2,794)
(542) Madison Square Garden Co/The 'A' (30,883) (498)
(1,709) Magellan Health Services Inc (104,454) 357
33,243 magicJack VocalTec Ltd 386,949 (56,470)
13,563 Magnachip Semiconductor Corp 274,379 64,630
(17,881) Magnum Hunter Resources Corp (127,849) (5,352)
14,349 Manhattan Associates Inc 1,737,664 581,945
3,471 Manitex International Inc 46,373 5,789
675 Manning & Napier Inc 12,609 948
33,404 MannKind Corp 167,020 4,710
(27,224) MannKind Corp (136,120) (44,192)
3,147 Manpowergroup Inc 253,271 (4,689)
(517) ManTech International Corp/VA 'A' (14,910) (298)
(7,853) Marathon Oil Corp (286,477) 11,443
401 Marathon Petroleum Corp 33,708 1,196
8,464 Marchex Inc 'B' 80,323 46,860
17,881 Marcus Corp/The 258,613 355
3,540 MarketAxess Holdings Inc 244,756 1,871
3,317 Marriott Vacations Worldwide Corp 173,612 11,913
301 Marrone Bio Innovations Inc 4,539 (103)
(30,860) Marsh & McLennan Cos Inc (1,470,788) (12,035)
15,612 Martha Stewart Living Omnimedia 'A' 57,921 19,527
9,769 Martin Marietta Materials Inc 946,128 (19,236)
(63,589) Marvell Technology Group Ltd (909,323) (61,910)
3,382 Masimo Corp 97,672 7,076
658 MasterCard Inc 'A' 501,626 7,182
511 Materion Corp 14,512 (1,861)
22,252 Matrix Service Co 485,984 225,629
34,163 Matson Inc 864,324 4,753
538 Matthews International Corp 'A' 22,768 2,319
(3,844) Mattress Firm Holding Corp (142,266) (11,650)
(55,813) Mattson Technology Inc (150,137) (29,378)
125,066 Maxim Integrated Products Inc 3,569,384 (46,008)
86,652 Maxygen Inc 2,600 (212,586)
(13,673) MB Financial Inc (447,791) (13,714)
(7,643) McClatchy Co/The 'A' (23,999) (2,304)
(2,686) McCormick & Co Inc/MD (187,349) 913
(46,038) McDermott International Inc (366,462) (4,995)
(74,017) McEwen Mining Inc (148,774) 105,173
7,541 MCG Capital Corp 36,197 2,664
(28,089) McGrath RentCorp (1,108,392) (287,190)
(13,789) McGraw-Hill Cos Inc/The (1,031,555) (35,767)
(1,887) MDC Partners Inc 'A' (42,910) (12,465)
1,821 Mead Johnson Nutrition Co 154,803 291
(2,885) MeadWestvaco Corp (101,754) (1,414)
(10,790) Measurement Specialties Inc (596,795) (158,966)
1,318 MedAssets Inc 28,759 2,227
1,432 MedCath Corp 1,962 (9,349)
37,478 Medical Action Industries Inc 320,437 86,393
4,599 Medicines Co/The 168,323 (1,510)
3,451 Medifast Inc 95,248 13,530
(273) Medivation Inc (17,245) (202)
(38,223) Medley Capital Corp (545,060) 34,512
(1,411) MEDNAX Inc (156,353) (880)
(607) MEI Pharma Inc (4,953) (223)
(2,700) Mellanox Technologies Ltd (104,598) 4,171
1,335 Men's Wearhouse Inc/The 68,005 15,387
2,075 Mentor Graphics Corp 47,102 7,786
(4,380) Mentor Graphics Corp (99,426) (3,020)
(26,415) Mercer International Inc (251,735) (73,555)
2,011 Merchants Bancshares Inc 62,924 6,115
(6,373) Merck & Co Inc (317,949) (11,599)
(3,632) Mercury General Corp (175,062) (2,651)
(9,759) Mercury Systems Inc (105,788) (32,718)
2,704 Meredith Corp 144,745 2,132
2,634 Merge Healthcare Inc 6,322 (707)
10,689 Meridian Bioscience Inc 260,010 3,092
5,599 Meritage Homes Corp 245,012 10,504
(29,321) Meritor Inc (231,929) (97,906)
(2,110) Merrimack Pharmaceuticals Inc (7,849) (2,634)
(1,672) Mesa Laboratories Inc (132,924) (20,580)
9,443 Meta Financial Group Inc 366,388 80,307
100,280 Metalico Inc 181,507 (5,028)
3,518 Methode Electronics Inc 101,811 12,055
(343) Metro Bancorp Inc (7,597) (237)
1,634 MetroCorp Bancshares Inc 23,742 6,899
(2,503) Mettler-Toledo International Inc (622,546) (3,079)
(1,881) MGE Energy Inc (105,881) (7,994)
(34,664) MGIC Investment Corp (279,738) (49,599)
(177) MGM Resorts International (3,418) 25
6,884 Michael Kors Holdings Ltd 559,945 (9,569)
15,689 Micrel Inc 153,909 8,823
10,214 MicroFinancial Inc 91,109 5,181
(27,209) Micron Technology Inc (574,926) (48,844)
17,618 MICROS Systems Inc 944,501 1,142
12,451 Microsemi Corp 306,046 61
(2,336) MicroStrategy Inc 'A' (300,410) (5,337)
5,596 Middleby Corp 1,241,305 33,413
452 MidSouth Bancorp Inc 8,095 1,115
3,378 Midstates Petroleum Co Inc 19,356 (4,354)
(27,575) Miller Energy Resources Inc (225,012) (82,390)
(17,681) Mindspeed Technologies Inc (88,847) (20,086)
(21,162) Mine Safety Appliances Co (1,067,411) 15,394
1,501 Minerals Technologies Inc 89,670 7,119
Contracts For Difference as at 30 November 2013
United States continued United States continued

Holding DescriptionMarket Value
USD
Unrealisedappreciation/
(depreciation)USD Holding Description
Market ValueUSD
Unrealisedappreciation/
(depreciation)USD
Unaudited Interim Report and Accounts 37
The notes on pages 150 to 158 form an integral part of these financial statements.
BlackRock Americas Diversified Equity Absolute Return Fund continued
(852) Mitcham Industries Inc (14,970) (2,165)
906 MKS Instruments Inc 26,818 (47)
(3,205) Mobile Mini Inc (130,796) (10,583)
(13,456) Modine Manufacturing Co (179,368) (70,641)
4,010 ModusLink Global Solutions Inc 15,198 3,979
(16,879) Molycorp Inc (78,825) 19,376
(42,179) Momenta Pharmaceuticals Inc (760,066) (64,504)
424 Monarch Casino & Resort Inc 7,708 (917)
(29,000) Mondelez International Inc 'A' (981,360) 7,559
(7,635) Monolithic Power Systems Inc (256,689) (7,540)
(29,657) Monro Muffler Brake Inc (1,579,235) (414,447)
(1,630) Monsanto Co (185,054) (421)
38,362 Monster Worldwide Inc 216,362 5,806
3,714 Montpelier Re Holdings Ltd 108,226 4,518
(1,306) Moog Inc 'A' (89,200) (3,540)
6,281 Morgan Stanley 197,161 6,038
(39,523) Morgans Hotel Group Co (315,789) (40,945)
(131) Morningstar Inc (10,895) 193
(239) Mosaic Co/The (11,307) 416
(87,995) MoSys Inc (432,055) (67,738)
3,589 Motorcar Parts of America Inc 62,305 26,267
(5,098) Motorola Solutions Inc (335,805) (1,529)
18,292 Movado Group Inc 824,603 64,990
12,340 Move Inc 189,666 9,425
1,237 MSC Industrial Direct Co Inc 'A' 94,915 (1,324)
7,988 Mueller Water Products Inc 'A' 68,777 592
(8,318) Multi-Color Corp (313,838) (119,478)
(2,652) Multi-Fineline Electronix Inc (37,287) 4,051
16,029 Multimedia Games Holding Co Inc 467,406 (3,790)
(2,973) Murphy Oil Corp (194,137) (1,707)
22,317 Murphy USA Inc 1,023,458 123,909
(8,144) Murphy USA Inc (373,484) (2,229)
762 MWI Veterinary Supply Inc 138,562 15,671
212 Myers Industries Inc 4,344 288
7,047 MYR Group Inc 180,474 23,757
7,376 Myriad Genetics Inc 223,345 33,974
(12,343) Nabors Industries Ltd (204,400) 14,921
450 NACCO Industries Inc 'A' 29,065 5,974
(12,796) NASB Financial Inc (383,752) (69,042)
11,006 NASDAQ OMX Group Inc/The 432,536 24,433
(1,435) Nathan's Famous Inc (76,629) (1,942)
15,926 National American University
Holdings Inc 57,015 (4,396)
66,339 National Bank Holdings Corp 'A' 1,411,031 193,129
(4,318) National Bankshares Inc (163,350) (6,989)
7,876 National Beverage Corp 167,601 49,567
(267) National Fuel Gas Co (18,127) 969
(5,356) National Health Investors Inc (Reit) (319,325) 7,828
(1,128) National Healthcare Corp (62,378) (7,243)
(11,839) National Instruments Corp (372,929) 4,144
(31,573) National Interstate Corp (896,673) 135,581
3,257 National Research Corp 'B' 109,533 (1,334)
6,023 National Retail Properties Inc (Reit) 192,676 (11,624)
1,081 National Western Life Insurance Co 'A' 231,345 39,481
(1,672) Nationstar Mortgage Holdings Inc (66,077) 1,297
15,821 Natus Medical Inc 362,301 171,083
(6,753) Navidea Biopharmaceuticals Inc (11,210) 8,672
14,588 Navios Maritime Partners LP 242,744 29,691
(49,895) Navistar International Corp (2,022,743) (43,112)
(84,220) NBT Bancorp Inc (2,168,665) (205,503)
(459) NCR Corp (15,886) 1,256
150 Neenah Paper Inc 6,306 503
(67,305) Nektar Therapeutics (846,024) (181,471)
17,526 Nelnet Inc 'A' 792,175 85,748
(2,192) Neogen Corp (111,485) (25,928)
845 NeoGenomics Inc 2,966 (229)
(69,796) Neonode Inc (440,413) (53,519)
(2,269) NeoPhotonics Corp (13,614) (2,008)
13,531 Net 1 UEPS Technologies Inc 106,895 37,173
(35,790) NETGEAR Inc (1,151,722) (29,685)
(22,499) Netscout Systems Inc (683,520) (28,131)
(2,232) NetSuite Inc (213,937) 3,412
(12,930) Neurocrine Biosciences Inc (127,490) 21,669
5,132 New Jersey Resources Corp 236,329 1,341
6,424 New Mountain Finance Corp 96,553 2,522
6,619 New Residential Investment Corp (Reit) 39,648 (1,786)
(136,850) New York Mortgage Trust Inc (Reit) (951,108) 36,475
(64,771) New York Times Co/The 'A' (908,737) (138,071)
(9,782) NewLink Genetics Corp (214,813) (22,144)
213 NewMarket Corp 69,219 (332)
(6,788) Newmont Mining Corp (169,904) 18,735
40,021 Newport Corp 687,161 28,145
4,369 News Corp 'A' 78,292 699
(19,240) NewStar Financial Inc (344,204) (45,972)
(3,657) Nexstar Broadcasting Group Inc 'A' (182,301) (38,634)
(4,292) NIC Inc (105,111) (2,639)
289 NIC Inc 7,078 221
(33,032) NII Holdings Inc (83,901) 61,073
11,658 NIKE Inc 'B' 924,946 4,470
(3,315) NL Industries Inc (38,288) (1,353)
4,721 NN Inc 93,098 24,655
9,662 Noranda Aluminum Holding Corp 26,570 (6,439)
(5,342) Northern Oil and Gas Inc (85,472) (1,928)
609 Northrim BanCorp Inc 15,998 433
16,748 Northrop Grumman Corp 1,909,272 64,926
13,973 NorthStar Realty Finance Corp (Reit) 137,914 8,373
7,498 Northwest Natural Gas Co 320,689 5,443
20,318 NorthWestern Corp 893,382 (18,067)
165 Norwegian Cruise Line Holdings Ltd 5,673 216
28,841 Novagold Resources Inc 66,911 (11,771)
8,941 Novatel Wireless Inc 19,491 307
(1,543) NPS Pharmaceuticals Inc (40,735) (1,188)
(2,605) NRG Energy Inc (69,033) 274
1,304 NTELOS Holdings Corp 27,814 10,935
3,302 Nu Skin Enterprises Inc 422,412 39,606
45,776 Nuance Communications Inc 614,085 (94,373)
(10,029) Numerex Corp 'A' (130,628) (14,208)
(67,444) Nuverra Environmental Solution (109,934) 156,938
(40,779) NVIDIA Corp (639,415) 3,776
13,179 NXP Semiconductor NV 556,154 2,838
7,098 NxStage Medical Inc 72,116 187
(27,025) NxStage Medical Inc (274,574) 79,348
8,293 Oasis Petroleum Inc 379,073 (37,074)
12,649 Ocean Rig UDW Inc 263,858 3,586
3,215 Oceaneering International Inc 247,716 (20,454)
1,089 Ocwen Financial Corp 61,888 4,650
(144,040) Odyssey Marine Exploration Inc (288,800) 165,536
(29,393) Office Depot Inc (160,780) (5,597)
(938) OFG Bancorp (16,209) (675)
33 Oi SA ADR 52 (3)
342 Oi SA ADR 534 (14)
6,227 Old Dominion Freight Line Inc 322,994 14,776
(41,354) Old National Bancorp/IN (644,295) (157,946)
3,837 Old Republic International Corp 66,418 1,702
(45,741) Olin Corp (1,133,005) (1,195)
1,436 Olympic Steel Inc 39,734 185
47,758 OM Group Inc 1,595,117 86,204
(5,469) Omega Healthcare Investors Inc (Reit) (178,563) 981
38,595 Omega Protein Corp 534,927 223,222
(9,913) Omeros Corp (78,214) (25,461)
152 OmniAmerican Bancorp Inc 3,350 10
16,501 Omnicell Inc 397,509 109,439
Contracts For Difference as at 30 November 2013
United States continued United States continued

Holding DescriptionMarket Value
USD
Unrealisedappreciation/
(depreciation)USD Holding Description
Market ValueUSD
Unrealisedappreciation/
(depreciation)USD
38 BlackRock Strategic Funds (BSF)
BlackRock Americas Diversified Equity Absolute Return Fund continued
2,816 OMNOVA Solutions Inc 23,840 (743)
22,899 On Assignment Inc 781,085 8,186
(14,461) ON Semiconductor Corp (102,456) 217
29,464 ON Semiconductor Corp 208,752 2,179
26,097 OncoGenex Pharmaceutical Inc 222,868 17,540
5,919 OncoMed Pharmaceuticals Inc 76,710 (21,957)
424 Onconova Therapeutics Inc 6,292 (4,971)
4,130 One Liberty Properties Inc 85,202 (5,143)
2,285 OneBeacon Insurance Group Ltd 'A' 36,446 5,793
(17,628) ONEOK Inc (1,030,709) (15,713)
(1,846) OpenTable Inc (155,433) (326)
7,032 Ophthotech Corp 193,239 (26,031)
(51,217) Opko Health Inc (536,754) (22,782)
4,339 Oplink Communications Inc 70,379 29
6,740 Oppenheimer Holdings Inc 'A' 155,020 27,273
(1,626) Oracle Corp (57,398) (946)
(54,318) ORBCOMM Inc (334,056) (73,705)
57,889 Orbitz Worldwide Inc 394,803 (17,464)
(17,872) Orexigen Therapeutics Inc (124,568) (27,396)
10,547 Organovo Holdiongs Inc 92,286 (2,655)
(1,302) Organovo Holdiongs Inc (11,393) (3,181)
50,512 Orient-Express Hotels Ltd 'A' 742,526 137,052
377 Orion Marine Group Inc 4,411 551
(2,072) Ormat Technologies Inc (52,442) (8,603)
(4,142) Orrstown Financial Services Inc (68,053) (995)
19,144 Orthofix International NV 411,787 (175,289)
3,572 OSH 1 Liquidating Corp 793 (6,333)
675 Oshkosh Corp 33,230 741
17,795 OSI Systems Inc 1,375,376 84,525
(3,138) Osiris Therapeutics Inc (55,292) (27,927)
360 Otter Tail Corp 10,746 867
5,019 OvaScience Inc 47,680 (4,884)
(865) Owens & Minor Inc (33,078) (662)
8,451 Owens Corning 330,772 18,170
13,207 Owens-Illinois Inc 438,472 (2,773)
(359) Oxford Industries Inc (27,112) (4,439)
21,854 Pacer International Inc 201,057 114,718
11,254 Pacific Biosciences of California Inc 49,067 28,961
10,620 Pacific Continental Corp 152,397 40,615
(2,540) Pacific Mercantile Bancorp (15,570) (208)
31,042 Pacific Sunwear of California Inc 91,263 (8,660)
(3,413) Pacira Pharmaceuticals Inc/DE (188,705) (117,839)
15,966 Packaging Corp of America 979,833 8,578
33,528 Pain Therapeutics Inc 157,917 64,096
(48,741) Pall Corp (4,084,008) (113,289)
(8,182) Palo Alto Networks Inc (404,027) (38,804)
14,868 Pan American Silver Corp 155,371 (44,716)
(2,411) Pandora Media Inc (69,003) 7,088
(5,859) Panera Bread Co 'A' (1,037,746) (1,495)
(1,884) Panhandle Oil and Gas Inc 'A' (62,078) (8,420)
27,316 Pantry Inc/The 388,160 37,094
(6,799) Paramount Gold and Silver Corp (7,683) 8,027
(3,529) Park Sterling Corp (24,703) (6,315)
45,688 Parker Drilling Co 365,504 166,982
(13,361) Parkervision Inc (54,646) (7,130)
(21,930) Parkway Properties Inc/Md (Reit) (398,030) (4,563)
576 PartnerRe Ltd 59,455 1,665
(198) Patriot Transportation Holding Inc (8,179) (1,590)
(37,022) Patterson-UTI Energy Inc (862,242) 56,479
(6,747) Paychex Inc (296,733) (4,345)
2,456 PBF Energy Inc 'A' 71,813 (19,605)
2,332 PC Connection inc 51,071 4,293
(2,936) PDF Solutions Inc (68,409) (14,755)
(40,833) PDL BioPharma Inc (400,572) (35,495)
22,675 PDL BioPharma Inc 222,442 52,676
28,241 Peabody Energy Corp 514,833 (13,808)
(29,951) Pebblebrook Hotel Trust (902,424) (8,852)
(606) Pegasystems Inc (30,530) (7,394)
(31,749) Pendrell Corp (68,260) 1,211
(1,854) Penford Corp (21,970) 3,999
(90,391) Pengrowth Energy Corp (565,848) 11,443
(63,776) Penn National Gaming Inc (923,476) 15,885
76,393 Penn West Petroleum Ltd 656,216 1,289
(3,445) Penns Woods Bancorp Inc (179,519) (17,500)
556 PennyMac Financial Services Inc 'A' 9,708 (2,204)
(79,425) PennyMac Mortgage Investment
Trust (Reit) (1,802,948) 118,394
771 Peoples Bancorp Inc/OH 18,334 1,164
(5,256) Pep Boys-Manny Moe & Jack/The (71,545) (11,566)
(15,788) Peregrine Semiconductor Corp (143,355) 15,599
20,113 Performant Financial Corp 212,997 12,357
19,695 Pericom Semiconductor Corp 185,133 39,640
(53,198) Pernix Therapeutics Holdings (154,274) 94,259
3,466 Perrigo Co 540,245 10,143
11,758 Perry Ellis International Inc 182,249 (34,499)
26,714 PetMed Express Inc 421,280 103,013
34,338 Petroleo Brasileiro SA ADR 570,011 56,861
(1,072) PG&E Corp (43,405) 128
30,787 PGT Inc 309,409 16,849
10,206 PH Glatfelter Co 282,094 11,803
770 Pharmacyclics Inc 96,250 939
11,757 PHH Corp 283,696 27,621
6,144 PHI Inc 259,584 65,280
2,945 Phillips 66 206,533 8,923
33,420 Phillips 66 Partners LP 1,076,792 3,843
(3,678) Phoenix Cos Inc/The (207,697) (59,815)
(795) Photronics Inc (6,821) (488)
1,573 PICO Holdings Inc 38,460 1,294
30,489 Pike Corp 322,574 (104,619)
18,629 Pilgrim's Pride Corp 305,702 18,443
2,867 Pinnacle Financial Partners Inc 93,493 36,611
18,175 Pinnacle Foods Inc 510,717 (3,794)
1,154 Pioneer Energy Services Corp 8,366 (195)
(1,106) Piper Jaffray Cos (41,917) (2,191)
(67,990) Pitney Bowes Inc (1,587,567) (203,985)
28,884 Plains GP Holdings LP 'A' 674,441 17,909
(406) Plantronics Inc (18,266) (24)
7,697 Platinum Underwriters Holdings Ltd 488,759 4,044
(41,556) Plexus Corp (1,685,511) (78,031)
168 Plum Creek Timber Co Inc (Reit) 7,395 (7)
(24,132) Pluristem Therapeutics Inc (79,153) (4,537)
(1,043) PLX Technology Inc (7,051) (2,140)
8,090 Ply Gem Holdings Inc 142,708 1,643
(28,303) PMC - Sierra Inc (171,516) 13,934
(7,204) PMFG Inc (55,975) (3,504)
18 Polaris Industries Inc 2,416 51
(5,361) Polycom Inc (57,121) 274
549 Polycom Inc 5,850 467
(33,942) PolyOne Corp (1,106,849) (18,106)
5,745 Polypore International Inc 214,920 5,251
(4,878) Polypore International Inc (182,486) 18,947
(4,409) Pool Corp (249,990) (9,171)
907 Popular Inc 25,949 172
2,740 Portola Pharmaceuticals Inc 66,856 550
7,166 Post Holdings Inc 365,466 62,055
(63) Powell Industries Inc (4,368) (1,082)
5,085 Power Integrations Inc 273,853 (3,785)
(100) Power Solutions International Inc (7,500) (3,025)
6,562 Pozen Inc 51,971 7,187
2,590 PPG Industries Inc 479,746 1,147
(5,700) PPL Corp (175,047) 2,109
3,797 Precision Castparts Corp 990,068 28,373
Contracts For Difference as at 30 November 2013
United States continued United States continued

Holding DescriptionMarket Value
USD
Unrealisedappreciation/
(depreciation)USD Holding Description
Market ValueUSD
Unrealisedappreciation/
(depreciation)USD
Unaudited Interim Report and Accounts 39
The notes on pages 150 to 158 form an integral part of these financial statements.
BlackRock Americas Diversified Equity Absolute Return Fund continued
(31,071) Precision Drilling Corp (290,203) 24,551
6,713 Preferred Bank/Los Angeles CA 135,670 7,241
(1,376) Preformed Line Products Co (96,444) 6,240
21,710 Premier Exhibitions Inc 25,618 (24,934)
32,957 Premiere Global Services Inc 308,148 (26,348)
35,870 Prestige Brands Holdings Inc 1,256,885 49,841
11,080 PRGX Global Inc 72,906 (8,618)
884 priceline.com Inc 1,056,946 48,557
(2,488) Pricesmart Inc (312,642) (22,536)
(13,037) PrivateBancorp Inc (360,212) (35,137)
3,305 ProAssurance Corp 159,466 5,453
(28,844) Procera Networks Inc (439,871) (55,943)
(28,834) Progenics Pharmaceuticals Inc (147,630) (8,545)
23,158 Progress Software Corp 610,445 48,837
(52,840) Progressive Corp/The (1,486,389) (38,573)
(3,691) Proofpoint Inc (114,089) (1,542)
(30,695) Protalix BioTherapeutics Inc (116,334) 18,856
1,241 Prothena Corp Plc 34,115 12,643
(274) Proto Labs Inc (20,339) 1,387
295 Providence Service Corp/The 8,095 3,651
60,762 Provident Financial Holdings Inc 893,201 (120,578)
(3,762) Provident Financial Services Inc (73,923) (12,559)
21,613 PS Business Parks Inc (Reit) 1,695,756 177,624
6,870 PTC Inc 224,992 2,611
(25,735) PTC Inc (842,821) (49,136)
300 PTC Therapeutics Inc 4,674 (313)
19,553 PTGi Holding Inc 48,882 (41,712)
(6,074) Public Service Enterprise Group Inc (200,260) 6,742
(10,585) PulteGroup Inc (199,104) (6,013)
8,180 PulteGroup Inc 153,866 12,201
1,251 Puma Biotechnology Inc 61,399 8,309
(51,946) Pure Cycle Corp (367,258) (82,863)
(18,289) PVH Corp (2,443,228) (64,034)
15,695 QAD Inc 'A' 263,519 42,776
(30,146) QEP Resources Inc (968,290) 10,521
(34,295) QIAGEN NV (806,275) 33,412
36,254 Qlik Technologies Inc 893,661 (77,248)
21,392 QLogic Corp 260,982 58,847
(81,698) QLogic Corp (996,716) (82,581)
233 QTS Realty Trust Inc 'A' (Reit) 4,797 24
550 Quad/Graphics Inc 14,470 556
10,020 QUALCOMM Inc 738,574 15,531
(44,865) Quality Systems Inc (1,047,149) (18,200)
(5,362) Quanex Building Products Corp (95,712) (2,636)
9,460 Quanta Services Inc 279,732 (4,257)
12,475 Quest Diagnostics Inc 764,468 (2,975)
(10,157) Questar Corp (229,040) 4,164
(7,973) Questcor Pharmaceuticals Inc (464,029) 37,398
1,972 Questcor Pharmaceuticals Inc 114,770 (6,093)
(2,110) Quicksilver Resources Inc (6,119) (1,266)
10,918 Quidel Corp 277,317 3,717
(54,217) Quiksilver Inc (481,447) (124,173)
23,953 QuinStreet Inc 209,589 (12,565)
2,880 Quintiles Transnational Holdings Inc 125,280 (1,382)
(5,106) Rackspace Hosting Inc (190,199) 25,326
(31,737) Radian Group Inc (455,109) (82,114)
(48,178) RadioShack Corp (138,753) 11,206
(1,408) Rally Software Development Corp (33,862) 2,308
1,183 Ralph Lauren Corp 206,410 (1,680)
(22,772) Rambus Inc (196,295) (54,674)
(3,170) Range Resources Corp (246,087) (6,122)
(21,724) Raptor Pharmaceutical Corp (303,919) (110,518)
6,742 Raytheon Co 600,982 26,024
3,132 RBC Bearings Inc 215,920 4,947
(1,178) RBC Bearings Inc (81,211) (2,997)
249 RE/MAX Holdings Inc 'A' 7,624 228
18,354 RealD Inc 163,534 (112,031)
9,016 Realogy Holdings Corp 427,268 16,319
(347) Realogy Holdings Corp (16,444) (27)
(472) RealPage Inc (10,620) 699
2,853 Receptos Inc 66,475 2,912
16,061 Red Lion Hotels Corp 91,066 (11,080)
(18,904) Redwood Trust Inc (Reit) (355,395) 11,097
33,190 Regal Entertainment Group 'A' 646,541 28
(266) Regal-Beloit Corp (19,769) (45)
307 Regeneron Pharmaceuticals Inc 90,347 4,444
(51,041) Regis Corp (821,250) 55,586
14,191 Regulus Therapeutics Inc 88,836 6,261
(3,686) Reinsurance Group of America Inc (276,450) (1,655)
(40,761) Reis Inc (709,649) 3,627
14,717 Reliance Steel & Aluminum Co 1,083,171 (19,795)
1,721 Remy International Inc 39,996 8,350
1,010 RenaissanceRe Holdings Ltd 96,162 1,447
2,323 Renewable Energy Group Inc 26,413 (7,224)
9,077 Rent-A-Center Inc/TX 309,435 (46,292)
(79,352) Rentech Inc (143,627) 25,700
(4,608) Rentrak Corp (183,951) (80,396)
15,889 Repligen Corp 214,978 73,402
(3,911) Repros Therapeutics Inc (66,995) (7,561)
19,909 Republic Airways Holdings Inc 221,388 36,485
(1,183) Republic Bancorp Inc/KY 'A' (29,528) 2,229
(836) Resolute Forest Products Inc (13,526) (640)
3,048 Resolute Forest Products Inc 49,317 9,583
(898) Resource America Inc 'A' (8,441) (2,487)
12,460 Resource Capital Corp (Reit) 74,760 (4,831)
44,383 Resources Connection Inc 625,356 99,885
10,996 Responsys Inc 185,063 107,981
(2,754) Restoration Hardware Holdings Inc (207,657) (565)
10,061 Retail Opportunity Investments Corp 146,891 1,944
4,505 Retail Properties of America 'A' (Reit) 59,826 (2,748)
(40,273) Retail Properties of America
Inc 'A' (Reit) (534,825) 25,007
306 RetailMeNot Inc 8,764 (1,636)
9,622 Revett Minerals Inc 6,062 (24,333)
(8,802) Revlon Inc 'A' (235,630) (19,125)
(5,000) Revolution Lighting Technologies Inc (14,800) 4,433
22,636 REX American Resources Corp 727,747 201,622
(2,390) Rex Energy Corp (45,099) (6,054)
6,577 Reynolds American Inc 332,138 (13,286)
19,715 RF Micro Devices Inc 103,602 4,888
(30,560) Richardson Electronics
Ltd/United States (345,634) 12,101
407 RigNet Inc 17,302 1,722
662 RingCentral Inc 'A' 10,632 (1,005)
(25,241) Riverbed Technology Inc (436,164) 13,982
(3,123) RLI Corp (315,985) (22,179)
39,541 RLJ Lodging Trust (Reit) 951,752 (16,741)
46,596 Robert Half International Inc 1,804,197 3,878
194 Rock Tenn Co 'A' 18,366 (749)
3,402 Rocket Fuel Inc 166,018 5,418
(56,115) Rockwell Collins Inc (4,108,740) (157,313)
15,079 Rockwood Holdings Inc 1,038,642 33,676
(4,142) Rogers Corp (259,372) (9,031)
6,617 Rollins Inc 187,195 3,176
(521) Roma Financial Corp (10,368) (5,924)
(5,009) Rosetta Resources Inc (253,305) 20,998
7,289 Rosetta Stone Inc 84,042 (27,169)
30,291 Roundy's Inc 262,623 125,048
(3,884) Rouse Properties Inc (Reit) (95,546) (18,089)
17,093 Rovi Corp 312,118 14,145
3,265 Rowan Cos Plc 'A' 113,100 (278)
3,752 Royal Caribbean Cruises Ltd 166,964 795
Contracts For Difference as at 30 November 2013
United States continued United States continued

Holding DescriptionMarket Value
USD
Unrealisedappreciation/
(depreciation)USD Holding Description
Market ValueUSD
Unrealisedappreciation/
(depreciation)USD
40 BlackRock Strategic Funds (BSF)
BlackRock Americas Diversified Equity Absolute Return Fund continued
(644) Royal Gold Inc (29,135) 1,224
5,363 RPC Inc 95,622 (2,875)
37,824 RPX Corp 617,288 152,719
10,145 RR Donnelley & Sons Co 187,480 13,387
88,728 RTI Surgical Inc 266,184 (62,076)
(29,773) Rubicon Technology Inc (298,921) (90,119)
(3,270) Ruby Tuesday Inc (22,955) 780
(894) Ruckus Wireless Inc (11,416) 1,556
9,324 Ruckus Wireless Inc 119,067 (2,971)
(16,451) Rudolph Technologies Inc (185,403) 1,733
(16,034) Rush Enterprises Inc 'A' (468,834) (83,989)
4,973 Ruth's Hospitality Group Inc 70,517 4,794
11,536 Ryder System Inc 804,751 214,821
4,028 Ryman Hospitality Properties (Reit) 169,257 23,640
(4,235) S&T Bancorp Inc (111,169) (36,419)
(5,780) Safeguard Scientifics Inc (108,491) (17,242)
958 Safety Insurance Group Inc 54,261 6,784
(3,293) Saga Communications Inc 'A' (168,602) (17,647)
3,003 Saia Inc 103,664 38,896
27,387 Salem Communications Corp 'A' 248,400 34,145
30,928 Salesforce.com Inc 1,597,431 (79,568)
(160) Salix Pharmaceuticals Ltd (13,613) 18
2,901 Sanchez Energy Corp 74,730 (7,908)
(266) Sanchez Energy Corp (6,852) (487)
(2,616) SanDisk Corp (177,940) 5,310
(34,251) SandRidge Energy Inc (190,778) 19,248
10,525 Sanmina Corp 162,190 (7,408)
62,911 Sapiens International Corp NV 434,086 136,885
12,811 Sarepta Therapeutics Inc 233,160 68,141
(2,222) Sarepta Therapeutics Inc (40,440) 53,423
151 Saul Centers Inc (Reit) 7,372 233
5,444 ScanSources Inc 227,178 49,904
(1,162) Schawk Inc (17,151) 1,686
13,909 Schlumberger Ltd 1,235,954 (22,817)
(17,338) Scholastic Corp (530,543) (13,580)
16,265 Schweitzer-Mauduit International Inc 838,949 (14,002)
94,310 Sciclone Pharmaceuticals Inc 467,778 39,289
3,478 Science Applications International 129,451 8,434
(1) Science Applications International (37) (37)
(46,326) Scientific Games Corp 'A' (839,427) (6,887)
(8,984) SciQuest Inc (252,001) (57,269)
1,663 Scotts Miracle-Gro Co/The 'A' 98,084 1,478
127 Scripps Networks Interactive Inc 'A' 9,507 36
67 Seaboard Corp 190,194 6,882
2,265 Seachange International Inc 33,930 3,567
51,237 Seacoast Banking Corp of Florida 115,796 1,533
4,463 Sealed Air Corp 143,619 2,008
(59) Sears Canada Inc (1,062) (289)
(3,600) Sears Holdings Corp (227,268) 1,608
11,757 Sears Hometown and Outlet Stores Inc 372,814 (66,048)
620 Seattle Genetics Inc 25,476 175
1,195 SeaWorld Entertainment Inc 35,432 (2,211)
13,169 SEI Investments Co 445,902 1,238
(6,111) Select Comfort Corp (129,553) 9,575
(14,113) Select Income (Reit) (388,108) (25,376)
(498) Selective Insurance Group Inc (13,984) (2,445)
1,401 SemGroup Corp 'A' 86,288 5,718
(2,021) Sempra Energy (179,141) 4,947
(642) Seneca Foods Corp 'A' (19,498) 30
(53,760) Senior Housing Properties Trust (Reit) (1,225,190) 44,192
2,944 Sensata Technologies Holding NV 114,963 4,044
(2,429) Sensient Technologies Corp (120,600) 1,039
(11,961) Sequenom Inc (31,816) 21,514
41,497 Service Corp International/US 751,926 10,015
(15,138) ServiceNow Inc (817,149) (3,339)
(1,616) ServiceSource International Inc (15,691) 3,841
(916) Sherwin-Williams Co/The (168,581) 1,682
(1,580) SI Financial Group Inc (18,486) (997)
5,474 Sigma Designs Inc 31,257 4,831
(50,547) Silgan Holdings Inc (2,367,621) (71,509)
(5,402) Silicon Graphics International Corp (69,686) 7,878
2,745 Silicon Image Inc 14,905 (114)
(10,765) Silicon Laboratories Inc (420,696) 29,973
(1) Silver Bay Realty Trust Corp (Reit) (16) (1)
723 Silver Spring Networks Inc 14,453 955
800 Simmons First National Corp 'A' 27,960 1,047
2,705 Simon Property Group Inc (Reit) 408,969 (3,206)
4,036 Simplicity Bancorp Inc 63,769 2,997
(5,749) Simpson Manufacturing Co Inc (209,666) (22,772)
(4,820) Sirius XM Holdings Inc (18,003) (1,694)
12,895 Sirona Dental Systems Inc 885,113 (43,050)
29,314 Six Flags Entertainment Corp 1,101,327 (1,019)
(1,629) SJW Corp (44,928) (3,691)
11,452 Skyworks Solutions Inc 305,883 8,952
(634) SL Green Realty Corp (Reit) (57,675) 828
777 SL Industries Inc 22,727 12,375
(3,072) SM Energy Co (270,828) 2,827
6,292 SM Energy Co 554,703 (20,567)
(2,279) Snyders-Lance Inc (66,729) (1,057)
(23,009) Sociedad Quimica y Minera
de Chile SA ADR (579,597) 47,011
6,506 SodaStream International Ltd 376,242 14,091
(12,498) Solar Capital Ltd (288,079) (10,535)
(2,971) Solar Senior Capital Ltd (53,805) 125
(1,204) SolarCity Corp (59,755) (4,405)
4,946 SolarCity Corp 245,470 (9,549)
3,711 SolarWinds Inc 123,910 3,911
(22,769) Solazyme Inc (193,309) (12,470)
(27,598) Solera Holdings Inc (1,843,546) (22,802)
26,415 Solta Medical Inc 52,830 118
(153,099) Sonus Networks Inc (447,049) (50,716)
(3,785) Sotheby's (196,328) (10,820)
(22,484) South Jersey Industries Inc (1,287,434) 44,198
(34,596) Southern Co/The (1,412,555) 55,008
25,870 Southern Copper Corp 653,217 (47,469)
8,280 Southside Bancshares Inc 234,407 64,903
28,764 Southwest Gas Corp 1,531,683 118,754
(2,252) Southwest Gas Corp (119,919) (782)
(1,110) Southwestern Energy Co (43,090) (2,608)
27,633 Sovran Self Storage Inc 1,850,029 15,829
25,193 Spansion Inc 'A' 313,653 18,969
3,646 Spark Networks Inc 21,183 (590)
(1,455) Spartan Motors Inc (9,850) (1,011)
457 Spartan Stores Inc 10,488 (48)
3,412 Spectranetics Corp 79,602 16,484
(11,377) Spectrum Brands Holdings Inc (805,150) (68,799)
(5,139) Spectrum Pharmaceuticals Inc (49,797) (11,175)
(124,696) Speed Commerce Inc (486,314) (82,132)
13,553 Speedway Motorsports Inc 275,804 39,399
50,507 Spirit Aerosystems Holdings Inc 'A' 1,647,033 285,147
1,378 Spirit Airlines Inc 64,077 2,719
(26,961) Spirit Realty Capital Inc (Reit) (268,801) 8,753
443 Splunk Inc 32,095 4,036
6,353 Springleaf Holdings Inc 134,811 7,642
(173,490) Sprint Corp (1,505,893) (210,219)
(618) SPS Commerce Inc (40,961) 1,989
134 SPS Commerce Inc 8,882 727
(6,609) SPX Corp (619,065) 6,756
2,602 SS&C Technologies Holdings Inc 112,927 8,240
715 Stamps.com Inc 33,083 1,242
(21,120) Standard Parking Corp (513,638) (58,769)
2,535 Stanley Black & Decker Inc 204,955 (4,538)
Contracts For Difference as at 30 November 2013
United States continued United States continued

Holding DescriptionMarket Value
USD
Unrealisedappreciation/
(depreciation)USD Holding Description
Market ValueUSD
Unrealisedappreciation/
(depreciation)USD
Unaudited Interim Report and Accounts 41
The notes on pages 150 to 158 form an integral part of these financial statements.
BlackRock Americas Diversified Equity Absolute Return Fund continued
(26,519) Star Scientific Inc (34,210) 17,671
3,743 Starbucks Corp 307,525 3,631
8,351 Starwood Hotels & Resorts
Worldwide Inc 624,905 3,997
(27,809) Starwood Property Trust Inc (Reit) (774,759) (36,845)
788 Starz 'A' 22,222 5,813
(52,622) State Auto Financial Corp (1,142,424) (332,126)
11,806 State Bank Financial Corp 206,251 3,757
8,372 Steel Dynamics Inc 152,370 574
2,990 Steiner Leisure Ltd 179,789 10,328
6,329 StellarOne Corp 159,744 62,315
168 Stemline Therapeutics Inc 3,410 (1,325)
(542) Stepan Co (34,395) (3,524)
2,544 STERIS Corp 118,016 3,809
(60,683) Sterling Bancorp/DE (801,016) (158,878)
(8,646) Sterling Construction Co Inc (103,666) (20,039)
6,734 Sterling Financial Corp/WA 219,326 63,630
(7,207) Steven Madden Ltd (281,505) (8,667)
254 Stewart Information Services Corp 8,186 338
(19,814) Stifel Financial Corp (899,556) (23,601)
1,541 Stillwater Mining Co 17,444 108
778 Stock Building Supply Holdings Inc 14,611 2,706
2,619 Stone Energy Corp 85,432 38,123
(7,400) Stone Energy Corp (241,388) 6,010
3,961 Stonegate Mortgage Corp 67,297 1,652
16,327 Stoneridge Inc 207,516 78,027
64,243 STR Holdings Inc 119,492 (27,509)
5,207 Straight Path Communications Inc 'B' 36,709 36,709
1,662 Stratasys Ltd 195,950 7,213
(4,604) Strayer Education Inc (171,315) 59,112
433 Sturm Ruger & Co Inc 33,432 (132)
10,636 Sucampo Pharmaceuticals Inc 'A' 82,110 9,354
(2,236) Summit Hotel Properties Inc (Reit) (20,370) 2,811
(38,299) Sun Bancorp Inc/NJ (137,110) (4,823)
4,380 Sun Communities Inc (Reit) 179,974 (19,460)
(712) Sun Communities Inc (Reit) (29,256) 2,132
(1,283) Sun Hydraulics Corp (55,195) (3,940)
7,333 SunCoke Energy Inc 166,679 18,178
(7,764) Sunedison Inc (100,544) (36,440)
9,895 SunPower Corp 297,938 1,279
5,696 SunTrust Banks Inc 208,075 3,838
274 Superior Industries International Inc 5,283 448
(16,957) Supernus Pharmaceuticals Inc (121,243) (9,982)
6,068 Supertex Inc 157,647 4,609
13,809 support.com Inc 55,236 (13,007)
39,796 SurModics Inc 951,920 (83,058)
(4,594) Susser Holdings Corp (300,677) (70,323)
3,421 SVB Financial Group 348,429 13,582
4,630 Swift Energy Co 60,792 217
1,053 Swift Transportation Co 24,472 6,224
7,531 SWS Group Inc 49,027 11,323
(11,394) SY Bancorp Inc (377,483) (90,500)
72,126 Sycamore Networks Inc 33,539 (151,939)
179 Sykes Enterprises Inc 3,890 225
322 Symetra Financial Corp 6,150 202
50,340 Symmetry Medical Inc 493,835 (45,155)
42,398 Synacor Inc 118,290 (23,796)
125 Synageva BioPharma Corp 7,500 778
(3,800) Synageva BioPharma Corp (228,000) (41,205)
9,442 Synaptics Inc 475,782 104,416
(2,728) Synaptics Inc (137,464) (6,965)
8,987 Synchronoss Technologies Inc 281,563 (9,052)
(785) Synchronoss Technologies Inc (24,594) 4,537
(1,779) Synergy Pharmaceuticals Inc (8,094) (815)
(15,146) Synopsys Inc (555,404) (1,666)
26,660 Synovus Financial Corp 93,843 5,169
(2,626) Synta Pharmaceuticals Corp (13,366) 12,447
15,097 Syntel Inc 1,349,219 45,150
(43,880) Synutra International Inc (391,848) (161,290)
18,983 Sypris Solutions Inc 51,064 (27,365)
(3,849) Sysco Corp (131,135) (1,712)
2,209 Systemax Inc 25,227 4,551
20,186 T-Mobile USA Inc 521,001 (25,679)
3,209 Tableau Software Inc 'A' 210,189 10,109
(613) Tableau Software Inc 'A' (40,152) (3,632)
(2,405) Tahoe Resources Inc (43,117) 2,482
55,669 Take-Two Interactive Software Inc 906,848 (53,489)
(29,066) TAL International Group Inc (1,594,270) (173,119)
(41,325) Tanger Factory Outlet Centers (Reit) (1,365,378) 53,862
(6,385) Tangoe Inc (100,500) (19,473)
5,181 Targa Resources Corp 424,013 15,398
23,955 Targacept Inc 134,148 11,257
4,107 Target Corp 264,984 (9,734)
(4,206) Target Corp (271,371) (239)
23,414 Taser International Inc 411,150 230,375
(8,825) TCF Financial Corp (138,817) (2,137)
16,964 TCP Capital Corp 294,325 40,364
2,141 TD Ameritrade Holding Corp 61,789 3,138
(132) Team Inc (5,391) (493)
(18,931) TearLab Corp (175,112) (42,103)
28,293 Tech Data Corp 1,465,860 75,325
2,534 TechTarget Inc 15,432 2,686
25,157 TECO Energy Inc 430,939 (7,296)
(17,536) Tecumseh Products Co 'A' (156,421) 18,408
(58,890) Teekay Corp (2,605,294) (77,714)
(38,270) Teekay Offshore Partners LP (1,237,269) 41,121
10,463 Tejon Ranch Co 376,668 32,389
1,465 Tejon Ranch Co (Warrants) 7,618 7,618
(28) Teledyne Technologies Inc (2,614) (112)
(1,054) Teleflex Inc (104,283) (3,955)
(17,970) Telefonica Brasil SA (345,204) 4,006
63,826 Telenav Inc 451,250 52,786
47,466 Telephone & Data Systems Inc 1,319,080 (84,374)
6,018 TeleTech Holdings Inc 155,926 22,433
336 TELUS Corp 11,918 94
(20,777) Tempur-Pedic International Inc (1,054,225) (110,441)
(1,979) Tennant Co (128,932) (7,191)
(2,777) Tenneco Inc (160,094) (2,957)
(377) Territorial Bancorp Inc (8,897) (282)
(5,263) TESARO Inc (206,783) (614)
1,517 Tesco Corp 27,078 8,501
(1,196) Tesla Motors Inc (154,786) (15,352)
2,694 Tesoro Corp 158,488 11,584
(14,321) Tessco Technologies Inc (564,247) (93,172)
88,983 Tessera Technologies Inc 1,801,906 39,085
(12,870) Tetra Tech Inc (368,468) (28,337)
1,042 TETRA Technologies Inc 12,764 238
16,824 Tetraphase Pharmaceuticals Inc 202,224 64,053
7,399 Texas Capital Bancshares Inc 415,232 92,292
(8,026) Texas Industries Inc (467,274) 58,516
(7,720) Textainer Group Holdings Ltd (301,080) (16,120)
(6,269) TG Therapeutics Inc (28,273) 9,644
(16,800) TherapeuticsMD Inc (79,800) (42,400)
(2,922) Theravance Inc (109,867) (13,674)
2,413 Theravance Inc 90,729 1,263
(7,843) Thermon Group Holdings Inc (224,467) (56,573)
58,291 Third Point Reinsurance Ltd 984,535 119,209
(36,125) Thomson Reuters Corp (1,364,080) 20,255
4,803 Thor Industries Inc 261,715 6,903
15,846 Thoratec Corp 624,332 55,242
13,870 Threshold Pharmaceuticals Inc 67,547 4,783
32,050 TIBCO Software Inc 779,776 13,651
Contracts For Difference as at 30 November 2013
United States continued United States continued
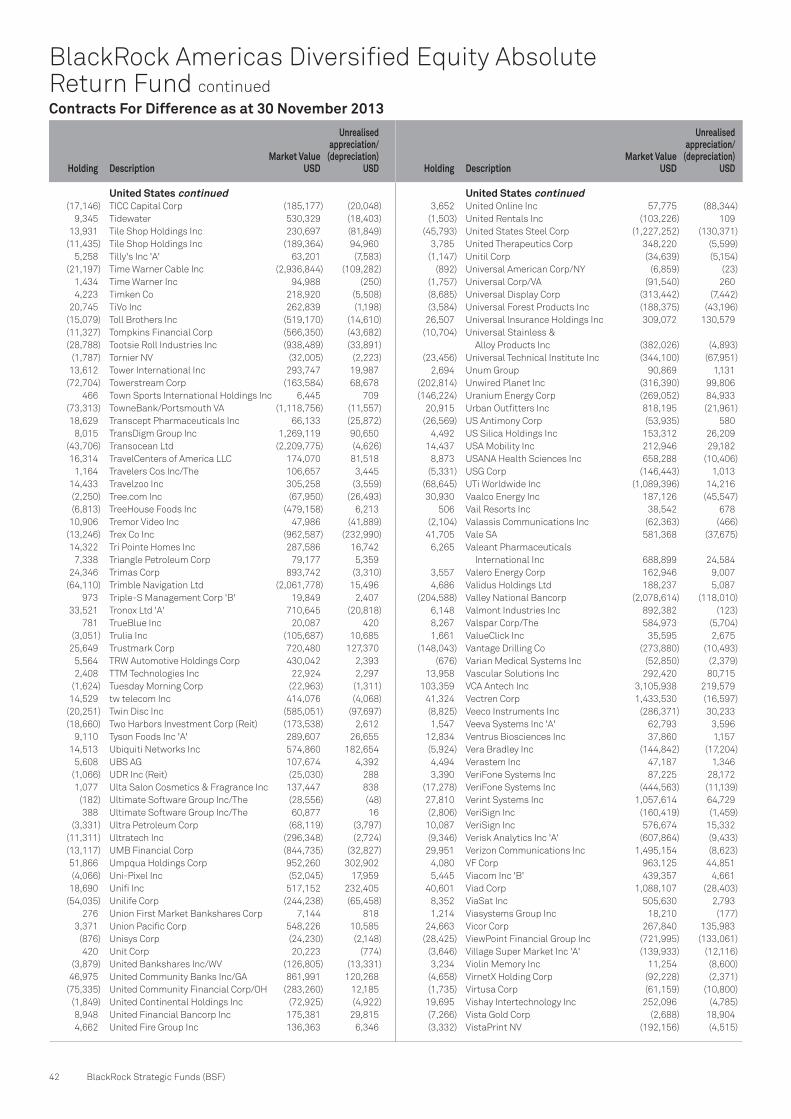
Holding DescriptionMarket Value
USD
Unrealisedappreciation/
(depreciation)USD Holding Description
Market ValueUSD
Unrealisedappreciation/
(depreciation)USD
42 BlackRock Strategic Funds (BSF)
BlackRock Americas Diversified Equity Absolute Return Fund continued
(17,146) TICC Capital Corp (185,177) (20,048)
9,345 Tidewater 530,329 (18,403)
13,931 Tile Shop Holdings Inc 230,697 (81,849)
(11,435) Tile Shop Holdings Inc (189,364) 94,960
5,258 Tilly's Inc 'A' 63,201 (7,583)
(21,197) Time Warner Cable Inc (2,936,844) (109,282)
1,434 Time Warner Inc 94,988 (250)
4,223 Timken Co 218,920 (5,508)
20,745 TiVo Inc 262,839 (1,198)
(15,079) Toll Brothers Inc (519,170) (14,610)
(11,327) Tompkins Financial Corp (566,350) (43,682)
(28,788) Tootsie Roll Industries Inc (938,489) (33,891)
(1,787) Tornier NV (32,005) (2,223)
13,612 Tower International Inc 293,747 19,987
(72,704) Towerstream Corp (163,584) 68,678
466 Town Sports International Holdings Inc 6,445 709
(73,313) TowneBank/Portsmouth VA (1,118,756) (11,557)
18,629 Transcept Pharmaceuticals Inc 66,133 (25,872)
8,015 TransDigm Group Inc 1,269,119 90,650
(43,706) Transocean Ltd (2,209,775) (4,626)
16,314 TravelCenters of America LLC 174,070 81,518
1,164 Travelers Cos Inc/The 106,657 3,445
14,433 Travelzoo Inc 305,258 (3,559)
(2,250) Tree.com Inc (67,950) (26,493)
(6,813) TreeHouse Foods Inc (479,158) 6,213
10,906 Tremor Video Inc 47,986 (41,889)
(13,246) Trex Co Inc (962,587) (232,990)
14,322 Tri Pointe Homes Inc 287,586 16,742
7,338 Triangle Petroleum Corp 79,177 5,359
24,346 Trimas Corp 893,742 (3,310)
(64,110) Trimble Navigation Ltd (2,061,778) 15,496
973 Triple-S Management Corp 'B' 19,849 2,407
33,521 Tronox Ltd 'A' 710,645 (20,818)
781 TrueBlue Inc 20,087 420
(3,051) Trulia Inc (105,687) 10,685
25,649 Trustmark Corp 720,480 127,370
5,564 TRW Automotive Holdings Corp 430,042 2,393
2,408 TTM Technologies Inc 22,924 2,297
(1,624) Tuesday Morning Corp (22,963) (1,311)
14,529 tw telecom Inc 414,076 (4,068)
(20,251) Twin Disc Inc (585,051) (97,697)
(18,660) Two Harbors Investment Corp (Reit) (173,538) 2,612
9,110 Tyson Foods Inc 'A' 289,607 26,655
14,513 Ubiquiti Networks Inc 574,860 182,654
5,608 UBS AG 107,674 4,392
(1,066) UDR Inc (Reit) (25,030) 288
1,077 Ulta Salon Cosmetics & Fragrance Inc 137,447 838
(182) Ultimate Software Group Inc/The (28,556) (48)
388 Ultimate Software Group Inc/The 60,877 16
(3,331) Ultra Petroleum Corp (68,119) (3,797)
(11,311) Ultratech Inc (296,348) (2,724)
(13,117) UMB Financial Corp (844,735) (32,827)
51,866 Umpqua Holdings Corp 952,260 302,902
(4,066) Uni-Pixel Inc (52,045) 17,959
18,690 Unifi Inc 517,152 232,405
(54,035) Unilife Corp (244,238) (65,458)
276 Union First Market Bankshares Corp 7,144 818
3,371 Union Pacific Corp 548,226 10,585
(876) Unisys Corp (24,230) (2,148)
420 Unit Corp 20,223 (774)
(3,879) United Bankshares Inc/WV (126,805) (13,331)
46,975 United Community Banks Inc/GA 861,991 120,268
(75,335) United Community Financial Corp/OH (283,260) 12,185
(1,849) United Continental Holdings Inc (72,925) (4,922)
8,948 United Financial Bancorp Inc 175,381 29,815
4,662 United Fire Group Inc 136,363 6,346
3,652 United Online Inc 57,775 (88,344)
(1,503) United Rentals Inc (103,226) 109
(45,793) United States Steel Corp (1,227,252) (130,371)
3,785 United Therapeutics Corp 348,220 (5,599)
(1,147) Unitil Corp (34,639) (5,154)
(892) Universal American Corp/NY (6,859) (23)
(1,757) Universal Corp/VA (91,540) 260
(8,685) Universal Display Corp (313,442) (7,442)
(3,584) Universal Forest Products Inc (188,375) (43,196)
26,507 Universal Insurance Holdings Inc 309,072 130,579
(10,704) Universal Stainless &
Alloy Products Inc (382,026) (4,893)
(23,456) Universal Technical Institute Inc (344,100) (67,951)
2,694 Unum Group 90,869 1,131
(202,814) Unwired Planet Inc (316,390) 99,806
(146,224) Uranium Energy Corp (269,052) 84,933
20,915 Urban Outfitters Inc 818,195 (21,961)
(26,569) US Antimony Corp (53,935) 580
4,492 US Silica Holdings Inc 153,312 26,209
14,437 USA Mobility Inc 212,946 29,182
8,873 USANA Health Sciences Inc 658,288 (10,406)
(5,331) USG Corp (146,443) 1,013
(68,645) UTi Worldwide Inc (1,089,396) 14,216
30,930 Vaalco Energy Inc 187,126 (45,547)
506 Vail Resorts Inc 38,542 678
(2,104) Valassis Communications Inc (62,363) (466)
41,705 Vale SA 581,368 (37,675)
6,265 Valeant Pharmaceuticals
International Inc 688,899 24,584
3,557 Valero Energy Corp 162,946 9,007
4,686 Validus Holdings Ltd 188,237 5,087
(204,588) Valley National Bancorp (2,078,614) (118,010)
6,148 Valmont Industries Inc 892,382 (123)
8,267 Valspar Corp/The 584,973 (5,704)
1,661 ValueClick Inc 35,595 2,675
(148,043) Vantage Drilling Co (273,880) (10,493)
(676) Varian Medical Systems Inc (52,850) (2,379)
13,958 Vascular Solutions Inc 292,420 80,715
103,359 VCA Antech Inc 3,105,938 219,579
41,324 Vectren Corp 1,433,530 (16,597)
(8,825) Veeco Instruments Inc (286,371) 30,233
1,547 Veeva Systems Inc 'A' 62,793 3,596
12,834 Ventrus Biosciences Inc 37,860 1,157
(5,924) Vera Bradley Inc (144,842) (17,204)
4,494 Verastem Inc 47,187 1,346
3,390 VeriFone Systems Inc 87,225 28,172
(17,278) VeriFone Systems Inc (444,563) (11,139)
27,810 Verint Systems Inc 1,057,614 64,729
(2,806) VeriSign Inc (160,419) (1,459)
10,087 VeriSign Inc 576,674 15,332
(9,346) Verisk Analytics Inc 'A' (607,864) (9,433)
29,951 Verizon Communications Inc 1,495,154 (8,623)
4,080 VF Corp 963,125 44,851
5,445 Viacom Inc 'B' 439,357 4,661
40,601 Viad Corp 1,088,107 (28,403)
8,352 ViaSat Inc 505,630 2,793
1,214 Viasystems Group Inc 18,210 (177)
24,663 Vicor Corp 267,840 135,983
(28,425) ViewPoint Financial Group Inc (721,995) (133,061)
(3,646) Village Super Market Inc 'A' (139,933) (12,116)
3,234 Violin Memory Inc 11,254 (8,600)
(4,658) VirnetX Holding Corp (92,228) (2,371)
(1,735) Virtusa Corp (61,159) (10,800)
19,695 Vishay Intertechnology Inc 252,096 (4,785)
(7,266) Vista Gold Corp (2,688) 18,904
(3,332) VistaPrint NV (192,156) (4,515)
Contracts For Difference as at 30 November 2013
United States continued United States continued

Holding DescriptionMarket Value
USD
Unrealisedappreciation/
(depreciation)USD Holding Description
Market ValueUSD
Unrealisedappreciation/
(depreciation)USD
Note: The net unrealised appreciation attributed to these transactions is included in the Statement of Net Assets (see Note 2(d)).
Goldman Sachs and Morgan Stanley are the counterparties to these Contracts for Difference.
Unaudited Interim Report and Accounts 43
The notes on pages 150 to 158 form an integral part of these financial statements.
BlackRock Americas Diversified Equity Absolute Return Fund continued
2,934 Visteon Corp 231,933 7,980
(69,930) Vitacost.com Inc (406,993) 90,987
(9,605) Vivus Inc (96,626) 5,305
(13,503) Volcano Corp (308,273) (10,094)
25,310 Vonage Holdings Corp 83,776 (8,604)
(17,465) Vornado Realty Trust (Reit) (1,547,748) 11,860
6,046 VOXX International Corp 106,410 59,882
(29,221) Vringo Inc (94,092) (8,178)
(4,249) Vulcan Materials Co (239,729) 1,615
(604) W&T Offshore Inc (10,510) 863
1,371 WABCO Holdings Inc 121,786 2,550
(1,011) Wabtec Corp (69,911) (581)
8,121 Waddell & Reed Financial Inc 'A' 519,744 (10,881)
4,003 WageWorks Inc 232,855 17,560
(707) Wal-Mart Stores Inc (57,380) (1,372)
(5,112) Walgreen Co (303,653) 4,499
11,484 Walker & Dunlop Inc 186,960 26,582
(4,141) Walter Energy Inc (59,341) 13,044
5,017 Walter Investment Management Corp 192,101 9,947
139,727 Warren Resources Inc 442,935 50,739
(118) Washington Trust Bancorp Inc (4,309) (532)
(2,841) Waste Management Inc (129,797) (1,305)
643 Waters Corp 64,030 (120)
1,126 Watsco Inc 108,445 (129)
(76,937) Wausau Paper Corp (928,630) (37,902)
4,514 WD-40 Co 341,484 13,793
6,939 Web.com Group Inc 197,415 6,402
(27,197) WebMD Health Corp (1,044,365) (55,468)
(3,280) Weight Watchers International Inc (106,239) (679)
(482) Weis Markets Inc (24,862) (1,791)
(8,246) WellCare Health Plans Inc (616,801) (37,487)
9,083 WellPoint Inc 849,170 30,791
5,702 Wendy's Co/The 49,237 3,417
(156) WESCO International Inc (13,516) (198)
2,576 West Bancorporation Inc 41,860 7,179
5,624 West Corp 131,039 3,904
2,519 West Pharmaceutical Services Inc 126,454 9,916
(6,503) Westamerica Bancorporation (367,420) (2,171)
(1,082) Western Alliance Bancorp (25,221) (919)
(3,902) Western Digital Corp (294,562) (436)
4,115 Western Refining Inc 162,090 12,856
11,728 Western Union Co/The 196,913 726
554 Westlake Chemical Corp 62,968 (673)
(6,693) Westmoreland Coal Co (100,395) (25,279)
13,614 Westport Innovations Inc 289,570 (85,951)
3,354 Westwood Holdings Group Inc 191,178 25,627
61,498 Wet Seal Inc 'A' 208,478 11,318
(6,433) WEX Inc (643,750) (7,141)
(6,205) Weyco Group Inc (180,938) (23,371)
(512) Weyerhaeuser Co (15,416) (189)
5,117 Whirlpool Corp 784,129 12,281
127 White Mountains Insurance Group Ltd 77,081 771
42,253 WhiteWave Foods Co 'A' 902,947 (1,930)
4,349 Whiting Petroleum Corp 261,897 (18,453)
11,998 Willbros Group Inc 103,543 (3,358)
(1,545) Williams-Sonoma Inc (91,881) (4,264)
28,500 Willis Lease Finance Corp 518,985 32,685
13,756 Wilshire Bancorp Inc 146,639 43,764
(86,942) Windstram Holdings Inc (707,708) 75,117
(3,550) Winnebago Industries Inc (111,115) (36,852)
6,760 Wintrust Financial Corp 307,174 32,118
2,123 WisdomTree Investments Inc 32,397 2,774
(65,850) Wolverine World Wide Inc (2,164,621) (510,937)
(1,840) Woodward Inc (79,506) (187)
649 Workday Inc 'A' 53,341 (268)
(3,927) Workday Inc 'A' (322,760) (25,642)
(2,072) World Acceptance Corp (191,660) (4,434)
26,448 Worthington Industries Inc 1,099,972 41,259
33,579 WP Carey Inc (Reit) 2,119,506 (114,798)
(29,848) WPX Energy Inc (546,815) 2,388
(453) WR Berkley Corp (20,041) (222)
(1,319) WR Grace & Co (126,914) (2,124)
(45,318) Wright Medical Group Inc (1,366,791) (212,108)
1,884 WSFS Financial Corp 141,677 27,924
26 WW Grainger Inc 6,751 84
(5,376) Wyndham Worldwide Corp (387,126) (15,383)
(2,043) Wynn Resorts Ltd (340,139) (6,177)
(29,996) XenoPort Inc (158,979) 29,650
4,911 Xerium Technologies Inc 64,727 29,583
2,149 Xilinx Inc 95,630 2,687
15,893 XL Group Plc 513,026 14,145
2,440 XO Group Inc 36,600 16,598
(23,789) XPO Logistics Inc (542,151) (151,158)
(35,827) Xylem Inc/NY (1,248,571) (18,356)
(9,519) Yadkin Financial Corp (171,056) (24,953)
(1,305) Yahoo! Inc (48,468) (1,633)
(1,736) Yandex NV 'A' (68,867) (661)
(2,070) Yelp Inc (125,587) (51,520)
(5,093) YRC Worldwide Inc (45,837) 53,199
(34,471) Yum! Brands Inc (2,689,427) (90,008)
2,044 YuMe Inc 18,028 (3,358)
60,558 Zagg Inc 258,583 (163,699)
920 ZAIS Financial Corp 15,677 277
22,461 Zebra Technologies Corp 'A' 1,172,464 27,823
871 Zeltiq Aesthetics Inc 15,112 588
(4,011) Zillow Inc 'A' (314,342) (24,895)
(24,787) ZIOPHARM Oncology Inc (105,345) 1,576
28,252 Zoetis Inc 882,875 (25,096)
(28,970) Zogenix Inc (94,442) (48,559)
(22,924) Zoltek Cos Inc (383,289) (101,842)
(11,832) Zumiez Inc (329,403) (26,516)
(7,799) Zygo Corp (123,146) (505)
(155,092) Zynga Inc 'A' (681,629) (62,923)
(3,300,726) (392,902)
Total market value
(USD underlying exposure – USD 1,058,015,057) 1,171,503 10,036,983
Contracts For Difference as at 30 November 2013
United States continued United States continued

44 BlackRock Strategic Funds (BSF)
Swaps as at 30 November 2013
Nominal Value Description
Unrealised appreciation/
(depreciation) USD
USD 5,330 Total Return Swap (Citibank) (Fund receives 3 Month
LIBOR and pays MSCI Daily TR Net Emerging
Markets Chile USD Index) (25/7/2014) 151,036
(USD underlying exposure – USD 2,149,417) 151,036
Note: The total market value of USD 151,036 is included in the Statement of Net Assets
(see Note 2(d)).
Open Forward Foreign Exchange Transactionsas at 30 November 2013
Purchases Sales Value date
Unrealised appreciation/
(depreciation) USD
EUR 33,614,114 USD 45,000,436 13/12/2013 712,762
USD 1,324,200 EUR 981,591 13/12/2013 (10,705)
SEK 105,124,843 USD 15,782,226 13/12/2013 274,430
USD 636,136 SEK 4,219,352 13/12/2013 (8,324)
Net unrealised appreciation
(USD underlying exposure – USD 63,749,219) 968,163
Note: The net unrealised appreciation attributed to these transactions is included
in the Statement of Net Assets (see Note 2(d)).
State Street Bank and Trust Company is the counterparty to these Open Forward Foreign
Exchange Transactions.
Sector Breakdown as at 30 November 2013
% of netassets *
Government 48.27
Financial 41.73
Other Net Assets 10.00
100.00
* Based on the market value of the Portfolio of Investments
Open Exchange Traded Futures Contractsas at 30 November 2013
Number of Contracts
Contract/Description
Expirationdate
Underlying exposure
USD
Unrealisedappreciation/
(depreciation) USD
92 S&P 500 E-Mini Index December 2013 8,298,860 588,920
Total 8,298,860 588,920
Note: The net unrealised appreciation attributed to these transactions is included
in the Statement of Net Assets (see Note 2(d)).
BlackRock Americas Diversified Equity Absolute Return Fund continued

Transferable Securities and Money Market Instruments Admitted to an Official Stock Exchange Listing or Dealt in on Another Regulated Market
Transferable Securities and Money Market Instruments Admitted to an Official Stock Exchange Listing or Dealt in on Another Regulated Market
Holding Description Market Value
(USD) % Holding Description Market Value
(USD) %
Unaudited Interim Report and Accounts 45
The notes on pages 150 to 158 form an integral part of these financial statements.
BlackRock Asia Extension Fund
BONDS
Canada USD 1,000,000 Province of Ontario Canada 1.375%
27/1/2014 1,001,908 2.62
1,001,908 2.62
France USD 500,000 BNP Paribas FRN 10/1/2014 500,457 1.31
500,457 1.31
United States USD 1,000,000 Fannie Mae Discount Notes 0.00%
27/1/2014 (Zero Coupon) 999,950 2.61
USD 900,000 Fannie Mae Discount Notes 0.00%
29/1/2014 (Zero Coupon) 899,953 2.35
USD 250,000 Federal Home Loan Banks 0.12%
30/1/2014 250,028 0.65
USD 136,000 Federal National Mortgage Association
1.35% 21/3/2014 136,548 0.36
USD 1,100,000 Freddie Mac Discount Notes 0.00%
7/4/2014 (Zero Coupon) 1,099,722 2.87
USD 500,000 United States Treasury Bill 0.00%
2/1/2014 (Zero Coupon) 499,996 1.31
USD 500,000 United States Treasury Bill 0.00%
9/1/2014 (Zero Coupon) 499,996 1.31
USD 1,500,000 United States Treasury Bill 0.00%
13/2/2014 (Zero Coupon) 1,499,857 3.92
USD 1,000,000 United States Treasury Bill 0.00%
24/4/2014 (Zero Coupon) 999,630 2.61
USD 2,000,000 United States Treasury Bill 0.00%
8/5/2014 (Zero Coupon) 1,999,178 5.22
USD 1,000,000 United States Treasury Bill 0.00%
22/5/2014 (Zero Coupon) 999,529 2.61
USD 1,500,000 United States Treasury Note 0.25%
31/1/2014 1,500,498 3.92
USD 500,000 United States Treasury Note 1.875%
28/2/2014 502,236 1.31
USD 1,300,000 United States Treasury Note 1.75%
31/3/2014 1,307,134 3.41
USD 400,000 United States Treasury Note 0.25%
30/4/2014 400,242 1.04
13,594,497 35.50
Total Bonds 15,096,862 39.43
CERTIFICATES OF DEPOSIT
United States USD 500,000 Bank of America NA 0.01% 14/1/2014 500,008 1.31
USD 500,000 Bank of Tokyo-Mitsubishi UFJ Ltd/The
0.21% 28/2/2014 500,030 1.31
USD 500,000 Bank of Tokyo-Mitsubishi UFJ Ltd/The
0% 7/3/2014 501,158 1.31
USD 500,000 Credit Industriel et Commercial 0%
2/12/2013 500,026 1.31
USD 550,000 Credit Suisse AG 0.67% 9/1/2014 553,207 1.44
USD 1,200,000 Mizuho Bank Ltd 0.21% 12/12/2013 1,200,196 3.13
USD 900,000 Norinchukin Bank 0% 4/12/2013 900,028 2.35
USD 500,000 Rabobank USA Financial Corp 0.01%
27/6/2014 499,216 1.30
USD 300,000 Skandinaviska Enskilda Banken AB
0.01% 7/1/2014 300,728 0.78
USD 500,000 Sumitomo Mitsui Banking Corp
0.21% 12/2/2014 500,101 1.31
5,954,698 15.55
Total Certificates of Deposit 5,954,698 15.55
COMMERCIAL PAPER
United States USD 900,000 Antalis US Funding Corp 0.01%
3/2/2014 899,626 2.35
EUR 500,000 Atlantic Asset Secritization LLC 0%
18/12/2013 499,965 1.31
USD 500,000 Bank of Nova Scotia 0.01% 25/2/2014 499,795 1.30
USD 500,000 Barton Capital Corp 0.01% 3/2/2014 499,801 1.30
USD 295,000 BNP Paribas SA 0% 5/3/2014 294,728 0.77
USD 900,000 BPCE SA 0.01% 3/2/2014 899,642 2.35
USD 500,000 Cooperatieve Centrale 0.01% 12/3/2014 500,000 1.31
USD 500,000 Govco LLC 0.01% 11/2/2014 499,797 1.30
USD 1,000,000 ING (US) Funding LLC 0% 9/12/2013 999,955 2.61
USD 300,000 Lloyds Bank Plc 0% 27/1/2014 299,894 0.78
USD 1,000,000 Nieuw Amsterdam Receivables Corp
0% 16/1/2014 999,778 2.61
USD 500,000 Nordea Bank AB 0.01% 10/1/2014 499,866 1.31
USD 400,000 Nordea Bank AB 0% 18/2/2014 399,782 1.04
USD 420,000 Oversea-Chinese Banking Corp Ltd 0%
19/2/2014 419,811 1.10
USD 500,000 Regency Markets No.1 LLC 0.01%
16/12/2013 499,969 1.31
USD 1,000,000 Societe Generale North America Inc
0.01% 6/12/2013 999,967 2.61
USD 500,000 Sumitomo Mitsui Banking Corp
0.01% 10/1/2014 499,869 1.31
10,212,245 26.67
Total Commercial Paper 10,212,245 26.67
Total Transferable Securities and Money
Market Instruments Admitted to an
Official Stock Exchange Listing or
Dealt in on Another Regulated Market 31,263,805 81.65
Securities portfolio at market value 31,263,805 81.65
Other Net Assets 7,024,253 18.35
Total Net Assets (USD) 38,288,058 100.00
Portfolio of Investments as at 30 November 2013
United States continued

Holding DescriptionMarket Value
USD
Unrealisedappreciation/
(depreciation) USD Holding Description
Market ValueUSD
Unrealisedappreciation/
(depreciation) USD
46 BlackRock Strategic Funds (BSF)
BlackRock Asia Extension Fund continued
Hong Kong 124,000 Agricultural Bank of China Ltd 63,658 7,672
345,000 AIA Group Ltd 1,748,875 294,548
(286,000) Aluminum Corp of China Ltd (106,982) 14,398
15,000 Anhui Conch Cement Co Ltd 'H' 58,625 2,793
(45,400) ASM Pacific Technology Ltd (377,421) 100,696
1,691,000 Bank of China Ltd 817,941 66,129
58,500 BBMG Corp 'H' 51,839 7,078
168,000 BOC Hong Kong Holdings Ltd 568,834 3,095
(50,000) Champion (Reit) (22,379) 42
84,000 Cheung Kong Holdings Ltd 1,327,280 27,619
40,000 China Agri-Industries Holdings Ltd 20,432 2,052
176,000 China CITIC Bank Corp Ltd 102,839 8,092
1,125,000 China Communications
Construction Co Ltd 947,573 (71,537)
2,089,000 China Construction Bank Corp 1,692,174 86,081
(916,500) China COSCO Holdings Co Ltd (471,685) (12,231)
56,000 China Everbright Ltd 91,880 12,554
44,000 China Gas Holdings Ltd 59,592 7,925
(428,000) China High Speed Transmission
Equipment Group Co Ltd (215,306) (14,493)
600,000 China Machinery Engineering Corp 'H' 461,259 117,764
55,500 China Merchants Bank Co Ltd 'H' 118,550 14,632
4,000 China Merchants Holdings
International Co Ltd 14,885 59
188,000 China Oilfield Services Ltd 567,441 137,165
862,600 China Petroleum & Chemical Corp 741,021 118,654
544,000 China Public Procurement Ltd 30,173 (3,804)
253,000 China Railway Construction Corp Ltd 283,588 41,930
375,000 China Railway Group Ltd 'H' 215,731 31,560
74,000 China Resources Cement Holdings Ltd 53,071 4,499
(62,000) China Resources Enterprise Ltd (219,524) (16,277)
12,000 China Resources Power Holdings Co Ltd 29,038 549
118,000 China Shenhua Energy Co Ltd 400,299 (11,695)
(695,000) China Shipping Container Lines Co Ltd (187,361) (9,810)
(178,000) China Shipping Development Co Ltd (120,998) (27,435)
182,000 China Unicom Hong Kong Ltd 288,751 24,364
(78,000) China Yurun Food Group Ltd (51,311) 161
87,500 China ZhengTong Auto Services
Holdings Ltd 59,592 (442)
139,000 Chongqing Rural Commercial Bank 'H' 72,793 4,420
150,200 Chow Tai Fook Jewellery Group Ltd 232,874 19,616
(79,000) CITIC Pacific Ltd (114,128) (27,433)
277,000 CNOOC Ltd 568,099 60,370
(340,000) Comba Telecom Systems Holdings Ltd (117,095) (4,151)
(164,000) Daphne International Holdings Ltd (75,520) 39,576
(483,500) Esprit Holdings Ltd (1,006,577) (257,338)
65,000 Geely Automobile Holdings Ltd 33,537 (874)
1,310,000 GOME Electrical Appliances Holding Ltd 228,114 74,101
13,500 Greentown China Holdings Ltd 23,438 1,010
(121,000) Hang Lung Group Ltd (640,686) 6,297
(278,000) Hong Kong & China Gas Co Ltd (656,927) 6,264
(454,000) Honghua Group Ltd (159,284) (23,570)
116,000 Hutchison Whampoa Ltd 1,477,550 295,356
2,024,000 Industrial & Commercial Bank
of China Ltd 1,454,162 47,679
37,000 Jiangxi Copper Co Ltd 'H' 71,683 1,485
5,500 Kerry Logistics Network Ltd 4,682 4,682
11,000 Kerry Properties Ltd 43,417 (2,435)
56,500 Kingboard Chemical Holdings Ltd 152,679 35,411
(54,000) Kingdee International Software
Group Co Ltd (15,672) 628
(86,000) Kunlun Energy Co Ltd (159,072) 2,922
363,500 KWG Property Holding Ltd 218,493 (1,554)
(39,500) L'Occitane International SA (88,143) (1,858)
69,000 Langham Hospitality Investments Ltd 34,265 (206)
61,000 Lee & Man Paper Manufacturing Ltd 44,928 4,533
218,000 Lenovo Group Ltd 258,416 28,735
(186,250) Li Ning Co Ltd (164,083) (2,828)
10,700 Lifestyle Properties Development Ltd 2,250 2,250
22,000 Luk Fook Holdings International Ltd 81,159 6,732
(121,000) Macau Legend Development Ltd (94,581) (12,877)
3,600 Man Wah Holdings Ltd 5,925 (355)
(34,000) Melco International Development Ltd (119,945) (56,271)
520,000 MMG Ltd 122,744 (83,487)
47,000 New World Development Co Ltd 63,534 (1,442)
159,000 NWS Holdings Ltd 237,904 (4,628)
209,000 PanAsialum Holdings Co Ltd 47,177 1,477
288,000 PCCW Ltd 124,447 (5,408)
33,000 Ping An Insurance Group Co of
China Ltd 'H' 307,538 60,588
71,000 Poly Property Group Co Ltd 41,669 4,477
5,500 Power Assets Holdings Ltd 44,694 (67)
157,600 Sands China Ltd 1,193,277 177,515
(84,000) Semiconductor Manufacturing
International Corp (6,934) (243)
(88,000) Shandong Weigao Group Medical
Polymer CoLtd 'H' (120,319) (29,969)
(188,000) Shanghai Electric Group Co Ltd 'H' (67,899) (783)
59,000 Shanghai Industrial Holdings Ltd 200,530 20,302
76,000 Shenzhen Investment Ltd 29,997 (499)
65,500 Shimao Property Holdings Ltd 'H' 164,073 7,434
56,000 Sino Land Co Ltd 76,567 (14,756)
17,000 Sinopec Engineering Group Co Ltd 'H' 26,006 5,116
780,000 Sinopec Shanghai Petrochemical
Co Ltd 'H' 231,403 34,120
16,000 Sinopharm Group Co Ltd 'H' 47,674 3,871
197,000 SJM Holdings Ltd 632,721 86,915
(29,000) Sun Art Retail Group Ltd (43,017) 338
(12,100) Television Broadcasts Ltd (75,696) (2,835)
3,700 Tencent Holdings Ltd 214,000 74,306
180,000 Termbray Petro-King Oilfield
Services Ltd 95,657 4,148
214,000 Truly International Holdings 125,595 (11,940)
(38,000) Tsingtao Brewery Co Ltd (318,354) (72,653)
(332,000) Uni-President China Holdings Ltd (335,310) (32,745)
19,000 Wheelock & Co Ltd 92,516 (2,103)
352,000 Xinyi Glass Holdings Ltd 372,309 102,426
15,000 Yue Yuen Industrial Holdings Ltd 46,532 4,705
17,500 Zhaojin Mining Industry Co Ltd 'H' 11,535 (1,989)
410,000 Zhejiang Expressway Co Ltd 382,357 61,032
14,603,652 1,597,927
Indonesia 79,000 Bank Mandiri Persero Tbk PT 50,520 (1,283)
86,500 Bank Rakyat Indonesia Persero Tbk PT 53,871 (2,788)
(897,500) Bumi Resources Tbk PT (21,757) 27,848
6,812,000 Energi Mega Persada Tbk PT 37,014 (38,516)
1,000 Gudang Garam Tbk PT 3,093 40
77,000 Indocement Tunggal Prakarsa Tbk PT 121,333 (60,915)
31,000 Matahari Department Store Tbk PT 29,931 (1,193)
419,500 Perusahaan Gas Negara
Persero Tbk PT 170,079 (76,529)
2,267,500 Telekomunikasi Indonesia
Persero Tbk PT 412,273 (19,101)
856,357 (172,437)
Malaysia 4,300 Axiata Group Bhd 8,965 (484)
13,300 Berjaya Corp Bhd 2,187 (654)
44,137 Berjaya Sports Toto Bhd 53,545 (2,669)
4,800 British American Tobacco Malaysia Bhd 93,677 1,170
96,500 DiGi.Com Bhd 145,813 7,349
160,300 MISC Bhd 273,052 14,168
11,900 PPB Group Bhd 54,866 5,913
195,400 Sime Darby Bhd 585,048 5,561
Contracts For Difference as at 30 November 2013
Hong Kong continued

Holding DescriptionMarket Value
USD
Unrealisedappreciation/
(depreciation) USD Holding Description
Market ValueUSD
Unrealisedappreciation/
(depreciation) USD
Unaudited Interim Report and Accounts 47
The notes on pages 150 to 158 form an integral part of these financial statements.
BlackRock Asia Extension Fund continued
366,200 Tenaga Nasional Bhd 1,120,302 205,716
76,820 YTL Corp Bhd 38,613 596
2,376,068 236,666
Philippines 188,200 Ayala Land Inc 122,099 27,800
31,440 Jollibee Foods Corp 127,196 32,433
84,000 Metro Pacific Investments Corp 9,153 (7)
2,780 Philippine Long Distance Telephone Co 172,103 (9,889)
12,700 SM Prime Holdings Inc 4,758 (77)
64,500 Universal Robina Corp 177,550 (10,674)
612,859 39,586
Singapore 109,000 Asian Pay Television Trust 67,745 (1,026)
(495,000) Biosensors International Group Ltd (372,729) (361)
152,000 CapitaMall Trust (Reit) 235,570 (6,330)
394,000 ComfortDelGro Corp Ltd 616,900 16,811
23,000 DBS Group Holdings Ltd 314,853 26,083
(16,000) First Resources Ltd (28,558) (40)
144,000 Fraser and Neave Ltd 656,319 (216,025)
(27,000) Genting Singapore Plc (31,626) (2,818)
(4,003) Jardine Matheson Holdings Ltd (202,232) 35,160
(14,000) Jardine Strategic Holdings Ltd (448,700) 18,424
31,000 Keppel Corp Ltd 279,370 6,383
28,000 Keppel Land Ltd 78,534 (4,915)
79,000 Mapletree Greater China
Commercial Trust (Reit) 55,709 (1,711)
102,000 Mapletree Logistics Trust (Reit) 85,339 (1,367)
7,000 Noble Group Ltd 6,163 92
(61,000) Religare Health Trust (38,641) 1,844
(71,000) Thai Beverage PCL (27,438) (2,114)
97,000 UOL Group Ltd 479,976 (21,354)
(118,000) Vard Holdings Ltd (75,219) 3,930
83,000 Wilmar International Ltd 232,797 16,478
756,000 Yangzijiang Shipbuilding
Holdings Ltd 701,785 51,397
2,585,917 (81,459)
South Korea 2,260 BS Financial Group Inc 34,809 8,691
(431) CJ CheilJedang Corp (105,072) (5,967)
378 CJ Corp 37,146 (2,235)
(899) CJ Korea Express Co Ltd (77,982) (7,701)
8,038 Coway Co Ltd 502,802 138,757
607 Daelim Industrial Co Ltd 57,643 (10,329)
(27,250) Daewoo Engineering &
Construction Co Ltd (219,638) (24,668)
800 DGB Financial Group Inc 12,851 2,163
810 Display Tech Co Ltd 7,072 (97)
12,730 Dongyang Mechatronics Corp 145,548 21,916
(1,300) DuzonBizon Co Ltd (12,775) (692)
310 E-Mart Co Ltd 78,943 12,150
1,704 Eugene Technology Co Ltd 25,279 (4,701)
270 Global Display Co Ltd 5,358 (196)
2,221 Green Cross Cell Corp 55,404 (35,814)
(6,320) GS Engineering & Construction Corp (180,648) (8,561)
3,608 Hana Financial Group Inc 135,347 4,199
1,820 Hankook Tire Worldwide Co Ltd 41,102 (1,648)
3,150 Hansol Paper Co 34,527 7,977
(1,790) Hite Jinro Co Ltd (42,877) (2,345)
(267) Huons Co Ltd (9,549) (460)
1,837 Hyosung Corp 125,151 12,385
(6,610) Hyundai Development Co-Engineering
& Construction (142,718) 468
7,127 Hyundai Engineering &
Construction Co Ltd 423,593 23,740
261 Hyundai Glovis Co Ltd 58,203 984
4,130 Hyundai Hysco Co Ltd 158,246 (5,700)
(3,238) Hyundai Mipo Dockyard (552,262) (166,376)
300 Hyundai Mobis 87,026 4,464
905 Hyundai Wia Corp 162,478 25,170
690 Industrial Bank of Korea 7,465 (1,029)
1,968 Infraware Inc 21,664 3,357
5,890 KB Financial Group Inc 220,952 15,179
(283) KEPCO Engineering &
Construction Co Inc (16,285) (1,006)
13,737 Kia Motors Corp 784,007 72,289
9,940 Korea Aerospace Industries Ltd 262,988 8,109
509 Korea Zinc Co Ltd 138,516 (1,793)
11,720 Korean Reinsurance Co 126,248 (4,395)
694 LG Chem Ltd 190,501 (4,781)
2,370 LG Fashion Corp 76,925 6,242
(210) Lock & Lock Co Ltd (4,544) (208)
3,266 LOTTE Himart Co Ltd 267,563 13,592
(470) Nexen Tire Corp (6,839) (143)
964 S-1 Corp 65,129 7,085
8,139 Samsung C&T Corp 486,048 64,111
840 Samsung Card Co Ltd 30,241 999
1,374 Samsung Electronics Co Ltd 1,939,673 160,541
334 Samsung Electronics Co Ltd (Pref) 316,547 69,474
(4,455) Samsung Engineering Co Ltd (264,783) 23,148
780 Samsung Life Insurance Co Ltd 75,177 2,717
(2,269) Sapphire Technology Co Ltd (80,615) 14,825
3,860 Seah Besteel Corp 98,843 (22,458)
2,600 Shinhan Financial Group Co Ltd 109,326 12,383
3,146 SK C&C Co Ltd 402,800 83,039
6,102 SK Chemicals Co Ltd 306,743 19,646
2,398 SK Holdings Co Ltd 423,723 49,021
905 SK Innovation Co Ltd 123,141 (5,153)
11,490 SK Networks Co Ltd 81,102 7,853
5,181 Sung Kwang Bend Co Ltd 135,363 (6,821)
489 YG Entertainment Inc 22,918 919
7,185,544 572,316
Taiwan (443,000) Acer Inc (240,256) 95,923
1,000 Advantech Co Ltd 6,184 128
78,000 Asia Cement Corp 103,582 7,862
1,000 Asustek Computer Inc 8,802 535
2,000 Catcher Technology Co Ltd 12,165 1,222
70,972 Cathay Financial Holding Co Ltd 111,516 16,924
409,000 Chunghwa Picture Tubes Ltd 21,283 8,868
898,000 Compeq Manufacturing Co Ltd 520,399 93,515
(3,000) CTCI Corp (4,764) 284
(155,000) Evergreen Marine Corp Taiwan Ltd (91,657) (1,293)
296,410 Far Eastern Department Stores Ltd 302,480 (1,383)
14,000 Far Eastern New Century Corp 16,155 304
73,000 Farglory Land Development Co Ltd 129,749 (3,202)
119,000 Feng Hsin Iron & Steel Co 217,139 1,426
(34,000) Formosa Petrochemical Corp (92,715) (870)
121,000 Formosa Taffeta Co Ltd 153,325 12,701
(45,500) Foxconn Technology Co Ltd (107,931) 141
52,000 Fubon Financial Holding Co Ltd 74,326 11,328
(113,000) G Tech Optoelectronics Corp (133,642) 77,601
7,000 Giga Solar Materials Corp 79,476 9,946
67,000 Gintech Energy Corp 71,655 (228)
8,000 Global Unichip Corp 20,410 (5,179)
118,000 Highwealth Construction Corp 260,769 21,309
65,190 Hon Hai Precision Industry Co Ltd 171,819 10,932
(20,000) Hota Industrial Manufacturing Co Ltd (31,729) (304)
(6,000) Hotai Motor Co Ltd (69,744) (13,294)
(1,000) HTC Corp (5,102) 197
(399) ILI Technology Corp (724) (724)
255,000 Inotera Memories Inc 181,810 88,385
621,000 Inventec Corp 522,501 130,756
Contracts For Difference as at 30 November 2013
South Korea continued Malaysia continued

Holding DescriptionMarket Value
USD
Unrealisedappreciation/
(depreciation) USD Holding Description
Market ValueUSD
Unrealisedappreciation/
(depreciation) USD
Note: The net unrealised appreciation attributed to these transactions is included in the Statement of Net Assets (see Note 2(d)).
Bank of America Merrill Lynch, Credit Suisse and Morgan Stanley are the counterparties to these Contracts for Difference.
48 BlackRock Strategic Funds (BSF)
BlackRock Asia Extension Fund continued
2,000 Largan Precision Co Ltd 71,298 3,708
7,000 MediaTek Inc 103,129 3,620
14,000 Merida Industry Co Ltd 104,075 7,052
44,000 Motech Industries Inc 84,003 (4,404)
35,000 Neo Solar Power Corp 45,178 2,612
6,000 Parade Technologies Ltd 34,973 (9,911)
14,000 PChome Online Inc 100,764 4,476
172,000 Pou Chen Corp 223,762 12,102
30,000 President Chain Store Corp 212,881 3,436
157,000 Synnex Technology International Corp 235,813 (13,640)
150,000 Taiflex Scientific Co Ltd 310,198 (2,378)
253,000 Taiwan Cement Corp 400,522 58,494
(10,000) Taiwan Fertilizer Co Ltd (23,316) (102)
384,000 Taiwan Semiconductor
Manufacturing Co Ltd 1,362,438 96,283
176,000 Teco Electric and Machinery Co Ltd 193,282 55,663
96,000 Ton Yi Industrial Corp 100,885 959
23,000 Tong Hsing Electronic Industries Ltd 122,407 1,928
(107,000) TTY Biopharm Co Ltd (357,221) 2,973
(47,000) Unimicron Technology Corp (34,860) 3,546
30,000 Vanguard International
Semiconductor Corp 35,227 3,502
(11,000) Win Semiconductors Corp (9,255) (225)
(769,000) Winbond Electronics Corp (189,950) (8,153)
(854,000) Wintek Corp (263,466) 113,473
249,000 Wistron NeWeb Corp 595,702 11,269
(1,226,000) Yang Ming Marine Transport Corp (538,555) (6,529)
1,296,000 Yuanta Financial Holding Co Ltd 702,872 19,717
(6,000) Yulon Motor Co Ltd (9,874) (95)
3,000 Yulon Nissan Motor Co Ltd 40,447 5,224
5,860,640 928,410
Thailand 72,300 BEC World PCL 119,337 (23,860)
(34,200) Italian-Thai Development PCL (5,432) (19)
(33,700) Jasmine International PCL (8,239) 383
26,300 Kasikornbank PCL 138,421 (8,355)
48,400 Land and Houses PCL 15,676 (2,098)
21,400 PTT Global Chemical PCL 50,817 (1,034)
3,025,100 Quality Houses PCL 260,021 (27,368)
28,400 Siam Cement PCL/The 355,553 (51,191)
36,000 Siam Commercial Bank PCL/The 176,020 (35,305)
1,102,174 (148,847)
United States 2,500 Changyou.com Ltd ADR 69,025 (18,248)
17,814 Dr Reddy's Laboratories Ltd ADR 719,864 29,157
1,235 E-Commerce China Dangdang
Inc 'A' ADR 11,350 4,455
4,922 E-House China Holdings Ltd ADR 52,911 3,749
1,864 HDFC Bank Ltd ADR 61,922 (12,422)
10,395 ICICI Bank Ltd ADR 368,399 (22,697)
995 Infosys Ltd ADR 53,730 1,345
(294) KT Corp ADR (4,631) (203)
375 Philippine Long Distance Telephone Co 511 (24,389)
(32,769) ReneSola Ltd ADR (147,788) 19,031
49,035 Sesa Sterlite Ltd ADR 570,277 (20,279)
21,471 Wipro Ltd ADR 252,070 12,520
2,007,640 (27,981)
Total market value
(USD underlying exposure – USD 60,163,950) 37,190,851 2,944,181
Contracts For Difference as at 30 November 2013
Taiwan continued
Open Exchange Traded Futures Contractsas at 30 November 2013
Number of Contracts
Contract/Description
Expirationdate
Underlying exposure
USD
Unrealisedappreciation/
(depreciation) USD
(1) S&P 500 E Mini Index December 2013 90,205 (450)
98 SGX CNX Nifty Index December 2013 1,220,688 19,158
Total 1,310,893 18,708
Note: The net unrealised appreciation attributed to these transactions is included
in the Statement of Net Assets (see Note 2(d)).
Open Forward Foreign Exchange Transactionsas at 30 November 2013
Purchases Sales Value date
Unrealised appreciation/
(depreciation) USD
GBP 3,874 USD 6,154 13/12/2013 172
USD 257 GBP 160 13/12/2013 (5)
Net unrealised appreciation
(USD underlying exposure – USD 6,588) 167
Note: The net unrealised appreciation attributed to these transactions is included
in the Statement of Net Assets (see Note 2(d)).
State Street Bank and Trust Company is the counterparty to these Open Forward Foreign
Exchange Transactions.
Sector Breakdownas at 30 November 2013
% of netassets *
Financial 43.53
Government 38.12
Other Net Assets 18.35
100.00
* Based on the market value of the Portfolio of Investments

Transferable Securities and Money Market Instruments Admitted to an Official Stock Exchange Listing or Dealt in on Another Regulated Market
Transferable Securities and Money Market Instruments Admitted to an Official Stock Exchange Listing or Dealt in on Another Regulated Market
Holding Description Market Value
(USD) % Holding Description Market Value
(USD) %
1 This fund is managed by BlackRock.
Unaudited Interim Report and Accounts 49
The notes on pages 150 to 158 form an integral part of these financial statements.
BlackRock Emerging Markets Absolute Return Fund
COMMON STOCKS (SHARES)
Austria 7,493 Raiffeisen Bank International AG 276,865 1.57
276,865 1.57
Brazil 33,521 Banco Bradesco SA ADR 444,824 2.53
58,038 Cetip SA - Mercados Organizados 633,323 3.59
1,078,147 6.12
Cayman Islands 2,172 Baidu Inc ADR 358,402 2.03
358,402 2.03
Chile 26,828,784 Corpbanca SA 346,521 1.97
346,521 1.97
China 422,000 Dongfeng Motor Group Co Ltd 'H' 670,610 3.81
670,610 3.81
Cyprus 27,481 Globaltrans Investment Plc GDR 416,887 2.37
416,887 2.37
Hungary 8,497 MOL Hungarian Oil and Gas Plc 536,974 3.05
22,020 OTP Bank Plc 442,520 2.51
979,494 5.56
India 10,000 Axis Bank Ltd 185,310 1.05
8,511 Axis Bank Ltd GDR 159,496 0.91
18,476 Reliance Industries Ltd GDR '144A' 503,840 2.86
13,375 Tata Motors Ltd ADR 436,025 2.47
1,284,671 7.29
Peru 16,469 Cia de Minas Buenaventura SAA ADR 193,675 1.10
193,675 1.10
Portugal 29,734 Jeronimo Martins SGPS SA 614,841 3.49
614,841 3.49
Russia 2,260 Magnit OJSC 624,036 3.54
28,400 Sberbank of Russia ADR 352,444 2.00
162,708 VTB Bank OJSC GDR 454,850 2.58
1,431,330 8.12
South Africa 27,652 Foschini Group Ltd/The 275,637 1.56
275,637 1.56
South Korea 3,713 Gamevil Inc 153,495 0.87
1,399 Hyundai Mobis Co Ltd 405,833 2.30
9,539 Kia Motors Corp 544,416 3.09
1,103,744 6.26
Thailand 326,600 Krung Thai Bank PCL 189,186 1.07
189,186 1.07
Trinidad And Tobago 1,124,624 Dogan Sirketler Grubu Holding AS 462,510 2.62
462,510 2.62
Total Common Stocks (Shares) 9,682,520 54.94
Total Transferable Securities and Money
Market Instruments Admitted to an
Official Stock Exchange Listing or
Dealt in on Another Regulated Market 9,682,520 54.94
Funds
Ireland 1,555,435 Institutional Cash Series Plc -
Institutional US Dollar Liquidity Fund 1 1,555,435 8.82
1,555,435 8.82
Total Funds 1,555,435 8.82
Securities portfolio at market value 11,237,955 63.76
Other Net Assets 6,386,130 36.24
Total Net Assets (USD) 17,624,084 100.00
Portfolio of Investments as at 30 November 2013

Holding DescriptionMarket Value
USD
Unrealisedappreciation/
(depreciation) USD Holding Description
Market ValueUSD
Unrealisedappreciation/
(depreciation) USD
Note: The net unrealised depreciation attributed to these transactions is included in the Statement of Net Assets (see Note 2(d)).
Citibank, Credit Suisse and Deutsche Bank are the counterparties to these Contracts for Difference.
50 BlackRock Strategic Funds (BSF)
Hong Kong (37,933) Tsingtao Brewery Co Ltd H (318,526) (26,057)
(318,526) (26,057)
Poland (10,286) Bank Pekao SA (626,252) (30,872)
(73,418) PGE SA (442,842) (55,489)
(1,069,094) (86,361)
South Africa (50,489) Barloworld Ltd (469,958) (14,654)
(17,073) Imperial Holdings Ltd (354,035) (13,373)
(51,341) Woolworths Holdings Ltd/
South Africa (373,165) (36,296)
(1,197,158) (64,323)
Turkey (267,650) Eregli Demir ve Celik Fabrikalari TAS (354,090) (1,610)
(354,090) (1,610)
United Kingdom (11,649) Ultrapar Participacoes SA (289,231) (33,044)
(289,231) (33,044)
United States (476,000) Advanced Semiconductor
Engineering Inc (472,668) (59,048)
(474,512) Astra International Tbk PT (247,933) 3,414
(244,600) Axiata Group Bhd (509,746) (14,758)
(531,970) Ayala Land Inc (345,940) 36,595
(395,500) Bank Central Asia Tbk PT (319,050) 34,838
(23,943) BRF SA (524,254) 44,565
(1,089,326) BTS Group Holdings PCL (317,539) (39,260)
(181,984) Chailease Holding Co Ltd (483,750) (78,838)
(601,350) China Steel Corp (516,920) (4,479)
(3,112) Coca-Cola Femsa SAB de CV (371,760) (1,826)
(372,700) CP ALL PCL (473,590) 29,437
(29,000) Group BTG Pactual (350,056) 34,182
(85,602) Grupo Financiero Banorte SAB de CV (587,144) (49,743)
(40,582) Hypermarcas SA (326,921) (53,008)
(346,200) IHH Healthcare Bhd (434,827) (13,409)
(378,937) Indofood CBP Sukses Makmur Tbk PT (316,753) 17,067
(4,600) Magnit OJSC (302,680) (8,953)
(90,993) Odontoprev SA (370,032) (17,625)
(35,400) Phosagro OAO GDR (344,442) 14,110
59,907 Radiant Opto-Electronics Corp 213,479 1,117
(7,402,526) (125,622)
Total market value
(USD underlying exposure – USD 11,443,184) (10,630,625) (337,017)
BlackRock Emerging Markets Absolute Return Fund continued
Contracts For Difference as at 30 November 2013
United States continued

Unaudited Interim Report and Accounts 51
The notes on pages 150 to 158 form an integral part of these financial statements.
BlackRock Emerging Markets Absolute Return Fund continued
Open Forward Foreign Exchange Transactionsas at 30 November 2013
Purchases Sales Value date
Unrealised appreciation/
(depreciation)USD
EUR 2,473,109 USD 3,311,797 13/12/2013 51,485
USD 49,632 EUR 36,840 13/12/2013 (468)
GBP 3,272 USD 5,194 13/12/2013 149
USD 66 GBP 41 13/12/2013 (2)
USD 1,009,037 PLN 3,130,000 28/2/2014 2,108
USD 986,772 ZAR 10,208,000 28/2/2014 (2,664)
Net unrealised appreciation
(USD underlying exposure – USD 5,415,157) 50,608
Note: The net unrealised appreciation attributed to these transactions is included
in the Statement of Net Assets (see Note 2(d)).
State Street Bank and Trust Company and UBS AG London are the counterparties to
these Open Forward Foreign Exchange Transactions.
Open Exchange Traded Futures Contractsas at 30 November 2013
Number of Contracts
Contract/Description
Expirationdate
Underlying exposure
USD
Unrealisedappreciation/
(depreciation) USD
(280) FTSE/ATHEX 20 December 2013 750,143 (7,260)
Total 750,143 (7,260)
Note: The net unrealised depreciation attributed to these transactions is included
in the Statement of Net Assets (see Note 2(d)).
Sector Breakdownas at 30 November 2013
% of netassets *
Financial 19.78
Consumer, Cyclical 13.23
Funds 8.82
Consumer, Non-cyclical 7.03
Energy 5.91
Diversified 2.62
Industrial 2.37
Communications 2.03
Basic Materials 1.10
Technology 0.87
Other Net Assets 36.24
100.00
* Based on the market value of the Portfolio of Investments

Transferable Securities and Money Market Instruments Admitted to an Official Stock Exchange Listing or Dealt in on Another Regulated Market
Transferable Securities and Money Market Instruments Admitted to an Official Stock Exchange Listing or Dealt in on Another Regulated Market
Holding Description Market Value
(USD) % Holding Description Market Value
(USD) %
52 BlackRock Strategic Funds (BSF)
BlackRock Emerging Markets Allocation Fund
BONDS
Brazil USD 200,000 Banco do Brasil SA 3.875%
10/10/2022 175,621 0.35
BRL 231,000 Brazil Notas do Tesouro Nacional
Serie F 10.00% 1/1/2023 89,218 0.18
BRL 259,000 Brazilian Government International
Bond 10.25% 10/1/2028 109,237 0.22
USD 375,000 Brazilian Government International
Bond 8.25% 20/1/2034 471,375 0.95
USD 150,000 Caixa Economica Federal 3.50%
7/11/2022 122,630 0.25
968,081 1.95
Cayman Islands USD 750,000 Hutchison Whampoa International
11 Ltd 4.625% 13/1/2022 778,001 1.56
USD 290,000 Petrobras International Finance
Co 6.75% 27/1/2041 277,410 0.56
1,055,411 2.12
Chile USD 270,000 Banco de Credito e Inversiones
4.00% 11/2/2023 250,593 0.50
USD 300,000 Banco Santander Chile 3.875%
20/9/2022 285,363 0.57
USD 200,000 Corp Nacional del Cobre de Chile
4.25% 17/7/2042 161,695 0.33
USD 264,000 Empresa Nacional del Petroleo
4.75% 6/12/2021 263,423 0.53
961,074 1.93
Colombia USD 375,000 Colombia Government International
Bond 2.625% 15/3/2023 330,469 0.67
COP 257,000,000 Colombia Government International
Bond 4.375% 21/3/2023 119,009 0.24
COP 424,000,000 Colombia Government International
Bond 9.85% 28/6/2027 277,163 0.56
USD 325,000 Republic of Colombia 7.375%
18/9/2037 394,810 0.79
1,121,451 2.26
Curacao USD 775,000 Teva Pharmaceutical Finance Co
BV 3.65% 10/11/2021 763,987 1.54
763,987 1.54
Germany USD 225,000 Deutsche Bank AG FRN 24/5/2028 206,300 0.42
206,300 0.42
India USD 200,000 Reliance Industries Ltd 5.875%
(Perpetual) 169,459 0.34
169,459 0.34
Ireland USD 330,000 Vnesheconombank Via VEB
Finance Plc 6.80% 22/11/2025 346,216 0.70
346,216 0.70
Luxembourg USD 123,000 Gazprom OAO Via Gaz Capital SA
6.51% 7/3/2022 132,422 0.27
132,422 0.27
Malaysia USD 394,000 Malayan Banking Bhd FRN
20/9/2022 392,887 0.79
392,887 0.79
Mexico USD 305,000 America Movil SAB de CV 3.125%
16/7/2022 285,083 0.57
USD 320,000 America Movil SAB de CV 6.375%
1/3/2035 348,264 0.70
USD 167,000 BBVA Bancomer SA/Texas 6.75%
30/9/2022 177,354 0.36
MXN 1,179,300 Mexican Bonos 6.50% 9/6/2022 92,612 0.19
MXN 1,066,400 Mexican Bonos 8.00% 7/12/2023 92,244 0.19
MXN 921,300 Mexican Bonos 10.00% 5/12/2024 91,859 0.18
MXN 1,451,800 Mexican Bonos 7.50% 3/6/2027 119,051 0.24
MXN 1,455,400 Mexican Bonos 8.50% 31/5/2029 125,904 0.25
MXN 1,776,800 Mexican Bonos 7.75% 29/5/2031 141,598 0.28
MXN 1,548,300 Mexican Bonos 10.00% 20/11/2036 148,987 0.30
MXN 2,057,900 Mexican Bonos 8.50% 18/11/2038 172,392 0.35
MXN 2,693,900 Mexican Bonos 7.75% 13/11/2042 208,733 0.42
USD 100,000 Mexico Government International
Bond 4.75% 8/3/2044 88,125 0.18
USD 104,000 Mexico Government International
Bond 5.75% 12/10/2110 94,284 0.19
USD 117,000 Petroleos Mexicanos 4.875%
24/1/2022 120,086 0.24
USD 196,000 Petroleos Mexicanos 6.50%
2/6/2041 198,427 0.40
2,505,003 5.04
Netherlands USD 137,000 Petrobras Global Finance BV
4.375% 20/5/2023 124,884 0.25
124,884 0.25
Peru USD 137,000 Banco de Credito del Peru/Panama
FRN 24/4/2027 138,093 0.28
USD 109,000 BBVA Banco Continental SA 5.00%
26/8/2022 107,639 0.22
USD 200,000 Corp Financiera de Desarrollo SA
4.75% 8/2/2022 199,080 0.40
USD 150,000 Fondo MIVIVIENDA SA 3.50%
31/1/2023 135,702 0.27
PEN 569,000 Peru Government Bond 8.20%
12/8/2026 243,686 0.49
PEN 495,000 Peru Government Bond 6.95%
12/8/2031 181,059 0.36
PEN 647,000 Peru Government Bond 6.90%
12/8/2037 233,527 0.47
USD 115,000 Peruvian Government International
Bond 7.35% 21/7/2025 146,099 0.29
USD 250,000 Republic of Peru 6.55% 14/3/2037 287,288 0.58
1,672,173 3.36
Portfolio of Investments as at 30 November 2013
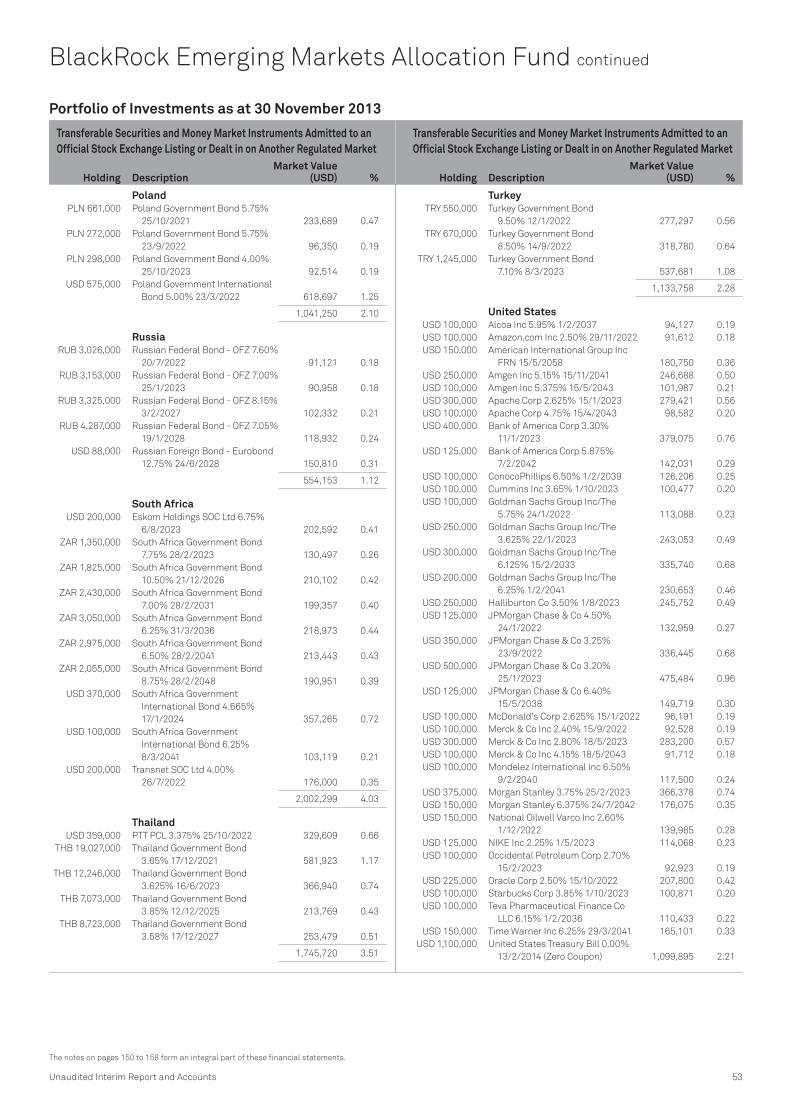
Transferable Securities and Money Market Instruments Admitted to an Official Stock Exchange Listing or Dealt in on Another Regulated Market
Transferable Securities and Money Market Instruments Admitted to an Official Stock Exchange Listing or Dealt in on Another Regulated Market
Holding Description Market Value
(USD) % Holding Description Market Value
(USD) %
Unaudited Interim Report and Accounts 53
The notes on pages 150 to 158 form an integral part of these financial statements.
BlackRock Emerging Markets Allocation Fund continued
Poland PLN 661,000 Poland Government Bond 5.75%
25/10/2021 233,689 0.47
PLN 272,000 Poland Government Bond 5.75%
23/9/2022 96,350 0.19
PLN 298,000 Poland Government Bond 4.00%
25/10/2023 92,514 0.19
USD 575,000 Poland Government International
Bond 5.00% 23/3/2022 618,697 1.25
1,041,250 2.10
Russia RUB 3,026,000 Russian Federal Bond - OFZ 7.60%
20/7/2022 91,121 0.18
RUB 3,153,000 Russian Federal Bond - OFZ 7.00%
25/1/2023 90,958 0.18
RUB 3,325,000 Russian Federal Bond - OFZ 8.15%
3/2/2027 102,332 0.21
RUB 4,287,000 Russian Federal Bond - OFZ 7.05%
19/1/2028 118,932 0.24
USD 88,000 Russian Foreign Bond - Eurobond
12.75% 24/6/2028 150,810 0.31
554,153 1.12
South Africa USD 200,000 Eskom Holdings SOC Ltd 6.75%
6/8/2023 202,592 0.41
ZAR 1,350,000 South Africa Government Bond
7.75% 28/2/2023 130,497 0.26
ZAR 1,825,000 South Africa Government Bond
10.50% 21/12/2026 210,102 0.42
ZAR 2,430,000 South Africa Government Bond
7.00% 28/2/2031 199,357 0.40
ZAR 3,050,000 South Africa Government Bond
6.25% 31/3/2036 218,973 0.44
ZAR 2,975,000 South Africa Government Bond
6.50% 28/2/2041 213,443 0.43
ZAR 2,055,000 South Africa Government Bond
8.75% 28/2/2048 190,951 0.39
USD 370,000 South Africa Government
International Bond 4.665%
17/1/2024 357,265 0.72
USD 100,000 South Africa Government
International Bond 6.25%
8/3/2041 103,119 0.21
USD 200,000 Transnet SOC Ltd 4.00%
26/7/2022 176,000 0.35
2,002,299 4.03
Thailand USD 359,000 PTT PCL 3.375% 25/10/2022 329,609 0.66
THB 19,027,000 Thailand Government Bond
3.65% 17/12/2021 581,923 1.17
THB 12,246,000 Thailand Government Bond
3.625% 16/6/2023 366,940 0.74
THB 7,073,000 Thailand Government Bond
3.85% 12/12/2025 213,769 0.43
THB 8,723,000 Thailand Government Bond
3.58% 17/12/2027 253,479 0.51
1,745,720 3.51
Turkey TRY 550,000 Turkey Government Bond
9.50% 12/1/2022 277,297 0.56
TRY 670,000 Turkey Government Bond
8.50% 14/9/2022 318,780 0.64
TRY 1,245,000 Turkey Government Bond
7.10% 8/3/2023 537,681 1.08
1,133,758 2.28
United States USD 100,000 Alcoa Inc 5.95% 1/2/2037 94,127 0.19
USD 100,000 Amazon.com Inc 2.50% 29/11/2022 91,612 0.18
USD 150,000 American International Group Inc
FRN 15/5/2058 180,750 0.36
USD 250,000 Amgen Inc 5.15% 15/11/2041 246,688 0.50
USD 100,000 Amgen Inc 5.375% 15/5/2043 101,987 0.21
USD 300,000 Apache Corp 2.625% 15/1/2023 279,421 0.56
USD 100,000 Apache Corp 4.75% 15/4/2043 98,582 0.20
USD 400,000 Bank of America Corp 3.30%
11/1/2023 379,075 0.76
USD 125,000 Bank of America Corp 5.875%
7/2/2042 142,031 0.29
USD 100,000 ConocoPhillips 6.50% 1/2/2039 126,206 0.25
USD 100,000 Cummins Inc 3.65% 1/10/2023 100,477 0.20
USD 100,000 Goldman Sachs Group Inc/The
5.75% 24/1/2022 113,088 0.23
USD 250,000 Goldman Sachs Group Inc/The
3.625% 22/1/2023 243,053 0.49
USD 300,000 Goldman Sachs Group Inc/The
6.125% 15/2/2033 335,740 0.68
USD 200,000 Goldman Sachs Group Inc/The
6.25% 1/2/2041 230,653 0.46
USD 250,000 Halliburton Co 3.50% 1/8/2023 245,752 0.49
USD 125,000 JPMorgan Chase & Co 4.50%
24/1/2022 132,959 0.27
USD 350,000 JPMorgan Chase & Co 3.25%
23/9/2022 336,445 0.68
USD 500,000 JPMorgan Chase & Co 3.20%
25/1/2023 475,484 0.96
USD 125,000 JPMorgan Chase & Co 6.40%
15/5/2038 149,719 0.30
USD 100,000 McDonald's Corp 2.625% 15/1/2022 96,191 0.19
USD 100,000 Merck & Co Inc 2.40% 15/9/2022 92,528 0.19
USD 300,000 Merck & Co Inc 2.80% 18/5/2023 283,200 0.57
USD 100,000 Merck & Co Inc 4.15% 18/5/2043 91,712 0.18
USD 100,000 Mondelez International Inc 6.50%
9/2/2040 117,500 0.24
USD 375,000 Morgan Stanley 3.75% 25/2/2023 366,378 0.74
USD 150,000 Morgan Stanley 6.375% 24/7/2042 176,075 0.35
USD 150,000 National Oilwell Varco Inc 2.60%
1/12/2022 139,985 0.28
USD 125,000 NIKE Inc 2.25% 1/5/2023 114,068 0.23
USD 100,000 Occidental Petroleum Corp 2.70%
15/2/2023 92,923 0.19
USD 225,000 Oracle Corp 2.50% 15/10/2022 207,800 0.42
USD 100,000 Starbucks Corp 3.85% 1/10/2023 100,871 0.20
USD 100,000 Teva Pharmaceutical Finance Co
LLC 6.15% 1/2/2036 110,433 0.22
USD 150,000 Time Warner Inc 6.25% 29/3/2041 165,101 0.33
USD 1,100,000 United States Treasury Bill 0.00%
13/2/2014 (Zero Coupon) 1,099,895 2.21
Portfolio of Investments as at 30 November 2013

Transferable Securities and Money Market Instruments Admitted to an Official Stock Exchange Listing or Dealt in on Another Regulated Market
Transferable Securities and Money Market Instruments Admitted to an Official Stock Exchange Listing or Dealt in on Another Regulated Market
Holding Description Market Value
(USD) % Holding Description Market Value
(USD) %
1 This fund is managed by BlackRock.
54 BlackRock Strategic Funds (BSF)
BlackRock Emerging Markets Allocation Fund continued
USD 1,000,000 United States Treasury Bill 0.00%
22/5/2014 (Zero Coupon) 999,529 2.01
USD 150,000 United Technologies Corp 3.10%
1/6/2022 147,133 0.30
USD 100,000 United Technologies Corp 4.50%
1/6/2042 97,327 0.20
USD 100,000 Viacom Inc 4.25% 1/9/2023 101,241 0.20
USD 100,000 Viacom Inc 5.85% 1/9/2043 104,442 0.21
8,808,181 17.72
Total Bonds 25,704,709 51.73
CERTIFICATES OF DEPOSIT
France USD 650,000 BNP Paribas SA 0.69% 17/4/2014 653,439 1.31
653,439 1.31
Luxembourg USD 1,000,000 Nordea Bank Finland Plc 0.16%
11/12/2013 1,000,166 2.02
USD 1,000,000 Norinchukin Bank 0.16%
2/12/2013 1,000,012 2.01
2,000,178 4.03
United States USD 650,000 Bank of America NA 0% 14/1/2014 650,010 1.31
USD 1,000,000 Bank of Montreal 0.19% 7/4/2014 1,000,198 2.01
USD 650,000 Bank of Nova Scotia 0% 22/2/2014 650,003 1.31
USD 650,000 Bank of Tokyo Mitsubishi UFJ Ltd
0% 7/3/2014 651,979 1.31
USD 650,000 Bank of Tokyo Mitsubishi UFJ Ltd
0.39% 13/5/2014 651,617 1.31
USD 1,000,000 Credit Suisse AG 0.67% 9/1/2014 1,005,832 2.03
USD 1,000,000 Mizuho Bank Ltd 0.22% 15/1/2014 1,000,250 2.01
5,609,889 11.29
Total Certificates of Deposit 8,263,506 16.63
COMMERCIAL PAPER
United States USD 600,000 Barton Capital LLC 0% 3/2/2014 599,762 1.20
USD 650,000 Govco LLC 0% 11/2/2014 649,736 1.31
USD 650,000 ING (US) Funding LLC 0% 6/3/2014 649,619 1.31
USD 120,000 Lloyds Bank Plc 0% 6/12/2013 119,997 0.24
USD 650,000 Natexis Banques Populaires 0%
5/2/2014 649,722 1.31
USD 650,000 Oversea - Chinese Banking Corp
0% 18/2/2014 649,755 1.31
USD 650,000 Rabobank USA Financial Corp 0%
8/5/2014 649,368 1.30
USD 650,000 Societe Generale North America
Inc 0% 31/1/2014 649,776 1.31
USD 1,000,000 Victory Receivables Corp 0%
20/12/2013 999,922 2.01
5,617,657 11.30
Total Commercial Paper 5,617,657 11.30
Total Transferable Securities and Money
Market Instruments Admitted to an
Official Stock Exchange Listing or
Dealt in on Another Regulated Market 42,120,522 84.76
FUNDS
United States 76,645 iShares MSCI Frontier 100 ETF1 2,534,650 5.10
2,534,650 5.10
Total Funds 2,534,650 5.10
Other Transferable Securities and Money Market Instruments
BONDS
Malaysia MYR 522,000 Malaysia Government Bond
3.418% 15/8/2022 153,118 0.31
MYR 321,000 Malaysia Government Bond
3.48% 15/3/2023 95,169 0.19
MYR 320,000 Malaysia Government Bond
3.733% 15/6/2028 93,173 0.19
MYR 517,000 Malaysia Government Bond
3.844% 15/4/2033 149,101 0.30
MYR 230,000 Malaysia Government Bond
3.892% 15/3/2027 68,542 0.14
MYR 320,000 Malaysia Government Bond
4.127% 15/4/2032 95,721 0.19
MYR 603,000 Malaysia Government Bond
4.392% 15/4/2026 188,687 0.38
843,511 1.70
Total Bonds 843,511 1.70
Total Other Transferable Securities
and Money Market Instruments 843,511 1.70
Securities portfolio at market value 42,964,033 86.46
Other Net Assets 6,730,625 13.54
Total Net Assets (USD) 49,694,658 100.00
Portfolio of Investments as at 30 November 2013
United States continued United States continued
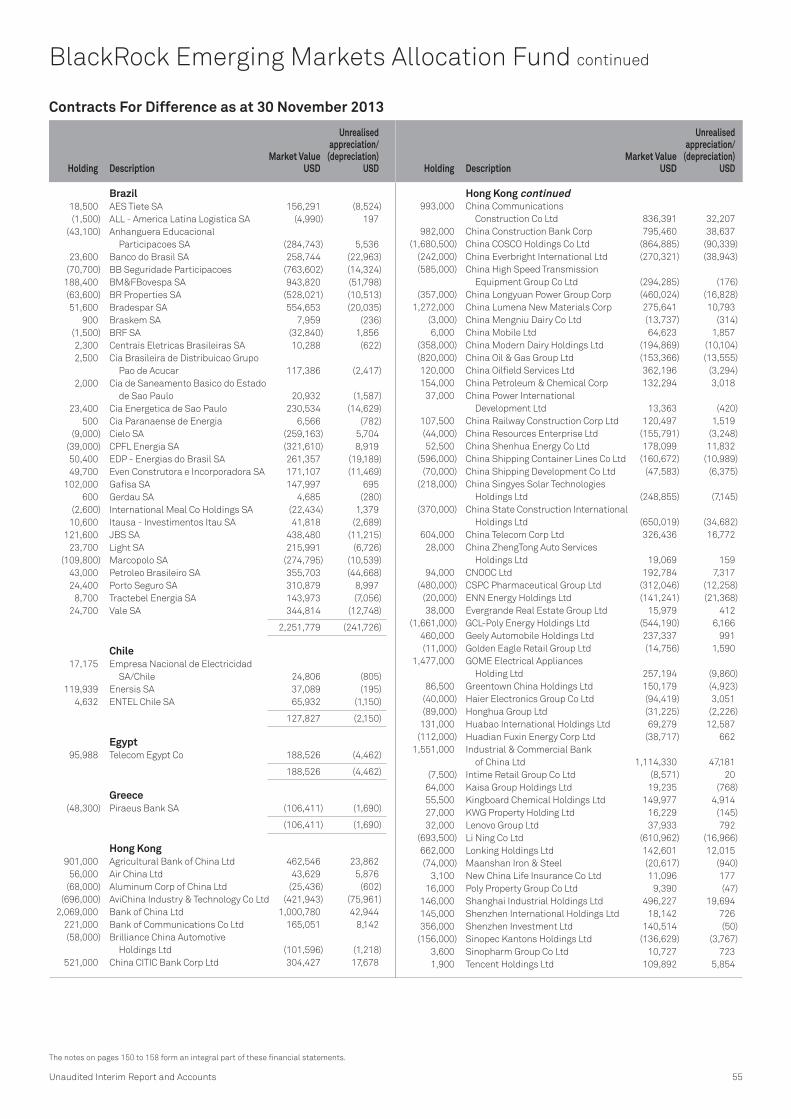
Holding DescriptionMarket Value
USD
Unrealisedappreciation/
(depreciation) USD Holding Description
Market ValueUSD
Unrealisedappreciation/
(depreciation) USD
Unaudited Interim Report and Accounts 55
The notes on pages 150 to 158 form an integral part of these financial statements.
BlackRock Emerging Markets Allocation Fund continued
Brazil 18,500 AES Tiete SA 156,291 (8,524)
(1,500) ALL - America Latina Logistica SA (4,990) 197
(43,100) Anhanguera Educacional
Participacoes SA (284,743) 5,536
23,600 Banco do Brasil SA 258,744 (22,963)
(70,700) BB Seguridade Participacoes (763,602) (14,324)
188,400 BM&FBovespa SA 943,820 (51,798)
(63,600) BR Properties SA (528,021) (10,513)
51,600 Bradespar SA 554,653 (20,035)
900 Braskem SA 7,959 (236)
(1,500) BRF SA (32,840) 1,856
2,300 Centrais Eletricas Brasileiras SA 10,288 (622)
2,500 Cia Brasileira de Distribuicao Grupo
Pao de Acucar 117,386 (2,417)
2,000 Cia de Saneamento Basico do Estado
de Sao Paulo 20,932 (1,587)
23,400 Cia Energetica de Sao Paulo 230,534 (14,629)
500 Cia Paranaense de Energia 6,566 (782)
(9,000) Cielo SA (259,163) 5,704
(39,000) CPFL Energia SA (321,610) 8,919
50,400 EDP - Energias do Brasil SA 261,357 (19,189)
49,700 Even Construtora e Incorporadora SA 171,107 (11,469)
102,000 Gafisa SA 147,997 695
600 Gerdau SA 4,685 (280)
(2,600) International Meal Co Holdings SA (22,434) 1,379
10,600 Itausa - Investimentos Itau SA 41,818 (2,689)
121,600 JBS SA 438,480 (11,215)
23,700 Light SA 215,991 (6,726)
(109,800) Marcopolo SA (274,795) (10,539)
43,000 Petroleo Brasileiro SA 355,703 (44,668)
24,400 Porto Seguro SA 310,879 8,997
8,700 Tractebel Energia SA 143,973 (7,056)
24,700 Vale SA 344,814 (12,748)
2,251,779 (241,726)
Chile 17,175 Empresa Nacional de Electricidad
SA/Chile 24,806 (805)
119,939 Enersis SA 37,089 (195)
4,632 ENTEL Chile SA 65,932 (1,150)
127,827 (2,150)
Egypt 95,988 Telecom Egypt Co 188,526 (4,462)
188,526 (4,462)
Greece (48,300) Piraeus Bank SA (106,411) (1,690)
(106,411) (1,690)
Hong Kong 901,000 Agricultural Bank of China Ltd 462,546 23,862
56,000 Air China Ltd 43,629 5,876
(68,000) Aluminum Corp of China Ltd (25,436) (602)
(696,000) AviChina Industry & Technology Co Ltd (421,943) (75,961)
2,069,000 Bank of China Ltd 1,000,780 42,944
221,000 Bank of Communications Co Ltd 165,051 8,142
(58,000) Brilliance China Automotive
Holdings Ltd (101,596) (1,218)
521,000 China CITIC Bank Corp Ltd 304,427 17,678
993,000 China Communications
Construction Co Ltd 836,391 32,207
982,000 China Construction Bank Corp 795,460 38,637
(1,680,500) China COSCO Holdings Co Ltd (864,885) (90,339)
(242,000) China Everbright International Ltd (270,321) (38,943)
(585,000) China High Speed Transmission
Equipment Group Co Ltd (294,285) (176)
(357,000) China Longyuan Power Group Corp (460,024) (16,828)
1,272,000 China Lumena New Materials Corp 275,641 10,793
(3,000) China Mengniu Dairy Co Ltd (13,737) (314)
6,000 China Mobile Ltd 64,623 1,857
(358,000) China Modern Dairy Holdings Ltd (194,869) (10,104)
(820,000) China Oil & Gas Group Ltd (153,366) (13,555)
120,000 China Oilfield Services Ltd 362,196 (3,294)
154,000 China Petroleum & Chemical Corp 132,294 3,018
37,000 China Power International
Development Ltd 13,363 (420)
107,500 China Railway Construction Corp Ltd 120,497 1,519
(44,000) China Resources Enterprise Ltd (155,791) (3,248)
52,500 China Shenhua Energy Co Ltd 178,099 11,832
(596,000) China Shipping Container Lines Co Ltd (160,672) (10,989)
(70,000) China Shipping Development Co Ltd (47,583) (6,375)
(218,000) China Singyes Solar Technologies
Holdings Ltd (248,855) (7,145)
(370,000) China State Construction International
Holdings Ltd (650,019) (34,682)
604,000 China Telecom Corp Ltd 326,436 16,772
28,000 China ZhengTong Auto Services
Holdings Ltd 19,069 159
94,000 CNOOC Ltd 192,784 7,317
(480,000) CSPC Pharmaceutical Group Ltd (312,046) (12,258)
(20,000) ENN Energy Holdings Ltd (141,241) (21,368)
38,000 Evergrande Real Estate Group Ltd 15,979 412
(1,661,000) GCL-Poly Energy Holdings Ltd (544,190) 6,166
460,000 Geely Automobile Holdings Ltd 237,337 991
(11,000) Golden Eagle Retail Group Ltd (14,756) 1,590
1,477,000 GOME Electrical Appliances
Holding Ltd 257,194 (9,860)
86,500 Greentown China Holdings Ltd 150,179 (4,923)
(40,000) Haier Electronics Group Co Ltd (94,419) 3,051
(89,000) Honghua Group Ltd (31,225) (2,226)
131,000 Huabao International Holdings Ltd 69,279 12,587
(112,000) Huadian Fuxin Energy Corp Ltd (38,717) 662
1,551,000 Industrial & Commercial Bank
of China Ltd 1,114,330 47,181
(7,500) Intime Retail Group Co Ltd (8,571) 20
64,000 Kaisa Group Holdings Ltd 19,235 (768)
55,500 Kingboard Chemical Holdings Ltd 149,977 4,914
27,000 KWG Property Holding Ltd 16,229 (145)
32,000 Lenovo Group Ltd 37,933 792
(693,500) Li Ning Co Ltd (610,962) (16,966)
662,000 Lonking Holdings Ltd 142,601 12,015
(74,000) Maanshan Iron & Steel (20,617) (940)
3,100 New China Life Insurance Co Ltd 11,096 177
16,000 Poly Property Group Co Ltd 9,390 (47)
146,000 Shanghai Industrial Holdings Ltd 496,227 19,694
145,000 Shenzhen International Holdings Ltd 18,142 726
356,000 Shenzhen Investment Ltd 140,514 (50)
(156,000) Sinopec Kantons Holdings Ltd (136,629) (3,767)
3,600 Sinopharm Group Co Ltd 10,727 723
1,900 Tencent Holdings Ltd 109,892 5,854
Contracts For Difference as at 30 November 2013
Hong Kong continued

Holding DescriptionMarket Value
USD
Unrealisedappreciation/
(depreciation) USD Holding Description
Market ValueUSD
Unrealisedappreciation/
(depreciation) USD
56 BlackRock Strategic Funds (BSF)
BlackRock Emerging Markets Allocation Fund continued
22,000 Tingyi Cayman Islands Holding Corp 65,268 1,884
(8,000) Tsingtao Brewery Co Ltd (67,022) 241
(204,000) Uni-President China Holdings Ltd (206,034) 1,690
22,000 Yuexiu Property Co Ltd 5,760 (292)
268,000 Zhejiang Expressway Co Ltd 249,931 6,170
(18,000) Zhuzhou CSR Times Electric Co Ltd (69,421) (3,582)
2,261,274 (41,232)
Hungary (108) MOL Hungarian Oil & Gas PLC (6,825) 155
(6,825) 155
Indonesia 284,000 Adaro Energy Tbk PT 26,827 (1,977)
277,000 Telekomunikasi Indonesia
Persero Tbk PT 50,364 (1,525)
(16,500) Unilever Indonesia Tbk PT (36,690) 4,492
68,000 United Tractors Tbk PT 103,741 (7,487)
144,242 (6,497)
Malaysia 14,500 British American Tobacco
Malaysia Bhd 282,982 (3,251)
(103,100) Bumi Armada Bhd (126,996) (4,839)
(27,300) Maxis Bhd (59,547) 1,059
38,700 MISC Bhd 65,921 3,170
(32,400) Petronas Dagangan Bhd (313,646) (9,346)
85,400 Sime Darby Bhd 255,697 1,661
104,411 (11,546)
Mexico (30,700) Alfa SAB de CV (90,549) (3,477)
(89,000) Compartamos SAB de CV (166,925) 6,464
(63,500) Empresas ICA SAB de CV (118,953) (1,280)
(24,900) Fibra Uno Administracion SA de CV (77,393) (100)
11,800 Fomento Economico Mexicano
SAB de CV 112,449 2,400
6,000 Gruma SAB de CV 41,645 (1,108)
1,600 Grupo Aeroportuario del Pacifico
SAB de CV 8,267 260
23,000 Grupo Aeroportuario del Sureste
SAB de CV 307,877 12,545
14,700 Grupo Financiero Inbursa SAB de CV 38,458 939
95,500 Grupo Mexico SAB de CV 280,074 (16,687)
13,500 Grupo Televisa SAB 82,283 666
(17,400) Industrias CH SAB de CV (98,873) (3,750)
105,000 Kimberly-Clark de Mexico SAB de CV 310,898 (3,482)
(174,500) Mexichem SAB de CV (746,674) (25,197)
(62,400) Minera Frisco SAB de CV (139,024) 4,351
(256,440) (27,456)
Philippines (190,500) Aboitiz Equity Ventures Inc (234,997) (18,496)
(234,997) (18,496)
Poland (11,832) Alior Bank SA (286,965) 4,092
(9,620) Cyfrowy Polsat SA (61,915) 1,334
(1,950) Grupa Azoty SA (45,982) 941
3,356 KGHM Polska Miedz SA 127,371 (1,150)
34,489 PGE SA 207,807 1,279
3,945 Synthos SA 6,903 229
111,150 Telekomunikacja Polska SA 372,064 (7,300)
319,283 (575)
Russia 130,190 Gazprom OAO 561,594 (28,164)
3,117 Lukoil OAO 191,941 (6,420)
68,100 Surgutneftegas OAO 56,244 (2,695)
1,033,900 Surgutneftegas OAO 734,993 (23,096)
(830) Uralkali OJSC (4,128) 333
1,540,644 (60,042)
South Africa (2,001) Aveng Ltd (5,799) 203
(9,434) Barloworld Ltd (87,813) 1,635
2,295 Clicks Group Ltd 14,528 120
(5,020) Discovery Ltd (40,175) (218)
(7,507) Exxaro Resources Ltd (103,443) 814
30,825 FirstRand Ltd 102,351 2,309
2,393 Harmony Gold Mining Co Ltd 6,928 (815)
16,644 Imperial Holdings Ltd 345,139 9,410
(52,846) Massmart Holdings Ltd (745,267) 43,041
9,195 Mr Price Group Ltd 139,968 1,608
75,567 Netcare Ltd 183,899 4,856
(38,911) Remgro Ltd (743,446) 4,346
2,602 SABMiller Plc 134,793 1,094
13,352 Sanlam Ltd 67,622 (374)
67,242 Spar Group Ltd/The 858,479 (8,798)
85,353 Steinhoff International Holdings Ltd 338,814 2,453
65,618 Vodacom Group Ltd 785,032 (48,427)
1,251,610 13,257
South Korea 108 AMOREPACIFIC Group 44,341 5,380
(164) Cheil Industries Inc (14,117) (607)
(362) CJ CheilJedang Corp (88,251) (3,340)
248 CJ E&M Corp 7,253 511
(923) CrucialTec Co Ltd (10,030) (504)
(1,811) CTC BIO Inc (32,941) (3,325)
(82,140) Daewoo Engineering &
Construction Co Ltd (662,056) (48,570)
(2,060) Daewoo Shipbuilding & Marine
Engineering Co Ltd (71,437) (532)
420 Daishin Securities Co Ltd 3,457 54
(2,605) Danal Co Ltd (20,529) (80)
(1,240) Doosan Heavy Industries &
Construction Co Ltd (44,700) 491
5,782 e-LITECOM Co Ltd 110,909 (1,406)
110 E-Mart Co Ltd 28,012 1,188
(1,520) GS Engineering & Construction Corp (43,447) 2,121
11,610 Hanjin Heavy Industries &
Construction Co Ltd 131,096 3,282
44,870 Hanwha Life Insurance Co Ltd 307,387 14,337
150 Hyosung Corp 10,219 (338)
390 Hyundai Engineering &
Construction Co Ltd 23,180 1,069
(119) Hyundai Heavy Industries Co Ltd (30,529) 29
(4,233) Hyundai Mipo Dockyard (721,966) 14,035
36 Hyundai Mobis 10,443 225
978 Hyundai Steel Co 76,333 (3,061)
7,510 Jahwa Electronics Co Ltd 170,311 9,549
1,800 KCC Corp 794,293 18,049
13,626 Kia Motors Corp 777,672 (8,176)
18,090 Korea Aerospace Industries Ltd 478,617 9,832
12,160 Korean Reinsurance Co 130,987 (6,276)
1,050 KT Skylife Co Ltd 27,036 516
7,569 LG Corp 447,002 11,850
9,310 LG Fashion Corp 302,181 20,996
1,333 LG Hausys Ltd 179,488 5,821
3,000 LIG Insurance Co Ltd 90,286 15,341
Contracts For Difference as at 30 November 2013
Hong Kong continued

Holding DescriptionMarket Value
USD
Unrealisedappreciation/
(depreciation) USD Holding Description
Market ValueUSD
Unrealisedappreciation/
(depreciation) USD
Unaudited Interim Report and Accounts 57
The notes on pages 150 to 158 form an integral part of these financial statements.
BlackRock Emerging Markets Allocation Fund continued
(22,280) Lock & Lock Co Ltd (482,105) (41,304)
189 Lotte Chemical Corp 39,111 (491)
12 Lotte Chilsung Beverage Co Ltd 17,417 143
49 LS Corp 3,658 82
564 Maeil Dairy Industry Co Ltd 25,021 2,201
8,550 Neowiz Games Corp 133,707 7,999
(2,095) OCI Co Ltd (347,418) 22,944
(1,729) OPTRON-TEC Inc (18,625) (558)
(636) Osstem Implant Co Ltd (14,964) (1,082)
399 POSCO 123,474 895
762 Samsung Electronics Co Ltd 1,075,714 27,467
(6,416) Samsung Engineering Co Ltd (381,335) 9,719
(4,753) Samsung Fine Chemicals Co Ltd (211,085) (13,210)
(1,674) Sapphire Technology Co Ltd (59,475) (2,177)
(494) Seoul Semiconductor Co Ltd (19,512) (420)
310 Shinhan Financial Group Co Ltd 13,035 (73)
668 SK C&C Co Ltd 85,528 8,177
3,430 SK Chemicals Co Ltd 172,424 14,325
349 SK Holdings Co Ltd 61,668 (506)
68,220 SK Networks Co Ltd 481,530 37,248
(2,000) SM Entertainment Co (80,979) (4,286)
9,868 Woojeon & Handan Co Ltd 81,588 (1,786)
3,108,877 123,768
Taiwan 99,000 Asustek Computer Inc 871,444 107,307
(14,000) Career Technology MFG. Co Ltd (13,080) (1,560)
(19,000) Chicony Electronics Co Ltd (47,510) (169)
114,000 Chimei Materials Technology Corp 126,543 4,847
159,000 China Metal Products 240,429 (2,857)
133,000 China Motor Corp 124,039 2,135
23,000 Chunghwa Telecom Co Ltd 72,123 567
1,382,000 Compeq Manufacturing Co Ltd 800,882 35,064
(37,000) CTCI Corp (58,762) 810
272,000 Eva Airways Corp 156,707 7,826
42,000 Everlight Electronics Co Ltd 78,482 2,983
33,000 Far Eastern Department Stores Ltd 33,676 1,287
(8,000) Faraday Technology Corp (9,259) 99
(30,000) FLEXium Interconnect Inc (96,912) (3,875)
(105,000) Formosa Petrochemical Corp (286,325) (10,141)
215,000 Formosa Taffeta Co Ltd 272,437 8,779
(58,000) Foxconn Technology Co Ltd (137,582) (5,959)
(322,000) G Tech Optoelectronics Corp (380,820) 34,480
(41,000) Genius Electronic Optical Co Ltd (121,917) (986)
(36,000) Giant Manufacturing Co Ltd (253,633) (10,863)
57,000 Gintech Energy Corp 60,960 (1,447)
29,000 Grape King Bio Ltd 147,969 13,016
(16,000) Hiwin Technologies Corp (132,730) (8,648)
(39,000) Hotai Motor Co Ltd (453,335) (24,173)
(84,000) HTC Corp (428,600) 1,793
531,000 Inotera Memories Inc 378,594 (4,251)
9,000 Inventec Corp 7,572 1,115
(198,000) Lextar Electronics Corp (161,577) (9,664)
(78,000) Lotus Pharmaceutical Co Ltd (188,450) (18,721)
3,000 MediaTek Inc 44,198 1,199
146,000 Motech Industries Inc 278,739 (11,885)
(5,000) MStar Semiconductor Inc (56,008) (1,487)
(285,000) Newmax Technology Co Ltd (637,528) (57,059)
(109,000) Orise Technology Co Ltd (164,638) 14,709
9,000 PChome Online Inc 64,777 1,992
56,000 Pou Chen Corp 72,853 4,942
20,000 Quanta Computer Inc 44,536 527
(165,000) Radium Life Tech Co Ltd (155,555) (270)
164,000 Realtek Semiconductor Corp 397,337 (3,560)
(638) Sekonix Co Ltd (16,066) (673)
(13,000) Simplo Technology Co Ltd (57,765) (2,620)
(16,000) Standard Foods Corp (48,550) (1,358)
308,000 Taiflex Scientific Co Ltd 636,940 (24,919)
554,000 Taiwan Cement Corp 877,032 83,534
(100,000) Taiwan Glass Industry Corp (103,568) (2,651)
55,000 Taiwan Semiconductor
Manufacturing Co Ltd 195,141 1,500
86,000 Taiwan Styrene Monomer 65,094 488
41,000 Tong Hsing Electronic Industries Ltd 218,203 (3,875)
(2,000) TPK Holding Co Ltd (11,185) (192)
(207,000) TTY Biopharm Co Ltd (691,073) (5,222)
66,000 Vanguard International
Semiconductor Corp 77,499 7,137
(880,000) Winbond Electronics Corp (217,368) (7,530)
327,000 Wistron NeWeb Corp 782,307 11,313
161,000 Yuanta Financial Holding Co Ltd 87,317 2,859
2,284,034 125,693
Thailand (1,300) Advanced Info Service PCL (9,231) 126
(195,000) CH Karnchang PCL (115,992) 14,770
17,300 CP ALL PCL 21,955 (569)
(1,006,500) Jasmine International PCL (246,061) 14,997
242,600 Land and Houses PCL 78,575 (2,971)
10,100 PTT Global Chemical PCL 23,984 (1,054)
653,600 Sansiri PCL 41,117 (1,538)
142,700 Thai Airways International PCL 73,772 (6,670)
(131,881) 17,091
Turkey 9,434 Aksa Akrilik Kimya Sanayii AS 39,452 1,704
(13,315) Anadolu Efes Biracilik Ve Malt
Sanayii AS (151,742) (4,124)
(23,403) Aselsan Elektronik Sanayi
Ve Ticaret AS (103,436) 807
1,417 BIM Birlesik Magazalar AS 31,806 301
(5,250) Coca-Cola Icecek AS (150,877) (15,356)
120,276 EIS Eczacibasi Ilac ve Sinai ve Finansal
Yatirimlar Sanayi ve Ticaret AS 143,030 3,850
169,198 Enka Insaat ve Sanayi AS 563,378 17,143
19,763 Eregli Demir ve Celik Fabrikalari TAS 26,048 (672)
16,508 Haci Omer Sabanci Holding AS 75,416 (1,279)
311 Koza Altin Isletmeleri AS 4,962 (120)
(1,053) Otokar Otomotiv Ve Savunma Sanayi AS (33,914) (1,577)
32,405 Tofas Turk Otomobil Fabrikasi AS 208,733 1,856
(51,088) Turkcell Iletisim Hizmetleri AS (307,561) (73)
345,295 2,460
United Kingdom 33,405 Gazprom OAO 287,450 (15,499)
4,294 Lukoil OAO 265,369 (6,750)
(6,684) MMC Norilsk Nickel OJSC (100,661) (1,417)
(1,789) NovaTek OAO (235,611) 2,143
(4,819) Uralkali OJSC (120,812) 9,822
95,735 (11,701)
United States 54,741 AES Corp/VA 790,460 (40,153)
(235) America Movil SAB de CV (5,461) (65)
(13,060) BRF SA (286,406) 14,481
234 Check Point Software Technologies Ltd 14,391 12
860 China Petroleum & Chemical Corp 74,046 (1,272)
Contracts For Difference as at 30 November 2013
Taiwan continued South Korea continued

Holding DescriptionMarket Value
USD
Unrealisedappreciation/
(depreciation) USD Holding Description
Market ValueUSD
Unrealisedappreciation/
(depreciation) USD
Note: The net unrealised depreciation attributed to these transactions is included in the Statement of Net Assets (see Note 2(d)).
Bank of America Merrill Lynch and Deutsche Bank are the counterparties to these Contracts for Difference.
58 BlackRock Strategic Funds (BSF)
2,816 Chunghwa Telecom Co Ltd 87,916 1,153
1,744 Cia Brasileira de Distribuicao
Grupo Pao de Acucar 82,456 (496)
3,132 Cia de Minas Buenaventura SAA 36,832 (2,864)
2,194 Copa Holdings SA 332,347 4,780
(17,535) CPFL Energia SA (288,626) 7,801
(5,531) Embraer SA (172,291) (660)
609 Fomento Economico Mexicano
SAB de CV 57,971 2,230
32,936 Gafisa SA 97,820 2,473
(36) MercadoLibre Inc (3,977) (32)
4,458 Southern Copper Corp 112,565 (3,434)
(15,423) Telefonica Brasil SA (296,276) 10,957
989 Telekomunikasi Indonesia
Persero Tbk PT 36,108 (541)
(18,876) Turkcell Iletisim Hizmetleri AS (286,349) (2,699)
1,675 Vale SA 23,350 (433)
406,876 (8,762)
Total market value
(USD underlying exposure – USD 62,694,753) 13,693,859 (153,911)
United States continued United States continued
Open Exchange Traded Futures Contractsas at 30 November 2013
Number of Contracts
Contract/Description
Expirationdate
Underlying exposure
USD
Unrealisedappreciation/
(depreciation) USD
94 SGX CNX Nifty Index December 2013 1,170,864 26,508
Total 1,170,864 26,508
Note: The net unrealised appreciation attributed to these transactions is included
in the Statement of Net Assets (see Note 2(d)).
Sector Breakdownas at 30 November 2013
% of netassets *
Financial 38.18
Government 27.54
Energy 5.22
Funds 5.10
Consumer, Non-cyclical 3.65
Communications 2.19
Diversified 1.56
Industrial 1.05
Consumer, Cyclical 0.62
Basic Materials 0.52
Technology 0.42
Utilities 0.41
Other Net Assets 13.54
100.00
* Based on the market value of the Portfolio of Investments
BlackRock Emerging Markets Allocation Fund continued
Contracts For Difference as at 30 November 2013

Transferable Securities and Money Market Instruments Admitted to an Official Stock Exchange Listing or Dealt in on Another Regulated Market
Transferable Securities and Money Market Instruments Admitted to an Official Stock Exchange Listing or Dealt in on Another Regulated Market
Holding Description Market Value
(USD) % Holding Description Market Value
(USD) %
Unaudited Interim Report and Accounts 59
The notes on pages 150 to 158 form an integral part of these financial statements.
BlackRock Emerging Markets Flexi Dynamic Bond Fund
BONDS
Argentina USD 900,000 Provincia de Buenos Aires 10.875%
26/1/2021 827,865 1.03
827,865 1.03
Brazil BRL 960,000 Brazil Notas do Tesouro Nacional
Serie F 10.00% 1/1/2015 4,258,855 5.32
BRL 7,500,000 Brazilian Government International
Bond 12.50% 5/1/2016 3,416,613 4.26
BRL 3,142,000 Brazilian Government International
Bond 12.50% 5/1/2016 1,431,333 1.79
9,106,801 11.37
Dominican Republic USD 650,000 Dominican Republic International
Bond 6.60% 28/1/2024 656,500 0.82
USD 450,000 Dominican Republic International
Bond 5.875% 18/4/2024 427,439 0.53
1,083,939 1.35
Hungary USD 400,000 Hungary Government International
Bond 5.375% 21/2/2023 391,820 0.49
391,820 0.49
Iraq USD 1,800,000 Republic of Iraq 5.80% 15/1/2028 1,517,652 1.89
1,517,652 1.89
Mexico MXN 26,000,000 Mexican Bonos 6.50% 9/6/2022 2,041,805 2.55
MXN 100,000,000 Mexican Bonos 7.75% 13/11/2042 7,748,375 9.67
9,790,180 12.22
Nigeria NGN 800,000,000 Nigeria Government Bond 4.00%
23/4/2015 4,487,025 5.60
USD 800,000 Nigeria Government International
Bond 6.375% 12/7/2023 830,088 1.04
5,317,113 6.64
Poland PLN 18,000,000 Poland Government Bond 4.00%
25/10/2023 5,588,124 6.98
5,588,124 6.98
Romania RON 10,000,000 Romania Government Bond 5.80%
26/10/2015 3,180,516 3.97
3,180,516 3.97
Russia RUB 230,000,000 Russian Federal Bond - OFZ 7.60%
14/4/2021 6,982,210 8.72
RUB 70,000,000 Russian Federal Bond - OFZ 7.00%
25/1/2023 2,019,368 2.52
9,001,578 11.24
South Africa ZAR 37,000,000 South Africa Government Bond
13.50% 15/9/2015 4,075,469 5.09
USD 400,000 South Africa Government
International Bond 4.665%
17/1/2024 386,232 0.48
USD 1,350,000 South Africa Government
International Bond
5.875% 16/9/2025 1,410,750 1.76
5,872,451 7.33
Uruguay UYU 86,394,386 Uruguay Government
International Bond
5.00% 14/9/2018 4,444,554 5.55
4,444,554 5.55
Venezuela USD 6,000,000 Petroleos de Venezuela SA 9.75%
17/5/2035 4,191,360 5.23
USD 2,600,000 Venezuela Government
International Bond
11.75% 21/10/2026 2,141,750 2.68
6,333,110 7.91
Total Bonds 62,455,703 77.97
Total Transferable Securities and Money
Market Instruments Admitted to an
Official Stock Exchange Listing or
Dealt in on Another Regulated Market 62,455,703 77.97
Securities portfolio at market value 62,455,703 77.97
Other Net Assets 17,651,209 22.03
Total Net Assets (USD) 80,106,912 100.00
Portfolio of Investments as at 30 November 2013
Sector Breakdown as at 30 November 2013
% of netassets *
Government 72.74
Energy 5.23
Other Net Assets 22.03
100.00
* Based on the market value of the Portfolio of Investments

60 BlackRock Strategic Funds (BSF)
BlackRock Emerging Markets Flexi Dynamic Bond Fund continued
Swaps as at 30 November 2013
Nominal Value Description
Unrealised appreciation/
(depreciation) USD
USD 8,000,000 Credit Default Swaps (Citibank) (Fund receives
Fixed 5.000% and provides default protection
on CDX EM 20 Version 1) (20/12/2018) (71,056)
USD 5,600,000 Credit Default Swaps (Citibank) (Fund receives
Fixed 5.000% and provides default protection
on CDX EM 20 Version 1) (20/12/2018) 17,461
USD 11,200,000 Credit Default Swaps (Citibank) (Fund receives
Fixed 5.000% and provides default protection
on CDX EM 20 Version 1) (20/12/2018) 1,323
USD 5,600,000 Credit Default Swaps (Citibank) (Fund receives
Fixed 5.000% and provides default protection
on CDX EM 20 Version 1) (20/12/2018) 662
USD 3,000,000 Credit Default Swaps (Deutsche Bank) (Fund
receives Fixed 5.000% and provides default
protection on Argentine Republic Government
International Bond 8.280% 31/12/2033)
(20/12/2023) 148,290
(USD underlying exposure – USD 35,417,524) 96,680
Note: The total market value of USD 1,670,746 is included in the Statement of Net Assets
(see note 2(d)).
Open Exchange Traded Futures Contractsas at 30 November 2013
Number of Contracts
Contract/Description
Expirationdate
Underlying exposure
USD
Unrealised appreciation/
(depreciation)USD
50 Euro-Bund December 2013 6,954,260 5,657
Total 6,954,260 5,657
Note: The net unrealised appreciation attributed to these transactions is included
in the Statement of Net Assets (see Note 2(d)).
Open Forward Foreign Exchange Transactionsas at 30 November 2013
Purchases Sales Value date
Unrealised appreciation/
(depreciation) USD
EUR 8,097 USD 10,842 13/12/2013 170
USD 407 EUR 303 13/12/2013 (5)
BRL 2,848,880 USD 1,237,836 18/12/2013 (19,232)
BRL 2,785,340 USD 1,184,243 18/12/2013 7,182
BRL 2,818,830 USD 1,232,707 18/12/2013 (26,956)
BRL 28,325,720 USD 12,281,574 18/12/2013 (165,291)
CLP 628,562,980 USD 1,197,719 18/12/2013 (14,294)
CLP 635,292,970 USD 1,224,307 18/12/2013 (28,211)
COP 2,340,190,070 USD 1,220,438 18/12/2013 (10,625)
COP 2,381,220,410 USD 1,230,732 18/12/2013 292
CZK 24,411,470 USD 1,218,210 18/12/2013 (5,001)
CZK 42,651,650 USD 2,124,355 18/12/2013 (4,638)
CZK 60,202,110 USD 2,982,972 18/12/2013 8,973
EUR 4,375,330 USD 5,876,582 18/12/2013 73,586
EUR 2,950,520 USD 4,015,315 18/12/2013 (2,798)
GBP 1,272,680 USD 2,049,439 18/12/2013 28,500
Open Forward Foreign Exchange Transactionsas at 30 November 2013
Purchases Sales Value date
Unrealised appreciation/
(depreciation) USD
GBP 3,798,590 USD 6,081,935 18/12/2013 120,125
GBP 3,709,460 USD 5,964,033 18/12/2013 92,502
HUF 270,420,060 USD 1,230,317 18/12/2013 (10,628)
HUF 1,149,986,930 USD 5,192,389 18/12/2013 (5,544)
INR 154,125,980 USD 2,456,191 18/12/2013 2,604
KRW 3,187,053,880 USD 2,993,101 18/12/2013 15,838
KRW 1,078,457,020 USD 1,019,528 18/12/2013 (1,343)
MXN 15,664,140 USD 1,213,119 18/12/2013 (19,643)
MXN 80,398,100 USD 6,194,995 18/12/2013 (69,336)
MXN 52,429,190 USD 4,004,529 18/12/2013 (9,865)
MYR 12,822,670 USD 4,005,323 18/12/2013 (29,818)
PEN 3,414,790 USD 1,216,613 18/12/2013 (1,288)
PEN 3,434,510 USD 1,222,246 18/12/2013 98
PHP 44,306,500 USD 1,019,712 18/12/2013 (5,658)
PHP 130,052,610 USD 2,984,569 18/12/2013 (8,021)
PLN 3,716,770 USD 1,183,979 18/12/2013 16,992
PLN 6,987,860 USD 2,260,582 18/12/2013 (2,649)
PLN 9,309,470 USD 2,984,257 18/12/2013 23,839
RON 4,035,730 USD 1,226,293 18/12/2013 9,394
RON 3,972,860 USD 1,196,403 18/12/2013 20,034
RUB 2,696,610 USD 81,052 18/12/2013 (23)
USD 7,980,857 AUD 8,767,590 18/12/2013 (878)
USD 22,648,025 BRL 53,050,780 18/12/2013 (44,365)
USD 6,471,375 BRL 14,774,150 18/12/2013 151,756
USD 2,413,321 CLP 1,263,855,950 18/12/2013 33,799
USD 2,439,375 COP 4,721,410,230 18/12/2013 (1,462)
USD 2,307,722 CZK 46,534,760 18/12/2013 (4,978)
USD 3,980,989 CZK 80,730,470 18/12/2013 (31,182)
USD 5,856,493 EUR 4,375,330 18/12/2013 (93,675)
USD 6,045,826 GBP 3,798,590 18/12/2013 (156,234)
USD 2,413,630 HUF 536,549,970 18/12/2013 (6,399)
USD 2,391,479 IDR 27,710,062,870 18/12/2013 69,668
USD 812,130 IDR 9,664,342,380 18/12/2013 2,360
USD 788,289 IDR 9,037,736,490 18/12/2013 31,022
USD 6,420,055 INR 405,307,430 18/12/2013 (45,875)
USD 10,225,600 JPY 1,017,150,560 18/12/2013 281,968
USD 3,014,845 JPY 300,387,090 18/12/2013 78,270
USD 2,887,178 JPY 289,750,560 18/12/2013 54,586
USD 12,533,078 MXN 165,803,440 18/12/2013 (99,752)
USD 4,771,148 MXN 62,466,130 18/12/2013 11,754
USD 2,436,606 PEN 6,849,300 18/12/2013 (1,063)
USD 6,752,167 PLN 21,093,860 18/12/2013 (63,727)
USD 2,856,505 PLN 8,950,000 18/12/2013 (35,439)
USD 1,259,932 PLN 3,899,400 18/12/2013 (51)
USD 5,673,301 RON 18,868,590 18/12/2013 (104,009)
USD 7,407,951 RUB 243,110,440 18/12/2013 102,862
USD 1,968,550 RUB 64,692,460 18/12/2013 24,642
USD 2,434,203 TRY 4,987,950 18/12/2013 (30,097)
USD 769,224 TRY 1,563,040 18/12/2013 (2,997)
USD 758,571 TRY 1,532,950 18/12/2013 1,216
USD 3,198,363 ZAR 33,290,000 18/12/2013 (63,329)
USD 4,931,726 ZAR 50,109,473 18/12/2013 22,094
ARS 18,223,480 USD 2,681,896 4/2/2014 (12,603)
Net unrealised appreciation
(USD underlying exposure – USD 244,235,434) 47,144
Note: The net unrealised appreciation attributed to these transactions is included
in the Statements of Net Assets (see Note 2(d)).
Bank of America N.A., Barclays Bank Plc, BNP Paribas S.A., Citibank N.A., Deutsche Bank
AG London, Goldman Sachs International, HSBC Bank Plc, JPMorgan Chase Bank N.A.,
State Street Bank and Trust Company and UBS AG London are the counterparties to
these Open Forward Foreign Exchange Transactions.

Transferable Securities and Money Market Instruments Admitted to an Official Stock Exchange Listing or Dealt in on Another Regulated Market Funds
Holding Description Market Value
(EUR) % Holding Description Market Value
(EUR) %
1 This fund is managed by BlackRock.
Unaudited Interim Report and Accounts 61
The notes on pages 150 to 158 form an integral part of these financial statements.
BlackRock Euro Dynamic Diversified Growth Fund
BONDS
Italy EUR 2,515,000 Italy Buoni Poliennali Del Tesoro
5.50% 1/11/2022 2,839,246 0.79
EUR 3,233,000 Italy Buoni Poliennali Del Tesoro
4.50% 1/5/2023 3,397,883 0.94
EUR 7,500,000 Italy Buoni Poliennali Del Tesoro
4.50% 1/3/2024 7,802,438 2.17
14,039,567 3.90
Total Bonds 14,039,567 3.90
FUNDS
Guernsey 1,145,797 Alcentra European Floating Rate
Income Fund Ltd 1,495,653 0.42
1,115,810 Better Capital PCC Ltd 1,471,612 0.41
139,499 BH Macro Ltd 2,777,425 0.77
2,473,500 Bluecrest Allblue Fund Ltd 4,124,561 1.15
34,622 HarbourVest Global Private Equity Ltd 257,462 0.07
902,081 NB Distressed Debt Investment
Fund Ltd 857,989 0.24
826,100 NB Global Floating Rate Income
Fund Ltd 1,049,519 0.29
3,356,000 NB Global Floating Rate Income
Fund Ltd 4,133,419 1.15
384,640 NB Global Floating Rate Income
Fund Ltd 298,745 0.08
702,149 Starwood European Real Estate
Finance Ltd 836,292 0.23
17,302,677 4.81
Ireland 1,728,854 Carador Income Fund Plc 1,218,978 0.34
99,356 iShares JP Morgan $ Emerging
Markets Bond UCITS ETF1 7,841,647 2.18
61,190 Stone Harbor Investment Funds
Plc - Emerging Market Debt Fund 6,712,002 1.86
15,772,627 4.38
Jersey 1,631,000 CVC Credit Partners European
Opportunities Ltd 1,661,581 0.46
1,347,000 Foresight Solar Fund Ltd 1,596,237 0.44
3,257,818 0.90
Luxembourg 110,392 Goldman Sachs Global High Yield
Portfolio 1,711,076 0.48
1,711,076 0.48
United Kingdom 593,836 Scottish Mortgage Investment
Trust Plc 7,215,749 2.00
7,215,749 2.00
Total Funds 45,259,947 12.57
Total Transferable Securities and Money
Market Instruments Admitted to an
Official Stock Exchange Listing or
Dealt in on Another Regulated Market 59,299,514 16.47
Ireland 2,340,019 BlackRock Developed World Index
Sub-Fund 1 34,473,160 9.58
64,181,023 Institutional Cash Series Plc -
Institutional Euro Liquidity
Fund 1 64,181,023 17.83
279,564 Institutional Cash Series Plc -
Institutional Ultra Bond Fund 1 31,008,890 8.62
129,663,073 36.03
Luxembourg 573,733 BlackRock Global Funds - ASEAN
Leaders X2 RF 1 4,904,889 1.36
72,720 BlackRock Global Funds - Asian
Dragon Fund X2 (USD) 1 1,749,699 0.49
1,450,232 BlackRock Global Funds -
Emerging Markets Equity
Income Fund X2 (USD) 1 11,950,793 3.32
1,144,160 BlackRock Global Funds -
Euro Corporate Bond
Fund X2 (EUR) 1 17,219,608 4.78
821,731 BlackRock Global Funds -
Euro Short Duration Bond
Fund X2 (EUR) 1 13,032,654 3.62
4,640,802 BlackRock Global Funds - Global
Corporate Bond Fund
X2 (EUR) Hedged 1 56,292,928 15.64
3,303,796 BlackRock Global Funds - Global
Equity Income X2 (USD) 1 35,111,399 9.76
166,612 BlackRock Global Funds - US Dollar
High Yield Bond Fund X2 (USD) 1 3,603,765 1.00
143,865,735 39.97
United Kingdom 1,327,336 BlackRock Frontiers Investment
Trust Plc 1 1,788,514 0.50
1,788,514 0.50
Total Funds 275,317,322 76.50
Other Transferable Securities and Money Market Instruments
BONDS
Luxembourg USD 4,200,000 Societe Generale SA 0.00%
28/3/2016 (Zero Coupon) 2,991,252 0.83
2,991,252 0.83
Total Bonds 2,991,252 0.83
Total Other Transferable Securities
and Money Market Instruments 2,991,252 0.83
Securities portfolio at market value 337,608,088 93.80
Other Net Assets 22,297,031 6.20
Total Net Assets (EUR) 359,905,119 100.00
Portfolio of Investments as at 30 November 2013

62 BlackRock Strategic Funds (BSF)
BlackRock Euro Dynamic Diversified Growth Fund continued
Swaps as at 30 November 2013
Nominal Value Description
Unrealised appreciation/
(depreciation) EUR
USD 1,000,000 Credit Default Swaps (Bank of America) (Fund
receives Fixed 5.000% and provides default
protection on CDX NA HY 21 Version 1)
(20/12/2018) 14,509
USD 1,363,000 Credit Default Swaps (Citibank) (Fund receives
Fixed 5.000% and provides default protection
on CDX NA HY 21 Version 1) (20/12/2018) 20,297
USD 3,933,000 Total Return Swap (Citibank) (Fund receives Citi
Dynavo2x Index and pays Fixed 0.000%)
(20/6/2014) 117,746
USD 9,816,231 Total Return Swap (Citibank) (Fund receives
Emerging Lifestyle Trends Index and pays
6 Month USD LIBOR BBA) (5/9/2014) 864,306
USD 2,187,000 Total Return Swap (JP Morgan Chase Bank) (Fund
receives Global Volatility Carry Strategy Index
and pays Fixed 0.000%) (3/7/2014) 48,540
EUR 5,940,141 Total Return Swap (JP Morgan Chase Bank) (Fund
receives JP European Basket Index and pays
3 Month EURIBOR) (19/8/2014) 455,838
EUR 1,692,836 Total Return Swap (JP Morgan Chase Bank) (Fund
receives JP European Basket Index and pays
3 Month EURIBOR) (13/11/2014) (4,337)
(EUR underlying exposure – EUR 22,697,319) 1,516,899
Note: The total market value of EUR 1,605,272 is included in the Statement of Net Assets
(see Note 2(d)).
Open Exchange Traded Futures Contractsas at 30 November 2013
Number of Contracts
Contract/Description
Expirationdate
Underlying exposure
EUR
Unrealised appreciation/
(depreciation)EUR
177 EURO STOXX 50 Index December 2013 5,460,450 271,150
(41) FTSE 100 Index December 2013 3,280,683 (107,525)
1,320 FTSE 100 Index December 2014 3,831,993 67,299
(67) H-Shares Index December 2013 3,638,606 (52,740)
927 Nikkei 225 Mini December 2013 10,468,859 863,160
275 STOXX 600 Oil Index December 2013 4,567,750 99,000
(80) US Treasury 10 Year Note March 2014 6,476,266 459
Total 37,724,607 1,140,803
Note: The net unrealised appreciation of EUR 1,140,803 attributed to these transactions
is included in the Statement of Net Assets (see Note 2(d)).
Open Forward Foreign Exchange Transactionsas at 30 November 2013
Purchases Sales Value Date
Unrealised appreciation/
(depreciation)EUR
EUR 752,800 SEK 6,723,371 13/12/2013 (2,557)
SEK 324,989,095 EUR 36,417,430 13/12/2013 94,450
USD 2,053,858 KRW 2,208,000,000 29/1/2014 (18,281)
USD 2,755,264 KRW 2,944,000,000 29/1/2014 (12,045)
USD 2,055,483 KRW 2,208,000,000 29/1/2014 (17,087)
USD 2,048,226 MYR 6,600,000 29/1/2014 5,631
USD 2,392,047 MYR 7,700,000 29/1/2014 8,369
USD 2,395,023 MYR 7,700,000 29/1/2014 10,555
USD 2,385,364 THB 75,950,000 29/1/2014 19,426
USD 4,093,696 THB 130,200,000 29/1/2014 36,606
USD 2,387,239 THB 75,950,000 29/1/2014 20,802
EUR 1,919,724 CAD 2,705,000 31/1/2014 46,021
EUR 6,090,000 CHF 7,497,308 31/1/2014 (6,622)
EUR 11,534,122 GBP 9,763,000 31/1/2014 (205,956)
EUR 8,493,486 JPY 1,130,500,000 31/1/2014 379,172
EUR 6,780,320 USD 9,140,000 31/1/2014 67,641
EUR 50,912,419 USD 68,733,000 31/1/2014 432,923
EUR 10,610,333 USD 14,260,000 31/1/2014 137,378
USD 13,217,470 AUD 14,000,000 31/1/2014 346,325
USD 9,010,000 CAD 9,444,796 31/1/2014 74,972
USD 1,786,000 EUR 1,322,393 31/1/2014 (10,703)
USD 4,000,000 GBP 2,506,925 31/1/2014 (76,881)
USD 4,000,000 GBP 2,507,373 31/1/2014 (77,419)
USD 13,860,000 JPY 1,366,244,649 31/1/2014 372,781
USD 6,034,399 ZAR 62,100,000 31/1/2014 (14,050)
Net unrealised appreciation
(EUR underlying exposure – EUR 240,157,621) 1,611,451
Note: the net unrealised appreciation attributed to these transactions is included
in the Statements of Net Assets (see Note 2(d)).
Citibank N.A., Deutsche Bank AG London, Goldman Sachs International, HSBC Bank Plc,
State Street Bank and Trust Company, State Street Bank London and UBS AG London are
the counterparties to these Open Forward Foreign Exchange Transactions.
Sector Breakdownas at 30 November 2013
% of netassets *
Funds 80.52
Financial 9.38
Government 3.90
Other Net Assets 6.20
100.00
* Based on the market value of the Portfolio of Investments

Unaudited Interim Report and Accounts 63
The notes on pages 150 to 158 form an integral part of these financial statements.
BlackRock Euro Dynamic Diversified Growth Fund continued
Written Put Options as at 30 November 2013
Number of contracts
subjectto Put Issuer
Underlying exposure
EUR
Unrealised appreciation/
(depreciation)EUR
Market Value
EUR
(356) DAX Index Put Option
strike price EUR 7,450.00
expiring on 20/12/2013 83,258 186,544 (3,026)
(428) EURO STOXX 50 Index Put Option
strike price EUR 2,600.00
expiring on 19/12/2014 2,835,228 92,448 (399,752)
(187) EURO STOXX Banks Index
Put Option
strike price EUR 115.00
expiring on 20/12/2013 25,257 24,123 (935)
(960) EURO STOXX Banks Index
Put Option
strike price EUR 115.00
expiring on 21/3/2014 574,554 52,800 (43,200)
(57) Nikkei 225 Index Put Option
strike price JPY 13,250.00
expiring on 13/12/2013 37,160 25,039 (818)
(127) S&P 500 Index Put Option
strike price USD 1,625.00
expiring on 21/12/2013 538,518 35,851 (10,260)
Total Written Put Options 4,093,975 416,805 (457,991)
Note: Written Put Options are included in the Statement of Net Assets (see Note 2(d)).
Merrill Lynch International is the counterparty to these Written Put Options.
Written Call Options as at 30 November 2013
Number of contracts
subjectto Call Issuer
Underlying exposure
EUR
Unrealised appreciation/
(depreciation)EUR
Market Value
EUR
(428) EURO STOXX 50 Index Call Option
strike price EUR 3,500.00
expiring on 19/12/2014 2,574,957 (26,264) (221,276)
(57) Nikkei 225 Index Call Option
strike price JPY 14,750.00
expiring on 13/12/2013 5,339,211 (354,665) (413,058)
Total Written Call Options 7,914,168 (380,929) (634,334)
Note: Written Call Options are included in the Statement of Net Assets (see Note 2(d)).
Merrill Lynch International is the counterparty to these Written Call Options.
Purchased Call Options as at 30 November 2013
Number of contracts
subjectto Call Issuer
Underlying exposure
EUR
Unrealised appreciation/
(depreciation)EUR
Market Value
EUR
428 EURO STOXX 50 Index
Call Option
strike price EUR 3,100.00
expiring on 19/12/2014 5,987,931 103,576 754,136
960 EURO STOXX Banks Index
Call Option
strike price EUR 150.00
expiring on 21/3/2014 2,046,932 2,496 144,000
2,793 Ishares MSCI EAFE ETF
Call Option
strike price USD 67.00
expiring on 21/12/2013 4,343,721 3,322 73,848
18 KOSPI 200 Index Call Option
strike price KRW 270.00
expiring on 12/12/2013 836,130 (46,500) 17,301
818 SPDR Gold Shares Call Option
strike price USD 132.00
expiring on 21/12/2013 192,766 (171,482) 4,206
Total Purchased Call Options 13,407,480 (108,588) 993,491
Note: Purchased Call Options are included in the Statement of Net Assets (see Note 2(d)).
Citibank N.A. and Merrill Lynch International are the counterparties to these Purchased
Call Options.
Purchased Put Options as at 30 November 2013
Number of contracts
subjectto Put Issuer
Underlying exposure
EUR
Unrealised appreciation/
(depreciation)EUR
Market Value
EUR
178 DAX Index Put Option
strike price EUR 7,900.00
expiring on 20/12/2013 99,275 (171,485) 2,581
117 S&P 500 Index Put Option
strike price USD 1,550.00
expiring on 21/12/2013 251,025 (158,044) 6,874
127 S&P 500 Index Put Option
strike price USD 1,725.00
expiring on 21/12/2013 1,883,762 (141,178) 34,046
Total Purchased Put Options 2,234,062 (470,707) 43,501
Note: Purchased Put Options are included in the Statement of Net Assets (see Note 2(d)).
Merrill Lynch International is the counterparty to these Purchased Put Options.

Transferable Securities and Money Market Instruments Admitted to an Official Stock Exchange Listing or Dealt in on Another Regulated Market
Transferable Securities and Money Market Instruments Admitted to an Official Stock Exchange Listing or Dealt in on Another Regulated Market
Holding Description Market Value
(EUR) % Holding Description Market Value
(EUR) %
1 This fund is managed by BlackRock.
64 BlackRock Strategic Funds (BSF)
BlackRock European Absolute Return Fund
COMMON STOCKS (SHARES)
Denmark 517,210 Pandora A/S 19,679,017 1.31
19,679,017 1.31
France 360,095 Eiffage SA 14,952,945 1.00
129,333 L'Oreal SA 16,004,958 1.06
436,298 Legrand SA 17,796,595 1.18
216,611 Remy Cointreau SA 13,484,035 0.90
1,074,526 Rexel SA 20,125,872 1.34
240,894 Sanofi 18,837,911 1.25
101,202,316 6.73
Germany 228,228 Bayer AG 22,352,650 1.49
287,170 Bayerische Motoren Werke AG 24,369,246 1.62
1,535,265 Commerzbank AG 16,903,268 1.12
116,936 Continental AG 17,920,442 1.19
660,618 Deutsche Post AG 17,156,250 1.14
270,893 Drillisch AG 5,849,934 0.39
298,784 NORMA Group AG 11,028,117 0.73
468,262 ProSiebenSat.1 Media AG 15,471,377 1.03
131,051,284 8.71
Greece 576,838 OPAP SA 5,641,475 0.38
5,641,475 0.38
Ireland 36,826 Paddy Power Plc 2,085,088 0.14
2,272,267 Ryanair Holdings Plc 13,997,165 0.93
16,082,253 1.07
Italy 748,631 Atlantia SpA 12,434,761 0.83
630,115 Azimut Holding SpA 11,915,475 0.79
22,361,061 Telecom Italia SpA 15,999,339 1.06
40,349,575 2.68
Netherlands 233,684 ASML Holding NV 16,138,217 1.07
452,660 Koninklijke Boskalis Westminster NV 16,700,891 1.11
1,392,811 Reed Elsevier NV 21,964,629 1.46
366,750 Ziggo NV 11,548,958 0.77
66,352,695 4.41
Spain 449,369 Grifols SA 15,159,463 1.01
15,159,463 1.01
Sweden 1,724,364 Nordea Bank AB 16,300,613 1.08
16,300,613 1.08
United Kingdom 2,609,981 Merlin Entertainments Plc'144A' 11,110,962 0.74
11,110,962 0.74
Total Common Stocks (Shares) 422,929,653 28.12
Total Transferable Securities and Money
Market Instruments Admitted to an
Official Stock Exchange Listing or
Dealt in on Another Regulated Market 422,929,653 28.12
Funds
Ireland 114,535,204 Institutional Cash Series Plc -
Institutional Euro Assets
Liquidity Fund 1 114,535,204 7.61
34,716,237 Institutional Cash Series Plc -
Institutional Euro Liquidity
Fund 1 34,716,237 2.31
149,251,441 9.92
Total Funds 149,251,441 9.92
Securities portfolio at market value 572,181,094 38.04
Other Net Assets 932,117,347 61.96
Total Net Assets (EUR) 1,504,298,441 100.00
Portfolio of Investments as at 30 November 2013

Unaudited Interim Report and Accounts 65
The notes on pages 150 to 158 form an integral part of these financial statements.
BlackRock European Absolute Return Fund continued
TIME DEPOSITS Barclays Bank Plc 227,980,000 15.15
BNP Paribas SA 227,980,000 15.15
HSBC Bank Plc 118,350,000 7.87
Societe Generale SA 227,980,000 15.16
Total Time Deposits 802,290,000 53.33
Time Deposit as at 30 November 2013
Description
Market ValueEUR %
Open Exchange Traded Futures Contractsas at 30 November 2013
Number of Contracts
Contract/Description
Expirationdate
Underlying exposure
EUR
Unrealisedappreciation/
(depreciation) EUR
(17,992) STOXX EUROPE
600 Index December 2013 292,459,960 (10,023,634)
Total 292,459,960 (10,023,634)
Note: The net unrealised depreciation attributed to these transactions is included
in the Statement of Net Assets (see note 2(d)).
Sector Breakdownas at 30 November 2013
% of netassets *
Funds 9.92
Consumer, Cyclical 7.04
Consumer, Non-cyclical 6.54
Industrial 5.77
Communications 4.71
Financial 2.99
Technology 1.07
Other Net Assets 61.96
100.00
* Based on the market value of the Portfolio of Investments
Open Forward Foreign Exchange Transactionsas at 30 November 2013
Purchases Sales Value Date
Unrealised appreciation/
(depreciation)EUR
CHF 16,573,880 EUR 13,451,056 13/12/2013 27,988
EUR 77,668 CHF 95,713 13/12/2013 (172)
EUR 200,779 GBP 167,869 13/12/2013 (770)
GBP 13,756,749 EUR 16,313,251 13/12/2013 203,509
EUR 5,590 SEK 49,938 13/12/2013 (18)
SEK 2,131,724 EUR 238,893 13/12/2013 527
Net unrealised appreciation
(EUR underlying exposure – EUR 30,520,222) 231,064
Note: The net unrealised appreciation attributed to these transactions is included
in the Statement of Net Assets (see note 2(d)).
State Street Bank and Trust Company is the counterparty to these Open Forward Foreign
Exchange Transactions.

Holding DescriptionMarket Value
EUR
Unrealisedappreciation/
(depreciation) EUR Holding Description
Market ValueEUR
Unrealisedappreciation/
(depreciation) EUR
* Investments which are less than 0,5 USD have been rounded down to zero.
Note: The net unrealised appreciation attributed to these transactions is included in the Statement of Net Assets (see Note 2(d)).
Deutsche Bank and JP Morgan are the counterparties to these Contracts for Difference.
66 BlackRock Strategic Funds (BSF)
BlackRock European Absolute Return Fund continued
Belgium (365,669) Belgacom SA (7,988,039) (1,057,284)
(7,988,039) (1,057,284)
Denmark 1,284,228 GN Store Nord A/S 22,640,811 3,902,340
187,791 Novo Nordisk A/S 'B' 24,635,404 443,857
47,276,215 4,346,197
Finland (857,965) Outotec OYJ (6,443,317) 2,578,974
(6,443,317) 2,578,974
France (161,729) Air Liquide SA (16,609,569) (669,333)
(190,669) Casino Guichard Perrachon SA (15,671,085) (1,266,975)
(696,367) CGG SA (10,630,042) 791,908
(287,102) Danone (15,368,570) 223,940
(724,826) Eutelsat Communications SA (15,583,759) 271,886
305,729 Salvatore Ferragamo SpA 8,939,516 2,510,035
(110,614) Sodexo (8,163,313) (214,930)
(207,202) Technip SA (15,258,355) 1,711,859
(339,291) Vallourec SA (14,221,382) 593,816
(1,264,290) Veolia Environnement SA (15,120,909) 838,929
(117,687,468) 4,791,135
Germany 325,481 Cap Gemini SA 15,667,028 341,873
(662,548) Deutsche Bank AG (23,613,211) (470,799)
(1,001,445) Deutsche Lufthansa AG (16,063,178) (2,654,510)
(176,635) MTU Aero Engines AG (12,217,843) 53,589
270,029 Publicis Groupe SA 17,605,891 1,547,656
(279,514) RWE AG (7,897,668) (1,229,760)
380,564 Societe Generale SA 16,206,318 2,838,410
(733,069) SOITEC (1,084,942) 779,149
(11,397,605) 1,205,608
Italy (3,569,072) Fiat SpA (20,950,453) (258,779)
(20,950,453) (258,779)
Luxembourg (1,043,275) SES SA (22,639,067) (460,056)
(22,639,067) (460,056)
Netherlands (1,220,745) ArcelorMittal (15,595,017) (1,795,366)
(355,565) Fugro NV (15,954,202) 219,487
(446,255) Koninklijke Vopak NV (19,586,132) 199,570
(2,188,727) SNS REAAL NV* – 22
(51,135,351) (1,376,287)
Norway (237,035) Norwegian Air Shuttle AS (6,554,303) (441,467)
(1,114,212) Petroleum Geo-Services ASA (9,851,734) 220,150
1,352,222 Statoil ASA 22,593,864 (209,639)
6,187,827 (430,956)
South Korea (445,112) SABMiller Plc (16,921,986) (526,335)
(16,921,986) (526,335)
Switzerland 270,227 Actelion Ltd 16,744,499 424,816
215,964 Cie Financiere Richemont SA 16,209,571 1,575,725
(231,450) Holcim Ltd (12,421,944) 459,959
23,453 Kuoni Reisen Holding AG 7,590,492 1,525,431
435,843 Novartis AG 25,341,048 1,178,618
22,755 Partners Group Holding AG 4,187,452 (129,528)
104,521 Roche Holding AG 21,444,171 1,024,629
1,544,384 UBS AG 21,801,856 (128,797)
100,897,145 5,930,853
United Kingdom (2,795,072) Aberdeen Asset Management Plc (16,531,956) (4,085,356)
(1,048,708) Admiral Group Plc (15,714,696) 144,794
(1,750,773) Ashmore Group Plc (8,316,162) (487,700)
7,155,682 Barclays Plc 23,447,222 388,318
3,136,573 Barratt Developments Plc 12,473,334 1,203,880
(581,027) British American Tobacco Plc (22,750,133) 1,093,499
(669,681) Burberry Group Plc (12,350,826) (297,037)
(1,919,858) Bwin.Party Digital Entertainment Plc (2,929,891) (124,704)
(260,585) Carnival Plc (7,028,986) 605,119
2,916,278 Elementis Plc 9,097,140 162,628
803,592 Grafton Group Plc 6,001,542 1,277,480
(1) Home Retail Group Plc (2) –
1,131,850 Hunting Plc 10,858,566 (1,006,331)
1,225,797 IG Group Holdings Plc 8,610,160 160,218
(2,041,961) J Sainsbury Plc (9,997,442) (293,679)
(2,074,249) Kazakhmys Plc (5,877,731) 1,082,088
(1,219,342) Lonmin Plc (4,605,970) (707,198)
(1,703,619) Marks & Spencer Group Plc (10,010,903) (523,238)
743,251 Playtech Plc 6,224,673 513,475
876,272 Royal Dutch Shell Plc 'B' 22,610,605 (591,764)
325,529 Spirax-Sarco Engineering Plc 11,507,058 558,060
1,937,986 Sports Direct International Plc 17,252,256 3,287,935
9,825,553 Taylor Wimpey Plc 12,611,639 1,823,957
3,631,334 Thomas Cook Group Plc 7,695,693 772,007
3,275,246 William Hill Plc 15,089,420 (1,468,896)
(1,919,894) WM Morrison Supermarkets Plc (6,115,773) 426,958
41,248,837 3,914,513
Total market value
(EUR underlying exposure – EUR 868,313,874) (59,553,262) 18,657,583
Contracts For Difference as at 30 November 2013
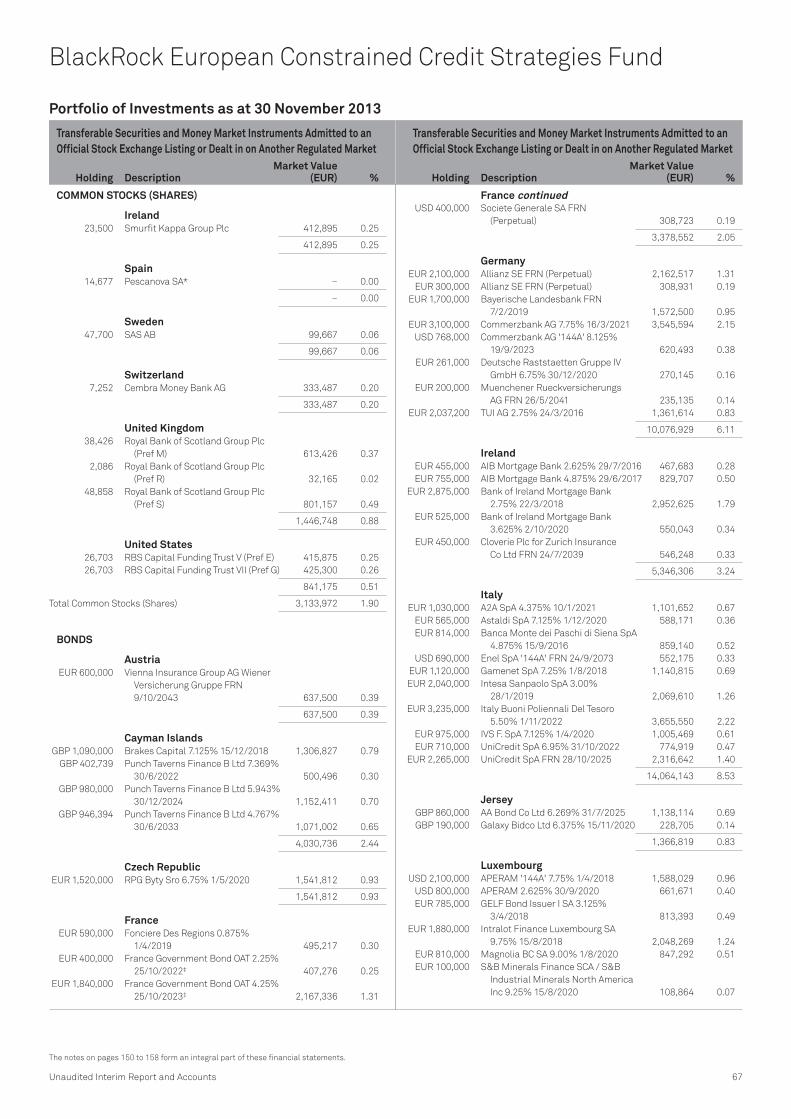
Transferable Securities and Money Market Instruments Admitted to an Official Stock Exchange Listing or Dealt in on Another Regulated Market
Transferable Securities and Money Market Instruments Admitted to an Official Stock Exchange Listing or Dealt in on Another Regulated Market
Holding Description Market Value
(EUR) % Holding Description Market Value
(EUR) %
Unaudited Interim Report and Accounts 67
The notes on pages 150 to 158 form an integral part of these financial statements.
BlackRock European Constrained Credit Strategies Fund
COMMON STOCKS (SHARES)
Ireland 23,500 Smurfit Kappa Group Plc 412,895 0.25
412,895 0.25
Spain 14,677 Pescanova SA* – 0.00
– 0.00
Sweden 47,700 SAS AB 99,667 0.06
99,667 0.06
Switzerland 7,252 Cembra Money Bank AG 333,487 0.20
333,487 0.20
United Kingdom 38,426 Royal Bank of Scotland Group Plc
(Pref M) 613,426 0.37
2,086 Royal Bank of Scotland Group Plc
(Pref R) 32,165 0.02
48,858 Royal Bank of Scotland Group Plc
(Pref S) 801,157 0.49
1,446,748 0.88
United States 26,703 RBS Capital Funding Trust V (Pref E) 415,875 0.25
26,703 RBS Capital Funding Trust VII (Pref G) 425,300 0.26
841,175 0.51
Total Common Stocks (Shares) 3,133,972 1.90
BONDS
Austria EUR 600,000 Vienna Insurance Group AG Wiener
Versicherung Gruppe FRN
9/10/2043 637,500 0.39
637,500 0.39
Cayman Islands GBP 1,090,000 Brakes Capital 7.125% 15/12/2018 1,306,827 0.79
GBP 402,739 Punch Taverns Finance B Ltd 7.369%
30/6/2022 500,496 0.30
GBP 980,000 Punch Taverns Finance B Ltd 5.943%
30/12/2024 1,152,411 0.70
GBP 946,394 Punch Taverns Finance B Ltd 4.767%
30/6/2033 1,071,002 0.65
4,030,736 2.44
Czech Republic EUR 1,520,000 RPG Byty Sro 6.75% 1/5/2020 1,541,812 0.93
1,541,812 0.93
France EUR 590,000 Fonciere Des Regions 0.875%
1/4/2019 495,217 0.30
EUR 400,000 France Government Bond OAT 2.25%
25/10/2022‡ 407,276 0.25
EUR 1,840,000 France Government Bond OAT 4.25%
25/10/2023‡ 2,167,336 1.31
USD 400,000 Societe Generale SA FRN
(Perpetual) 308,723 0.19
3,378,552 2.05
Germany EUR 2,100,000 Allianz SE FRN (Perpetual) 2,162,517 1.31
EUR 300,000 Allianz SE FRN (Perpetual) 308,931 0.19
EUR 1,700,000 Bayerische Landesbank FRN
7/2/2019 1,572,500 0.95
EUR 3,100,000 Commerzbank AG 7.75% 16/3/2021 3,545,594 2.15
USD 768,000 Commerzbank AG '144A' 8.125%
19/9/2023 620,493 0.38
EUR 261,000 Deutsche Raststaetten Gruppe IV
GmbH 6.75% 30/12/2020 270,145 0.16
EUR 200,000 Muenchener Rueckversicherungs
AG FRN 26/5/2041 235,135 0.14
EUR 2,037,200 TUI AG 2.75% 24/3/2016 1,361,614 0.83
10,076,929 6.11
Ireland EUR 455,000 AIB Mortgage Bank 2.625% 29/7/2016 467,683 0.28
EUR 755,000 AIB Mortgage Bank 4.875% 29/6/2017 829,707 0.50
EUR 2,875,000 Bank of Ireland Mortgage Bank
2.75% 22/3/2018 2,952,625 1.79
EUR 525,000 Bank of Ireland Mortgage Bank
3.625% 2/10/2020 550,043 0.34
EUR 450,000 Cloverie Plc for Zurich Insurance
Co Ltd FRN 24/7/2039 546,248 0.33
5,346,306 3.24
Italy EUR 1,030,000 A2A SpA 4.375% 10/1/2021 1,101,652 0.67
EUR 565,000 Astaldi SpA 7.125% 1/12/2020 588,171 0.36
EUR 814,000 Banca Monte dei Paschi di Siena SpA
4.875% 15/9/2016 859,140 0.52
USD 690,000 Enel SpA '144A' FRN 24/9/2073 552,175 0.33
EUR 1,120,000 Gamenet SpA 7.25% 1/8/2018 1,140,815 0.69
EUR 2,040,000 Intesa Sanpaolo SpA 3.00%
28/1/2019 2,069,610 1.26
EUR 3,235,000 Italy Buoni Poliennali Del Tesoro
5.50% 1/11/2022 3,655,550 2.22
EUR 975,000 IVS F. SpA 7.125% 1/4/2020 1,005,469 0.61
EUR 710,000 UniCredit SpA 6.95% 31/10/2022 774,919 0.47
EUR 2,265,000 UniCredit SpA FRN 28/10/2025 2,316,642 1.40
14,064,143 8.53
Jersey GBP 860,000 AA Bond Co Ltd 6.269% 31/7/2025 1,138,114 0.69
GBP 190,000 Galaxy Bidco Ltd 6.375% 15/11/2020 228,705 0.14
1,366,819 0.83
Luxembourg USD 2,100,000 APERAM '144A' 7.75% 1/4/2018 1,588,029 0.96
USD 800,000 APERAM 2.625% 30/9/2020 661,671 0.40
EUR 785,000 GELF Bond Issuer I SA 3.125%
3/4/2018 813,393 0.49
EUR 1,880,000 Intralot Finance Luxembourg SA
9.75% 15/8/2018 2,048,269 1.24
EUR 810,000 Magnolia BC SA 9.00% 1/8/2020 847,292 0.51
EUR 100,000 S&B Minerals Finance SCA / S&B
Industrial Minerals North America
Inc 9.25% 15/8/2020 108,864 0.07
Portfolio of Investments as at 30 November 2013
France continued

Transferable Securities and Money Market Instruments Admitted to an Official Stock Exchange Listing or Dealt in on Another Regulated Market
Transferable Securities and Money Market Instruments Admitted to an Official Stock Exchange Listing or Dealt in on Another Regulated Market
Holding Description Market Value
(EUR) % Holding Description Market Value
(EUR) %
68 BlackRock Strategic Funds (BSF)
BlackRock European Constrained Credit Strategies Fund continued
EUR 1,672,000 Servus Luxembourg Holding SCA
7.75% 15/6/2018 1,756,603 1.07
EUR 940,000 Snai SpA 7.625% 15/6/2018 956,098 0.58
USD 443,000 Telecom Italia Capital SA 6.375%
15/11/2033 284,635 0.17
USD 372,000 Telecom Italia Capital SA 6.00%
30/9/2034 229,824 0.14
USD 400,000 Telecom Italia Capital SA 7.721%
4/6/2038 283,018 0.17
EUR 3,600,000 Telecom Italia Finance SA 6.125%
15/11/2016 3,767,040 2.29
EUR 3,600,000 Telecom Italia Finance SA 6.125%
15/11/2016 3,600,000 2.18
EUR 3,012,000 Telecom Italia Finance SA 7.75%
24/1/2033 3,280,038 1.99
EUR 2,520,000 Wind Acquisition Finance SA 7.375%
15/2/2018 2,666,261 1.62
22,891,035 13.88
Mexico USD 1,640,000 Cemex SAB de CV '144A' 7.25%
15/1/2021 1,229,092 0.75
1,229,092 0.75
Netherlands EUR 570,000 Achmea BV FRN 4/4/2043 614,175 0.37
EUR 845,000 Achmea BV FRN 4/4/2043 910,487 0.55
EUR 360,000 Adria Bidco BV 7.875% 15/11/2020 361,033 0.22
EUR 700,000 Allianz Finance II BV FRN 8/7/2041 800,754 0.49
EUR 401,000 Enel Finance International NV
4.875% 17/4/2023 446,528 0.27
USD 3,300,000 ING Bank NV '144A' 5.80%
25/9/2023 2,532,636 1.54
USD 5,248,001 ING Bank NV FRN 21/11/2023 3,851,576 2.34
EUR 1,845,000 Portugal Telecom International
Finance BV 4.625% 8/5/2020 1,882,472 1.14
AUD 550,000 Royal Bank of Scotland NV FRN
17/5/2018 330,763 0.20
EUR 977,000 Ziggo BV 3.625% 27/3/2020 977,000 0.59
12,707,424 7.71
Portugal EUR 900,000 Caixa Geral de Depositos SA 5.625%
4/12/2015 951,534 0.58
USD 5,190,000 Portugal Government International
Bond 3.50% 25/3/2015 3,822,994 2.32
4,774,528 2.90
Spain CHF 1,100,000 Autonomous Community of Catalonia
2.125% 1/10/2014 893,652 0.54
EUR 112,000 Autonomous Community of Valencia
Spain 4.75% 20/3/2014 112,840 0.07
EUR 740,000 Autonomous Community of Valencia
Spain 3.25% 6/7/2015 744,366 0.45
EUR 2,288,000 Autonomous Community of Valencia
Spain 4.375% 16/7/2015 2,339,629 1.42
EUR 750,000 Autonomous Community of Valencia
Spain 4.00% 2/11/2016 756,195 0.46
EUR 400,000 Ayt Cedulas Cajas Global 4.00%
21/3/2017 417,550 0.25
EUR 300,000 Ayt Cedulas Cajas Global 4.25%
14/6/2018 313,958 0.19
EUR 800,000 Ayt Cedulas Cajas Global 3.75%
14/12/2022 761,960 0.46
EUR 300,000 Ayt Cedulas Cajas Global 4.25%
25/10/2023 293,565 0.18
EUR 300,000 AyT Cedulas Cajas X Fondo de
Titulizacion 3.75% 30/6/2025 262,950 0.16
EUR 1,600,000 AyT Cedulas Cajas XXIII Fondo de
Titulizacion de Activos 4.75%
15/6/2016 1,701,352 1.03
USD 800,000 Banco Bilbao Vizcaya Argentaria SA
FRN (Perpetual) 622,449 0.38
EUR 200,000 BBVA Senior Finance SAU 3.75%
17/1/2018 213,085 0.13
EUR 1,500,000 BPE Financiaciones SA 2.875%
19/5/2016 1,501,327 0.91
EUR 1,100,000 CaixaBank SA 3.125% 14/5/2018 1,136,261 0.69
EUR 1,100,000 Caja Rural de Navarra 2.875%
11/6/2018 1,131,449 0.69
EUR 300,000 Cedulas TDA 4.125% 29/11/2019 309,938 0.19
EUR 400,000 Cedulas TDA 4.25% 28/3/2027 352,330 0.21
EUR 400,000 Cedulas TDA 1 Fondo de Titulizacion
de Activos FRN 8/4/2016 382,288 0.23
EUR 1,100,000 Cedulas TDA 6 Fondo de Titulizacion
de Activos 3.875% 23/5/2025 966,625 0.59
EUR 1,000,000 Cedulas TDA 6 Fondo de Titulizacion
de Activos 4.25% 10/4/2031 834,600 0.51
EUR 100,000 Cedulas TDA 7 Fondo de Titulizacion
de Activos 3.50% 20/6/2017 101,735 0.06
EUR 500,000 Kutxabank SA 3.00% 1/2/2017 520,757 0.31
EUR 1,500,000 Santander Issuances SAU FRN
30/9/2019 1,418,910 0.86
EUR 3,600,000 Spain Government Bond '144A'
5.40% 31/1/2023 3,973,950 2.41
22,063,721 13.38
Switzerland EUR 1,875,000 Credit Suisse AG FRN 18/9/2025 1,981,256 1.20
1,981,256 1.20
United Kingdom GBP 836,361 Annington Finance No 4 Plc FRN
10/1/2023 996,190 0.60
EUR 840,000 Aviva Plc FRN 5/7/2043 937,650 0.57
GBP 462,000 Bakkavor Finance 2 Plc 8.75%
15/6/2020 607,420 0.37
EUR 650,000 Barclays Bank Plc 6.00% 14/1/2021 743,282 0.45
EUR 190,000 Barclays Bank Plc 6.625% 30/3/2022 225,269 0.14
USD 226,000 Barclays Bank Plc 7.625%
21/11/2022 174,962 0.11
EUR 780,000 Barclays Bank Plc FRN (Perpetual) 674,099 0.41
EUR 280,000 Barclays Bank Plc FRN (Perpetual) 252,714 0.15
USD 2,400,000 Barclays Bank Plc FRN (Perpetual) 1,823,661 1.11
GBP 320,000 BUPA Finance Plc 5.00% 25/4/2023 387,855 0.24
GBP 490,000 Co-operative Group Holdings 2011
(Step Coupon) 6.875% 8/7/2020 601,210 0.36
GBP 450,000 Co-operative Group Holdings 2011
(Step Coupon) 7.50% 8/7/2026 552,475 0.34
EUR 220,000 Imperial Tobacco Finance Plc 4.50%
5/7/2018 246,989 0.15
Portfolio of Investments as at 30 November 2013
Spain continued Luxembourg continued

Transferable Securities and Money Market Instruments Admitted to an Official Stock Exchange Listing or Dealt in on Another Regulated Market Funds
Holding Description Market Value
(EUR) % Holding Description Market Value
(EUR) %
* Investments which are less than EUR 0.5 have been rounded down to zero.1 This fund is managed by BlackRock.‡ Securities given as guarantee, see Note 13, for further details.
Unaudited Interim Report and Accounts 69
The notes on pages 150 to 158 form an integral part of these financial statements.
BlackRock European Constrained Credit Strategies Fund continued
GBP 200,000 Jaguar Land Rover Automotive Plc
8.25% 15/3/2020 271,537 0.16
EUR 1,545,000 Lloyds Bank Plc 6.50% 24/3/2020 1,796,804 1.09
EUR 1,436,000 Lloyds Bank Plc FRN 16/12/2021 1,785,802 1.08
GBP 824,000 Marks & Spencer Plc 4.75%
12/6/2025 993,904 0.60
EUR 1,183,000 Nationwide Building Society FRN
20/3/2023 1,219,271 0.74
GBP 1,105,000 Next Plc 4.375% 2/10/2026 1,338,443 0.81
USD 1,180,000 Royal Bank of Scotland Group Plc
'144A' FRN (Perpetual) 928,416 0.56
USD 300,000 Santander UK Plc '144A' 5.00%
7/11/2023 220,704 0.13
GBP 1,170,000 Unique Pub Finance Co Plc/The
7.395% 28/3/2024 1,369,706 0.83
GBP 2,209,062 Unique Pub Finance Co Plc/The
5.659% 30/6/2027 2,596,892 1.58
GBP 400,000 Unique Pub Finance Co Plc/The
'A3' 6.542% 30/3/2021 502,664 0.30
GBP 253,000 Vougeot Bidco Plc Reg 7.875%
15/7/2020 322,352 0.20
21,570,271 13.08
United States USD 742,000 Continental Rubber of America Corp
'144A' 4.50% 15/9/2019 579,982 0.35
USD 3,780,000 Meccanica Holdings USA Inc '144A'
6.25% 15/7/2019 2,878,111 1.75
USD 530,000 Meccanica Holdings USA Inc '144A'
7.375% 15/7/2039 370,492 0.22
USD 2,305,000 Meccanica Holdings USA Inc '144A'
6.25% 15/1/2040 1,454,442 0.88
EUR 220,000 RBS Capital Trust A FRN (Perpetual) 199,604 0.12
5,482,631 3.32
Total Bonds 133,142,755 80.74
Total Transferable Securities and Money
Market Instruments Admitted to an
Official Stock Exchange Listing or
Dealt in on Another Regulated Market 136,276,727 82.64
Ireland 15,822,036 Institutional Cash Series Plc -
Institutional Euro Assets
Liquidity Fund 1 15,822,036 9.59
15,822,036 9.59
Total Funds 15,822,036 9.59
Other Transferable Securities and Money Market Instruments
BONDS
Jersey GBP 1,000,000 Enterprise Funding Ltd 3.50%
10/9/2020 1,250,422 0.76
1,250,422 0.76
Total Bonds 1,250,422 0.76
Total Other Transferable Securities
and Money Market Instruments 1,250,422 0.76
Securities portfolio at market value 153,349,185 92.99
Other Net Assets 11,554,856 7.01
Total Net Assets (EUR) 164,904,041 100.00
Portfolio of Investments as at 30 November 2013
TIME DEPOSITS Societe Generale SA 12,000,107 7.28
Total Time Deposits 12,000,107 7.28
Time Deposit as at 30 November 2013
Description
Market ValueEUR %
United Kingdom continued

Nominal Value Description
Unrealisedappreciation/
(depreciation)EUR
Nominal Value Description
Unrealisedappreciation/
(depreciation)EUR
70 BlackRock Strategic Funds (BSF)
BlackRock European Constrained Credit Strategies Fund continued
Swaps as at 30 November 2013
USD 300,000 Credit Default Swaps (Bank of America Securities
LLC) (Fund receives default protection on Ireland
Government Bond 4.500% 18/4/2020 and pays
Fixed 1.000%) (20/3/2018) (8,079)
EUR 590,000 Credit Default Swaps (Bank of America) (Fund
receives default protection on Portugal Telecom
International Finance BV 4.375% 24/3/2017 and
pays Fixed 5.000%) (20/6/2018) (60,652)
EUR 1,610,000 Credit Default Swaps (Bank of America) (Fund
receives default protection on Stora Enso OYJ
5.125% 23/6/2014 and pays Fixed 5.000%)
(20/9/2018) (79,879)
EUR 1,062,874 Credit Default Swaps (Bank of America) (Fund
receives Fixed 5.000% and provides default
protection on Virgin Media Finance Plc 5.125%
15/2/2022) (20/9/2018) 25,354
EUR 1,340,000 Credit Default Swaps (Barclays Bank) (Fund receives
default protection on AXA SA 4.500% 23/1/2015
and pays Fixed 1.000%) (20/6/2018) (41,167)
EUR 320,000 Credit Default Swaps (Barclays Bank) (Fund receives
default protection on Clariant Finance Luxembourg
SA 4.375% 5/4/2013 and pays Fixed 1.000%)
(20/6/2018) (10,999)
EUR 1,100,000 Credit Default Swaps (Barclays Bank) (Fund receives
default protection on Deutsche Bank AG 5.125%
31/8/2017 and pays Fixed 1.000%) (20/3/2018) (14,146)
EUR 150,000 Credit Default Swaps (Barclays Bank) (Fund receives
default protection on Dixons Retail Plc 8.750%
3/8/2015 and pays Fixed 5.000%) (20/12/2017) (22,870)
EUR 40,000 Credit Default Swaps (Barclays Bank) (Fund receives
default protection on Dixons Retail Plc 8.750%
3/8/2015 and pays Fixed 5.000%) (20/12/2017) (6,099)
EUR 450,000 Credit Default Swaps (Barclays Bank) (Fund receives
default protection on Finmeccanica Finance SA/
Old 5.750% 12/12/2018 and pays Fixed 5.000%)
(20/12/2018) (1,515)
EUR 415,000 Credit Default Swaps (Barclays Bank) (Fund receives
default protection on Finmeccanica Finance SA/
Old 5.750% 12/12/2018 and pays Fixed 5.000%)
(20/3/2016) (4,506)
EUR 650,000 Credit Default Swaps (Barclays Bank) (Fund receives
default protection on Finmeccanica Finance SA/
Old 5.750% 12/12/2018 and pays Fixed 5.000%)
(20/6/2018) (29,211)
USD 1,635,000 Credit Default Swaps (Barclays Bank) (Fund receives
default protection on France Government Bond
OAT 4.250% 25/4/2019 and pays Fixed 0.250%)
(20/6/2018) (12,128)
USD 2,150,000 Credit Default Swaps (Barclays Bank) (Fund
receives default protection on Italy Government
International Bond 6.875% 27/9/2023 and pays
Fixed 1.000%) (20/3/2018) (62,410)
EUR 210,000 Credit Default Swaps (Barclays Bank) (Fund receives
default protection on iTraxx Europe Senior
Financials Series 19 Version 1 and pays Fixed
1.000%) (20/6/2018) (6,063)
EUR 644,444 Credit Default Swaps (Barclays Bank) (Fund receives
default protection on iTraxx Europe Senior
Financials Series 19 Version 1 and pays Fixed
1.000%) (20/6/2018) (17,608)
EUR 7,350,000 Credit Default Swaps (Barclays Bank) (Fund receives
default protection on iTraxx Europe Series 20
Version 1 and pays Fixed 1.000%) (20/12/2018) (22,912)
EUR 7,800,000 Credit Default Swaps (Barclays Bank) (Fund receives
default protection on iTraxx Europe Series 20
Version 1 and pays Fixed 1.000%) (20/12/2018) (24,394)
EUR 10,000 Credit Default Swaps (Barclays Bank) (Fund
receives default protection on Peugeot SA 8.375%
15/7/2014 and pays Fixed 5.000%) (20/3/2018) (1,684)
EUR 733,500 Credit Default Swaps (Barclays Bank) (Fund
receives default protection on Peugeot SA 8.375%
15/7/2014 and pays Fixed 5.000%) (20/9/2018) (67,942)
USD 800,000 Credit Default Swaps (Barclays Bank) (Fund receives
default protection on Portugal Obrigacoes do
Tesouro OT 5.450% 23/9/2013 and pays Fixed
1.000%) (20/6/2017) (178,376)
USD 450,000 Credit Default Swaps (Barclays Bank) (Fund receives
default protection on Portugal Obrigacoes do
Tesouro OT 5.450% 23/9/2013 and pays Fixed
1.000%) (20/12/2015) (24,641)
USD 600,000 Credit Default Swaps (Barclays Bank) (Fund receives
default protection on Portugal Obrigacoes do
Tesouro OT 5.450% 23/9/2013 and pays Fixed
1.000%) (20/12/2017) (43,032)
EUR 750,000 Credit Default Swaps (Barclays Bank) (Fund receives
default protection on Stena AB 6.125% 1/2/2017
and pays Fixed 5.000%) (20/12/2017) (68,774)
EUR 540,000 Credit Default Swaps (Barclays Bank) (Fund receives
default protection on Stora Enso OYJ 5.125%
23/6/2014 and pays Fixed 5.000%) (20/9/2018) (27,757)
EUR 531,438 Credit Default Swaps (Barclays Bank) (Fund receives
default protection on Unitymedia KabelBW GmbH
9.625% 1/12/2019 and pays Fixed 5.000%)
(20/9/2018) (10,314)
EUR 330,000 Credit Default Swaps (Barclays Bank) (Fund receives
default protection on Wind Acquisition Finance
SA 11.750% 15/7/2017 and pays Fixed 5.000%)
(20/9/2015) (416)
USD 1,000,000 Credit Default Swaps (Barclays Bank) (Fund receives
Fixed 0.250% and provides default protection on
France Government Bond OAT 4.250% 25/4/2019)
(20/6/2023) 16,591
EUR 1,340,000 Credit Default Swaps (Barclays Bank) (Fund receives
Fixed 1.000% and provides default protection on
Aviva Plc 9.500% 20/6/2016) (20/6/2018) 37,950
EUR 650,000 Credit Default Swaps (Barclays Bank) (Fund receives
Fixed 1.000% and provides default protection on
Deutsche Bank AG 5.125% 31/8/2017) (20/6/2018) 9,394
EUR 50,000 Credit Default Swaps (Barclays Bank) (Fund receives
Fixed 1.000% and provides default protection on
Imperial Tobacco Finance Plc 6.250% 4/12/2018)
(20/12/2017) 946
EUR 1,600,000 Credit Default Swaps (Barclays Bank) (Fund receives
Fixed 1.000% and provides default protection
on Italy Government International Bond 6.875%
27/9/2023) (20/3/2018) 52,845
USD 33,000 Credit Default Swaps (Barclays Bank) (Fund receives
Fixed 1.000% and provides default protection
on Italy Government International Bond 6.875%
27/9/2023) (20/3/2018) 1,441
EUR 1,720,000 Credit Default Swaps (Barclays Bank) (Fund receives
Fixed 1.000% and provides default protection on
iTraxx Europe Senior Financials Series 19 Version
1) (20/6/2018) 40,881
EUR 9,500,000 Credit Default Swaps (Barclays Bank) (Fund receives
Fixed 1.000% and provides default protection on
iTraxx Europe Series 20 Version 1) (20/12/2018) 13,244
EUR 1,100,000 Credit Default Swaps (Barclays Bank) (Fund receives
Fixed 1.000% and provides default protection on
Swiss Reinsurance Co Ltd 4.000% 29/6/2015)
(20/3/2018) 23,105

Nominal Value Description
Unrealisedappreciation/
(depreciation)EUR
Nominal Value Description
Unrealisedappreciation/
(depreciation)EUR
Unaudited Interim Report and Accounts 71
The notes on pages 150 to 158 form an integral part of these financial statements.
BlackRock European Constrained Credit Strategies Fund continued
Swaps as at 30 November 2013
EUR 280,000 Credit Default Swaps (Barclays Bank) (Fund receives
Fixed 1.000% and provides default protection on
ThyssenKrupp AG 4.375% 18/3/2015) (20/3/2018) 12,103
EUR 350,000 Credit Default Swaps (Barclays Bank) (Fund receives
Fixed 5.000% and provides default protection on
Finmeccanica Finance SA/Old 5.750% 12/12/2018)
(20/3/2018) 14,148
EUR 200,000 Credit Default Swaps (Barclays Bank) (Fund receives
Fixed 5.000% and provides default protection on
Portugal Telecom International Finance BV 4.375%
24/3/2017) (20/9/2017) 38,925
EUR 750,000 Credit Default Swaps (Barclays Bank) (Fund receives
Fixed 5.000% and provides default protection on
Sunrise Communications Holdings SA 8.500%
31/12/2018) (20/12/2017) 47,361
EUR 540,000 Credit Default Swaps (BNP Paribas) (Fund receives
default protection on AXA SA 6.000% 18/6/2013
and pays Fixed 1.000%) (20/6/2018) (29,275)
EUR 425,000 Credit Default Swaps (BNP Paribas) (Fund receives
default protection on Banco Comercial Portugues
SA FRN 17/6/2013 and pays Fixed 5.000%)
(20/3/2016) (138,579)
EUR 185,000 Credit Default Swaps (BNP Paribas) (Fund receives
default protection on Banco de Sabadell SA
0.365% 4/10/2016 and pays Fixed 5.000%)
(20/6/2017) (27,687)
EUR 570,000 Credit Default Swaps (BNP Paribas) (Fund receives
default protection on Banco de Sabadell SA
0.365% 4/10/2016 and pays Fixed 5.000%)
(20/3/2018) (46,991)
EUR 580,000 Credit Default Swaps (BNP Paribas) (Fund receives
default protection on Banco Espirito Santo SA
0.454% 19/1/2015 and pays Fixed 5.000%)
(20/6/2018) (35,882)
EUR 100,000 Credit Default Swaps (BNP Paribas) (Fund receives
default protection on Banco Santander SA FRN
9/8/2013 and pays Fixed 3.000%) (20/9/2017) (11,322)
EUR 50,000 Credit Default Swaps (BNP Paribas) (Fund receives
default protection on BBVA Senior Finance SAU
4.875% 23/1/2014 and pays Fixed 3.000%)
(20/12/2017) (5,638)
EUR 800,000 Credit Default Swaps (BNP Paribas) (Fund receives
default protection on BBVA Senior Finance SAU
4.875% 23/1/2014 and pays Fixed 3.000%)
(20/3/2018) (60,857)
EUR 400,000 Credit Default Swaps (BNP Paribas) (Fund receives
default protection on BPE Financiaciones SA
1.211% 30/12/2014 and pays Fixed 5.000%)
(20/12/2017) (63,199)
EUR 140,000 Credit Default Swaps (BNP Paribas) (Fund receives
default protection on Caja de Ahorros y Pensiones
de Barcelona 3.940% 28/2/2019 and pays Fixed
3.000%) (20/6/2017) (8,701)
EUR 185,000 Credit Default Swaps (BNP Paribas) (Fund receives
default protection on Caja de Ahorros y Pensiones
de Barcelona 3.940% 28/2/2019 and pays Fixed
3.000%) (20/6/2017) (11,076)
EUR 7,800,000 Credit Default Swaps (BNP Paribas) (Fund receives
default protection on iTraxx Europe Series 20
Version 1 and pays Fixed 1.000%) (20/12/2018) (25,356)
EUR 100,000 Credit Default Swaps (BNP Paribas) (Fund receives
default protection on Jaguar Land Rover
Automotive PLC 8.125% 15/5/2018 and pays Fixed
5.000%) (20/3/2016) 202
EUR 504,000 Credit Default Swaps (BNP Paribas) (Fund receives
default protection on Marks & Spencer Plc 6.125%
2/12/2019 and pays Fixed 1.000%) (20/12/2018) (7,393)
EUR 473,500 Credit Default Swaps (BNP Paribas) (Fund receives
default protection on Peugeot SA 8.375%
15/7/2014 and pays Fixed 5.000%) (20/9/2017) (89,225)
EUR 745,000 Credit Default Swaps (BNP Paribas) (Fund receives
default protection on St-Gobain Nederland BV
5.000% 25/4/2014 and pays Fixed 1.000%)
(20/9/2018) (19,748)
EUR 520,000 Credit Default Swaps (BNP Paribas) (Fund receives
default protection on Stena AB 6.125% 1/2/2017
and pays Fixed 5.000%) (20/3/2018) (10,423)
EUR 531,437 Credit Default Swaps (BNP Paribas) (Fund receives
default protection on Unitymedia KabelBW GmbH
9.625% 1/12/2019 and pays Fixed 5.000%)
(20/9/2018) (12,939)
EUR 540,000 Credit Default Swaps (BNP Paribas) (Fund receives
Fixed 1.000% and provides default protection on
Aviva Plc 9.500% 20/6/2016) (20/6/2018) 28,492
EUR 65,000 Credit Default Swaps (BNP Paribas) (Fund receives
Fixed 1.000% and provides default protection
on St-Gobain Nederland BV 5.000% 25/4/2014)
(20/6/2018) 1,725
EUR 100,000 Credit Default Swaps (BNP Paribas) (Fund receives
Fixed 5.000% and provides default protection
on Jaguar Land Rover Automotive PLC 8.125%
15/5/2018) (20/3/2018) 4,152
EUR 531,437 Credit Default Swaps (BNP Paribas) (Fund receives
Fixed 5.000% and provides default protection
on Virgin Media Finance Plc 5.125% 15/2/2022)
(20/9/2018) 14,392
EUR 410,000 Credit Default Swaps (Citibank) (Fund receives
default protection on BBVA Senior Finance SAU
4.875% 23/1/2014 and pays Fixed 3.000%)
(20/9/2017) (48,375)
EUR 530,000 Credit Default Swaps (Citibank) (Fund receives
default protection on British Airways Plc 8.750%
23/8/2016 and pays Fixed 5.000%) (20/12/2018) (26,599)
EUR 1,610,000 Credit Default Swaps (Citibank) (Fund receives
default protection on Clariant AG 3.125% 9/6/2017
and pays Fixed 1.000%) (20/9/2018) (37,077)
EUR 500,000 Credit Default Swaps (Citibank) (Fund receives
default protection on Deutsche Bank AG 5.125%
31/8/2017 and pays Fixed 1.000%) (20/3/2018) (6,186)
EUR 420,000 Credit Default Swaps (Citibank) (Fund receives
default protection on Dixons Retail Plc 8.750%
3/8/2015 and pays Fixed 5.000%) (20/6/2017) (94,749)
EUR 130,000 Credit Default Swaps (Citibank) (Fund receives
default protection on Dixons Retail Plc 8.750%
3/8/2015 and pays Fixed 5.000%) (20/6/2018) (13,152)
USD 1,775,000 Credit Default Swaps (Citibank) (Fund receives
default protection on France Government Bond
OAT 4.250% 25/4/2019 and pays Fixed 0.250%)
(20/6/2018) (16,472)
USD 500,000 Credit Default Swaps (Citibank) (Fund receives
default protection on Ireland Government Bond
5.400% 13/3/2025 and pays Fixed 1.000%)
(20/12/2016) (90,047)
USD 460,000 Credit Default Swaps (Citibank) (Fund receives
default protection on Ireland Government Bond
5.400% 13/3/2025 and pays Fixed 1.000%)
(20/12/2016) (81,246)
USD 750,000 Credit Default Swaps (Citibank) (Fund receives
default protection on Ireland Government Bond
5.400% 13/3/2025 and pays Fixed 1.000%)
(20/3/2017) (112,757)

Nominal Value Description
Unrealisedappreciation/
(depreciation)EUR
Nominal Value Description
Unrealisedappreciation/
(depreciation)EUR
72 BlackRock Strategic Funds (BSF)
BlackRock European Constrained Credit Strategies Fund continued
Swaps as at 30 November 2013
EUR 1,000,000 Credit Default Swaps (Citibank) (Fund receives
default protection on iTraxx Europe Crossover
Series 20 Version 1 and pays Fixed 5.000%)
(20/12/2018) (3,087)
EUR 3,840,000 Credit Default Swaps (Citibank) (Fund receives
default protection on iTraxx Europe Senior
Financials Series 20 Version 1 and pays Fixed
1.000%) (20/12/2018) (46,721)
EUR 820,000 Credit Default Swaps (Citibank) (Fund receives
default protection on iTraxx Europe Senior
Financials Series 20 Version 1 and pays Fixed
1.000%) (20/12/2018) (9,183)
EUR 3,670,000 Credit Default Swaps (Citibank) (Fund receives
default protection on iTraxx Europe Series 20
Version 1 and pays Fixed 1.000%) (20/12/2018) (10,080)
EUR 6,390,000 Credit Default Swaps (Citibank) (Fund receives
default protection on iTraxx Europe Series 20
Version 1 and pays Fixed 1.000%) (20/12/2018) (18,727)
EUR 2,460,000 Credit Default Swaps (Citibank) (Fund receives
default protection on iTraxx Europe Series 9
Version 1 and pays Fixed 5.000%) (20/6/2018) (300,567)
EUR 260,000 Credit Default Swaps (Citibank) (Fund receives
default protection on Peugeot SA 8.375%
15/7/2014 and pays Fixed 5.000%) (20/9/2017) (47,693)
EUR 330,000 Credit Default Swaps (Citibank) (Fund receives
default protection on Peugeot SA 8.375%
15/7/2014 and pays Fixed 5.000%) (20/6/2018) (51,292)
USD 1,350,000 Credit Default Swaps (Citibank) (Fund receives
default protection on Portugal Obrigacoes do
Tesouro OT 4.950% 25/10/2023 and pays Fixed
1.000%) (20/6/2015) (4,406)
USD 650,000 Credit Default Swaps (Citibank) (Fund receives
default protection on Portugal Obrigacoes do
Tesouro OT 5.450% 23/9/2013 and pays Fixed
1.000%) (20/6/2017) (142,468)
USD 75,000 Credit Default Swaps (Citibank) (Fund receives
default protection on Portugal Obrigacoes do
Tesouro OT 5.450% 23/9/2013 and pays Fixed
1.000%) (20/3/2018) (2,560)
USD 295,000 Credit Default Swaps (Citibank) (Fund receives
default protection on Portugal Obrigacoes do
Tesouro OT 5.450% 23/9/2013 and pays Fixed
1.000%) (20/9/2017) (49,221)
USD 1,710,000 Credit Default Swaps (Citibank) (Fund receives
default protection on Republic of Ireland 4.500%
4/18/2020 and pays Fixed 1.000%) (20/6/2018) (50,824)
EUR 250,000 Credit Default Swaps (Citibank) (Fund receives
default protection on Societe Generale SA 5.250%
28/3/2013 and pays Fixed 3.000%) (20/12/2017) (12,428)
EUR 540,000 Credit Default Swaps (Citibank) (Fund receives
default protection on Wind Acquisition Finance
SA 11.750% 15/7/2017 and pays Fixed 5.000%)
(20/9/2015) (1,234)
USD 1,085,000 Credit Default Swaps (Citibank) (Fund receives
Fixed 0.250% and provides default protection on
France Government Bond OAT 4.250% 25/4/2019)
(20/6/2023) 21,617
EUR 1,000,000 Credit Default Swaps (Citibank) (Fund receives
Fixed 1.000% and provides default protection on
Imperial Tobacco Finance Plc 6.250% 4/12/2018)
(20/12/2017) 19,415
USD 500,000 Credit Default Swaps (Citibank) (Fund receives
Fixed 1.000% and provides default protection
on Italy Government International Bond 6.875%
27/9/2023) (20/12/2016) 56,617
USD 460,000 Credit Default Swaps (Citibank) (Fund receives
Fixed 1.000% and provides default protection
on Italy Government International Bond 6.875%
27/9/2023) (20/12/2016) 50,940
EUR 9,500,000 Credit Default Swaps (Citibank) (Fund receives Fixed
1.000% and provides default protection on iTraxx
Europe Series 20 Version 1) (20/12/2018) 13,244
EUR 500,000 Credit Default Swaps (Citibank) (Fund receives Fixed
1.000% and provides default protection on Swiss
Reinsurance Co Ltd 4.000% 29/6/2015)
(20/3/2018) 10,624
EUR 310,000 Credit Default Swaps (Citibank) (Fund receives
Fixed 1.000% and provides default protection on
ThyssenKrupp AG 4.375% 18/3/2015) (20/9/2018) 14,353
EUR 1,630,000 Credit Default Swaps (Citibank) (Fund receives Fixed
5.000% and provides default protection on Grohe
Holding GmbH 8.750% 15/12/2017) (20/12/2018) 73,848
EUR 545,000 Credit Default Swaps (Citibank) (Fund receives Fixed
5.000% and provides default protection on Jaguar
Land Rover Automotive PLC 8.125% 15/5/2018)
(20/12/2018) 19,357
EUR 700,000 Credit Default Swaps (Citibank) (Fund receives Fixed
5.000% and provides default protection on Sunrise
Communications Holdings SA 8.500% 31/12/2018)
(20/12/2017) 28,899
EUR 380,000 Credit Default Swaps (Citibank) (Fund receives Fixed
5.000% and provides default protection on Sunrise
Communications Holdings SA 8.500% 31/12/2018)
(20/3/2018) 13,371
EUR 75,000 Credit Default Swaps (Citibank) (Fund receives Fixed
5.000% and provides default protection on Sunrise
Communications Holdings SA 8.500% 31/12/2018)
(20/12/2017) 3,846
EUR 70,000 Credit Default Swaps (Citibank) (Fund receives Fixed
5.000% and provides default protection on Sunrise
Communications Holdings SA 8.500% 31/12/2018)
(20/12/2017) 3,765
EUR 190,000 Credit Default Swaps (Citibank) (Fund receives Fixed
5.000% and provides default protection on Techem
GmbH 6.125% 1/10/2019) (20/6/2018) 12,349
EUR 200,000 Credit Default Swaps (Citibank) (Fund receives Fixed
5.000% and provides default protection on Techem
GmbH 6.125% 1/10/2019) (20/6/2018) 13,264
EUR 531,438 Credit Default Swaps (Citibank) (Fund receives Fixed
5.000% and provides default protection on Virgin
Media Finance Plc 5.125% 15/2/2022)
(20/9/2018) 10,388
EUR 580,000 Credit Default Swaps (Credit Suisse) (Fund receives
default protection on AXA SA 6.000% 18/6/2013
and pays Fixed 1.000%) (20/6/2018) (31,977)
EUR 270,000 Credit Default Swaps (Credit Suisse) (Fund receives
default protection on Clariant Finance Luxembourg
SA 4.375% 5/4/2013 and pays Fixed 1.000%)
(20/12/2017) (21,410)
EUR 672,000 Credit Default Swaps (Credit Suisse) (Fund receives
default protection on Deutsche Bank AG 5.125%
31/8/2017 and pays Fixed 1.000%) (20/6/2018) (9,460)
EUR 540,000 Credit Default Swaps (Credit Suisse) (Fund receives
default protection on Dixons Retail Plc 8.750%
3/8/2015 and pays Fixed 5.000%) (20/12/2016) (158,490)
EUR 100,000 Credit Default Swaps (Credit Suisse) (Fund receives
default protection on Finmeccanica Finance SA/
Old 5.750% 12/12/2018 and pays Fixed 5.000%)
(20/6/2018) (3,725)
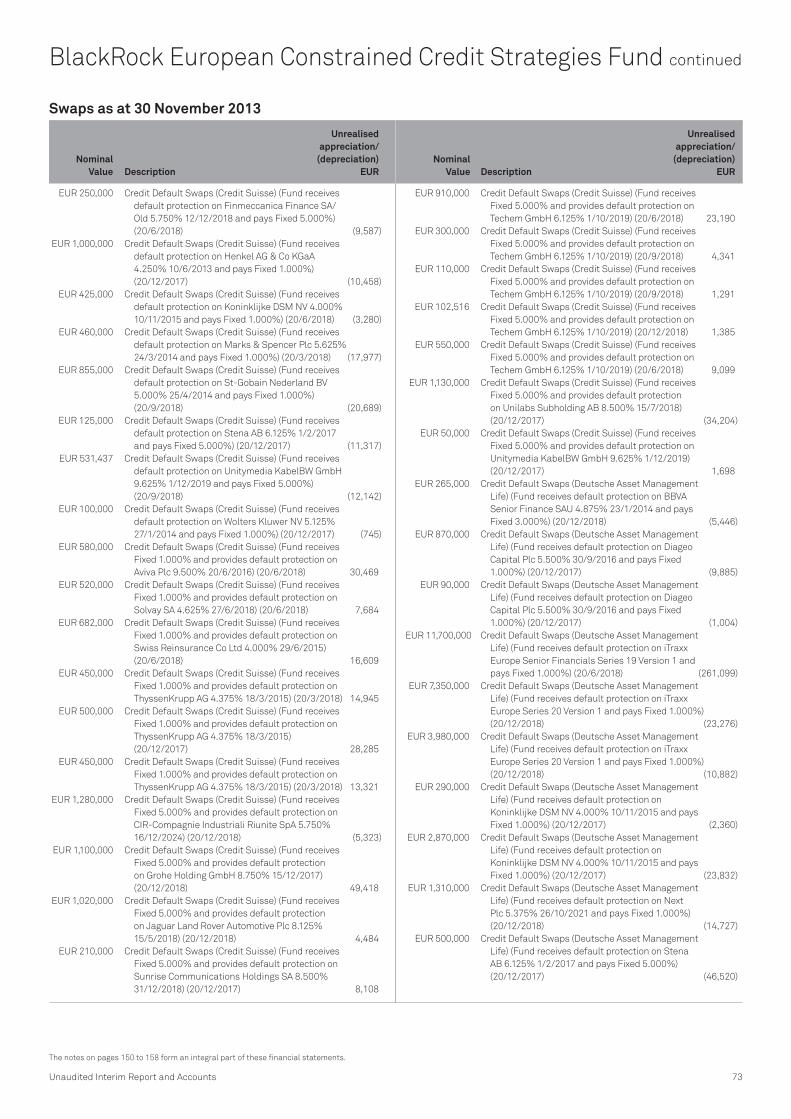
Nominal Value Description
Unrealisedappreciation/
(depreciation)EUR
Nominal Value Description
Unrealisedappreciation/
(depreciation)EUR
Unaudited Interim Report and Accounts 73
The notes on pages 150 to 158 form an integral part of these financial statements.
BlackRock European Constrained Credit Strategies Fund continued
Swaps as at 30 November 2013
EUR 250,000 Credit Default Swaps (Credit Suisse) (Fund receives
default protection on Finmeccanica Finance SA/
Old 5.750% 12/12/2018 and pays Fixed 5.000%)
(20/6/2018) (9,587)
EUR 1,000,000 Credit Default Swaps (Credit Suisse) (Fund receives
default protection on Henkel AG & Co KGaA
4.250% 10/6/2013 and pays Fixed 1.000%)
(20/12/2017) (10,458)
EUR 425,000 Credit Default Swaps (Credit Suisse) (Fund receives
default protection on Koninklijke DSM NV 4.000%
10/11/2015 and pays Fixed 1.000%) (20/6/2018) (3,280)
EUR 460,000 Credit Default Swaps (Credit Suisse) (Fund receives
default protection on Marks & Spencer Plc 5.625%
24/3/2014 and pays Fixed 1.000%) (20/3/2018) (17,977)
EUR 855,000 Credit Default Swaps (Credit Suisse) (Fund receives
default protection on St-Gobain Nederland BV
5.000% 25/4/2014 and pays Fixed 1.000%)
(20/9/2018) (20,689)
EUR 125,000 Credit Default Swaps (Credit Suisse) (Fund receives
default protection on Stena AB 6.125% 1/2/2017
and pays Fixed 5.000%) (20/12/2017) (11,317)
EUR 531,437 Credit Default Swaps (Credit Suisse) (Fund receives
default protection on Unitymedia KabelBW GmbH
9.625% 1/12/2019 and pays Fixed 5.000%)
(20/9/2018) (12,142)
EUR 100,000 Credit Default Swaps (Credit Suisse) (Fund receives
default protection on Wolters Kluwer NV 5.125%
27/1/2014 and pays Fixed 1.000%) (20/12/2017) (745)
EUR 580,000 Credit Default Swaps (Credit Suisse) (Fund receives
Fixed 1.000% and provides default protection on
Aviva Plc 9.500% 20/6/2016) (20/6/2018) 30,469
EUR 520,000 Credit Default Swaps (Credit Suisse) (Fund receives
Fixed 1.000% and provides default protection on
Solvay SA 4.625% 27/6/2018) (20/6/2018) 7,684
EUR 682,000 Credit Default Swaps (Credit Suisse) (Fund receives
Fixed 1.000% and provides default protection on
Swiss Reinsurance Co Ltd 4.000% 29/6/2015)
(20/6/2018) 16,609
EUR 450,000 Credit Default Swaps (Credit Suisse) (Fund receives
Fixed 1.000% and provides default protection on
ThyssenKrupp AG 4.375% 18/3/2015) (20/3/2018) 14,945
EUR 500,000 Credit Default Swaps (Credit Suisse) (Fund receives
Fixed 1.000% and provides default protection on
ThyssenKrupp AG 4.375% 18/3/2015)
(20/12/2017) 28,285
EUR 450,000 Credit Default Swaps (Credit Suisse) (Fund receives
Fixed 1.000% and provides default protection on
ThyssenKrupp AG 4.375% 18/3/2015) (20/3/2018) 13,321
EUR 1,280,000 Credit Default Swaps (Credit Suisse) (Fund receives
Fixed 5.000% and provides default protection on
CIR-Compagnie Industriali Riunite SpA 5.750%
16/12/2024) (20/12/2018) (5,323)
EUR 1,100,000 Credit Default Swaps (Credit Suisse) (Fund receives
Fixed 5.000% and provides default protection
on Grohe Holding GmbH 8.750% 15/12/2017)
(20/12/2018) 49,418
EUR 1,020,000 Credit Default Swaps (Credit Suisse) (Fund receives
Fixed 5.000% and provides default protection
on Jaguar Land Rover Automotive Plc 8.125%
15/5/2018) (20/12/2018) 4,484
EUR 210,000 Credit Default Swaps (Credit Suisse) (Fund receives
Fixed 5.000% and provides default protection on
Sunrise Communications Holdings SA 8.500%
31/12/2018) (20/12/2017) 8,108
EUR 910,000 Credit Default Swaps (Credit Suisse) (Fund receives
Fixed 5.000% and provides default protection on
Techem GmbH 6.125% 1/10/2019) (20/6/2018) 23,190
EUR 300,000 Credit Default Swaps (Credit Suisse) (Fund receives
Fixed 5.000% and provides default protection on
Techem GmbH 6.125% 1/10/2019) (20/9/2018) 4,341
EUR 110,000 Credit Default Swaps (Credit Suisse) (Fund receives
Fixed 5.000% and provides default protection on
Techem GmbH 6.125% 1/10/2019) (20/9/2018) 1,291
EUR 102,516 Credit Default Swaps (Credit Suisse) (Fund receives
Fixed 5.000% and provides default protection on
Techem GmbH 6.125% 1/10/2019) (20/12/2018) 1,385
EUR 550,000 Credit Default Swaps (Credit Suisse) (Fund receives
Fixed 5.000% and provides default protection on
Techem GmbH 6.125% 1/10/2019) (20/6/2018) 9,099
EUR 1,130,000 Credit Default Swaps (Credit Suisse) (Fund receives
Fixed 5.000% and provides default protection
on Unilabs Subholding AB 8.500% 15/7/2018)
(20/12/2017) (34,204)
EUR 50,000 Credit Default Swaps (Credit Suisse) (Fund receives
Fixed 5.000% and provides default protection on
Unitymedia KabelBW GmbH 9.625% 1/12/2019)
(20/12/2017) 1,698
EUR 265,000 Credit Default Swaps (Deutsche Asset Management
Life) (Fund receives default protection on BBVA
Senior Finance SAU 4.875% 23/1/2014 and pays
Fixed 3.000%) (20/12/2018) (5,446)
EUR 870,000 Credit Default Swaps (Deutsche Asset Management
Life) (Fund receives default protection on Diageo
Capital Plc 5.500% 30/9/2016 and pays Fixed
1.000%) (20/12/2017) (9,885)
EUR 90,000 Credit Default Swaps (Deutsche Asset Management
Life) (Fund receives default protection on Diageo
Capital Plc 5.500% 30/9/2016 and pays Fixed
1.000%) (20/12/2017) (1,004)
EUR 11,700,000 Credit Default Swaps (Deutsche Asset Management
Life) (Fund receives default protection on iTraxx
Europe Senior Financials Series 19 Version 1 and
pays Fixed 1.000%) (20/6/2018) (261,099)
EUR 7,350,000 Credit Default Swaps (Deutsche Asset Management
Life) (Fund receives default protection on iTraxx
Europe Series 20 Version 1 and pays Fixed 1.000%)
(20/12/2018) (23,276)
EUR 3,980,000 Credit Default Swaps (Deutsche Asset Management
Life) (Fund receives default protection on iTraxx
Europe Series 20 Version 1 and pays Fixed 1.000%)
(20/12/2018) (10,882)
EUR 290,000 Credit Default Swaps (Deutsche Asset Management
Life) (Fund receives default protection on
Koninklijke DSM NV 4.000% 10/11/2015 and pays
Fixed 1.000%) (20/12/2017) (2,360)
EUR 2,870,000 Credit Default Swaps (Deutsche Asset Management
Life) (Fund receives default protection on
Koninklijke DSM NV 4.000% 10/11/2015 and pays
Fixed 1.000%) (20/12/2017) (23,832)
EUR 1,310,000 Credit Default Swaps (Deutsche Asset Management
Life) (Fund receives default protection on Next
Plc 5.375% 26/10/2021 and pays Fixed 1.000%)
(20/12/2018) (14,727)
EUR 500,000 Credit Default Swaps (Deutsche Asset Management
Life) (Fund receives default protection on Stena
AB 6.125% 1/2/2017 and pays Fixed 5.000%)
(20/12/2017) (46,520)

Nominal Value Description
Unrealisedappreciation/
(depreciation)EUR
Nominal Value Description
Unrealisedappreciation/
(depreciation)EUR
74 BlackRock Strategic Funds (BSF)
BlackRock European Constrained Credit Strategies Fund continued
Swaps as at 30 November 2013
EUR 250,000 Credit Default Swaps (Deutsche Asset Management
Life) (Fund receives default protection on Veolia
Environnement SA 5.375% 28/5/2018 and pays
Fixed 1.000%) (20/12/2017) (11,213)
EUR 560,000 Credit Default Swaps (Deutsche Asset Management
Life) (Fund receives default protection on Wind
Acquisition Finance SA 11.750% 15/7/2017 and
pays Fixed 5.000%) (20/9/2015) (2,959)
EUR 1,000,000 Credit Default Swaps (Deutsche Asset Management
Life) (Fund receives default protection on Wolters
Kluwer NV 5.125% 27/1/2014 and pays Fixed
1.000%) (20/12/2017) (3,591)
EUR 1,370,000 Credit Default Swaps (Deutsche Asset Management
Life) (Fund receives default protection on WPP
PLC 6.000% 4/4/2017 and pays Fixed 1.000%)
(20/12/2017) (28,727)
EUR 130,000 Credit Default Swaps (Deutsche Asset Management
Life) (Fund receives Fixed 1.000% and provides
default protection on E.ON International Finance
BV 6.375% 29/5/2017) (20/12/2017) 1,743
EUR 265,000 Credit Default Swaps (Deutsche Asset Management
Life) (Fund receives Fixed 3.000% and provides
default protection on UniCredit SpA 4.375%
29/1/2020) (20/12/2018) 7,786
EUR 8,400,000 Credit Default Swaps (Deutsche Asset Management
Life) (Fund receives Fixed 5.000% and provides
default protection on iTraxx Europe Sub Financials
Series 19 Version 1) (20/6/2018) 262,479
EUR 120,000 Credit Default Swaps (Deutsche Asset Management
Life) (Fund receives Fixed 5.000% and provides
default protection on Portugal Telecom
International Finance BV 4.375% 24/3/2017)
(20/12/2017) 10,327
EUR 210,000 Credit Default Swaps (Deutsche Bank) (Fund
receives default protection on iTraxx Europe Senior
Financials Series 19 Version 1 and pays Fixed
1.000%) (20/6/2018) (5,970)
EUR 3,795,000 Credit Default Swaps (Deutsche Bank) (Fund
receives default protection on iTraxx Europe Senior
Financials Series 20 Version 1 and pays Fixed
1.000%) (20/12/2018) (46,287)
USD 150,000 Credit Default Swaps (Deutsche Bank) (Fund receives
default protection on Portugal Obrigacoes do
Tesouro OT 5.450% 23/9/2013 and pays Fixed
1.000%) (20/12/2017) (11,414)
USD 450,000 Credit Default Swaps (Deutsche Bank) (Fund receives
default protection on Portugal Obrigacoes do
Tesouro OT 5.450% 23/9/2013 and pays Fixed
1.000%) (20/12/2015) (24,641)
USD 350,000 Credit Default Swaps (Deutsche Bank) (Fund receives
default protection on Republic of Ireland 4.500%
4/18/2020 and pays Fixed 1.000%) (20/3/2018) (9,425)
EUR 250,000 Credit Default Swaps (Deutsche Bank) (Fund receives
default protection on Societe Generale SA 5.250%
28/3/2013 and pays Fixed 3.000%) (20/12/2017) (12,306)
EUR 531,437 Credit Default Swaps (Deutsche Bank) (Fund receives
default protection on Unitymedia KabelBW GmbH
9.625% 1/12/2019 and pays Fixed 5.000%)
(20/9/2018) (11,900)
EUR 540,000 Credit Default Swaps (Deutsche Bank) (Fund receives
default protection on Wind Acquisition Finance
SA 11.750% 15/7/2017 and pays Fixed 5.000%)
(20/9/2015) (2,441)
EUR 540,000 Credit Default Swaps (Deutsche Bank) (Fund receives
default protection on Wind Acquisition Finance
SA 11.750% 15/7/2017 and pays Fixed 5.000%)
(20/9/2015) (2,441)
EUR 500,000 Credit Default Swaps (Deutsche Bank) (Fund receives
Fixed 1.000% and provides default protection on
Imperial Tobacco Finance Plc 6.250% 4/12/2018)
(20/12/2017) 6,684
EUR 20,000 Credit Default Swaps (Deutsche Bank) (Fund receives
Fixed 5.000% and provides default protection on
Portugal Telecom International Finance BV 4.375%
24/3/2017) (20/9/2017) 3,843
EUR 510,000 Credit Default Swaps (Deutsche Bank) (Fund receives
Fixed 5.000% and provides default protection on
Techem GmbH 6.125% 1/10/2019) (20/6/2018) 30,392
EUR 260,000 Credit Default Swaps (Goldman Sachs) (Fund
receives default protection on BBVA Senior
Finance SAU 4.875% 23/1/2014 and pays Fixed
3.000%) (20/6/2018) (18,137)
EUR 540,000 Credit Default Swaps (Goldman Sachs) (Fund
receives default protection on Finmeccanica
Finance SA/Old 5.750% 12/12/2018 and pays
Fixed 5.000%) (20/12/2018) (6,825)
USD 650,000 Credit Default Swaps (Goldman Sachs) (Fund
receives default protection on Ireland Government
Bond 4.500% 18/4/2020 and pays Fixed 1.000%)
(20/12/2016) (119,236)
EUR 2,300,000 Credit Default Swaps (Goldman Sachs) (Fund
receives default protection on Marks & Spencer
Plc 5.625% 24/3/2014 and pays Fixed 1.000%)
(20/6/2018) (103,111)
EUR 250,000 Credit Default Swaps (Goldman Sachs) (Fund
receives default protection on St-Gobain
Nederland BV 5.000% 25/4/2014 and pays
Fixed 1.000%) (20/12/2017) (10,415)
USD 650,000 Credit Default Swaps (Goldman Sachs) (Fund
receives Fixed 1.000% and provides default
protection on Italy Government International
Bond 6.875% 27/9/2023) (20/12/2016) 75,322
EUR 340,000 Credit Default Swaps (Goldman Sachs) (Fund
receives Fixed 1.000% and provides default
protection on ThyssenKrupp AG 4.375%
18/3/2015) (20/9/2018) 10,502
EUR 250,000 Credit Default Swaps (Goldman Sachs) (Fund
receives Fixed 1.000% and provides default
protection on ThyssenKrupp AG 4.375%
18/3/2015) (20/12/2017) 14,593
EUR 180,000 Credit Default Swaps (Goldman Sachs) (Fund
receives Fixed 1.000% and provides default
protection on ThyssenKrupp AG 4.375%
18/3/2015) (20/3/2018) 4,715
EUR 240,000 Credit Default Swaps (Goldman Sachs) (Fund
receives Fixed 5.000% and provides default
protection on Sunrise Communications Holdings
SA 8.500% 31/12/2018) (20/12/2017) 11,108
EUR 400,000 Credit Default Swaps (Goldman Sachs) (Fund
receives Fixed 5.000% and provides default
protection on Sunrise Communications Holdings
SA 8.500% 31/12/2018) (20/3/2018) 12,328
EUR 500,000 Credit Default Swaps (Goldman Sachs) (Fund
receives Fixed 5.000% and provides default
protection on Unitymedia KabelBW GmbH 9.625%
1/12/2019) (20/12/2017) 32,858
EUR 300,000 Credit Default Swaps (JP Morgan Chase Bank
(Depository Cle) (Fund receives default protection
on Banco de Sabadell SA 0.365% 4/10/2016 and
pays Fixed 5.000%) (20/9/2017) (46,853)

Nominal Value Description
Unrealisedappreciation/
(depreciation)EUR
Nominal Value Description
Unrealisedappreciation/
(depreciation)EUR
Unaudited Interim Report and Accounts 75
The notes on pages 150 to 158 form an integral part of these financial statements.
BlackRock European Constrained Credit Strategies Fund continued
Swaps as at 30 November 2013
EUR 500,000 Credit Default Swaps (JP Morgan Chase Bank
(Depository Cle) (Fund receives default protection
on Caja de Ahorros y Pensiones de Barcelona
3.940% 28/2/2019 and pays Fixed 3.000%)
(20/12/2015) (23,847)
EUR 930,000 Credit Default Swaps (JP Morgan Chase Bank
(Depository Cle) (Fund receives default protection
on Clariant Finance Luxembourg SA 4.375%
5/4/2013 and pays Fixed 1.000%) (20/12/2017) (72,103)
EUR 420,000 Credit Default Swaps (JP Morgan Chase Bank
(Depository Cle) (Fund receives default protection
on Finmeccanica Finance SA/Old 5.750%
12/12/2018 and pays Fixed 5.000%) (20/12/2017) (22,119)
EUR 450,000 Credit Default Swaps (JP Morgan Chase Bank
(Depository Cle) (Fund receives default protection
on Finmeccanica Finance SA/Old 5.750%
12/12/2018 and pays Fixed 5.000%) (20/12/2017) (21,680)
EUR 2,300,000 Credit Default Swaps (JP Morgan Chase Bank
(Depository Cle) (Fund receives default protection
on Finmeccanica Finance SA/Old 5.750%
12/12/2018 and pays Fixed 5.000%) (20/3/2016) (899)
EUR 490,000 Credit Default Swaps (JP Morgan Chase Bank
(Depository Cle) (Fund receives default protection
on Jaguar Land Rover Automotive Plc 8.125%
15/5/2018 and pays Fixed 5.000%) (20/3/2016) (4,626)
EUR 265,000 Credit Default Swaps (JP Morgan Chase Bank
(Depository Cle) (Fund receives default protection
on St-Gobain Nederland BV 5.000% 25/4/2014
and pays Fixed 1.000%) (20/12/2017) (12,675)
EUR 1,250,000 Credit Default Swaps (JP Morgan Chase Bank
(Depository Cle) (Fund receives Fixed 1.000% and
provides default protection on E.ON International
Finance BV 6.375% 29/5/2017) (20/12/2017) 11,533
EUR 520,000 Credit Default Swaps (JP Morgan Chase Bank
(Depository Cle) (Fund receives Fixed 1.000% and
provides default protection on Vinci SA 4.125%
20/2/2017) (20/6/2018) 6,122
EUR 1,960,000 Credit Default Swaps (JP Morgan Chase Bank
(Depository Cle) (Fund receives Fixed 5.000%
and provides default protection on Finmeccanica
Finance SA/Old 5.750% 12/12/2018) (20/3/2018) 60,045
EUR 490,000 Credit Default Swaps (JP Morgan Chase Bank
(Depository Cle) (Fund receives Fixed 5.000% and
provides default protection on Jaguar Land Rover
Plc 8.125% 5/15/2018) (20/3/2018) 40,120
EUR 450,000 Credit Default Swaps (JP Morgan Chase Bank
(Depository Cle) (Fund receives Fixed 5.000% and
provides default protection on Portugal Telecom
International Finance BV 4.375% 24/3/2017)
(20/12/2017) 45,721
EUR 318,000 Credit Default Swaps (JP Morgan Chase Bank
(Depository Cle)) (Fund receives default protection
on British Airways Plc 8.750% 23/8/2016 and pays
Fixed 5.000%) (20/12/2018) (16,852)
EUR 100,000 Credit Default Swaps (JP Morgan Chase Bank
(Depository Cle)) (Fund receives default protection
on Henkel AG & Co KGaA 4.625% 19/3/2014 and
pays Fixed 1.000%) (20/12/2017) (1,078)
EUR 60,000 Credit Default Swaps (JP Morgan Chase Bank
(Depository Cle)) (Fund receives default protection
on St-Gobain Nederland BV 5.000% 25/4/2014
and pays Fixed 1.000%) (20/12/2017) (2,870)
EUR 30,000 Credit Default Swaps (JP Morgan Chase Bank
(Depository Cle)) (Fund receives default protection
on Veolia Environnement SA 5.375% 28/5/2018
and pays Fixed 1.000%) (20/12/2017) (1,882)
EUR 140,000 Credit Default Swaps (JP Morgan Chase Bank
(Depository Cle)) (Fund receives default protection
on WPP PLC 6.000% 4/4/2017 and pays Fixed
1.000%) (20/12/2017) (3,549)
EUR 223,333 Credit Default Swaps (JP Morgan Chase Bank
(Depository Cle)) (Fund receives Fixed 1.000% and
provides default protection on ThyssenKrupp AG
4.375% 18/3/2015) (20/9/2018) 10,431
EUR 230,000 Credit Default Swaps (JP Morgan Chase Bank
(Depository Cle)) (Fund receives Fixed 1.000% and
provides default protection on ThyssenKrupp AG
4.375% 18/3/2015) (20/12/2017) 13,426
USD 2,900,000 Credit Default Swaps (JP Morgan Securities Inc)
(Fund receives default protection on Portugal
Obrigacoes do Tesouro OT 5.450% 23/9/2013 and
pays Fixed 1.000%) (20/6/2015) (144,774)
EUR 590,000 Credit Default Swaps (JP Morgan) (Fund receives
default protection on Banco Espirito Santo SA
0.454% 19/1/2015 and pays Fixed 5.000%)
(20/6/2018) (37,268)
EUR 560,000 Credit Default Swaps (JP Morgan) (Fund receives
default protection on Credit Agricole SA 5.065%
8/10/2022 and pays Fixed 3.000%) (20/6/2018) (29,589)
EUR 100,000 Credit Default Swaps (JP Morgan) (Fund receives
default protection on Finmeccanica Finance SA/
Old 5.750% 12/12/2018 and pays Fixed 5.000%)
(20/6/2018) (353)
USD 1,770,000 Credit Default Swaps (JP Morgan) (Fund receives
default protection on France Government Bond
OAT 4.250% 25/4/2019 and pays Fixed 0.250%)
(20/6/2018) (9,596)
USD 2,080,000 Credit Default Swaps (JP Morgan) (Fund receives
default protection on Ireland Government Bond
4.500% 18/4/2020 and pays Fixed 1.000%)
(20/3/2018) (48,453)
USD 290,000 Credit Default Swaps (JP Morgan) (Fund receives
default protection on Portugal Obrigacoes do
Tesouro OT 5.450% 23/9/2013 and pays Fixed
1.000%) (20/6/2015) (11,307)
USD 600,000 Credit Default Swaps (JP Morgan) (Fund receives
default protection on Portugal Obrigacoes do
Tesouro OT 5.450% 23/9/2013 and pays Fixed
1.000%) (20/12/2017) (69,543)
USD 225,000 Credit Default Swaps (JP Morgan) (Fund receives
default protection on Portugal Obrigacoes do
Tesouro OT 5.450% 23/9/2013 and pays Fixed
1.000%) (20/12/2015) (4,484)
USD 650,000 Credit Default Swaps (JP Morgan) (Fund receives
default protection on Portugal Obrigacoes do
Tesouro OT 5.450% 23/9/2013 and pays Fixed
1.000%) (20/6/2015) (6,436)
EUR 560,000 Credit Default Swaps (JP Morgan) (Fund receives
default protection on Societe Generale SA 2.375%
28/2/2018 and pays Fixed 3.000%) (20/6/2018) (30,949)
USD 1,080,000 Credit Default Swaps (JP Morgan) (Fund receives
Fixed 0.250% and provides default protection on
France Government Bond OAT 4.250% 25/4/2019)
(20/6/2023) 16,100
EUR 1,230,000 Credit Default Swaps (JP Morgan) (Fund receives
Fixed 1.000% and provides default protection on
Allianz Finance II BV 4.000% 23/11/2016)
(20/6/2018) 34,770
EUR 6,006,667 Credit Default Swaps (JP Morgan) (Fund receives
Fixed 1.000% and provides default protection on
iTraxx Europe Series 20 Version 1) (20/12/2018) 59,998

Nominal Value Description
Unrealisedappreciation/
(depreciation)EUR
Nominal Value Description
Unrealisedappreciation/
(depreciation)EUR
76 BlackRock Strategic Funds (BSF)
BlackRock European Constrained Credit Strategies Fund continued
Swaps as at 30 November 2013
EUR 1,230,000 Credit Default Swaps (JP Morgan) (Fund receives
Fixed 1.000% and provides default protection
on Muenchener Rueckversicherungs AG 7.625%
21/6/2028) (20/6/2018) 23,402
EUR 510,000 Credit Default Swaps (JP Morgan) (Fund receives
Fixed 1.000% and provides default protection
on St-Gobain Nederland BV 5.000% 25/4/2014)
(20/6/2018) 12,549
EUR 500,000 Credit Default Swaps (JP Morgan) (Fund receives
Fixed 5.000% and provides default protection on
Portugal Telecom International Finance BV 4.375%
24/3/2017) (20/12/2017) 85,802
EUR 150,000 Credit Default Swaps (Morgan Stanley) (Fund
receives default protection on Dixons Retail
Plc 8.750% 3/8/2015 and pays Fixed 5.000%)
(20/12/2016) (41,025)
EUR 1,213 Total Return Swap (Barclays Bank) (Fund receives
3 Month EURIBOR and pays Fonciere Des Regions)
(14/11/2014) 1,608
EUR 590 Total Return Swap (Barclays Bank) (Fund receives
3 Month EURIBOR and pays Fonciere Des Regions)
(13/11/2014) 534
EUR 85 Total Return Swap (Barclays Bank) (Fund receives
3 Month EURIBOR and pays Fonciere Des Regions)
(15/11/2014) 133
EUR 14,869 Total Return Swap (BNP Paribas) (Fund receives
3 Month EURIBOR and pays TUI AG) (22/11/2014) (4,015)
EUR 5,503 Total Return Swap (BNP Paribas) (Fund receives
3 Month EURIBOR and pays TUI AG) (25/11/2014) (1,089)
GBP 226,342 Total Return Swap (Credit Suisse) (Fund receives
1 Month LIBOR and pays Enterprise Inns Plc)
(5/9/2014) 7,066
GBP 350,000 Total Return Swap (Credit Suisse) (Fund receives
1 Month LIBOR and pays Equiniti Newco 2 plc
7.125% 15/12/2018) (30/9/2014) (7,959)
EUR 940,000 Total Return Swap (Credit Suisse) (Fund receives
1 Month LIBOR and pays Italy Buoni Poliennali
Del Tesoro 3.750% 1/8/2021) (29/8/2014) (30,281)
EUR 1,892,000 Total Return Swap (Credit Suisse) (Fund receives
1 Month LIBOR and pays Italy Buoni Poliennali
Del Tesoro 3.750% 1/8/2021) (29/8/2014) (60,490)
EUR 540,000 Total Return Swap (Credit Suisse) (Fund receives
1 Month LIBOR and pays Italy Buoni Poliennali
Del Tesoro 4.500% 1/5/2023) (29/8/2014) (16,618)
EUR 100,000 Total Return Swap (Credit Suisse) (Fund receives
1 Month LIBOR and pays Manutencoop Facility
8.500% 1/8/2020) (30/9/2014) (8,072)
EUR 100,000 Total Return Swap (Credit Suisse) (Fund receives
1 Month LIBOR and pays Manutencoop Facility
8.500% 1/8/2020) (30/9/2014) (8,072)
EUR 100,000 Total Return Swap (Credit Suisse) (Fund receives
1 Month LIBOR and pays Manutencoop Facility
8.500% 1/8/2020) (30/10/2014) (7,572)
EUR 200,000 Total Return Swap (Credit Suisse) (Fund receives
1 Month LIBOR and pays Manutencoop Facility
8.500% 1/8/2020) (30/10/2014) (14,143)
EUR 570,000 Total Return Swap (Credit Suisse) (Fund receives
1 Month LIBOR and pays Peugeot SA 7.375%
6/3/2018) (30/5/2014) (65,721)
EUR 570,000 Total Return Swap (Credit Suisse) (Fund receives
1 Month LIBOR and pays Peugeot SA 7.375%
6/3/2018) (30/5/2014) (65,721)
EUR 1,050,000 Total Return Swap (Credit Suisse) (Fund receives
1 Month LIBOR and pays Portugal Obrigacoes
do Tesouro OT 4.350% 16/10/2017) (30/4/2014) 21,528
GBP 200,000 Total Return Swap (Credit Suisse) (Fund receives
1 Month LIBOR and pays Priory Group No 3 Plc
8.875% 15/2/2019) (31/10/2014) (1,341)
GBP 389,550 Total Return Swap (Credit Suisse) (Fund receives
1 Month LIBOR and pays Punch Taverns Finance
Plc 6.820% 15/7/2020) (26/9/2014) (17,817)
GBP 735,000 Total Return Swap (Credit Suisse) (Fund receives
1 Month LIBOR and pays Punch Taverns Finance
Plc 6.820% 15/7/2020) (26/9/2014) (32,205)
GBP 404,250 Total Return Swap (Credit Suisse) (Fund receives
1 Month LIBOR and pays Punch Taverns Finance
Plc 6.820% 15/7/2020) (26/9/2014) (17,276)
EUR 1,400,000 Total Return Swap (Credit Suisse) (Fund receives
1 Month LIBOR and pays Spain Government
Bond 3.750% 31/10/2018) (29/8/2014) (41,131)
EUR 6,310,000 Total Return Swap (Credit Suisse) (Fund receives
1 Month LIBOR and pays Spain Government
Bond 4.100% 30/7/2018) (31/10/2014) 19,337
EUR 690,000 Total Return Swap (Credit Suisse) (Fund receives
1 Month LIBOR and pays Spain Government
Bond 4.100% 30/7/2018) (29/8/2014) (29,212)
EUR 1,120,000 Total Return Swap (Credit Suisse) (Fund receives
1 Month LIBOR and pays Spain Government
Bond 4.100% 30/7/2018) (30/4/2014) (45,423)
EUR 450,000 Total Return Swap (Credit Suisse) (Fund receives
1 Month LIBOR and pays Spain Government
Bond 4.500% 31/1/2018) (28/2/2014) (32,133)
EUR 970,000 Total Return Swap (Credit Suisse) (Fund receives
1 Month LIBOR and pays Spain Government
Bond 5.500% 30/4/2021) (28/2/2014) (69,950)
EUR 95,000 Total Return Swap (Credit Suisse) (Fund receives
1 Month LIBOR and pays Spain Government
Bond 5.500% 30/7/2017) (28/2/2014) (1,012)
EUR 910,000 Total Return Swap (Credit Suisse) (Fund receives
1 Month LIBOR and pays Spain Government
Bond 5.900% 30/7/2026) (30/4/2014) (75,310)
EUR 200,000 Total Return Swap (Credit Suisse) (Fund receives
1 Month LIBOR and pays Telecom Italia SpA
7.750% 20/3/2073) (29/8/2014) (7,775)
EUR 500,000 Total Return Swap (Credit Suisse) (Fund receives
1 Month LIBOR and pays Telecom Italia SpA
7.750% 20/3/2073) (29/8/2014) (14,944)
EUR 1,311,404 Total Return Swap (JP Morgan) (Fund receives
3 Month EURIBOR and pays Telecom Italia SpA)
(8/11/2014) (49,833)
EUR 1,430,000 Total Return Swap (JP Morgan) (Fund receives Fixed
0.050% and pays Italy Buoni Poliennali Del Tesoro
3.750% 1/3/2021) (13/10/2014) (62,468)
EUR 3,680,000 Total Return Swap (JP Morgan) (Fund receives Fixed
0.070% and pays France Government Bond OAT
4.000% 25/4/2018) (23/6/2014) 3,381
EUR 710,000 Total Return Swap (JP Morgan) (Fund receives Fixed
0.080% and pays Italy Buoni Poliennali Del Tesoro
3.750% 1/3/2021) (2/10/2014) (26,028)
EUR 370,000 Total Return Swap (JP Morgan) (Fund receives Fixed
0.100% and pays France Government Bond OAT
4.000% 25/4/2018) (23/6/2014) 340
EUR 220,000 Total Return Swap (JP Morgan) (Fund receives Fixed
0.100% and pays Wind Acquisition Holdings
Finance SA 12.250% 15/7/2017) (15/10/2014) (13,034)
EUR 110,000 Total Return Swap (JP Morgan) (Fund receives Fixed
0.100% and pays Wind Acquisition Holdings
Finance SA 12.250% 15/7/2017) (15/10/2014) (6,517)
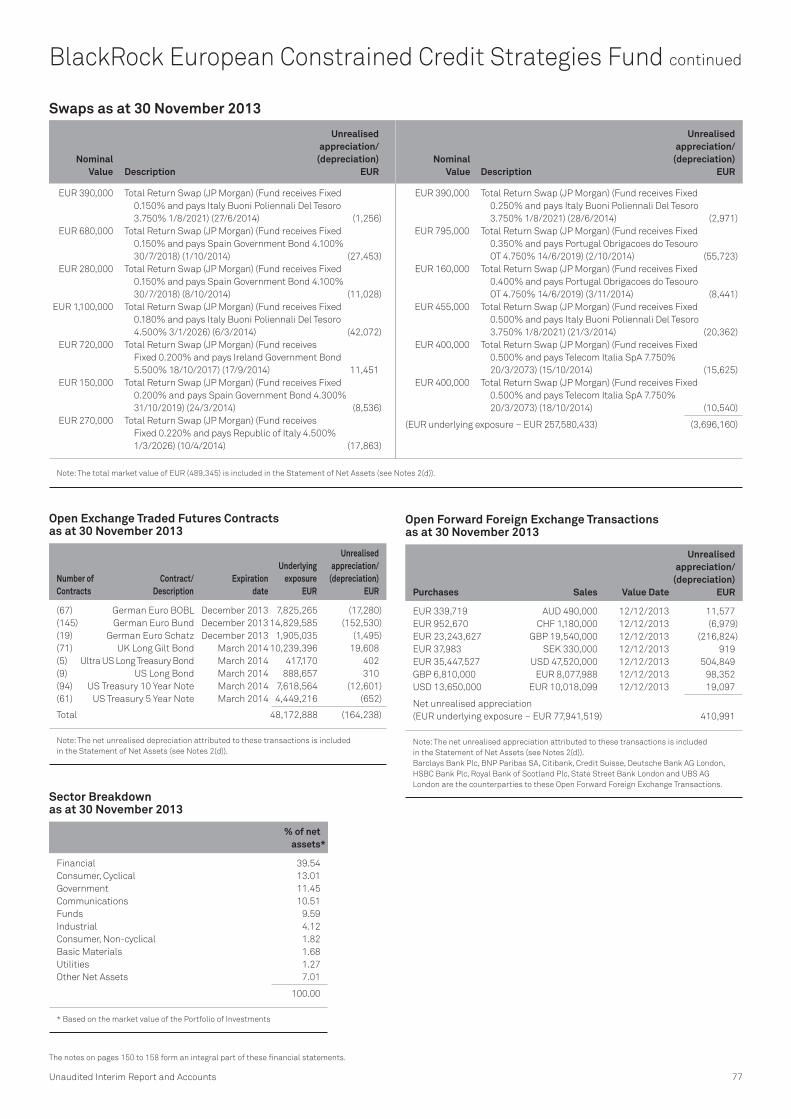
Nominal Value Description
Unrealisedappreciation/
(depreciation)EUR
Nominal Value Description
Unrealisedappreciation/
(depreciation)EUR
Note: The total market value of EUR (489,345) is included in the Statement of Net Assets (see Notes 2(d)).
Unaudited Interim Report and Accounts 77
The notes on pages 150 to 158 form an integral part of these financial statements.
BlackRock European Constrained Credit Strategies Fund continued
Swaps as at 30 November 2013
EUR 390,000 Total Return Swap (JP Morgan) (Fund receives Fixed
0.150% and pays Italy Buoni Poliennali Del Tesoro
3.750% 1/8/2021) (27/6/2014) (1,256)
EUR 680,000 Total Return Swap (JP Morgan) (Fund receives Fixed
0.150% and pays Spain Government Bond 4.100%
30/7/2018) (1/10/2014) (27,453)
EUR 280,000 Total Return Swap (JP Morgan) (Fund receives Fixed
0.150% and pays Spain Government Bond 4.100%
30/7/2018) (8/10/2014) (11,028)
EUR 1,100,000 Total Return Swap (JP Morgan) (Fund receives Fixed
0.180% and pays Italy Buoni Poliennali Del Tesoro
4.500% 3/1/2026) (6/3/2014) (42,072)
EUR 720,000 Total Return Swap (JP Morgan) (Fund receives
Fixed 0.200% and pays Ireland Government Bond
5.500% 18/10/2017) (17/9/2014) 11,451
EUR 150,000 Total Return Swap (JP Morgan) (Fund receives Fixed
0.200% and pays Spain Government Bond 4.300%
31/10/2019) (24/3/2014) (8,536)
EUR 270,000 Total Return Swap (JP Morgan) (Fund receives
Fixed 0.220% and pays Republic of Italy 4.500%
1/3/2026) (10/4/2014) (17,863)
EUR 390,000 Total Return Swap (JP Morgan) (Fund receives Fixed
0.250% and pays Italy Buoni Poliennali Del Tesoro
3.750% 1/8/2021) (28/6/2014) (2,971)
EUR 795,000 Total Return Swap (JP Morgan) (Fund receives Fixed
0.350% and pays Portugal Obrigacoes do Tesouro
OT 4.750% 14/6/2019) (2/10/2014) (55,723)
EUR 160,000 Total Return Swap (JP Morgan) (Fund receives Fixed
0.400% and pays Portugal Obrigacoes do Tesouro
OT 4.750% 14/6/2019) (3/11/2014) (8,441)
EUR 455,000 Total Return Swap (JP Morgan) (Fund receives Fixed
0.500% and pays Italy Buoni Poliennali Del Tesoro
3.750% 1/8/2021) (21/3/2014) (20,362)
EUR 400,000 Total Return Swap (JP Morgan) (Fund receives Fixed
0.500% and pays Telecom Italia SpA 7.750%
20/3/2073) (15/10/2014) (15,625)
EUR 400,000 Total Return Swap (JP Morgan) (Fund receives Fixed
0.500% and pays Telecom Italia SpA 7.750%
20/3/2073) (18/10/2014) (10,540)
(EUR underlying exposure – EUR 257,580,433) (3,696,160)
Open Exchange Traded Futures Contractsas at 30 November 2013
Number of Contracts
Contract/Description
Expirationdate
Underlying exposure
EUR
Unrealised appreciation/
(depreciation) EUR
(67) German Euro BOBL December 2013 7,825,265 (17,280)
(145) German Euro Bund December 2013 14,829,585 (152,530)
(19) German Euro Schatz December 2013 1,905,035 (1,495)
(71) UK Long Gilt Bond March 2014 10,239,396 19,608
(5) Ultra US Long Treasury Bond March 2014 417,170 402
(9) US Long Bond March 2014 888,657 310
(94) US Treasury 10 Year Note March 2014 7,618,564 (12,601)
(61) US Treasury 5 Year Note March 2014 4,449,216 (652)
Total 48,172,888 (164,238)
Note: The net unrealised depreciation attributed to these transactions is included
in the Statement of Net Assets (see Notes 2(d)).
Sector Breakdownas at 30 November 2013
% of netassets *
Financial 39.54
Consumer, Cyclical 13.01
Government 11.45
Communications 10.51
Funds 9.59
Industrial 4.12
Consumer, Non-cyclical 1.82
Basic Materials 1.68
Utilities 1.27
Other Net Assets 7.01
100.00
* Based on the market value of the Portfolio of Investments
Open Forward Foreign Exchange Transactionsas at 30 November 2013
Purchases Sales Value Date
Unrealised appreciation/
(depreciation)EUR
EUR 339,719 AUD 490,000 12/12/2013 11,577
EUR 952,670 CHF 1,180,000 12/12/2013 (6,979)
EUR 23,243,627 GBP 19,540,000 12/12/2013 (216,824)
EUR 37,983 SEK 330,000 12/12/2013 919
EUR 35,447,527 USD 47,520,000 12/12/2013 504,849
GBP 6,810,000 EUR 8,077,988 12/12/2013 98,352
USD 13,650,000 EUR 10,018,099 12/12/2013 19,097
Net unrealised appreciation
(EUR underlying exposure – EUR 77,941,519) 410,991
Note: The net unrealised appreciation attributed to these transactions is included
in the Statement of Net Assets (see Notes 2(d)).
Barclays Bank Plc, BNP Paribas SA, Citibank, Credit Suisse, Deutsche Bank AG London,
HSBC Bank Plc, Royal Bank of Scotland Plc, State Street Bank London and UBS AG
London are the counterparties to these Open Forward Foreign Exchange Transactions.

78 BlackRock Strategic Funds (BSF)
BlackRock European Constrained Credit Strategies Fund continued
Swaptions as at 30 November 2013
Nominal Value Description
Unrealised appreciation/
(depreciation) EUR
Market Value
EUR
14,945,000 Fund purchases a put option
(expiring 15/1/2014) to enter into
a Credit Default Swap (Citibank
NA). If exercised Fund receives
Floating iTraxx XO 20 Version 1
quarterly from 20/12/2013; and
pays 5% Fixed quarterly from
15/1/2014 (78,870) 58,624
5,550,000 Fund purchases a put option
(expiring 15/1/2014) to enter
into a Credit Default Swap (JP
Morgan Chase Bank). If exercised
Fund receives Floating iTraxx
XO 20 Version 1 quarterly from
20/12/2013; and pays 5% Fixed
quarterly from 15/1/2014 (25,405) 21,770
(14,945,000) Fund writes a put option (expiring
15/1/2014) to enter into a Credit
Default Swap (Citibank NA). If
exercised Fund receives 5%
Fixed quarterly from 15/1/2014;
and pays Floating iTraxx XO 20
Version 1 quarterly from
20/12/2013 6,278 (7,172)
(5,550,000) Fund writes a put option (expiring
15/1/2014) to enter into a
Credit Default Swap (JP Morgan
Chase Bank). If exercised Fund
receives 5% Fixed quarterly from
15/1/2014; and pays Floating
iTraxx XO 20 Version 1 quarterly
from 20/12/2013 2,831 (2,664)
(EUR underlying exposure – EUR 7,575,990) (95,166) 70,558
Note: Swaptions are included in the Statement of Net Assets (see Notes 2(d)).

Transferable Securities and Money Market Instruments Admitted to an Official Stock Exchange Listing or Dealt in on Another Regulated Market
Transferable Securities and Money Market Instruments Admitted to an Official Stock Exchange Listing or Dealt in on Another Regulated Market
Holding Description Market Value
(EUR) % Holding Description Market Value
(EUR) %
Unaudited Interim Report and Accounts 79
The notes on pages 150 to 158 form an integral part of these financial statements.
BlackRock European Credit Strategies Fund
COMMON STOCKS (SHARES)
Ireland 148,000 Smurfit Kappa Group Plc 2,600,360 0.24
2,600,360 0.24
Spain 86,667 Pescanova SA 1 0.00
1 0.00
Sweden 317,700 SAS AB 663,821 0.06
663,821 0.06
Switzerland 46,750 Cembra Money Bank AG 2,149,823 0.19
2,149,823 0.19
United Kingdom 12,215 Royal Bank of Scotland Group
Plc (Pref) 188,351 0.01
261,748 Royal Bank of Scotland Group
Plc (Pref) 4,178,498 0.38
322,823 Royal Bank of Scotland Group
Plc (Pref) 5,293,541 0.48
9,660,390 0.87
United States 121,005 RBS Capital Funding Trust V (Pref) 1,884,544 0.17
121,006 RBS Capital Funding Trust VII (Pref) 1,927,269 0.18
3,811,813 0.35
Total Common Stocks (Shares) 18,886,208 1.71
BONDS
Austria EUR 4,300,000 Vienna Insurance Group AG Wiener
Versicherung Gruppe FRN
9/10/2043 4,568,750 0.41
4,568,750 0.41
Cayman Islands GBP 6,205,000 Brakes Capital 7.125% 15/12/2018 7,439,319 0.67
GBP 2,822,414 Punch Taverns Finance B Ltd
7.369% 30/6/2022 3,507,502 0.32
GBP 6,321,000 Punch Taverns Finance B Ltd
5.943% 30/12/2024 7,433,052 0.67
GBP 8,647,771 Punch Taverns Finance B Ltd
4.767% 30/6/2033 9,786,387 0.89
28,166,260 2.55
Czech Republic EUR 9,878,000 RPG Byty Sro 6.75% 1/5/2020 10,019,749 0.91
10,019,749 0.91
France EUR 3,583,800 Fonciere Des Regions 0.875%
1/4/2019 3,008,062 0.27
EUR 2,600,000 France Government Bond OAT
2.25% 25/10/2022‡ 2,647,294 0.24
EUR 11,510,000 France Government Bond OAT
4.25% 25/10/2023‡ 13,557,629 1.23
USD 2,440,000 Societe Generale SA FRN (Perpetual) 1,883,211 0.17
21,096,196 1.91
Germany EUR 14,500,000 Allianz SE FRN (Perpetual) 14,931,665 1.35
EUR 11,500,000 Bayerische Landesbank FRN
7/2/2019 10,637,500 0.96
EUR 21,600,000 Commerzbank AG 7.75% 16/3/2021 24,704,784 2.24
USD 4,997,000 Commerzbank AG '144A'
8.125% 19/9/2023 4,037,246 0.37
USD 223,000 Commerzbank AG 8.125%
19/9/2023 180,169 0.02
EUR 1,026,000 Deutsche Raststaetten Gruppe IV
GmbH 6.75% 30/12/2020 1,061,951 0.10
EUR 18,513,000 HSH Nordbank AG FRN 14/2/2017 13,308,163 1.20
EUR 14,254,000 HSH Nordbank AG Reg FRN
14/2/2017 10,220,118 0.92
EUR 16,647,000 HSH Nordbank AG (Flat trading)
7.408% (Perpetual) 4,848,522 0.44
EUR 1,000,000 Muenchener Rueckversicherungs
AG FRN 26/5/2041 1,175,675 0.11
EUR 12,998,600 TUI AG 2.75% 24/3/2016 8,687,939 0.79
93,793,732 8.50
Ireland EUR 3,455,000 AIB Mortgage Bank 2.625%
29/7/2016 3,551,308 0.32
EUR 4,875,000 AIB Mortgage Bank 4.875%
29/6/2017 5,357,381 0.49
EUR 9,060,000 Bank of Ireland Mortgage Bank
2.75% 22/3/2018 9,304,620 0.84
EUR 3,655,000 Bank of Ireland Mortgage Bank
3.625% 2/10/2020 3,829,344 0.35
EUR 3,100,000 Cloverie Plc for Zurich Insurance
Co Ltd FRN 24/7/2039 3,763,044 0.34
EUR 28,030,000 DEPFA Bank Plc FRN 15/12/2015 24,771,512 2.24
50,577,209 4.58
Italy EUR 6,705,000 A2A SpA 4.375% 10/1/2021 7,171,433 0.65
EUR 3,335,000 Astaldi SpA 7.125% 1/12/2020 3,471,769 0.31
EUR 5,388,000 Banca Monte dei Paschi di Siena
SpA 4.875% 15/9/2016 5,686,792 0.52
EUR 14,600,000 Buzzi Unicem SpA 1.375%
17/7/2019 15,804,500 1.43
USD 4,640,000 Enel SpA '144A' FRN 24/9/2073 3,713,176 0.34
EUR 7,460,000 Gamenet SpA 7.25% 1/8/2018 7,598,644 0.69
EUR 12,230,000 Intesa Sanpaolo SpA 3.00%
28/1/2019 12,407,519 1.12
EUR 18,220,000 Italy Buoni Poliennali Del Tesoro
5.50% 1/11/2022 20,588,600 1.87
EUR 7,201,000 IVS F. SpA 7.125% 1/4/2020 7,426,031 0.67
EUR 4,490,000 UniCredit SpA 6.95% 31/10/2022 4,900,543 0.44
EUR 15,220,000 UniCredit SpA FRN 28/10/2025 15,567,016 1.41
104,336,023 9.45
Jersey GBP 5,350,000 AA Bond Co Ltd 6.269% 31/7/2025 7,080,129 0.64
GBP 1,210,000 Galaxy Bidco Ltd 6.375%
15/11/2020 1,456,487 0.13
GBP 1,275,000 Galaxy Finco Ltd 7.875%
15/11/2021 1,533,694 0.14
EUR 8,255,000 RESPARCS Funding II LP
(Flat trading) 7.50% (Perpetual) 2,414,794 0.22
12,485,104 1.13
Portfolio of Investments as at 30 November 2013

Transferable Securities and Money Market Instruments Admitted to an Official Stock Exchange Listing or Dealt in on Another Regulated Market
Transferable Securities and Money Market Instruments Admitted to an Official Stock Exchange Listing or Dealt in on Another Regulated Market
Holding Description Market Value
(EUR) % Holding Description Market Value
(EUR) %
80 BlackRock Strategic Funds (BSF)
BlackRock European Credit Strategies Fund continued
Luxembourg USD 13,700,000 APERAM '144A' 7.75% 1/4/2018 10,359,996 0.94
USD 4,400,000 APERAM 2.625% 30/9/2020 3,639,192 0.33
EUR 5,355,000 GELF Bond Issuer I SA 3.125%
3/4/2018 5,548,690 0.50
EUR 12,770,000 Intralot Finance Luxembourg SA
9.75% 15/8/2018 13,912,979 1.26
EUR 5,141,000 Magnolia BC SA 9.00% 1/8/2020 5,377,692 0.49
EUR 290,000 S&B Minerals Finance SCA / S&B
Industrial Minerals North America
Inc 9.25% 15/8/2020 315,704 0.03
EUR 9,430,000 Servus Luxembourg Holding SCA
7.75% 15/6/2018 9,907,158 0.90
EUR 5,500,000 Snai SpA 7.625% 15/6/2018 5,594,188 0.51
USD 2,976,000 Telecom Italia Capital SA 6.375%
15/11/2033 1,912,128 0.17
USD 2,499,000 Telecom Italia Capital SA 6.00%
30/9/2034 1,543,900 0.14
USD 2,475,000 Telecom Italia Capital SA 7.721%
4/6/2038 1,751,172 0.16
EUR 21,500,000 Telecom Italia Finance SA 6.125%
15/11/2016 22,497,600 2.04
EUR 21,500,000 Telecom Italia Finance SA Reg
6.125% 15/11/2016 21,500,000 1.95
EUR 19,522,000 Telecom Italia Finance SA 7.75%
24/1/2033 21,259,263 1.92
EUR 17,170,000 Wind Acquisition Finance SA
7.375% 15/2/2018 18,166,547 1.64
143,286,209 12.98
Mexico USD 11,230,000 Cemex SAB de CV '144A' 7.25%
15/1/2021 8,416,284 0.76
8,416,284 0.76
Netherlands EUR 9,409,000 Achmea BV FRN 4/4/2043 10,138,198 0.92
EUR 2,115,000 Adria Bidco BV 7.875% 15/11/2020 2,121,070 0.19
EUR 4,600,000 Allianz Finance II BV FRN 8/7/2041 5,262,101 0.48
EUR 2,131,000 Enel Finance International NV
4.875% 17/4/2023 2,372,943 0.21
USD 22,360,000 ING Bank NV '144A' 5.80%
25/9/2023 17,160,530 1.55
USD 25,122,010 ING Bank NV FRN 21/11/2023 18,437,366 1.67
EUR 10,400,000 IVG Finance BV 1.75% 29/3/2017 8,346,000 0.76
EUR 11,800,000 Portugal Telecom International
Finance BV 4.625% 8/5/2020 12,039,658 1.09
AUD 3,750,000 Royal Bank of Scotland NV FRN
17/5/2018 2,255,199 0.20
EUR 2,520,000 TMF Group Holding BV Reg
9.875% 1/12/2019 2,734,969 0.25
EUR 5,270,000 Univeg Holding BV 7.875%
15/11/2020 5,270,000 0.48
EUR 7,039,000 Ziggo BV 3.625% 27/3/2020 7,039,000 0.64
93,177,034 8.44
Norway USD 16,440,000 Norske Skogindustrier ASA
'144A' 7.125% 15/10/2033 5,621,235 0.51
5,621,235 0.51
Portugal EUR 4,300,000 Caixa Geral de Depositos SA 5.625%
4/12/2015 4,546,218 0.41
EUR 6,000,000 Galp Energia SGPS SA 4.125%
25/1/2019 6,093,600 0.55
USD 26,150,000 Portugal Government International
Bond 3.50% 25/3/2015 19,262,294 1.75
29,902,112 2.71
Spain CHF 7,300,000 Autonomous Community of
Catalonia 2.125% 1/10/2014 5,930,599 0.54
EUR 707,000 Autonomous Community of Valencia
Spain 4.75% 20/3/2014 712,303 0.06
EUR 3,150,000 Autonomous Community of Valencia
Spain 3.25% 6/7/2015 3,168,585 0.29
EUR 18,287,000 Autonomous Community of Valencia
Spain 4.375% 16/7/2015 18,699,646 1.69
EUR 5,850,000 Autonomous Community of Valencia
Spain 4.00% 2/11/2016 5,898,321 0.53
EUR 3,900,000 Ayt Cedulas Cajas Global 4.00%
21/3/2017 4,071,113 0.37
EUR 2,200,000 Ayt Cedulas Cajas Global 4.25%
14/6/2018 2,302,355 0.21
EUR 3,300,000 Ayt Cedulas Cajas Global 3.75%
14/12/2022 3,143,085 0.28
EUR 2,100,000 Ayt Cedulas Cajas Global 4.25%
25/10/2023 2,054,955 0.19
EUR 3,300,000 AyT Cedulas Cajas X Fondo de
Titulizacion 3.75% 30/6/2025 2,892,450 0.26
EUR 9,600,000 AyT Cedulas Cajas XXIII Fondo de
Titulizacion de Activos 4.75%
15/6/2016 10,208,112 0.92
USD 7,800,000 Banco Bilbao Vizcaya Argentaria SA
FRN (Perpetual) 6,068,880 0.55
EUR 10,000,000 Banco Popular Espanol SA FRN
(Perpetual) 10,785,050 0.98
EUR 1,500,000 BBVA Senior Finance SAU 3.75%
17/1/2018 1,598,138 0.14
EUR 8,900,000 BPE Financiaciones SA 2.875%
19/5/2016 8,907,876 0.81
EUR 7,700,000 CaixaBank SA 4.50% 22/11/2016 8,151,951 0.74
EUR 6,800,000 CaixaBank SA 3.125% 14/5/2018 7,024,162 0.64
EUR 7,300,000 Caja Rural de Navarra 2.875%
11/6/2018 7,508,707 0.68
EUR 2,000,000 Cedulas TDA 4.125% 29/11/2019 2,066,250 0.19
EUR 800,000 Cedulas TDA A-5 4.25% 28/3/2027 704,660 0.06
EUR 8,500,000 Cedulas TDA 6 Fondo de Titulizacion
de Activos 3.875% 23/5/2025 7,469,375 0.68
EUR 8,100,000 Cedulas TDA 6 Fondo de Titulizacion
de Activos 4.25% 10/4/2031 6,760,260 0.61
EUR 400,000 Cedulas TDA 7 Fondo de Titulizacion
de Activos 3.50% 20/6/2017 406,940 0.04
EUR 10,000,000 Indra Sistemas SA 1.75%
17/10/2018 10,215,050 0.92
EUR 4,000,000 Kutxabank SA 3.00% 1/2/2017 4,166,060 0.38
EUR 11,200,000 Santander Issuances SAU FRN
30/9/2019 10,594,528 0.96
EUR 21,100,000 Spain Government Bond '144A'
5.40% 31/1/2023 23,291,762 2.11
174,801,173 15.83
Sweden SEK 140,000,000 SAS AB 7.50% 1/4/2015 15,957,119 1.45
15,957,119 1.45
Switzerland EUR 11,125,000 Credit Suisse AG FRN 18/9/2025 11,755,454 1.06
11,755,454 1.06
Portfolio of Investments as at 30 November 2013
Portugal continued

Transferable Securities and Money Market Instruments Admitted to an Official Stock Exchange Listing or Dealt in on Another Regulated Market
Transferable Securities and Money Market Instruments Admitted to an Official Stock Exchange Listing or Dealt in on Another Regulated Market
Holding Description Market Value
(EUR) % Holding Description Market Value
(EUR) %
1 This fund is managed by BlackRock.‡ Securities given as guarantee, see Note 13, for further details.
Unaudited Interim Report and Accounts 81
The notes on pages 150 to 158 form an integral part of these financial statements.
United Kingdom GBP 5,309,436 Annington Finance No 4 Plc FRN
10/1/2023 6,324,073 0.57
GBP 4,528,181 Annington Finance No 5 Plc
(Pay-in-kind) 13.00% 15/1/2023 6,347,716 0.57
EUR 5,495,000 Aviva Plc FRN 5/7/2043 6,133,794 0.56
GBP 3,059,000 Bakkavor Finance 2 Plc 8.75%
15/6/2020 4,021,855 0.36
EUR 6,990,000 Barclays Bank Plc 6.00% 14/1/2021 7,993,135 0.72
EUR 1,000,000 Barclays Bank Plc 6.625% 30/3/2022 1,185,625 0.11
USD 2,045,000 Barclays Bank Plc 7.625% 21/11/2022 1,583,174 0.14
EUR 4,770,000 Barclays Bank Plc FRN (Perpetual) 4,122,377 0.37
EUR 1,690,000 Barclays Bank Plc FRN (Perpetual) 1,525,309 0.14
USD 14,475,000 Barclays Bank Plc FRN (Perpetual) 10,998,954 1.00
GBP 2,270,000 BUPA Finance Plc 5.00% 25/4/2023 2,751,347 0.25
GBP 2,540,000 Co-operative Group Holdings 2011
(Step-up Coupon) 6.875%
8/7/2020 3,116,478 0.28
GBP 3,561,000 Co-operative Group Holdings 2011
(Step-up Coupon) 7.50%
8/7/2026 4,371,919 0.40
GBP 3,145,000 House of Fraser Funding Plc 8.875%
15/8/2018 4,087,816 0.37
EUR 1,505,000 Imperial Tobacco Finance Plc 4.50%
5/7/2018 1,689,626 0.15
GBP 1,500,000 Jaguar Land Rover Automotive Plc
8.25% 15/3/2020 2,036,530 0.18
EUR 10,159,000 Lloyds Bank Plc 6.50% 24/3/2020 11,814,714 1.07
EUR 6,020,000 Lloyds Bank Plc FRN 16/12/2021 7,486,442 0.68
GBP 5,324,000 Marks & Spencer Plc 4.75%
12/6/2025 6,421,775 0.58
EUR 10,062,000 Nationwide Building Society FRN
20/3/2023 10,370,501 0.94
GBP 7,600,000 Next Plc 4.375% 2/10/2026 9,205,580 0.83
GBP 8,740,000 Phosphorus Holdco Plc (Pay-in-kind)
10.00% 1/4/2019 10,021,936 0.91
USD 7,040,000 Royal Bank of Scotland Group Plc
'144A' FRN (Perpetual) 5,539,026 0.50
USD 1,775,000 Santander UK Plc '144A' 5.00%
7/11/2023 1,305,834 0.12
GBP 3,300,000 Unique Pub Finance Co Plc 6.542%
30/3/2021 4,146,976 0.38
GBP 7,309,000 Unique Pub Finance Co Plc 7.395%
28/3/2024 8,556,564 0.78
GBP 14,816,322 Unique Pub Finance Co Plc 5.659%
30/6/2027 17,417,529 1.58
GBP 1,596,000 Vougeot Bidco Plc Reg 7.875%
15/7/2020 2,033,492 0.18
GBP 4,800,000 Voyage Care Bondco Plc 11.00%
1/2/2019 6,246,075 0.57
168,856,172 15.29
United States USD 4,776,000 Continental Rubber of America
Corp '144A' 4.50% 15/9/2019 3,733,142 0.34
USD 22,995,000 Meccanica Holdings USA Inc
'144A' 6.25% 15/7/2019 17,508,509 1.58
USD 3,610,000 Meccanica Holdings USA Inc
'144A' 7.375% 15/7/2039 2,523,541 0.23
USD 15,695,000 Meccanica Holdings USA Inc
'144A' 6.25% 15/1/2040 9,903,457 0.90
EUR 1,490,000 RBS Capital Trust A FRN
(Perpetual) 1,351,862 0.12
35,020,511 3.17
Total Bonds 1,011,836,326 91.64
Total Transferable Securities and Money
Market Instruments Admitted to an
Official Stock Exchange Listing or
Dealt in on Another Regulated Market 1,030,722,534 93.35
Funds
Ireland 75,581,679 Institutional Cash Series Plc -
Institutional Euro Assets
Liquidity Fund 1 75,581,679 6.85
75,581,679 6.85
Total Funds 75,581,679 6.85
Other Transferable Securities and Money Market Instruments
BONDS
Italy EUR 8,000,000 Snai SpA 12.00% 15/12/2018 8,412,920 0.76
8,412,920 0.76
Jersey GBP 6,700,000 Balfour Beatty Finance No.2
Ltd 1.875% 3/12/2018 8,115,124 0.74
GBP 7,900,000 Enterprise Funding Ltd 3.50%
10/9/2020 9,878,331 0.89
17,993,455 1.63
Sweden SEK 25,000,000 Scandinavian Airlines System
Denmark-Norway-Sweden
10.50% 16/6/2014 2,929,174 0.27
2,929,174 0.27
Total Bonds 29,335,549 2.66
Total Other Transferable Securities
and Money Market Instruments 29,335,549 2.66
Securities portfolio at market value 1,135,639,762 102.86
Other Net Liabilities (31,535,901) (2.86)
Total Net Assets (EUR) 1,104,103,861 100.00
BlackRock European Credit Strategies Fund continued
Portfolio of Investments as at 30 November 2013
United States continued
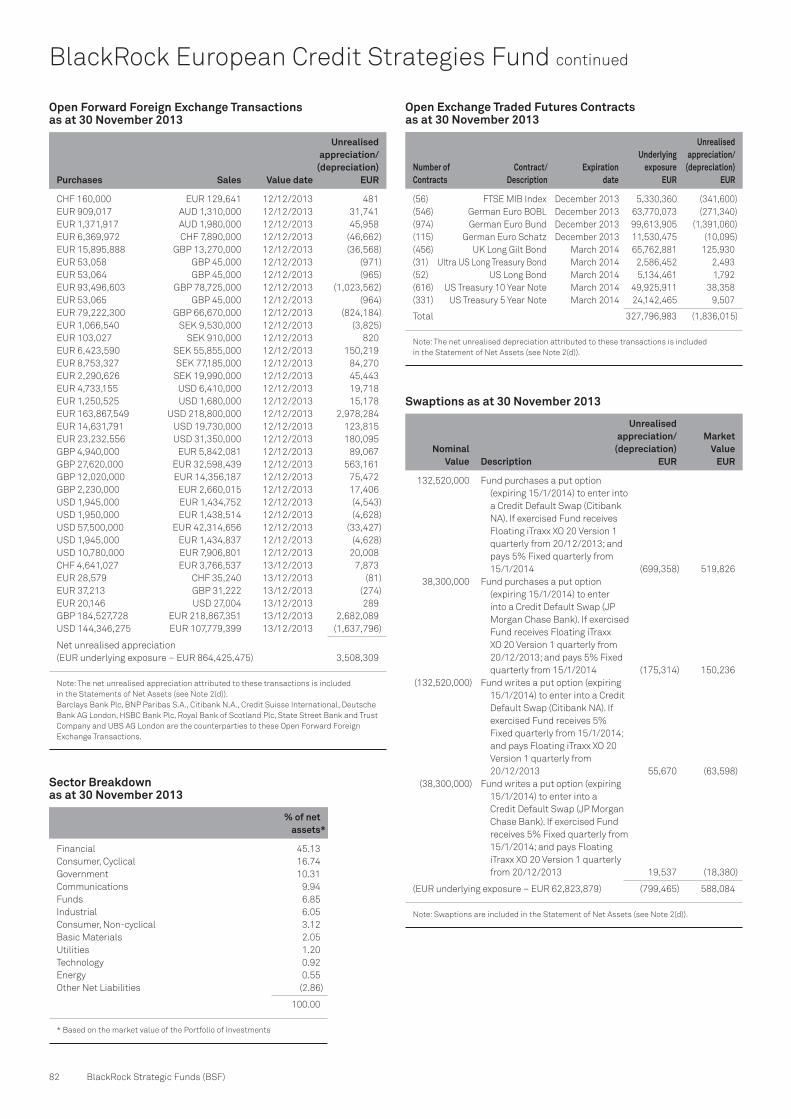
82 BlackRock Strategic Funds (BSF)
BlackRock European Credit Strategies Fund continued
Open Forward Foreign Exchange Transactionsas at 30 November 2013
Purchases Sales Value date
Unrealised appreciation/
(depreciation)EUR
CHF 160,000 EUR 129,641 12/12/2013 481
EUR 909,017 AUD 1,310,000 12/12/2013 31,741
EUR 1,371,917 AUD 1,980,000 12/12/2013 45,958
EUR 6,369,972 CHF 7,890,000 12/12/2013 (46,662)
EUR 15,895,888 GBP 13,270,000 12/12/2013 (36,568)
EUR 53,058 GBP 45,000 12/12/2013 (971)
EUR 53,064 GBP 45,000 12/12/2013 (965)
EUR 93,496,603 GBP 78,725,000 12/12/2013 (1,023,562)
EUR 53,065 GBP 45,000 12/12/2013 (964)
EUR 79,222,300 GBP 66,670,000 12/12/2013 (824,184)
EUR 1,066,540 SEK 9,530,000 12/12/2013 (3,825)
EUR 103,027 SEK 910,000 12/12/2013 820
EUR 6,423,590 SEK 55,855,000 12/12/2013 150,219
EUR 8,753,327 SEK 77,185,000 12/12/2013 84,270
EUR 2,290,626 SEK 19,990,000 12/12/2013 45,443
EUR 4,733,155 USD 6,410,000 12/12/2013 19,718
EUR 1,250,525 USD 1,680,000 12/12/2013 15,178
EUR 163,867,549 USD 218,800,000 12/12/2013 2,978,284
EUR 14,631,791 USD 19,730,000 12/12/2013 123,815
EUR 23,232,556 USD 31,350,000 12/12/2013 180,095
GBP 4,940,000 EUR 5,842,081 12/12/2013 89,067
GBP 27,620,000 EUR 32,598,439 12/12/2013 563,161
GBP 12,020,000 EUR 14,356,187 12/12/2013 75,472
GBP 2,230,000 EUR 2,660,015 12/12/2013 17,406
USD 1,945,000 EUR 1,434,752 12/12/2013 (4,543)
USD 1,950,000 EUR 1,438,514 12/12/2013 (4,628)
USD 57,500,000 EUR 42,314,656 12/12/2013 (33,427)
USD 1,945,000 EUR 1,434,837 12/12/2013 (4,628)
USD 10,780,000 EUR 7,906,801 12/12/2013 20,008
CHF 4,641,027 EUR 3,766,537 13/12/2013 7,873
EUR 28,579 CHF 35,240 13/12/2013 (81)
EUR 37,213 GBP 31,222 13/12/2013 (274)
EUR 20,146 USD 27,004 13/12/2013 289
GBP 184,527,728 EUR 218,867,351 13/12/2013 2,682,089
USD 144,346,275 EUR 107,779,399 13/12/2013 (1,637,796)
Net unrealised appreciation
(EUR underlying exposure – EUR 864,425,475) 3,508,309
Note: The net unrealised appreciation attributed to these transactions is included
in the Statements of Net Assets (see Note 2(d)).
Barclays Bank Plc, BNP Paribas S.A., Citibank N.A., Credit Suisse International, Deutsche
Bank AG London, HSBC Bank Plc, Royal Bank of Scotland Plc, State Street Bank and Trust
Company and UBS AG London are the counterparties to these Open Forward Foreign
Exchange Transactions.
Sector Breakdownas at 30 November 2013
% of netassets *
Financial 45.13
Consumer, Cyclical 16.74
Government 10.31
Communications 9.94
Funds 6.85
Industrial 6.05
Consumer, Non-cyclical 3.12
Basic Materials 2.05
Utilities 1.20
Technology 0.92
Energy 0.55
Other Net Liabilities (2.86)
100.00
* Based on the market value of the Portfolio of Investments
Open Exchange Traded Futures Contractsas at 30 November 2013
Number of Contracts
Contract/Description
Expirationdate
Underlying exposure
EUR
Unrealised appreciation/
(depreciation) EUR
(56) FTSE MIB Index December 2013 5,330,360 (341,600)
(546) German Euro BOBL December 2013 63,770,073 (271,340)
(974) German Euro Bund December 2013 99,613,905 (1,391,060)
(115) German Euro Schatz December 2013 11,530,475 (10,095)
(456) UK Long Gilt Bond March 2014 65,762,881 125,930
(31) Ultra US Long Treasury Bond March 2014 2,586,452 2,493
(52) US Long Bond March 2014 5,134,461 1,792
(616) US Treasury 10 Year Note March 2014 49,925,911 38,358
(331) US Treasury 5 Year Note March 2014 24,142,465 9,507
Total 327,796,983 (1,836,015)
Note: The net unrealised depreciation attributed to these transactions is included
in the Statement of Net Assets (see Note 2(d)).
Swaptions as at 30 November 2013
Nominal Value Description
Unrealised appreciation/
(depreciation) EUR
Market Value
EUR
132,520,000 Fund purchases a put option
(expiring 15/1/2014) to enter into
a Credit Default Swap (Citibank
NA). If exercised Fund receives
Floating iTraxx XO 20 Version 1
quarterly from 20/12/2013; and
pays 5% Fixed quarterly from
15/1/2014 (699,358) 519,826
38,300,000 Fund purchases a put option
(expiring 15/1/2014) to enter
into a Credit Default Swap (JP
Morgan Chase Bank). If exercised
Fund receives Floating iTraxx
XO 20 Version 1 quarterly from
20/12/2013; and pays 5% Fixed
quarterly from 15/1/2014 (175,314) 150,236
(132,520,000) Fund writes a put option (expiring
15/1/2014) to enter into a Credit
Default Swap (Citibank NA). If
exercised Fund receives 5%
Fixed quarterly from 15/1/2014;
and pays Floating iTraxx XO 20
Version 1 quarterly from
20/12/2013 55,670 (63,598)
(38,300,000) Fund writes a put option (expiring
15/1/2014) to enter into a
Credit Default Swap (JP Morgan
Chase Bank). If exercised Fund
receives 5% Fixed quarterly from
15/1/2014; and pays Floating
iTraxx XO 20 Version 1 quarterly
from 20/12/2013 19,537 (18,380)
(EUR underlying exposure – EUR 62,823,879) (799,465) 588,084
Note: Swaptions are included in the Statement of Net Assets (see Note 2(d)).

Nominal Value Description
Unrealisedappreciation/
(depreciation)EUR
NominalValue Description
Unrealisedappreciation/
(depreciation)EUR
Unaudited Interim Report and Accounts 83
The notes on pages 150 to 158 form an integral part of these financial statements.
Swaps as at 30 November 2013
EUR 1,310,000 Credit Default Swaps (Bank of America
International Ltd) (Fund receives Fixed
5.000% and provides default protection on
Scandinavian Airlines 9.650% 16/6/2014)
(20/3/2018) 119,153
USD 2,100,000 Credit Default Swaps (Bank of America Securities
LLC) (Fund receives default protection on
Ireland Government Bond 4.500% 18/4/2020
and pays Fixed 1.000%) (20/3/2018) (56,552)
EUR 3,510,000 Credit Default Swaps (Bank of America) (Fund
receives default protection on Portugal Telecom
International Finance BV 4.375% 24/3/2017
and pays Fixed 5.000%) (20/6/2018) (360,827)
EUR 11,130,000 Credit Default Swaps (Bank of America) (Fund
receives default protection on Stora Enso OYJ
5.125% 23/6/2014 and pays Fixed 5.000%)
(20/9/2018) (552,209)
EUR 1,579,999 Credit Default Swaps (Bank of America) (Fund
receives Fixed 1.000% and provides default
protection on ThyssenKrupp AG 4.375%
18/3/2015) (20/9/2018) 63,470
EUR 7,395,210 Credit Default Swaps (Bank of America) (Fund
receives Fixed 5.000% and provides default
protection on Virgin Media Finance Plc 5.125%
15/2/2022) (20/9/2018) 176,408
EUR 8,070,000 Credit Default Swaps (Barclays Bank) (Fund
receives default protection on AXA SA 4.500%
23/1/2015 and pays Fixed 1.000%) (20/6/2018) (247,924)
EUR 1,500,000 Credit Default Swaps (Barclays Bank) (Fund
receives default protection on Clariant Finance
Luxembourg SA 4.375% 5/4/2013 and pays
Fixed 1.000%) (20/3/2018) (110,458)
EUR 9,200,000 Credit Default Swaps (Barclays Bank) (Fund
receives default protection on Deutsche Bank
AG 5.125% 31/8/2017 and pays Fixed 1.000%)
(20/3/2018) (118,311)
EUR 350,000 Credit Default Swaps (Barclays Bank) (Fund
receives default protection on Dixons Retail
Plc 8.750% 3/8/2015 and pays Fixed 5.000%)
(20/12/2016) (1,459)
EUR 150,000 Credit Default Swaps (Barclays Bank) (Fund
receives default protection on Dixons Retail
Plc 8.750% 3/8/2015 and pays Fixed 5.000%)
(20/12/2017) (2,997)
EUR 3,330,000 Credit Default Swaps (Barclays Bank) (Fund
receives default protection on Finmeccanica
Finance SA/Old 5.750% 12/12/2018 and pays
Fixed 5.000%) (20/12/2018) (11,210)
EUR 2,600,000 Credit Default Swaps (Barclays Bank) (Fund
receives default protection on Finmeccanica
Finance SA/Old 5.750% 12/12/2018 and pays
Fixed 5.000%) (20/6/2018) (116,844)
USD 10,260,000 Credit Default Swaps (Barclays Bank) (Fund
receives default protection on France
Government Bond OAT 4.250% 25/4/2019 and
pays Fixed 0.250%) (20/6/2018) (76,108)
USD 16,890,000 Credit Default Swaps (Barclays Bank) (Fund
receives default protection on Italy Government
International Bond 6.875% 27/9/2023 and pays
Fixed 1.000%) (20/3/2018) (490,280)
EUR 1,490,000 Credit Default Swaps (Barclays Bank) (Fund
receives default protection on iTraxx Europe
Senior Financials Series 19 Version 1 and pays
Fixed 1.000%) (20/6/2018) (43,018)
EUR 4,450,000 Credit Default Swaps (Barclays Bank) (Fund
receives default protection on iTraxx Europe
Senior Financials Series 19 Version 1 and pays
Fixed 1.000%) (20/6/2018) (121,584)
EUR 49,700,000 Credit Default Swaps (Barclays Bank) (Fund
receives default protection on iTraxx Europe
Series 20 Version 1 and pays Fixed 1.000%)
(20/12/2018) (154,930)
EUR 53,910,000 Credit Default Swaps (Barclays Bank) (Fund
receives default protection on iTraxx Europe
Series 20 Version 1 and pays Fixed 1.000%)
(20/12/2018) (168,598)
EUR 3,100,000 Credit Default Swaps (Barclays Bank) (Fund
receives default protection on Norske
Skogindustrier ASA 7.000% 26/6/2017 and pays
Fixed 5.000%) (20/9/2017) 289,042
EUR 460,000 Credit Default Swaps (Barclays Bank) (Fund
receives default protection on Peugeot SA
8.375% 15/7/2014 and pays Fixed 5.000%)
(20/3/2018) (77,455)
EUR 5,091,500 Credit Default Swaps (Barclays Bank) (Fund
receives default protection on Peugeot SA
8.375% 15/7/2014 and pays Fixed 5.000%)
(20/9/2018) (471,611)
USD 4,200,000 Credit Default Swaps (Barclays Bank) (Fund
receives default protection on Portugal
Obrigacoes do Tesouro OT 5.450% 23/9/2013
and pays Fixed 1.000%) (20/12/2017) (301,227)
USD 2,400,000 Credit Default Swaps (Barclays Bank) (Fund
receives default protection on Portugal
Obrigacoes do Tesouro OT 5.450% 23/9/2013
and pays Fixed 1.000%) (20/12/2015) (131,419)
USD 5,000,000 Credit Default Swaps (Barclays Bank) (Fund
receives default protection on Portugal
Obrigacoes do Tesouro OT 5.450% 23/9/2013
and pays Fixed 1.000%) (20/6/2017) (1,114,850)
EUR 1,260,000 Credit Default Swaps (Barclays Bank) (Fund
receives default protection on Societe Air
France SA 2.750% 1/4/2020 and pays Fixed
5.000%) (20/12/2017) (164,165)
EUR 1,750,000 Credit Default Swaps (Barclays Bank) (Fund
receives default protection on Societe Air
France SA 2.750% 1/4/2020 and pays Fixed
5.000%) (20/12/2017) (245,507)
EUR 5,150,000 Credit Default Swaps (Barclays Bank) (Fund
receives default protection on Stena AB 6.125%
1/2/2017 and pays Fixed 5.000%) (20/12/2017) (472,249)
EUR 3,670,000 Credit Default Swaps (Barclays Bank) (Fund
receives default protection on Stora Enso OYJ
5.125% 23/6/2014 and pays Fixed 5.000%)
(20/9/2018) (188,648)
EUR 3,697,604 Credit Default Swaps (Barclays Bank) (Fund
receives default protection on Unitymedia
KabelBW GmbH 9.625% 1/12/2019 and pays
Fixed 5.000%) (20/9/2018) (71,760)
EUR 2,160,000 Credit Default Swaps (Barclays Bank) (Fund
receives default protection on Wind Acquisition
Finance SA 11.750% 15/7/2017 and pays Fixed
5.000%) (20/9/2015) (2,726)
USD 6,270,000 Credit Default Swaps (Barclays Bank) (Fund
receives Fixed 0.250% and provides default
protection on France Government Bond OAT
4.250% 25/4/2019) (20/6/2023) 104,027
EUR 8,070,000 Credit Default Swaps (Barclays Bank) (Fund
receives Fixed 1.000% and provides default
protection on Aviva Plc 9.500% 20/6/2016)
(20/6/2018) 228,548
EUR 3,630,000 Credit Default Swaps (Barclays Bank) (Fund
receives Fixed 1.000% and provides default
protection on Deutsche Bank AG 5.125%
31/8/2017) (20/6/2018) 52,461
BlackRock European Credit Strategies Fund continued
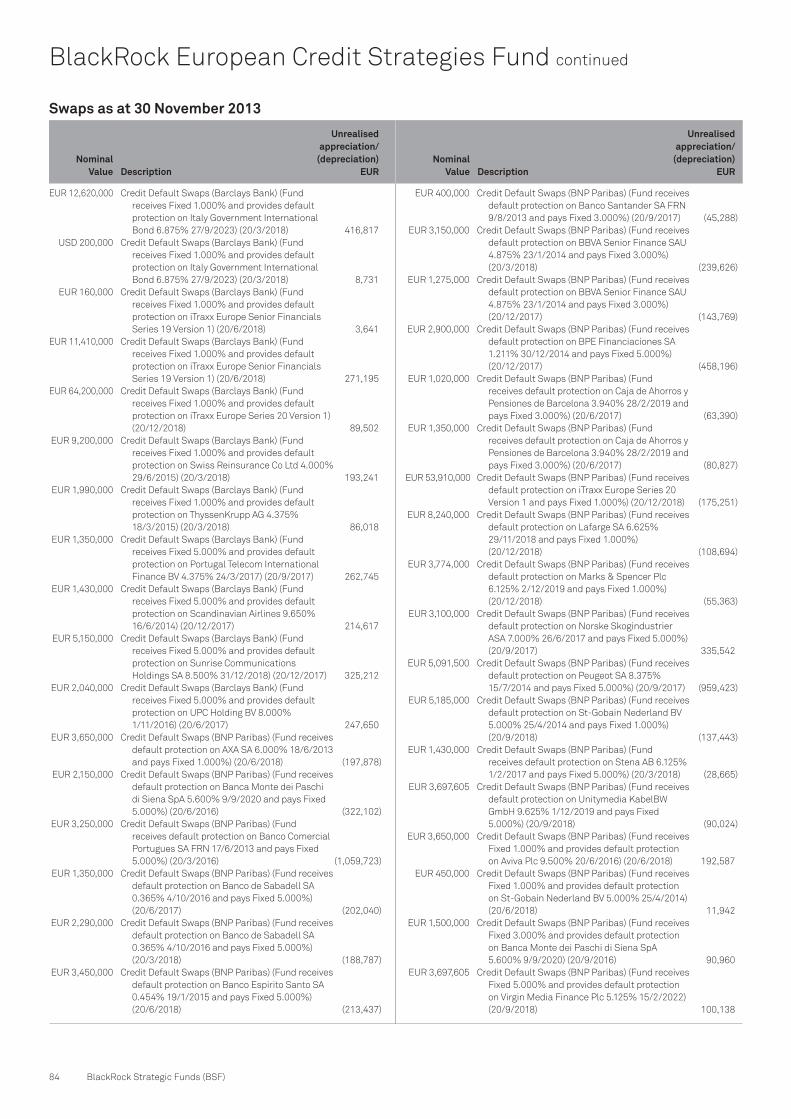
Nominal Value Description
Unrealisedappreciation/
(depreciation)EUR
NominalValue Description
Unrealisedappreciation/
(depreciation)EUR
84 BlackRock Strategic Funds (BSF)
BlackRock European Credit Strategies Fund continued
Swaps as at 30 November 2013
EUR 12,620,000 Credit Default Swaps (Barclays Bank) (Fund
receives Fixed 1.000% and provides default
protection on Italy Government International
Bond 6.875% 27/9/2023) (20/3/2018) 416,817
USD 200,000 Credit Default Swaps (Barclays Bank) (Fund
receives Fixed 1.000% and provides default
protection on Italy Government International
Bond 6.875% 27/9/2023) (20/3/2018) 8,731
EUR 160,000 Credit Default Swaps (Barclays Bank) (Fund
receives Fixed 1.000% and provides default
protection on iTraxx Europe Senior Financials
Series 19 Version 1) (20/6/2018) 3,641
EUR 11,410,000 Credit Default Swaps (Barclays Bank) (Fund
receives Fixed 1.000% and provides default
protection on iTraxx Europe Senior Financials
Series 19 Version 1) (20/6/2018) 271,195
EUR 64,200,000 Credit Default Swaps (Barclays Bank) (Fund
receives Fixed 1.000% and provides default
protection on iTraxx Europe Series 20 Version 1)
(20/12/2018) 89,502
EUR 9,200,000 Credit Default Swaps (Barclays Bank) (Fund
receives Fixed 1.000% and provides default
protection on Swiss Reinsurance Co Ltd 4.000%
29/6/2015) (20/3/2018) 193,241
EUR 1,990,000 Credit Default Swaps (Barclays Bank) (Fund
receives Fixed 1.000% and provides default
protection on ThyssenKrupp AG 4.375%
18/3/2015) (20/3/2018) 86,018
EUR 1,350,000 Credit Default Swaps (Barclays Bank) (Fund
receives Fixed 5.000% and provides default
protection on Portugal Telecom International
Finance BV 4.375% 24/3/2017) (20/9/2017) 262,745
EUR 1,430,000 Credit Default Swaps (Barclays Bank) (Fund
receives Fixed 5.000% and provides default
protection on Scandinavian Airlines 9.650%
16/6/2014) (20/12/2017) 214,617
EUR 5,150,000 Credit Default Swaps (Barclays Bank) (Fund
receives Fixed 5.000% and provides default
protection on Sunrise Communications
Holdings SA 8.500% 31/12/2018) (20/12/2017) 325,212
EUR 2,040,000 Credit Default Swaps (Barclays Bank) (Fund
receives Fixed 5.000% and provides default
protection on UPC Holding BV 8.000%
1/11/2016) (20/6/2017) 247,650
EUR 3,650,000 Credit Default Swaps (BNP Paribas) (Fund receives
default protection on AXA SA 6.000% 18/6/2013
and pays Fixed 1.000%) (20/6/2018) (197,878)
EUR 2,150,000 Credit Default Swaps (BNP Paribas) (Fund receives
default protection on Banca Monte dei Paschi
di Siena SpA 5.600% 9/9/2020 and pays Fixed
5.000%) (20/6/2016) (322,102)
EUR 3,250,000 Credit Default Swaps (BNP Paribas) (Fund
receives default protection on Banco Comercial
Portugues SA FRN 17/6/2013 and pays Fixed
5.000%) (20/3/2016) (1,059,723)
EUR 1,350,000 Credit Default Swaps (BNP Paribas) (Fund receives
default protection on Banco de Sabadell SA
0.365% 4/10/2016 and pays Fixed 5.000%)
(20/6/2017) (202,040)
EUR 2,290,000 Credit Default Swaps (BNP Paribas) (Fund receives
default protection on Banco de Sabadell SA
0.365% 4/10/2016 and pays Fixed 5.000%)
(20/3/2018) (188,787)
EUR 3,450,000 Credit Default Swaps (BNP Paribas) (Fund receives
default protection on Banco Espirito Santo SA
0.454% 19/1/2015 and pays Fixed 5.000%)
(20/6/2018) (213,437)
EUR 400,000 Credit Default Swaps (BNP Paribas) (Fund receives
default protection on Banco Santander SA FRN
9/8/2013 and pays Fixed 3.000%) (20/9/2017) (45,288)
EUR 3,150,000 Credit Default Swaps (BNP Paribas) (Fund receives
default protection on BBVA Senior Finance SAU
4.875% 23/1/2014 and pays Fixed 3.000%)
(20/3/2018) (239,626)
EUR 1,275,000 Credit Default Swaps (BNP Paribas) (Fund receives
default protection on BBVA Senior Finance SAU
4.875% 23/1/2014 and pays Fixed 3.000%)
(20/12/2017) (143,769)
EUR 2,900,000 Credit Default Swaps (BNP Paribas) (Fund receives
default protection on BPE Financiaciones SA
1.211% 30/12/2014 and pays Fixed 5.000%)
(20/12/2017) (458,196)
EUR 1,020,000 Credit Default Swaps (BNP Paribas) (Fund
receives default protection on Caja de Ahorros y
Pensiones de Barcelona 3.940% 28/2/2019 and
pays Fixed 3.000%) (20/6/2017) (63,390)
EUR 1,350,000 Credit Default Swaps (BNP Paribas) (Fund
receives default protection on Caja de Ahorros y
Pensiones de Barcelona 3.940% 28/2/2019 and
pays Fixed 3.000%) (20/6/2017) (80,827)
EUR 53,910,000 Credit Default Swaps (BNP Paribas) (Fund receives
default protection on iTraxx Europe Series 20
Version 1 and pays Fixed 1.000%) (20/12/2018) (175,251)
EUR 8,240,000 Credit Default Swaps (BNP Paribas) (Fund receives
default protection on Lafarge SA 6.625%
29/11/2018 and pays Fixed 1.000%)
(20/12/2018) (108,694)
EUR 3,774,000 Credit Default Swaps (BNP Paribas) (Fund receives
default protection on Marks & Spencer Plc
6.125% 2/12/2019 and pays Fixed 1.000%)
(20/12/2018) (55,363)
EUR 3,100,000 Credit Default Swaps (BNP Paribas) (Fund receives
default protection on Norske Skogindustrier
ASA 7.000% 26/6/2017 and pays Fixed 5.000%)
(20/9/2017) 335,542
EUR 5,091,500 Credit Default Swaps (BNP Paribas) (Fund receives
default protection on Peugeot SA 8.375%
15/7/2014 and pays Fixed 5.000%) (20/9/2017) (959,423)
EUR 5,185,000 Credit Default Swaps (BNP Paribas) (Fund receives
default protection on St-Gobain Nederland BV
5.000% 25/4/2014 and pays Fixed 1.000%)
(20/9/2018) (137,443)
EUR 1,430,000 Credit Default Swaps (BNP Paribas) (Fund
receives default protection on Stena AB 6.125%
1/2/2017 and pays Fixed 5.000%) (20/3/2018) (28,665)
EUR 3,697,605 Credit Default Swaps (BNP Paribas) (Fund receives
default protection on Unitymedia KabelBW
GmbH 9.625% 1/12/2019 and pays Fixed
5.000%) (20/9/2018) (90,024)
EUR 3,650,000 Credit Default Swaps (BNP Paribas) (Fund receives
Fixed 1.000% and provides default protection
on Aviva Plc 9.500% 20/6/2016) (20/6/2018) 192,587
EUR 450,000 Credit Default Swaps (BNP Paribas) (Fund receives
Fixed 1.000% and provides default protection
on St-Gobain Nederland BV 5.000% 25/4/2014)
(20/6/2018) 11,942
EUR 1,500,000 Credit Default Swaps (BNP Paribas) (Fund receives
Fixed 3.000% and provides default protection
on Banca Monte dei Paschi di Siena SpA
5.600% 9/9/2020) (20/9/2016) 90,960
EUR 3,697,605 Credit Default Swaps (BNP Paribas) (Fund receives
Fixed 5.000% and provides default protection
on Virgin Media Finance Plc 5.125% 15/2/2022)
(20/9/2018) 100,138

Nominal Value Description
Unrealisedappreciation/
(depreciation)EUR
NominalValue Description
Unrealisedappreciation/
(depreciation)EUR
Unaudited Interim Report and Accounts 85
The notes on pages 150 to 158 form an integral part of these financial statements.
BlackRock European Credit Strategies Fund continued
Swaps as at 30 November 2013
EUR 1,500,000 Credit Default Swaps (Citibank) (Fund receives
default protection on Banca Monte dei Paschi
di Siena SpA 4.500% 24/9/2015 and pays Fixed
5.000%) (20/9/2016) (37,436)
EUR 690,000 Credit Default Swaps (Citibank) (Fund receives
default protection on BBVA Senior Finance SAU
4.875% 23/1/2014 and pays Fixed 3.000%)
(20/9/2017) (81,411)
EUR 3,700,000 Credit Default Swaps (Citibank) (Fund receives
default protection on British Airways Plc
8.750% 23/8/2016 and pays Fixed 5.000%)
(20/12/2018) (185,693)
EUR 11,130,000 Credit Default Swaps (Citibank) (Fund receives
default protection on Clariant AG 3.125%
9/6/2017 and pays Fixed 1.000%) (20/9/2018) (256,316)
EUR 3,600,000 Credit Default Swaps (Citibank) (Fund receives
default protection on Deutsche Bank AG 5.125%
31/8/2017 and pays Fixed 1.000%) (20/3/2018) (44,539)
EUR 2,750,000 Credit Default Swaps (Citibank) (Fund receives
default protection on Dixons Retail Plc 8.750%
3/8/2015 and pays Fixed 5.000%) (20/9/2016) (805,478)
EUR 3,330,000 Credit Default Swaps (Citibank) (Fund receives
default protection on Dixons Retail Plc 8.750%
3/8/2015 and pays Fixed 5.000%) (20/6/2017) (751,225)
USD 11,090,000 Credit Default Swaps (Citibank) (Fund receives
default protection on France Government Bond
OAT 4.250% 25/4/2019 and pays Fixed 0.250%)
(20/6/2018) (102,912)
USD 3,500,000 Credit Default Swaps (Citibank) (Fund receives
default protection on Ireland Government Bond
5.400% 13/3/2025 and pays Fixed 1.000%)
(20/3/2017) (526,198)
USD 2,000,000 Credit Default Swaps (Citibank) (Fund receives
default protection on Ireland Government Bond
5.400% 13/3/2025 and pays Fixed 1.000%)
(20/12/2016) (360,188)
USD 2,500,000 Credit Default Swaps (Citibank) (Fund receives
default protection on Ireland Government Bond
5.400% 13/3/2025 and pays Fixed 1.000%)
(20/12/2016) (441,555)
EUR 5,700,000 Credit Default Swaps (Citibank) (Fund receives
default protection on iTraxx Europe Crossover
Series 20 Version 1 and pays Fixed 5.000%)
(20/12/2018) (17,596)
EUR 25,780,000 Credit Default Swaps (Citibank) (Fund receives
default protection on iTraxx Europe Senior
Financials Series 20 Version 1 and pays Fixed
1.000%) (20/12/2018) (313,661)
EUR 5,155,000 Credit Default Swaps (Citibank) (Fund receives
default protection on iTraxx Europe Senior
Financials Series 20 Version 1 and pays Fixed
1.000%) (20/12/2018) (57,731)
EUR 1,620,000 Credit Default Swaps (Citibank) (Fund receives
default protection on iTraxx Europe Series 20
Version 1 and pays Fixed 1.000%) (20/12/2018) (4,147)
EUR 24,850,000 Credit Default Swaps (Citibank) (Fund receives
default protection on iTraxx Europe Series 20
Version 1 and pays Fixed 1.000%) (20/12/2018) (68,250)
EUR 15,400,000 Credit Default Swaps (Citibank) (Fund receives
default protection on iTraxx Europe Series 9
Version 1 and pays Fixed 5.000%) (20/6/2018) (1,881,595)
EUR 900,000 Credit Default Swaps (Citibank) (Fund receives
default protection on iTraxx Europe Series 9
Version 1 and pays Fixed 5.000%) (20/6/2018) (134,713)
EUR 1,875,000 Credit Default Swaps (Citibank) (Fund receives
default protection on Norske Skogindustrier
ASA 7.000% 26/6/2017 and pays Fixed 5.000%)
(20/9/2017) 225,839
EUR 2,000,000 Credit Default Swaps (Citibank) (Fund receives
default protection on Norske Skogindustrier
ASA 7.000% 26/6/2017 and pays Fixed 5.000%)
(20/9/2017) 91,479
EUR 1,950,000 Credit Default Swaps (Citibank) (Fund receives
default protection on Peugeot SA 8.375%
15/7/2014 and pays Fixed 5.000%) (20/6/2018) (303,089)
USD 1,350,000 Credit Default Swaps (Citibank) (Fund receives
default protection on Portugal Obrigacoes do
Tesouro OT 4.950% 25/10/2023 and pays Fixed
1.000%) (20/6/2015) (4,406)
USD 580,000 Credit Default Swaps (Citibank) (Fund receives
default protection on Portugal Obrigacoes do
Tesouro OT 5.450% 23/9/2013 and pays Fixed
1.000%) (20/3/2018) (19,797)
USD 2,250,000 Credit Default Swaps (Citibank) (Fund receives
default protection on Portugal Obrigacoes do
Tesouro OT 5.450% 23/9/2013 and pays Fixed
1.000%) (20/9/2017) (375,414)
USD 6,500,000 Credit Default Swaps (Citibank) (Fund receives
default protection on Portugal Obrigacoes do
Tesouro OT 5.450% 23/9/2013 and pays Fixed
1.000%) (20/6/2017) (1,424,680)
USD 5,380,000 Credit Default Swaps (Citibank) (Fund receives
default protection on Republic of Ireland
4.500% 4/18/2020 and pays Fixed 1.000%)
(20/6/2018) (159,904)
EUR 3,625,000 Credit Default Swaps (Citibank) (Fund receives
default protection on Scandinavian Airlines
9.650% 16/6/2014 and pays Fixed 5.000%)
(20/6/2018) (188,193)
EUR 3,200,000 Credit Default Swaps (Citibank) (Fund receives
default protection on Societe Air France SA
2.750% 1/4/2020 and pays Fixed 5.000%)
(20/12/2017) (608,928)
EUR 4,140,000 Credit Default Swaps (Citibank) (Fund receives
default protection on Societe Air France SA
2.750% 1/4/2020 and pays Fixed 5.000%)
(20/9/2018) (393,896)
EUR 1,700,000 Credit Default Swaps (Citibank) (Fund receives
default protection on Societe Generale SA
5.250% 28/3/2013 and pays Fixed 3.000%)
(20/12/2017) (84,512)
EUR 3,840,000 Credit Default Swaps (Citibank) (Fund receives
default protection on Wind Acquisition Finance
SA 11.750% 15/7/2017 and pays Fixed 5.000%)
(20/9/2015) (8,772)
USD 6,760,000 Credit Default Swaps (Citibank) (Fund receives
Fixed 0.250% and provides default protection
on France Government Bond OAT 4.250%
25/4/2019) (20/6/2023) 134,683
EUR 3,000,000 Credit Default Swaps (Citibank) (Fund receives
Fixed 1.000% and provides default protection
on Imperial Tobacco Finance Plc 6.250%
4/12/2018) (20/12/2017) 58,245
USD 2,000,000 Credit Default Swaps (Citibank) (Fund receives
Fixed 1.000% and provides default protection
on Italy Government International Bond 6.875%
27/9/2023) (20/12/2016) 226,470
USD 2,500,000 Credit Default Swaps (Citibank) (Fund receives
Fixed 1.000% and provides default protection
on Italy Government International Bond 6.875%
27/9/2023) (20/12/2016) 276,845
EUR 64,230,000 Credit Default Swaps (Citibank) (Fund receives
Fixed 1.000% and provides default protection
on iTraxx Europe Series 20 Version 1) (20/12/2018) 89,544

Nominal Value Description
Unrealisedappreciation/
(depreciation)EUR
NominalValue Description
Unrealisedappreciation/
(depreciation)EUR
86 BlackRock Strategic Funds (BSF)
Swaps as at 30 November 2013
EUR 3,600,000 Credit Default Swaps (Citibank) (Fund receives
Fixed 1.000% and provides default protection
on Swiss Reinsurance Co Ltd 4.000%
29/6/2015) (20/3/2018) 76,491
EUR 2,120,000 Credit Default Swaps (Citibank) (Fund receives
Fixed 1.000% and provides default protection
on ThyssenKrupp AG 4.375% 18/3/2015)
(20/9/2018) 98,156
EUR 13,500,000 Credit Default Swaps (Citibank) (Fund receives
Fixed 5.000% and provides default protection
on Ardagh Packaging Finance Plc 9.250%
15/10/2020) (20/12/2018) 750,585
EUR 4,500,000 Credit Default Swaps (Citibank) (Fund receives
Fixed 5.000% and provides default protection
on Ardagh Packaging Finance Plc 9.250%
15/10/2020) (20/12/2018) 244,688
EUR 11,300,000 Credit Default Swaps (Citibank) (Fund receives
Fixed 5.000% and provides default protection
on Grohe Holding GmbH 8.750% 15/12/2017)
(20/12/2018) 511,951
EUR 3,765,000 Credit Default Swaps (Citibank) (Fund receives
Fixed 5.000% and provides default protection
on Jaguar Land Rover Automotive PLC 8.125%
15/5/2018) (20/12/2018) 133,722
EUR 3,330,000 Credit Default Swaps (Citibank) (Fund receives
Fixed 5.000% and provides default protection
on Kabel BW Musketeer GmbH 9.500%
15/3/2021) (20/6/2017) 549,449
EUR 3,330,000 Credit Default Swaps (Citibank) (Fund receives
Fixed 5.000% and provides default protection
on Kabel BW Musketeer GmbH 9.500%
15/3/2021) (20/6/2017) 416,249
EUR 1,330,000 Credit Default Swaps (Citibank) (Fund receives
Fixed 5.000% and provides default protection
on Kabel BW Musketeer GmbH 9.500%
15/3/2021) (20/6/2017) 162,924
EUR 1,600,000 Credit Default Swaps (Citibank) (Fund receives
Fixed 5.000% and provides default protection
on Norske Skogindustrier ASA 7.000%
26/6/2017) (20/3/2015) 92,023
EUR 1,500,000 Credit Default Swaps (Citibank) (Fund receives
Fixed 5.000% and provides default protection
on Scandinavian Airlines 9.650% 16/6/2014)
(20/12/2017) 217,622
EUR 670,000 Credit Default Swaps (Citibank) (Fund receives
Fixed 5.000% and provides default protection
on Scandinavian Airlines 9.650% 16/6/2014)
(20/12/2017) 100,555
EUR 3,200,000 Credit Default Swaps (Citibank) (Fund receives
Fixed 5.000% and provides default protection
on Scandinavian Airlines 9.650% 16/6/2014)
(20/12/2017) 520,262
EUR 5,050,000 Credit Default Swaps (Citibank) (Fund receives
Fixed 5.000% and provides default protection
on Sunrise Communications Holdings SA
8.500% 31/12/2018) (20/12/2017) 208,485
EUR 1,670,000 Credit Default Swaps (Citibank) (Fund receives
Fixed 5.000% and provides default protection
on Sunrise Communications Holdings SA
8.500% 31/12/2018) (20/3/2018) 58,760
EUR 1,230,000 Credit Default Swaps (Citibank) (Fund receives
Fixed 5.000% and provides default protection
on Techem GmbH 6.125% 1/10/2019) (20/6/2018) 79,944
EUR 1,370,000 Credit Default Swaps (Citibank) (Fund receives
Fixed 5.000% and provides default protection
on Techem GmbH 6.125% 1/10/2019) (20/6/2018) 90,859
EUR 3,697,604 Credit Default Swaps (Citibank) (Fund receives
Fixed 5.000% and provides default protection
on Virgin Media Finance Plc 5.125% 15/2/2022)
(20/9/2018) 72,277
EUR 3,940,000 Credit Default Swaps (Credit Suisse) (Fund
receives default protection on AXA SA 6.000%
18/6/2013 and pays Fixed 1.000%) (20/6/2018) (217,222)
EUR 650,000 Credit Default Swaps (Credit Suisse) (Fund
receives default protection on Dixons Retail
Plc 8.750% 3/8/2015 and pays Fixed 5.000%)
(20/12/2016) (190,775)
EUR 2,000,000 Credit Default Swaps (Credit Suisse) (Fund
receives default protection on Dixons Retail
Plc 8.750% 3/8/2015 and pays Fixed 5.000%)
(20/12/2016) (517,000)
EUR 2,125,000 Credit Default Swaps (Credit Suisse) (Fund
receives default protection on Finmeccanica
Finance SA/Old 5.750% 12/12/2018 and pays
Fixed 5.000%) (20/6/2018) (79,160)
EUR 1,230,000 Credit Default Swaps (Credit Suisse) (Fund
receives default protection on Finmeccanica
Finance SA/Old 5.750% 12/12/2018 and pays
Fixed 5.000%) (20/6/2018) (47,167)
EUR 6,000,000 Credit Default Swaps (Credit Suisse) (Fund
receives default protection on Henkel AG &
Co KGaA 4.250% 10/6/2013 and pays Fixed
1.000%) (20/12/2017) (62,748)
EUR 3,600,000 Credit Default Swaps (Credit Suisse) (Fund
receives default protection on Marks & Spencer
Plc 5.625% 24/3/2014 and pays Fixed 1.000%)
(20/3/2018) (140,692)
EUR 5,925,000 Credit Default Swaps (Credit Suisse) (Fund
receives default protection on St-Gobain
Nederland BV 5.000% 25/4/2014 and pays
Fixed 1.000%) (20/9/2018) (143,373)
EUR 1,100,000 Credit Default Swaps (Credit Suisse) (Fund
receives default protection on Stena AB 6.125%
1/2/2017 and pays Fixed 5.000%) (20/12/2017) (63,843)
EUR 3,697,605 Credit Default Swaps (Credit Suisse) (Fund
receives default protection on Unitymedia
KabelBW GmbH 9.625% 1/12/2019 and pays
Fixed 5.000%) (20/9/2018) (84,479)
EUR 3,940,000 Credit Default Swaps (Credit Suisse) (Fund
receives Fixed 1.000% and provides default
protection on Aviva Plc 9.500% 20/6/2016)
(20/6/2018) 206,981
EUR 3,370,000 Credit Default Swaps (Credit Suisse) (Fund
receives Fixed 1.000% and provides default
protection on Solvay SA 4.625% 27/6/2018)
(20/6/2018) 49,799
EUR 3,300,000 Credit Default Swaps (Credit Suisse) (Fund
receives Fixed 1.000% and provides default
protection on ThyssenKrupp AG 4.375%
18/3/2015) (20/3/2018) 109,598
EUR 3,600,000 Credit Default Swaps (Credit Suisse) (Fund
receives Fixed 1.000% and provides default
protection on ThyssenKrupp AG 4.375%
18/3/2015) (20/3/2018) 106,572
EUR 3,400,000 Credit Default Swaps (Credit Suisse) (Fund
receives Fixed 1.000% and provides default
protection on ThyssenKrupp AG 4.375%
18/3/2015) (20/12/2017) 192,338
EUR 2,500,000 Credit Default Swaps (Credit Suisse) (Fund
receives Fixed 3.000% and provides default
protection on Banca Monte dei Paschi di Siena
SpA 5.600% 9/9/2020) (20/6/2016) (72,992)
BlackRock European Credit Strategies Fund continued

Nominal Value Description
Unrealisedappreciation/
(depreciation)EUR
NominalValue Description
Unrealisedappreciation/
(depreciation)EUR
Unaudited Interim Report and Accounts 87
The notes on pages 150 to 158 form an integral part of these financial statements.
BlackRock European Credit Strategies Fund continued
Swaps as at 30 November 2013
EUR 10,610,000 Credit Default Swaps (Credit Suisse) (Fund
receives Fixed 5.000% and provides default
protection on Ardagh Packaging Finance Plc
9.250% 15/10/2020) (20/12/2018) 259,091
EUR 7,380,000 Credit Default Swaps (Credit Suisse) (Fund
receives Fixed 5.000% and provides default
protection on CIR-Compagnie Industriali Riunite
SpA 5.750% 16/12/2024) (20/12/2018) (30,691)
EUR 7,500,000 Credit Default Swaps (Credit Suisse) (Fund
receives Fixed 5.000% and provides default
protection on Grohe Holding GmbH 8.750%
15/12/2017) (20/12/2018) 336,938
EUR 7,080,000 Credit Default Swaps (Credit Suisse) (Fund
receives Fixed 5.000% and provides default
protection on Jaguar Land Rover Automotive Plc
8.125% 15/5/2018) (20/12/2018) 31,124
EUR 3,600,000 Credit Default Swaps (Credit Suisse) (Fund
receives Fixed 5.000% and provides default
protection on Norske Skogindustrier ASA
7.000% 26/6/2017) (20/3/2015) 40,732
EUR 3,015,000 Credit Default Swaps (Credit Suisse) (Fund
receives Fixed 5.000% and provides default
protection on Norske Skogindustrier ASA
7.000% 26/6/2017) (20/12/2018) (199,691)
EUR 6,545,000 Credit Default Swaps (Credit Suisse) (Fund
receives Fixed 5.000% and provides default
protection on Norske Skogindustrier ASA
7.000% 26/6/2017) (20/3/2015) 278,584
EUR 1,390,000 Credit Default Swaps (Credit Suisse) (Fund
receives Fixed 5.000% and provides default
protection on Scandinavian Airlines 9.650%
16/6/2014) (20/12/2017) 208,614
EUR 2,100,000 Credit Default Swaps (Credit Suisse) (Fund
receives Fixed 5.000% and provides default
protection on Sunrise Communications
Holdings SA 8.500% 31/12/2018) (20/12/2017) 81,085
EUR 2,450,000 Credit Default Swaps (Credit Suisse) (Fund
receives Fixed 5.000% and provides default
protection on Techem GmbH 6.125% 1/10/2019)
(20/9/2018) 35,455
EUR 822,000 Credit Default Swaps (Credit Suisse) (Fund
receives Fixed 5.000% and provides default
protection on Techem GmbH 6.125% 1/10/2019)
(20/9/2018) 9,644
EUR 818,267 Credit Default Swaps (Credit Suisse) (Fund
receives Fixed 5.000% and provides default
protection on Techem GmbH 6.125% 1/10/2019)
(20/12/2018) 11,055
EUR 3,500,000 Credit Default Swaps (Credit Suisse) (Fund
receives Fixed 5.000% and provides default
protection on Techem GmbH 6.125% 1/10/2019)
(20/6/2018) 57,905
EUR 5,630,000 Credit Default Swaps (Credit Suisse) (Fund
receives Fixed 5.000% and provides default
protection on Techem GmbH 6.125% 1/10/2019)
(20/6/2018) 143,471
EUR 7,440,000 Credit Default Swaps (Credit Suisse) (Fund
receives Fixed 5.000% and provides default
protection on Unilabs Subholding AB 8.500%
15/7/2018) (20/12/2017) (225,204)
EUR 400,000 Credit Default Swaps (Credit Suisse) (Fund
receives Fixed 5.000% and provides default
protection on Unitymedia KabelBW GmbH
9.625% 1/12/2019) (20/12/2017) 10,248
EUR 1,565,000 Credit Default Swaps (Deutsche Asset
Management Life) (Fund receives default
protection on BBVA Senior Finance SAU 4.875%
23/1/2014 and pays Fixed 3.000%) (20/12/2018) (32,160)
EUR 6,000,000 Credit Default Swaps (Deutsche Asset
Management Life) (Fund receives default
protection on Diageo Capital Plc 5.500%
30/9/2016 and pays Fixed 1.000%) (20/12/2017) (68,174)
EUR 79,400,000 Credit Default Swaps (Deutsche Asset
Management Life) (Fund receives default
protection on iTraxx Europe Senior Financials
Series 19 Version 1 and pays Fixed 1.000%)
(20/6/2018) (1,771,902)
EUR 48,000,000 Credit Default Swaps (Deutsche Asset
Management Life) (Fund receives default
protection on iTraxx Europe Series 20 Version 1
and pays Fixed 1.000%) (20/12/2018) (134,384)
EUR 49,700,000 Credit Default Swaps (Deutsche Asset
Management Life) (Fund receives default
protection on iTraxx Europe Series 20 Version 1
and pays Fixed 1.000%) (20/12/2018) (157,387)
EUR 24,890,000 Credit Default Swaps (Deutsche Asset
Management Life) (Fund receives default
protection on iTraxx Europe Series 20 Version 1
and pays Fixed 1.000%) (20/12/2018) (68,052)
EUR 20,020,000 Credit Default Swaps (Deutsche Asset
Management Life) (Fund receives default
protection on Koninklijke DSM NV 4.000%
10/11/2015 and pays Fixed 1.000%) (20/12/2017) (166,245)
EUR 9,030,000 Credit Default Swaps (Deutsche Asset
Management Life) (Fund receives default
protection on Next Plc 5.375% 26/10/2021 and
pays Fixed 1.000%) (20/12/2018) (101,515)
EUR 3,500,000 Credit Default Swaps (Deutsche Asset
Management Life) (Fund receives default
protection on Stena AB 6.125% 1/2/2017 and
pays Fixed 5.000%) (20/12/2017) (325,637)
EUR 2,000,000 Credit Default Swaps (Deutsche Asset
Management Life) (Fund receives default
protection on Veolia Environnement SA 5.375%
28/5/2018 and pays Fixed 1.000%) (20/12/2017) (89,707)
EUR 3,700,000 Credit Default Swaps (Deutsche Asset
Management Life) (Fund receives default
protection on Wind Acquisition Finance SA
11.750% 15/7/2017 and pays Fixed 5.000%)
(20/9/2015) (19,548)
EUR 6,000,000 Credit Default Swaps (Deutsche Asset
Management Life) (Fund receives default
protection on Wolters Kluwer NV 5.125%
27/1/2014 and pays Fixed 1.000%) (20/12/2017) (21,548)
EUR 6,130,000 Credit Default Swaps (Deutsche Asset
Management Life) (Fund receives default
protection on WPP PLC 6.000% 4/4/2017 and
pays Fixed 1.000%) (20/12/2017) (128,540)
EUR 1,565,000 Credit Default Swaps (Deutsche Asset
Management Life) (Fund receives Fixed 3.000%
and provides default protection on UniCredit
SpA 4.375% 29/1/2020) (20/12/2018) 45,979
EUR 56,700,000 Credit Default Swaps (Deutsche Asset
Management Life) (Fund receives Fixed 5.000%
and provides default protection on iTraxx
Europe Sub Financials Series 19 Version 1)
(20/6/2018) 1,771,733
EUR 1,750,000 Credit Default Swaps (Deutsche Bank) (Fund
receives default protection on Banca Monte dei
Paschi di Siena SpA 5.600% 9/9/2020 and pays
Fixed 5.000%) (20/12/2016) (263,436)
USD 3,000,000 Credit Default Swaps (Deutsche Bank) (Fund
receives default protection on Ireland
Government Bond 4.500% 18/4/2020 and pays
Fixed 1.000%) (20/9/2016) (551,003)

Nominal Value Description
Unrealisedappreciation/
(depreciation)EUR
NominalValue Description
Unrealisedappreciation/
(depreciation)EUR
88 BlackRock Strategic Funds (BSF)
Swaps as at 30 November 2013
EUR 1,490,000 Credit Default Swaps (Deutsche Bank) (Fund
receives default protection on iTraxx Europe
Senior Financials Series 19 Version 1 and pays
Fixed 1.000%) (20/6/2018) (42,359)
EUR 25,490,000 Credit Default Swaps (Deutsche Bank) (Fund
receives default protection on iTraxx Europe
Senior Financials Series 20 Version 1 and pays
Fixed 1.000%) (20/12/2018) (310,899)
USD 3,250,000 Credit Default Swaps (Deutsche Bank) (Fund
receives default protection on Portugal
Obrigacoes do Tesouro OT 5.450% 23/9/2013
and pays Fixed 1.000%) (20/12/2015) (177,963)
USD 2,550,000 Credit Default Swaps (Deutsche Bank) (Fund
receives default protection on Republic of
Ireland 4.500% 4/18/2020 and pays Fixed
1.000%) (20/3/2018) (68,670)
EUR 1,700,000 Credit Default Swaps (Deutsche Bank) (Fund
receives default protection on Societe Generale
SA 5.250% 28/3/2013 and pays Fixed 3.000%)
(20/12/2017) (83,682)
EUR 3,697,605 Credit Default Swaps (Deutsche Bank) (Fund
receives default protection on Unitymedia
KabelBW GmbH 9.625% 1/12/2019 and pays
Fixed 5.000%) (20/9/2018) (82,799)
EUR 3,750,000 Credit Default Swaps (Deutsche Bank) (Fund
receives default protection on Wind Acquisition
Finance SA 11.750% 15/7/2017 and pays Fixed
5.000%) (20/9/2015) (16,954)
EUR 3,750,000 Credit Default Swaps (Deutsche Bank) (Fund
receives default protection on Wind Acquisition
Finance SA 11.750% 15/7/2017 and pays Fixed
5.000%) (20/9/2015) (16,954)
EUR 3,500,000 Credit Default Swaps (Deutsche Bank) (Fund
receives Fixed 1.000% and provides default
protection on Imperial Tobacco Finance Plc
6.250% 4/12/2018) (20/12/2017) 46,789
EUR 4,550,000 Credit Default Swaps (Deutsche Bank) (Fund
receives Fixed 1.000% and provides default
protection on ThyssenKrupp AG 4.375%
18/3/2015) (20/9/2018) 149,001
EUR 340,000 Credit Default Swaps (Deutsche Bank) (Fund
receives Fixed 5.000% and provides default
protection on Portugal Telecom International
Finance BV 4.375% 24/3/2017) (20/9/2017) 65,323
EUR 3,470,000 Credit Default Swaps (Deutsche Bank) (Fund
receives Fixed 5.000% and provides default
protection on Techem GmbH 6.125% 1/10/2019)
(20/6/2018) 206,788
EUR 1,540,000 Credit Default Swaps (Goldman Sachs) (Fund
receives default protection on BBVA Senior
Finance SAU 4.875% 23/1/2014 and pays Fixed
3.000%) (20/6/2018) (107,424)
EUR 3,730,000 Credit Default Swaps (Goldman Sachs) (Fund
receives default protection on Finmeccanica
Finance SA/Old 5.750% 12/12/2018 and pays
Fixed 5.000%) (20/12/2018) (47,141)
USD 4,000,000 Credit Default Swaps (Goldman Sachs) (Fund
receives default protection on Ireland
Government Bond 4.500% 18/4/2020 and pays
Fixed 1.000%) (20/12/2016) (733,762)
EUR 1,750,000 Credit Default Swaps (Goldman Sachs) (Fund
receives default protection on St-Gobain
Nederland BV 5.000% 25/4/2014 and pays
Fixed 1.000%) (20/12/2017) (72,907)
USD 4,000,000 Credit Default Swaps (Goldman Sachs) (Fund
receives Fixed 1.000% and provides default
protection on Italy Government International
Bond 6.875% 27/9/2023) (20/12/2016) 463,520
EUR 1,725,000 Credit Default Swaps (Goldman Sachs) (Fund
receives Fixed 1.000% and provides default
protection on ThyssenKrupp AG 4.375%
18/3/2015) (20/12/2017) 100,694
EUR 1,066,668 Credit Default Swaps (Goldman Sachs) (Fund
receives Fixed 1.000% and provides default
protection on ThyssenKrupp AG 4.375%
18/3/2015) (20/9/2018) 32,946
EUR 1,940,000 Credit Default Swaps (Goldman Sachs) (Fund
receives Fixed 5.000% and provides default
protection on Sunrise Communications
Holdings SA 8.500% 31/12/2018) (20/12/2017) 89,791
EUR 1,790,000 Credit Default Swaps (Goldman Sachs) (Fund
receives Fixed 5.000% and provides default
protection on Sunrise Communications
Holdings SA 8.500% 31/12/2018) (20/3/2018) 55,170
EUR 3,500,000 Credit Default Swaps (Goldman Sachs) (Fund
receives Fixed 5.000% and provides default
protection on Unitymedia KabelBW GmbH
9.625% 1/12/2019) (20/12/2017) 230,008
EUR 2,350,000 Credit Default Swaps (JP Morgan Chase Bank
(Depository Cle) (Fund receives default
protection on Banco de Sabadell SA 0.365%
4/10/2016 and pays Fixed 5.000%) (20/9/2017) (367,019)
EUR 3,400,000 Credit Default Swaps (JP Morgan Chase Bank
(Depository Cle) (Fund receives default
protection on Caja de Ahorros y Pensiones de
Barcelona 3.940% 28/2/2019 and pays Fixed
3.000%) (20/12/2015) (162,160)
EUR 7,060,000 Credit Default Swaps (JP Morgan Chase Bank
(Depository Cle) (Fund receives default
protection on Clariant Finance Luxembourg
SA 4.375% 5/4/2013 and pays Fixed 1.000%)
(20/12/2017) (547,366)
EUR 15,250,000 Credit Default Swaps (JP Morgan Chase Bank
(Depository Cle) (Fund receives default
protection on Finmeccanica Finance SA/Old
5.750% 12/12/2018 and pays Fixed 5.000%)
(20/3/2016) (5,964)
EUR 2,420,000 Credit Default Swaps (JP Morgan Chase Bank
(Depository Cle) (Fund receives default
protection on Finmeccanica Finance SA/Old
5.750% 12/12/2018 and pays Fixed 5.000%)
(20/12/2017) (127,447)
EUR 3,200,000 Credit Default Swaps (JP Morgan Chase Bank
(Depository Cle) (Fund receives default
protection on Finmeccanica Finance SA/Old
5.750% 12/12/2018 and pays Fixed 5.000%)
(20/12/2017) (154,169)
EUR 3,240,000 Credit Default Swaps (JP Morgan Chase Bank
(Depository Cle) (Fund receives default
protection on Jaguar Land Rover Automotive
Plc 8.125% 15/5/2018 and pays Fixed 5.000%)
(20/3/2016) (30,587)
EUR 2,785,000 Credit Default Swaps (JP Morgan Chase Bank
(Depository Cle) (Fund receives default
protection on Marks & Spencer Plc 5.625%
24/3/2014 and pays Fixed 1.000%) (20/12/2017) (120,417)
EUR 2,050,000 Credit Default Swaps (JP Morgan Chase Bank
(Depository Cle) (Fund receives default
protection on Societe Air France SA 2.750%
1/4/2020 and pays Fixed 5.000%) (20/12/2017) (292,719)
EUR 1,840,000 Credit Default Swaps (JP Morgan Chase Bank
(Depository Cle) (Fund receives default
protection on St-Gobain Nederland BV 5.000%
25/4/2014 and pays Fixed 1.000%) (20/12/2017) (88,011)
BlackRock European Credit Strategies Fund continued

Nominal Value Description
Unrealisedappreciation/
(depreciation)EUR
NominalValue Description
Unrealisedappreciation/
(depreciation)EUR
Unaudited Interim Report and Accounts 89
The notes on pages 150 to 158 form an integral part of these financial statements.
Swaps as at 30 November 2013
EUR 7,500,000 Credit Default Swaps (JP Morgan Chase Bank
(Depository Cle) (Fund receives Fixed 1.000%
and provides default protection on E.ON
International Finance BV 6.375% 29/5/2017)
(20/12/2017) 69,195
EUR 1,705,000 Credit Default Swaps (JP Morgan Chase
Bank (Depository Cle) (Fund receives Fixed
1.000% and provides default protection on
ThyssenKrupp AG 4.375% 18/3/2015)
(20/12/2017) 99,527
EUR 3,370,000 Credit Default Swaps (JP Morgan Chase Bank
(Depository Cle) (Fund receives Fixed 1.000%
and provides default protection on Vinci SA
4.125% 20/2/2017) (20/6/2018) 39,677
EUR 12,980,000 Credit Default Swaps (JP Morgan Chase
Bank (Depository Cle) (Fund receives Fixed
5.000% and provides default protection
on Finmeccanica Finance SA/Old 5.750%
12/12/2018) (20/3/2018) 397,644
EUR 3,240,000 Credit Default Swaps (JP Morgan Chase Bank
(Depository Cle) (Fund receives Fixed 5.000%
and provides default protection on Jaguar Land
Rover Plc 8.125% 5/15/2018) (20/3/2018) 265,280
EUR 3,250,000 Credit Default Swaps (JP Morgan Chase Bank
(Depository Cle) (Fund receives Fixed 5.000%
and provides default protection on Portugal
Telecom International Finance BV 4.375%
24/3/2017) (20/12/2017) 330,211
EUR 2,220,000 Credit Default Swaps (JP Morgan Chase Bank
(Depository Cle)) (Fund receives default
protection on British Airways Plc 8.750%
23/8/2016 and pays Fixed 5.000%) (20/12/2018) (117,643)
EUR 1,680,001 Credit Default Swaps (JP Morgan Chase Bank
(Depository Cle)) (Fund receives Fixed
1.000% and provides default protection on
ThyssenKrupp AG 4.375% 18/3/2015) (20/9/2018) 78,465
USD 20,750,000 Credit Default Swaps (JP Morgan Securities Inc)
(Fund receives default protection on Portugal
Obrigacoes do Tesouro OT 5.450% 23/9/2013
and pays Fixed 1.000%) (20/6/2015) (1,035,886)
EUR 3,440,000 Credit Default Swaps (JP Morgan) (Fund receives
default protection on Banco Espirito Santo SA
0.454% 19/1/2015 and pays Fixed 5.000%)
(20/6/2018) (217,292)
EUR 3,790,000 Credit Default Swaps (JP Morgan) (Fund receives
default protection on Credit Agricole SA 5.065%
8/10/2022 and pays Fixed 3.000%) (20/6/2018) (200,256)
USD 11,100,000 Credit Default Swaps (JP Morgan) (Fund receives
default protection on France Government Bond
OAT 4.250% 25/4/2019 and pays Fixed 0.250%)
(20/6/2018) (60,177)
USD 6,570,000 Credit Default Swaps (JP Morgan) (Fund receives
default protection on Ireland Government Bond
4.500% 18/4/2020 and pays Fixed 1.000%)
(20/3/2018) (153,046)
EUR 2,785,000 Credit Default Swaps (JP Morgan) (Fund receives
default protection on Marks & Spencer Plc
5.625% 24/3/2014 and pays Fixed 1.000%)
(20/12/2017) (146,718)
USD 4,100,000 Credit Default Swaps (JP Morgan) (Fund receives
default protection on Portugal Obrigacoes do
Tesouro OT 5.450% 23/9/2013 and pays Fixed
1.000%) (20/12/2017) (475,214)
USD 4,050,000 Credit Default Swaps (JP Morgan) (Fund receives
default protection on Portugal Obrigacoes do
Tesouro OT 5.450% 23/9/2013 and pays Fixed
1.000%) (20/6/2015) (40,102)
EUR 3,790,000 Credit Default Swaps (JP Morgan) (Fund receives
default protection on Societe Generale SA
2.375% 28/2/2018 and pays Fixed 3.000%)
(20/6/2018) (209,455)
EUR 3,175,000 Credit Default Swaps (JP Morgan) (Fund receives
default protection on Unitymedia KabelBW
GmbH 9.625% 1/12/2019 and pays Fixed
5.000%) (20/12/2016) (538,968)
USD 6,770,000 Credit Default Swaps (JP Morgan) (Fund receives
Fixed 0.250% and provides default protection
on France Government Bond OAT 4.250%
25/4/2019) (20/6/2023) 100,921
EUR 8,350,000 Credit Default Swaps (JP Morgan) (Fund receives
Fixed 1.000% and provides default protection
on Allianz Finance II BV 4.000% 23/11/2016)
(20/6/2018) 236,037
EUR 40,733,333 Credit Default Swaps (JP Morgan) (Fund receives
Fixed 1.000% and provides default protection
on iTraxx Europe Series 20 Version 1) (20/12/2018) 406,867
EUR 8,350,000 Credit Default Swaps (JP Morgan) (Fund receives
Fixed 1.000% and provides default protection
on Muenchener Rueckversicherungs AG 7.625%
21/6/2028) (20/6/2018) 158,864
EUR 3,140,000 Credit Default Swaps (JP Morgan) (Fund receives
Fixed 1.000% and provides default protection
on St-Gobain Nederland BV 5.000% 25/4/2014)
(20/6/2018) 77,262
EUR 2,000,000 Credit Default Swaps (JP Morgan) (Fund receives
Fixed 3.000% and provides default protection
on Banca Monte dei Paschi di Sien FRN
30/6/2015) (20/9/2016) 7,376
EUR 3,175,000 Credit Default Swaps (JP Morgan) (Fund receives
Fixed 5.000% and provides default protection
on Kabel BW Musketeer GmbH 9.500%
15/3/2021) (20/12/2016) 844,995
EUR 3,400,000 Credit Default Swaps (JP Morgan) (Fund receives
Fixed 5.000% and provides default protection
on Portugal Telecom International Finance BV
4.375% 24/3/2017) (20/12/2017) 583,451
EUR 900,000 Credit Default Swaps (Morgan Stanley) (Fund
receives default protection on Dixons Retail
Plc 8.750% 3/8/2015 and pays Fixed 5.000%)
(20/12/2016) (246,149)
EUR 3,175,000 Credit Default Swaps (Morgan Stanley) (Fund
receives default protection on Kabel BW
Musketeer GmbH 9.500% 15/3/2021 and pays
Fixed 5.000%) (20/12/2016) (448,120)
EUR 3,175,000 Credit Default Swaps (Morgan Stanley) (Fund
receives Fixed 5.000% and provides default
protection on Unitymedia KabelBW GmbH
9.625% 1/12/2019) (20/12/2016) 352,436
EUR 1,500,000 Credit Default Swaps (UBS) (Fund receives Fixed
5.000% and provides default protection on
Scandinavian Airlines 9.650% 16/6/2014)
(20/9/2017) 378,642
EUR 7,369 Total Return Swap (Barclays Bank) (Fund receives
3 Month EURIBOR and pays Fonciere Des
Regions) (14/11/2014) 9,771
EUR 3,584 Total Return Swap (Barclays Bank) (Fund receives
3 Month EURIBOR and pays Fonciere Des
Regions) (13/11/2014) 3,242
EUR 515 Total Return Swap (Barclays Bank) (Fund receives
3 Month EURIBOR and pays Fonciere Des
Regions) (15/11/2014) 805
EUR 94,873 Total Return Swap (BNP Paribas) (Fund receives
3 Month EURIBOR and pays TUI AG) (22/11/2014) (25,616)
BlackRock European Credit Strategies Fund continued

Nominal Value Description
Unrealisedappreciation/
(depreciation)EUR
NominalValue Description
Unrealisedappreciation/
(depreciation)EUR
90 BlackRock Strategic Funds (BSF)
Swaps as at 30 November 2013
EUR 35,113 Total Return Swap (BNP Paribas) (Fund receives
3 Month EURIBOR and pays TUI AG) (25/11/2014) (6,946)
GBP 323,913 Total Return Swap (BNP Paribas) (Fund receives
3 Month LIBOR and pays Balfour Beatty Plc)
(14/11/2014) (233)
GBP 406,105 Total Return Swap (BNP Paribas) (Fund receives
3 Month LIBOR and pays Balfour Beatty Plc)
(13/11/2014) (18,746)
GBP 128,207 Total Return Swap (BNP Paribas) (Fund receives
3 Month LIBOR and pays Balfour Beatty Plc)
(17/11/2014) (3,066)
EUR 371,979 Total Return Swap (Citibank) (Fund receives
3 Month EURIBOR and pays Indra Sistemas SA)
(9/10/2014) (119,740)
EUR 325,394 Total Return Swap (Citibank) (Fund receives
3 Month EURIBOR and pays Repsol SA)
(12/11/2014) (346,545)
GBP 1,815,656 Total Return Swap (Credit Suisse) (Fund receives
1 Month LIBOR and pays Enterprise Inns Plc)
(5/9/2014) 56,682
GBP 2,150,000 Total Return Swap (Credit Suisse) (Fund receives
1 Month LIBOR and pays Equiniti Newco 2 plc
7.125% 15/12/2018) (30/9/2014) (48,889)
EUR 2,500,000 Total Return Swap (Credit Suisse) (Fund receives
1 Month LIBOR and pays Generali Finance BV
3.875% 6/5/2015) (28/2/2014) (101,546)
EUR 6,520,000 Total Return Swap (Credit Suisse) (Fund receives
1 Month LIBOR and pays Italy Buoni Poliennali
Del Tesoro 3.750% 1/8/2021) (29/8/2014) (210,034)
EUR 10,680,000 Total Return Swap (Credit Suisse) (Fund receives
1 Month LIBOR and pays Italy Buoni Poliennali
Del Tesoro 3.750% 1/8/2021) (29/8/2014) (341,455)
EUR 4,100,000 Total Return Swap (Credit Suisse) (Fund receives
1 Month LIBOR and pays Italy Buoni Poliennali
Del Tesoro 4.500% 1/5/2023) (29/8/2014) (126,170)
EUR 700,000 Total Return Swap (Credit Suisse) (Fund receives
1 Month LIBOR and pays Manutencoop Facility
8.500% 1/8/2020) (30/9/2014) (56,501)
EUR 700,000 Total Return Swap (Credit Suisse) (Fund receives
1 Month LIBOR and pays Manutencoop Facility
8.500% 1/8/2020) (30/9/2014) (56,501)
EUR 700,000 Total Return Swap (Credit Suisse) (Fund receives
1 Month LIBOR and pays Manutencoop Facility
8.500% 1/8/2020) (30/10/2014) (53,001)
EUR 1,400,000 Total Return Swap (Credit Suisse) (Fund receives
1 Month LIBOR and pays Manutencoop Facility
8.500% 1/8/2020) (30/10/2014) (99,002)
EUR 2,500,000 Total Return Swap (Credit Suisse) (Fund receives
1 Month LIBOR and pays Ono Finance II Plc
11.125% 15/7/2019) (30/9/2014) (45,486)
EUR 3,510,000 Total Return Swap (Credit Suisse) (Fund receives
1 Month LIBOR and pays Peugeot SA 7.375%
6/3/2018) (30/5/2014) (404,701)
EUR 3,510,000 Total Return Swap (Credit Suisse) (Fund receives
1 Month LIBOR and pays Peugeot SA 7.375%
6/3/2018) (30/5/2014) (404,701)
EUR 6,950,000 Total Return Swap (Credit Suisse) (Fund receives
1 Month LIBOR and pays Portugal Obrigacoes
do Tesouro OT 4.350% 16/10/2017) (30/4/2014) 142,497
GBP 1,100,000 Total Return Swap (Credit Suisse) (Fund receives
1 Month LIBOR and pays Priory Group No 3 Plc
8.875% 15/2/2019) (31/10/2014) (7,374)
GBP 2,454,900 Total Return Swap (Credit Suisse) (Fund receives
1 Month LIBOR and pays Punch Taverns
Finance Plc 6.820% 15/7/2020) (26/9/2014) (112,280)
GBP 5,071,500 Total Return Swap (Credit Suisse) (Fund receives
1 Month LIBOR and pays Punch Taverns
Finance Plc 6.820% 15/7/2020) (26/9/2014) (222,214)
GBP 2,410,800 Total Return Swap (Credit Suisse) (Fund receives
1 Month LIBOR and pays Punch Taverns
Finance Plc 6.820% 15/7/2020) (26/9/2014) (103,027)
EUR 1,700,000 Total Return Swap (Credit Suisse) (Fund receives
1 Month LIBOR and pays Societe Generale SA
4.000% 20/4/2016) (28/9/2014) (166,381)
EUR 10,440,000 Total Return Swap (Credit Suisse) (Fund receives
1 Month LIBOR and pays Spain Government
Bond 3.750% 31/10/2018) (29/8/2014) (306,716)
EUR 37,020,000 Total Return Swap (Credit Suisse) (Fund receives
1 Month LIBOR and pays Spain Government
Bond 4.100% 30/7/2018) (31/10/2014) 113,447
EUR 4,770,000 Total Return Swap (Credit Suisse) (Fund receives
1 Month LIBOR and pays Spain Government
Bond 4.100% 30/7/2018) (29/8/2014) (201,940)
EUR 6,720,000 Total Return Swap (Credit Suisse) (Fund receives
1 Month LIBOR and pays Spain Government
Bond 4.100% 30/7/2018) (30/4/2014) (272,537)
EUR 2,610,000 Total Return Swap (Credit Suisse) (Fund receives
1 Month LIBOR and pays Spain Government
Bond 4.500% 31/1/2018) (28/2/2014) (186,370)
EUR 6,800,000 Total Return Swap (Credit Suisse) (Fund receives
1 Month LIBOR and pays Spain Government
Bond 5.500% 30/4/2021) (28/2/2014) (490,368)
EUR 615,000 Total Return Swap (Credit Suisse) (Fund receives
1 Month LIBOR and pays Spain Government
Bond 5.500% 30/7/2017) (28/2/2014) (6,549)
EUR 250,000 Total Return Swap (Credit Suisse) (Fund receives
1 Month LIBOR and pays Spain Government
Bond 5.850% 31/1/2022) (30/6/2014) (16,943)
EUR 6,390,000 Total Return Swap (Credit Suisse) (Fund receives
1 Month LIBOR and pays Spain Government
Bond 5.900% 30/7/2026) (30/4/2014) (528,829)
EUR 1,500,000 Total Return Swap (Credit Suisse) (Fund receives
1 Month LIBOR and pays Telecom Italia SpA
7.750% 20/3/2073) (29/8/2014) (58,311)
EUR 2,900,000 Total Return Swap (Credit Suisse) (Fund receives
1 Month LIBOR and pays Telecom Italia SpA
7.750% 20/3/2073) (29/8/2014) (86,675)
EUR 14,037 Total Return Swap (Deutsche Bank) (Fund receives
3 Month EURIBOR and pays Indra Sistemas SA)
(22/10/2014) 12,566
EUR 7,902,047 Total Return Swap (JP Morgan) (Fund receives
3 Month EURIBOR and pays Telecom Italia SpA)
(8/11/2014) (300,278)
EUR 10,660,000 Total Return Swap (JP Morgan) (Fund receives
Fixed 0.050% and pays Italy Buoni Poliennali
Del Tesoro 3.750% 1/3/2021) (13/10/2014) (465,673)
EUR 23,020,000 Total Return Swap (JP Morgan) (Fund receives
Fixed 0.070% and pays France Government
Bond OAT 4.000% 25/4/2018) (23/6/2014) 21,152
EUR 4,930,000 Total Return Swap (JP Morgan) (Fund receives
Fixed 0.080% and pays Italy Buoni Poliennali
Del Tesoro 3.750% 1/3/2021) (2/10/2014) (180,730)
EUR 2,300,000 Total Return Swap (JP Morgan) (Fund receives
Fixed 0.100% and pays France Government
Bond OAT 4.000% 25/4/2018) (23/6/2014) 2,113
EUR 1,490,000 Total Return Swap (JP Morgan) (Fund receives
Fixed 0.100% and pays Wind Acquisition
Holdings Finance SA 12.250% 15/7/2017)
(15/10/2014) (88,278)
BlackRock European Credit Strategies Fund continued

Nominal Value Description
Unrealisedappreciation/
(depreciation)EUR
NominalValue Description
Unrealisedappreciation/
(depreciation)EUR
Note: The total market value of EUR 24,785 is included in the Statement of Net Assets (see Note 2(d)).
Unaudited Interim Report and Accounts 91
The notes on pages 150 to 158 form an integral part of these financial statements.
Swaps as at 30 November 2013
EUR 750,000 Total Return Swap (JP Morgan) (Fund receives
Fixed 0.100% and pays Wind Acquisition
Holdings Finance SA 12.250% 15/7/2017)
(15/10/2014) (44,435)
EUR 2,460,000 Total Return Swap (JP Morgan) (Fund receives
Fixed 0.150% and pays Italy Buoni Poliennali
Del Tesoro 3.750% 1/8/2021) (27/6/2014) (7,925)
EUR 4,740,000 Total Return Swap (JP Morgan) (Fund receives
Fixed 0.150% and pays Spain Government Bond
4.100% 30/7/2018) (1/10/2014) (191,366)
EUR 2,450,000 Total Return Swap (JP Morgan) (Fund receives
Fixed 0.150% and pays Spain Government Bond
4.100% 30/7/2018) (8/10/2014) (96,496)
EUR 7,700,000 Total Return Swap (JP Morgan) (Fund receives
Fixed 0.180% and pays Italy Buoni Poliennali
Del Tesoro 4.500% 3/1/2026) (6/3/2014) (294,507)
EUR 4,640,000 Total Return Swap (JP Morgan) (Fund receives
Fixed 0.200% and pays Ireland Government
Bond 5.500% 18/10/2017) (17/9/2014) 73,794
EUR 1,050,000 Total Return Swap (JP Morgan) (Fund receives
Fixed 0.200% and pays Spain Government
Bond 4.300% 31/10/2019) (24/3/2014) (59,749)
EUR 2,490,000 Total Return Swap (JP Morgan) (Fund receives
Fixed 0.250% and pays Italy Buoni Poliennali
Del Tesoro 3.750% 1/8/2021) (28/6/2014) (18,968)
EUR 4,850,000 Total Return Swap (JP Morgan) (Fund receives
Fixed 0.350% and pays Portugal Obrigacoes do
Tesouro OT 4.750% 14/6/2019) (2/10/2014) (339,947)
EUR 1,045,000 Total Return Swap (JP Morgan) (Fund receives
Fixed 0.400% and pays Portugal Obrigacoes do
Tesouro OT 4.750% 14/6/2019) (3/11/2014) (55,133)
EUR 3,195,000 Total Return Swap (JP Morgan) (Fund receives
Fixed 0.500% and pays Italy Buoni Poliennali
Del Tesoro 3.750% 1/8/2021) (21/3/2014) (142,982)
EUR 2,300,000 Total Return Swap (JP Morgan) (Fund receives
Fixed 0.500% and pays Telecom Italia SpA
7.750% 20/3/2073) (15/10/2014) (89,844)
EUR 2,200,000 Total Return Swap (JP Morgan) (Fund receives
Fixed 0.500% and pays Telecom Italia SpA
7.750% 20/3/2073) (18/10/2014) (57,970)
(EUR underlying exposure – EUR 1,805,864,594) (21,815,786)
BlackRock European Credit Strategies Fund continued

Transferable Securities and Money Market Instruments Admitted to an Official Stock Exchange Listing or Dealt in on Another Regulated Market
Transferable Securities and Money Market Instruments Admitted to an Official Stock Exchange Listing or Dealt in on Another Regulated Market
Holding Description Market Value
(EUR) % Holding Description Market Value
(EUR) %
1 This fund is managed by BlackRock.
92 BlackRock Strategic Funds (BSF)
BlackRock European Diversified Equity Absolute Return Fund
BONDS
Australia EUR 3,200,000 National Australia Bank Ltd FRN
7/4/2014 3,206,208 2.06
3,206,208 2.06
Finland EUR 2,500,000 Pohjola Bank Plc FRN 9/8/2014 2,499,738 1.61
2,499,738 1.61
France EUR 1,000,000 BNP Paribas SA FRN 20/12/2013 1,000,150 0.64
EUR 10,000,000 BNP Paribas SA 0.00% 3/2/2014
(Zero Coupon) 9,996,640 6.42
EUR 2,500,000 HSBC France SA FRN 6/12/2013 2,500,025 1.61
13,496,815 8.67
Germany EUR 4,000,000 Deutsche Bank AG FRN 17/1/2014 4,001,600 2.57
EUR 1,000,000 NRW Bank FRN 17/2/2014 999,790 0.64
5,001,390 3.21
Netherlands EUR 3,700,000 Bank Nederlandse Gemeenten FRN
23/5/2014 3,702,534 2.38
EUR 8,000,000 Cooperatieve Centrale Raiffeisen-
Boerenleenbank BA FRN
13/3/2014 8,001,280 5.14
EUR 5,000,000 Cooperatieve Centrale Raiffeisen-
Boerenleenbank BA FRN
14/11/2014 5,000,150 3.21
EUR 5,000,000 Dutch Treasury Certificate 0.00%
31/1/2014 (Zero Coupon) 4,999,820 3.21
21,703,784 13.94
Sweden EUR 700,000 Nordea Bank AB 1.177% 10/1/2014 700,774 0.45
700,774 0.45
United Kingdom EUR 5,000,000 Bank of Tokyo Mitsubishi 0.00%
13/12/2013 (Zero Coupon) 4,999,805 3.21
EUR 2,500,000 Barclays Bank Plc FRN 17/1/2014 2,504,912 1.61
EUR 2,000,000 HSBC Bank Plc FRN 14/3/2014 2,003,480 1.28
EUR 6,600,000 Mizuho Bank Ltd 0.165% 7/2/2014 6,597,743 4.24
16,105,940 10.34
Total Bonds 62,714,649 40.28
COMMERCIAL PAPER
France EUR 3,700,000 Antalis SA 0% 27/12/2013 3,699,417 2.38
EUR 6,000,000 BPCE SA 0% 3/2/2014 5,997,564 3.85
EUR 7,000,000 LMA SA 0% 12/12/2013 6,999,767 4.49
16,696,748 10.72
Germany EUR 4,000,000 BMW Malta Finance Ltd 0%
23/1/2014 3,999,160 2.57
EUR 10,000,000 FMS Wertmanagement 0 %
8/1/2014 10,000,000 6.42
EUR 4,000,000 Metlife Short Term Funding LLC
0% 7/2/2014 3,998,468 2.57
EUR 4,000,000 Sumitomo Mitsui Banking Corp
0% 6/2/2014 3,998,678 2.57
21,996,306 14.13
Luxembourg EUR 2,000,000 Barclays Bank Plc 0% 6/1/2014 1,999,671 1.28
EUR 4,000,000 Cancara Asset Securitisation Ltd
0% 16/12/2013 3,999,822 2.57
USD 1,500,000 Mont Blanc Capital Corp 0%
14/2/2014 1,499,367 0.96
EUR 4,000,000 Mont Blanc Capital Corp 0%
13/12/2013 3,999,798 2.57
EUR 5,000,000 Scaldis Capital 0% 27/12/2013 4,999,526 3.21
EUR 3,000,000 Sheffield Receivables Corp 0%
10/2/2014 2,998,861 1.93
EUR 5,000,000 Svenska Handelsbanken AB 0%
22/5/2014 4,994,720 3.21
24,491,765 15.73
Total Commercial Paper 63,184,819 40.58
Total Transferable Securities and Money
Market Instruments Admitted to an
Official Stock Exchange Listing or
Dealt in on Another Regulated Market 125,899,468 80.86
Funds
Ireland 10,813,861 Institutional Cash Series Plc -
Institutional Euro Assets
Liquidity Fund 1 10,813,861 6.95
10,813,861 6.95
Total Funds 10,813,861 6.95
Securities portfolio at market value 136,713,329 87.81
Other Net Assets 18,984,727 12.19
Total Net Assets (EUR) 155,698,056 100.00
Portfolio of Investments as at 30 November 2013
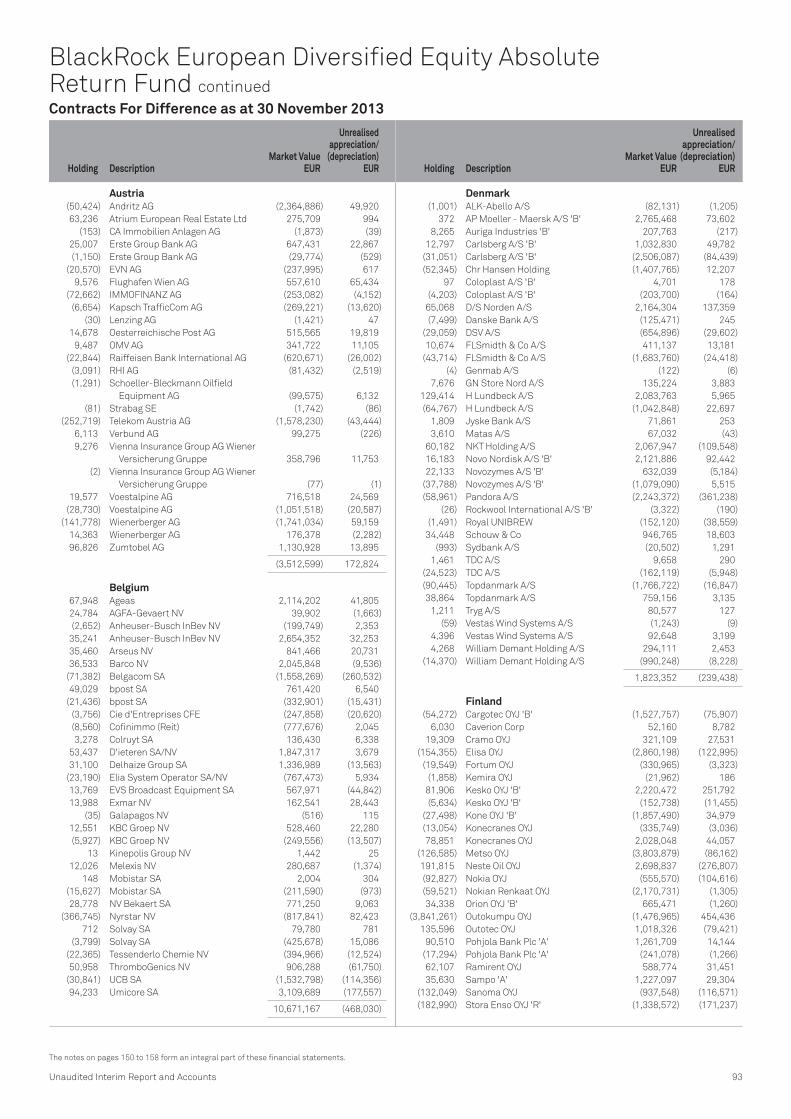
Holding DescriptionMarket Value
EUR
Unrealisedappreciation/
(depreciation) EUR Holding Description
Market ValueEUR
Unrealisedappreciation/
(depreciation) EUR
Unaudited Interim Report and Accounts 93
The notes on pages 150 to 158 form an integral part of these financial statements.
BlackRock European Diversified Equity Absolute Return Fund continued
Contracts For Difference as at 30 November 2013
Austria (50,424) Andritz AG (2,364,886) 49,920
63,236 Atrium European Real Estate Ltd 275,709 994
(153) CA Immobilien Anlagen AG (1,873) (39)
25,007 Erste Group Bank AG 647,431 22,867
(1,150) Erste Group Bank AG (29,774) (529)
(20,570) EVN AG (237,995) 617
9,576 Flughafen Wien AG 557,610 65,434
(72,662) IMMOFINANZ AG (253,082) (4,152)
(6,654) Kapsch TrafficCom AG (269,221) (13,620)
(30) Lenzing AG (1,421) 47
14,678 Oesterreichische Post AG 515,565 19,819
9,487 OMV AG 341,722 11,105
(22,844) Raiffeisen Bank International AG (620,671) (26,002)
(3,091) RHI AG (81,432) (2,519)
(1,291) Schoeller-Bleckmann Oilfield
Equipment AG (99,575) 6,132
(81) Strabag SE (1,742) (86)
(252,719) Telekom Austria AG (1,578,230) (43,444)
6,113 Verbund AG 99,275 (226)
9,276 Vienna Insurance Group AG Wiener
Versicherung Gruppe 358,796 11,753
(2) Vienna Insurance Group AG Wiener
Versicherung Gruppe (77) (1)
19,577 Voestalpine AG 716,518 24,569
(28,730) Voestalpine AG (1,051,518) (20,587)
(141,778) Wienerberger AG (1,741,034) 59,159
14,363 Wienerberger AG 176,378 (2,282)
96,826 Zumtobel AG 1,130,928 13,895
(3,512,599) 172,824
Belgium 67,948 Ageas 2,114,202 41,805
24,784 AGFA-Gevaert NV 39,902 (1,663)
(2,652) Anheuser-Busch InBev NV (199,749) 2,353
35,241 Anheuser-Busch InBev NV 2,654,352 32,253
35,460 Arseus NV 841,466 20,731
36,533 Barco NV 2,045,848 (9,536)
(71,382) Belgacom SA (1,558,269) (260,532)
49,029 bpost SA 761,420 6,540
(21,436) bpost SA (332,901) (15,431)
(3,756) Cie d'Entreprises CFE (247,858) (20,620)
(8,560) Cofinimmo (Reit) (777,676) 2,045
3,278 Colruyt SA 136,430 6,338
53,437 D'ieteren SA/NV 1,847,317 3,679
31,100 Delhaize Group SA 1,336,989 (13,563)
(23,190) Elia System Operator SA/NV (767,473) 5,934
13,769 EVS Broadcast Equipment SA 567,971 (44,842)
13,988 Exmar NV 162,541 28,443
(35) Galapagos NV (516) 115
12,551 KBC Groep NV 528,460 22,280
(5,927) KBC Groep NV (249,556) (13,507)
13 Kinepolis Group NV 1,442 25
12,026 Melexis NV 280,687 (1,374)
148 Mobistar SA 2,004 304
(15,627) Mobistar SA (211,590) (973)
28,778 NV Bekaert SA 771,250 9,063
(366,745) Nyrstar NV (817,841) 82,423
712 Solvay SA 79,780 781
(3,799) Solvay SA (425,678) 15,086
(22,365) Tessenderlo Chemie NV (394,966) (12,524)
50,958 ThromboGenics NV 906,288 (61,750)
(30,841) UCB SA (1,532,798) (114,356)
94,233 Umicore SA 3,109,689 (177,557)
10,671,167 (468,030)
Denmark (1,001) ALK-Abello A/S (82,131) (1,205)
372 AP Moeller - Maersk A/S 'B' 2,765,468 73,602
8,265 Auriga Industries 'B' 207,763 (217)
12,797 Carlsberg A/S 'B' 1,032,830 49,782
(31,051) Carlsberg A/S 'B' (2,506,087) (84,439)
(52,345) Chr Hansen Holding (1,407,765) 12,207
97 Coloplast A/S 'B' 4,701 178
(4,203) Coloplast A/S 'B' (203,700) (164)
65,068 D/S Norden A/S 2,164,304 137,359
(7,499) Danske Bank A/S (125,471) 245
(29,059) DSV A/S (654,896) (29,602)
10,674 FLSmidth & Co A/S 411,137 13,181
(43,714) FLSmidth & Co A/S (1,683,760) (24,418)
(4) Genmab A/S (122) (6)
7,676 GN Store Nord A/S 135,224 3,883
129,414 H Lundbeck A/S 2,083,763 5,965
(64,767) H Lundbeck A/S (1,042,848) 22,697
1,809 Jyske Bank A/S 71,861 253
3,610 Matas A/S 67,032 (43)
60,182 NKT Holding A/S 2,067,947 (109,548)
16,183 Novo Nordisk A/S 'B' 2,121,886 92,442
22,133 Novozymes A/S 'B' 632,039 (5,184)
(37,788) Novozymes A/S 'B' (1,079,090) 5,515
(58,961) Pandora A/S (2,243,372) (361,238)
(26) Rockwool International A/S 'B' (3,322) (190)
(1,491) Royal UNIBREW (152,120) (38,559)
34,448 Schouw & Co 946,765 18,603
(993) Sydbank A/S (20,502) 1,291
1,461 TDC A/S 9,658 290
(24,523) TDC A/S (162,119) (5,948)
(90,445) Topdanmark A/S (1,766,722) (16,847)
38,864 Topdanmark A/S 759,156 3,135
1,211 Tryg A/S 80,577 127
(59) Vestas Wind Systems A/S (1,243) (9)
4,396 Vestas Wind Systems A/S 92,648 3,199
4,268 William Demant Holding A/S 294,111 2,453
(14,370) William Demant Holding A/S (990,248) (8,228)
1,823,352 (239,438)
Finland (54,272) Cargotec OYJ 'B' (1,527,757) (75,907)
6,030 Caverion Corp 52,160 8,782
19,309 Cramo OYJ 321,109 27,531
(154,355) Elisa OYJ (2,860,198) (122,995)
(19,549) Fortum OYJ (330,965) (3,323)
(1,858) Kemira OYJ (21,962) 186
81,906 Kesko OYJ 'B' 2,220,472 251,792
(5,634) Kesko OYJ 'B' (152,738) (11,455)
(27,498) Kone OYJ 'B' (1,857,490) 34,979
(13,054) Konecranes OYJ (335,749) (3,036)
78,851 Konecranes OYJ 2,028,048 44,057
(126,585) Metso OYJ (3,803,879) (86,162)
191,815 Neste Oil OYJ 2,698,837 (276,807)
(92,827) Nokia OYJ (555,570) (104,616)
(59,521) Nokian Renkaat OYJ (2,170,731) (1,305)
34,338 Orion OYJ 'B' 665,471 (1,260)
(3,841,261) Outokumpu OYJ (1,476,965) 454,436
135,596 Outotec OYJ 1,018,326 (79,421)
90,510 Pohjola Bank Plc 'A' 1,261,709 14,144
(17,294) Pohjola Bank Plc 'A' (241,078) (1,266)
62,107 Ramirent OYJ 588,774 31,451
35,630 Sampo 'A' 1,227,097 29,304
(132,049) Sanoma OYJ (937,548) (116,571)
(182,990) Stora Enso OYJ 'R' (1,338,572) (171,237)
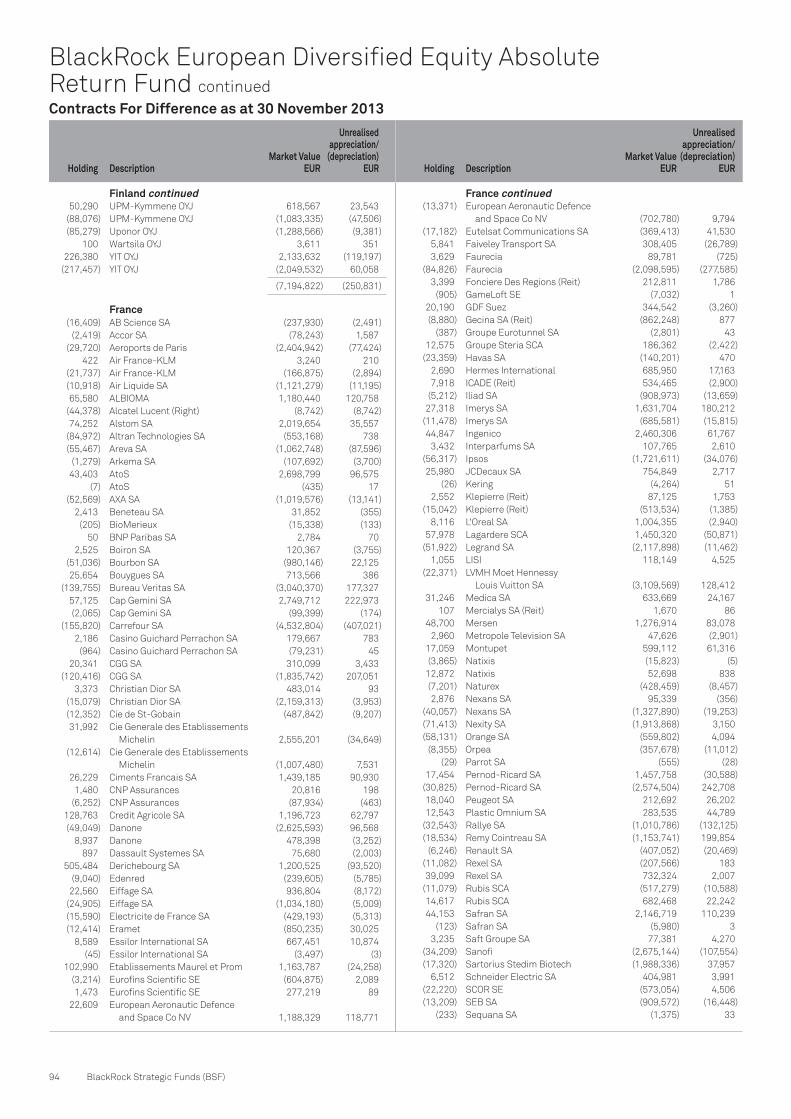
Holding DescriptionMarket Value
EUR
Unrealisedappreciation/
(depreciation) EUR Holding Description
Market ValueEUR
Unrealisedappreciation/
(depreciation) EUR
94 BlackRock Strategic Funds (BSF)
BlackRock European Diversified Equity Absolute Return Fund continued
Contracts For Difference as at 30 November 2013
50,290 UPM-Kymmene OYJ 618,567 23,543
(88,076) UPM-Kymmene OYJ (1,083,335) (47,506)
(85,279) Uponor OYJ (1,288,566) (9,381)
100 Wartsila OYJ 3,611 351
226,380 YIT OYJ 2,133,632 (119,197)
(217,457) YIT OYJ (2,049,532) 60,058
(7,194,822) (250,831)
France (16,409) AB Science SA (237,930) (2,491)
(2,419) Accor SA (78,243) 1,587
(29,720) Aeroports de Paris (2,404,942) (77,424)
422 Air France-KLM 3,240 210
(21,737) Air France-KLM (166,875) (2,894)
(10,918) Air Liquide SA (1,121,279) (11,195)
65,580 ALBIOMA 1,180,440 120,758
(44,378) Alcatel Lucent (Right) (8,742) (8,742)
74,252 Alstom SA 2,019,654 35,557
(84,972) Altran Technologies SA (553,168) 738
(55,467) Areva SA (1,062,748) (87,596)
(1,279) Arkema SA (107,692) (3,700)
43,403 AtoS 2,698,799 96,575
(7) AtoS (435) 17
(52,569) AXA SA (1,019,576) (13,141)
2,413 Beneteau SA 31,852 (355)
(205) BioMerieux (15,338) (133)
50 BNP Paribas SA 2,784 70
2,525 Boiron SA 120,367 (3,755)
(51,036) Bourbon SA (980,146) 22,125
25,654 Bouygues SA 713,566 386
(139,755) Bureau Veritas SA (3,040,370) 177,327
57,125 Cap Gemini SA 2,749,712 222,973
(2,065) Cap Gemini SA (99,399) (174)
(155,820) Carrefour SA (4,532,804) (407,021)
2,186 Casino Guichard Perrachon SA 179,667 783
(964) Casino Guichard Perrachon SA (79,231) 45
20,341 CGG SA 310,099 3,433
(120,416) CGG SA (1,835,742) 207,051
3,373 Christian Dior SA 483,014 93
(15,079) Christian Dior SA (2,159,313) (3,953)
(12,352) Cie de St-Gobain (487,842) (9,207)
31,992 Cie Generale des Etablissements
Michelin 2,555,201 (34,649)
(12,614) Cie Generale des Etablissements
Michelin (1,007,480) 7,531
26,229 Ciments Francais SA 1,439,185 90,930
1,480 CNP Assurances 20,816 198
(6,252) CNP Assurances (87,934) (463)
128,763 Credit Agricole SA 1,196,723 62,797
(49,049) Danone (2,625,593) 96,568
8,937 Danone 478,398 (3,252)
897 Dassault Systemes SA 75,680 (2,003)
505,484 Derichebourg SA 1,200,525 (93,520)
(9,040) Edenred (239,605) (5,785)
22,560 Eiffage SA 936,804 (8,172)
(24,905) Eiffage SA (1,034,180) (5,009)
(15,590) Electricite de France SA (429,193) (5,313)
(12,414) Eramet (850,235) 30,025
8,589 Essilor International SA 667,451 10,874
(45) Essilor International SA (3,497) (3)
102,990 Etablissements Maurel et Prom 1,163,787 (24,258)
(3,214) Eurofins Scientific SE (604,875) 2,089
1,473 Eurofins Scientific SE 277,219 89
22,609 European Aeronautic Defence
and Space Co NV 1,188,329 118,771
(13,371) European Aeronautic Defence
and Space Co NV (702,780) 9,794
(17,182) Eutelsat Communications SA (369,413) 41,530
5,841 Faiveley Transport SA 308,405 (26,789)
3,629 Faurecia 89,781 (725)
(84,826) Faurecia (2,098,595) (277,585)
3,399 Fonciere Des Regions (Reit) 212,811 1,786
(905) GameLoft SE (7,032) 1
20,190 GDF Suez 344,542 (3,260)
(8,880) Gecina SA (Reit) (862,248) 877
(387) Groupe Eurotunnel SA (2,801) 43
12,575 Groupe Steria SCA 186,362 (2,422)
(23,359) Havas SA (140,201) 470
2,690 Hermes International 685,950 17,163
7,918 ICADE (Reit) 534,465 (2,900)
(5,212) Iliad SA (908,973) (13,659)
27,318 Imerys SA 1,631,704 180,212
(11,478) Imerys SA (685,581) (15,815)
44,847 Ingenico 2,460,306 61,767
3,432 Interparfums SA 107,765 2,610
(56,317) Ipsos (1,721,611) (34,076)
25,980 JCDecaux SA 754,849 2,717
(26) Kering (4,264) 51
2,552 Klepierre (Reit) 87,125 1,753
(15,042) Klepierre (Reit) (513,534) (1,385)
8,116 L'Oreal SA 1,004,355 (2,940)
57,978 Lagardere SCA 1,450,320 (50,871)
(51,922) Legrand SA (2,117,898) (11,462)
1,055 LISI 118,149 4,525
(22,371) LVMH Moet Hennessy
Louis Vuitton SA (3,109,569) 128,412
31,246 Medica SA 633,669 24,167
107 Mercialys SA (Reit) 1,670 86
48,700 Mersen 1,276,914 83,078
2,960 Metropole Television SA 47,626 (2,901)
17,059 Montupet 599,112 61,316
(3,865) Natixis (15,823) (5)
12,872 Natixis 52,698 838
(7,201) Naturex (428,459) (8,457)
2,876 Nexans SA 95,339 (356)
(40,057) Nexans SA (1,327,890) (19,253)
(71,413) Nexity SA (1,913,868) 3,150
(58,131) Orange SA (559,802) 4,094
(8,355) Orpea (357,678) (11,012)
(29) Parrot SA (555) (28)
17,454 Pernod-Ricard SA 1,457,758 (30,588)
(30,825) Pernod-Ricard SA (2,574,504) 242,708
18,040 Peugeot SA 212,692 26,202
12,543 Plastic Omnium SA 283,535 44,789
(32,543) Rallye SA (1,010,786) (132,125)
(18,534) Remy Cointreau SA (1,153,741) 199,854
(6,246) Renault SA (407,052) (20,469)
(11,082) Rexel SA (207,566) 183
39,099 Rexel SA 732,324 2,007
(11,079) Rubis SCA (517,279) (10,588)
14,617 Rubis SCA 682,468 22,242
44,153 Safran SA 2,146,719 110,239
(123) Safran SA (5,980) 3
3,235 Saft Groupe SA 77,381 4,270
(34,209) Sanofi (2,675,144) (107,554)
(17,320) Sartorius Stedim Biotech (1,988,336) 37,957
6,512 Schneider Electric SA 404,981 3,991
(22,220) SCOR SE (573,054) 4,506
(13,209) SEB SA (909,572) (16,448)
(233) Sequana SA (1,375) 33
France continued Finland continued

Holding DescriptionMarket Value
EUR
Unrealisedappreciation/
(depreciation) EUR Holding Description
Market ValueEUR
Unrealisedappreciation/
(depreciation) EUR
Unaudited Interim Report and Accounts 95
The notes on pages 150 to 158 form an integral part of these financial statements.
BlackRock European Diversified Equity Absolute Return Fund continued
Contracts For Difference as at 30 November 2013
(27,382) SES SA (594,189) (3,395)
17,721 Societe BIC SA 1,597,371 19,257
(2,176) Societe BIC SA (196,145) 5,026
(16,046) Societe Generale SA (683,399) (11,945)
60,709 Societe Television Francaise 1 830,196 425
(27,203) Sodexo (2,007,037) (57,172)
(204,183) STMicroelectronics NV (1,193,450) (13,313)
(20,390) Suez Environnement Co (258,749) (3,037)
207,631 Technicolor SA 780,693 (11,421)
32,653 Technip SA 2,405,220 (89,322)
20,238 Teleperformance 849,085 113,683
(23,433) Teleperformance (983,132) (50,140)
58,429 Thales SA 2,631,058 256,795
(15,980) Total SA (710,710) 4,019
(1,603) UBISOFT Entertainment (15,581) 382
(908) Unibail-Rodamco SE (Reit) (174,835) (627)
290 Unibail-Rodamco SE (Reit) 55,840 318
17,197 Valeo SA 1,344,118 232,177
(19,871) Valeo SA (1,553,117) (75,768)
29,520 Vallourec SA 1,236,445 11,204
(14,789) Vallourec SA (619,437) 34,661
(4,559) Valneva SE (18,783) 52
(66,523) Veolia Environnement SA (795,615) 51,707
51,188 Veolia Environnement SA 612,208 3,337
(8,352) Vicat (457,105) (140)
(14,932) Vilmorin & Cie SA (1,402,264) 2,841
(10,553) Vinci SA (501,373) (3,886)
54,737 Vinci SA 2,600,555 248,506
(1,312) Virbac SA (189,584) 7,282
26,208 Vivendi SA 490,876 11,275
(63,301) Vivendi SA (1,185,628) (106,502)
(14,478,752) 1,597,422
Germany 52,655 Aareal Bank AG 1,424,318 127,189
33,239 Adidas AG 2,980,541 115,828
400,528 ADVA Optical Networking SE 1,556,452 (72,852)
86,110 Aixtron SE 882,628 (79,121)
(24,167) Aixtron SE (247,712) 44,217
53,616 Aurubis AG 2,326,934 (206)
(14,552) Axel Springer AG (646,109) 330
13,053 BASF SE 1,027,271 41,174
342 Bayer AG 33,496 720
1,630 Bayerische Motoren Werke AG 138,322 57
(3,938) BayWa AG (149,959) (9,662)
257 Bechtle AG 12,264 (408)
36,567 Beiersdorf AG 2,728,264 83,420
(6,481) Bertrandt AG (652,313) (49,191)
(10,446) Bilfinger SE (878,926) (17,947)
67,227 Borussia Dortmund GmbH & Co KGaA 253,446 11,649
(3,978) Brenntag AG (520,123) (698)
(10,170) CANCOM SE (278,709) 11,017
(804) CANCOM SE (Right) (686) (686)
21,635 Cewe Stiftung & Co KGAA 872,972 31,273
(153,017) Commerzbank AG (1,684,717) (135,521)
14,924 Continental AG 2,287,103 299,800
28,992 CTS Eventim AG 1,104,595 117,266
(12,085) Daimler AG (737,789) (6,289)
14,976 Delticom AG 520,266 (58,872)
5,662 Deutsche Annington Immobilien SE 109,192 762
9,069 Deutsche Bank AG 323,401 15,225
(29,184) Deutsche Bank AG (1,040,701) (13,788)
(1,794) Deutsche Boerse (102,491) (4,037)
63 Deutsche Euroshop AG 2,066 59
(21,162) Deutsche Euroshop AG (694,114) (7,098)
(21,439) Deutsche Lufthansa AG (343,882) (14,799)
4,934 Deutsche Post AG 128,136 4,372
(89,081) Deutsche Post AG (2,313,434) (84,151)
19,034 Deutsche Telekom AG 222,222 1,886
(37,047) Deutsche Telekom AG (432,524) (2,419)
32,758 Deutsche Wohnen AG 487,111 43,041
320,814 Deutz AG 2,061,551 217,493
80,241 Dialog Semiconductor Plc 1,139,823 24,386
(198) DIC Asset AG (1,321) 45
(198) DIC Asset AG (Right) (46) 14
(27,830) DMG Mori Seiki AG (637,029) (13,241)
37,681 DMG Mori Seiki AG 862,518 100,171
5,083 Draegerwerk AG & Co KGaA (Pref) 461,435 16,667
(9,014) Draegerwerk AG & Co KGaA (Pref) (818,291) 53,751
(47,002) Drillisch AG (1,015,008) (17,156)
17,949 Duerr AG 1,144,608 153,074
(13,048) Duerr AG (832,071) 11,385
(131,324) E.ON SE (1,856,265) (65,658)
17,798 ElringKlinger AG 545,687 (2,250)
(41,984) ElringKlinger AG (1,287,229) 103,562
25,846 Evonik Industries AG 755,479 63,585
(341,850) Evotec AG (1,381,074) 33,253
(22,522) Fielmann AG (1,892,749) (78,137)
(69,956) Fraport AG Frankfurt Airport
Services Worldwide (3,790,916) (107,290)
68,611 Freenet AG 1,433,970 187,759
(5,258) Fresenius Medical Care AG & Co KGaA (268,526) 1,583
20,813 Fresenius Medical Care AG & Co KGaA 1,062,920 59,633
11,123 Fresenius SE & Co KGaA 1,161,241 60,646
(2,474) Fresenius SE & Co KGaA (258,286) (3,689)
(15,088) Fuchs Petrolub SE (Pref) (1,043,939) (86,562)
52,511 GAGFAH SA 559,767 49,468
(14,772) GEA Group AG (506,827) 1,128
8,239 Gerresheimer AG 410,385 14,811
2,876 Gerry Weber International AG 88,825 1,292
717 Gesco AG 50,190 (2,015)
(7,905) GFK SE (332,010) 7,093
53,873 Grammer AG 2,022,931 151,010
1,258 GSW Immobilien AG 38,262 (9,930)
1,321 Hamborner REIT AG (Reit) 9,724 173
(20,248) Hamburger Hafen und Logistik AG (373,981) (5,872)
18,163 Hannover Rueck SE 1,113,392 6,105
(3,505) HeidelbergCement AG (202,379) (2,443)
26,272 HeidelbergCement AG 1,516,945 24,417
155,748 Heidelberger Druckmaschinen AG 427,217 62,624
27,764 Henkel AG & Co KGaA (Pref) 2,322,459 179,582
(21,681) Hochtief AG (1,410,349) 31,453
(17,787) Hugo Boss AG (1,743,660) (33,889)
(1,497) Indus Holding AG (41,909) 150
(464,573) Infineon Technologies AG (3,475,006) (169,232)
2,376 Jenoptik AG 28,963 (1,169)
37,467 Jungheinrich AG (Pref) 1,713,928 139,127
129 K+S AG 2,681 200
644 KION Group AG 18,386 262
18,464 Kloeckner & Co SE 189,625 3,645
(3,901) Kontron AG (21,998) (956)
22,897 Krones AG 1,440,450 4,608
1,898 KUKA AG 65,623 308
(7,272) KWS Saat AG (1,817,636) 170,968
32,219 LANXESS AG 1,576,154 41,747
9,526 LEG Immobilien AG 401,854 1,966
(43,307) Leoni AG (2,379,720) (222,942)
(19,178) Linde AG (2,879,577) (74,502)
110,327 LPKF Laser & Electronics AG 2,045,463 529,892
(12,940) MAN SE (1,155,542) (14,655)
11,582 Merck KGaA 1,476,705 78,969
(8,821) Merck KGaA (1,124,677) (8,223)
Germany continued France continued

Holding DescriptionMarket Value
EUR
Unrealisedappreciation/
(depreciation) EUR Holding Description
Market ValueEUR
Unrealisedappreciation/
(depreciation) EUR
96 BlackRock Strategic Funds (BSF)
BlackRock European Diversified Equity Absolute Return Fund continued
Contracts For Difference as at 30 November 2013
(3,631) Metro AG (134,311) (8,688)
10,154 Morphosys AG 571,163 4,026
(19,672) Morphosys AG (1,106,550) 20,711
(7,763) MTU Aero Engines AG (537,044) 5,761
305 Muenchener Rueckversicherungs AG 49,151 2,216
(5,531) Muenchener Rueckversicherungs AG (891,321) (37,450)
(4) Nemetschek AG (200) 6
23,528 Nordex SE 250,809 2,092
(4,991) Pfeiffer Vacuum Technology AG (457,525) (5,304)
(21,242) PNE Wind AG (59,966) 3,664
(8,816) Porsche Automobil Holding SE (Pref) (660,759) (34,933)
87,115 ProSiebenSat.1 Media AG 2,878,280 (43,565)
(7,984) Puma SE (1,865,062) (88,064)
(59,941) QIAGEN NV (1,034,582) 21,453
77,359 QSC AG 309,591 134,602
60,085 Rheinmetall AG 2,728,460 131,103
(6,188) Rheinmetall AG (280,997) (10,791)
(72,341) RWE AG (2,043,995) (45,326)
(1,532) Salzgitter AG (49,361) 459
38 SAP AG 2,318 43
(395) Sartorius AG (Pref) (32,350) 261
1 SGL Carbon SE 30 3
(19,274) Siemens AG (1,877,866) (161,323)
54,434 Sixt SE 1,261,236 155,654
89,291 Sky Deutschland AG 672,986 12,357
(394) SMA Solar Technology AG (11,629) (105)
5,793 Software AG 163,536 11,670
(25,919) Software AG (731,693) (49,635)
2,233 Stada Arzneimittel AG 85,401 2,161
(22,068) Stada Arzneimittel AG (843,991) 16,762
(41,080) STRATEC Biomedical AG (1,318,668) (52,456)
2,182 Stroeer Media AG 30,253 4,439
29,750 Suedzucker AG 549,929 (95,680)
(29,462) Suss Microtec AG (198,868) (12,554)
76,923 Symrise AG 2,507,690 52,219
37,127 TAG Immobilien AG 316,916 (4,854)
30,843 Takkt AG 437,816 (18,992)
16,341 Talanx AG 401,989 (2,862)
356,476 Telefonica Deutschland Holding AG 2,140,638 62,895
(2,263) ThyssenKrupp AG (43,766) (79)
21,032 Tipp24 SE 1,072,422 62,574
(31,450) Tom Tailor Holding AG (570,817) (17,769)
87,881 TUI AG 942,084 91,010
51,523 United Internet AG 1,526,369 67,141
(828) Volkswagen AG (Pref) (161,212) (16,633)
2,218 Volkswagen AG (Pref) 431,845 (1,168)
(7,348) Vossloh AG (517,667) 15,995
(14,240) Wacker Chemie (1,116,986) (58,812)
24,058 Wincor Nixdorf AG 1,212,764 28,136
25,545 Wirecard AG 702,615 11,218
8,997,056 2,213,322
Ireland (519,485) Bank of Ireland (150,027) (11,580)
(138,735) C&C Group Plc (614,735) 15,271
(45,930) Glanbia Plc (493,518) (52,414)
1,429 Glanbia Plc 15,355 252
(51,039) Irish Continental Group Plc (1,247,904) (138,187)
(21,798) Kerry Group Plc 'A' (1,027,231) (7,338)
(10,276) Paddy Power Plc (581,827) 45,837
92,597 Ryanair Holdings Plc 570,397 (8,852)
58,239 Smurfit Kappa Group Plc 1,020,930 (726)
(2,508,560) (157,737)
Italy 3,931 A2A SpA 3,318 480
14,391 ACEA SpA 116,063 11,862
(296) Aeroporto di Venezia Marco Polo
SpA - SAVE (4,496) (364)
(41,319) Amplifon SpA (163,623) (5,704)
183,042 Ansaldo STS SpA 1,461,590 49,089
(148,216) Assicurazioni Generali SpA (2,516,708) (70,950)
(119,665) Astaldi SpA (940,567) (172,470)
(220) ASTM SpA (2,519) (11)
(54,134) Atlantia SpA (899,166) (78,496)
(82,776) Azimut Holding SpA (1,565,294) (138,106)
(430,565) Banca Carige SpA (210,546) (710)
30,907 Banca Generali SpA 646,574 61,632
1,542 Banca Piccolo Credito
Valtellinese Scarl 2,247 241
32,470 Banca Popolare dell'Emilia
Romagna SC 231,836 35,994
704,933 Banca Popolare di Milano Scarl 310,875 12,539
249,393 Banco Popolare SC 350,397 70,074
(164,394) Beni Stabili SpA (Reit) (82,033) 1,573
57,974 Brembo SpA 1,117,739 3,840
(54,779) Brunello Cucinelli SpA (1,416,585) (486,774)
(54,093) Buzzi Unicem SpA (688,604) (18,813)
1,566 Cairo Communication 7,963 153
148,644 CNH Industrial NV 1,258,272 (34,456)
(152) Credito Emiliano SpA (863) (390)
(49,744) Danieli & C Officine Meccaniche SpA (1,160,527) (80,556)
(49,416) De'Longhi SpA (637,466) (37,778)
(380) Ei Towers SpA (12,802) (243)
(304,761) Enel Green Power SpA (553,446) (18,479)
(2,168) Engineering SpA (86,720) (21,443)
(42,321) Eni SpA (755,007) (4,145)
(52,909) ERG SpA (517,715) (36,478)
284,236 Fiat SpA 1,668,465 (5,101)
590 Finmeccanica SpA 3,186 577
(425,694) Geox SpA (1,080,411) (225,843)
93,802 Gtech SpA 2,131,181 127,387
(6) Hera SpA (10) (2)
22,719 Industria Macchine Automatiche SpA 605,234 65,611
(197) Interpump Group SpA (1,652) (470)
538,783 Iren SpA 606,131 112,877
(7,929) Italcementi SpA (50,468) (1,812)
(6,023) Luxottica Group SpA (234,897) 4,707
(17,121) Maire Tecnimont SpA (28,352) (2,706)
(23,192) MARR SpA (273,434) (6,470)
(6) Mediaset SpA (20) –
16,602 Mediobanca SpA 105,257 19,673
1,607 Milano Assicurazioni SPA 1,053 167
(56,244) Molecular Medicine SPA (43,702) (366)
174,365 Parmalat SpA 429,635 (2,257)
(15,362) Piaggio & C SpA (36,807) (2,888)
58,461 Prysmian SpA 1,125,959 62,869
141,408 Recordati SpA 1,467,815 144,702
(50,925) Safilo Group SpA (922,761) (90,116)
42,686 Salvatore Ferragamo SpA 1,248,139 162,892
(314,041) Saras SpA (282,637) (4,273)
(502,613) Snam SpA (1,991,353) (110,794)
8,532 Societa Cattolica di Assicurazioni SCRL 166,033 20,912
(122,053) Societa Iniziative Autostradali
e Servizi SpA (901,361) (34,119)
32,259 Sorin SpA 67,292 4,032
(410,884) Telecom Italia SpA (293,987) (33,028)
(165,408) Tenaris SA (2,749,081) 78,977
(8,179) Tod's SpA (1,027,282) (69,522)
16,499 Trevi Finanziaria Industriale SpA 106,666 3,812
194,888 UniCredit SpA 1,057,267 138,955
(47,241) World Duty Free SpA (407,217) 4,622
50,994 World Duty Free SpA 439,568 (978)
(5,804,364) (596,862)
Italy continued Germany continued

Holding DescriptionMarket Value
EUR
Unrealisedappreciation/
(depreciation) EUR Holding Description
Market ValueEUR
Unrealisedappreciation/
(depreciation) EUR
Unaudited Interim Report and Accounts 97
The notes on pages 150 to 158 form an integral part of these financial statements.
BlackRock European Diversified Equity Absolute Return Fund continued
Contracts For Difference as at 30 November 2013
Netherlands 95 Aalberts Industries NV 2,158 287
(24,787) Aalberts Industries NV (563,161) (35,192)
(381,655) Aegon NV (2,511,672) (185,048)
429,160 Aegon NV 2,824,302 380,410
10,241 Akzo Nobel NV 567,454 26,790
3 AMG Advanced Metallurgical Group NV 23 2
(79,165) APERAM (1,080,602) (48,848)
(6,067) Arcadis NV (152,312) (900)
(38,971) ArcelorMittal (497,465) (8,916)
129,216 ArcelorMittal 1,649,442 325,856
40,157 ASM International NV 1,004,728 28,263
7,128 ASML Holding NV 492,260 (7,715)
1,177 BE Semiconductor Industries NV 9,545 81
(198) BinckBank NV (1,499) 7
(10,670) Brunel International NV (480,150) (8,131)
(154,723) Coribon NV (2,455,454) 112,220
24,825 Coribon NV 393,973 (13,847)
(4,648) Corio NV (Reit) (148,899) 641
(118,916) Delta Lloyd NV (2,127,407) (119,850)
4,081 Eurocommercial Properties NV (Reit) 121,757 (4,393)
(67,086) Fugro NV (3,010,820) 50,381
10,270 Gemalto NV 855,902 23,476
(13,627) Gemalto NV (1,135,674) 954
(194,936) Heijmans NV (2,102,385) (182,283)
(65,012) Heineken NV (3,246,374) 44,550
96,429 ING Groep NV 925,622 62,016
341,437 Koninklijke Ahold NV 4,573,549 133,515
82,897 Koninklijke BAM Groep NV 291,300 (15,459)
(93,773) Koninklijke BAM Groep NV (329,518) 40,588
(24,228) Koninklijke Boskalis Westminster NV (893,892) (7,941)
4,006 Koninklijke DSM NV 231,467 (781)
(26,820) Koninklijke DSM NV (1,549,660) (25,109)
87,198 Koninklijke Ten Cate NV 2,058,309 142,590
(58,843) Koninklijke Vopak NV (2,585,561) (37,389)
(17,367) Koninklijke Wessanen NV (48,975) (411)
(131,766) Nieuwe Steen Investments NV (Reit) (611,262) 44,817
30,903 Nutreco NV 1,089,331 (11,324)
(90) Nutreco NV (3,173) 77
(315,527) PostNL NV (1,362,761) (241,155)
37,791 Randstad Holding NV 1,740,087 (4,651)
(86,440) Reed Elsevier NV (1,363,159) (54,070)
75,642 Royal Imtech NV 151,965 (3,947)
133,329 SBM Offshore NV 1,969,269 (45,351)
(12,414) TKH Group NV (312,833) (32,871)
346,845 TNT Express NV 2,327,677 (10,305)
2,712 TomTom NV 15,195 138
(15,436) TomTom NV (86,488) 834
(204,782) USG People NV (2,015,055) (118,713)
(3,851) Wereldhave NV (Reit) (216,426) (9,831)
(53,347) Wolters Kluwer NV (1,110,685) (61,188)
63,359 Ziggo NV 1,995,175 28,229
(6,712,832) 151,103
Norway (223,030) Aker Solutions ASA (2,931,831) (420,558)
735 Algeta ASA 31,118 10,241
(48,974) Archer Ltd (28,004) (4,267)
223,814 Atea ASA 1,603,088 (69,529)
5,098 Awilco Drilling Plc 81,621 (114)
553,779 Borregaard ASA 1,779,921 31,360
586,768 BW Offshore Ltd 559,429 26,617
(132,822) Cermaq ASA (1,614,896) 89,043
(53,058) Det Norske Oljeselskap ASA (545,778) 1,514
(32,284) DNB ASA (424,777) (5,734)
473,754 DNO International ASA 1,291,167 342,165
(999,880) DNO International ASA (2,725,068) (262,396)
843,010 Dolphin Group AS 554,088 120
(539,722) Electromagnetic GeoServices (505,154) (22,762)
122,231 Fred Olsen Energy ASA 3,566,704 (258,987)
11,401 Gjensidige Forsikring ASA 152,342 (1,090)
(15,817) Gjensidige Forsikring ASA (211,349) (16,466)
1,261,646 Kongsberg Automotive Holding ASA 774,570 30,638
(803,494) Kvaerner ASA (1,083,313) (89,582)
834 Leroy Seafood Group ASA 18,373 866
445,909 Marine Harvest ASA 381,653 16,466
(3,139,583) Marine Harvest ASA (2,687,167) (60,384)
(829,055) Norsk Hydro ASA (2,622,780) (35,785)
2,531 Norwegian Air Shuttle AS 70,077 3,765
24,353 Odfjell Drilling Ltd 121,075 (2,335)
(88,223) Opera Software ASA (801,829) (45,136)
145,846 Orkla ASA 835,357 30,139
(37,118) Orkla ASA (212,599) 1,527
379,506 Petroleum Geo-Services ASA 3,357,833 (5,571)
2,265 Polarcus Ltd 1,219 63
208,215 ProSafe SE 1,152,482 (53,808)
(35,053) Royal Caribbean Cruises Ltd (1,146,906) (97,120)
14,546 Salmar ASA 132,204 9,973
(30,292) Schibsted ASA (1,442,571) (12,237)
(65,445) Seadrill Ltd (2,064,101) 61,752
33,053 Seadrill Ltd 1,042,474 (1,516)
(561,740) Songa Offshore (215,038) 146,740
59,732 SpareBank 1 SMN 390,085 38,189
73,237 SpareBank 1 SR Bank ASA 493,710 51,779
189,015 Statoil ASA 3,158,194 28,007
55,404 Storebrand ASA 252,108 11,269
(243,344) Storebrand ASA (1,107,301) 17,133
144,858 Subsea 7 SA 2,075,117 (100,472)
149,279 Telenor ASA 2,664,974 68,693
61,793 TGS Nopec Geophysical Co ASA 1,199,849 88,695
80,015 Yara International ASA 2,574,681 80,513
(37,733) Yara International ASA (1,214,153) (9,966)
6,730,898 (388,548)
Portugal 112,318 Altri SGPS SA 282,704 31,279
(495,783) Banco BPI SA (589,486) (63,085)
(1,902,135) Banco Comercial Portugues SA 'R' (243,473) (3,405)
420,875 Banco Espirito Santo SA 432,239 14,419
25,149 EDP - Energias de Portugal SA 70,040 819
221,773 EDP Renovaveis SA 878,221 (5,981)
(2,517) EDP Renovaveis SA (9,967) 184
(133,210) Galp Energia SGPS SA (1,631,823) (28,901)
(24,013) Jeronimo Martins SGPS SA (365,118) (9,118)
72,322 Portucel SA 208,287 559
951,860 Sonae 1,048,950 18,085
788,956 Sonaecom - SGPS SA 1,992,114 220,570
(1,817) ZON Optimus SGPS SA (9,657) (55)
2,063,031 175,370
Spain 872,357 Abengoa SA 'B' 1,701,969 145,315
59,986 Abertis Infraestructuras SA 937,281 1,325
(12,063) Abertis Infraestructuras SA (188,484) (4,788)
2,274 Acciona SA 103,285 (257)
(6,659) Acciona SA (302,452) 9,785
63,274 ACS Actividades de Construccion
y Servicios SA 1,510,983 11,027
(136,475) Almirall SA (1,562,639) (152,587)
131,131 Amadeus IT Holding SA 'A' 3,642,819 191,433
(96,436) Atresmedia Corp (1,089,727) (675,814)
(22,721) Banco Bilbao Vizcaya Argentaria SA (202,399) (10,951)
65,725 Banco de Sabadell SA 125,863 9,938
Norway continued
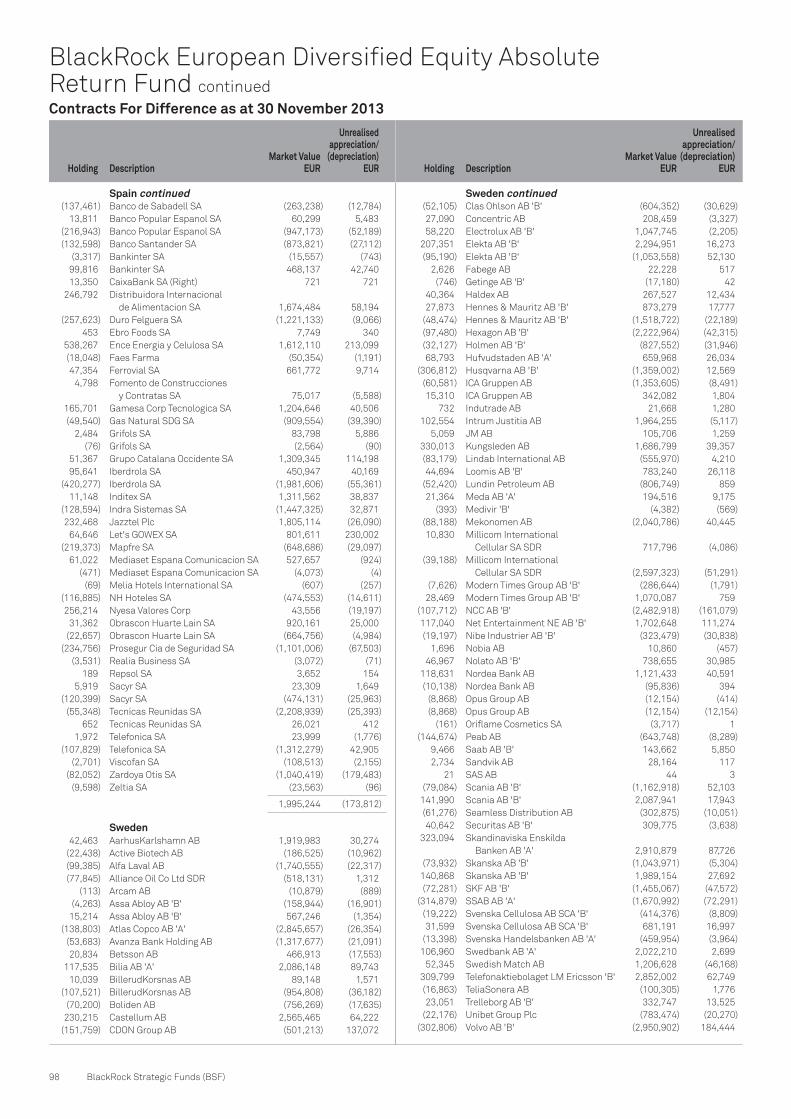
Holding DescriptionMarket Value
EUR
Unrealisedappreciation/
(depreciation) EUR Holding Description
Market ValueEUR
Unrealisedappreciation/
(depreciation) EUR
98 BlackRock Strategic Funds (BSF)
BlackRock European Diversified Equity Absolute Return Fund continued
Contracts For Difference as at 30 November 2013
(137,461) Banco de Sabadell SA (263,238) (12,784)
13,811 Banco Popular Espanol SA 60,299 5,483
(216,943) Banco Popular Espanol SA (947,173) (52,189)
(132,598) Banco Santander SA (873,821) (27,112)
(3,317) Bankinter SA (15,557) (743)
99,816 Bankinter SA 468,137 42,740
13,350 CaixaBank SA (Right) 721 721
246,792 Distribuidora Internacional
de Alimentacion SA 1,674,484 58,194
(257,623) Duro Felguera SA (1,221,133) (9,066)
453 Ebro Foods SA 7,749 340
538,267 Ence Energia y Celulosa SA 1,612,110 213,099
(18,048) Faes Farma (50,354) (1,191)
47,354 Ferrovial SA 661,772 9,714
4,798 Fomento de Construcciones
y Contratas SA 75,017 (5,588)
165,701 Gamesa Corp Tecnologica SA 1,204,646 40,506
(49,540) Gas Natural SDG SA (909,554) (39,390)
2,484 Grifols SA 83,798 5,886
(76) Grifols SA (2,564) (90)
51,367 Grupo Catalana Occidente SA 1,309,345 114,198
95,641 Iberdrola SA 450,947 40,169
(420,277) Iberdrola SA (1,981,606) (55,361)
11,148 Inditex SA 1,311,562 38,837
(128,594) Indra Sistemas SA (1,447,325) 32,871
232,468 Jazztel Plc 1,805,114 (26,090)
64,646 Let's GOWEX SA 801,611 230,002
(219,373) Mapfre SA (648,686) (29,097)
61,022 Mediaset Espana Comunicacion SA 527,657 (924)
(471) Mediaset Espana Comunicacion SA (4,073) (4)
(69) Melia Hotels International SA (607) (257)
(116,885) NH Hoteles SA (474,553) (14,611)
256,214 Nyesa Valores Corp 43,556 (19,197)
31,362 Obrascon Huarte Lain SA 920,161 25,000
(22,657) Obrascon Huarte Lain SA (664,756) (4,984)
(234,756) Prosegur Cia de Seguridad SA (1,101,006) (67,503)
(3,531) Realia Business SA (3,072) (71)
189 Repsol SA 3,652 154
5,919 Sacyr SA 23,309 1,649
(120,399) Sacyr SA (474,131) (25,963)
(55,348) Tecnicas Reunidas SA (2,208,939) (25,393)
652 Tecnicas Reunidas SA 26,021 412
1,972 Telefonica SA 23,999 (1,776)
(107,829) Telefonica SA (1,312,279) 42,905
(2,701) Viscofan SA (108,513) (2,155)
(82,052) Zardoya Otis SA (1,040,419) (179,483)
(9,598) Zeltia SA (23,563) (96)
1,995,244 (173,812)
Sweden 42,463 AarhusKarlshamn AB 1,919,983 30,274
(22,438) Active Biotech AB (186,525) (10,962)
(99,385) Alfa Laval AB (1,740,555) (22,317)
(77,845) Alliance Oil Co Ltd SDR (518,131) 1,312
(113) Arcam AB (10,879) (889)
(4,263) Assa Abloy AB 'B' (158,944) (16,901)
15,214 Assa Abloy AB 'B' 567,246 (1,354)
(138,803) Atlas Copco AB 'A' (2,845,657) (26,354)
(53,683) Avanza Bank Holding AB (1,317,677) (21,091)
20,834 Betsson AB 466,913 (17,553)
117,535 Bilia AB 'A' 2,086,148 89,743
10,039 BillerudKorsnas AB 89,148 1,571
(107,521) BillerudKorsnas AB (954,808) (36,182)
(70,200) Boliden AB (756,269) (17,635)
230,215 Castellum AB 2,565,465 64,222
(151,759) CDON Group AB (501,213) 137,072
(52,105) Clas Ohlson AB 'B' (604,352) (30,629)
27,090 Concentric AB 208,459 (3,327)
58,220 Electrolux AB 'B' 1,047,745 (2,205)
207,351 Elekta AB 'B' 2,294,951 16,273
(95,190) Elekta AB 'B' (1,053,558) 52,130
2,626 Fabege AB 22,228 517
(746) Getinge AB 'B' (17,180) 42
40,364 Haldex AB 267,527 12,434
27,873 Hennes & Mauritz AB 'B' 873,279 17,777
(48,474) Hennes & Mauritz AB 'B' (1,518,722) (22,189)
(97,480) Hexagon AB 'B' (2,222,964) (42,315)
(32,127) Holmen AB 'B' (827,552) (31,946)
68,793 Hufvudstaden AB 'A' 659,968 26,034
(306,812) Husqvarna AB 'B' (1,359,002) 12,569
(60,581) ICA Gruppen AB (1,353,605) (8,491)
15,310 ICA Gruppen AB 342,082 1,804
732 Indutrade AB 21,668 1,280
102,554 Intrum Justitia AB 1,964,255 (5,117)
5,059 JM AB 105,706 1,259
330,013 Kungsleden AB 1,686,799 39,357
(83,179) Lindab International AB (555,970) 4,210
44,694 Loomis AB 'B' 783,240 26,118
(52,420) Lundin Petroleum AB (806,749) 859
21,364 Meda AB 'A' 194,516 9,175
(393) Medivir 'B' (4,382) (569)
(88,188) Mekonomen AB (2,040,786) 40,445
10,830 Millicom International
Cellular SA SDR 717,796 (4,086)
(39,188) Millicom International
Cellular SA SDR (2,597,323) (51,291)
(7,626) Modern Times Group AB 'B' (286,644) (1,791)
28,469 Modern Times Group AB 'B' 1,070,087 759
(107,712) NCC AB 'B' (2,482,918) (161,079)
117,040 Net Entertainment NE AB 'B' 1,702,648 111,274
(19,197) Nibe Industrier AB 'B' (323,479) (30,838)
1,696 Nobia AB 10,860 (457)
46,967 Nolato AB 'B' 738,655 30,985
118,631 Nordea Bank AB 1,121,433 40,591
(10,138) Nordea Bank AB (95,836) 394
(8,868) Opus Group AB (12,154) (414)
(8,868) Opus Group AB (12,154) (12,154)
(161) Oriflame Cosmetics SA (3,717) 1
(144,674) Peab AB (643,748) (8,289)
9,466 Saab AB 'B' 143,662 5,850
2,734 Sandvik AB 28,164 117
21 SAS AB 44 3
(79,084) Scania AB 'B' (1,162,918) 52,103
141,990 Scania AB 'B' 2,087,941 17,943
(61,276) Seamless Distribution AB (302,875) (10,051)
40,642 Securitas AB 'B' 309,775 (3,638)
323,094 Skandinaviska Enskilda
Banken AB 'A' 2,910,879 87,726
(73,932) Skanska AB 'B' (1,043,971) (5,304)
140,868 Skanska AB 'B' 1,989,154 27,692
(72,281) SKF AB 'B' (1,455,067) (47,572)
(314,879) SSAB AB 'A' (1,670,992) (72,291)
(19,222) Svenska Cellulosa AB SCA 'B' (414,376) (8,809)
31,599 Svenska Cellulosa AB SCA 'B' 681,191 16,997
(13,398) Svenska Handelsbanken AB 'A' (459,954) (3,964)
106,960 Swedbank AB 'A' 2,022,210 2,699
52,345 Swedish Match AB 1,206,628 (46,168)
309,799 Telefonaktiebolaget LM Ericsson 'B' 2,852,002 62,749
(16,863) TeliaSonera AB (100,305) 1,776
23,051 Trelleborg AB 'B' 332,747 13,525
(22,176) Unibet Group Plc (783,474) (20,270)
(302,806) Volvo AB 'B' (2,950,902) 184,444
Spain continued Sweden continued

Holding DescriptionMarket Value
EUR
Unrealisedappreciation/
(depreciation) EUR Holding Description
Market ValueEUR
Unrealisedappreciation/
(depreciation) EUR
Unaudited Interim Report and Accounts 99
The notes on pages 150 to 158 form an integral part of these financial statements.
BlackRock European Diversified Equity Absolute Return Fund continued
Contracts For Difference as at 30 November 2013
79,608 Wallenstam AB 'B' 827,664 26,322
90,009 Wihlborgs Fastigheter AB 1,155,215 53,191
1,917,794 517,126
Switzerland (48) ABB Ltd (905) (1)
40,299 Actelion Ltd 2,497,110 278,622
63 Adecco SA 3,596 61
2,982 Allreal Holding AG 301,659 (3,573)
(57) ams AG (4,473) 57
256 ams AG 20,089 (87)
22,149 Ascom Holding AG 262,963 14,393
16,929 Autoneum Holding AG 1,906,644 257,609
5,175 Baloise Holding AG 451,542 18,616
2,210 Banque Cantonale Vaudoise 870,712 6,201
(2,488) Banque Cantonale Vaudoise (980,240) 13,122
234 Barry Callebaut AG 196,374 4,302
(1,618) Barry Callebaut AG (1,357,834) (59,717)
(1,626) Basilea Pharmaceutica (140,025) (30,722)
(3,084) Burckhardt Compression Holding AG (943,581) (29,463)
(3,253) Cembra Money Bank (149,591) (2,170)
18,304 Cie Financiere Richemont SA 1,374,584 6,051
38,026 Clariant AG 492,280 3,791
(5,668) Cosmo Pharmaceuticals SpA (347,989) 5,240
54,700 Credit Suisse Group AG 1,203,659 15,143
(73,105) Credit Suisse Group AG (1,608,657) 55,059
(1,675) Daetwyler Holding (162,905) 2,839
4,420 DKSH Holding AG 260,585 (5,838)
(21,270) Dufry AG (2,654,999) (263,774)
(2,035) EFG International AG (19,444) 264
(1,272) Flughafen Zuerich AG (537,872) (2,418)
2,104 Flughafen Zuerich AG 889,688 54,738
(606) Galenica AG (442,278) (59,115)
21,152 GAM Holding AG 286,388 151
(33,998) Gategroup Holding AG (680,107) (40,088)
73 Geberit AG 15,826 (109)
(381) Geberit AG (82,599) 953
5,288 Georg Fischer AG 2,698,321 72,130
(1,958) Georg Fischer AG (999,114) (65,065)
1 Helvetia Holding AG 345 19
(1,168) Helvetia Holding AG (402,952) (21,991)
(34,871) Holcim Ltd (1,871,530) 32,479
1,441 Holcim Ltd 77,339 1,088
36,866 Implenia AG 1,855,689 (33,133)
1,967 Inficon Holding AG 514,249 48,061
(2,618) Julius Baer Group Ltd (90,479) (1,780)
6 Julius Baer Group Ltd 207 1
58,497 Kardex AG 1,921,779 (7,063)
13,419 Komax Holding AG 1,496,050 182,137
114,684 Kudelski SA 1,282,313 50,645
1,349 Kuehne + Nagel International AG 129,225 5,959
(29,683) Kuehne + Nagel International AG (2,843,423) (59,428)
6,423 Kuoni Reisen Holding AG 'B' 2,078,784 103,157
(89) Lindt & Spruengli AG (284,065) (1,095)
46,418 Logitech International SA 390,675 42,868
(53,716) Logitech International SA (452,098) (29,761)
2,282 Lonza Group AG 156,713 (1,980)
(1,476) Lonza Group AG (101,362) 2,387
(966) Luzerner Kantonalbank AG (280,436) 1,444
36,855 Meyer Burger Technology AG 314,684 (2,603)
439 Mobimo Holding AG 67,899 (138)
4,628 Nestle SA 248,009 1,235
66,080 Nobel Biocare Holding AG 711,991 (38,612)
2,198 Novartis AG 127,797 731
254,338 OC Oerlikon Corp AG 2,719,728 180,781
(9,766) Panalpina Welttransport Holding AG (1,192,026) (133,418)
474 Partners Group Holding AG 87,227 1,360
7 PSP Swiss Property AG 440 (12)
(11,775) Rieter Holding AG (2,012,714) (230,763)
14,681 Roche Holding AG 3,010,850 555
5,402 Schindler Holding AG 550,859 (243)
(531) Schindler Holding AG (54,148) (536)
74,294 Schmolz + Bickenbach AG 71,289 (30,954)
(1,654) SGS SA (2,749,191) 144,508
8,583 Siegfried Holding AG 1,105,561 60,331
112 Sika AG 272,228 32,150
(435) Sika AG (1,057,313) (20,870)
(15,644) Sonova Holding AG (1,610,534) (154,984)
(99) St Galler Kantonalbank AG (28,177) 663
56 Straumann Holding AG 7,696 68
(283) Straumann Holding AG (38,892) (345)
(11,493) Sulzer (1,324,316) (36,788)
(3,852) Swatch Group AG/The (1,866,900) (26,167)
(2,564) Swiss Life Holding AG (391,563) 6,430
7,943 Swiss Life Holding AG 1,213,022 56,288
32,390 Swiss Re AG 2,124,241 3,926
5,062 Swisscom AG 1,903,805 (14,641)
(338) Swissquote Group Holding SA (10,623) (536)
2,482 Syngenta AG 718,926 3,222
(26,575) Tecan Group AG (2,134,022) (70,618)
14,359 Temenos Group AG 280,820 5,501
(3,865) Temenos Group AG (75,588) (1,082)
68,828 Transocean Ltd 2,556,140 114,196
(47,424) Transocean Ltd (1,761,236) 124,882
28,883 U-Blox AG 2,057,476 154,510
(32,031) UBS AG (452,177) (14,741)
5,029 Valiant Holding 331,454 (16,630)
(3,936) Valora Holding AG (713,434) (56,652)
15,976 Vontobel Holding AG 435,212 (13,602)
(13,784) Zehnder Group AG (483,665) (31,945)
1,358 Zurich Insurance Group AG 279,389 171
9,436,654 555,844
United Kingdom (44,019) A.G.BARR Plc (291,759) (11,105)
(52,864) Abcam Plc (299,122) 7,413
62,761 Aberdeen Asset Management Plc 371,211 24,370
(118,635) Aberdeen Asset Management Plc (701,688) (126,491)
(78,340) Advanced Computer Software
Group Plc (88,655) (2,745)
(626,075) Afren Plc (1,227,579) (51,153)
(73,398) Aggreko Plc (1,410,953) (18,042)
(4,399) Al Noor Hospitals Group Plc (46,586) (1,802)
(215,386) Alent Plc (875,620) 39,511
98,286 AMEC Plc 1,339,443 54,986
(179,328) AMEC Plc (2,443,885) (98,939)
(932,572) Amerisur Resources Plc (549,101) (22,118)
(220,586) Amlin Plc (1,193,455) (16,796)
(38,820) Anglo American Plc (633,682) 59,387
32,216 Anite Plc 34,113 (1,234)
(2,857) Antofagasta Plc (27,375) (793)
(5,185) APR Energy Plc (63,253) 2,293
(221,223) Aquarius Platinum Ltd (119,531) (8,368)
(75,437) ARM Holdings Plc (924,345) (33,115)
239,115 Ashtead Group Plc 2,005,442 129,379
(115,258) Ashtead Group Plc (966,661) (112,244)
25,025 ASOS Plc 1,742,014 76,467
(75,340) Associated British Foods Plc (2,080,608) (377,122)
(31,279) AstraZeneca Plc (1,312,050) (21,361)
(2,182) Avanti Communications Group Plc (6,026) (262)
Switzerland continued Sweden continued
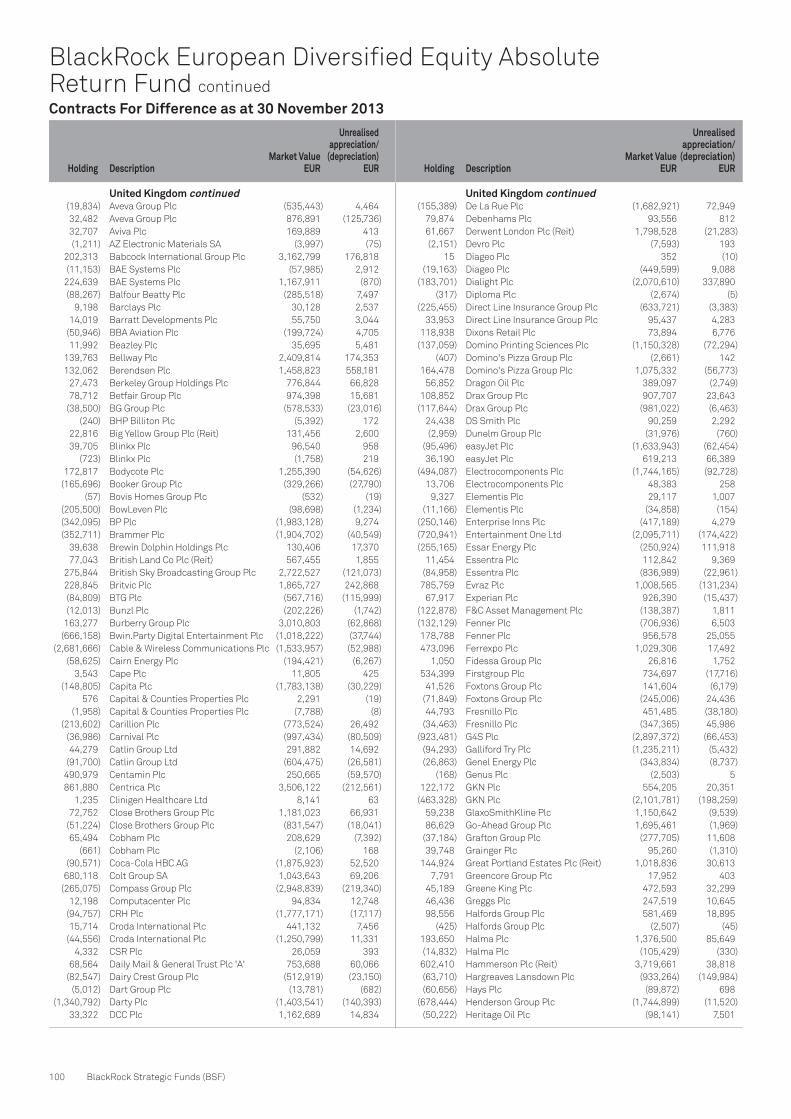
Holding DescriptionMarket Value
EUR
Unrealisedappreciation/
(depreciation) EUR Holding Description
Market ValueEUR
Unrealisedappreciation/
(depreciation) EUR
100 BlackRock Strategic Funds (BSF)
BlackRock European Diversified Equity Absolute Return Fund continued
Contracts For Difference as at 30 November 2013
(19,834) Aveva Group Plc (535,443) 4,464
32,482 Aveva Group Plc 876,891 (125,736)
32,707 Aviva Plc 169,889 413
(1,211) AZ Electronic Materials SA (3,997) (75)
202,313 Babcock International Group Plc 3,162,799 176,818
(11,153) BAE Systems Plc (57,985) 2,912
224,639 BAE Systems Plc 1,167,911 (870)
(88,267) Balfour Beatty Plc (285,518) 7,497
9,198 Barclays Plc 30,128 2,537
14,019 Barratt Developments Plc 55,750 3,044
(50,946) BBA Aviation Plc (199,724) 4,705
11,992 Beazley Plc 35,695 5,481
139,763 Bellway Plc 2,409,814 174,353
132,062 Berendsen Plc 1,458,823 558,181
27,473 Berkeley Group Holdings Plc 776,844 66,828
78,712 Betfair Group Plc 974,398 15,681
(38,500) BG Group Plc (578,533) (23,016)
(240) BHP Billiton Plc (5,392) 172
22,816 Big Yellow Group Plc (Reit) 131,456 2,600
39,705 Blinkx Plc 96,540 958
(723) Blinkx Plc (1,758) 219
172,817 Bodycote Plc 1,255,390 (54,626)
(165,696) Booker Group Plc (329,266) (27,790)
(57) Bovis Homes Group Plc (532) (19)
(205,500) BowLeven Plc (98,698) (1,234)
(342,095) BP Plc (1,983,128) 9,274
(352,711) Brammer Plc (1,904,702) (40,549)
39,638 Brewin Dolphin Holdings Plc 130,406 17,370
77,043 British Land Co Plc (Reit) 567,455 1,855
275,844 British Sky Broadcasting Group Plc 2,722,527 (121,073)
228,845 Britvic Plc 1,865,727 242,868
(84,809) BTG Plc (567,716) (115,999)
(12,013) Bunzl Plc (202,226) (1,742)
163,277 Burberry Group Plc 3,010,803 (62,868)
(666,158) Bwin.Party Digital Entertainment Plc (1,018,222) (37,744)
(2,681,666) Cable & Wireless Communications Plc (1,533,957) (52,988)
(58,625) Cairn Energy Plc (194,421) (6,267)
3,543 Cape Plc 11,805 425
(148,805) Capita Plc (1,783,138) (30,229)
576 Capital & Counties Properties Plc 2,291 (19)
(1,958) Capital & Counties Properties Plc (7,788) (8)
(213,602) Carillion Plc (773,524) 26,492
(36,986) Carnival Plc (997,434) (80,509)
44,279 Catlin Group Ltd 291,882 14,692
(91,700) Catlin Group Ltd (604,475) (26,581)
490,979 Centamin Plc 250,665 (59,570)
861,880 Centrica Plc 3,506,122 (212,561)
1,235 Clinigen Healthcare Ltd 8,141 63
72,752 Close Brothers Group Plc 1,181,023 66,931
(51,224) Close Brothers Group Plc (831,547) (18,041)
65,494 Cobham Plc 208,629 (7,392)
(661) Cobham Plc (2,106) 168
(90,571) Coca-Cola HBC AG (1,875,923) 52,520
680,118 Colt Group SA 1,043,643 69,206
(265,075) Compass Group Plc (2,948,839) (219,340)
12,198 Computacenter Plc 94,834 12,748
(94,757) CRH Plc (1,777,171) (17,117)
15,714 Croda International Plc 441,132 7,456
(44,556) Croda International Plc (1,250,799) 11,331
4,332 CSR Plc 26,059 393
68,564 Daily Mail & General Trust Plc 'A' 753,688 60,066
(82,547) Dairy Crest Group Plc (512,919) (23,150)
(5,012) Dart Group Plc (13,781) (682)
(1,340,792) Darty Plc (1,403,541) (140,393)
33,322 DCC Plc 1,162,689 14,834
(155,389) De La Rue Plc (1,682,921) 72,949
79,874 Debenhams Plc 93,556 812
61,667 Derwent London Plc (Reit) 1,798,528 (21,283)
(2,151) Devro Plc (7,593) 193
15 Diageo Plc 352 (10)
(19,163) Diageo Plc (449,599) 9,088
(183,701) Dialight Plc (2,070,610) 337,890
(317) Diploma Plc (2,674) (5)
(225,455) Direct Line Insurance Group Plc (633,721) (3,383)
33,953 Direct Line Insurance Group Plc 95,437 4,283
118,938 Dixons Retail Plc 73,894 6,776
(137,059) Domino Printing Sciences Plc (1,150,328) (72,294)
(407) Domino's Pizza Group Plc (2,661) 142
164,478 Domino's Pizza Group Plc 1,075,332 (56,773)
56,852 Dragon Oil Plc 389,097 (2,749)
108,852 Drax Group Plc 907,707 23,643
(117,644) Drax Group Plc (981,022) (6,463)
24,438 DS Smith Plc 90,259 2,292
(2,959) Dunelm Group Plc (31,976) (760)
(95,496) easyJet Plc (1,633,943) (62,454)
36,190 easyJet Plc 619,213 66,389
(494,087) Electrocomponents Plc (1,744,165) (92,728)
13,706 Electrocomponents Plc 48,383 258
9,327 Elementis Plc 29,117 1,007
(11,166) Elementis Plc (34,858) (154)
(250,146) Enterprise Inns Plc (417,189) 4,279
(720,941) Entertainment One Ltd (2,095,711) (174,422)
(255,165) Essar Energy Plc (250,924) 111,918
11,454 Essentra Plc 112,842 9,369
(84,958) Essentra Plc (836,989) (22,961)
785,759 Evraz Plc 1,008,565 (131,234)
67,917 Experian Plc 926,390 (15,437)
(122,878) F&C Asset Management Plc (138,387) 1,811
(132,129) Fenner Plc (706,936) 6,503
178,788 Fenner Plc 956,578 25,055
473,096 Ferrexpo Plc 1,029,306 17,492
1,050 Fidessa Group Plc 26,816 1,752
534,399 Firstgroup Plc 734,697 (17,716)
41,526 Foxtons Group Plc 141,604 (6,179)
(71,849) Foxtons Group Plc (245,006) 24,436
44,793 Fresnillo Plc 451,485 (38,180)
(34,463) Fresnillo Plc (347,365) 45,986
(923,481) G4S Plc (2,897,372) (66,453)
(94,293) Galliford Try Plc (1,235,211) (5,432)
(26,863) Genel Energy Plc (343,834) (8,737)
(168) Genus Plc (2,503) 5
122,172 GKN Plc 554,205 20,351
(463,328) GKN Plc (2,101,781) (198,259)
59,238 GlaxoSmithKline Plc 1,150,642 (9,539)
86,629 Go-Ahead Group Plc 1,695,461 (1,969)
(37,184) Grafton Group Plc (277,705) 11,608
39,748 Grainger Plc 95,260 (1,310)
144,924 Great Portland Estates Plc (Reit) 1,018,836 30,613
7,791 Greencore Group Plc 17,952 403
45,189 Greene King Plc 472,593 32,299
46,436 Greggs Plc 247,519 10,645
98,556 Halfords Group Plc 581,469 18,895
(425) Halfords Group Plc (2,507) (45)
193,650 Halma Plc 1,376,500 85,649
(14,832) Halma Plc (105,429) (330)
602,410 Hammerson Plc (Reit) 3,719,661 38,818
(63,710) Hargreaves Lansdown Plc (933,264) (149,984)
(60,656) Hays Plc (89,872) 698
(678,444) Henderson Group Plc (1,744,899) (11,520)
(50,222) Heritage Oil Plc (98,141) 7,501
United Kingdom continued United Kingdom continued

Holding DescriptionMarket Value
EUR
Unrealisedappreciation/
(depreciation) EUR Holding Description
Market ValueEUR
Unrealisedappreciation/
(depreciation) EUR
Unaudited Interim Report and Accounts 101
The notes on pages 150 to 158 form an integral part of these financial statements.
BlackRock European Diversified Equity Absolute Return Fund continued
355,014 Highland Gold Mining Ltd 250,432 (186,375)
(105,596) Hikma Pharmaceuticals Plc (1,527,817) 2,820
(62,502) Hiscox Ltd (510,317) (2,982)
53,259 Hiscox Ltd 434,849 9,635
361,545 Home Retail Group Plc 832,622 44,905
(284,927) Home Retail Group Plc (656,174) (33,687)
(154,259) Homeserve Plc (476,941) (1,681)
863,584 Howden Joinery Group Plc 3,343,001 111,966
(331,644) HSBC Holdings Plc (2,738,470) (85,705)
139,342 HSBC Holdings Plc 1,150,583 2,472
17,707 Hunting Plc 169,875 (4,329)
(217,726) Hunting Plc (2,088,786) 20,526
33,036 ICAP Plc 164,775 14,913
(13,242) ICAP Plc (66,048) (7,467)
73,951 IG Group Holdings Plc 518,998 3,216
(220) IGAS Energy Plc (288) 4
66,949 Imagination Technologies Group Plc 198,152 (1,209)
(22,846) Imagination Technologies Group Plc (67,618) 1,930
(4,432) Imperial Tobacco Group Plc (123,566) 4,693
261,342 Inchcape Plc 1,871,787 (28,116)
15,338 Informa Plc 102,856 781
(277,530) Inmarsat Plc (2,332,944) (12,271)
(29,671) InterContinental Hotels Group Plc (679,391) (14,535)
(105) Intermediate Capital Group Plc (539) 24
(181,195) International Consolidated
Airlines Group SA (799,323) (63,577)
232,917 International Consolidated
Airlines Group SA 1,027,489 4,246
(91,434) International Personal Finance Plc (655,968) 14,726
37,241 International Personal Finance Plc 267,175 12,617
(272,780) Interserve Plc (2,146,951) (191,343)
(104,778) Intertek Group Plc (3,837,133) 238,108
(230,909) Intu Properties Plc (Reit) (895,530) (4,385)
16,558 Investec Plc 86,325 2,386
(5,301,122) IQE Plc (1,628,636) (123,566)
418,009 ITE Group Plc 1,546,122 108,597
(329,285) ITV Plc (753,885) (17,118)
37,930 John Wood Group Plc 360,244 (5,730)
(20,560) Johnson Matthey Plc (787,747) 14,779
(110,935) Jupiter Fund Management Plc (519,881) 8,816
60,680 Jupiter Fund Management Plc 284,368 (4,203)
(297,472) Kazakhmys Plc (842,222) 2,297
(203,228) Kcom Group Plc (241,516) (19,460)
113,452 Keller Group Plc 1,437,148 21,796
(203,778) Kenmare Resources Plc (48,999) 12,118
54,137 Kentz Corp Ltd 385,791 33,427
(34,271) Kentz Corp Ltd (244,222) (10,198)
(36,799) Kier Group Plc (785,606) (66,947)
(5,134) Kingfisher Plc (23,080) 1,240
(7,546) Lancashire Holdings Ltd (71,170) 1,218
1,336 Land Securities Group Plc (Reit) 15,328 15,328
(11,718) Lavendon Group Plc (25,255) (105)
(906,106) London Mining Plc (1,245,723) (91,582)
(41,332) Majestic Wine Plc (286,848) (12,868)
142,866 Man Group Plc 153,031 9,214
(74,293) Man Group Plc (79,579) (1,020)
41,016 Marks & Spencer Group Plc 241,021 (7,432)
(283,215) Marston's Plc (507,707) 3,832
(170) McBride Plc – –
(180,823) Mears Group Plc (970,506) (59,179)
(358,387) Meggitt Plc (2,151,158) 210,402
(249,633) Melrose Industries Plc (883,322) 13,206
409,395 Melrose Industries Plc 1,448,637 (29,221)
(205,956) Michael Page International Plc (1,173,157) 9,876
43,904 Micro Focus International Plc 428,580 (9,534)
(18,473) Millennium & Copthorne Hotels Plc (130,533) (7,431)
(16) Mitchells & Butlers Plc (79) (4)
(129,636) Mitie Group Plc (483,308) (731)
72,010 Mondi Plc 875,869 (51,667)
253,239 Moneysupermarket.com Group Plc 554,312 19,831
(919,772) Monitise Plc (598,406) (34,606)
288,755 Monitise Plc 187,865 504
116,277 Morgan Sindall Group Plc 1,064,561 (51,240)
(282,727) Mothercare Plc (1,304,418) (54,394)
(158,246) Nanoco Group Plc (277,410) 8,156
118,512 National Express Group Plc 373,959 8,317
96,033 National Grid Plc 896,515 4,008
(292,091) National Grid Plc (2,726,813) (164,782)
(140) Next Plc (9,279) (1)
356,197 Northgate Plc 1,773,836 (35,267)
(137,743) Ocado Group Plc (676,441) (7,134)
781,797 Old Mutual Plc 1,882,111 22,047
(133,431) Ophir Energy Plc (541,515) 33,903
264,329 Optimal Payments Plc 1,048,946 131,913
(19,890) Oxford Instruments Plc (360,380) (15,623)
(304,028) Pace Plc (1,157,057) (119,695)
287,441 Pace Plc 1,093,931 138,836
106,670 Paragon Group of Cos Plc 442,898 21,987
(241,383) Pearson Plc (3,924,300) (225,060)
942,037 Pendragon Plc 404,372 (25,778)
194 Pennon Group Plc 1,513 16
(190,464) Pennon Group Plc (1,485,350) 52,953
(1,439) Perform Group Plc (7,563) 1,405
20,657 Persimmon Plc 287,715 (9,245)
(280,369) Petroceltic International Plc (498,229) 13,122
39,940 Petrofac Ltd 606,646 43,223
26,254 Playtech Plc 219,875 749
(451) Polymetal International Plc (2,919) 623
52,970 Polymetal International Plc 342,812 (30,060)
31 Polyus Gold International Ltd 71 (6)
(529,410) Premier Farnell Plc (1,415,628) 13,632
(351,281) Premier Foods Plc (513,524) 61,583
227,066 Premier Oil Plc 846,546 (15,092)
(56,096) Primary Health Properties Plc (Reit) (224,965) 1,852
(156) Providence Resources Plc (476) 86
(1,273) Provident Financial Plc (24,487) (98)
5,761 PZ Cussons Plc 27,337 1,090
443,315 QinetiQ Group Plc 1,160,395 124,024
(2,973,677) Quindell Portfolio Plc (602,524) (10,313)
1,385,567 Quintain Estates & Development Plc 1,559,681 164,646
4,934 Randgold Resources Ltd 256,818 (17,576)
(194) Reckitt Benckiser Group Plc (11,461) (86)
57,436 Redrow Plc 194,961 14,445
115,956 Regus Plc 276,787 23,390
(19,733) Renishaw Plc (439,278) (11,881)
(1,057,499) Rentokil Initial Plc (1,347,658) 10,023
3,152 Resolution Ltd 13,008 980
(188,877) Resolution Ltd (779,463) 11,583
158,560 Restaurant Group Plc/The 1,101,372 73,862
23,575 Rexam Plc 143,020 4,597
77,499 Rightmove Plc 2,381,156 168,170
(10,307) Rio Tinto Plc (407,036) (6,709)
30,197 Rio Tinto Plc 1,192,517 26,963
5,147,014 Rolls Royce Holdings -Rights- 6,180 6,180
27,330 Rolls-Royce Holdings Plc 408,222 27,811
(45,306) Rolls-Royce Holdings Plc (676,726) (15,066)
(26,695) Rotork Plc (909,660) 10,575
80,561 Rotork Plc 2,745,201 66,457
(225,679) Royal Bank of Scotland Group Plc (885,544) 4,657
(6,020) Royal Dutch Shell Plc 'B' (155,371) (999)
(35,880) RPS Group Plc (133,638) (18,180)
(2,575) RSA Insurance Group Plc (3,299) (3,299)
Contracts For Difference as at 30 November 2013
United Kingdom continued United Kingdom continued
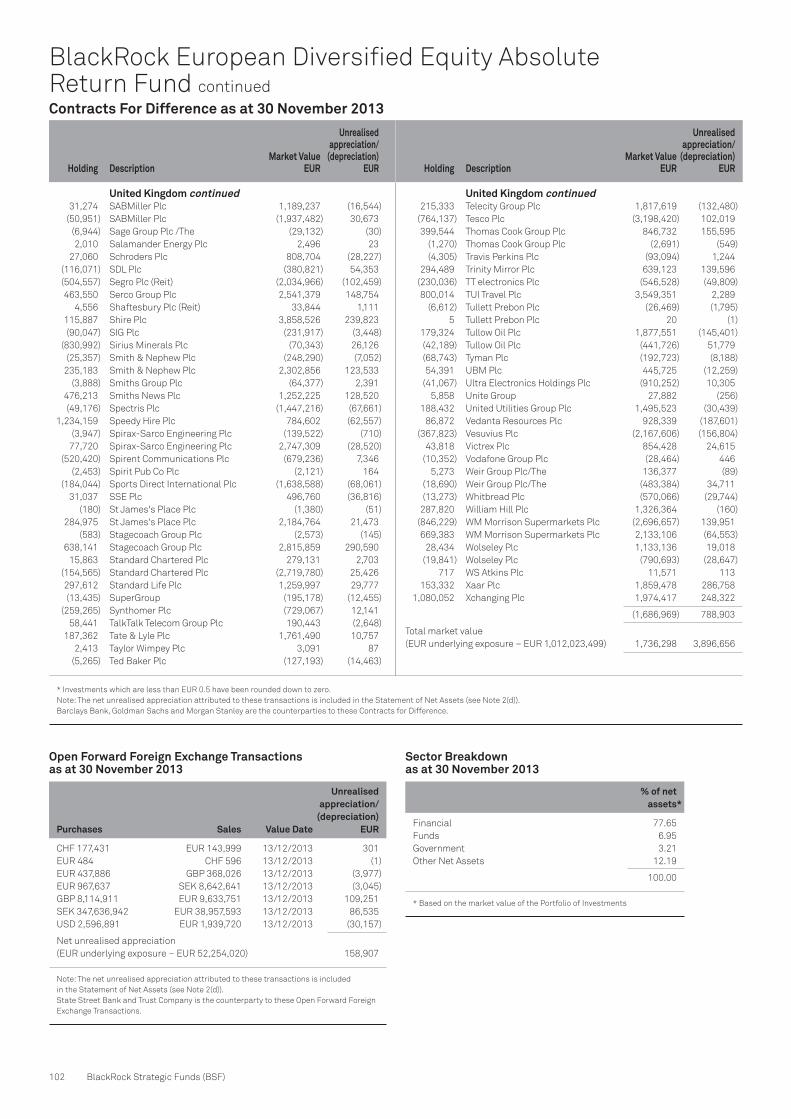
Holding DescriptionMarket Value
EUR
Unrealisedappreciation/
(depreciation) EUR Holding Description
Market ValueEUR
Unrealisedappreciation/
(depreciation) EUR
* Investments which are less than EUR 0.5 have been rounded down to zero.
Note: The net unrealised appreciation attributed to these transactions is included in the Statement of Net Assets (see Note 2(d)).
Barclays Bank, Goldman Sachs and Morgan Stanley are the counterparties to these Contracts for Difference.
102 BlackRock Strategic Funds (BSF)
BlackRock European Diversified Equity Absolute Return Fund continued
31,274 SABMiller Plc 1,189,237 (16,544)
(50,951) SABMiller Plc (1,937,482) 30,673
(6,944) Sage Group Plc /The (29,132) (30)
2,010 Salamander Energy Plc 2,496 23
27,060 Schroders Plc 808,704 (28,227)
(116,071) SDL Plc (380,821) 54,353
(504,557) Segro Plc (Reit) (2,034,966) (102,459)
463,550 Serco Group Plc 2,541,379 148,754
4,556 Shaftesbury Plc (Reit) 33,844 1,111
115,887 Shire Plc 3,858,526 239,823
(90,047) SIG Plc (231,917) (3,448)
(830,992) Sirius Minerals Plc (70,343) 26,126
(25,357) Smith & Nephew Plc (248,290) (7,052)
235,183 Smith & Nephew Plc 2,302,856 123,533
(3,888) Smiths Group Plc (64,377) 2,391
476,213 Smiths News Plc 1,252,225 128,520
(49,176) Spectris Plc (1,447,216) (67,661)
1,234,159 Speedy Hire Plc 784,602 (62,557)
(3,947) Spirax-Sarco Engineering Plc (139,522) (710)
77,720 Spirax-Sarco Engineering Plc 2,747,309 (28,520)
(520,420) Spirent Communications Plc (679,236) 7,346
(2,453) Spirit Pub Co Plc (2,121) 164
(184,044) Sports Direct International Plc (1,638,588) (68,061)
31,037 SSE Plc 496,760 (36,816)
(180) St James's Place Plc (1,380) (51)
284,975 St James's Place Plc 2,184,764 21,473
(583) Stagecoach Group Plc (2,573) (145)
638,141 Stagecoach Group Plc 2,815,859 290,590
15,863 Standard Chartered Plc 279,131 2,703
(154,565) Standard Chartered Plc (2,719,780) 25,426
297,612 Standard Life Plc 1,259,997 29,777
(13,435) SuperGroup (195,178) (12,455)
(259,265) Synthomer Plc (729,067) 12,141
58,441 TalkTalk Telecom Group Plc 190,443 (2,648)
187,362 Tate & Lyle Plc 1,761,490 10,757
2,413 Taylor Wimpey Plc 3,091 87
(5,265) Ted Baker Plc (127,193) (14,463)
215,333 Telecity Group Plc 1,817,619 (132,480)
(764,137) Tesco Plc (3,198,420) 102,019
399,544 Thomas Cook Group Plc 846,732 155,595
(1,270) Thomas Cook Group Plc (2,691) (549)
(4,305) Travis Perkins Plc (93,094) 1,244
294,489 Trinity Mirror Plc 639,123 139,596
(230,036) TT electronics Plc (546,528) (49,809)
800,014 TUI Travel Plc 3,549,351 2,289
(6,612) Tullett Prebon Plc (26,469) (1,795)
5 Tullett Prebon Plc 20 (1)
179,324 Tullow Oil Plc 1,877,551 (145,401)
(42,189) Tullow Oil Plc (441,726) 51,779
(68,743) Tyman Plc (192,723) (8,188)
54,391 UBM Plc 445,725 (12,259)
(41,067) Ultra Electronics Holdings Plc (910,252) 10,305
5,858 Unite Group 27,882 (256)
188,432 United Utilities Group Plc 1,495,523 (30,439)
86,872 Vedanta Resources Plc 928,339 (187,601)
(367,823) Vesuvius Plc (2,167,606) (156,804)
43,818 Victrex Plc 854,428 24,615
(10,352) Vodafone Group Plc (28,464) 446
5,273 Weir Group Plc/The 136,377 (89)
(18,690) Weir Group Plc/The (483,384) 34,711
(13,273) Whitbread Plc (570,066) (29,744)
287,820 William Hill Plc 1,326,364 (160)
(846,229) WM Morrison Supermarkets Plc (2,696,657) 139,951
669,383 WM Morrison Supermarkets Plc 2,133,106 (64,553)
28,434 Wolseley Plc 1,133,136 19,018
(19,841) Wolseley Plc (790,693) (28,647)
717 WS Atkins Plc 11,571 113
153,332 Xaar Plc 1,859,478 286,758
1,080,052 Xchanging Plc 1,974,417 248,322
(1,686,969) 788,903
Total market value
(EUR underlying exposure – EUR 1,012,023,499) 1,736,298 3,896,656
Contracts For Difference as at 30 November 2013
United Kingdom continued United Kingdom continued
Open Forward Foreign Exchange Transactionsas at 30 November 2013
Purchases Sales Value Date
Unrealised appreciation/
(depreciation)EUR
CHF 177,431 EUR 143,999 13/12/2013 301
EUR 484 CHF 596 13/12/2013 (1)
EUR 437,886 GBP 368,026 13/12/2013 (3,977)
EUR 967,637 SEK 8,642,641 13/12/2013 (3,045)
GBP 8,114,911 EUR 9,633,751 13/12/2013 109,251
SEK 347,636,942 EUR 38,957,593 13/12/2013 86,535
USD 2,596,891 EUR 1,939,720 13/12/2013 (30,157)
Net unrealised appreciation
(EUR underlying exposure – EUR 52,254,020) 158,907
Note: The net unrealised appreciation attributed to these transactions is included
in the Statement of Net Assets (see Note 2(d)).
State Street Bank and Trust Company is the counterparty to these Open Forward Foreign
Exchange Transactions.
Sector Breakdownas at 30 November 2013
% of netassets *
Financial 77.65
Funds 6.95
Government 3.21
Other Net Assets 12.19
100.00
* Based on the market value of the Portfolio of Investments

Transferable Securities and Money Market Instruments Admitted to an Official Stock Exchange Listing or Dealt in on Another Regulated Market
Transferable Securities and Money Market Instruments Admitted to an Official Stock Exchange Listing or Dealt in on Another Regulated Market
Holding Description Market Value
(EUR) % Holding Description Market Value
(EUR) %
1 This fund is managed by BlackRock.
Unaudited Interim Report and Accounts 103
The notes on pages 150 to 158 form an integral part of these financial statements.
BlackRock European Opportunities Extension Fund
COMMON / PREFERRED STOCKS (SHARES)
Belgium 14,558 Anheuser-Busch InBev NV 1,096,508 1.94
39,911 KBC Groep NV 1,680,453 2.98
7,502 Kinepolis Group NV 831,972 1.47
37,362 Melexis NV 872,029 1.54
4,480,962 7.93
Denmark 111,504 GN Store Nord A/S 1,964,309 3.48
45,436 Matas A/S 843,673 1.49
10,140 Novo Nordisk A/S 'B' 1,329,538 2.35
16,063 Novozymes A/S 'B' 458,702 0.81
18,919 Pandora A/S 719,838 1.27
5,905 Royal UNIBREW 602,461 1.07
5,918,521 10.47
France 16,607 Alten SA 546,370 0.97
11,786 Legrand SA 480,751 0.85
3,703 Unibail-Rodamco SE (traded in France)
(Reit) 713,013 1.26
597 Unibail-Rodamco SE (traded in
Netherlands) (Reit) 114,952 0.20
1,855,086 3.28
Germany 6,857 Bayer AG 671,574 1.19
8,871 Continental AG 1,359,481 2.41
7,463 Sartorius AG -Pref- 611,220 1.08
31,331 SHW AG 1,322,168 2.34
4,857 Volkswagen AG 922,587 1.63
4,887,030 8.65
Ireland 39,151 Irish Continental Group Plc 957,242 1.70
51,087 Kingspan Group Plc 656,468 1.16
1,613,710 2.86
Italy 30,213 Atlantia SpA 501,838 0.89
68,402 Azimut Holding SpA 1,293,482 2.29
56,018 Banca Generali SpA 1,171,896 2.07
52,403 Ei Towers SpA 1,765,457 3.13
846,314 Telecom Italia SpA 605,538 1.07
5,338,211 9.45
Jersey 14,999 WANdisco Plc 265,098 0.47
265,098 0.47
Netherlands 17,094 ASML Holding NV 1,180,512 2.09
23,014 Beter Bed Holding NV 379,501 0.67
164,553 ING Groep NV - CVA 1,579,544 2.80
41,429 Koninklijke Boskalis Westminster NV 1,528,523 2.70
68,350 Reed Elsevier NV 1,077,879 1.91
27,439 Ziggo NV 864,054 1.53
6,610,013 11.70
Norway 16,662 Algeta ASA 705,428 1.25
705,428 1.25
Sweden 29,455 Assa Abloy AB 'B' 1,098,214 1.94
51,854 Hexagon AB 'B' 1,182,495 2.09
154,028 Nordea Bank AB 1,456,045 2.58
3,736,754 6.61
Switzerland 30,399 Actelion Ltd 1,883,661 3.33
11,413 Adecco SA 651,517 1.15
3,897 Bossard Holding 'BR' 621,436 1.10
1,724 Burckhardt Compression Holding AG 527,475 0.93
22,575 Cembra Money Bank AG 1,038,123 1.84
33,868 Novartis AG 1,969,174 3.49
8,525 Roche Holding AG 1,748,348 3.09
18,202 U-Blox AG 1,296,617 2.30
106,176 UBS AG 1,498,872 2.65
11,235,223 19.88
United Kingdom 52,010 Merlin Entertainments Plc'144A' 221,412 0.39
128,555 Restaurant Group Plc 892,954 1.58
1,114,366 1.97
Total Common / Preferred Stocks (Shares) 47,760,402 84.52
Total Transferable Securities and Money
Market Instruments Admitted to an
Official Stock Exchange Listing or
Dealt in on Another Regulated Market 47,760,402 84,52
FUNDS
Ireland 5,092,202 Institutional Cash Series Plc -
Institutional Euro Assets
Liquidity Fund 1 5,092,202 9.01
5,092,202 9.01
Total Funds 5,092,202 9.01
Securities portfolio at market value 52,852,604 93.53
Other Net Assets 3,656,378 6.47
Total Net Assets (EUR) 56,508,982 100.00
Portfolio of Investments as at 30 November 2013

Holding DescriptionMarket Value
EUR
Unrealisedappreciation/
(depreciation) EUR Holding Description
Market ValueEUR
Unrealisedappreciation/
(depreciation) EUR
104 BlackRock Strategic Funds (BSF)
BlackRock European Opportunities Extension Fund continued
Belgium (5,775) Barco NV (323,400) (2,599)
(11,261) Umicore SA (371,500) 2,972
(694,900) 373
Denmark (31,609) Bang & Olufsen A/S (202,988) 16,597
(7,216) FLSmidth & Co A/S 'C' (278,137) (4,256)
(12,403) H Lundbeck A/S 'C' (199,541) (3,368)
(13,747) SimCorp A/SSimCorp A/SSimCorp A/S (344,646) (16,904)
(1,025,312) (7,931)
Finland (25,934) Neste Oil OYJ (365,151) 13,509
(511,713) Outokumpu OYJ (197,009) (1,324)
(23,845) Outotec OYJ (179,076) 23,660
(23,881) Stockmann OYJ Abp 'B' (270,094) 4,933
(1,011,330) 40,778
France (32,153) Air France KLM 'C' (246,839) (12,155)
(2,708) Air Liquide SA (278,112) (4,447)
27,839 Cap Gemini SA 1,340,030 61,087
(2,857) Dassault Systemes SA (241,045) 13,802
(8,463) Delticom AG (294,005) 15,684
(6,555) Nexans SA (217,298) (7,201)
(9,804) Nutreco NV (345,591) 10,947
(89,514) Nyrstar NV (199,616) 20,201
(4,568) Sodexo (337,118) (9,781)
(13,655) Suedzucker AG (252,481) 35,296
(8,512) Vallourec SA (356,780) 2,692
(26,311) Veolia Environnement SA (314,680) 4,180
39,271 Vinci SA 1,864,784 69,193
121,249 199,498
Germany (20,728) Bauer AG (389,065) (8,643)
(12,429) Carl Zeiss Meditec AG (294,505) 4,143
(11,471) Deutsche Bank AG (408,826) (12,084)
(33,644) Distribuidora Internacional de
Alimentacion SA (228,241) (14,106)
(10,328) Gerry Weber International AG (318,980) (4,805)
65,374 Grifols SA 1,643,502 134,935
(4,770) HeidelbergCement AG (275,229) (5,620)
(3,768) Hochtief AG (245,108) (9,706)
1,976 Inditex SA 232,476 17,214
52,437 Jeronimo Martins SGPS SA 797,305 10,391
55,522 JUMBO SA 626,843 89,836
4,168 L'Oreal SA 515,790 (3,905)
(3,262) MTU Aero Engines AG (225,633) 7,496
96,099 OPAP SA 939,848 70,109
28,014 Rexel SA 524,702 15,396
(7,081) Software AG (199,932) (12,197)
(220,305) SOITEC (326,051) 34,523
(11,497) ThromboGenics NV (204,474) 30,189
(17,261) ThyssenKrupp AG (334,346) (3,275)
(28,175) TNT Express NV (189,195) 1,246
1,640,881 341,137
Ireland 337,368 Ryanair Holdings Plc 2,074,813 115,796
2,074,813 115,796
Italy (890,323) Banca Monte dei Paschi di Siena SpA (166,223) 26,935
(75,755) Fiat SpA (444,682) (14,739)
(115,546) Geox SpA (293,256) (52,421)
(3,144) Tod's SpA (394,886) (29,255)
(1,299,047) (69,480)
Netherlands (27,808) BinckBank NV (210,507) (15,830)
(5,050) Fugro NV (226,594) 12,572
(10,214) Koninklijke Vopak NV (448,292) 4,018
(13,642) SNS REAAL NV – 12,414
(885,393) 13,174
Norway (14,118) Norwegian Air Shuttle AS (390,380) (6,611)
(9,604) Yara International ASA (308,685) (4,609)
(699,065) (11,220)
Spain (51,461) Prosegur Cia de Seguridad SA (241,352) (17,988)
(241,352) (17,988)
Sweden (33,072) Elekta AB (366,039) (1,219)
(366,039) (1,219)
Switzerland (511) Kaba Holding AG (168,396) (3,073)
(2,561) Sulzer AG (294,683) (2,893)
(1,227) Syngenta AG (355,408) 4,037
(818,487) (1,929)
United Kingdom (60,815) Ashmore Group Plc (288,871) (9,859)
(51,483) BAE Systems Plc (267,972) 4,123
165,826 Barratt Developments Plc 659,447 79,808
205,589 BTG Plc 1,377,434 292,070
(78,541) Cape Plc (261,696) (8,723)
(67,918) Cobham Plc (216,351) 14,697
31,590 Compass Group Plc 351,235 26,051
104,407 Daily Mail & General Trust Plc 1,147,991 143,096
(71,761) Dart Group Plc (196,885) (5,579)
30,786 Dechra Pharmaceuticals Plc 253,949 13,523
121,633 Diploma Plc 1,025,970 82,253
(23,613) easyJet Plc (404,020) (53,728)
68,022 Experian Plc 928,230 (47,635)
70,898 Imperial Tobacco Group Plc 1,977,516 (26,898)
449,397 ITV Plc 1,028,304 58,867
(103,954) J Sainsbury Plc (508,959) (3,600)
21,561 Johnson Matthey Plc 826,100 76,353
(123,541) Ladbrokes Plc (261,072) 12,271
(129,280) Mcbride Plc (169,198) 6,100
(1,961,487) McBride Plc (2,355) (2,355)
Contracts For Difference as at 30 November 2013

Holding DescriptionMarket Value
EUR
Unrealisedappreciation/
(depreciation) EUR Holding Description
Market ValueEUR
Unrealisedappreciation/
(depreciation) EUR
Note: The net unrealised appreciation attributed to these transactions is included in the Statement of Net Assets (see Note 2(d)).
Deutsche Bank and JP Morgan are the counterparties to these Contracts for Difference.
Unaudited Interim Report and Accounts 105
The notes on pages 150 to 158 form an integral part of these financial statements.
Open Forward Foreign Exchange Transactionsas at 30 November 2013
Purchases Sales Value Date
Unrealised appreciation/
(depreciation)EUR
EUR 3,786,410 CHF 4,666,807 13/12/2013 (8,966)
EUR 4,179,744 DKK 31,171,152 13/12/2013 112
EUR 253,905 SEK 2,280,567 13/12/2013 (2,232)
GBP 12,989,767 EUR 15,479,690 13/12/2013 116,208
NOK 1,146,304 EUR 137,362 13/12/2013 580
Net unrealised appreciation
(EUR underlying exposure – EUR 23,964,984) 105,702
Note: The net unrealised appreciation attributed to these transactions is included
in the Statements of Net Assets (see note 2(d)).
State Street Bank London is the counterparty to these Open Forward Foreign
Exchange Transactions.
Sector Breakdownas at 30 November 2013
% of netassets *
Consumer, Non-cyclical 19.75
Financial 18.67
Industrial 13.55
Communications 13.42
Consumer, Cyclical 13.25
Funds 9.01
Technology 5.07
Basic Materials 0.81
Other Net Assets 6.47
100.00
* Based on the market value of the Portfolio of Investments
BlackRock European Opportunities Extension Fund continued
352,020 National Express Group Plc 1,110,784 22,717
(254,783) New World Resources Plc 'A' (233,264) 9,751
(76,052) Partnership Assurance Group Plc (281,984) 55,158
175,998 SIG Plc 453,286 36,833
30,181 Spirax-Sarco Engineering Plc 1,066,862 5,386
210,346 Sports Direct International Plc 1,872,533 170,696
348,705 Vodafone Group Plc 956,670 51,914
(76,450) WM Morrison Supermarkets Plc (243,529) 12,720
(139,725) Wolfson Microelectronics Plc 'C' (247,358) (2,803)
11,452,797 1,013,207
United States (78,742) Turkiye Garanti Bankasi AS (219,183) 13
(219,183) 13
Total market value
(EUR underlying exposure – EUR 43,090,615) 8,029,632 1,614,209
Contracts For Difference as at 30 November 2013
United Kingdom continued

Transferable Securities and Money Market Instruments Admitted to an Official Stock Exchange Listing or Dealt in on Another Regulated Market
Transferable Securities and Money Market Instruments Admitted to an Official Stock Exchange Listing or Dealt in on Another Regulated Market
Holding Description Market Value
(EUR) % Holding Description Market Value
(EUR) %
106 BlackRock Strategic Funds (BSF)
BONDS
Australia AUD 3,105,000 Australia Government Bond 4.50%
21/4/2033 1,991,128 1.11
USD 597,000 CNOOC Curtis Funding No 1 Ltd
4.50% 3/10/2023 443,468 0.24
AUD 800,000 Holcim Finance Australia Pty Ltd
7.00% 27/3/2015 555,545 0.31
2,990,141 1.66
Austria EUR 400,000 BAWAG PSK Bank fuer Arbeit und
Wirtschaft und Oesterreichische
Postsparkasse AG 8.125%
30/10/2023 417,300 0.23
EUR 300,000 Kommunalkredit Austria AG 1.625%
25/9/2018 305,826 0.17
EUR 400,000 UNIQA Insurance Group AG FRN
31/7/2043 431,106 0.24
1,154,232 0.64
Belgium EUR 4,150,000 Belgium Government Bond 2.25%
22/6/2023 4,114,767 2.29
EUR 937,000 UCB SA 4.125% 4/1/2021 972,620 0.54
5,087,387 2.83
British Virgin Islands USD 405,000 CNPC General Capital Ltd 3.40%
16/4/2023 278,680 0.16
278,680 0.16
Cayman Islands USD 200,000 China Resources Land Ltd 4.625%
19/5/2016 153,361 0.09
EUR 880,000 IPIC GMTN Ltd 2.375% 30/5/2018 901,938 0.50
GBP 210,689 Punch Taverns Finance B Ltd
7.369% 30/6/2022 261,829 0.15
GBP 446,964 Punch Taverns Finance B Ltd FRN
30/6/2033 512,523 0.28
1,829,651 1.02
Croatia USD 500,000 Croatia Government International
Bond 6.00% 26/1/2024 360,081 0.20
360,081 0.20
Denmark DKK 14,155 Nordea Kredit Realkredit 3.00%
1/10/2044 1,823 0.00
1,823 0.00
France EUR 600,000 BPCE SA 1.75% 14/3/2016 610,788 0.34
EUR 500,000 Caisse Francaise de Financement
Local 3.00% 2/10/2028 508,875 0.28
EUR 1,000,000 Dexia Credit Local SA 1.625%
29/10/2018 1,015,225 0.57
EUR 263,611 FCT Copernic 2012-1 'A1' FRN
25/9/2029 264,818 0.15
EUR 690,000 GDF Suez 1.50% 1/2/2016 703,031 0.39
EUR 400,000 Imerys SA 2.50% 26/11/2020 400,764 0.22
EUR 450,000 Kering 8.625% 3/4/2014 462,019 0.26
EUR 270,000 Kering 3.75% 8/4/2015 281,129 0.16
EUR 900,000 Master Credit Cards Pass
Compartment France 2013-1
'A' FRN 25/10/2025 900,810 0.50
EUR 1,500,000 Societe Generale SFH 1.625%
5/1/2021 1,496,910 0.83
6,644,369 3.70
Germany EUR 700,000 Allianz SE FRN (Perpetual) 720,839 0.40
EUR 2,195,000 Bundesrepublik Deutschland
4.75% 4/7/2034 2,962,207 1.65
EUR 1,760,000 Bundesrepublik Deutschland
2.50% 4/7/2044 1,714,346 0.95
EUR 2,782,982 Bundesrepublik Deutschland
Bundesobligation Inflation
Linked Bond 0.75% 15/4/2018 2,920,948 1.63
EUR 196,000 Daimler AG 1.75% 21/5/2015 199,480 0.11
EUR 10,000,000 German Treasury Bill 0.00%
26/3/2014 (Zero Coupon) 9,998,500 5.56
EUR 300,000 Red & Black Auto Germany 2 'A'
FRN 15/9/2022 300,200 0.17
EUR 400,000 RWE AG FRN (Perpetual) 406,360 0.23
EUR 400,000 SAP AG 1.00% 13/11/2015 402,626 0.22
EUR 791,216 SC Germany auto 2013-2 UG A'
FRN 12/3/2023 792,513 0.44
EUR 100,000 Trionista Holdco GmbH 5.00%
30/4/2020 101,780 0.06
20,519,799 11.42
Hungary USD 454,000 Hungary Government International
Bond 5.75% 22/11/2023 331,083 0.18
331,083 0.18
Ireland EUR 100,000 Ardagh Packaging Finance Plc
7.375% 15/10/2017 107,203 0.06
EUR 535,000 Bank of Ireland 2.75% 5/6/2016 537,737 0.30
EUR 1,010,000 Bank of Ireland Mortgage Bank
1.875% 13/5/2017 1,015,626 0.57
EUR 900,000 Caterpillar International Finance
Ltd 1.375% 18/5/2015 910,651 0.51
EUR 190,761 Cornerstone Titan 2007-1 Plc 'A1'
FRN 23/1/2017 187,975 0.10
EUR 500,000 Epic Value Retail Ltd 'C' FRN
26/7/2019 493,575 0.27
EUR 1,135,000 ESB Finance Ltd 3.494% 12/1/2024 1,148,342 0.64
EUR 180,000 German Residential Funding
2013-2 Ltd 'A' FRN 27/11/2024 180,427 0.10
EUR 244,000 German Residential Funding
2013-2 Ltd 'B' FRN 27/11/2024 244,616 0.14
EUR 318,000 German Residential Funding
2013-2 Ltd 'E' FRN 27/11/2024 319,112 0.18
EUR 229,434 German Residential Funding
Plc 'A' FRN 27/8/2024 231,602 0.13
EUR 114,470 German Residential Funding
Plc 'B' FRN 27/8/2024 115,436 0.06
EUR 144,643 German Residential Funding
Plc 'D' FRN 27/8/2024 148,220 0.08
BlackRock Fixed Income Strategies Fund
Portfolio of Investments as at 30 November 2013
France continued
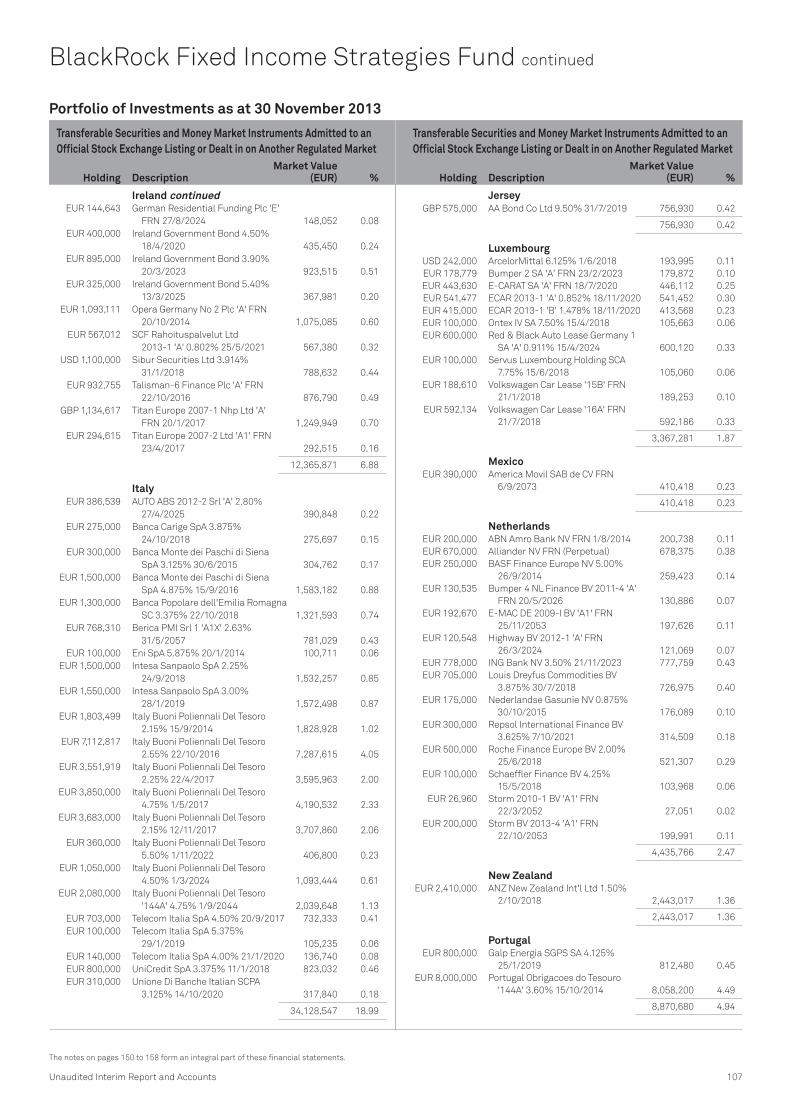
Transferable Securities and Money Market Instruments Admitted to an Official Stock Exchange Listing or Dealt in on Another Regulated Market
Transferable Securities and Money Market Instruments Admitted to an Official Stock Exchange Listing or Dealt in on Another Regulated Market
Holding Description Market Value
(EUR) % Holding Description Market Value
(EUR) %
Unaudited Interim Report and Accounts 107
The notes on pages 150 to 158 form an integral part of these financial statements.
BlackRock Fixed Income Strategies Fund continued
EUR 144,643 German Residential Funding Plc 'E'
FRN 27/8/2024 148,052 0.08
EUR 400,000 Ireland Government Bond 4.50%
18/4/2020 435,450 0.24
EUR 895,000 Ireland Government Bond 3.90%
20/3/2023 923,515 0.51
EUR 325,000 Ireland Government Bond 5.40%
13/3/2025 367,981 0.20
EUR 1,093,111 Opera Germany No 2 Plc 'A' FRN
20/10/2014 1,075,085 0.60
EUR 567,012 SCF Rahoituspalvelut Ltd
2013-1 'A' 0.802% 25/5/2021 567,380 0.32
USD 1,100,000 Sibur Securities Ltd 3.914%
31/1/2018 788,632 0.44
EUR 932,755 Talisman-6 Finance Plc 'A' FRN
22/10/2016 876,790 0.49
GBP 1,134,617 Titan Europe 2007-1 Nhp Ltd 'A'
FRN 20/1/2017 1,249,949 0.70
EUR 294,615 Titan Europe 2007-2 Ltd 'A1' FRN
23/4/2017 292,515 0.16
12,365,871 6.88
Italy EUR 386,539 AUTO ABS 2012-2 Srl 'A' 2.80%
27/4/2025 390,848 0.22
EUR 275,000 Banca Carige SpA 3.875%
24/10/2018 275,697 0.15
EUR 300,000 Banca Monte dei Paschi di Siena
SpA 3.125% 30/6/2015 304,762 0.17
EUR 1,500,000 Banca Monte dei Paschi di Siena
SpA 4.875% 15/9/2016 1,583,182 0.88
EUR 1,300,000 Banca Popolare dell'Emilia Romagna
SC 3.375% 22/10/2018 1,321,593 0.74
EUR 768,310 Berica PMI Srl 1 'A1X' 2.63%
31/5/2057 781,029 0.43
EUR 100,000 Eni SpA 5.875% 20/1/2014 100,711 0.06
EUR 1,500,000 Intesa Sanpaolo SpA 2.25%
24/9/2018 1,532,257 0.85
EUR 1,550,000 Intesa Sanpaolo SpA 3.00%
28/1/2019 1,572,498 0.87
EUR 1,803,499 Italy Buoni Poliennali Del Tesoro
2.15% 15/9/2014 1,828,928 1.02
EUR 7,112,817 Italy Buoni Poliennali Del Tesoro
2.55% 22/10/2016 7,287,615 4.05
EUR 3,551,919 Italy Buoni Poliennali Del Tesoro
2.25% 22/4/2017 3,595,963 2.00
EUR 3,850,000 Italy Buoni Poliennali Del Tesoro
4.75% 1/5/2017 4,190,532 2.33
EUR 3,683,000 Italy Buoni Poliennali Del Tesoro
2.15% 12/11/2017 3,707,860 2.06
EUR 360,000 Italy Buoni Poliennali Del Tesoro
5.50% 1/11/2022 406,800 0.23
EUR 1,050,000 Italy Buoni Poliennali Del Tesoro
4.50% 1/3/2024 1,093,444 0.61
EUR 2,080,000 Italy Buoni Poliennali Del Tesoro
'144A' 4.75% 1/9/2044 2,039,648 1.13
EUR 703,000 Telecom Italia SpA 4.50% 20/9/2017 732,333 0.41
EUR 100,000 Telecom Italia SpA 5.375%
29/1/2019 105,235 0.06
EUR 140,000 Telecom Italia SpA 4.00% 21/1/2020 136,740 0.08
EUR 800,000 UniCredit SpA 3.375% 11/1/2018 823,032 0.46
EUR 310,000 Unione Di Banche Italian SCPA
3.125% 14/10/2020 317,840 0.18
34,128,547 18.99
Jersey GBP 575,000 AA Bond Co Ltd 9.50% 31/7/2019 756,930 0.42
756,930 0.42
Luxembourg USD 242,000 ArcelorMittal 6.125% 1/6/2018 193,995 0.11
EUR 178,779 Bumper 2 SA 'A' FRN 23/2/2023 179,872 0.10
EUR 443,630 E-CARAT SA 'A' FRN 18/7/2020 446,112 0.25
EUR 541,477 ECAR 2013-1 'A' 0.852% 18/11/2020 541,452 0.30
EUR 415,000 ECAR 2013-1 'B' 1.478% 18/11/2020 413,568 0.23
EUR 100,000 Ontex IV SA 7.50% 15/4/2018 105,663 0.06
EUR 600,000 Red & Black Auto Lease Germany 1
SA 'A' 0.911% 15/4/2024 600,120 0.33
EUR 100,000 Servus Luxembourg Holding SCA
7.75% 15/6/2018 105,060 0.06
EUR 188,610 Volkswagen Car Lease '15B' FRN
21/1/2018 189,253 0.10
EUR 592,134 Volkswagen Car Lease '16A' FRN
21/7/2018 592,186 0.33
3,367,281 1.87
Mexico EUR 390,000 America Movil SAB de CV FRN
6/9/2073 410,418 0.23
410,418 0.23
Netherlands EUR 200,000 ABN Amro Bank NV FRN 1/8/2014 200,738 0.11
EUR 670,000 Alliander NV FRN (Perpetual) 678,375 0.38
EUR 250,000 BASF Finance Europe NV 5.00%
26/9/2014 259,423 0.14
EUR 130,535 Bumper 4 NL Finance BV 2011-4 'A'
FRN 20/5/2026 130,886 0.07
EUR 192,670 E-MAC DE 2009-I BV 'A1' FRN
25/11/2053 197,626 0.11
EUR 120,548 Highway BV 2012-1 'A' FRN
26/3/2024 121,069 0.07
EUR 778,000 ING Bank NV 3.50% 21/11/2023 777,759 0.43
EUR 705,000 Louis Dreyfus Commodities BV
3.875% 30/7/2018 726,975 0.40
EUR 175,000 Nederlandse Gasunie NV 0.875%
30/10/2015 176,089 0.10
EUR 300,000 Repsol International Finance BV
3.625% 7/10/2021 314,509 0.18
EUR 500,000 Roche Finance Europe BV 2.00%
25/6/2018 521,307 0.29
EUR 100,000 Schaeffler Finance BV 4.25%
15/5/2018 103,968 0.06
EUR 26,960 Storm 2010-1 BV 'A1' FRN
22/3/2052 27,051 0.02
EUR 200,000 Storm BV 2013-4 'A1' FRN
22/10/2053 199,991 0.11
4,435,766 2.47
New Zealand EUR 2,410,000 ANZ New Zealand Int'l Ltd 1.50%
2/10/2018 2,443,017 1.36
2,443,017 1.36
Portugal EUR 800,000 Galp Energia SGPS SA 4.125%
25/1/2019 812,480 0.45
EUR 8,000,000 Portugal Obrigacoes do Tesouro
'144A' 3.60% 15/10/2014 8,058,200 4.49
8,870,680 4.94
Portfolio of Investments as at 30 November 2013
Ireland continued
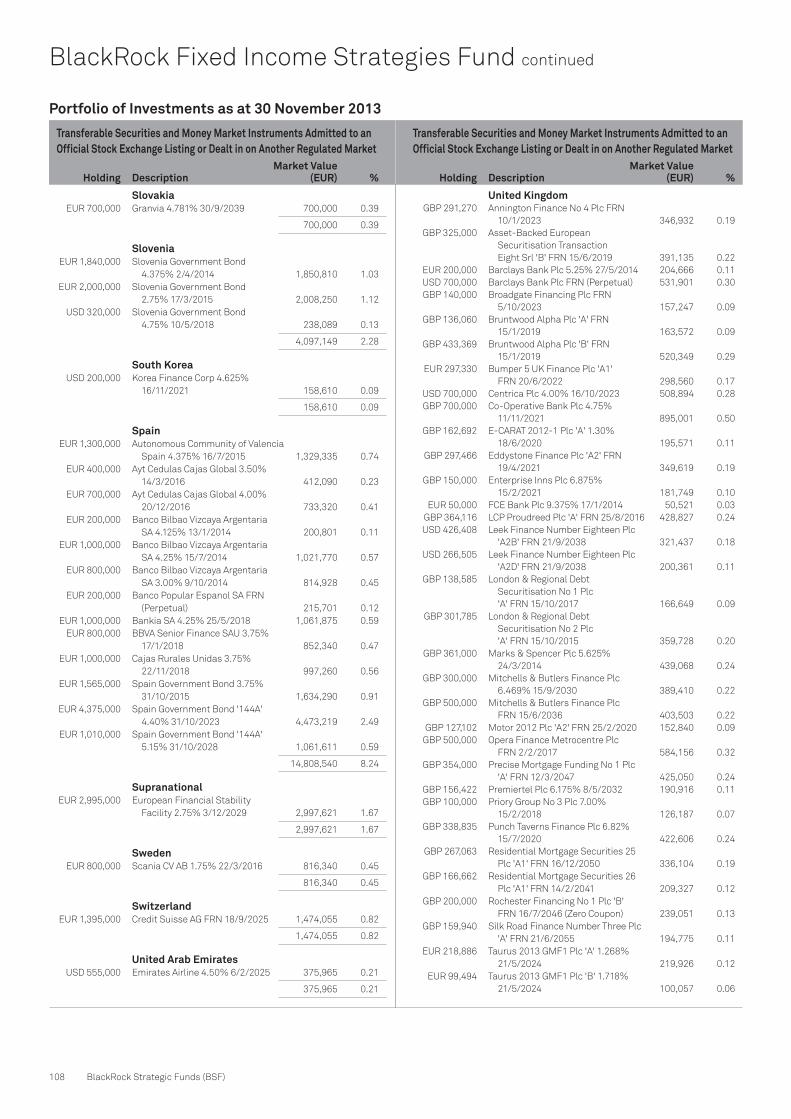
Transferable Securities and Money Market Instruments Admitted to an Official Stock Exchange Listing or Dealt in on Another Regulated Market
Transferable Securities and Money Market Instruments Admitted to an Official Stock Exchange Listing or Dealt in on Another Regulated Market
Holding Description Market Value
(EUR) % Holding Description Market Value
(EUR) %
108 BlackRock Strategic Funds (BSF)
BlackRock Fixed Income Strategies Fund continued
Slovakia EUR 700,000 Granvia 4.781% 30/9/2039 700,000 0.39
700,000 0.39
Slovenia EUR 1,840,000 Slovenia Government Bond
4.375% 2/4/2014 1,850,810 1.03
EUR 2,000,000 Slovenia Government Bond
2.75% 17/3/2015 2,008,250 1.12
USD 320,000 Slovenia Government Bond
4.75% 10/5/2018 238,089 0.13
4,097,149 2.28
South Korea USD 200,000 Korea Finance Corp 4.625%
16/11/2021 158,610 0.09
158,610 0.09
Spain EUR 1,300,000 Autonomous Community of Valencia
Spain 4.375% 16/7/2015 1,329,335 0.74
EUR 400,000 Ayt Cedulas Cajas Global 3.50%
14/3/2016 412,090 0.23
EUR 700,000 Ayt Cedulas Cajas Global 4.00%
20/12/2016 733,320 0.41
EUR 200,000 Banco Bilbao Vizcaya Argentaria
SA 4.125% 13/1/2014 200,801 0.11
EUR 1,000,000 Banco Bilbao Vizcaya Argentaria
SA 4.25% 15/7/2014 1,021,770 0.57
EUR 800,000 Banco Bilbao Vizcaya Argentaria
SA 3.00% 9/10/2014 814,928 0.45
EUR 200,000 Banco Popular Espanol SA FRN
(Perpetual) 215,701 0.12
EUR 1,000,000 Bankia SA 4.25% 25/5/2018 1,061,875 0.59
EUR 800,000 BBVA Senior Finance SAU 3.75%
17/1/2018 852,340 0.47
EUR 1,000,000 Cajas Rurales Unidas 3.75%
22/11/2018 997,260 0.56
EUR 1,565,000 Spain Government Bond 3.75%
31/10/2015 1,634,290 0.91
EUR 4,375,000 Spain Government Bond '144A'
4.40% 31/10/2023 4,473,219 2.49
EUR 1,010,000 Spain Government Bond '144A'
5.15% 31/10/2028 1,061,611 0.59
14,808,540 8.24
Supranational EUR 2,995,000 European Financial Stability
Facility 2.75% 3/12/2029 2,997,621 1.67
2,997,621 1.67
Sweden EUR 800,000 Scania CV AB 1.75% 22/3/2016 816,340 0.45
816,340 0.45
Switzerland EUR 1,395,000 Credit Suisse AG FRN 18/9/2025 1,474,055 0.82
1,474,055 0.82
United Arab Emirates USD 555,000 Emirates Airline 4.50% 6/2/2025 375,965 0.21
375,965 0.21
United Kingdom GBP 291,270 Annington Finance No 4 Plc FRN
10/1/2023 346,932 0.19
GBP 325,000 Asset-Backed European
Securitisation Transaction
Eight Srl 'B' FRN 15/6/2019 391,135 0.22
EUR 200,000 Barclays Bank Plc 5.25% 27/5/2014 204,666 0.11
USD 700,000 Barclays Bank Plc FRN (Perpetual) 531,901 0.30
GBP 140,000 Broadgate Financing Plc FRN
5/10/2023 157,247 0.09
GBP 136,060 Bruntwood Alpha Plc 'A' FRN
15/1/2019 163,572 0.09
GBP 433,369 Bruntwood Alpha Plc 'B' FRN
15/1/2019 520,349 0.29
EUR 297,330 Bumper 5 UK Finance Plc 'A1'
FRN 20/6/2022 298,560 0.17
USD 700,000 Centrica Plc 4.00% 16/10/2023 508,894 0.28
GBP 700,000 Co-Operative Bank Plc 4.75%
11/11/2021 895,001 0.50
GBP 162,692 E-CARAT 2012-1 Plc 'A' 1.30%
18/6/2020 195,571 0.11
GBP 297,466 Eddystone Finance Plc 'A2' FRN
19/4/2021 349,619 0.19
GBP 150,000 Enterprise Inns Plc 6.875%
15/2/2021 181,749 0.10
EUR 50,000 FCE Bank Plc 9.375% 17/1/2014 50,521 0.03
GBP 364,116 LCP Proudreed Plc 'A' FRN 25/8/2016 428,827 0.24
USD 426,408 Leek Finance Number Eighteen Plc
'A2B' FRN 21/9/2038 321,437 0.18
USD 266,505 Leek Finance Number Eighteen Plc
'A2D' FRN 21/9/2038 200,361 0.11
GBP 138,585 London & Regional Debt
Securitisation No 1 Plc
'A' FRN 15/10/2017 166,649 0.09
GBP 301,785 London & Regional Debt
Securitisation No 2 Plc
'A' FRN 15/10/2015 359,728 0.20
GBP 361,000 Marks & Spencer Plc 5.625%
24/3/2014 439,068 0.24
GBP 300,000 Mitchells & Butlers Finance Plc
6.469% 15/9/2030 389,410 0.22
GBP 500,000 Mitchells & Butlers Finance Plc
FRN 15/6/2036 403,503 0.22
GBP 127,102 Motor 2012 Plc 'A2' FRN 25/2/2020 152,840 0.09
GBP 500,000 Opera Finance Metrocentre Plc
FRN 2/2/2017 584,156 0.32
GBP 354,000 Precise Mortgage Funding No 1 Plc
'A' FRN 12/3/2047 425,050 0.24
GBP 156,422 Premiertel Plc 6.175% 8/5/2032 190,916 0.11
GBP 100,000 Priory Group No 3 Plc 7.00%
15/2/2018 126,187 0.07
GBP 338,835 Punch Taverns Finance Plc 6.82%
15/7/2020 422,606 0.24
GBP 267,063 Residential Mortgage Securities 25
Plc 'A1' FRN 16/12/2050 336,104 0.19
GBP 166,662 Residential Mortgage Securities 26
Plc 'A1' FRN 14/2/2041 209,327 0.12
GBP 200,000 Rochester Financing No 1 Plc 'B'
FRN 16/7/2046 (Zero Coupon) 239,051 0.13
GBP 159,940 Silk Road Finance Number Three Plc
'A' FRN 21/6/2055 194,775 0.11
EUR 218,886 Taurus 2013 GMF1 Plc 'A' 1.268%
21/5/2024 219,926 0.12
EUR 99,494 Taurus 2013 GMF1 Plc 'B' 1.718%
21/5/2024 100,057 0.06
Portfolio of Investments as at 30 November 2013
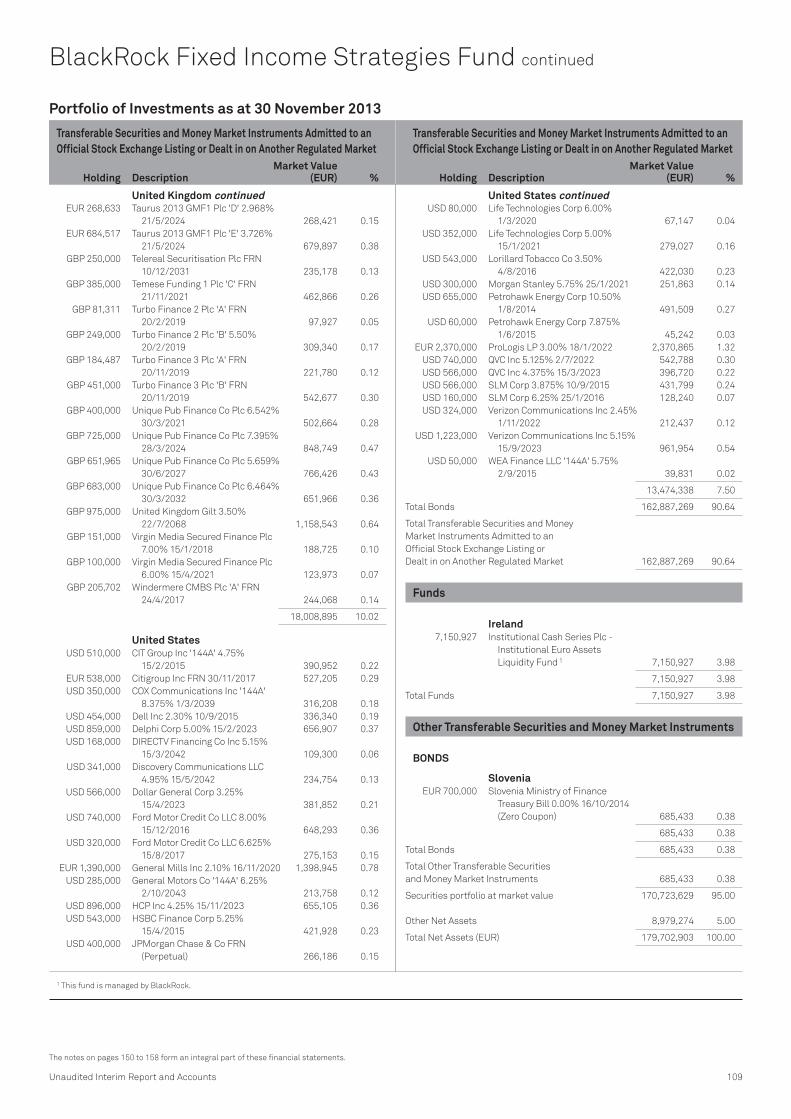
Transferable Securities and Money Market Instruments Admitted to an Official Stock Exchange Listing or Dealt in on Another Regulated Market
Transferable Securities and Money Market Instruments Admitted to an Official Stock Exchange Listing or Dealt in on Another Regulated Market
Holding Description Market Value
(EUR) % Holding Description Market Value
(EUR) %
1 This fund is managed by BlackRock.
Unaudited Interim Report and Accounts 109
The notes on pages 150 to 158 form an integral part of these financial statements.
BlackRock Fixed Income Strategies Fund continued
EUR 268,633 Taurus 2013 GMF1 Plc 'D' 2.968%
21/5/2024 268,421 0.15
EUR 684,517 Taurus 2013 GMF1 Plc 'E' 3.726%
21/5/2024 679,897 0.38
GBP 250,000 Telereal Securitisation Plc FRN
10/12/2031 235,178 0.13
GBP 385,000 Temese Funding 1 Plc 'C' FRN
21/11/2021 462,866 0.26
GBP 81,311 Turbo Finance 2 Plc 'A' FRN
20/2/2019 97,927 0.05
GBP 249,000 Turbo Finance 2 Plc 'B' 5.50%
20/2/2019 309,340 0.17
GBP 184,487 Turbo Finance 3 Plc 'A' FRN
20/11/2019 221,780 0.12
GBP 451,000 Turbo Finance 3 Plc 'B' FRN
20/11/2019 542,677 0.30
GBP 400,000 Unique Pub Finance Co Plc 6.542%
30/3/2021 502,664 0.28
GBP 725,000 Unique Pub Finance Co Plc 7.395%
28/3/2024 848,749 0.47
GBP 651,965 Unique Pub Finance Co Plc 5.659%
30/6/2027 766,426 0.43
GBP 683,000 Unique Pub Finance Co Plc 6.464%
30/3/2032 651,966 0.36
GBP 975,000 United Kingdom Gilt 3.50%
22/7/2068 1,158,543 0.64
GBP 151,000 Virgin Media Secured Finance Plc
7.00% 15/1/2018 188,725 0.10
GBP 100,000 Virgin Media Secured Finance Plc
6.00% 15/4/2021 123,973 0.07
GBP 205,702 Windermere CMBS Plc 'A' FRN
24/4/2017 244,068 0.14
18,008,895 10.02
United States USD 510,000 CIT Group Inc '144A' 4.75%
15/2/2015 390,952 0.22
EUR 538,000 Citigroup Inc FRN 30/11/2017 527,205 0.29
USD 350,000 COX Communications Inc '144A'
8.375% 1/3/2039 316,208 0.18
USD 454,000 Dell Inc 2.30% 10/9/2015 336,340 0.19
USD 859,000 Delphi Corp 5.00% 15/2/2023 656,907 0.37
USD 168,000 DIRECTV Financing Co Inc 5.15%
15/3/2042 109,300 0.06
USD 341,000 Discovery Communications LLC
4.95% 15/5/2042 234,754 0.13
USD 566,000 Dollar General Corp 3.25%
15/4/2023 381,852 0.21
USD 740,000 Ford Motor Credit Co LLC 8.00%
15/12/2016 648,293 0.36
USD 320,000 Ford Motor Credit Co LLC 6.625%
15/8/2017 275,153 0.15
EUR 1,390,000 General Mills Inc 2.10% 16/11/2020 1,398,945 0.78
USD 285,000 General Motors Co '144A' 6.25%
2/10/2043 213,758 0.12
USD 896,000 HCP Inc 4.25% 15/11/2023 655,105 0.36
USD 543,000 HSBC Finance Corp 5.25%
15/4/2015 421,928 0.23
USD 400,000 JPMorgan Chase & Co FRN
(Perpetual) 266,186 0.15
USD 80,000 Life Technologies Corp 6.00%
1/3/2020 67,147 0.04
USD 352,000 Life Technologies Corp 5.00%
15/1/2021 279,027 0.16
USD 543,000 Lorillard Tobacco Co 3.50%
4/8/2016 422,030 0.23
USD 300,000 Morgan Stanley 5.75% 25/1/2021 251,863 0.14
USD 655,000 Petrohawk Energy Corp 10.50%
1/8/2014 491,509 0.27
USD 60,000 Petrohawk Energy Corp 7.875%
1/6/2015 45,242 0.03
EUR 2,370,000 ProLogis LP 3.00% 18/1/2022 2,370,865 1.32
USD 740,000 QVC Inc 5.125% 2/7/2022 542,788 0.30
USD 566,000 QVC Inc 4.375% 15/3/2023 396,720 0.22
USD 566,000 SLM Corp 3.875% 10/9/2015 431,799 0.24
USD 160,000 SLM Corp 6.25% 25/1/2016 128,240 0.07
USD 324,000 Verizon Communications Inc 2.45%
1/11/2022 212,437 0.12
USD 1,223,000 Verizon Communications Inc 5.15%
15/9/2023 961,954 0.54
USD 50,000 WEA Finance LLC '144A' 5.75%
2/9/2015 39,831 0.02
13,474,338 7.50
Total Bonds 162,887,269 90.64
Total Transferable Securities and Money
Market Instruments Admitted to an
Official Stock Exchange Listing or
Dealt in on Another Regulated Market 162,887,269 90.64
Funds
Ireland 7,150,927 Institutional Cash Series Plc -
Institutional Euro Assets
Liquidity Fund 1 7,150,927 3.98
7,150,927 3.98
Total Funds 7,150,927 3.98
Other Transferable Securities and Money Market Instruments
BONDS
Slovenia EUR 700,000 Slovenia Ministry of Finance
Treasury Bill 0.00% 16/10/2014
(Zero Coupon) 685,433 0.38
685,433 0.38
Total Bonds 685,433 0.38
Total Other Transferable Securities
and Money Market Instruments 685,433 0.38
Securities portfolio at market value 170,723,629 95.00
Other Net Assets 8,979,274 5.00
Total Net Assets (EUR) 179,702,903 100.00
Portfolio of Investments as at 30 November 2013
United Kingdom continued United States continued

110 BlackRock Strategic Funds (BSF)
BlackRock Fixed Income Strategies Fund continued
Open Exchange Traded Futures Contractsas at 30 November 2013
Number of Contracts
Contract/Description
Expirationdate
Underlying exposure
EUR
Unrealised appreciation/
(depreciation) EUR
60 3 Month Euribor Interest
Rate June 2014 59,961,750 1,500
(60) 3 Month Euribor Interest
Rate June 2015 59,938,500 (8,250)
(44) Australian 10 Year Bond December 2013 3,387,088 2,604
76 Australian 3 Year Bond December 2013 5,515,491 4,560
(66) Euro BTP December 2013 7,457,207 (55,740)
(219) German Euro BOBL December 2013 25,578,106 (60,400)
(261) German Euro Bund December 2013 26,693,254 (47,180)
(71) German Euro Schatz December 2013 7,118,815 (1,880)
(22) Short Euro BTP December 2013 2,321,154 (34,790)
(27) UK Long Gilt Bond March 2014 3,893,855 7,456
(1) Ultra US Long Treasury
Bond March 2014 83,434 (103)
(144) US Treasury 10 Year Note March 2014 11,670,992 16,464
(92) US Treasury 5 Year Note March 2014 6,710,292 2,350
Total 220,329,938 (173,410)
Note: The net unrealised depreciation attributed to these transactions is included
in the Statement of Net Assets (see note 2(d)).
Sector Breakdownas at 30 November 2013
% of netassets *
Government 42.14
Financial 20.99
Mortgage Securities 6.68
Asset Backed Securities 5.50
Consumer, Cyclical 5.08
Funds 3.98
Consumer, Non-cyclical 2.59
Utilities 2.02
Communications 1.98
Energy 1.83
Industrial 1.04
Diversified 0.51
Technology 0.41
Basic Materials 0.25
Other Net Assets 5.00
100.00
* Based on the market value of the Portfolio of Investments
Open Forward Foreign Exchange Transactionsas at 30 November 2013
Purchases Sales Value date
Unrealised appreciation/
(depreciation)EUR
EUR 2,571,138 AUD 3,780,000 12/12/2013 39,762
EUR 113,029 CHF 140,000 12/12/2013 (828)
DKK 45,410,000 EUR 6,089,662 12/12/2013 (879)
EUR 6,274,964 DKK 46,790,000 12/12/2013 1,144
EUR 17,867,901 GBP 15,065,000 12/12/2013 (219,699)
GBP 1,240,000 EUR 1,470,248 12/12/2013 18,543
EUR 2,988,635 NOK 24,280,000 12/12/2013 66,782
NOK 24,470,000 EUR 3,001,537 12/12/2013 (56,819)
EUR 571,462 PLN 2,430,000 12/12/2013 (6,119)
PLN 2,640,000 EUR 621,120 12/12/2013 6,376
EUR 3,453 SEK 30,000 12/12/2013 84
EUR 20,118,938 USD 26,840,000 12/12/2013 382,796
USD 9,380,000 EUR 6,890,366 12/12/2013 6,989
EUR 282,887 ZAR 3,782,654 12/12/2013 10,107
ZAR 3,810,000 EUR 279,935 12/12/2013 (5,184)
EUR 647,987 CHF 799,000 20/12/2013 (1,865)
GBP 832,000 EUR 989,699 20/12/2013 9,180
MXN 6,960,000 USD 538,364 20/12/2013 (5,990)
NOK 6,154,000 EUR 744,501 20/12/2013 (4,146)
EUR 132,878 USD 180,000 20/12/2013 518
Net unrealised appreciation
(EUR underlying exposure – EUR 72,147,478) 240,752
Note: The net unrealised appreciation attributed to these transactions is included
in the Statement of Net Assets (see note 2(d)).
Barclays Bank Plc, Credit Suisse International, Deutsche Bank AG London, HSBC Bank Plc,
Royal Bank of Scotland Plc and UBS AG London are the counterparties to these Open
Forward Foreign Exchange Transactions.

Unaudited Interim Report and Accounts 111
The notes on pages 150 to 158 form an integral part of these financial statements.
Purchased Put Options as at 30 November 2013
Number of contracts
subject to Put Issuer
Underlying exposure
EUR
Unrealised appreciation/
(depreciation) EUR
Market Value
EUR
660,000 EUR/CHF Put Option
strike price EUR 1.22
expiring on 20/1/2014 147,757 (10,184) 904
665,000 EUR/CHF Put Option
strike price EUR 1.22
expiring on 20/1/2014 148,876 (8,213) 911
660,000 EUR/CHF Put Option
strike price EUR 1.22
expiring on 20/1/2014 147,757 (10,006) 904
665,000 EUR/CHF Put Option
strike price EUR 1.22
expiring on 20/1/2014 148,876 (9,330) 911
662,188 EUR/CHF Put Option
strike price EUR 1.22
expiring on 20/1/2014 148,246 (8,496) 907
660,000 EUR/CHF Put Option
strike price EUR 1.22
expiring on 20/1/2014 147,757 (8,699) 904
665,000 EUR/CHF Put Option
strike price EUR 1.22
expiring on 20/1/2014 148,876 (9,755) 911
100,000 EUR/CHF Put Option
strike price EUR 1.22
expiring on 20/1/2014 22,388 (1,473) 137
1,168,000 EUR/CHF Put Option
strike price EUR 1.22
expiring on 20/1/2014 261,485 (14,810) 1,600
6,000,000 EUR/CHF Put Option
strike price EUR 1.20
expiring on 20/1/2014 65,010 (52,716) 1,134
1,500,000 EUR/CHF Put Option
strike price EUR 1.22
expiring on 20/1/2014 335,812 (22,282) 2,055
990,000 EUR/CHF Put Option
strike price EUR 1.22
expiring on 20/1/2014 221,636 (15,276) 1,357
Total Purchased Put Options 1,944,476 (171,240) 12,635
Note: Purchased Put Options are included in the Statement of Net Assets (see note 2(d)).
UBS AG London is the counterparty to these Purchased Put Options.
BlackRock Fixed Income Strategies Fund continued
Written Put Options as at 30 November 2013
Number of contracts
subjectto Put Issuer
Underlying exposure
EUR
Unrealised appreciation/
(depreciation)EUR
Market Value
EUR
(1,325,000) EUR/CHF Put Option
strike price EUR 1.20
expiring on 20/1/2014 14,356 12,205 (251)
(1,325,000) EUR/CHF Put Option
strike price EUR 1.20
expiring on 20/1/2014 14,356 12,026 (251)
(1,325,000) EUR/CHF Put Option
strike price EUR 1.20
expiring on 20/1/2014 14,356 10,164 (250)
(1,325,000) EUR/CHF Put Option
strike price EUR 1.20
expiring on 20/1/2014 14,356 11,277 (250)
(1,324,388) EUR/CHF Put Option
strike price EUR 1.20
expiring on 20/1/2014 14,350 10,477 (250)
(1,325,000) EUR/CHF Put Option
strike price EUR 1.20
expiring on 20/1/2014 14,356 10,714 (250)
(1,325,000) EUR/CHF Put Option
strike price EUR 1.20
expiring on 20/1/2014 14,356 11,701 (250)
(205,000) EUR/CHF Put Option
strike price EUR 1.20
expiring on 20/1/2014 2,221 1,980 (39)
(2,336,000) EUR/CHF Put Option
strike price EUR 1.20
expiring on 20/1/2014 25,311 20,524 (442)
(3,000,000) EUR/CHF Put Option
strike price EUR 1.20
expiring on 20/1/2014 32,506 28,233 (567)
(1,980,000) EUR/CHF Put Option
strike price EUR 1.20
expiring on 20/1/2014 21,454 20,416 (374)
(3,000,000) EUR/CHF Put Option
strike price EUR 1.22
expiring on 20/1/2014 671,623 38,040 (4,110)
Total Written Put Options 853,601 187,757 (7,284)
Note: Written Put Options are included in the Statement of Net Assets (see note 2(d)).
UBS AG London is the counterparty to these Written Put Options.

Nominal Value Description
Unrealisedappreciation/
(depreciation)EUR
NominalValue Description
Unrealisedappreciation/
(depreciation)EUR
112 BlackRock Strategic Funds (BSF)
Swaps as at 30 November 2013
USD 700,000 Credit Default Swaps (JP Morgan) (Fund provides
default protection on Constellation Energy
Group Inc 5.150% 1/12/2020 and receives Fixed
1.000%) (20/3/2018) (802)
EUR 275,000 Credit Default Swaps (Bank of America) (Fund
receives default protection on BBVA Senior
Finance SAU 4.875% 23/1/2014 and pays Fixed
3.000%) (20/12/2018) (3,954)
EUR 800,000 Credit Default Swaps (Bank of America) (Fund
receives default protection on UniCredit SpA
4.375% 29/1/2020 and pays Fixed 3.000%)
(20/12/2018) (16,765)
EUR 300,000 Credit Default Swaps (Bank of America) (Fund
receives Fixed 1.000% and provides default
protection on RWE AG 5.750% 14/2/2033)
(20/9/2018) 1,808
USD 30,000 Credit Default Swaps (Bank of America) (Fund
receives Fixed 1.000% and provides default
protection on Host Hotels & Resorts LP 6.750%
1/6/2016) (20/6/2018) 600
EUR 800,000 Credit Default Swaps (Barclays Bank) (Fund
receives default protection on Deutsche
Telekom International Finance BV 6.000%
20/1/2017 and pays Fixed 1.000%)
(20/6/2018) (11,007)
EUR 680,000 Credit Default Swaps (Barclays Bank) (Fund
receives default protection on Intesa Sanpaolo
SpA 4.75% 15/6/2017 and pays Fixed 3.000%)
(20/12/2018) (7,994)
EUR 350,000 Credit Default Swaps (Barclays Bank) (Fund
receives default protection on Pernod Ricard
SA 4.875% 18/3/2016 and pays Fixed 1.000%)
(20/9/2018) (4,200)
EUR 300,000 Credit Default Swaps (Barclays Bank) (Fund
receives default protection on Pernod Ricard
SA 4.875% 18/3/2016 and pays Fixed 1.000%)
(20/9/2018) (3,452)
EUR 200,000 Credit Default Swaps (Barclays Bank) (Fund
receives default protection on Pernod Ricard
SA 4.875% 18/3/2016 and pays Fixed 1.000%)
(20/9/2018) (2,203)
EUR 800,000 Credit Default Swaps (Barclays Bank) (Fund
receives Fixed 1.000% and provides default
protection on Orange SA 5.625% 22/5/2018)
(20/6/2018) 15,829
EUR 300,000 Credit Default Swaps (Barclays Bank) (Fund
receives Fixed 1.000% and provides default
protection on RWE AG 5.750% 14/2/2033)
(20/9/2018) 4,030
EUR 350,000 Credit Default Swaps (Barclays Bank) (Fund
receives Fixed 1.000% and provides default
protection on RWE AG 5.750% 14/2/2033)
(20/9/2018) 2,629
EUR 200,000 Credit Default Swaps (Barclays Bank) (Fund
receives Fixed 1.000% and provides default
protection on RWE AG 5.750% 14/2/2033)
(20/9/2018) 1,205
EUR 395,000 Credit Default Swaps (BNP Paribas) (Fund receives
default protection on Anglo American Capital
PLC 5.875% 17/4/2015 and pays Fixed 1.000%)
(20/12/2018) 975
EUR 270,000 Credit Default Swaps (BNP Paribas) (Fund receives
default protection on BBVA Senior Finance SAU
4.875% 23/1/2014 and pays Fixed 3.000%)
(20/12/2018) (3,616)
EUR 255,000 Credit Default Swaps (Citibank) (Fund receives
default protection on BBVA Senior Finance SAU
4.875% 23/1/2014 and pays Fixed 3.000%)
(20/12/2018) (3,659)
EUR 10,000,000 Credit Default Swaps (Citibank) (Fund receives
default protection on iTraxx EUR Series 20
Version 1 and pays Fixed 1.000%) (20/12/2018) (87,608)
EUR 400,000 Credit Default Swaps (Citibank) (Fund receives
default protection on iTraxx FinSub 17 Version 1
and pays Fixed 1.000%) (20/6/2017) (28,352)
EUR 290,000 Credit Default Swaps (Credit Suisse) (Fund receives
default protection on Anglo American Capital
PLC 5.875% 17/4/2015 and pays Fixed 1.000%)
(20/12/2018) 186
USD 260,000 Credit Default Swaps (Credit Suisse) (Fund receives
Fixed 1.000% and provides default protection
on Host Hotels & Resorts LP 6.750% 1/6/2016)
(20/6/2018) 5,010
USD 510,000 Credit Default Swaps (Credit Suisse) (Fund receives
Fixed 1.000% and provides default protection
on Host Hotels & Resorts LP 6.750% 1/6/2016)
(20/6/2018) 9,455
EUR 200,000 Credit Default Swaps (Deutsche Asset
Management Life) (Fund receives default
protection on BBVA Senior Finance SAU 4.875%
23/1/2014 and pays Fixed 3.000%) (20/12/2018) (4,110)
EUR 516,000 Credit Default Swaps (Deutsche Asset
Management Life) (Fund receives Fixed 1.000%
and provides default protection on E.ON AG
6.375% 29/5/2017) (20/12/2017) 5,898
EUR 200,000 Credit Default Swaps (Deutsche Asset
Management Life) (Fund receives Fixed 3.000%
and provides default protection on UniCredit
SpA 4.375% 29/1/2020) (20/12/2018) 5,876
USD 525,000 Credit Default Swaps (Deutsche Bank) (Fund
provides default protection on Firstenergy Corp
7.375% 15/11/2031 and receives Fixed 1.000%)
(20/3/2018) (2,580)
EUR 820,000 Credit Default Swaps (Deutsche Bank) (Fund
receives default protection on Deutsche Telekom
International Finance BV 6.000% 20/1/2017 and
pays Fixed 1.000%) (20/6/2018) (13,064)
EUR 645,000 Credit Default Swaps (Deutsche Bank) (Fund
receives default protection on iTraxx EUR Series
20 Version 1 and pays Fixed 1.000%)
(20/12/2018) (6,282)
EUR 3,000,000 Credit Default Swaps (Deutsche Bank) (Fund
receives default protection on iTraxx EUR
Series 20 Version 1 and pays Fixed 1.000%)
(20/12/2018) (23,328)
EUR 820,000 Credit Default Swaps (Deutsche Bank) (Fund
receives Fixed 1.000% and pays default
protection on Orange SA 5.625% 22/5/2018)
(20/6/2018) 21,180
USD 1,000,000 Credit Default Swaps (Deutsche Bank) (Fund
receives Fixed 1.000% and provides default
protection on CDX NA IG 20 Version 1) (20/6/2018) 2,390
EUR 375,000 Credit Default Swaps (Goldman Sachs) (Fund
receives default protection on Anglo American
Capital PLC 5.875% 17/4/2015 and pays Fixed
1.000%) (20/12/2018) 1,097
EUR 295,000 Credit Default Swaps (Goldman Sachs) (Fund
receives default protection on Anglo American
Capital PLC 5.875% 17/4/2015 and pays Fixed
1.000%) (20/12/2018) 55
BlackRock Fixed Income Strategies Fund continued

Nominal Value Description
Unrealisedappreciation/
(depreciation)EUR
NominalValue Description
Unrealisedappreciation/
(depreciation)EUR
Note: The total market value of EUR (289,698) is included in the Statement of Net Assets (see note 2(d)).
Unaudited Interim Report and Accounts 113
The notes on pages 150 to 158 form an integral part of these financial statements.
Swaps as at 30 November 2013
EUR 870,000 Credit Default Swaps (Goldman Sachs) (Fund
receives default protection on Intesa Sanpaolo
SpA 4.75% 15/6/2017 and pays Fixed 3.000%)
(20/12/2018) (10,198)
USD 200,000 Credit Default Swaps (JP Morgan) (Fund receives
default protection on Exelon Generation Co LLC
6.200% 1/10/2017 and pays Fixed 1.000%)
(20/9/2018) (842)
USD 200,000 Credit Default Swaps (JP Morgan) (Fund receives
default protection on Exelon Generation Co
LLC 6.200% 1/10/2017 and pays Fixed 1.000%)
(20/9/2018) (1,051)
USD 100,000 Credit Default Swaps (JP Morgan) (Fund receives
default protection on Exelon Generation Co LLC
6.200% 10/1/2017 and pays Fixed 1.000%)
(20/9/2018) (102)
EUR 700,000 Credit Default Swaps (JP Morgan) (Fund receives
default protection on Intesa Sanpaolo SpA
4.750% 15/6/2017 and pays Fixed 3.000%)
(20/12/2018) (16,493)
EUR 300,000 Credit Default Swaps (JP Morgan) (Fund receives
default protection on Pernod Ricard SA 4.875%
18/3/2016 and pays Fixed 1.000%) (20/9/2018) (5,814)
EUR 800,000 Credit Default Swaps (JP Morgan) (Fund receives
default protection on St-Gobain Nederland BV
5.000% 25/4/2014 and pays Fixed 1.000%)
(20/6/2018) (23,793)
USD 350,000 Credit Default Swaps (JP Morgan) (Fund receives
Fixed 1.000% and provides default protection on
FirstEnergy Corp 7.375% 15/11/2031) (20/9/2018) 4,641
USD 200,000 Credit Default Swaps (JP Morgan) (Fund receives
Fixed 1.000% and provides default protection on
PSEG Power LLC 5.500% 1/12/2015) (20/9/2018) 1,909
USD 200,000 Credit Default Swaps (JP Morgan) (Fund receives
Fixed 1.000% and provides default protection on
PSEG Power LLC 5.500% 1/12/2015) (20/9/2018) 1,406
USD 100,000 Credit Default Swaps (JP Morgan) (Fund receives
Fixed 1.000% and provides default protection on
PSEG Power LLC 5.500% 1/12/2015) (20/9/2018) 409
EUR 1,400,000 Interest Rate Swap (Barclays Bank) (Fund receives
Fixed 2.348% and pays Floating EUR 6 Month
EURIBOR) (10/6/2033) (49,328)
EUR 1,450,000 Interest Rate Swap (Barclays Bank) (Fund receives
Fixed 2.465% and pays Floating EUR 6 Month
EURIBOR) (8/7/2033) (24,220)
EUR 1,195,000 Interest Rate Swap (Barclays Bank) (Fund receives
Floating EUR 6 Month EURIBOR and pays Fixed
2.208%) (4/7/2044) 105,084
EUR 1,150,000 Interest Rate Swap (Barclays Bank) (Fund receives
Floating EUR 6 Month EURIBOR and pays Fixed
2.410%) (4/7/2044) 50,071
EUR 830,000 Interest Rate Swap (Barclays Bank) (Fund receives
Floating EUR 6 Month EURIBOR and pays Fixed
2.525%) (10/6/2063) 27,300
EUR 830,000 Interest Rate Swap (Barclays Bank) (Fund receives
Floating EUR 6 Month EURIBOR and pays Fixed
2.605%) (8/7/2063) 8,282
EUR 460,000 Interest Rate Swap (Barclays Bank) (Fund receives
Floating EUR 6 Month EURIBOR and pays Fixed
2.735%) (19/9/2043) (12,644)
PLN 13,325,000 Interest Rate Swap (Deutsche Asset Management
Life) (Fund receives Floating PLN 3 Month
WIBOR and pays Fixed 4.130%) (18/9/2014) (34,621)
(EUR underlying exposure – EUR 40,631,462) (124,757)
BlackRock Fixed Income Strategies Fund continued

Transferable Securities Admitted to an Official Stock Exchange Listing or Dealt in on Another Regulated Market
Transferable Securities Admitted to an Official Stock Exchange Listing or Dealt in on Another Regulated Market
Holding Description Market Value
(EUR) % Holding Description Market Value
(EUR) %
1 This fund is managed by BlackRock.
114 BlackRock Strategic Funds (BSF)
BlackRock Fund of iShares – Conservative
FUNDS
Germany 3,970 iShares Dow Jones - UBS Commodity
Swap DE 1 93,216 2.41
93,216 2.41
Ireland 11,345 iShares Developed Markets Property
Yield UCITS ETF 1 179,932 4.65
3,078 iShares Euro Corporate Bond
UCITS ETF 1 379,764 9.82
3,437 iShares Euro Government Bond
1-3 UCITS ETF 1 488,105 12.62
2,119 iShares Euro Government Bond
3-5 UCITS ETF 1 336,688 8.70
2,587 iShares Euro Government Bond
7-10 UCITS ETF 1 465,259 12.03
4,021 iShares Euro High Yield Corporate
Bond UCITS ETF 1 438,711 11.34
3,880 iShares Euro Inflation Linked
Government Bond UCITS ETF 1 738,752 19.10
4,084 iShares EURO STOXX Small UCITS ETF 1 110,145 2.85
3,782 iShares FTSE 100 UCITS ETF 1 30,112 0.78
3,183 iShares JP Morgan $ Emerging
Markets Bond UCITS ETF 1 251,123 6.49
4,471 iShares MSCI Emerging Markets
UCITS ETF 1 129,838 3.36
2,561 iShares MSCI Europe ex. UK UCITS ETF 1 65,562 1.70
3,298 iShares MSCI Japan UCITS ETF 1 29,616 0.77
4,239 iShares MSCI North America UCITS ETF 1 109,165 2.82
534 iShares MSCI Pacific ex-Japan
UCITS ETF 1 17,763 0.46
3,770,535 97.49
Total Funds 3,863,751 99.90
Total Transferable Securities Admitted
to an Official Stock Exchange Listing or
Dealt in on Another Regulated Market 3,863,751 99.90
Total Portfolio 3,863,751 99.90
Other Net Assets 4,054 0.10
Total Net Assets (EUR) 3,867,805 100.00
Portfolio of Investments as at 30 November 2013
Ireland continued
Sector Breakdownas at 30 November 2013
% of netassets *
Funds 99.90
Other net assets 0.10
100.00
* Based on the market value of the Portfolio of Investments
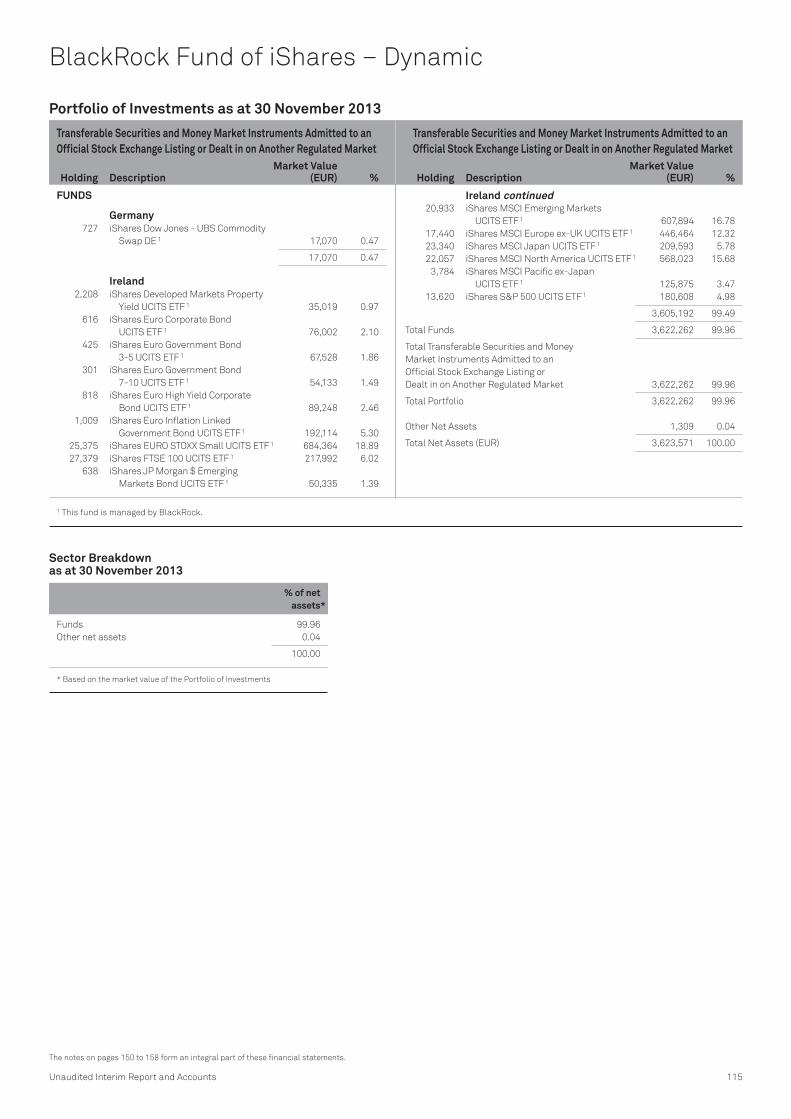
Transferable Securities and Money Market Instruments Admitted to an Official Stock Exchange Listing or Dealt in on Another Regulated Market
Transferable Securities and Money Market Instruments Admitted to an Official Stock Exchange Listing or Dealt in on Another Regulated Market
Holding Description Market Value
(EUR) % Holding Description Market Value
(EUR) %
1 This fund is managed by BlackRock.
Unaudited Interim Report and Accounts 115
The notes on pages 150 to 158 form an integral part of these financial statements.
BlackRock Fund of iShares – Dynamic
FUNDS
Germany 727 iShares Dow Jones - UBS Commodity
Swap DE 1 17,070 0.47
17,070 0.47
Ireland 2,208 iShares Developed Markets Property
Yield UCITS ETF 1 35,019 0.97
616 iShares Euro Corporate Bond
UCITS ETF 1 76,002 2.10
425 iShares Euro Government Bond
3-5 UCITS ETF 1 67,528 1.86
301 iShares Euro Government Bond
7-10 UCITS ETF 1 54,133 1.49
818 iShares Euro High Yield Corporate
Bond UCITS ETF 1 89,248 2.46
1,009 iShares Euro Inflation Linked
Government Bond UCITS ETF 1 192,114 5.30
25,375 iShares EURO STOXX Small UCITS ETF 1 684,364 18.89
27,379 iShares FTSE 100 UCITS ETF 1 217,992 6.02
638 iShares JP Morgan $ Emerging
Markets Bond UCITS ETF 1 50,335 1.39
20,933 iShares MSCI Emerging Markets
UCITS ETF 1 607,894 16.78
17,440 iShares MSCI Europe ex-UK UCITS ETF 1 446,464 12.32
23,340 iShares MSCI Japan UCITS ETF 1 209,593 5.78
22,057 iShares MSCI North America UCITS ETF 1 568,023 15.68
3,784 iShares MSCI Pacific ex-Japan
UCITS ETF 1 125,875 3.47
13,620 iShares S&P 500 UCITS ETF 1 180,608 4.98
3,605,192 99.49
Total Funds 3,622,262 99.96
Total Transferable Securities and Money
Market Instruments Admitted to an
Official Stock Exchange Listing or
Dealt in on Another Regulated Market 3,622,262 99.96
Total Portfolio 3,622,262 99.96
Other Net Assets 1,309 0.04
Total Net Assets (EUR) 3,623,571 100.00
Portfolio of Investments as at 30 November 2013
Ireland continued
Sector Breakdownas at 30 November 2013
% of netassets *
Funds 99.96
Other net assets 0.04
100.00
* Based on the market value of the Portfolio of Investments

Transferable Securities and Money Market Instruments Admitted to an Official Stock Exchange Listing or Dealt in on Another Regulated Market
Transferable Securities and Money Market Instruments Admitted to an Official Stock Exchange Listing or Dealt in on Another Regulated Market
Holding Description Market Value
(EUR) % Holding Description Market Value
(EUR) %
1 This fund is managed by BlackRock.
116 BlackRock Strategic Funds (BSF)
BlackRock Fund of iShares – Growth
FUNDS
Germany 3,887 iShares Dow Jones - UBS Commodity
Swap DE 1 91,267 1.14
91,267 1.14
Ireland 12,481 iShares Developed Markets Property
Yield UCITS ETF 1 197,949 2.48
3,369 iShares Euro Corporate Bond
UCITS ETF 1 415,667 5.20
2,308 iShares Euro Government Bond
3-5 UCITS ETF 1 366,718 4.59
1,544 iShares Euro Government Bond
7-10 UCITS ETF 1 277,681 3.47
4,396 iShares Euro High Yield Corporate
Bond UCITS ETF 1 479,625 6.00
5,375 iShares Euro Inflation Linked
Government Bond UCITS ETF 1 1,023,400 12.81
40,736 iShares EURO STOXX Small UCITS ETF 1 1,098,650 13.75
42,578 iShares FTSE 100 UCITS ETF 1 339,006 4.24
3,467 iShares JP Morgan $ Emerging
Markets Bond UCITS ETF 1 273,529 3.42
34,520 iShares MSCI Emerging Markets
UCITS ETF 1 1,002,461 12.54
27,735 iShares MSCI Europe ex-UK UCITS ETF 1 710,016 8.88
37,422 iShares MSCI Japan UCITS ETF 1 336,049 4.21
45,678 iShares MSCI North America UCITS ETF 1 1,176,323 14.72
5,852 iShares MSCI Pacific ex-Japan
UCITS ETF 1 194,667 2.44
7,891,741 98.75
Total Funds 7,983,008 99.89
Total Transferable Securities and Money
Market Instruments Admitted to an
Official Stock Exchange Listing or
Dealt in on Another Regulated Market 7,983,008 99.89
Total Portfolio 7,983,008 99.89
Other Net Assets 8,603 0.11
Total Net Assets (EUR) 7,991,611 100.00
Portfolio of Investments as at 30 November 2013
Ireland continued
Sector Breakdownas at 30 November 2013
% of netassets *
Funds 99.89
Other net assets 0.11
100.00
* Based on the market value of the Portfolio of Investments
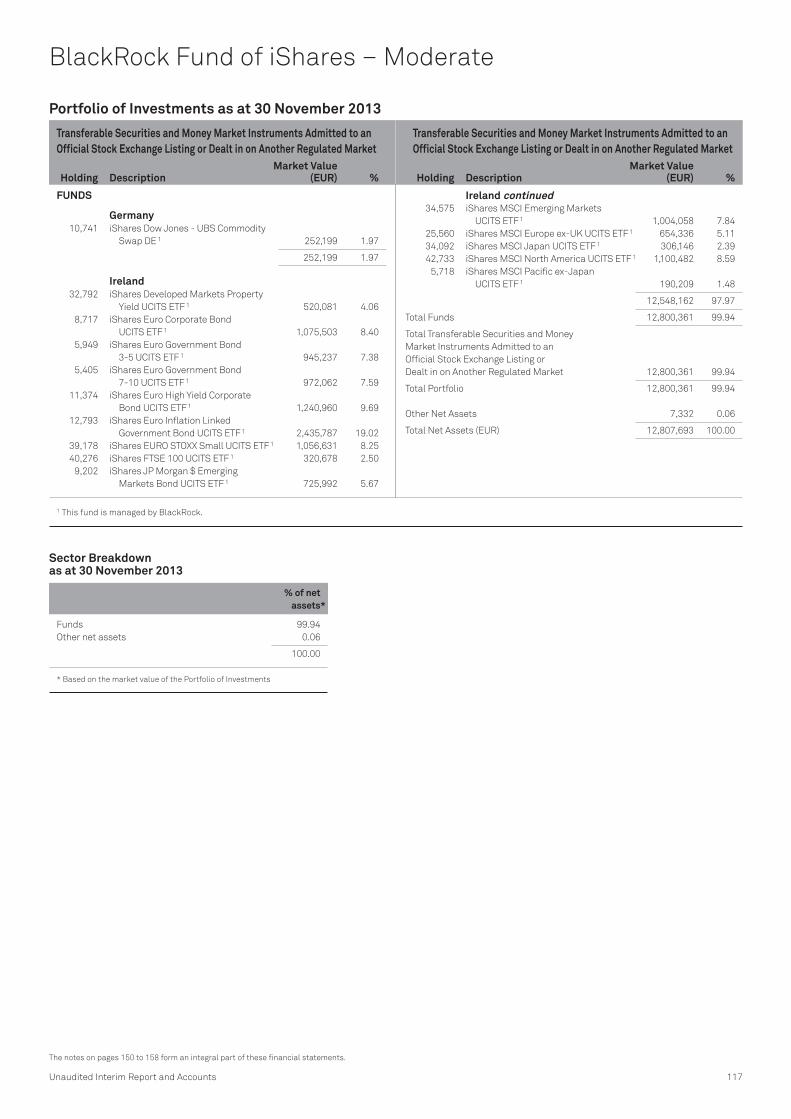
Transferable Securities and Money Market Instruments Admitted to an Official Stock Exchange Listing or Dealt in on Another Regulated Market
Transferable Securities and Money Market Instruments Admitted to an Official Stock Exchange Listing or Dealt in on Another Regulated Market
Holding Description Market Value
(EUR) % Holding Description Market Value
(EUR) %
1 This fund is managed by BlackRock.
Unaudited Interim Report and Accounts 117
The notes on pages 150 to 158 form an integral part of these financial statements.
BlackRock Fund of iShares – Moderate
FUNDS
Germany 10,741 iShares Dow Jones - UBS Commodity
Swap DE 1 252,199 1.97
252,199 1.97
Ireland 32,792 iShares Developed Markets Property
Yield UCITS ETF 1 520,081 4.06
8,717 iShares Euro Corporate Bond
UCITS ETF 1 1,075,503 8.40
5,949 iShares Euro Government Bond
3-5 UCITS ETF 1 945,237 7.38
5,405 iShares Euro Government Bond
7-10 UCITS ETF 1 972,062 7.59
11,374 iShares Euro High Yield Corporate
Bond UCITS ETF 1 1,240,960 9.69
12,793 iShares Euro Inflation Linked
Government Bond UCITS ETF 1 2,435,787 19.02
39,178 iShares EURO STOXX Small UCITS ETF 1 1,056,631 8.25
40,276 iShares FTSE 100 UCITS ETF 1 320,678 2.50
9,202 iShares JP Morgan $ Emerging
Markets Bond UCITS ETF 1 725,992 5.67
34,575 iShares MSCI Emerging Markets
UCITS ETF 1 1,004,058 7.84
25,560 iShares MSCI Europe ex-UK UCITS ETF 1 654,336 5.11
34,092 iShares MSCI Japan UCITS ETF 1 306,146 2.39
42,733 iShares MSCI North America UCITS ETF 1 1,100,482 8.59
5,718 iShares MSCI Pacific ex-Japan
UCITS ETF 1 190,209 1.48
12,548,162 97.97
Total Funds 12,800,361 99.94
Total Transferable Securities and Money
Market Instruments Admitted to an
Official Stock Exchange Listing or
Dealt in on Another Regulated Market 12,800,361 99.94
Total Portfolio 12,800,361 99.94
Other Net Assets 7,332 0.06
Total Net Assets (EUR) 12,807,693 100.00
Portfolio of Investments as at 30 November 2013
Ireland continued
Sector Breakdownas at 30 November 2013
% of netassets *
Funds 99.94
Other net assets 0.06
100.00
* Based on the market value of the Portfolio of Investments

Transferable Securities and Money Market Instruments Admitted to an Official Stock Exchange Listing or Dealt in on Another Regulated Market
Transferable Securities and Money Market Instruments Admitted to an Official Stock Exchange Listing or Dealt in on Another Regulated Market
Holding Description Market Value
(EUR) % Holding Description Market Value
(EUR) %
118 BlackRock Strategic Funds (BSF)
BlackRock Global Absolute Return Bond Fund
BONDS
Australia USD 10,402 Medallion Trust Series 2007-1G 'A1'
FRN 27/2/2039 7,630 0.01
USD 83,754 Puma Finance Ltd 'A1' '144A' FRN
21/2/2038 60,757 0.03
AUD 602,000 Queensland Treasury Corp 6.00%
21/7/2022 438,640 0.23
USD 221,202 Swan 2006-1E 'A1' FRN 12/5/2037 161,999 0.09
AUD 626,552 Torrens Trust 2013-1A FRN
12/4/2044 419,828 0.22
1,088,854 0.58
Austria EUR 400,000 BAWAG PSK Bank fuer Arbeit und
Wirtschaft und Oesterreichische
Postsparkasse AG 8.125%
30/10/2023 417,300 0.22
EUR 400,000 UNIQA Insurance Group AG FRN
31/7/2043 431,106 0.23
848,406 0.45
Belgium EUR 1,197,000 UCB SA 4.125% 4/1/2021 1,242,504 0.66
1,242,504 0.66
Brazil BRL 2,004,000 Brazil Notas do Tesouro Nacional
Serie F 10.00% 1/1/2017 624,949 0.33
624,949 0.33
British Virgin Islands USD 400,000 Caifu Holdings Ltd 8.75% 24/1/2020 298,448 0.16
298,448 0.16
Canada USD 25,000 Thomson Reuters Corp 1.30%
23/2/2017 18,405 0.01
18,405 0.01
Cayman Islands EUR 420,000 IPIC GMTN Ltd 2.375% 30/5/2018 430,471 0.23
USD 25,000 Seagate HDD Cayman '144A' 3.75%
15/11/2018 18,613 0.01
USD 362,000 Seagate HDD Cayman 3.75%
15/11/2018 269,513 0.15
USD 35,000 XLIT Ltd 2.30% 15/12/2018 25,766 0.01
744,363 0.40
France EUR 2,100,000 Auto ABS Compartiment 2012-1A
FRN 25/7/2026 2,116,040 1.13
GBP 150,000 AXA SA FRN (Perpetual) 191,588 0.10
EUR 600,000 Cars Alliance Auto Loans France V
2012-1A FRN 25/2/2024 600,848 0.32
EUR 1,286,116 Driver France 1 FCT 'A' FRN
21/10/2020 1,287,317 0.69
EUR 715,852 FCT Copernic 2012-1 'A1' FRN
25/9/2029 719,129 0.38
EUR 391,489 FCT GINKGO Sales Finance 2012-1A
FRN 18/7/2038 394,494 0.21
EUR 1,000,000 Master Credit Cards Pass
Compartment France 2013-1
FRN 25/10/2025 1,000,900 0.54
EUR 700,000 Plastic Omnium SA 2.875%
29/5/2020 693,840 0.37
EUR 185,772 Red & Black Auto France 2012-1A
FRN 28/12/2021 186,267 0.10
EUR 750,000 Renault SA 4.625% 18/9/2017 808,635 0.43
7,999,058 4.27
Germany EUR 900,000 Allianz SE FRN (Perpetual) 926,793 0.49
EUR 932,000 Bayer AG FRN 29/7/2105 972,658 0.52
EUR 1,250,000 Bundesobligation 2.25% 11/4/2014 1,259,531 0.67
EUR 1,300,000 Bundesrepublik Deutschland 4.25%
4/1/2014 1,304,615 0.70
EUR 6,500,000 Bundesrepublik Deutschland 4.25%
4/7/2014 6,657,300 3.55
EUR 2,619,469 Bundesrepublik Deutschland
Bundesobligation Inflation
Linked Bond 0.75% 15/4/2018 2,749,329 1.47
EUR 1,000,000 Bundesschatzanweisungen 0.25%
13/12/2013 1,000,040 0.53
EUR 4,000,000 Bundesschatzanweisungen 0.25%
14/3/2014 4,001,940 2.14
EUR 4,000,000 Bundesschatzanweisungen 0.00%
13/6/2014 (Zero Coupon) 3,998,720 2.13
EUR 1,500,000 Bundesschatzanweisungen 0.00%
12/9/2014 (Zero Coupon) 1,499,025 0.80
EUR 750,000 Continental AG 3.00% 16/7/2018 787,523 0.42
EUR 630,453 Driver Ten GmbH 'A' FRN 21/3/2019 630,296 0.34
GBP 300,000 FMS Wertmanagement AoeR FRN
3/8/2015 361,474 0.19
EUR 3,000,000 German Treasury Bill 0.00%
26/2/2014 (Zero Coupon) 2,999,790 1.60
EUR 3,000,000 German Treasury Bill 0.00%
12/3/2014 (Zero Coupon) 2,999,715 1.60
EUR 1,000,000 German Treasury Bill 0.00%
26/3/2014 (Zero Coupon) 999,850 0.53
EUR 3,000,000 German Treasury Bill 0.00%
14/5/2014 (Zero Coupon) 2,999,028 1.60
EUR 2,500,000 German Treasury Bill 0.00%
25/6/2014 (Zero Coupon) 2,499,350 1.33
EUR 1,500,000 German Treasury Bill 0.00%
27/8/2014 (Zero Coupon) 1,499,475 0.80
EUR 250,000 Heidelberger Druckmaschinen
AG 9.25% 15/4/2018 268,819 0.14
EUR 1,600,000 Red & Black Auto Germany 2 'A'
FRN 15/9/2022 1,601,067 0.85
EUR 769,865 Red & Black TME Germany 1 SA
'A' FRN 15/1/2023 770,605 0.41
EUR 120,000 RWE AG FRN (Perpetual) 121,908 0.07
EUR 250,000 RWE AG FRN (Perpetual) 253,975 0.14
EUR 304,661 SC Germany Auto 2010-1A FRN
12/8/2019 305,543 0.16
EUR 410,307 SC Germany Auto 2011-2A FRN
13/11/2021 412,912 0.22
EUR 538,533 SC Germany Auto 2013-1A FRN
12/10/2022 538,803 0.29
EUR 967,041 SC Germany auto 2013-2A FRN
12/3/2023 968,627 0.52
45,388,711 24.21
India USD 400,000 Power Grid Corp of India Ltd
3.875% 17/1/2023 253,093 0.14
253,093 0.14
Portfolio of Investments as at 30 November 2013
France continued

Transferable Securities and Money Market Instruments Admitted to an Official Stock Exchange Listing or Dealt in on Another Regulated Market
Transferable Securities and Money Market Instruments Admitted to an Official Stock Exchange Listing or Dealt in on Another Regulated Market
Holding Description Market Value
(EUR) % Holding Description Market Value
(EUR) %
Unaudited Interim Report and Accounts 119
The notes on pages 150 to 158 form an integral part of these financial statements.
BlackRock Global Absolute Return Bond Fund continued
Indonesia USD 400,000 Indonesia Government
International Bond 5.375%
17/10/2023 292,467 0.16
292,467 0.16
Ireland EUR 1,225,000 ESB Finance Ltd 3.494% 12/1/2024 1,239,400 0.66
EUR 195,000 Ireland Government Bond 4.50%
18/4/2020 212,282 0.11
EUR 430,000 Ireland Government Bond 3.90%
20/3/2023 443,700 0.24
EUR 155,000 Ireland Government Bond 5.40%
13/3/2025 175,499 0.09
EUR 84,085 Opera Germany No2 Plc 'A' FRN
20/10/2014 82,699 0.04
EUR 681,336 SCF Rahoituspalvelut Ltd 2013-1 'A'
0.802% 25/5/2021 681,779 0.36
GBP 229,358 Titan Europe 2007-1 Nhp Ltd 'A'
FRN 20/1/2017 252,671 0.14
EUR 31,212 Titan Europe 2007-2 Ltd 'A1' FRN
23/4/2017 30,989 0.02
3,119,019 1.66
Isle Of Man USD 300,000 Sasol Financing International Plc
4.50% 14/11/2022 209,003 0.11
209,003 0.11
Italy EUR 421,946 Asset-Backed European Securitisation
Transaction Seven Srl 'A'
FRN 10/12/2026 427,270 0.23
EUR 900,000 Banca Popolare dell'Emilia Romagna
SC 3.375% 22/10/2018 914,949 0.49
EUR 487,937 Berica ABS Srl FRN 30/11/2051 476,018 0.25
EUR 950,000 Intesa Sanpaolo SpA 3.00%
28/1/2019 963,789 0.51
EUR 300,000 Intesa Sanpaolo SpA 4.00%
30/10/2023 304,101 0.16
EUR 1,663,362 Italy Buoni Poliennali Del Tesoro
2.15% 15/9/2014 1,686,815 0.90
EUR 5,760,893 Italy Buoni Poliennali Del Tesoro
2.55% 22/10/2016 5,902,467 3.15
EUR 998,880 Italy Buoni Poliennali Del Tesoro
2.15% 12/11/2017 1,004,174 0.54
EUR 2,142,000 Italy Buoni Poliennali Del Tesoro
2.15% 12/11/2017 2,156,458 1.15
EUR 500,000 Linea Group Holding SpA 3.875%
28/11/2018 498,152 0.27
EUR 200,000 Telecom Italia SpA 5.375%
29/1/2019 210,469 0.11
EUR 180,000 Telecom Italia SpA 4.00% 21/1/2020 175,809 0.09
EUR 920,000 UniCredit SpA 3.375% 11/1/2018 946,487 0.51
15,666,958 8.36
Jersey GBP 780,000 AA Bond Co Ltd 4.249% 31/7/2020 938,752 0.50
USD 152,889 Aircraft Lease Securitisation Ltd
'144A' FRN 10/5/2032 107,363 0.06
GBP 1,150,000 Heathrow Funding Ltd 4.625%
31/10/2046 1,342,488 0.71
2,388,603 1.27
Luxembourg USD 145,000 ArcelorMittal 6.125% 1/6/2018 116,237 0.06
EUR 476,744 Bumper 2 SA 'A' FRN 23/2/2023 479,658 0.25
EUR 512,850 E-Carat 2013-1 'A' 0.852%
18/11/2020 512,826 0.27
EUR 972,598 E-Carat 2012-1 'A' FRN 18/7/2020 978,038 0.52
EUR 100,000 GCS Holdco Finance I SA 6.50%
15/11/2018 102,800 0.05
EUR 1,500,000 Red & Black Auto Lease Germany 1
SA 'A' 0.911% 15/4/2024 1,500,300 0.80
EUR 300,000 Schmolz + Bickenbach Luxembourg
SA 9.875% 15/5/2019 331,266 0.18
EUR 58,363 Volkswagen Car Lease '13A' FRN
21/2/2017 58,402 0.03
EUR 104,904 Volkswagen Car Lease '15A' FRN
21/1/2018 105,070 0.06
EUR 161,491 Volkswagen Car Lease '16A' FRN
21/7/2018 161,505 0.09
EUR 142,564 Volkswagen Car Lease '17A' FRN
21/1/2019 142,544 0.08
4,488,646 2.39
Mexico USD 65,000 Kansas City Southern de Mexico
de CV '144A' FRN 28/10/2016 47,760 0.03
MXN 21,500,000 Mexican Cetes 0.00% 23/1/2014
(Zero Coupon) 119,908 0.06
USD 600,000 Petroleos Mexicanos 3.50%
30/1/2023 401,371 0.21
569,039 0.30
Netherlands EUR 800,000 Alliander NV FRN (Perpetual) 810,000 0.43
EUR 500,000 ASML Holding NV 3.375% 19/9/2023 511,080 0.27
EUR 600,000 Brenntag Finance BV 5.50%
19/7/2018 678,276 0.36
EUR 1,044,278 Bumper 4 NL Finance BV '2011-4
'A' FRN 20/5/2026 1,047,081 0.56
GBP 300,000 Cable & Wireless International
Finance BV 8.625% 25/3/2019 412,931 0.22
USD 2,000,000 Cooperatieve Centrale Raiffeisen-
Boerenleenbank BA/Netherlands
4.625% 1/12/2023 1,462,980 0.78
GBP 150,000 Enel Finance International NV
5.75% 14/9/2040 168,881 0.09
EUR 301,369 Highway BV 2012-1 'A' FRN
26/3/2024 302,672 0.16
EUR 818,000 ING Bank NV 3.50% 21/11/2023 817,746 0.44
EUR 905,000 Louis Dreyfus Commodities BV
3.875% 30/7/2018 933,209 0.50
EUR 500,000 Repsol International Finance BV
3.625% 7/10/2021 524,183 0.28
EUR 232,782 Storm 2012-4 BV 'A1' FRN 22/8/2054 233,819 0.13
EUR 1,000,000 Storm 2013-4 BV 'A1' FRN
22/10/2053 999,954 0.53
EUR 100,000 Univeg Holding BV 7.875%
15/11/2020 100,000 0.05
9,002,812 4.80
Portugal EUR 800,000 Galp Energia SGPS SA 4.125%
25/1/2019 812,480 0.43
812,480 0.43
Portfolio of Investments as at 30 November 2013

Transferable Securities and Money Market Instruments Admitted to an Official Stock Exchange Listing or Dealt in on Another Regulated Market
Transferable Securities and Money Market Instruments Admitted to an Official Stock Exchange Listing or Dealt in on Another Regulated Market
Holding Description Market Value
(EUR) % Holding Description Market Value
(EUR) %
120 BlackRock Strategic Funds (BSF)
BlackRock Global Absolute Return Bond Fund continued
Puerto Rico USD 190,000 Warner Chilcott Co LLC Warner
Chilcott Finance LLC 7.75%
15/9/2018 152,809 0.08
152,809 0.08
Russia USD 600,000 Russian Foreign Bond - Eurobond
4.875% 16/9/2023 451,980 0.24
451,980 0.24
Spain EUR 300,000 Banco Popular Espanol SA FRN
(Perpetual) 323,552 0.17
EUR 500,000 Bankia SA 4.25% 25/5/2018 530,937 0.29
EUR 900,000 BBVA Senior Finance SAU 3.75%
17/1/2018 958,882 0.51
EUR 300,000 Caja Rural de Navarra 2.875%
11/6/2018 308,577 0.17
EUR 450,000 Ence Energia y Celulosa SA 7.25%
15/2/2020 490,374 0.26
EUR 900,000 Spain Government Bond '144A'
4.40% 31/10/2023 920,205 0.49
3,532,527 1.89
Sweden GBP 1,300,000 Svenska Handelsbanken AB 3.00%
20/11/2020 1,562,760 0.83
EUR 300,000 TVN Finance Corp III AB 7.375%
15/12/2020 319,799 0.17
1,882,559 1.00
Switzerland EUR 687,000 Credit Suisse AG FRN 18/9/2025 725,932 0.39
725,932 0.39
United Kingdom GBP 201,119 Asset-Backed European
Securitisation Transaction 8
Srl 'A' FRN 15/6/2019 241,631 0.13
USD 800,000 Barclays Plc FRN (Perpetual) 607,887 0.32
GBP 141,869 Brass No 2 Plc 2012-1A1 FRN
16/7/2050 170,645 0.09
GBP 604,000 Brass No 3 Plc 'A' FRN 16/4/2051 726,844 0.39
EUR 1,498,127 Brunel Residential Mortgage
Securitisation Plc FRN 13/1/2039 1,480,558 0.79
USD 800,000 Centrica Plc 4.00% 16/10/2023 581,593 0.31
GBP 820,000 Chester Asset Receivables Dealings
2004-1 Plc 'A' FRN 15/4/2016 984,444 0.53
GBP 350,000 Dixons Retail Plc 8.75% 15/9/2017 485,386 0.26
GBP 768,796 E-Carat 2 Plc - Class A FRN
18/10/2021 924,254 0.49
GBP 459,905 E-Carat 2012-1 Plc 'A' 1.30%
18/6/2020 552,848 0.29
GBP 1,200,000 FCE Bank Plc 3.25% 19/11/2020 1,433,716 0.76
GBP 150,892 Gosforth Funding 2012-2 Plc 'A1A'
FRN 18/11/2049 181,372 0.10
GBP 1,250,000 Gracechurch Card 2011-3 'A2' FRN
15/4/2016 1,503,783 0.80
EUR 863,000 Gracechurch Card Funding Plc 2011
'A' FRN 15/1/2016 863,952 0.46
USD 64,571 Granite Master Issuer Plc 'A1' '144A'
FRN 20/12/2054 46,888 0.03
GBP 860,000 Greater Gabbard Ofto Plc 4.137%
29/11/2032 1,040,104 0.55
EUR 600,000 HBOS Plc 4.875% 20/3/2015 625,275 0.33
GBP 1,549,759 Kenrick Plc 'A' FRN 18/4/2049 1,860,862 0.99
GBP 250,000 Marks & Spencer Plc 4.75%
12/6/2025 301,548 0.16
GBP 783,462 Motor 2012 Plc 'A2' FRN 25/2/2020 942,110 0.50
GBP 400,000 Next Plc 5.375% 26/10/2021 536,694 0.29
GBP 440,000 Penarth Master Issuer Plc 'A3' FRN
18/12/2016 531,958 0.28
GBP 621,000 Permanent Master Issuer Plc '1A2'
FRN 15/7/2042 746,623 0.40
EUR 1,000,000 Permanent Master Issuer Plc '1A3'
FRN 15/7/2042 1,001,206 0.53
GBP 1,500,000 Telereal Secured Finance Plc 4.01%
10/12/2031 1,775,548 0.95
GBP 1,024,000 Temese Funding 1 Plc - Class A FRN
21/11/2021 1,230,080 0.66
GBP 277,970 Turbo Finance 2 Plc 'A' FRN
20/2/2019 334,774 0.18
GBP 508,000 Turbo Finance 2 Plc 'B' 5.50%
20/2/2019 631,104 0.34
GBP 801,085 Turbo Finance 3 Plc 'A' FRN
20/11/2019 963,020 0.51
GBP 763,000 Turbo Finance 4 Plc - Class A FRN
20/1/2021 916,414 0.49
GBP 27,369 Unique Pub Finance Co Plc 5.659%
30/6/2027 32,174 0.02
GBP 688,000 United Kingdom Gilt 3.25%
22/1/2044 773,278 0.41
GBP 1,271,000 United Kingdom Gilt 3.50%
22/7/2068 1,510,265 0.81
GBP 342,914 United Kingdom Gilt Inflation Linked
0.125% 22/3/2068 446,872 0.24
EUR 370,000 WM Morrison Supermarkets Plc
2.25% 19/6/2020 369,700 0.20
27,355,410 14.59
United States USD 50,000 Air Lease Corp 3.375% 15/1/2019 36,893 0.02
USD 75,000 Ally Financial Inc 5.50% 15/2/2017 60,044 0.03
USD 55,000 American Honda Finance Corp
1.125% 7/10/2016 40,720 0.02
USD 75,000 American International Group Inc
4.875% 15/9/2016 60,807 0.03
USD 50,000 Aviation Capital Group Corp '144A'
3.875% 27/9/2016 37,226 0.02
USD 26,000 Avis Budget Car Rental LLC 4.875%
15/11/2017 20,170 0.01
USD 250,000 Banc of America Re-Remic Trust
'144A' FRN 15/9/2026 184,224 0.10
USD 22,000 Bank of America Corp 1.25% 11/1/2016 16,258 0.01
USD 90,000 Bank of America Corp 6.50% 1/8/2016 75,187 0.04
USD 325,000 Bank of America Corp 2.60%
15/1/2019 241,896 0.13
EUR 150,000 Belden Inc 5.50% 15/4/2023 147,351 0.08
USD 100,000 Capital One Financial Corp 6.75%
15/9/2017 86,414 0.05
USD 400,000 CarMax Auto Owner Trust 'A4'
0.84% 15/11/2018 292,062 0.16
USD 500,000 CarMax Auto Owner Trust 'B' 1.21%
15/1/2019 365,557 0.20
USD 405,000 Citibank Credit Card Issuance Trust
1.32% 7/9/2018 301,609 0.16
USD 8,304,479 Citigroup Commercial Mortgage Trust
2013-GC15 FRN 10/9/2046 482,770 0.26
USD 50,000 Citigroup Inc 1.25% 15/1/2016 36,950 0.02
Portfolio of Investments as at 30 November 2013
United Kingdom continued
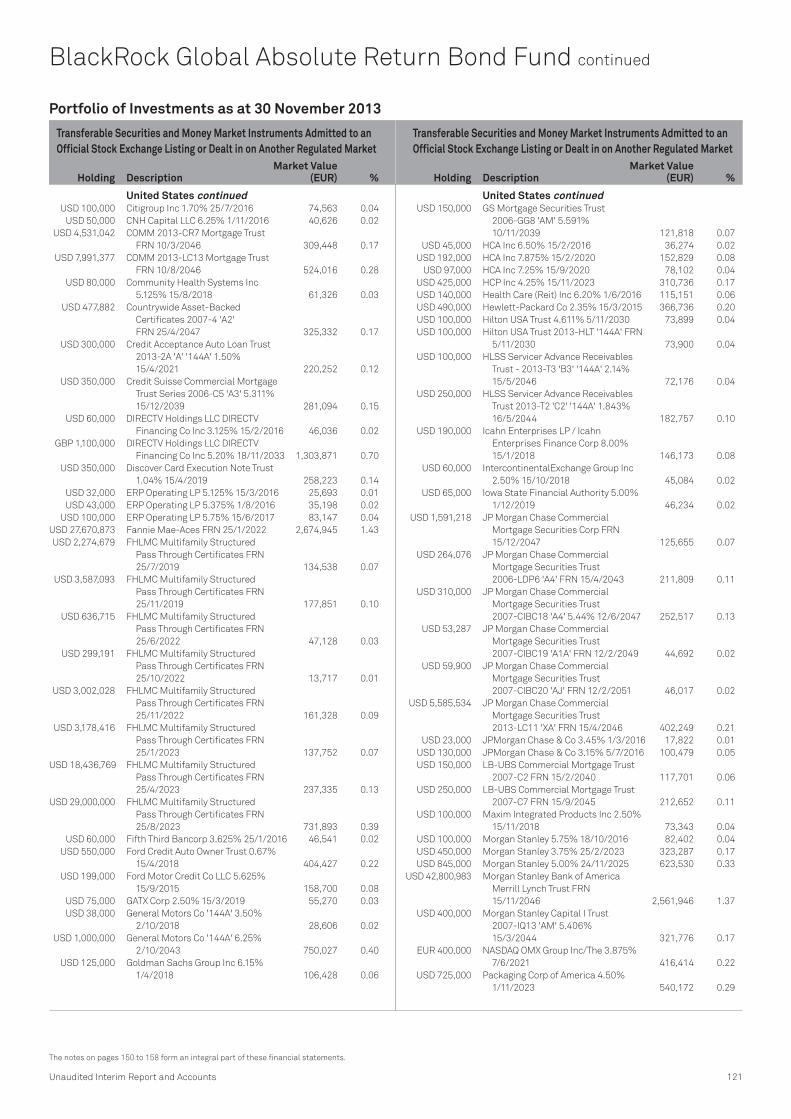
Transferable Securities and Money Market Instruments Admitted to an Official Stock Exchange Listing or Dealt in on Another Regulated Market
Transferable Securities and Money Market Instruments Admitted to an Official Stock Exchange Listing or Dealt in on Another Regulated Market
Holding Description Market Value
(EUR) % Holding Description Market Value
(EUR) %
Unaudited Interim Report and Accounts 121
The notes on pages 150 to 158 form an integral part of these financial statements.
BlackRock Global Absolute Return Bond Fund continued
USD 100,000 Citigroup Inc 1.70% 25/7/2016 74,563 0.04
USD 50,000 CNH Capital LLC 6.25% 1/11/2016 40,626 0.02
USD 4,531,042 COMM 2013-CR7 Mortgage Trust
FRN 10/3/2046 309,448 0.17
USD 7,991,377 COMM 2013-LC13 Mortgage Trust
FRN 10/8/2046 524,016 0.28
USD 80,000 Community Health Systems Inc
5.125% 15/8/2018 61,326 0.03
USD 477,882 Countrywide Asset-Backed
Certificates 2007-4 'A2'
FRN 25/4/2047 325,332 0.17
USD 300,000 Credit Acceptance Auto Loan Trust
2013-2A 'A' '144A' 1.50%
15/4/2021 220,252 0.12
USD 350,000 Credit Suisse Commercial Mortgage
Trust Series 2006-C5 'A3' 5.311%
15/12/2039 281,094 0.15
USD 60,000 DIRECTV Holdings LLC DIRECTV
Financing Co Inc 3.125% 15/2/2016 46,036 0.02
GBP 1,100,000 DIRECTV Holdings LLC DIRECTV
Financing Co Inc 5.20% 18/11/2033 1,303,871 0.70
USD 350,000 Discover Card Execution Note Trust
1.04% 15/4/2019 258,223 0.14
USD 32,000 ERP Operating LP 5.125% 15/3/2016 25,693 0.01
USD 43,000 ERP Operating LP 5.375% 1/8/2016 35,198 0.02
USD 100,000 ERP Operating LP 5.75% 15/6/2017 83,147 0.04
USD 27,670,873 Fannie Mae-Aces FRN 25/1/2022 2,674,945 1.43
USD 2,274,679 FHLMC Multifamily Structured
Pass Through Certificates FRN
25/7/2019 134,538 0.07
USD 3,587,093 FHLMC Multifamily Structured
Pass Through Certificates FRN
25/11/2019 177,851 0.10
USD 636,715 FHLMC Multifamily Structured
Pass Through Certificates FRN
25/6/2022 47,128 0.03
USD 299,191 FHLMC Multifamily Structured
Pass Through Certificates FRN
25/10/2022 13,717 0.01
USD 3,002,028 FHLMC Multifamily Structured
Pass Through Certificates FRN
25/11/2022 161,328 0.09
USD 3,178,416 FHLMC Multifamily Structured
Pass Through Certificates FRN
25/1/2023 137,752 0.07
USD 18,436,769 FHLMC Multifamily Structured
Pass Through Certificates FRN
25/4/2023 237,335 0.13
USD 29,000,000 FHLMC Multifamily Structured
Pass Through Certificates FRN
25/8/2023 731,893 0.39
USD 60,000 Fifth Third Bancorp 3.625% 25/1/2016 46,541 0.02
USD 550,000 Ford Credit Auto Owner Trust 0.67%
15/4/2018 404,427 0.22
USD 199,000 Ford Motor Credit Co LLC 5.625%
15/9/2015 158,700 0.08
USD 75,000 GATX Corp 2.50% 15/3/2019 55,270 0.03
USD 38,000 General Motors Co '144A' 3.50%
2/10/2018 28,606 0.02
USD 1,000,000 General Motors Co '144A' 6.25%
2/10/2043 750,027 0.40
USD 125,000 Goldman Sachs Group Inc 6.15%
1/4/2018 106,428 0.06
USD 150,000 GS Mortgage Securities Trust
2006-GG8 'AM' 5.591%
10/11/2039 121,818 0.07
USD 45,000 HCA Inc 6.50% 15/2/2016 36,274 0.02
USD 192,000 HCA Inc 7.875% 15/2/2020 152,829 0.08
USD 97,000 HCA Inc 7.25% 15/9/2020 78,102 0.04
USD 425,000 HCP Inc 4.25% 15/11/2023 310,736 0.17
USD 140,000 Health Care (Reit) Inc 6.20% 1/6/2016 115,151 0.06
USD 490,000 Hewlett-Packard Co 2.35% 15/3/2015 366,736 0.20
USD 100,000 Hilton USA Trust 4.611% 5/11/2030 73,899 0.04
USD 100,000 Hilton USA Trust 2013-HLT '144A' FRN
5/11/2030 73,900 0.04
USD 100,000 HLSS Servicer Advance Receivables
Trust - 2013-T3 'B3' '144A' 2.14%
15/5/2046 72,176 0.04
USD 250,000 HLSS Servicer Advance Receivables
Trust 2013-T2 'C2' '144A' 1.843%
16/5/2044 182,757 0.10
USD 190,000 Icahn Enterprises LP / Icahn
Enterprises Finance Corp 8.00%
15/1/2018 146,173 0.08
USD 60,000 IntercontinentalExchange Group Inc
2.50% 15/10/2018 45,084 0.02
USD 65,000 Iowa State Financial Authority 5.00%
1/12/2019 46,234 0.02
USD 1,591,218 JP Morgan Chase Commercial
Mortgage Securities Corp FRN
15/12/2047 125,655 0.07
USD 264,076 JP Morgan Chase Commercial
Mortgage Securities Trust
2006-LDP6 'A4' FRN 15/4/2043 211,809 0.11
USD 310,000 JP Morgan Chase Commercial
Mortgage Securities Trust
2007-CIBC18 'A4' 5.44% 12/6/2047 252,517 0.13
USD 53,287 JP Morgan Chase Commercial
Mortgage Securities Trust
2007-CIBC19 'A1A' FRN 12/2/2049 44,692 0.02
USD 59,900 JP Morgan Chase Commercial
Mortgage Securities Trust
2007-CIBC20 'AJ' FRN 12/2/2051 46,017 0.02
USD 5,585,534 JP Morgan Chase Commercial
Mortgage Securities Trust
2013-LC11 'XA' FRN 15/4/2046 402,249 0.21
USD 23,000 JPMorgan Chase & Co 3.45% 1/3/2016 17,822 0.01
USD 130,000 JPMorgan Chase & Co 3.15% 5/7/2016 100,479 0.05
USD 150,000 LB-UBS Commercial Mortgage Trust
2007-C2 FRN 15/2/2040 117,701 0.06
USD 250,000 LB-UBS Commercial Mortgage Trust
2007-C7 FRN 15/9/2045 212,652 0.11
USD 100,000 Maxim Integrated Products Inc 2.50%
15/11/2018 73,343 0.04
USD 100,000 Morgan Stanley 5.75% 18/10/2016 82,402 0.04
USD 450,000 Morgan Stanley 3.75% 25/2/2023 323,287 0.17
USD 845,000 Morgan Stanley 5.00% 24/11/2025 623,530 0.33
USD 42,800,983 Morgan Stanley Bank of America
Merrill Lynch Trust FRN
15/11/2046 2,561,946 1.37
USD 400,000 Morgan Stanley Capital I Trust
2007-IQ13 'AM' 5.406%
15/3/2044 321,776 0.17
EUR 400,000 NASDAQ OMX Group Inc/The 3.875%
7/6/2021 416,414 0.22
USD 725,000 Packaging Corp of America 4.50%
1/11/2023 540,172 0.29
Portfolio of Investments as at 30 November 2013
United States continued United States continued

Transferable Securities and Money Market Instruments Admitted to an Official Stock Exchange Listing or Dealt in on Another Regulated Market
Transferable Securities and Money Market Instruments Admitted to an Official Stock Exchange Listing or Dealt in on Another Regulated Market
Holding Description Market Value
(EUR) % Holding Description Market Value
(EUR) %
1 This fund is managed by BlackRock.
122 BlackRock Strategic Funds (BSF)
BlackRock Global Absolute Return Bond Fund continued
USD 85,000 Penske Truck Leasing Co LP / PTL
Finance Corp '144A' 2.50%
15/3/2016 64,084 0.03
USD 70,000 Petrohawk Energy Corp 6.25%
1/6/2019 56,367 0.03
USD 1,975,000 Philip Morris International Inc
4.875% 15/11/2043 1,437,388 0.77
USD 350,000 Prestige Auto Receivables Trust
2013-1A 'B' '144A' 1.74%
15/5/2019 256,076 0.14
USD 150,000 ProLogis LP 5.625% 15/11/2016 122,769 0.07
EUR 1,779,000 ProLogis LP 3.00% 18/1/2022 1,779,649 0.95
USD 120,000 Prudential Financial Inc 6.00%
1/12/2017 102,588 0.05
USD 110,000 Prudential Financial Inc FRN
15/8/2018 81,131 0.04
USD 100,000 Regions Financial Corp 2.00%
15/5/2018 72,403 0.04
USD 1,025,000 Santander Drive Auto Receivables
Trust FRN 17/4/2017 753,937 0.40
USD 85,000 Santander Drive Auto Receivables
Trust 2012-3 'C' 3.01% 16/4/2018 64,516 0.03
USD 300,000 Santander Drive Auto Receivables
Trust 2012-AA 'C' '144A' 1.78%
15/11/2018 220,538 0.12
USD 500,000 Santander Drive Auto Receivables
Trust 2013-3 'C' 1.81% 15/4/2019 362,671 0.19
USD 500,000 Santander Drive Auto Receivables
Trust 2013-3 'D' 2.42% 15/4/2019 366,619 0.20
USD 284,280 SLM Private Education Loan Trust
2013-C 'A1' '144A' FRN 15/2/2022 209,550 0.11
USD 146,802 SLM Student Loan Trust 2013-4 'A'
FRN 25/6/2027 107,797 0.06
USD 55,000 T-Mobile USA Inc '144A' 5.25%
1/9/2018 42,313 0.02
USD 151,000 Thermo Fisher Scientific Inc 2.25%
15/8/2016 113,792 0.06
USD 50,000 United Airlines Inc '144A' 6.75%
15/9/2015 37,961 0.02
USD 1,950,000 United States Treasury Note 0.25%
30/9/2015 1,433,735 0.76
USD 95,000 United States Treasury Note 1.00%
31/5/2018 69,307 0.04
USD 640,000 United States Treasury Note 1.375%
31/7/2018 473,547 0.25
USD 200,000 United States Treasury Note 1.125%
31/5/2019 143,594 0.08
USD 100,000 Ventas Realty LP 1.55% 26/9/2016 74,099 0.04
USD 62,000 Verizon Communications Inc 2.50%
15/9/2016 47,373 0.03
USD 113,000 Verizon Communications Inc 5.50%
1/4/2017 93,649 0.05
USD 725,000 Verizon Communications Inc 6.55%
15/9/2043 608,533 0.32
USD 850,000 Western Union Co /The 3.35%
22/5/2019 631,706 0.34
USD 5,062,825 WFRBS Commercial Mortgage Trust
2013-C14 'XA' FRN 15/6/2046 224,673 0.12
USD 549,049 WFRBS Commercial Mortgage Trust
2013-C15 'XA' FRN 15/8/2046 17,082 0.01
USD 200,000 WM Wrigley Jr Co '144A' 2.00%
20/10/2017 148,185 0.08
30,455,413 16.25
Total Bonds 159,612,448 85.13
TBA
United States USD 499,999 Fannie Mae Pool 3.00% TBA 354,964 0.19
USD 1,500,000 Fannie Mae Pool 4.00% TBA 1,151,237 0.61
USD 400,000 Fannie Mae Pool 5.00% TBA 319,681 0.17
USD 7,850,000 Fannie Mae Pool 3.50% TBA 5,824,581 3.11
USD 8,600,000 Fannie Mae Pool 4.50% TBA 6,748,638 3.60
14,399,101 7.68
Total TBA 14,399,101 7.68
Total Transferable Securities and Money
Market Instruments Admitted to an
Official Stock Exchange Listing or
Dealt in on Another Regulated Market 174,011,549 92.81
Funds
Luxembourg 92,879 BlackRock Global Funds - Emerging
Markets Bond Fund X2 EUR
hedged 1 1,398,758 0.75
265,473 BlackRock Global Funds - Emerging
Markets Local Currency Bond Fund
X2 EUR 1 1,369,841 0.73
227,539 BlackRock Global Funds - Global
High Yield Bond Fund X2 EUR
hedged 1 3,736,190 1.99
6,504,789 3.47
United Kingdom 2,080,000 BlackRock Corporate Bond
Fund - D Acc 1 6,533,380 3.49
6,533,380 3.49
Total Funds 13,038,169 6.96
Other Transferable Securities and Money Market Instruments
BONDS
Australia AUD 554,000 Western Australian Treasury Corp
6.00% 16/10/2023 401,607 0.22
401,607 0.22
United States GBP 100,000 Health Care (Reit) Inc 4.80%
20/11/2028 120,353 0.06
120,353 0.06
Total Bonds 521,960 0.28
Total Other Transferable Securities
and Money Market Instruments 521,960 0.28
Securities portfolio at market value 187,571,678 100.05
Other Net Assets (86,111) (0.05)
Total Net Assets (EUR) 187,485,567 100.00
Portfolio of Investments as at 30 November 2013
United States continued

Nominal Value Description
Unrealisedappreciation/
(depreciation)EUR
Nominal Value Description
Unrealisedappreciation/
(depreciation)EUR
Unaudited Interim Report and Accounts 123
The notes on pages 150 to 158 form an integral part of these financial statements.
TIME DEPOSITS Barclays Bank Plc 1,700,000 0.91
BNP Paribas SA 1,700,001 0.90
HSBC Bank Plc 1,700,000 0.91
ING Bank NV 1,700,001 0.91
Societe Generale SA 1,700,004 0.90
Total Time Deposits 8,500,006 4.53
Time Deposit as at 30 November 2013
Description
Market ValueEUR %
Swaps as at 30 November 2013
EUR 300,000 Credit Default Swaps (Bank of America
International Ltd) (Fund receives Fixed 1.000%
and provides default protection on RWE AG
5.750% 14/2/2033) (20/9/2018) 1,808
EUR 1,150,000 Credit Default Swaps (Bank of America) (Fund
receives default protection on Akzo Nobel
NV 8.000% 6/4/2016 and pays Fixed 1.000%)
(20/12/2018) (17,850)
EUR 660,000 Credit Default Swaps (Bank of America) (Fund
receives default protection on Alstom SA
4.125% 1/2/2017 and pays Fixed 1.000%)
(20/12/2018) (12,813)
EUR 122,800 Credit Default Swaps (Bank of America) (Fund
receives default protection on BASF SE
4.500% 29/6/2016 and pays Fixed 1.000%)
(20/9/2017) (2,657)
EUR 118,100 Credit Default Swaps (Bank of America) (Fund
receives default protection on BASF SE
4.500% 29/6/2016 and pays Fixed 1.000%)
(20/9/2017) (2,607)
EUR 240,000 Credit Default Swaps (Bank of America) (Fund
receives default protection on BBVA Senior
Finance SAU 4.875% 23/1/2014 and pays
Fixed 3.000%) (20/12/2018) (3,451)
EUR 50,000 Credit Default Swaps (Bank of America) (Fund
receives default protection on Bouygues SA
4.750% 24/5/2016 and pays Fixed 1.000%)
(20/6/2018) (896)
EUR 640,000 Credit Default Swaps (Bank of America) (Fund
receives default protection on Deutsche
Lufthansa AG 6.500% 7/7/2016 and pays
Fixed 1.000%) (20/12/2018) (11,594)
EUR 200,000 Credit Default Swaps (Bank of America) (Fund
receives default protection on Deutsche
Telekom International Finance BV 6.000%
20/1/2017 and pays Fixed 1.000%) (20/12/2018) (760)
EUR 300,000 Credit Default Swaps (Bank of America)
(Fund receives default protection on E.ON
International Finance BV 6.375% 29/5/2017
and pays Fixed 1.000%) (20/12/2018) (994)
EUR 500,000 Credit Default Swaps (Bank of America)
(Fund receives default protection on E.ON
International Finance BV 6.375% 29/5/2017
and pays Fixed 1.000%) (20/12/2018) (3,699)
EUR 170,000 Credit Default Swaps (Bank of America) (Fund
receives default protection on Electrolux AB
FRN 7/4/2016 and pays Fixed 1.000%)
(20/12/2018) (27)
EUR 540,000 Credit Default Swaps (Bank of America)
(Fund receives default protection on Enbw
International Finance BV 4.250% 19/10/2016
and pays Fixed 1.000%) (20/12/2018) (1,896)
EUR 200,000 Credit Default Swaps (Bank of America) (Fund
receives default protection on Experian
Finance Plc 4.750% 23/11/2018 and pays
Fixed 1.000%) (20/12/2018) (922)
EUR 73,394 Credit Default Swaps (Bank of America) (Fund
receives default protection on Finmeccanica
Finance SA/Old 5.750% 12/12/2018 and pays
Fixed 5.000%) (20/3/2018) (3,048)
EUR 210,000 Credit Default Swaps (Bank of America) (Fund
receives default protection on Lafarge SA
6.625% 29/11/2018 and pays Fixed 1.000%)
(20/12/2018) (2,724)
EUR 200,000 Credit Default Swaps (Bank of America) (Fund
receives default protection on Lafarge SA
6.625% 29/11/2018 and pays Fixed 1.000%)
(20/12/2018) (2,594)
EUR 80,000 Credit Default Swaps (Bank of America) (Fund
receives default protection on LANXESS
Finance BV 7.750% 9/4/2014 and pays Fixed
1.000%) (20/3/2018) (701)
EUR 110,000 Credit Default Swaps (Bank of America) (Fund
receives default protection on LANXESS
Finance BV 7.750% 9/4/2014 and pays Fixed
1.000%) (20/3/2018) (1,066)
EUR 1,150,000 Credit Default Swaps (Bank of America) (Fund
receives default protection on LANXESS
Finance BV 7.750% 9/4/2014 and pays Fixed
1.000%) (20/12/2018) (5,332)
EUR 10,000 Credit Default Swaps (Bank of America) (Fund
receives default protection on Metsa Board
OYJ 8.750% 1/4/2013 and pays Fixed 5.000%)
(20/12/2017) (1,171)
EUR 70,000 Credit Default Swaps (Bank of America) (Fund
receives default protection on Metsa OYJ
3.800% 27/6/2022 and pays Fixed 5.000%)
(20/12/2018) 113
EUR 60,000 Credit Default Swaps (Bank of America) (Fund
receives default protection on Metsa OYJ
3.800% 27/6/2022 and pays Fixed 5.000%)
(20/12/2018) (429)
EUR 680,000 Credit Default Swaps (Bank of America) (Fund
receives default protection on Orange SA
5.625% 22/5/2018 and pays Fixed 1.000%)
(20/12/2018) (8,120)
EUR 105,200 Credit Default Swaps (Bank of America) (Fund
receives default protection on PostNL NV
3.875% 1/6/2015 and pays Fixed 1.000%)
(20/9/2017) (5,296)
EUR 50,000 Credit Default Swaps (Bank of America) (Fund
receives default protection on Rallye SA
7.625% 4/11/2016 and pays Fixed 5.000%)
(20/12/2017) (4,564)
BlackRock Global Absolute Return Bond Fund continued

Nominal Value Description
Unrealisedappreciation/
(depreciation)EUR
Nominal Value Description
Unrealisedappreciation/
(depreciation)EUR
124 BlackRock Strategic Funds (BSF)
Swaps as at 30 November 2013
EUR 80,000 Credit Default Swaps (Bank of America) (Fund
receives default protection on Rallye SA
7.625% 4/11/2016 and pays Fixed 5.000%)
(20/6/2018) (163)
EUR 200,000 Credit Default Swaps (Bank of America) (Fund
receives default protection on Rallye SA
7.625% 4/11/2016 and pays Fixed 5.000%)
(20/9/2017) (24,354)
EUR 580,000 Credit Default Swaps (Bank of America) (Fund
receives default protection on RWE AG 5.750%
14/2/2033 and pays Fixed 1.000%)
(20/12/2018) (4,585)
EUR 740,000 Credit Default Swaps (Bank of America) (Fund
receives default protection on SABMiller Plc
6.625% 15/8/2033 and pays Fixed 1.000%)
(20/12/2018) (4,622)
EUR 200,000 Credit Default Swaps (Bank of America) (Fund
receives default protection on Schneider
Electric SA 4.500% 17/1/2014 and pays Fixed
1.000%) (20/9/2017) (4,493)
EUR 110,000 Credit Default Swaps (Bank of America) (Fund
receives default protection on Societe Air
France SA 2.75% 1/4/2020 and pays Fixed
5.000%) (20/12/2018) 80
EUR 40,000 Credit Default Swaps (Bank of America) (Fund
receives default protection on Societe Air
France SA 2.750% 1/4/2020 and pays Fixed
5.000%) (20/9/2018) (3,700)
EUR 50,000 Credit Default Swaps (Bank of America) (Fund
receives default protection on Solvay SA
4.625% 27/6/2018 and pays Fixed 1.000%)
(20/6/2018) (617)
EUR 60,000 Credit Default Swaps (Bank of America) (Fund
receives default protection on Stena AB
6.125% 1/2/2017 and pays Fixed 5.000%)
(20/12/2017) (5,241)
EUR 100,000 Credit Default Swaps (Bank of America) (Fund
receives default protection on Telecom Italia
SpA 5.375% 29/1/2019 and pays Fixed 1.000%)
(20/3/2018) (4,807)
EUR 400,000 Credit Default Swaps (Bank of America) (Fund
receives default protection on ThyssenKrupp
AG 4.375% 18/3/2015 and pays Fixed 1.000%)
(20/6/2018) (11,655)
EUR 160,000 Credit Default Swaps (Bank of America) (Fund
receives default protection on ThyssenKrupp
AG 4.375% 18/3/2015 and pays Fixed 1.000%)
(20/12/2018) (3,305)
EUR 500,000 Credit Default Swaps (Bank of America) (Fund
receives default protection on ThyssenKrupp
AG 4.375% 18/3/2015 and pays Fixed 1.000%)
(20/6/2017) (78,402)
EUR 800,000 Credit Default Swaps (Bank of America) (Fund
receives default protection on UniCredit SpA
4.375% 29/1/2020 and pays Fixed 3.000%)
(20/12/2018) (16,765)
EUR 400,000 Credit Default Swaps (Bank of America) (Fund
receives default protection on Vinci SA 4.125%
20/2/2017 and pays Fixed 1.000%)
(20/9/2018) (11,567)
EUR 220,000 Credit Default Swaps (Bank of America) (Fund
receives default protection on Volvo Treasury
AB 5% 31/5/2017 and pays Fixed 1.000%)
(20/12/2018) (1,896)
USD 800,000 Credit Default Swaps (Bank of America) (Fund
receives default protection on Western Union
Co/The 3.65% 22/8/2018 and pays Fixed
1.000%) (20/12/2018) (2,649)
EUR 90,000 Credit Default Swaps (Bank of America) (Fund
receives Fixed 1.000% and provides default
protection on ArcelorMittal 6.125% 1/6/2018)
(20/12/2018) 2,182
EUR 140,000 Credit Default Swaps (Bank of America) (Fund
receives Fixed 1.000% and provides default
protection on ArcelorMittal 6.125% 1/6/2018)
(20/12/2018) 3,329
EUR 100,000 Credit Default Swaps (Bank of America) (Fund
receives Fixed 1.000% and provides default
protection on BMW Finance NV 5.000%
6/8/2018) (20/12/2018) 978
EUR 450,000 Credit Default Swaps (Bank of America) (Fund
receives Fixed 1.000% and provides default
protection on Carrefour SA 4.375% 2/11/2016)
(20/12/2018) 4,944
EUR 180,000 Credit Default Swaps (Bank of America) (Fund
receives Fixed 1.000% and provides default
protection on Enel SpA 5.25% 20/6/2017)
(20/12/2018) 684
EUR 420,000 Credit Default Swaps (Bank of America) (Fund
receives Fixed 1.000% and provides default
protection on GKN Holdings Plc 6.750%
28/10/2019) (20/12/2018) 8,778
EUR 110,000 Credit Default Swaps (Bank of America) (Fund
receives Fixed 1.000% and provides default
protection on Glencore Finance Europe SA
6.500% 27/2/2019) (20/12/2018) 2,421
EUR 430,000 Credit Default Swaps (Bank of America)
(Fund receives Fixed 1.000% and provides
default protection on Kingfisher Plc 5.625%
15/12/2014) (20/12/2018) 3,887
EUR 390,000 Credit Default Swaps (Bank of America) (Fund
receives Fixed 1.000% and provides default
protection on Koninklijke KPN NV 8.375%
1/10/2030) (20/12/2018) 1,891
EUR 400,000 Credit Default Swaps (Bank of America) (Fund
receives Fixed 1.000% and provides default
protection on Next Plc 5.375% 26/10/2021)
(20/6/2018) 8,214
EUR 126,000 Credit Default Swaps (Bank of America) (Fund
receives Fixed 1.000% and provides default
protection on Publicis Groupe SA 4.250%
31/3/2015) (20/9/2017) 3,476
EUR 100,000 Credit Default Swaps (Bank of America) (Fund
receives Fixed 1.000% and provides default
protection on Rolls-Royce Plc 7.375%
14/6/2016) (20/12/2017) 1,697
EUR 170,000 Credit Default Swaps (Bank of America) (Fund
receives Fixed 1.000% and provides default
protection on Telefonaktiebolaget LM Ericsson
5.375% 27/6/2017) (20/12/2018) 1,406
EUR 700,000 Credit Default Swaps (Bank of America) (Fund
receives Fixed 1.000% and provides default
protection on Telefonaktiebolaget LM Ericsson
5.375% 27/6/2017) (20/12/2018) 3,734
EUR 260,000 Credit Default Swaps (Bank of America) (Fund
receives Fixed 5.000% and provides default
protection on British Airways Plc 8.750%
23/8/2016) (20/12/2018) 11,191
EUR 350,000 Credit Default Swaps (Bank of America) (Fund
receives Fixed 5.000% and provides default
protection on CIR-Compagnie Industriali
Riunite SpA 5.750% 16/12/2024) (20/12/2018) (3,531)
EUR 810,000 Credit Default Swaps (Bank of America) (Fund
receives Fixed 5.000% and provides default
protection on Conti-Gummi Finance BV
7.500% 15/9/2017) (20/12/2018) 21,871
BlackRock Global Absolute Return Bond Fund continued

Nominal Value Description
Unrealisedappreciation/
(depreciation)EUR
Nominal Value Description
Unrealisedappreciation/
(depreciation)EUR
Unaudited Interim Report and Accounts 125
The notes on pages 150 to 158 form an integral part of these financial statements.
Swaps as at 30 November 2013
EUR 320,000 Credit Default Swaps (Bank of America) (Fund
receives Fixed 5.000% and provides default
protection on Conti-Gummi Finance BV
7.500% 15/9/2017) (20/12/2018) 3,004
EUR 50,000 Credit Default Swaps (Bank of America) (Fund
receives Fixed 5.000% and provides default
protection on ConvaTec Healthcare E SA
10.875% 15/12/2018) (20/12/2017) 5,948
EUR 20,000 Credit Default Swaps (Bank of America) (Fund
receives Fixed 5.000% and provides default
protection on Eileme 2 AB 11.750% 31/1/2020)
(20/12/2018) 3,637
EUR 190,000 Credit Default Swaps (Bank of America) (Fund
receives Fixed 5.000% and provides default
protection on Jaguar Land Rover Automotive
PLC 8.125% 15/5/2018) (20/12/2018) 6,500
EUR 50,000 Credit Default Swaps (Bank of America) (Fund
receives Fixed 5.000% and provides default
protection on Melia Hotels International SA
5.000% 18/12/2014) (20/3/2018) 7,032
EUR 50,000 Credit Default Swaps (Bank of America) (Fund
receives Fixed 5.000% and provides default
protection on Melia Hotels International SA
5.000% 18/12/2014) (20/3/2018) 7,032
EUR 30,000 Credit Default Swaps (Bank of America) (Fund
receives Fixed 5.000% and provides default
protection on Melia Hotels International SA
5.000% 18/12/2014) (20/3/2018) 4,294
EUR 50,000 Credit Default Swaps (Bank of America) (Fund
receives Fixed 5.000% and provides default
protection on Melia Hotels International SA
5.000% 18/12/2014) (20/3/2018) 6,907
EUR 50,000 Credit Default Swaps (Bank of America) (Fund
receives Fixed 5.000% and provides default
protection on Melia Hotels International SA
5.000% 18/12/2014) (20/6/2018) 4,782
EUR 40,000 Credit Default Swaps (Bank of America) (Fund
receives Fixed 5.000% and provides default
protection on Melia Hotels International SA
5.000% 18/12/2014) (20/12/2018) 1,399
EUR 50,000 Credit Default Swaps (Bank of America) (Fund
receives Fixed 5.000% and provides default
protection on Nokia OYJ 6.750% 4/2/2019)
(20/12/2017) 10,495
EUR 70,000 Credit Default Swaps (Bank of America) (Fund
receives Fixed 5.000% and provides default
protection on Peugeot SA 8.375% 15/7/2014)
(20/9/2018) 4,909
EUR 40,000 Credit Default Swaps (Bank of America) (Fund
receives Fixed 5.000% and provides default
protection on Scandinavian Airlines 9.65%
16/6/2014) (20/12/2018) (625)
EUR 100,000 Credit Default Swaps (Bank of America) (Fund
receives Fixed 5.000% and provides default
protection on TUI AG 2.750% 24/3/2016)
(20/12/2018) 2,911
EUR 60,000 Credit Default Swaps (Bank of America) (Fund
receives Fixed 5.000% and provides default
protection on TUI AG 5.125% 10/12/2012)
(20/12/2017) 5,194
EUR 100,000 Credit Default Swaps (Bank of America) (Fund
receives Fixed 5.000% and provides default
protection on TUI AG 5.125% 10/12/2012)
(20/12/2017) 10,650
EUR 100,000 Credit Default Swaps (Bank of America) (Fund
receives Fixed 5.000% and provides default
protection on Wendel SA 4.875% 26/5/2016)
(20/12/2017) 5,731
EUR 220,000 Credit Default Swaps (Barclays Bank) (Fund
receives default protection on Anglo American
Capital PLC 5.875% 17/4/2015 and pays Fixed
1.000%) (20/12/2018) 180
EUR 70,000 Credit Default Swaps (Barclays Bank)
(Fund receives default protection on BAT
International Finance Plc 5.875% 12/3/2015
and pays Fixed 1.000%) (20/12/2017) (367)
EUR 570,000 Credit Default Swaps (Barclays Bank) (Fund
receives default protection on Deutsche
Telekom International Finance BV 6.000%
20/1/2017 and pays Fixed 1.000%) (20/6/2018) (7,842)
EUR 200,000 Credit Default Swaps (Barclays Bank) (Fund
receives default protection on Deutsche
Telekom International Finance BV 6.000%
20/1/2017 and pays Fixed 1.000%) (20/6/2017) (5,247)
EUR 170,000 Credit Default Swaps (Barclays Bank) (Fund
receives default protection on Fiat Finance
North America Inc 5.625% 12/6/2017 and pays
Fixed 5.000%) (20/12/2018) (3,863)
EUR 150,000 Credit Default Swaps (Barclays Bank) (Fund
receives default protection on Finmeccanica
Finance SA/Old 5.75% 12/12/2018 and pays
Fixed 5.000%) (20/12/2018) (540)
EUR 400,000 Credit Default Swaps (Barclays Bank) (Fund
receives default protection on GDF Suez
5.125% 19/2/2018 and pays Fixed 1.000%)
(20/6/2018) (9,393)
EUR 415,000 Credit Default Swaps (Barclays Bank) (Fund
receives default protection on Intesa Sanpaolo
SpA 4.75% 15/6/2017 and pays Fixed 3.000%)
(20/12/2018) (4,878)
EUR 4,800,000 Credit Default Swaps (Barclays Bank) (Fund
receives default protection on iTraxx Europe
Series 20 Version 1 and pays Fixed 1.000%)
(20/12/2018) (2,210)
EUR 8,900,000 Credit Default Swaps (Barclays Bank) (Fund
receives default protection on iTraxx Europe
Series 20 Version 1 and pays Fixed 1.000%)
(20/12/2018) (12,355)
EUR 40,000 Credit Default Swaps (Barclays Bank) (Fund
receives default protection on LANXESS
Finance BV 7.750% 9/4/2014 and pays Fixed
1.000%) (20/3/2018) (321)
EUR 100,000 Credit Default Swaps (Barclays Bank) (Fund
receives default protection on Orange SA
5.625% 22/5/2018 and pays Fixed 1.000%)
(20/12/2017) (3,313)
EUR 300,000 Credit Default Swaps (Barclays Bank) (Fund
receives default protection on Pernod Ricard
SA 4.875% 18/3/2016 and pays Fixed 1.000%)
(20/9/2018) (3,600)
EUR 300,000 Credit Default Swaps (Barclays Bank) (Fund
receives default protection on Pernod Ricard
SA 4.875% 18/3/2016 and pays Fixed 1.000%)
(20/9/2018) (3,452)
EUR 200,000 Credit Default Swaps (Barclays Bank) (Fund
receives default protection on Pernod Ricard
SA 4.875% 18/3/2016 and pays Fixed 1.000%)
(20/9/2018) (2,203)
EUR 150,000 Credit Default Swaps (Barclays Bank) (Fund
receives default protection on Portugal
Telecom International Finance BV 4.375%
24/3/2017 and pays Fixed 5.000%) (20/6/2018) (9,010)
EUR 100,000 Credit Default Swaps (Barclays Bank) (Fund
receives default protection on Portugal
Telecom International Finance BV 4.375%
24/3/2017 and pays Fixed 5.000%) (20/6/2018) (7,197)
BlackRock Global Absolute Return Bond Fund continued

Nominal Value Description
Unrealisedappreciation/
(depreciation)EUR
Nominal Value Description
Unrealisedappreciation/
(depreciation)EUR
126 BlackRock Strategic Funds (BSF)
Swaps as at 30 November 2013
EUR 30,000 Credit Default Swaps (Barclays Bank) (Fund
receives default protection on Rallye SA
7.625% 4/11/2016 and pays Fixed 5.000%)
(20/6/2018) (1,106)
EUR 90,000 Credit Default Swaps (Barclays Bank)
(Fund receives default protection on
STMicroelectronics NV and pays Fixed 1.000%)
(20/12/2018) (47)
EUR 170,000 Credit Default Swaps (Barclays Bank) (Fund
receives default protection on Suedzucker
International Finance BV 4.125% 29/3/2018
and pays Fixed 1.000%) (20/6/2018) 1,779
EUR 260,000 Credit Default Swaps (Barclays Bank) (Fund
receives default protection on Suedzucker
International Finance BV 4.125% 29/3/2018
and pays Fixed 1.000%) (20/12/2018) (2,202)
EUR 50,000 Credit Default Swaps (Barclays Bank) (Fund
receives default protection on Swedish Match
AB 4.625% 28/6/2013 and pays Fixed 1.000%)
(20/6/2018) (349)
EUR 80,000 Credit Default Swaps (Barclays Bank) (Fund
receives default protection on Virgin Media
Finance Plc 4.875% 15/2/2022 and pays Fixed
5.000%) (20/12/2018) (1,892)
EUR 2,300,000 Credit Default Swaps (Barclays Bank) (Fund
receives default protection on Vodafone Group
Plc 5.000% 4/6/2018 and pays Fixed 1.000%)
(20/9/2018) (20,714)
EUR 160,000 Credit Default Swaps (Barclays Bank) (Fund
receives Fixed 1.000% and provides default
protection on Enel SpA 5.25% 20/6/2017)
(20/12/2018) 1,522
EUR 150,000 Credit Default Swaps (Barclays Bank) (Fund
receives Fixed 1.000% and provides default
protection on GKN Holdings PLC 6.75%
28/10/2019) (20/12/2018) 1,068
EUR 30,000 Credit Default Swaps (Barclays Bank) (Fund
receives Fixed 1.000% and provides default
protection on Glencore Finance Europe SA
6.500% 27/2/2019) (20/12/2018) 575
EUR 70,000 Credit Default Swaps (Barclays Bank) (Fund
receives Fixed 1.000% and provides default
protection on Glencore Finance Europe SA
6.500% 27/2/2019) (20/12/2018) 157
EUR 300,000 Credit Default Swaps (Barclays Bank) (Fund
receives Fixed 1.000% and provides default
protection on J Sainsbury Plc 4.250%
16/7/2014) (20/12/2018) 3,377
EUR 200,000 Credit Default Swaps (Barclays Bank) (Fund
receives Fixed 1.000% and provides default
protection on Kering 3.750% 8/4/2015)
(20/12/2017) 7,316
EUR 100,000 Credit Default Swaps (Barclays Bank) (Fund
receives Fixed 1.000% and provides default
protection on Kingfisher Plc 5.625%
15/12/2014) (20/12/2017) 2,935
EUR 70,000 Credit Default Swaps (Barclays Bank) (Fund
receives Fixed 1.000% and provides default
protection on Kingfisher Plc 5.625%
15/12/2014) (20/12/2017) 1,928
EUR 80,000 Credit Default Swaps (Barclays Bank) (Fund
receives Fixed 1.000% and provides default
protection on Kingfisher Plc 5.625%
15/12/2014) (20/12/2017) 2,240
EUR 60,000 Credit Default Swaps (Barclays Bank) (Fund
receives Fixed 1.000% and provides default
protection on National Grid Plc 5.000%
2/7/2018) (20/6/2018) 199
EUR 200,000 Credit Default Swaps (Barclays Bank) (Fund
receives Fixed 1.000% and provides default
protection on Next Plc 5.375% 26/10/2021)
(20/6/2018) 2,136
EUR 650,000 Credit Default Swaps (Barclays Bank) (Fund
receives Fixed 1.000% and provides default
protection on Next Plc 5.375% 26/10/2021)
(20/6/2017) 29,053
EUR 570,000 Credit Default Swaps (Barclays Bank) (Fund
receives Fixed 1.000% and provides default
protection on Orange SA 5.625% 22/5/2018)
(20/6/2018) 11,278
EUR 50,000 Credit Default Swaps (Barclays Bank) (Fund
receives Fixed 1.000% and provides default
protection on Pernod Ricard SA 4.625%
6/12/2013) (20/12/2017) 787
EUR 100,000 Credit Default Swaps (Barclays Bank) (Fund
receives Fixed 1.000% and provides default
protection on Renault SA FRN 4/8/2014)
(20/6/2018) 4,828
EUR 300,000 Credit Default Swaps (Barclays Bank) (Fund
receives Fixed 1.000% and provides default
protection on RWE AG 5.750% 14/2/2033)
(20/9/2018) 4,030
EUR 300,000 Credit Default Swaps (Barclays Bank) (Fund
receives Fixed 1.000% and provides default
protection on RWE AG 5.750% 14/2/2033)
(20/9/2018) 2,253
EUR 200,000 Credit Default Swaps (Barclays Bank) (Fund
receives Fixed 1.000% and provides default
protection on RWE AG 5.750% 14/2/2033)
(20/9/2018) 1,205
EUR 280,000 Credit Default Swaps (Barclays Bank) (Fund
receives Fixed 1.000% and provides default
protection on Vodafone Group PLC 5%
4/6/2018) (20/12/2018) 521
EUR 300,000 Credit Default Swaps (Barclays Bank) (Fund
receives Fixed 5.000% and provides default
protection on Ardagh Packaging Finance Plc
9.250% 15/10/2020) (20/12/2017) 25,642
EUR 100,000 Credit Default Swaps (Barclays Bank) (Fund
receives Fixed 5.000% and provides default
protection on Ardagh Packaging Finance Plc
9.250% 15/10/2020) (20/12/2018) 5,470
EUR 100,000 Credit Default Swaps (Barclays Bank) (Fund
receives Fixed 5.000% and provides default
protection on British Airways PLC 8.75%
23/8/2016) (20/12/2018) 232
EUR 50,000 Credit Default Swaps (Barclays Bank) (Fund
receives Fixed 5.000% and provides default
protection on ConvaTec Healthcare E SA
10.875% 15/12/2018) (20/6/2018) 3,076
EUR 110,000 Credit Default Swaps (Barclays Bank) (Fund
receives Fixed 5.000% and provides default
protection on Melia Hotels International SA 5%
18/12/2014) (20/12/2018) 323
EUR 235,000 Credit Default Swaps (BNP Paribas) (Fund
receives default protection on Anglo American
Capital PLC 5.875% 17/4/2015 and pays Fixed
1.000%) (20/12/2018) 580
EUR 235,000 Credit Default Swaps (BNP Paribas) (Fund
receives default protection on BBVA Senior
Finance SAU 4.875% 23/1/2014 and pays Fixed
3.000%) (20/12/2018) (3,147)
EUR 60,000 Credit Default Swaps (BNP Paribas) (Fund
receives default protection on Electrolux AB
FRN 7/4/2016 and pays Fixed 1.000%)
(20/12/2018) (44)
BlackRock Global Absolute Return Bond Fund continued
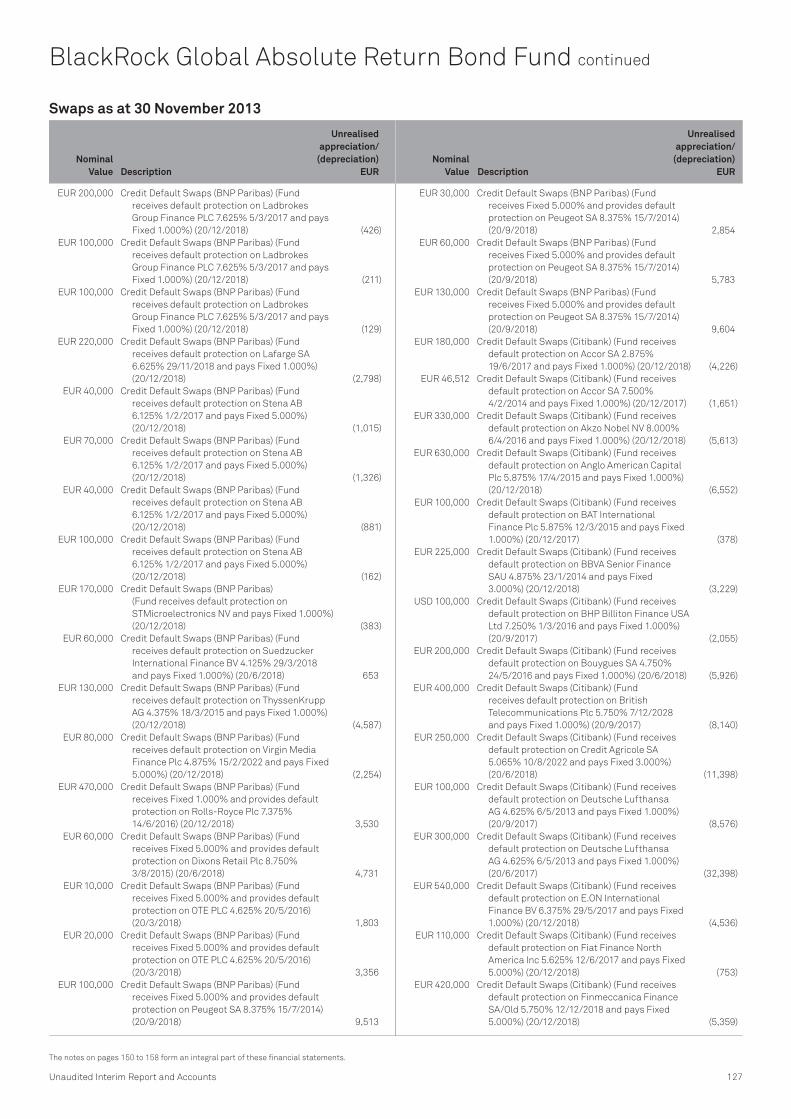
Nominal Value Description
Unrealisedappreciation/
(depreciation)EUR
Nominal Value Description
Unrealisedappreciation/
(depreciation)EUR
Unaudited Interim Report and Accounts 127
The notes on pages 150 to 158 form an integral part of these financial statements.
Swaps as at 30 November 2013
EUR 200,000 Credit Default Swaps (BNP Paribas) (Fund
receives default protection on Ladbrokes
Group Finance PLC 7.625% 5/3/2017 and pays
Fixed 1.000%) (20/12/2018) (426)
EUR 100,000 Credit Default Swaps (BNP Paribas) (Fund
receives default protection on Ladbrokes
Group Finance PLC 7.625% 5/3/2017 and pays
Fixed 1.000%) (20/12/2018) (211)
EUR 100,000 Credit Default Swaps (BNP Paribas) (Fund
receives default protection on Ladbrokes
Group Finance PLC 7.625% 5/3/2017 and pays
Fixed 1.000%) (20/12/2018) (129)
EUR 220,000 Credit Default Swaps (BNP Paribas) (Fund
receives default protection on Lafarge SA
6.625% 29/11/2018 and pays Fixed 1.000%)
(20/12/2018) (2,798)
EUR 40,000 Credit Default Swaps (BNP Paribas) (Fund
receives default protection on Stena AB
6.125% 1/2/2017 and pays Fixed 5.000%)
(20/12/2018) (1,015)
EUR 70,000 Credit Default Swaps (BNP Paribas) (Fund
receives default protection on Stena AB
6.125% 1/2/2017 and pays Fixed 5.000%)
(20/12/2018) (1,326)
EUR 40,000 Credit Default Swaps (BNP Paribas) (Fund
receives default protection on Stena AB
6.125% 1/2/2017 and pays Fixed 5.000%)
(20/12/2018) (881)
EUR 100,000 Credit Default Swaps (BNP Paribas) (Fund
receives default protection on Stena AB
6.125% 1/2/2017 and pays Fixed 5.000%)
(20/12/2018) (162)
EUR 170,000 Credit Default Swaps (BNP Paribas)
(Fund receives default protection on
STMicroelectronics NV and pays Fixed 1.000%)
(20/12/2018) (383)
EUR 60,000 Credit Default Swaps (BNP Paribas) (Fund
receives default protection on Suedzucker
International Finance BV 4.125% 29/3/2018
and pays Fixed 1.000%) (20/6/2018) 653
EUR 130,000 Credit Default Swaps (BNP Paribas) (Fund
receives default protection on ThyssenKrupp
AG 4.375% 18/3/2015 and pays Fixed 1.000%)
(20/12/2018) (4,587)
EUR 80,000 Credit Default Swaps (BNP Paribas) (Fund
receives default protection on Virgin Media
Finance Plc 4.875% 15/2/2022 and pays Fixed
5.000%) (20/12/2018) (2,254)
EUR 470,000 Credit Default Swaps (BNP Paribas) (Fund
receives Fixed 1.000% and provides default
protection on Rolls-Royce Plc 7.375%
14/6/2016) (20/12/2018) 3,530
EUR 60,000 Credit Default Swaps (BNP Paribas) (Fund
receives Fixed 5.000% and provides default
protection on Dixons Retail Plc 8.750%
3/8/2015) (20/6/2018) 4,731
EUR 10,000 Credit Default Swaps (BNP Paribas) (Fund
receives Fixed 5.000% and provides default
protection on OTE PLC 4.625% 20/5/2016)
(20/3/2018) 1,803
EUR 20,000 Credit Default Swaps (BNP Paribas) (Fund
receives Fixed 5.000% and provides default
protection on OTE PLC 4.625% 20/5/2016)
(20/3/2018) 3,356
EUR 100,000 Credit Default Swaps (BNP Paribas) (Fund
receives Fixed 5.000% and provides default
protection on Peugeot SA 8.375% 15/7/2014)
(20/9/2018) 9,513
EUR 30,000 Credit Default Swaps (BNP Paribas) (Fund
receives Fixed 5.000% and provides default
protection on Peugeot SA 8.375% 15/7/2014)
(20/9/2018) 2,854
EUR 60,000 Credit Default Swaps (BNP Paribas) (Fund
receives Fixed 5.000% and provides default
protection on Peugeot SA 8.375% 15/7/2014)
(20/9/2018) 5,783
EUR 130,000 Credit Default Swaps (BNP Paribas) (Fund
receives Fixed 5.000% and provides default
protection on Peugeot SA 8.375% 15/7/2014)
(20/9/2018) 9,604
EUR 180,000 Credit Default Swaps (Citibank) (Fund receives
default protection on Accor SA 2.875%
19/6/2017 and pays Fixed 1.000%) (20/12/2018) (4,226)
EUR 46,512 Credit Default Swaps (Citibank) (Fund receives
default protection on Accor SA 7.500%
4/2/2014 and pays Fixed 1.000%) (20/12/2017) (1,651)
EUR 330,000 Credit Default Swaps (Citibank) (Fund receives
default protection on Akzo Nobel NV 8.000%
6/4/2016 and pays Fixed 1.000%) (20/12/2018) (5,613)
EUR 630,000 Credit Default Swaps (Citibank) (Fund receives
default protection on Anglo American Capital
Plc 5.875% 17/4/2015 and pays Fixed 1.000%)
(20/12/2018) (6,552)
EUR 100,000 Credit Default Swaps (Citibank) (Fund receives
default protection on BAT International
Finance Plc 5.875% 12/3/2015 and pays Fixed
1.000%) (20/12/2017) (378)
EUR 225,000 Credit Default Swaps (Citibank) (Fund receives
default protection on BBVA Senior Finance
SAU 4.875% 23/1/2014 and pays Fixed
3.000%) (20/12/2018) (3,229)
USD 100,000 Credit Default Swaps (Citibank) (Fund receives
default protection on BHP Billiton Finance USA
Ltd 7.250% 1/3/2016 and pays Fixed 1.000%)
(20/9/2017) (2,055)
EUR 200,000 Credit Default Swaps (Citibank) (Fund receives
default protection on Bouygues SA 4.750%
24/5/2016 and pays Fixed 1.000%) (20/6/2018) (5,926)
EUR 400,000 Credit Default Swaps (Citibank) (Fund
receives default protection on British
Telecommunications Plc 5.750% 7/12/2028
and pays Fixed 1.000%) (20/9/2017) (8,140)
EUR 250,000 Credit Default Swaps (Citibank) (Fund receives
default protection on Credit Agricole SA
5.065% 10/8/2022 and pays Fixed 3.000%)
(20/6/2018) (11,398)
EUR 100,000 Credit Default Swaps (Citibank) (Fund receives
default protection on Deutsche Lufthansa
AG 4.625% 6/5/2013 and pays Fixed 1.000%)
(20/9/2017) (8,576)
EUR 300,000 Credit Default Swaps (Citibank) (Fund receives
default protection on Deutsche Lufthansa
AG 4.625% 6/5/2013 and pays Fixed 1.000%)
(20/6/2017) (32,398)
EUR 540,000 Credit Default Swaps (Citibank) (Fund receives
default protection on E.ON International
Finance BV 6.375% 29/5/2017 and pays Fixed
1.000%) (20/12/2018) (4,536)
EUR 110,000 Credit Default Swaps (Citibank) (Fund receives
default protection on Fiat Finance North
America Inc 5.625% 12/6/2017 and pays Fixed
5.000%) (20/12/2018) (753)
EUR 420,000 Credit Default Swaps (Citibank) (Fund receives
default protection on Finmeccanica Finance
SA/Old 5.750% 12/12/2018 and pays Fixed
5.000%) (20/12/2018) (5,359)
BlackRock Global Absolute Return Bond Fund continued

Nominal Value Description
Unrealisedappreciation/
(depreciation)EUR
Nominal Value Description
Unrealisedappreciation/
(depreciation)EUR
128 BlackRock Strategic Funds (BSF)
Swaps as at 30 November 2013
EUR 8,200,000 Credit Default Swaps (Citibank) (Fund receives
default protection on iTraxx Europe Series 20
Version 1 and pays Fixed 1.000%)
(20/12/2018) (22,178)
EUR 4,000,000 Credit Default Swaps (Citibank) (Fund receives
default protection on iTraxx Europe Series 20
Version 1 and pays Fixed 1.000%) (20/12/2018) (10,020)
EUR 4,100,000 Credit Default Swaps (Citibank) (Fund receives
default protection on iTraxx Europe Series 20
Version 1 and pays Fixed 1.000%) (20/12/2018) (12,316)
EUR 250,000 Credit Default Swaps (Citibank) (Fund receives
default protection on Lloyds Bank Plc 3.375%
20/4/2015 and pays Fixed 1.000%) (20/6/2018) (10,960)
EUR 200,000 Credit Default Swaps (Citibank) (Fund receives
default protection on Michelin Luxembourg
SCS 2.75% 20/6/2019 and pays Fixed 1.000%)
(20/12/2018) (531)
EUR 60,000 Credit Default Swaps (Citibank) (Fund receives
default protection on Rallye SA 7.625%
4/11/2016 and pays Fixed 5.000%) (20/12/2018) (1,858)
EUR 320,000 Credit Default Swaps (Citibank) (Fund receives
default protection on RWE AG 5.750%
14/2/2033 and pays Fixed 1.000%) (20/12/2018) (2,054)
EUR 270,000 Credit Default Swaps (Citibank) (Fund receives
default protection on SABMiller Plc 6.625%
15/8/2033 and pays Fixed 1.000%) (20/12/2018) (1,548)
EUR 650,000 Credit Default Swaps (Citibank) (Fund receives
default protection on Securitas AB 6.500%
2/4/2013 and pays Fixed 1.000%) (20/9/2017) (10,618)
EUR 210,000 Credit Default Swaps (Citibank) (Fund receives
default protection on Societe Air France SA
2.75% 1/4/2020 and pays Fixed 5.000%)
(20/12/2018) (225)
EUR 15,336 Credit Default Swaps (Citibank) (Fund receives
default protection on Societe Air France SA
2.750% 1/4/2020 and pays Fixed 5.000%)
(20/9/2018) (1,402)
EUR 15,335 Credit Default Swaps (Citibank) (Fund receives
default protection on Societe Air France SA
2.750% 1/4/2020 and pays Fixed 5.000%)
(20/9/2018) (1,402)
EUR 60,000 Credit Default Swaps (Citibank) (Fund receives
default protection on Solvay SA 4.625%
27/6/2018 and pays Fixed 1.000%) (20/9/2018) (1,364)
EUR 700,000 Credit Default Swaps (Citibank) (Fund receives
default protection on St-Gobain Nederland
BV 5.000% 25/4/2014 and pays Fixed 1.000%)
(20/6/2018) (21,629)
EUR 620,000 Credit Default Swaps (Citibank) (Fund receives
default protection on STMicroelectronics
Finance BV 0.652% 17/3/2013 and pays Fixed
1.000%) (20/12/2018) (1,502)
EUR 180,000 Credit Default Swaps (Citibank) (Fund receives
default protection on STMicroelectronics NV
and pays Fixed 1.000%) (20/12/2018) (181)
EUR 170,000 Credit Default Swaps (Citibank) (Fund receives
default protection on Suedzucker International
Finance BV 4.125% 29/3/2018 and pays Fixed
1.000%) (20/6/2018) 1,769
EUR 170,000 Credit Default Swaps (Citibank) (Fund receives
default protection on Suedzucker International
Finance BV 4.125% 29/3/2018 and pays Fixed
1.000%) (20/6/2018) 1,764
EUR 100,000 Credit Default Swaps (Citibank) (Fund receives
default protection on Telecom Italia SpA
5.375% 29/1/2019 and pays Fixed 1.000%)
(20/3/2018) (2,231)
EUR 400,000 Credit Default Swaps (Citibank) (Fund receives
default protection on TeliaSonera AB 4.125%
11/5/2015 and pays Fixed 1.000%) (20/9/2017) (4,202)
EUR 700,000 Credit Default Swaps (Citibank) (Fund receives
default protection on ThyssenKrupp AG
4.375% 18/3/2015 and pays Fixed 1.000%)
(20/6/2018) (31,121)
EUR 340,000 Credit Default Swaps (Citibank) (Fund receives
default protection on Vattenfall AB 5.375%
29/4/2024 and pays Fixed 1.000%) (20/12/2018) (1,220)
EUR 250,000 Credit Default Swaps (Citibank) (Fund receives
default protection on Veolia Environnement
SA 5.375% 28/5/2018 and pays Fixed 1.000%)
(20/12/2017) (12,674)
EUR 69,251 Credit Default Swaps (Citibank) (Fund receives
default protection on Veolia Environnement
SA 5.375% 28/5/2018 and pays Fixed 1.000%)
(20/12/2017) (2,754)
EUR 180,000 Credit Default Swaps (Citibank) (Fund receives
default protection on Volvo Treasury AB 5%
31/5/2017 and pays Fixed 1.000%) (20/12/2018) (1,902)
EUR 179,000 Credit Default Swaps (Citibank) (Fund receives
default protection on Volvo Treasury AB 5%
31/5/2017 and pays Fixed 1.000%) (20/12/2018) (1,891)
EUR 360,000 Credit Default Swaps (Citibank) (Fund receives
default protection on Volvo Treasury AB 5%
31/5/2017 and pays Fixed 1.000%) (20/12/2018) (3,632)
EUR 420,000 Credit Default Swaps (Citibank) (Fund receives
default protection on Volvo Treasury AB 5%
31/5/2017 and pays Fixed 1.000%) (20/12/2018) (3,828)
EUR 221,000 Credit Default Swaps (Citibank) (Fund receives
default protection on Volvo Treasury AB 5%
31/5/2017 and pays Fixed 1.000%) (20/12/2018) (2,014)
EUR 200,000 Credit Default Swaps (Citibank) (Fund receives
default protection on Volvo Treasury AB 5%
31/5/2017 and pays Fixed 1.000%) (20/12/2018) (2,004)
EUR 20,000 Credit Default Swaps (Citibank) (Fund receives
default protection on Volvo Treasury AB 5%
31/5/2017 and pays Fixed 1.000%) (20/12/2018) (171)
EUR 60,000 Credit Default Swaps (Citibank) (Fund receives
default protection on Volvo Treasury AB 5%
31/5/2017 and pays Fixed 1.000%) (20/12/2018) (485)
EUR 150,000 Credit Default Swaps (Citibank) (Fund receives
default protection on Volvo Treasury AB
5.000% 31/5/2017 and pays Fixed 1.000%)
(20/12/2018) (1,374)
EUR 70,000 Credit Default Swaps (Citibank) (Fund receives
default protection on Volvo Treasury AB
5.000% 31/5/2017 and pays Fixed 1.000%)
(20/12/2018) (542)
EUR 150,000 Credit Default Swaps (Citibank) (Fund receives
default protection on Volvo Treasury AB
5.000% 31/5/2017 and pays Fixed 1.000%)
(20/12/2018) (1,233)
EUR 200,000 Credit Default Swaps (Citibank) (Fund receives
Fixed 1.000% and provides default protection
on Ahold Finance USA LLC 6.875% 1/5/2029)
(20/9/2017) 8,462
EUR 600,000 Credit Default Swaps (Citibank) (Fund receives
Fixed 1.000% and provides default protection
on Anheuser-Busch InBev NV 8.625%
30/1/2017) (20/12/2018) 2,698
EUR 50,000 Credit Default Swaps (Citibank) (Fund receives
Fixed 1.000% and provides default protection
on Cap Gemini SA 5.250% 29/11/2016)
(20/12/2017) 1,560
BlackRock Global Absolute Return Bond Fund continued
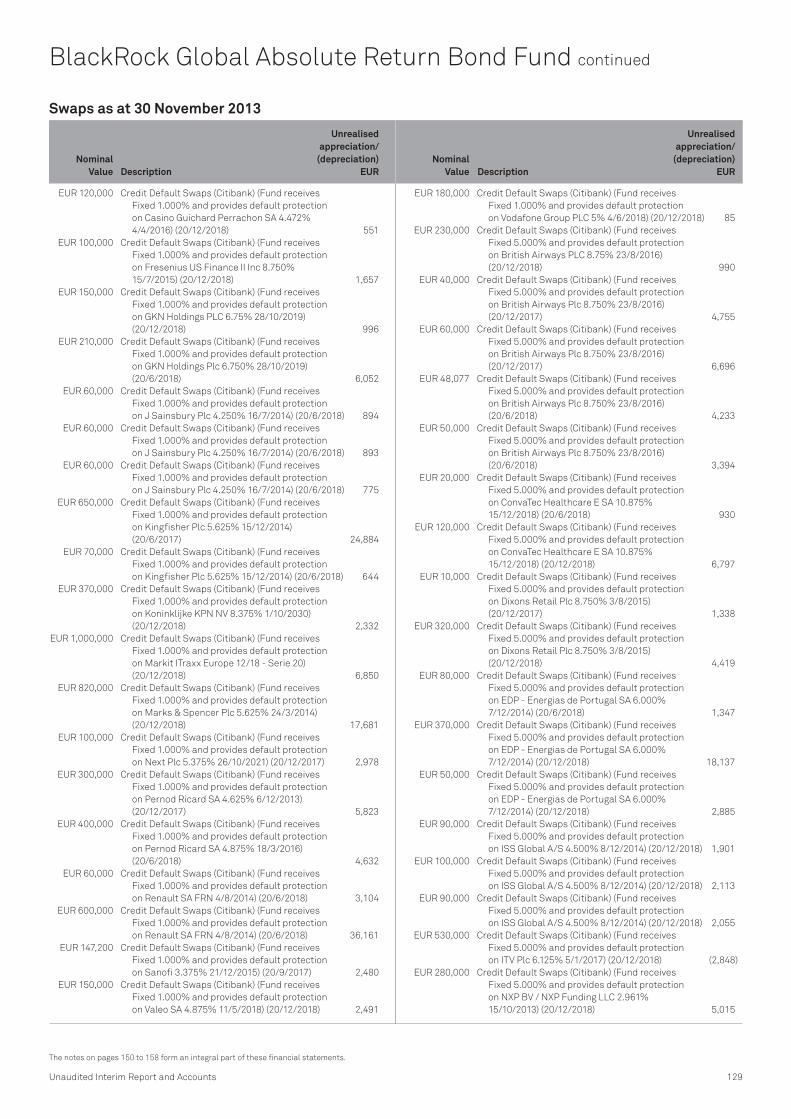
Nominal Value Description
Unrealisedappreciation/
(depreciation)EUR
Nominal Value Description
Unrealisedappreciation/
(depreciation)EUR
Unaudited Interim Report and Accounts 129
The notes on pages 150 to 158 form an integral part of these financial statements.
Swaps as at 30 November 2013
EUR 120,000 Credit Default Swaps (Citibank) (Fund receives
Fixed 1.000% and provides default protection
on Casino Guichard Perrachon SA 4.472%
4/4/2016) (20/12/2018) 551
EUR 100,000 Credit Default Swaps (Citibank) (Fund receives
Fixed 1.000% and provides default protection
on Fresenius US Finance II Inc 8.750%
15/7/2015) (20/12/2018) 1,657
EUR 150,000 Credit Default Swaps (Citibank) (Fund receives
Fixed 1.000% and provides default protection
on GKN Holdings PLC 6.75% 28/10/2019)
(20/12/2018) 996
EUR 210,000 Credit Default Swaps (Citibank) (Fund receives
Fixed 1.000% and provides default protection
on GKN Holdings Plc 6.750% 28/10/2019)
(20/6/2018) 6,052
EUR 60,000 Credit Default Swaps (Citibank) (Fund receives
Fixed 1.000% and provides default protection
on J Sainsbury Plc 4.250% 16/7/2014) (20/6/2018) 894
EUR 60,000 Credit Default Swaps (Citibank) (Fund receives
Fixed 1.000% and provides default protection
on J Sainsbury Plc 4.250% 16/7/2014) (20/6/2018) 893
EUR 60,000 Credit Default Swaps (Citibank) (Fund receives
Fixed 1.000% and provides default protection
on J Sainsbury Plc 4.250% 16/7/2014) (20/6/2018) 775
EUR 650,000 Credit Default Swaps (Citibank) (Fund receives
Fixed 1.000% and provides default protection
on Kingfisher Plc 5.625% 15/12/2014)
(20/6/2017) 24,884
EUR 70,000 Credit Default Swaps (Citibank) (Fund receives
Fixed 1.000% and provides default protection
on Kingfisher Plc 5.625% 15/12/2014) (20/6/2018) 644
EUR 370,000 Credit Default Swaps (Citibank) (Fund receives
Fixed 1.000% and provides default protection
on Koninklijke KPN NV 8.375% 1/10/2030)
(20/12/2018) 2,332
EUR 1,000,000 Credit Default Swaps (Citibank) (Fund receives
Fixed 1.000% and provides default protection
on Markit ITraxx Europe 12/18 - Serie 20)
(20/12/2018) 6,850
EUR 820,000 Credit Default Swaps (Citibank) (Fund receives
Fixed 1.000% and provides default protection
on Marks & Spencer Plc 5.625% 24/3/2014)
(20/12/2018) 17,681
EUR 100,000 Credit Default Swaps (Citibank) (Fund receives
Fixed 1.000% and provides default protection
on Next Plc 5.375% 26/10/2021) (20/12/2017) 2,978
EUR 300,000 Credit Default Swaps (Citibank) (Fund receives
Fixed 1.000% and provides default protection
on Pernod Ricard SA 4.625% 6/12/2013)
(20/12/2017) 5,823
EUR 400,000 Credit Default Swaps (Citibank) (Fund receives
Fixed 1.000% and provides default protection
on Pernod Ricard SA 4.875% 18/3/2016)
(20/6/2018) 4,632
EUR 60,000 Credit Default Swaps (Citibank) (Fund receives
Fixed 1.000% and provides default protection
on Renault SA FRN 4/8/2014) (20/6/2018) 3,104
EUR 600,000 Credit Default Swaps (Citibank) (Fund receives
Fixed 1.000% and provides default protection
on Renault SA FRN 4/8/2014) (20/6/2018) 36,161
EUR 147,200 Credit Default Swaps (Citibank) (Fund receives
Fixed 1.000% and provides default protection
on Sanofi 3.375% 21/12/2015) (20/9/2017) 2,480
EUR 150,000 Credit Default Swaps (Citibank) (Fund receives
Fixed 1.000% and provides default protection
on Valeo SA 4.875% 11/5/2018) (20/12/2018) 2,491
EUR 180,000 Credit Default Swaps (Citibank) (Fund receives
Fixed 1.000% and provides default protection
on Vodafone Group PLC 5% 4/6/2018) (20/12/2018) 85
EUR 230,000 Credit Default Swaps (Citibank) (Fund receives
Fixed 5.000% and provides default protection
on British Airways PLC 8.75% 23/8/2016)
(20/12/2018) 990
EUR 40,000 Credit Default Swaps (Citibank) (Fund receives
Fixed 5.000% and provides default protection
on British Airways Plc 8.750% 23/8/2016)
(20/12/2017) 4,755
EUR 60,000 Credit Default Swaps (Citibank) (Fund receives
Fixed 5.000% and provides default protection
on British Airways Plc 8.750% 23/8/2016)
(20/12/2017) 6,696
EUR 48,077 Credit Default Swaps (Citibank) (Fund receives
Fixed 5.000% and provides default protection
on British Airways Plc 8.750% 23/8/2016)
(20/6/2018) 4,233
EUR 50,000 Credit Default Swaps (Citibank) (Fund receives
Fixed 5.000% and provides default protection
on British Airways Plc 8.750% 23/8/2016)
(20/6/2018) 3,394
EUR 20,000 Credit Default Swaps (Citibank) (Fund receives
Fixed 5.000% and provides default protection
on ConvaTec Healthcare E SA 10.875%
15/12/2018) (20/6/2018) 930
EUR 120,000 Credit Default Swaps (Citibank) (Fund receives
Fixed 5.000% and provides default protection
on ConvaTec Healthcare E SA 10.875%
15/12/2018) (20/12/2018) 6,797
EUR 10,000 Credit Default Swaps (Citibank) (Fund receives
Fixed 5.000% and provides default protection
on Dixons Retail Plc 8.750% 3/8/2015)
(20/12/2017) 1,338
EUR 320,000 Credit Default Swaps (Citibank) (Fund receives
Fixed 5.000% and provides default protection
on Dixons Retail Plc 8.750% 3/8/2015)
(20/12/2018) 4,419
EUR 80,000 Credit Default Swaps (Citibank) (Fund receives
Fixed 5.000% and provides default protection
on EDP - Energias de Portugal SA 6.000%
7/12/2014) (20/6/2018) 1,347
EUR 370,000 Credit Default Swaps (Citibank) (Fund receives
Fixed 5.000% and provides default protection
on EDP - Energias de Portugal SA 6.000%
7/12/2014) (20/12/2018) 18,137
EUR 50,000 Credit Default Swaps (Citibank) (Fund receives
Fixed 5.000% and provides default protection
on EDP - Energias de Portugal SA 6.000%
7/12/2014) (20/12/2018) 2,885
EUR 90,000 Credit Default Swaps (Citibank) (Fund receives
Fixed 5.000% and provides default protection
on ISS Global A/S 4.500% 8/12/2014) (20/12/2018) 1,901
EUR 100,000 Credit Default Swaps (Citibank) (Fund receives
Fixed 5.000% and provides default protection
on ISS Global A/S 4.500% 8/12/2014) (20/12/2018) 2,113
EUR 90,000 Credit Default Swaps (Citibank) (Fund receives
Fixed 5.000% and provides default protection
on ISS Global A/S 4.500% 8/12/2014) (20/12/2018) 2,055
EUR 530,000 Credit Default Swaps (Citibank) (Fund receives
Fixed 5.000% and provides default protection
on ITV Plc 6.125% 5/1/2017) (20/12/2018) (2,848)
EUR 280,000 Credit Default Swaps (Citibank) (Fund receives
Fixed 5.000% and provides default protection
on NXP BV / NXP Funding LLC 2.961%
15/10/2013) (20/12/2018) 5,015
BlackRock Global Absolute Return Bond Fund continued

Nominal Value Description
Unrealisedappreciation/
(depreciation)EUR
Nominal Value Description
Unrealisedappreciation/
(depreciation)EUR
130 BlackRock Strategic Funds (BSF)
Swaps as at 30 November 2013
EUR 600,000 Credit Default Swaps (Citibank) (Fund receives
Fixed 5.000% and provides default protection
on Peugeot SA 8.375% 15/7/2014) (20/12/2018) 38,508
EUR 190,000 Credit Default Swaps (Citibank) (Fund receives
Fixed 5.000% and provides default protection
on Peugeot SA 8.375% 15/7/2014)
(20/12/2018) 7,598
EUR 210,000 Credit Default Swaps (Citibank) (Fund receives
Fixed 5.000% and provides default protection
on Schaeffler Finance BV 7.75% 15/2/2017)
(20/12/2018) 384
EUR 150,000 Credit Default Swaps (Citibank) (Fund receives
Fixed 5.000% and provides default protection
on UPC Holding BV 8.000% 1/11/2016)
(20/6/2017) 21,036
EUR 107,000 Credit Default Swaps (Citigroup Global Markets)
(Fund receives default protection on Scania CV
AB 1.750% 22/3/2016 and pays Fixed 1.000%)
(20/9/2017) (2,877)
EUR 420,000 Credit Default Swaps (Credit Suisse) (Fund
receives default protection on Air France-KLM
4.970% 1/4/2015 and pays Fixed 5.000%)
(20/9/2018) (46,320)
EUR 80,000 Credit Default Swaps (Credit Suisse) (Fund
receives default protection on Air France-KLM
4.970% 1/4/2015 and pays Fixed 5.000%)
(20/9/2018) (8,647)
EUR 140,000 Credit Default Swaps (Credit Suisse) (Fund
receives default protection on Air France-KLM
4.970% 1/4/2015 and pays Fixed 5.000%)
(20/9/2018) (14,049)
EUR 1,630,000 Credit Default Swaps (Credit Suisse) (Fund
receives default protection on Alstom SA
4.000% 23/9/2014 and pays Fixed 1.000%)
(20/12/2018) (49,013)
EUR 175,000 Credit Default Swaps (Credit Suisse) (Fund
receives default protection on Anglo American
Capital PLC 5.875% 17/4/2015 and pays Fixed
1.000%) (20/12/2018) 112
EUR 340,000 Credit Default Swaps (Credit Suisse) (Fund
receives default protection on Anglo American
Capital Plc 5.875% 17/4/2015 and pays Fixed
1.000%) (20/12/2018) (2,240)
EUR 100,000 Credit Default Swaps (Credit Suisse) (Fund
receives default protection on Anglo American
Capital PLC 5.875% 17/4/2015 and pays Fixed
1.000%) (20/12/2018) (21)
EUR 1,400,000 Credit Default Swaps (Credit Suisse) (Fund
receives default protection on AXA SA 4.500%
23/1/2015 and pays Fixed 1.000%) (20/6/2018) (75,329)
EUR 130,000 Credit Default Swaps (Credit Suisse) (Fund
receives default protection on BBVA Senior
Finance SAU 4.875% 23/1/2014 and pays Fixed
3.000%) (20/12/2018) (1,235)
EUR 140,000 Credit Default Swaps (Credit Suisse) (Fund
receives default protection on Bouygues SA
4.750% 24/5/2016 and pays Fixed 1.000%)
(20/6/2018) (4,659)
EUR 100,000 Credit Default Swaps (Credit Suisse) (Fund
receives default protection on CNH Industrial
Finance Europe SA 6.250% 9/3/2018 and pays
Fixed 5.000%) (20/6/2018) (2,429)
EUR 40,000 Credit Default Swaps (Credit Suisse) (Fund
receives default protection on Fiat Finance
North America Inc 5.625% 12/6/2017 and pays
Fixed 5.000%) (20/12/2018) (1,053)
EUR 40,000 Credit Default Swaps (Credit Suisse) (Fund
receives default protection on Fiat Finance
North America Inc 5.625% 12/6/2017 and pays
Fixed 5.000%) (20/12/2018) (1,019)
EUR 320,000 Credit Default Swaps (Credit Suisse) (Fund
receives default protection on Fiat Finance
North America Inc 5.625% 12/6/2017 and pays
Fixed 5.000%) (20/12/2018) (6,461)
EUR 210,000 Credit Default Swaps (Credit Suisse) (Fund
receives default protection on Fiat Finance
North America Inc 5.625% 12/6/2017 and pays
Fixed 5.000%) (20/12/2018) (4,244)
EUR 100,000 Credit Default Swaps (Credit Suisse) (Fund
receives default protection on Finmeccanica
Finance SA/Old 5.750% 12/12/2018 and pays
Fixed 5.000%) (20/3/2018) (3,785)
EUR 300,000 Credit Default Swaps (Credit Suisse) (Fund
receives default protection on Finmeccanica
Finance SA/Old 5.750% 12/12/2018 and pays
Fixed 5.000%) (20/12/2018) 115
EUR 20,000 Credit Default Swaps (Credit Suisse) (Fund
receives default protection on Infineon
Technologies Holding BV 7.500% 26/5/2014
and pays Fixed 5.000%) (20/12/2017) (1,572)
EUR 230,000 Credit Default Swaps (Credit Suisse) (Fund receives
default protection on iTraxx Europe Series 20
Version 1 and pays Fixed 1.000%) (20/12/2018) (78)
EUR 650,000 Credit Default Swaps (Credit Suisse) (Fund
receives default protection on Koninklijke DSM
NV 4.000% 10/11/2015 and pays Fixed 1.000%)
(20/6/2017) (7,656)
EUR 100,000 Credit Default Swaps (Credit Suisse) (Fund
receives default protection on LANXESS
Finance BV 7.750% 9/4/2014 and pays Fixed
1.000%) (20/3/2018) (1,175)
EUR 100,000 Credit Default Swaps (Credit Suisse) (Fund
receives default protection on Metsa Board
OYJ 8.750% 1/4/2013 and pays Fixed 5.000%)
(20/3/2018) (6,403)
EUR 40,000 Credit Default Swaps (Credit Suisse) (Fund
receives default protection on Metsa OYJ
3.800% 27/6/2022 and pays Fixed 5.000%)
(20/12/2018) 87
EUR 70,000 Credit Default Swaps (Credit Suisse) (Fund
receives default protection on Metsa OYJ
3.800% 27/6/2022 and pays Fixed 5.000%)
(20/12/2018) (294)
EUR 900,000 Credit Default Swaps (Credit Suisse) (Fund
receives default protection on Orange SA
5.625% 22/5/2018 and pays Fixed 1.000%)
(20/6/2018) (21,877)
EUR 40,000 Credit Default Swaps (Credit Suisse) (Fund
receives default protection on PostNL NV
3.875% 1/6/2015 and pays Fixed 1.000%)
(20/6/2018) (3,083)
EUR 30,000 Credit Default Swaps (Credit Suisse) (Fund
receives default protection on Rallye SA
7.625% 4/11/2016 and pays Fixed 5.000%)
(20/6/2018) (560)
EUR 200,000 Credit Default Swaps (Credit Suisse) (Fund
receives default protection on Siemens
Financieringsmaatschappij NV 5.625%
11/6/2018 and pays Fixed 1.000%) (20/6/2017) (5,441)
EUR 40,000 Credit Default Swaps (Credit Suisse) (Fund
receives default protection on Societe Air
France SA 2.75% 1/4/2020 and pays Fixed
5.000%) (20/12/2018) (92)
BlackRock Global Absolute Return Bond Fund continued

Nominal Value Description
Unrealisedappreciation/
(depreciation)EUR
Nominal Value Description
Unrealisedappreciation/
(depreciation)EUR
Unaudited Interim Report and Accounts 131
The notes on pages 150 to 158 form an integral part of these financial statements.
Swaps as at 30 November 2013
EUR 160,000 Credit Default Swaps (Credit Suisse) (Fund
receives default protection on Societe Air
France SA 2.75% 1/4/2020 and pays Fixed
5.000%) (20/12/2018) (804)
EUR 110,000 Credit Default Swaps (Credit Suisse) (Fund
receives default protection on Societe Air
France SA 2.75% 1/4/2020 and pays Fixed
5.000%) (20/12/2018) (654)
EUR 20,000 Credit Default Swaps (Credit Suisse) (Fund
receives default protection on Societe Air
France SA 2.750% 1/4/2020 and pays Fixed
5.000%) (20/9/2018) (1,778)
EUR 130,000 Credit Default Swaps (Credit Suisse) (Fund
receives default protection on Societe Air
France SA 2.750% 1/4/2020 and pays Fixed
5.000%) (20/9/2018) (13,019)
EUR 100,000 Credit Default Swaps (Credit Suisse) (Fund
receives default protection on Solvay SA
4.625% 27/6/2018 and pays Fixed 1.000%)
(20/6/2018) (2,313)
EUR 110,000 Credit Default Swaps (Credit Suisse) (Fund
receives default protection on Stena AB
6.125% 1/2/2017 and pays Fixed 5.000%)
(20/12/2018) (321)
EUR 300,000 Credit Default Swaps (Credit Suisse) (Fund
receives default protection on Stena AB
6.125% 1/2/2017 and pays Fixed 5.000%)
(20/9/2017) (52,870)
EUR 300,000 Credit Default Swaps (Credit Suisse) (Fund
receives default protection on Stora Enso OYJ
5.125% 23/6/2014 and pays Fixed 5.000%)
(20/6/2018) (16,656)
EUR 250,000 Credit Default Swaps (Credit Suisse) (Fund
receives default protection on Suedzucker
International Finance BV 4.125% 29/3/2018
and pays Fixed 1.000%) (20/12/2018) (2,117)
EUR 50,000 Credit Default Swaps (Credit Suisse) (Fund
receives default protection on Swedish Match
AB 4.625% 28/6/2013 and pays Fixed 1.000%)
(20/6/2018) (373)
EUR 50,000 Credit Default Swaps (Credit Suisse) (Fund
receives default protection on Swedish Match
AB 4.625% 28/6/2013 and pays Fixed 1.000%)
(20/6/2018) (374)
EUR 400,000 Credit Default Swaps (Credit Suisse) (Fund
receives default protection on Tate & Lyle
International Finance Plc 6.750% 25/11/2019
and pays Fixed 1.000%) (20/6/2018) (1,686)
EUR 50,000 Credit Default Swaps (Credit Suisse) (Fund
receives default protection on TDC A/S 5.875%
16/12/2015 and pays Fixed 1.000%) (20/3/2018) (464)
EUR 30,000 Credit Default Swaps (Credit Suisse) (Fund
receives default protection on TDC A/S 5.875%
16/12/2015 and pays Fixed 1.000%) (20/3/2018) (218)
EUR 30,000 Credit Default Swaps (Credit Suisse) (Fund
receives default protection on Telecom Italia
SpA 5.375% 29/1/2019 and pays Fixed 1.000%)
(20/3/2018) (320)
EUR 130,000 Credit Default Swaps (Credit Suisse) (Fund
receives default protection on UniCredit SpA
4.375% 29/1/2020 and pays Fixed 3.000%)
(20/12/2018) (1,732)
EUR 80,000 Credit Default Swaps (Credit Suisse) (Fund
receives default protection on Virgin Media
Finance Plc 4.875% 15/2/2022 and pays Fixed
5.000%) (20/12/2018) (1,571)
EUR 40,000 Credit Default Swaps (Credit Suisse) (Fund
receives default protection on Virgin Media
Finance Plc 4.875% 15/2/2022 and pays Fixed
5.000%) (20/12/2018) (1,173)
EUR 110,000 Credit Default Swaps (Credit Suisse) (Fund
receives default protection on Virgin Media
Finance Plc 4.875% 15/2/2022 and pays Fixed
5.000%) (20/12/2018) (1,363)
EUR 190,000 Credit Default Swaps (Credit Suisse) (Fund
receives default protection on Volvo Treasury
AB 5% 31/5/2017 and pays Fixed 1.000%)
(20/12/2018) (1,830)
EUR 110,000 Credit Default Swaps (Credit Suisse) (Fund
receives default protection on Volvo Treasury
AB 5% 31/5/2017 and pays Fixed 1.000%)
(20/12/2018) (1,153)
EUR 30,000 Credit Default Swaps (Credit Suisse) (Fund
receives default protection on Volvo Treasury
AB 5% 31/5/2017 and pays Fixed 1.000%)
(20/12/2018) (243)
EUR 220,000 Credit Default Swaps (Credit Suisse) (Fund
receives default protection on Volvo Treasury
AB 5% 31/5/2017 and pays Fixed 1.000%)
(20/12/2018) (2,092)
EUR 320,000 Credit Default Swaps (Credit Suisse) (Fund
receives Fixed 1.000% and provides default
protection on ArcelorMittal 6.125% 1/6/2018)
(20/12/2018) 5,958
EUR 190,000 Credit Default Swaps (Credit Suisse) (Fund
receives Fixed 1.000% and provides default
protection on ArcelorMittal 6.125% 1/6/2018)
(20/12/2018) 3,458
EUR 700,000 Credit Default Swaps (Credit Suisse) (Fund
receives Fixed 1.000% and provides default
protection on Aviva Plc 9.500% 20/6/2016)
(20/3/2018) 24,848
EUR 1,400,000 Credit Default Swaps (Credit Suisse) (Fund
receives Fixed 1.000% and provides default
protection on Aviva Plc 9.500% 20/6/2016)
(20/6/2018) 71,694
EUR 700,000 Credit Default Swaps (Credit Suisse) (Fund
receives Fixed 1.000% and provides default
protection on AXA SA 6.000% 18/6/2013)
(20/3/2018) 25,524
EUR 200,000 Credit Default Swaps (Credit Suisse) (Fund
receives Fixed 1.000% and provides default
protection on EADS Finance BV 5.500%
25/9/2018) (20/12/2018) 1,604
EUR 190,000 Credit Default Swaps (Credit Suisse) (Fund
receives Fixed 1.000% and provides default
protection on EADS Finance BV 5.500%
25/9/2018) (20/12/2018) 866
EUR 170,000 Credit Default Swaps (Credit Suisse) (Fund
receives Fixed 1.000% and provides default
protection on Glencore Finance Europe SA
6.5% 27/2/2019) (20/12/2018) 368
EUR 150,000 Credit Default Swaps (Credit Suisse) (Fund
receives Fixed 1.000% and provides default
protection on Glencore Finance Europe SA
6.5% 27/2/2019) (20/12/2018) 49
EUR 160,000 Credit Default Swaps (Credit Suisse) (Fund
receives Fixed 1.000% and provides default
protection on Glencore Finance Europe SA
6.500% 27/2/2019) (20/12/2018) 159
BlackRock Global Absolute Return Bond Fund continued
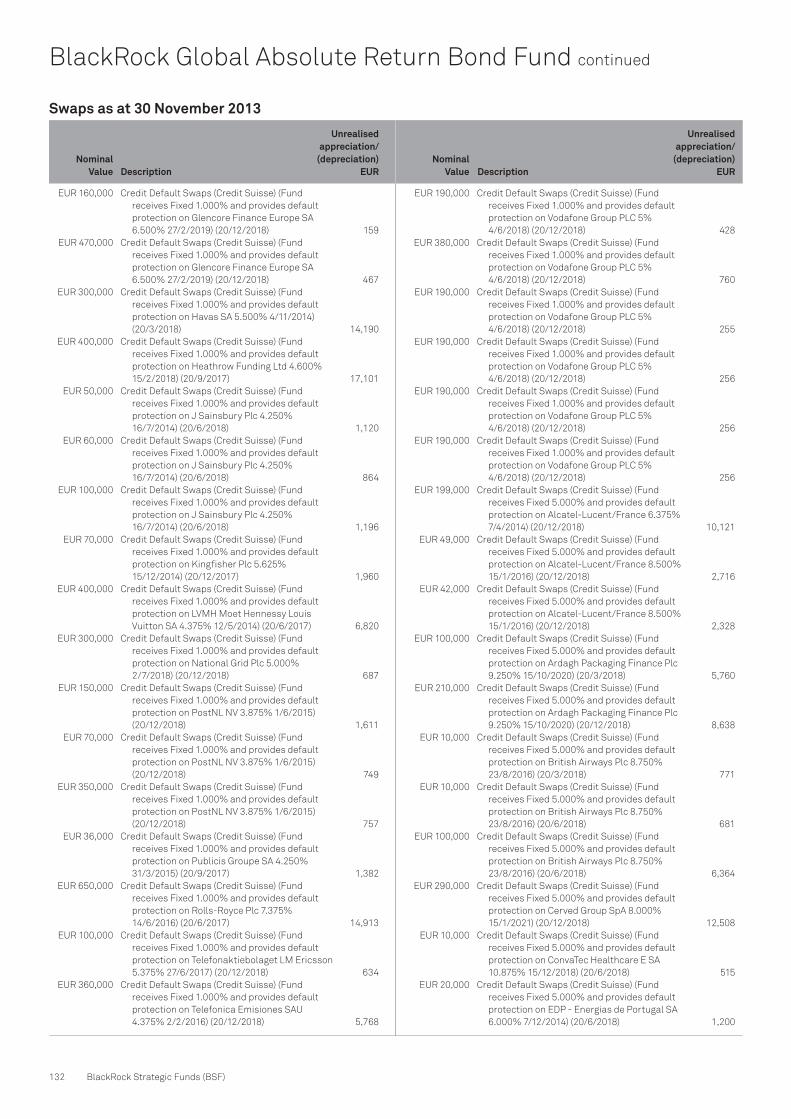
Nominal Value Description
Unrealisedappreciation/
(depreciation)EUR
Nominal Value Description
Unrealisedappreciation/
(depreciation)EUR
132 BlackRock Strategic Funds (BSF)
Swaps as at 30 November 2013
EUR 160,000 Credit Default Swaps (Credit Suisse) (Fund
receives Fixed 1.000% and provides default
protection on Glencore Finance Europe SA
6.500% 27/2/2019) (20/12/2018) 159
EUR 470,000 Credit Default Swaps (Credit Suisse) (Fund
receives Fixed 1.000% and provides default
protection on Glencore Finance Europe SA
6.500% 27/2/2019) (20/12/2018) 467
EUR 300,000 Credit Default Swaps (Credit Suisse) (Fund
receives Fixed 1.000% and provides default
protection on Havas SA 5.500% 4/11/2014)
(20/3/2018) 14,190
EUR 400,000 Credit Default Swaps (Credit Suisse) (Fund
receives Fixed 1.000% and provides default
protection on Heathrow Funding Ltd 4.600%
15/2/2018) (20/9/2017) 17,101
EUR 50,000 Credit Default Swaps (Credit Suisse) (Fund
receives Fixed 1.000% and provides default
protection on J Sainsbury Plc 4.250%
16/7/2014) (20/6/2018) 1,120
EUR 60,000 Credit Default Swaps (Credit Suisse) (Fund
receives Fixed 1.000% and provides default
protection on J Sainsbury Plc 4.250%
16/7/2014) (20/6/2018) 864
EUR 100,000 Credit Default Swaps (Credit Suisse) (Fund
receives Fixed 1.000% and provides default
protection on J Sainsbury Plc 4.250%
16/7/2014) (20/6/2018) 1,196
EUR 70,000 Credit Default Swaps (Credit Suisse) (Fund
receives Fixed 1.000% and provides default
protection on Kingfisher Plc 5.625%
15/12/2014) (20/12/2017) 1,960
EUR 400,000 Credit Default Swaps (Credit Suisse) (Fund
receives Fixed 1.000% and provides default
protection on LVMH Moet Hennessy Louis
Vuitton SA 4.375% 12/5/2014) (20/6/2017) 6,820
EUR 300,000 Credit Default Swaps (Credit Suisse) (Fund
receives Fixed 1.000% and provides default
protection on National Grid Plc 5.000%
2/7/2018) (20/12/2018) 687
EUR 150,000 Credit Default Swaps (Credit Suisse) (Fund
receives Fixed 1.000% and provides default
protection on PostNL NV 3.875% 1/6/2015)
(20/12/2018) 1,611
EUR 70,000 Credit Default Swaps (Credit Suisse) (Fund
receives Fixed 1.000% and provides default
protection on PostNL NV 3.875% 1/6/2015)
(20/12/2018) 749
EUR 350,000 Credit Default Swaps (Credit Suisse) (Fund
receives Fixed 1.000% and provides default
protection on PostNL NV 3.875% 1/6/2015)
(20/12/2018) 757
EUR 36,000 Credit Default Swaps (Credit Suisse) (Fund
receives Fixed 1.000% and provides default
protection on Publicis Groupe SA 4.250%
31/3/2015) (20/9/2017) 1,382
EUR 650,000 Credit Default Swaps (Credit Suisse) (Fund
receives Fixed 1.000% and provides default
protection on Rolls-Royce Plc 7.375%
14/6/2016) (20/6/2017) 14,913
EUR 100,000 Credit Default Swaps (Credit Suisse) (Fund
receives Fixed 1.000% and provides default
protection on Telefonaktiebolaget LM Ericsson
5.375% 27/6/2017) (20/12/2018) 634
EUR 360,000 Credit Default Swaps (Credit Suisse) (Fund
receives Fixed 1.000% and provides default
protection on Telefonica Emisiones SAU
4.375% 2/2/2016) (20/12/2018) 5,768
EUR 190,000 Credit Default Swaps (Credit Suisse) (Fund
receives Fixed 1.000% and provides default
protection on Vodafone Group PLC 5%
4/6/2018) (20/12/2018) 428
EUR 380,000 Credit Default Swaps (Credit Suisse) (Fund
receives Fixed 1.000% and provides default
protection on Vodafone Group PLC 5%
4/6/2018) (20/12/2018) 760
EUR 190,000 Credit Default Swaps (Credit Suisse) (Fund
receives Fixed 1.000% and provides default
protection on Vodafone Group PLC 5%
4/6/2018) (20/12/2018) 255
EUR 190,000 Credit Default Swaps (Credit Suisse) (Fund
receives Fixed 1.000% and provides default
protection on Vodafone Group PLC 5%
4/6/2018) (20/12/2018) 256
EUR 190,000 Credit Default Swaps (Credit Suisse) (Fund
receives Fixed 1.000% and provides default
protection on Vodafone Group PLC 5%
4/6/2018) (20/12/2018) 256
EUR 190,000 Credit Default Swaps (Credit Suisse) (Fund
receives Fixed 1.000% and provides default
protection on Vodafone Group PLC 5%
4/6/2018) (20/12/2018) 256
EUR 199,000 Credit Default Swaps (Credit Suisse) (Fund
receives Fixed 5.000% and provides default
protection on Alcatel-Lucent/France 6.375%
7/4/2014) (20/12/2018) 10,121
EUR 49,000 Credit Default Swaps (Credit Suisse) (Fund
receives Fixed 5.000% and provides default
protection on Alcatel-Lucent/France 8.500%
15/1/2016) (20/12/2018) 2,716
EUR 42,000 Credit Default Swaps (Credit Suisse) (Fund
receives Fixed 5.000% and provides default
protection on Alcatel-Lucent/France 8.500%
15/1/2016) (20/12/2018) 2,328
EUR 100,000 Credit Default Swaps (Credit Suisse) (Fund
receives Fixed 5.000% and provides default
protection on Ardagh Packaging Finance Plc
9.250% 15/10/2020) (20/3/2018) 5,760
EUR 210,000 Credit Default Swaps (Credit Suisse) (Fund
receives Fixed 5.000% and provides default
protection on Ardagh Packaging Finance Plc
9.250% 15/10/2020) (20/12/2018) 8,638
EUR 10,000 Credit Default Swaps (Credit Suisse) (Fund
receives Fixed 5.000% and provides default
protection on British Airways Plc 8.750%
23/8/2016) (20/3/2018) 771
EUR 10,000 Credit Default Swaps (Credit Suisse) (Fund
receives Fixed 5.000% and provides default
protection on British Airways Plc 8.750%
23/8/2016) (20/6/2018) 681
EUR 100,000 Credit Default Swaps (Credit Suisse) (Fund
receives Fixed 5.000% and provides default
protection on British Airways Plc 8.750%
23/8/2016) (20/6/2018) 6,364
EUR 290,000 Credit Default Swaps (Credit Suisse) (Fund
receives Fixed 5.000% and provides default
protection on Cerved Group SpA 8.000%
15/1/2021) (20/12/2018) 12,508
EUR 10,000 Credit Default Swaps (Credit Suisse) (Fund
receives Fixed 5.000% and provides default
protection on ConvaTec Healthcare E SA
10.875% 15/12/2018) (20/6/2018) 515
EUR 20,000 Credit Default Swaps (Credit Suisse) (Fund
receives Fixed 5.000% and provides default
protection on EDP - Energias de Portugal SA
6.000% 7/12/2014) (20/6/2018) 1,200
BlackRock Global Absolute Return Bond Fund continued
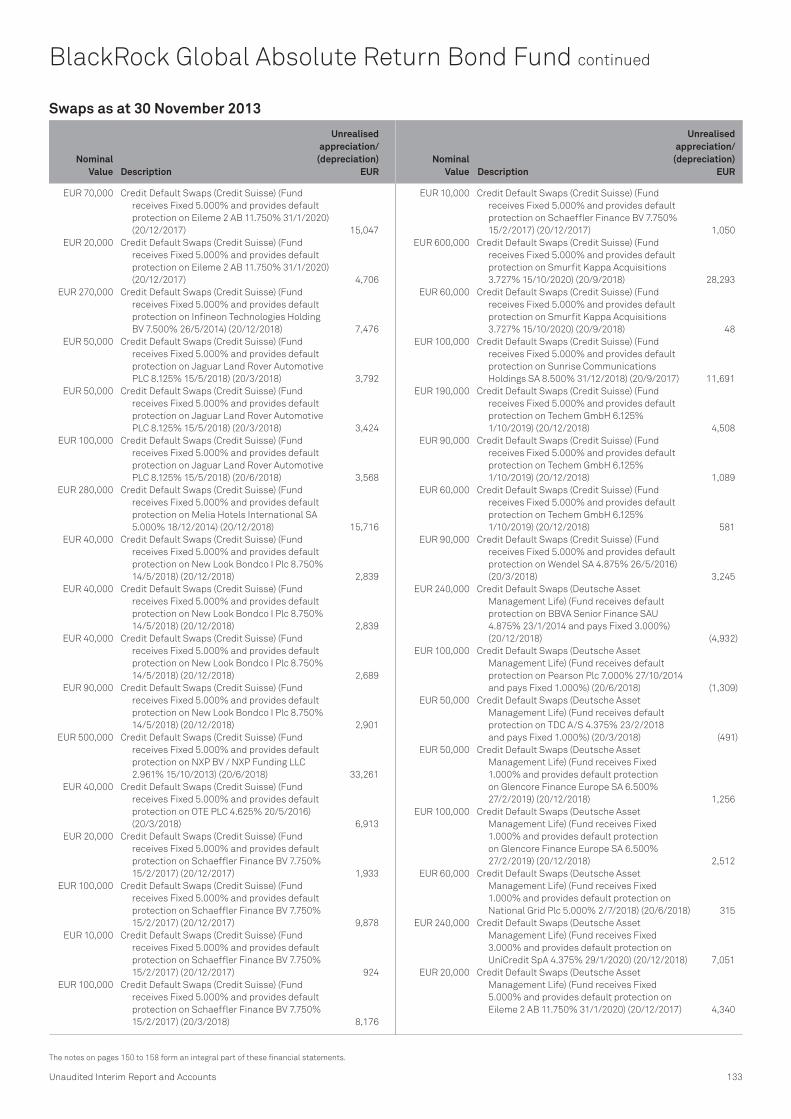
Nominal Value Description
Unrealisedappreciation/
(depreciation)EUR
Nominal Value Description
Unrealisedappreciation/
(depreciation)EUR
Unaudited Interim Report and Accounts 133
The notes on pages 150 to 158 form an integral part of these financial statements.
Swaps as at 30 November 2013
EUR 70,000 Credit Default Swaps (Credit Suisse) (Fund
receives Fixed 5.000% and provides default
protection on Eileme 2 AB 11.750% 31/1/2020)
(20/12/2017) 15,047
EUR 20,000 Credit Default Swaps (Credit Suisse) (Fund
receives Fixed 5.000% and provides default
protection on Eileme 2 AB 11.750% 31/1/2020)
(20/12/2017) 4,706
EUR 270,000 Credit Default Swaps (Credit Suisse) (Fund
receives Fixed 5.000% and provides default
protection on Infineon Technologies Holding
BV 7.500% 26/5/2014) (20/12/2018) 7,476
EUR 50,000 Credit Default Swaps (Credit Suisse) (Fund
receives Fixed 5.000% and provides default
protection on Jaguar Land Rover Automotive
PLC 8.125% 15/5/2018) (20/3/2018) 3,792
EUR 50,000 Credit Default Swaps (Credit Suisse) (Fund
receives Fixed 5.000% and provides default
protection on Jaguar Land Rover Automotive
PLC 8.125% 15/5/2018) (20/3/2018) 3,424
EUR 100,000 Credit Default Swaps (Credit Suisse) (Fund
receives Fixed 5.000% and provides default
protection on Jaguar Land Rover Automotive
PLC 8.125% 15/5/2018) (20/6/2018) 3,568
EUR 280,000 Credit Default Swaps (Credit Suisse) (Fund
receives Fixed 5.000% and provides default
protection on Melia Hotels International SA
5.000% 18/12/2014) (20/12/2018) 15,716
EUR 40,000 Credit Default Swaps (Credit Suisse) (Fund
receives Fixed 5.000% and provides default
protection on New Look Bondco I Plc 8.750%
14/5/2018) (20/12/2018) 2,839
EUR 40,000 Credit Default Swaps (Credit Suisse) (Fund
receives Fixed 5.000% and provides default
protection on New Look Bondco I Plc 8.750%
14/5/2018) (20/12/2018) 2,839
EUR 40,000 Credit Default Swaps (Credit Suisse) (Fund
receives Fixed 5.000% and provides default
protection on New Look Bondco I Plc 8.750%
14/5/2018) (20/12/2018) 2,689
EUR 90,000 Credit Default Swaps (Credit Suisse) (Fund
receives Fixed 5.000% and provides default
protection on New Look Bondco I Plc 8.750%
14/5/2018) (20/12/2018) 2,901
EUR 500,000 Credit Default Swaps (Credit Suisse) (Fund
receives Fixed 5.000% and provides default
protection on NXP BV / NXP Funding LLC
2.961% 15/10/2013) (20/6/2018) 33,261
EUR 40,000 Credit Default Swaps (Credit Suisse) (Fund
receives Fixed 5.000% and provides default
protection on OTE PLC 4.625% 20/5/2016)
(20/3/2018) 6,913
EUR 20,000 Credit Default Swaps (Credit Suisse) (Fund
receives Fixed 5.000% and provides default
protection on Schaeffler Finance BV 7.750%
15/2/2017) (20/12/2017) 1,933
EUR 100,000 Credit Default Swaps (Credit Suisse) (Fund
receives Fixed 5.000% and provides default
protection on Schaeffler Finance BV 7.750%
15/2/2017) (20/12/2017) 9,878
EUR 10,000 Credit Default Swaps (Credit Suisse) (Fund
receives Fixed 5.000% and provides default
protection on Schaeffler Finance BV 7.750%
15/2/2017) (20/12/2017) 924
EUR 100,000 Credit Default Swaps (Credit Suisse) (Fund
receives Fixed 5.000% and provides default
protection on Schaeffler Finance BV 7.750%
15/2/2017) (20/3/2018) 8,176
EUR 10,000 Credit Default Swaps (Credit Suisse) (Fund
receives Fixed 5.000% and provides default
protection on Schaeffler Finance BV 7.750%
15/2/2017) (20/12/2017) 1,050
EUR 600,000 Credit Default Swaps (Credit Suisse) (Fund
receives Fixed 5.000% and provides default
protection on Smurfit Kappa Acquisitions
3.727% 15/10/2020) (20/9/2018) 28,293
EUR 60,000 Credit Default Swaps (Credit Suisse) (Fund
receives Fixed 5.000% and provides default
protection on Smurfit Kappa Acquisitions
3.727% 15/10/2020) (20/9/2018) 48
EUR 100,000 Credit Default Swaps (Credit Suisse) (Fund
receives Fixed 5.000% and provides default
protection on Sunrise Communications
Holdings SA 8.500% 31/12/2018) (20/9/2017) 11,691
EUR 190,000 Credit Default Swaps (Credit Suisse) (Fund
receives Fixed 5.000% and provides default
protection on Techem GmbH 6.125%
1/10/2019) (20/12/2018) 4,508
EUR 90,000 Credit Default Swaps (Credit Suisse) (Fund
receives Fixed 5.000% and provides default
protection on Techem GmbH 6.125%
1/10/2019) (20/12/2018) 1,089
EUR 60,000 Credit Default Swaps (Credit Suisse) (Fund
receives Fixed 5.000% and provides default
protection on Techem GmbH 6.125%
1/10/2019) (20/12/2018) 581
EUR 90,000 Credit Default Swaps (Credit Suisse) (Fund
receives Fixed 5.000% and provides default
protection on Wendel SA 4.875% 26/5/2016)
(20/3/2018) 3,245
EUR 240,000 Credit Default Swaps (Deutsche Asset
Management Life) (Fund receives default
protection on BBVA Senior Finance SAU
4.875% 23/1/2014 and pays Fixed 3.000%)
(20/12/2018) (4,932)
EUR 100,000 Credit Default Swaps (Deutsche Asset
Management Life) (Fund receives default
protection on Pearson Plc 7.000% 27/10/2014
and pays Fixed 1.000%) (20/6/2018) (1,309)
EUR 50,000 Credit Default Swaps (Deutsche Asset
Management Life) (Fund receives default
protection on TDC A/S 4.375% 23/2/2018
and pays Fixed 1.000%) (20/3/2018) (491)
EUR 50,000 Credit Default Swaps (Deutsche Asset
Management Life) (Fund receives Fixed
1.000% and provides default protection
on Glencore Finance Europe SA 6.500%
27/2/2019) (20/12/2018) 1,256
EUR 100,000 Credit Default Swaps (Deutsche Asset
Management Life) (Fund receives Fixed
1.000% and provides default protection
on Glencore Finance Europe SA 6.500%
27/2/2019) (20/12/2018) 2,512
EUR 60,000 Credit Default Swaps (Deutsche Asset
Management Life) (Fund receives Fixed
1.000% and provides default protection on
National Grid Plc 5.000% 2/7/2018) (20/6/2018) 315
EUR 240,000 Credit Default Swaps (Deutsche Asset
Management Life) (Fund receives Fixed
3.000% and provides default protection on
UniCredit SpA 4.375% 29/1/2020) (20/12/2018) 7,051
EUR 20,000 Credit Default Swaps (Deutsche Asset
Management Life) (Fund receives Fixed
5.000% and provides default protection on
Eileme 2 AB 11.750% 31/1/2020) (20/12/2017) 4,340
BlackRock Global Absolute Return Bond Fund continued

Nominal Value Description
Unrealisedappreciation/
(depreciation)EUR
Nominal Value Description
Unrealisedappreciation/
(depreciation)EUR
134 BlackRock Strategic Funds (BSF)
Swaps as at 30 November 2013
EUR 110,000 Credit Default Swaps (Deutsche Asset
Management Life) (Fund receives Fixed
5.000% and provides default protection on ISS
Global A/S 4.500% 8/12/2014) (20/12/2018) 1,392
EUR 10,000 Credit Default Swaps (Deutsche Asset
Management Life) (Fund receives Fixed
5.000% and provides default protection on
OTE PLC 4.625% 20/5/2016) (20/3/2018) 1,576
EUR 11,000,000 Credit Default Swaps (Deutsche Bank
Management Life) (Fund receives default
protection on iTraxx Europe Series 20 Version 1
and pays Fixed 1.000%) (20/12/2018) (38,911)
EUR 110,000 Credit Default Swaps (Deutsche Bank
Management Life) (Fund receives default
protection on Societe Air France SA 2.75%
1/4/2020 and pays Fixed 5.000%) (20/12/2018) (946)
EUR 180,000 Credit Default Swaps (Deutsche Bank
Management Life) (Fund receives Fixed
1.000% and provides default protection on
Renault SA 5.625% 22/3/2017) (20/12/2018) 1,295
EUR 180,000 Credit Default Swaps (Deutsche Bank
Management Life) (Fund receives Fixed
1.000% and provides default protection on
Vodafone Group PLC 5% 4/6/2018) (20/12/2018) 167
EUR 60,000 Credit Default Swaps (Deutsche Bank
Management Life) (Fund receives Fixed
5.000% and provides default protection
on Wind Acquisition Finance SA 11.75%
15/7/2017) (20/12/2018) 164
USD 725,000 Credit Default Swaps (Deutsche Bank) (Fund
receives default protection on Bank of America
Corp 5.650% 1/5/2018 and pays Fixed 1.000%)
(20/12/2018) (7,901)
EUR 60,000 Credit Default Swaps (Deutsche Bank)
(Fund receives default protection on BAT
International Finance Plc 5.875% 12/3/2015
and pays Fixed 1.000%) (20/12/2017) (312)
EUR 195,000 Credit Default Swaps (Deutsche Bank) (Fund
receives default protection on Bouygues SA
4.750% 24/5/2016 and pays Fixed 1.000%)
(20/9/2017) (8,608)
EUR 700,000 Credit Default Swaps (Deutsche Bank) (Fund
receives default protection on Credit Agricole
SA 5.065% 10/8/2022 and pays Fixed 3.000%)
(20/3/2018) (14,806)
EUR 590,000 Credit Default Swaps (Deutsche Bank) (Fund
receives default protection on Deutsche
Telekom International Finance BV 6.000%
20/1/2017 and pays Fixed 1.000%) (20/6/2018) (9,400)
EUR 170,000 Credit Default Swaps (Deutsche Bank) (Fund
receives default protection on Fiat Finance
North America Inc 5.625% 12/6/2017 and pays
Fixed 5.000%) (20/12/2018) (3,402)
EUR 20,000 Credit Default Swaps (Deutsche Bank) (Fund
receives default protection on Fiat Finance
North America Inc 5.625% 12/6/2017 and pays
Fixed 5.000%) (20/12/2018) (534)
EUR 20,000 Credit Default Swaps (Deutsche Bank) (Fund
receives default protection on Fiat Finance
North America Inc 5.625% 12/6/2017 and pays
Fixed 5.000%) (20/12/2018) (491)
EUR 2,390,000 Credit Default Swaps (Deutsche Bank) (Fund
receives default protection on iTraxx EUR
Series 20 Version 1 and pays Fixed 1.000%)
(20/12/2018) (23,279)
EUR 490,000 Credit Default Swaps (Deutsche Bank) (Fund
receives default protection on iTraxx Europe
Crossover Series 20 Version 1 and pays Fixed
5.000%) (20/12/2018) (7,079)
EUR 360,000 Credit Default Swaps (Deutsche Bank) (Fund
receives default protection on LANXESS
Finance BV 7.750% 9/4/2014 and pays Fixed
1.000%) (20/12/2018) (1,669)
EUR 830,000 Credit Default Swaps (Deutsche Bank) (Fund
receives default protection on Markit ITraxx
Europe 12/18 - Serie 20 and pays Fixed
5.000%) (20/12/2018) (8,191)
EUR 2,670,000 Credit Default Swaps (Deutsche Bank) (Fund
receives default protection on Markit ITraxx
Europe Crossover 12/18 - Serie 20 and pays
Fixed 5.000%) (20/12/2018) (88,085)
USD 725,000 Credit Default Swaps (Deutsche Bank) (Fund
receives default protection on Morgan Stanley
6.000% 28/4/2015 and pays Fixed 1.000%)
(20/12/2018) (11,517)
EUR 50,000 Credit Default Swaps (Deutsche Bank) (Fund
receives default protection on Rallye SA
7.625% 4/11/2016 and pays Fixed 5.000%)
(20/6/2018) (94)
EUR 400,000 Credit Default Swaps (Deutsche Bank) (Fund
receives default protection on RWE AG 5.750%
14/2/2033 and pays Fixed 1.000%)
(20/9/2017) (10,139)
EUR 10,000 Credit Default Swaps (Deutsche Bank) (Fund
receives default protection on Societe Air
France SA 2.750% 1/4/2020 and pays Fixed
5.000%) (20/9/2018) (851)
EUR 170,000 Credit Default Swaps (Deutsche Bank) (Fund
receives default protection on Suedzucker
International Finance BV 4.125% 29/3/2018
and pays Fixed 1.000%) (20/12/2018) (40)
EUR 70,000 Credit Default Swaps (Deutsche Bank) (Fund
receives default protection on Swedish Match
AB 4.625% 28/6/2013 and pays Fixed 1.000%)
(20/3/2018) (509)
EUR 70,000 Credit Default Swaps (Deutsche Bank) (Fund
receives default protection on Swedish Match
AB 4.625% 28/6/2013 and pays Fixed 1.000%)
(20/3/2018) (648)
EUR 100,000 Credit Default Swaps (Deutsche Bank) (Fund
receives default protection on ThyssenKrupp
AG 4.375% 18/3/2015 and pays Fixed 1.000%)
(20/6/2018) (3,219)
EUR 90,000 Credit Default Swaps (Deutsche Bank) (Fund
receives default protection on ThyssenKrupp
AG 4.375% 18/3/2015 and pays Fixed 1.000%)
(20/12/2018) (3,155)
EUR 80,000 Credit Default Swaps (Deutsche Bank) (Fund
receives default protection on Volvo Treasury
AB 5.000% 31/5/2017 and pays Fixed 1.000%)
(20/12/2018) (546)
EUR 190,000 Credit Default Swaps (Deutsche Bank) (Fund
receives Fixed 1.000% and provides default
protection on Alstom SA 4.125% 1/2/2017)
(20/12/2018) 1,627
EUR 200,000 Credit Default Swaps (Deutsche Bank) (Fund
receives Fixed 1.000% and provides default
protection on BAE Systems Plc 10.750%
24/11/2014) (20/6/2017) 10,765
BlackRock Global Absolute Return Bond Fund continued

Nominal Value Description
Unrealisedappreciation/
(depreciation)EUR
Nominal Value Description
Unrealisedappreciation/
(depreciation)EUR
Unaudited Interim Report and Accounts 135
The notes on pages 150 to 158 form an integral part of these financial statements.
Swaps as at 30 November 2013
EUR 50,000 Credit Default Swaps (Deutsche Bank) (Fund
receives Fixed 1.000% and provides default
protection on Cap Gemini SA 5.250%
29/11/2016) (20/12/2017) 1,605
EUR 400,000 Credit Default Swaps (Deutsche Bank) (Fund
receives Fixed 1.000% and provides default
protection on EADS Finance BV 5.500%
25/9/2018) (20/6/2017) 25,045
EUR 60,000 Credit Default Swaps (Deutsche Bank) (Fund
receives Fixed 1.000% and provides default
protection on Glencore Finance Europe SA
6.500% 27/2/2019) (20/12/2018) 1,774
EUR 40,000 Credit Default Swaps (Deutsche Bank) (Fund
receives Fixed 1.000% and provides default
protection on Glencore Finance Europe SA
6.500% 27/2/2019) (20/12/2018) 782
EUR 50,000 Credit Default Swaps (Deutsche Bank) (Fund
receives Fixed 1.000% and provides default
protection on Heathrow Funding Ltd 4.600%
15/2/2018) (20/12/2017) 2,177
EUR 200,000 Credit Default Swaps (Deutsche Bank) (Fund
receives Fixed 1.000% and provides default
protection on Heathrow Funding Ltd 4.600%
15/2/2018) (20/12/2018) 1,547
EUR 110,000 Credit Default Swaps (Deutsche Bank) (Fund
receives Fixed 1.000% and provides default
protection on Next Plc 5.375% 26/10/2021)
(20/12/2018) 1,153
EUR 590,000 Credit Default Swaps (Deutsche Bank) (Fund
receives Fixed 1.000% and provides default
protection on Orange SA 5.625% 22/5/2018)
(20/6/2018) 15,239
EUR 100,000 Credit Default Swaps (Deutsche Bank) (Fund
receives Fixed 1.000% and provides default
protection on Renault SA FRN 4/8/2014)
(20/6/2018) 3,009
USD 220,000 Credit Default Swaps (Deutsche Bank) (Fund
receives Fixed 1.000% and provides default
protection on Rio Tinto Finance Plc 2.000%
11/5/2020) (20/12/2018) 2,251
EUR 260,000 Credit Default Swaps (Deutsche Bank) (Fund
receives Fixed 1.000% and provides default
protection on Telefonica Emisiones SAU
4.375% 2/2/2016) (20/12/2018) 10,069
EUR 180,000 Credit Default Swaps (Deutsche Bank) (Fund
receives Fixed 1.000% and provides default
protection on Telefonica Emisiones SAU
4.375% 2/2/2016) (20/12/2018) 2,797
EUR 180,000 Credit Default Swaps (Deutsche Bank) (Fund
receives Fixed 1.000% and provides default
protection on Vodafone Group PLC 5%
4/6/2018) (20/12/2018) 86
EUR 250,000 Credit Default Swaps (Deutsche Bank) (Fund
receives Fixed 5.000% and provides default
protection on Cable & Wireless International
Fin NV 8.625% 25/3/2019) (20/9/2017) 41,367
EUR 150,000 Credit Default Swaps (Deutsche Bank) (Fund
receives Fixed 5.000% and provides default
protection on Cable & Wireless Worldwide Plc
5.750% 24/11/2014) (20/6/2017) 33,926
EUR 200,000 Credit Default Swaps (Deutsche Bank) (Fund
receives Fixed 5.000% and provides default
protection on Infineon Technologies Holding
BV 7.500% 26/5/2014) (20/9/2018) 6,532
EUR 200,000 Credit Default Swaps (Deutsche Bank) (Fund
receives Fixed 5.000% and provides default
protection on Unitymedia KabelBW GmbH
9.625% 1/12/2019) (20/9/2017) 22,518
EUR 30,000 Credit Default Swaps (Deutsche Bank) (Fund
receives Fixed 5.000% and provides default
protection on UPC Holding BV 8.000%
1/11/2016) (20/12/2018) 245
EUR 80,000 Credit Default Swaps (Deutsche Bank) (Fund
receives Fixed 5.000% and provides default
protection on Wendel SA 4.875% 26/5/2016)
(20/12/2018) 962
EUR 225,000 Credit Default Swaps (Goldman Sachs) (Fund
receives default protection on Anglo American
Capital PLC 5.875% 17/4/2015 and pays Fixed
1.000%) (20/12/2018) 658
EUR 175,000 Credit Default Swaps (Goldman Sachs) (Fund
receives default protection on Anglo American
Capital PLC 5.875% 17/4/2015 and pays Fixed
1.000%) (20/12/2018) 32
EUR 50,000 Credit Default Swaps (Goldman Sachs)
(Fund receives default protection on BAT
International Finance Plc 5.875% 12/3/2015
and pays Fixed 1.000%) (20/12/2017) (238)
EUR 100,000 Credit Default Swaps (Goldman Sachs) (Fund
receives default protection on Bouygues SA
4.750% 24/5/2016 and pays Fixed 1.000%)
(20/6/2018) (3,278)
USD 7,100,000 Credit Default Swaps (Goldman Sachs) (Fund
receives default protection on CDX NA IG 21
Version 1 and pays Fixed 1.000%) (20/12/2018) (7,082)
EUR 130,000 Credit Default Swaps (Goldman Sachs) (Fund
receives default protection on Clariant Finance
Luxembourg SA 4.375% 5/4/2013 and pays
Fixed 1.000%) (20/3/2018) (6,449)
EUR 80,000 Credit Default Swaps (Goldman Sachs) (Fund
receives default protection on Deutsche
Lufthansa AG 6.500% 7/7/2016 and pays Fixed
1.000%) (20/12/2018) (1,754)
EUR 200,000 Credit Default Swaps (Goldman Sachs)
(Fund receives default protection on E.ON
International Finance BV 6.375% 29/5/2017
and pays Fixed 1.000%) (20/12/2018) (730)
EUR 410,000 Credit Default Swaps (Goldman Sachs) (Fund
receives default protection on Fiat Finance
North America Inc 5.625% 12/6/2017 and pays
Fixed 5.000%) (20/12/2018) (16,199)
EUR 100,000 Credit Default Swaps (Goldman Sachs) (Fund
receives default protection on Finmeccanica
Finance SA/Old 5.750% 12/12/2018 and pays
Fixed 5.000%) (20/3/2018) (4,795)
USD 1,450,000 Credit Default Swaps (Goldman Sachs) (Fund
receives default protection on Ford Motor
Co 6.500% 1/8/2018 and pays Fixed 5.000%)
(20/12/2018) (6,464)
EUR 220,000 Credit Default Swaps (Goldman Sachs)
(Fund receives default protection on
HeidelbergCement Finance BV 5.625%
4/1/2018 and pays Fixed 5.000%) (20/12/2018) (698)
EUR 280,000 Credit Default Swaps (Goldman Sachs)
(Fund receives default protection on
HeidelbergCement Finance BV 5.625%
4/1/2018 and pays Fixed 5.000%) (20/12/2018) (909)
EUR 535,000 Credit Default Swaps (Goldman Sachs) (Fund
receives default protection on Intesa Sanpaolo
SpA 4.75% 15/6/2017 and pays Fixed 3.000%)
(20/12/2018) (6,271)
EUR 100,000 Credit Default Swaps (Goldman Sachs) (Fund
receives default protection on Ladbrokes
Group Finance Plc 7.625% 5/3/2017 and pays
Fixed 1.000%) (20/12/2018) 568
BlackRock Global Absolute Return Bond Fund continued

Nominal Value Description
Unrealisedappreciation/
(depreciation)EUR
Nominal Value Description
Unrealisedappreciation/
(depreciation)EUR
136 BlackRock Strategic Funds (BSF)
Swaps as at 30 November 2013
EUR 90,000 Credit Default Swaps (Goldman Sachs) (Fund
receives default protection on Ladbrokes
Group Finance Plc 7.625% 5/3/2017 and pays
Fixed 1.000%) (20/12/2018) 457
EUR 210,000 Credit Default Swaps (Goldman Sachs) (Fund
receives default protection on Ladbrokes
Group Finance PLC 7.625% 5/3/2017 and pays
Fixed 1.000%) (20/12/2018) (179)
EUR 112,589 Credit Default Swaps (Goldman Sachs) (Fund
receives default protection on Lafarge SA
6.625% 29/11/2018 and pays Fixed 1.000%)
(20/12/2018) (1,458)
EUR 96,066 Credit Default Swaps (Goldman Sachs) (Fund
receives default protection on Lafarge SA
6.625% 29/11/2018 and pays Fixed 1.000%)
(20/12/2018) (1,244)
EUR 190,000 Credit Default Swaps (Goldman Sachs) (Fund
receives default protection on Lafarge SA
6.625% 29/11/2018 and pays Fixed 1.000%)
(20/12/2018) (3,414)
EUR 50,000 Credit Default Swaps (Goldman Sachs) (Fund
receives default protection on LANXESS
Finance BV 7.750% 9/4/2014 and pays Fixed
1.000%) (20/3/2018) (424)
EUR 120,000 Credit Default Swaps (Goldman Sachs) (Fund
receives default protection on Metsa OYJ
3.800% 27/6/2022 and pays Fixed 5.000%)
(20/12/2018) 10
EUR 80,000 Credit Default Swaps (Goldman Sachs) (Fund
receives default protection on Metsa OYJ
3.800% 27/6/2022 and pays Fixed 5.000%)
(20/12/2018) (526)
EUR 80,000 Credit Default Swaps (Goldman Sachs) (Fund
receives default protection on Metsa OYJ
3.800% 27/6/2022 and pays Fixed 5.000%)
(20/12/2018) (558)
EUR 100,000 Credit Default Swaps (Goldman Sachs) (Fund
receives default protection on Pearson Plc
7.000% 27/10/2014 and pays Fixed 1.000%)
(20/6/2018) (1,753)
USD 320,000 Credit Default Swaps (Goldman Sachs) (Fund
receives default protection on Qantas Airways
Ltd 6.050% 15/4/2016 and pays Fixed 1.000%)
(20/12/2018) (456)
EUR 210,000 Credit Default Swaps (Goldman Sachs) (Fund
receives default protection on Rallye SA
7.625% 4/11/2016 and pays Fixed 5.000%)
(20/12/2018) (4,740)
EUR 210,000 Credit Default Swaps (Goldman Sachs) (Fund
receives default protection on SES SA 4.625%
9/3/2020 and pays Fixed 1.000%)
(20/12/2018) (483)
EUR 60,000 Credit Default Swaps (Goldman Sachs) (Fund
receives default protection on Solvay SA
4.625% 27/6/2018 and pays Fixed 1.000%)
(20/9/2018) (1,387)
EUR 800,000 Credit Default Swaps (Goldman Sachs) (Fund
receives default protection on St-Gobain
Nederland BV 5.000% 25/4/2014 and pays
Fixed 1.000%) (20/6/2018) (21,530)
EUR 40,000 Credit Default Swaps (Goldman Sachs) (Fund
receives default protection on Stena AB
6.125% 1/2/2017 and pays Fixed 5.000%)
(20/12/2017) (3,635)
EUR 80,000 Credit Default Swaps (Goldman Sachs) (Fund
receives default protection on Stena AB
6.125% 1/2/2017 and pays Fixed 5.000%)
(20/12/2018) (130)
EUR 120,000 Credit Default Swaps (Goldman Sachs)
(Fund receives default protection on
STMicroelectronics NV and pays Fixed 1.000%)
(20/12/2018) (357)
EUR 90,000 Credit Default Swaps (Goldman Sachs) (Fund
receives default protection on Suedzucker
International Finance BV 4.125% 29/3/2018
and pays Fixed 1.000%) (20/12/2018) (672)
EUR 50,000 Credit Default Swaps (Goldman Sachs) (Fund
receives default protection on Telecom Italia
SpA 5.375% 29/1/2019 and pays Fixed 1.000%)
(20/3/2018) (578)
EUR 100,000 Credit Default Swaps (Goldman Sachs) (Fund
receives default protection on ThyssenKrupp
AG 4.375% 18/3/2015 and pays Fixed 1.000%)
(20/6/2018) (4,006)
EUR 50,000 Credit Default Swaps (Goldman Sachs) (Fund
receives Fixed 1.000% and provides default
protection on ArcelorMittal 6.125% 1/6/2018)
(20/12/2018) 1,397
EUR 90,000 Credit Default Swaps (Goldman Sachs) (Fund
receives Fixed 1.000% and provides default
protection on ArcelorMittal 6.125% 1/6/2018)
(20/12/2018) 2,551
EUR 110,000 Credit Default Swaps (Goldman Sachs) (Fund
receives Fixed 1.000% and provides default
protection on ArcelorMittal 6.125% 1/6/2018)
(20/12/2018) 1,440
EUR 250,000 Credit Default Swaps (Goldman Sachs) (Fund
receives Fixed 1.000% and provides default
protection on Aviva Plc 9.500% 20/6/2016)
(20/6/2018) 11,823
EUR 250,000 Credit Default Swaps (Goldman Sachs) (Fund
receives Fixed 1.000% and provides default
protection on AXA SA 4.500% 23/1/2015)
(20/6/2018) 12,359
EUR 230,000 Credit Default Swaps (Goldman Sachs) (Fund
receives Fixed 1.000% and provides default
protection on EADS Finance BV 5.500%
25/9/2018) (20/12/2018) 1,157
EUR 100,000 Credit Default Swaps (Goldman Sachs) (Fund
receives Fixed 1.000% and provides default
protection on Fresenius US Finance II Inc
8.75% 15/7/2015) (20/12/2018) 1,321
EUR 30,000 Credit Default Swaps (Goldman Sachs) (Fund
receives Fixed 1.000% and provides default
protection on Gecina SA 2.125% 1/1/2016)
(20/12/2017) 1,304
EUR 80,000 Credit Default Swaps (Goldman Sachs) (Fund
receives Fixed 1.000% and provides default
protection on GKN Holdings PLC 6.75%
28/10/2019) (20/12/2018) 570
EUR 140,000 Credit Default Swaps (Goldman Sachs) (Fund
receives Fixed 1.000% and provides default
protection on GKN Holdings Plc 6.750%
28/10/2019) (20/6/2018) 3,650
EUR 240,000 Credit Default Swaps (Goldman Sachs) (Fund
receives Fixed 1.000% and provides default
protection on Glencore Finance Europe SA
6.5% 27/2/2019) (20/12/2018) 71
EUR 110,000 Credit Default Swaps (Goldman Sachs) (Fund
receives Fixed 1.000% and provides default
protection on Glencore Finance Europe SA
6.5% 27/2/2019) (20/12/2018) 32
EUR 100,000 Credit Default Swaps (Goldman Sachs) (Fund
receives Fixed 1.000% and provides default
protection on Glencore Finance Europe SA
6.500% 27/2/2019) (20/12/2018) 2,334
BlackRock Global Absolute Return Bond Fund continued

Nominal Value Description
Unrealisedappreciation/
(depreciation)EUR
Nominal Value Description
Unrealisedappreciation/
(depreciation)EUR
Unaudited Interim Report and Accounts 137
The notes on pages 150 to 158 form an integral part of these financial statements.
Swaps as at 30 November 2013
EUR 50,000 Credit Default Swaps (Goldman Sachs) (Fund
receives Fixed 1.000% and provides default
protection on Glencore Finance Europe SA
6.500% 27/2/2019) (20/12/2018) 768
EUR 130,000 Credit Default Swaps (Goldman Sachs) (Fund
receives Fixed 1.000% and provides default
protection on Glencore Finance Europe SA
6.500% 27/2/2019) (20/12/2018) 523
EUR 60,000 Credit Default Swaps (Goldman Sachs)
(Fund receives Fixed 1.000% and provides
default protection on Kingfisher Plc 5.625%
15/12/2014) (20/6/2018) 581
EUR 20,000 Credit Default Swaps (Goldman Sachs)
(Fund receives Fixed 1.000% and provides
default protection on Kingfisher Plc 5.625%
15/12/2014) (20/6/2018) 135
EUR 50,000 Credit Default Swaps (Goldman Sachs) (Fund
receives Fixed 1.000% and provides default
protection on Pernod Ricard SA 4.625%
6/12/2013) (20/12/2017) 902
EUR 50,000 Credit Default Swaps (Goldman Sachs) (Fund
receives Fixed 1.000% and provides default
protection on Publicis Groupe SA 4.250%
31/3/2015) (20/6/2018) 973
EUR 50,000 Credit Default Swaps (Goldman Sachs) (Fund
receives Fixed 1.000% and provides default
protection on Publicis Groupe SA 4.250%
31/3/2015) (20/6/2018) 874
EUR 180,000 Credit Default Swaps (Goldman Sachs) (Fund
receives Fixed 1.000% and provides default
protection on Renault SA 5.625% 22/3/2017)
(20/12/2018) 1,047
EUR 990,000 Credit Default Swaps (Goldman Sachs) (Fund
receives Fixed 1.000% and provides default
protection on Renault SA FRN 4/8/2014)
(20/9/2018) 44,601
EUR 680,000 Credit Default Swaps (Goldman Sachs) (Fund
receives Fixed 1.000% and provides default
protection on Rolls-Royce Plc 7.375%
14/6/2016) (20/12/2018) 4,584
USD 1,450,000 Credit Default Swaps (Goldman Sachs) (Fund
receives Fixed 1.000% and provides default
protection on TRW Automotive Holdings Corp)
(20/12/2018) 3,499
EUR 290,000 Credit Default Swaps (Goldman Sachs) (Fund
receives Fixed 1.000% and provides default
protection on Vodafone Group PLC 5%
4/6/2018) (20/12/2018) 187
EUR 570,000 Credit Default Swaps (Goldman Sachs) (Fund
receives Fixed 5.000% and provides default
protection on Alcatel-Lucent/France 6.375%
7/4/2014) (20/12/2018) 29,753
EUR 20,000 Credit Default Swaps (Goldman Sachs) (Fund
receives Fixed 5.000% and provides default
protection on British Airways Plc 8.750%
23/8/2016) (20/3/2018) 2,051
EUR 290,000 Credit Default Swaps (Goldman Sachs) (Fund
receives Fixed 5.000% and provides default
protection on CIR-Compagnie Industriali
Riunite SpA 5.750% 16/12/2024) (20/12/2018) (878)
EUR 60,000 Credit Default Swaps (Goldman Sachs) (Fund
receives Fixed 5.000% and provides default
protection on ConvaTec Healthcare E SA
7.375% 15/12/2017) (20/12/2017) 6,135
EUR 60,000 Credit Default Swaps (Goldman Sachs) (Fund
receives Fixed 5.000% and provides default
protection on Eileme 2 AB 11.75% 31/1/2020)
(20/12/2018) 4,070
EUR 30,000 Credit Default Swaps (Goldman Sachs) (Fund
receives Fixed 5.000% and provides default
protection on Eileme 2 AB 11.750% 31/1/2020)
(20/12/2017) 7,339
EUR 20,000 Credit Default Swaps (Goldman Sachs) (Fund
receives Fixed 5.000% and provides default
protection on Eileme 2 AB 11.750% 31/1/2020)
(20/12/2017) 4,617
EUR 70,000 Credit Default Swaps (Goldman Sachs) (Fund
receives Fixed 5.000% and provides default
protection on Imperial Tobacco Finance Plc
6.250% 4/12/2018) (20/9/2018) (532)
EUR 60,000 Credit Default Swaps (Goldman Sachs) (Fund
receives Fixed 5.000% and provides default
protection on Infineon Technologies Holding
BV 7.500% 26/5/2014) (20/9/2018) 2,581
EUR 130,000 Credit Default Swaps (Goldman Sachs) (Fund
receives Fixed 5.000% and provides default
protection on ISS Global A/S 4.500%
8/12/2014) (20/12/2018) 2,634
EUR 110,000 Credit Default Swaps (Goldman Sachs) (Fund
receives Fixed 5.000% and provides default
protection on Melia Hotels International SA 5%
18/12/2014) (20/12/2018) 324
EUR 20,000 Credit Default Swaps (Goldman Sachs) (Fund
receives Fixed 5.000% and provides default
protection on Melia Hotels International SA
5.000% 18/12/2014) (20/3/2018) 2,263
EUR 50,000 Credit Default Swaps (Goldman Sachs) (Fund
receives Fixed 5.000% and provides default
protection on Melia Hotels International SA
5.000% 18/12/2014) (20/6/2018) 4,907
EUR 50,000 Credit Default Swaps (Goldman Sachs) (Fund
receives Fixed 5.000% and provides default
protection on Melia Hotels International SA
5.000% 18/12/2014) (20/12/2018) 3,125
EUR 140,000 Credit Default Swaps (Goldman Sachs) (Fund
receives Fixed 5.000% and provides default
protection on Nokia OYJ 6.750% 4/2/2019)
(20/12/2018) 3,427
EUR 70,000 Credit Default Swaps (Goldman Sachs) (Fund
receives Fixed 5.000% and provides default
protection on NXP BV / NXP Funding LLC
8.625% 15/10/2015) (20/3/2018) 4,590
EUR 50,000 Credit Default Swaps (Goldman Sachs) (Fund
receives Fixed 5.000% and provides default
protection on OTE PLC 4.625% 20/5/2016)
(20/3/2018) 9,766
EUR 40,000 Credit Default Swaps (Goldman Sachs) (Fund
receives Fixed 5.000% and provides default
protection on OTE PLC 4.625% 20/5/2016)
(20/3/2018) 6,377
EUR 20,000 Credit Default Swaps (Goldman Sachs) (Fund
receives Fixed 5.000% and provides default
protection on Scandinavian Airlines 9.65%
16/6/2014) (20/12/2018) (312)
EUR 230,000 Credit Default Swaps (Goldman Sachs) (Fund
receives Fixed 5.000% and provides default
protection on Scandinavian Airlines 9.650%
16/6/2014) (20/12/2018) (143)
EUR 20,000 Credit Default Swaps (Goldman Sachs) (Fund
receives Fixed 5.000% and provides default
protection on Schaeffler Finance BV 7.750%
15/2/2017) (20/12/2017) 1,976
EUR 140,000 Credit Default Swaps (Goldman Sachs) (Fund
receives Fixed 5.000% and provides default
protection on Schaeffler Finance BV 7.750%
15/2/2017) (20/12/2018) 2,936
BlackRock Global Absolute Return Bond Fund continued

Nominal Value Description
Unrealisedappreciation/
(depreciation)EUR
Nominal Value Description
Unrealisedappreciation/
(depreciation)EUR
138 BlackRock Strategic Funds (BSF)
Swaps as at 30 November 2013
EUR 140,000 Credit Default Swaps (Goldman Sachs) (Fund
receives Fixed 5.000% and provides default
protection on TUI AG 2.75% 24/3/2016)
(20/12/2018) 2,150
EUR 90,000 Credit Default Swaps (Goldman Sachs) (Fund
receives Fixed 5.000% and provides default
protection on UPM-Kymmene Corp 5.625%
1/12/2014) (20/12/2018) 175
EUR 100,000 Credit Default Swaps (Goldman Sachs) (Fund
receives Fixed 5.000% and provides default
protection on Wind Acquisition Finance SA
11.75% 15/7/2017) (20/12/2018) 41
EUR 200,000 Credit Default Swaps (HSBC) (Fund receives
default protection on Fortum OYJ 5.000%
19/11/2013 and pays Fixed 1.000%) (20/9/2017) (1,289)
EUR 188,709 Credit Default Swaps (HSBC) (Fund receives
default protection on GDF Suez 5.125%
19/2/2018 and pays Fixed 1.000%)
(20/12/2017) (4,206)
EUR 100,000 Credit Default Swaps (HSBC) (Fund receives
default protection on Rallye SA 7.625%
4/11/2016 and pays Fixed 5.000%)
(20/12/2017) (8,931)
EUR 100,000 Credit Default Swaps (HSBC) (Fund receives
default protection on Telecom Italia SpA
5.375% 29/1/2019 and pays Fixed 1.000%)
(20/12/2017) (5,295)
EUR 71,000 Credit Default Swaps (HSBC) (Fund receives
Fixed 1.000% and provides default protection
on Publicis Groupe SA 4.250% 31/3/2015)
(20/9/2017) 2,268
EUR 183,500 Credit Default Swaps (HSBC) (Fund receives
Fixed 1.000% and provides default protection
on Shell International Finance BV 5.200%
22/3/2017) (20/9/2017) 4,899
EUR 40,000 Credit Default Swaps (HSBC) (Fund receives
Fixed 5.000% and provides default protection
on ConvaTec Healthcare E SA 10.875%
15/12/2018) (20/12/2017) 4,281
EUR 300,000 Credit Default Swaps (JP Morgan Chase Bank
(Depository Cle)) (Fund receives default
protection on Pernod Ricard SA 4.875%
18/3/2016 and pays Fixed 1.000%) (20/9/2018) (5,814)
EUR 50,000 Credit Default Swaps (JP Morgan Chase Bank)
(Fund receives default protection on LANXESS
Finance BV 7.750% 9/4/2014 and pays Fixed
1.000%) (20/12/2017) (830)
EUR 120,000 Credit Default Swaps (JP Morgan Chase Bank)
(Fund receives default protection on LANXESS
Finance BV 7.750% 9/4/2014 and pays Fixed
1.000%) (20/3/2018) (1,127)
EUR 110,000 Credit Default Swaps (JP Morgan Chase Bank)
(Fund receives default protection on Michelin
Luxembourg SCS 2.75% 20/6/2019 and pays
Fixed 1.000%) (20/12/2018) (505)
EUR 150,000 Credit Default Swaps (JP Morgan Chase
Bank) (Fund receives default protection on
STMicroelectronics NV and pays Fixed 1.000%)
(20/12/2018) (153)
EUR 40,000 Credit Default Swaps (JP Morgan Chase
Bank) (Fund receives default protection on
Suedzucker International Finance BV 4.125%
29/3/2018 and pays Fixed 1.000%) (20/12/2018) (339)
EUR 100,000 Credit Default Swaps (JP Morgan Chase Bank)
(Fund receives default protection on Telecom
Italia SpA 5.375% 29/1/2019 and pays Fixed
1.000%) (20/12/2017) (3,233)
EUR 50,000 Credit Default Swaps (JP Morgan Chase Bank)
(Fund receives Fixed 1.000% and provides
default protection on ArcelorMittal 6.125%
1/6/2018) (20/12/2018) 1,079
EUR 100,000 Credit Default Swaps (JP Morgan Chase Bank)
(Fund receives Fixed 1.000% and provides
default protection on BAE Systems Plc
10.750% 24/11/2014) (20/9/2018) 864
EUR 170,000 Credit Default Swaps (JP Morgan Chase Bank)
(Fund receives Fixed 1.000% and provides
default protection on Enel SpA 5.25%
20/6/2017) (20/12/2018) 887
EUR 100,000 Credit Default Swaps (JP Morgan Chase Bank)
(Fund receives Fixed 1.000% and provides
default protection on Gecina SA 2.125%
1/1/2016) (20/12/2017) 4,763
EUR 50,000 Credit Default Swaps (JP Morgan Chase Bank)
(Fund receives Fixed 1.000% and provides
default protection on Heathrow Funding Ltd
4.600% 15/2/2018) (20/12/2017) 2,198
EUR 100,000 Credit Default Swaps (JP Morgan Chase Bank)
(Fund receives Fixed 1.000% and provides
default protection on Kering 3.750% 8/4/2015)
(20/12/2017) 2,807
EUR 40,000 Credit Default Swaps (JP Morgan Chase Bank)
(Fund receives Fixed 1.000% and provides
default protection on Kering 3.750% 8/4/2015)
(20/12/2017) 1,081
EUR 40,000 Credit Default Swaps (JP Morgan Chase Bank)
(Fund receives Fixed 1.000% and provides
default protection on Kering 3.750% 8/4/2015)
(20/12/2017) 978
EUR 100,000 Credit Default Swaps (JP Morgan Chase Bank)
(Fund receives Fixed 1.000% and provides
default protection on Kingfisher Plc 5.625%
15/12/2014) (20/12/2017) 2,755
EUR 170,000 Credit Default Swaps (JP Morgan Chase Bank)
(Fund receives Fixed 1.000% and provides
default protection on Safeway Ltd 6.125%
17/12/2018) (20/12/2018) 1,038
EUR 30,000 Credit Default Swaps (JP Morgan Chase Bank)
(Fund receives Fixed 5.000% and provides
default protection on Ardagh Packaging
Finance Plc 9.250% 15/10/2020) (20/3/2018) 1,502
EUR 40,000 Credit Default Swaps (JP Morgan Chase Bank)
(Fund receives Fixed 5.000% and provides
default protection on NXP BV / NXP Funding
LLC 2.961% 15/10/2013) (20/3/2018) 3,248
EUR 50,000 Credit Default Swaps (JP Morgan Chase Bank)
(Fund receives Fixed 5.000% and provides
default protection on NXP BV / NXP Funding
LLC 2.961% 15/10/2013) (20/3/2018) 3,961
EUR 10,000 Credit Default Swaps (JP Morgan Chase Bank)
(Fund receives Fixed 5.000% and provides
default protection on Schaeffler Finance BV
7.750% 15/2/2017) (20/12/2017) 988
EUR 160,000 Credit Default Swaps (JP Morgan) (Fund receives
default protection on Accor SA 2.875%
19/6/2017 and pays Fixed 1.000%)
(20/12/2018) (129)
EUR 78,700 Credit Default Swaps (JP Morgan) (Fund receives
default protection on BASF SE 4.500%
29/6/2016 and pays Fixed 1.000%)
(20/9/2017) (1,668)
BlackRock Global Absolute Return Bond Fund continued

Nominal Value Description
Unrealisedappreciation/
(depreciation)EUR
Nominal Value Description
Unrealisedappreciation/
(depreciation)EUR
Unaudited Interim Report and Accounts 139
The notes on pages 150 to 158 form an integral part of these financial statements.
Swaps as at 30 November 2013
USD 600,000 Credit Default Swaps (JP Morgan) (Fund receives
default protection on Dow Chemical Co/The
7.375% 1/11/2029 and pays Fixed 1.000%)
(20/9/2018) (4,121)
EUR 600,000 Credit Default Swaps (JP Morgan) (Fund receives
default protection on Fortum OYJ 5.000%
19/11/2013 and pays Fixed 1.000%) (20/9/2017) (7,023)
USD 725,000 Credit Default Swaps (JP Morgan) (Fund receives
default protection on Hewlett-Packard Co
5.4% 1/3/2017 and pays Fixed 1.000%)
(20/12/2018) (11,863)
EUR 700,000 Credit Default Swaps (JP Morgan) (Fund receives
default protection on Lloyds Bank Plc 3.375%
20/4/2015 and pays Fixed 3.000%) (20/3/2018) (12,632)
EUR 970,000 Credit Default Swaps (JP Morgan) (Fund receives
default protection on Markit ITraxx Europe
Crossover 12/18 - Serie 20 and pays Fixed
5.000%) (20/12/2018) (32,780)
EUR 40,000 Credit Default Swaps (JP Morgan) (Fund receives
default protection on Metsa OYJ 3.800%
27/6/2022 and pays Fixed 1.000%) (20/6/2018) (933)
EUR 220,000 Credit Default Swaps (JP Morgan) (Fund receives
default protection on Metsa OYJ 3.800%
27/6/2022 and pays Fixed 1.000%) (20/12/2018) (4,353)
EUR 200,000 Credit Default Swaps (JP Morgan) (Fund receives
default protection on Pearson Plc 7.000%
27/10/2014 and pays Fixed 1.000%) (20/6/2017) (1,152)
EUR 50,000 Credit Default Swaps (JP Morgan) (Fund receives
default protection on PostNL NV 3.875%
1/6/2015 and pays Fixed 1.000%) (20/6/2018) (3,900)
USD 1,200,000 Credit Default Swaps (JP Morgan) (Fund receives
default protection on PPG Industries Inc
6.650% 15/3/2018 and pays Fixed 1.000%)
(20/9/2018) (1,655)
EUR 500,000 Credit Default Swaps (JP Morgan) (Fund receives
default protection on RWE AG 5.750%
14/2/2033 and pays Fixed 1.000%) (20/6/2018) (4,313)
EUR 600,000 Credit Default Swaps (JP Morgan) (Fund receives
default protection on St-Gobain Nederland
BV 5.000% 25/4/2014 and pays Fixed 1.000%)
(20/6/2018) (17,845)
USD 300,000 Credit Default Swaps (JP Morgan) (Fund receives
default protection on Time Warner Cable Inc
5.85% 1/5/2017 and pays Fixed 1.000%)
(20/12/2018) 1,500
USD 500,000 Credit Default Swaps (JP Morgan) (Fund receives
default protection on Time Warner Cable Inc
6.75% 1/7/2018 and pays Fixed 1.000%)
(20/12/2018) 558
EUR 380,000 Credit Default Swaps (JP Morgan) (Fund receives
Fixed 1.000% and provides default protection
on Alstom SA 4.125% 1/2/2017) (20/12/2018) 4,508
EUR 300,000 Credit Default Swaps (JP Morgan) (Fund receives
Fixed 1.000% and provides default protection
on Imperial Tobacco Finance Plc 6.250%
4/12/2018) (20/9/2017) 6,541
EUR 130,000 Credit Default Swaps (JP Morgan) (Fund receives
Fixed 1.000% and provides default protection
on Next Plc 5.375% 26/10/2021) (20/12/2018) 1,362
EUR 138,000 Credit Default Swaps (JP Morgan) (Fund receives
Fixed 1.000% and provides default protection
on Publicis Groupe SA 4.250% 31/3/2015)
(20/9/2017) 5,590
EUR 200,000 Credit Default Swaps (JP Morgan) (Fund receives
Fixed 1.000% and provides default protection
on Renault SA FRN 4/8/2014) (20/6/2018) 12,420
EUR 100,000 Credit Default Swaps (JP Morgan) (Fund receives
Fixed 1.000% and provides default protection
on Renault SA FRN 4/8/2014) (20/6/2018) 5,436
EUR 160,000 Credit Default Swaps (JP Morgan) (Fund receives
Fixed 1.000% and provides default protection
on Renault SA FRN 4/8/2014) (20/6/2018) 5,486
EUR 2,300,000 Credit Default Swaps (JP Morgan) (Fund receives
Fixed 1.000% and provides default protection
on RWE AG 5.750% 14/2/2033) (20/9/2018) 23,933
EUR 300,000 Credit Default Swaps (JP Morgan) (Fund receives
Fixed 1.000% and provides default protection
on Telefonica Emisiones SAU 4.375%
2/2/2016) (20/12/2018) 12,009
EUR 90,000 Credit Default Swaps (JP Morgan) (Fund receives
Fixed 1.000% and provides default protection
on Telefonica Emisiones SAU 4.375%
2/2/2016) (20/12/2018) 1,441
EUR 60,000 Credit Default Swaps (JP Morgan) (Fund receives
Fixed 5.000% and provides default protection
on Nokia OYJ 6.750% 4/2/2019) (20/9/2017) 16,188
EUR 300,000 Credit Default Swaps (JP Morgan) (Fund receives
Fixed 5.000% and provides default protection
on TUI AG 5.125% 10/12/2012) (20/9/2017) 59,950
EUR 950,000 Credit Default Swaps (Merrill Lynch) (Fund
receives default protection on iTraxx Europe
Crossover Series 20 Version 1 and pays Fixed
5.000%) (20/12/2018) (10,485)
EUR 650,000 Credit Default Swaps (Morgan Stanley) (Fund
receives default protection on Clariant Finance
Luxembourg SA 4.375% 5/4/2013 and pays
Fixed 1.000%) (20/6/2017) (56,656)
EUR 600,000 Credit Default Swaps (Morgan Stanley) (Fund
receives default protection on Tate & Lyle
International Finance Plc 6.750% 25/11/2019
and pays Fixed 1.000%) (20/6/2017) (4,342)
EUR 390,000 Credit Default Swaps (Morgan Stanley) (Fund
receives Fixed 1.000% and provides default
protection on Centrica Plc 7.000% 19/9/2018)
(20/6/2017) 5,884
EUR 550,000 Credit Default Swaps (Morgan Stanley) (Fund
receives Fixed 1.000% and provides default
protection on Swisscom AG 3.500% 19/7/2013)
(20/6/2017) 11,988
EUR 78,800 Credit Default Swaps (UBS) (Fund receives
default protection on BASF SE 4.500%
29/6/2016 and pays Fixed 1.000%) (20/9/2017) (1,739)
EUR 70,000 Credit Default Swaps (UBS) (Fund receives
default protection on BAT International
Finance Plc 5.875% 12/3/2015 and pays Fixed
1.000%) (20/12/2017) (333)
EUR 150,000 Credit Default Swaps (UBS) (Fund receives
default protection on Clariant Finance
Luxembourg SA 4.375% 5/4/2013 and pays
Fixed 1.000%) (20/9/2017) (14,239)
EUR 220,000 Credit Default Swaps (UBS) (Fund receives
default protection on STMicroelectronics
Finance BV 0.652% 17/3/2013 and pays Fixed
1.000%) (20/6/2017) (9,404)
EUR 20,000 Credit Default Swaps (UBS) (Fund receives
default protection on Telecom Italia SpA
5.375% 29/1/2019 and pays Fixed 1.000%)
(20/3/2018) (297)
EUR 71,000 Credit Default Swaps (UBS) (Fund receives Fixed
1.000% and provides default protection on
Publicis Groupe SA 4.250% 31/3/2015)
(20/9/2017) 2,389
BlackRock Global Absolute Return Bond Fund continued

Nominal Value Description
Unrealisedappreciation/
(depreciation)EUR
Nominal Value Description
Unrealisedappreciation/
(depreciation)EUR
Note: The total market value of EUR (359,186) is included in the Statement of Net Assets (see note 2(d)).
140 BlackRock Strategic Funds (BSF)
Swaps as at 30 November 2013
EUR 148,000 Credit Default Swaps (UBS) (Fund receives Fixed
1.000% and provides default protection on
Publicis Groupe SA 4.250% 31/3/2015)
(20/9/2017) 4,018
EUR 1,420,000 Interest Rate Swap (Barclays Bank) (Fund receives
Fixed 2.465% and pays Floating EUR 6 Month
EURIBOR) (8/7/2033) (23,719)
GBP 2,900,000 Interest Rate Swap (Barclays Bank) (Fund receives
Fixed 2.489% and pays Floating GBP 6 Month
LIBOR) (10/7/2023) (63,986)
GBP 3,200,000 Interest Rate Swap (Barclays Bank) (Fund receives
Fixed 2.690% and pays Floating GBP 6 Month
LIBOR) (18/11/2023) (18,060)
GBP 3,200,000 Interest Rate Swap (Barclays Bank) (Fund
receives Fixed 2.772% and pays Floating GBP
6 Month LIBOR) (13/11/2023) 11,358
EUR 800,000 Interest Rate Swap (Barclays Bank) (Fund
receives Floating EUR 6 Month EURIBOR
and pays Fixed 2.605%) (8/7/2063) 7,983
GBP 6,260,000 Interest Rate Swap (Barclays Bank) (Fund
receives Floating GBP 6 Month LIBOR
and pays Fixed 2.913%) (7/3/2025) 28,784
GBP 2,850,000 Interest Rate Swap (Citibank) (Fund receives
Floating GBP 6 Month LIBOR and pays Fixed
2.765%) (21/11/2023) (9,512)
GBP 2,900,000 Interest Rate Swap (Credit Suisse) (Fund
receives Fixed 2.508% and pays Floating GBP
6 Month LIBOR) (28/6/2023) (53,860)
USD 2,500,000 Interest Rate Swap (Deutsche Bank) (Fund
receives Fixed 1.891% and pays Floating
USD 3 Month LIBOR) (1/2/2019) 26,772
USD 1,000,000 Interest Rate Swap (Deutsche Bank) (Fund
receives Fixed 3.228% and pays Floating
USD 3 Month LIBOR) (22/11/2024) (3,525)
USD 1,000,000 Interest Rate Swap (Deutsche Bank) (Fund
receives Fixed 3.262% and pays Floating
USD 3 Month LIBOR) (18/11/2024) (859)
USD 850,000 Interest Rate Swap (Deutsche Bank) (Fund
receives Floating USD 3 Month LIBOR
and pays Fixed 0.560%) (25/6/2015) (2,545)
USD 6,000,000 Interest Rate Swap (Deutsche Bank) (Fund
receives Floating USD 3 Month LIBOR
and pays Fixed 0.683%) (1/2/2016) (22,713)
USD 13,800,000 Interest Rate Swap (Deutsche Bank) (Fund
receives Floating USD 3 Month LIBOR
and pays Fixed 1.164%) (28/2/2018) 6,205
USD 900,000 Interest Rate Swap (Deutsche Bank) (Fund
receives Floating USD 3 Month LIBOR
and pays Fixed 2.805%) (19/11/2023) 1,219
USD 1,300,000 Interest Rate Swap (Deutsche Bank) (Fund
receives Floating USD 3 Month LIBOR
and pays Fixed 3.571%) (1/11/2043) 30,233
USD 500,000 Interest Rate Swap (Deutsche Bank) (Fund
receives Floating USD 3 Month LIBOR
and pays Fixed 3.898%) (22/11/2044) 2,620
USD 500,000 Interest Rate Swap (Deutsche Bank) (Fund
receives Floating USD 3 Month LIBOR
and pays Fixed 3.940%) (18/11/2044) (374)
GBP 875,000 Interest Rate Swap (Goldman Sachs) (Fund
receives Floating GBP 6 Month LIBOR
and pays Fixed 3.251%) (24/10/2046) 16,115
USD 4,100,000 Interest Rate Swap (Goldman Sachs) (Fund
receives Floating USD 3 Month LIBOR
and pays Fixed 0.675%) (8/11/2016) (3,749)
USD 2,400,000 Interest Rate Swap (Goldman Sachs) (Fund
receives Floating USD 3 Month LIBOR
and pays Fixed 1.554%) (18/10/2018) (10,747)
USD 2,500,000 Interest Rate Swap (Royal Bank of Scotland)
(Fund receives Floating USD 3 Month LIBOR
and pays Fixed 1.485%) (21/10/2018) (4,777)
(EUR underlying exposure – EUR 235,603,416) (61,159)
BlackRock Global Absolute Return Bond Fund continued

Unaudited Interim Report and Accounts 141
The notes on pages 150 to 158 form an integral part of these financial statements.
BlackRock Global Absolute Return Bond Fund continued
Open Forward Foreign Exchange Transactionsas at 30 November 2013
Purchases Sales Value Date
Unrealised appreciation/
(depreciation)EUR
CZK 2,020,000 USD 104,084 3/12/2013 (2,732)
CZK 4,290,000 USD 225,813 3/12/2013 (9,304)
EUR 70,000 USD 92,225 3/12/2013 2,185
HUF 26,000,000 USD 117,204 3/12/2013 118
HUF 13,900,000 USD 64,543 3/12/2013 (1,322)
HUF 10,700,000 USD 48,912 3/12/2013 (450)
HUF 14,200,000 USD 64,749 3/12/2013 (482)
INR 3,400,000 USD 54,954 3/12/2013 (401)
INR 5,900,000 USD 93,779 3/12/2013 468
KRW 83,500,000 USD 76,876 3/12/2013 1,489
KRW 58,900,000 USD 55,305 3/12/2013 257
MXN 610,000 USD 47,334 3/12/2013 (594)
MXN 20,000 USD 1,528 3/12/2013 (2)
MXN 1,890,000 USD 146,657 3/12/2013 (1,839)
MXN 200,000 USD 15,193 3/12/2013 45
MXN 950,000 USD 73,219 3/12/2013 (559)
MXN 730,000 USD 55,055 3/12/2013 459
MYR 170,000 USD 51,763 3/12/2013 722
MYR 100,000 USD 30,114 3/12/2013 671
MYR 170,000 USD 53,459 3/12/2013 (524)
PLN 390,000 USD 120,254 3/12/2013 4,324
PLN 200,000 USD 63,759 3/12/2013 680
PLN 70,000 USD 22,571 3/12/2013 51
PLN 200,000 USD 63,759 3/12/2013 680
PLN 240,000 USD 77,382 3/12/2013 176
RUB 1,100,000 USD 34,072 3/12/2013 (671)
RUB 6,450,000 USD 196,811 3/12/2013 (1,750)
SGD 110,000 USD 86,303 3/12/2013 990
SGD 60,000 USD 47,030 3/12/2013 573
SGD 60,000 USD 47,950 3/12/2013 (104)
SGD 180,000 USD 144,409 3/12/2013 (722)
TRY 150,000 USD 72,505 3/12/2013 1,337
TRY 310,000 USD 152,984 3/12/2013 455
TRY 260,000 USD 130,228 3/12/2013 (1,030)
USD 114,951 CZK 2,190,000 3/12/2013 4,511
USD 183,959 CZK 3,510,000 3/12/2013 7,026
USD 31,811 CZK 610,000 3/12/2013 1,104
USD 82,263 EUR 62,000 3/12/2013 (1,510)
USD 10,562 EUR 8,000 3/12/2013 (234)
USD 48,106 HUF 11,000,000 3/12/2013 (1,138)
USD 203,924 HUF 45,100,000 3/12/2013 252
USD 39,090 HUF 8,700,000 3/12/2013 (134)
USD 47,473 INR 2,950,000 3/12/2013 196
USD 54,839 INR 3,400,000 3/12/2013 316
USD 47,573 INR 2,950,000 3/12/2013 269
USD 23,751 KRW 25,900,000 3/12/2013 (531)
USD 78,515 KRW 84,600,000 3/12/2013 (1,047)
USD 29,964 KRW 31,900,000 3/12/2013 (131)
USD 119,759 MXN 1,580,000 3/12/2013 (554)
USD 129,158 MXN 1,660,000 3/12/2013 1,871
USD 86,196 MXN 1,160,000 3/12/2013 (1,677)
USD 135,334 MYR 440,000 3/12/2013 (872)
USD 138,221 PLN 450,000 3/12/2013 (5,381)
USD 105,005 PLN 330,000 3/12/2013 (1,268)
USD 6,504 PLN 20,000 3/12/2013 26
USD 94,201 PLN 300,000 3/12/2013 (2,077)
USD 62,415 RUB 2,100,000 3/12/2013 (653)
USD 119,619 RUB 3,850,000 3/12/2013 2,620
USD 49,246 RUB 1,600,000 3/12/2013 746
USD 48,403 SGD 60,000 3/12/2013 437
USD 16,056 SGD 20,000 3/12/2013 88
USD 260,752 SGD 330,000 3/12/2013 (1,615)
USD 59,985 TRY 120,000 3/12/2013 387
USD 138,367 TRY 280,000 3/12/2013 (272)
USD 90,191 TRY 180,000 3/12/2013 737
Open Forward Foreign Exchange Transactionsas at 30 November 2013
Purchases Sales Value Date
Unrealised appreciation/
(depreciation)EUR
USD 67,446 TRY 140,000 3/12/2013 (1,414)
EUR 680,130 USD 919,000 5/12/2013 4,369
EUR 17,926,055 USD 24,384,578 5/12/2013 (4,463)
EUR 2,655,242 USD 3,586,342 5/12/2013 18,126
EUR 54,111 USD 73,000 5/12/2013 432
EUR 335,928 USD 454,134 5/12/2013 1,993
USD 69,000 EUR 51,444 5/12/2013 (707)
EUR 2,155,714 GBP 1,800,000 9/12/2013 (5,474)
EUR 65,263 GBP 55,000 9/12/2013 (773)
EUR 65,287 GBP 55,000 9/12/2013 (749)
EUR 59,362 GBP 50,000 9/12/2013 (671)
EUR 233,039 GBP 195,000 9/12/2013 (1,090)
EUR 392,876 GBP 330,000 9/12/2013 (3,342)
EUR 65,301 GBP 55,000 9/12/2013 (735)
EUR 1,040,812 USD 1,410,754 9/12/2013 3,450
EUR 213,989 USD 286,163 9/12/2013 3,566
EUR 1,735,934 USD 2,315,000 9/12/2013 33,659
EUR 429,137 USD 583,084 9/12/2013 382
EUR 784,929 USD 1,050,000 9/12/2013 12,838
GBP 410,000 EUR 485,567 9/12/2013 6,704
GBP 175,000 EUR 209,493 9/12/2013 623
USD 600,000 EUR 443,852 9/12/2013 (2,657)
USD 1,907,327 EUR 1,411,172 9/12/2013 (8,668)
USD 15,000 EUR 11,428 9/12/2013 (398)
USD 15,000 EUR 11,426 9/12/2013 (396)
USD 790,000 EUR 578,073 9/12/2013 2,833
USD 15,000 EUR 11,425 9/12/2013 (395)
USD 8,220 JPY 805,048 9/12/2013 257
INR 246,187 USD 3,939 10/12/2013 (3)
KRW 498,509,318 USD 468,348 10/12/2013 1,848
MYR 11,083 USD 3,493 10/12/2013 (41)
TWD 18,024,693 USD 613,920 10/12/2013 (3,522)
USD 2,248 IDR 25,137,948 10/12/2013 106
USD 175,581 KRW 188,380,332 10/12/2013 (1,730)
USD 92,876 KRW 98,803,747 10/12/2013 (330)
USD 1,637 PHP 70,713 10/12/2013 15
USD 352,298 THB 11,048,919 11/12/2013 6,124
USD 326,392 THB 10,382,533 11/12/2013 2,329
AUD 324,000 USD 306,071 12/12/2013 (8,087)
AUD 980,000 USD 913,278 12/12/2013 (15,274)
AUD 1,391,000 USD 1,292,854 12/12/2013 (19,149)
AUD 967,000 USD 911,282 12/12/2013 (22,512)
AUD 3,377,000 USD 3,180,936 12/12/2013 (77,528)
AUD 1,625,000 USD 1,499,343 12/12/2013 (14,282)
AUD 239,000 USD 224,681 12/12/2013 (5,161)
AUD 870,000 USD 811,318 12/12/2013 (13,965)
AUD 914,000 USD 851,025 12/12/2013 (13,697)
AUD 688,000 USD 655,140 12/12/2013 (21,004)
AUD 982,000 USD 911,544 12/12/2013 (12,660)
AUD 1,098,000 USD 1,033,842 12/12/2013 (24,906)
CAD 458,000 USD 438,735 12/12/2013 (4,368)
CAD 385,000 USD 370,627 12/12/2013 (5,011)
CAD 188,000 USD 182,577 12/12/2013 (3,620)
CAD 347,000 USD 333,986 12/12/2013 (4,473)
CAD 2,157,000 USD 2,078,366 12/12/2013 (29,466)
CAD 1,849,000 USD 1,779,375 12/12/2013 (23,627)
CAD 2,210,000 USD 2,132,460 12/12/2013 (32,415)
EUR 742,000 USD 993,230 12/12/2013 11,652
EUR 2,247,000 USD 3,041,269 12/12/2013 10,677
EUR 1,903,000 USD 2,589,686 12/12/2013 (1,263)
EUR 1,032,000 USD 1,416,870 12/12/2013 (9,861)
EUR 2,355,000 USD 3,167,898 12/12/2013 25,563
EUR 490,000 USD 663,188 12/12/2013 2,341
EUR 306,379 USD 412,524 12/12/2013 3,040
EUR 1,968,000 USD 2,669,858 12/12/2013 4,785

142 BlackRock Strategic Funds (BSF)
BlackRock Global Absolute Return Bond Fund continued
Open Forward Foreign Exchange Transactionsas at 30 November 2013
Purchases Sales Value Date
Unrealised appreciation/
(depreciation)EUR
EUR 312,000 USD 428,674 12/12/2013 (3,215)
GBP 1,605,000 USD 2,536,138 12/12/2013 62,135
GBP 238,000 USD 380,294 12/12/2013 6,112
GBP 4,045,000 USD 6,489,676 12/12/2013 84,552
GBP 195,000 USD 316,319 12/12/2013 1,527
GBP 851,000 USD 1,377,609 12/12/2013 8,751
GBP 453,000 USD 710,476 12/12/2013 21,457
GBP 2,641,000 USD 4,231,042 12/12/2013 59,689
GBP 1,999,000 USD 3,219,386 12/12/2013 32,777
JPY 64,900,000 USD 638,530 12/12/2013 (3,017)
JPY 267,100,000 USD 2,712,210 12/12/2013 (74,405)
JPY 37,200,000 USD 373,241 12/12/2013 (7,055)
JPY 112,000,000 USD 1,125,589 12/12/2013 (22,602)
JPY 266,150,000 USD 2,706,562 12/12/2013 (77,081)
JPY 32,800,000 USD 321,463 12/12/2013 (609)
JPY 171,500,000 USD 1,702,483 12/12/2013 (19,113)
JPY 65,900,000 USD 658,665 12/12/2013 (10,635)
JPY 71,400,000 USD 725,621 12/12/2013 (20,334)
JPY 52,800,000 USD 519,515 12/12/2013 (2,479)
NOK 1,614,000 USD 264,029 12/12/2013 81
NOK 3,460,000 USD 565,939 12/12/2013 226
NOK 11,483,000 USD 1,896,448 12/12/2013 (12,644)
NOK 895,000 USD 151,089 12/12/2013 (3,395)
NOK 7,322,000 USD 1,226,621 12/12/2013 (20,837)
NOK 8,813,000 USD 1,459,782 12/12/2013 (12,859)
NZD 870,396 USD 712,747 12/12/2013 (2,039)
NZD 1,531,604 USD 1,267,303 12/12/2013 (13,226)
NZD 658,000 USD 544,767 12/12/2013 (5,914)
NZD 311,000 USD 253,602 12/12/2013 57
NZD 483,000 USD 385,062 12/12/2013 6,557
NZD 913,000 USD 752,094 12/12/2013 (5,418)
NZD 736,000 USD 610,353 12/12/2013 (7,357)
NZD 29,000 USD 24,246 12/12/2013 (434)
SEK 4,045,000 USD 619,173 12/12/2013 (978)
SEK 3,675,000 USD 563,623 12/12/2013 (1,687)
SEK 6,745,000 USD 1,036,848 12/12/2013 (4,854)
SEK 1,785,000 USD 274,969 12/12/2013 (1,709)
SEK 1,551,000 USD 239,558 12/12/2013 (1,952)
SEK 1,070,000 USD 163,157 12/12/2013 204
SEK 3,685,000 USD 569,333 12/12/2013 (4,764)
SEK 6,887,000 USD 1,064,011 12/12/2013 (8,879)
SEK 3,616,000 USD 552,758 12/12/2013 (325)
SEK 3,954,000 USD 612,209 12/12/2013 (6,078)
SEK 13,488,000 USD 2,069,500 12/12/2013 (6,847)
SEK 14,669,000 USD 2,249,842 12/12/2013 (6,814)
USD 547,629 AUD 578,000 12/12/2013 15,613
USD 854,739 AUD 901,000 12/12/2013 25,134
USD 588,728 AUD 634,000 12/12/2013 8,332
USD 476,814 AUD 511,000 12/12/2013 8,409
USD 586,352 AUD 622,000 12/12/2013 14,621
USD 3,723,127 AUD 4,039,000 12/12/2013 32,889
USD 313,628 AUD 341,000 12/12/2013 2,259
USD 909,030 AUD 971,000 12/12/2013 18,178
USD 2,560,769 AUD 2,741,000 12/12/2013 47,417
USD 837,719 AUD 887,000 12/12/2013 21,994
USD 591,318 AUD 630,000 12/12/2013 12,915
USD 572,312 CAD 598,000 12/12/2013 5,310
USD 513,862 CAD 539,000 12/12/2013 3,328
USD 323,689 CAD 340,000 12/12/2013 1,765
USD 298,235 CAD 315,000 12/12/2013 419
USD 900,897 CAD 936,000 12/12/2013 12,065
USD 2,602,400 CAD 2,718,000 12/12/2013 24,987
USD 315,648 CAD 326,000 12/12/2013 5,580
USD 2,132,491 CAD 2,230,000 12/12/2013 18,541
USD 310,706 EUR 232,000 12/12/2013 (3,530)
Open Forward Foreign Exchange Transactionsas at 30 November 2013
Purchases Sales Value Date
Unrealised appreciation/
(depreciation)EUR
USD 1,422,080 EUR 1,059,000 12/12/2013 (13,308)
USD 658,863 EUR 485,000 12/12/2013 (521)
USD 4,365,319 EUR 3,222,000 12/12/2013 (12,069)
USD 1,234,179 EUR 911,000 12/12/2013 (3,476)
USD 2,231,695 EUR 1,635,000 12/12/2013 6,022
USD 1,683,117 EUR 1,257,000 12/12/2013 (19,361)
USD 319,268 EUR 236,000 12/12/2013 (1,234)
USD 2,126,625 EUR 1,570,000 12/12/2013 (6,238)
USD 5,082,821 EUR 3,738,000 12/12/2013 (471)
USD 447,240 GBP 279,000 12/12/2013 (6,110)
USD 6,053,437 GBP 3,778,000 12/12/2013 (84,760)
USD 2,377,775 GBP 1,492,000 12/12/2013 (42,912)
USD 3,715,170 GBP 2,320,000 12/12/2013 (53,618)
USD 496,804 GBP 308,000 12/12/2013 (4,484)
USD 882,407 GBP 546,000 12/12/2013 (6,691)
USD 703,061 GBP 439,000 12/12/2013 (10,101)
USD 765,343 JPY 76,100,000 12/12/2013 15,759
USD 707,891 JPY 69,800,000 12/12/2013 18,798
USD 1,794,761 JPY 177,965,000 12/12/2013 40,497
USD 3,347,066 JPY 327,890,000 12/12/2013 104,264
USD 183,691 JPY 18,000,000 12/12/2013 5,686
USD 1,614,008 JPY 160,645,000 12/12/2013 32,082
USD 442,368 JPY 44,700,000 12/12/2013 3,974
USD 2,465,151 JPY 240,200,000 12/12/2013 86,097
USD 429,921 JPY 42,500,000 12/12/2013 10,636
USD 1,656,441 NOK 10,030,000 12/12/2013 11,014
USD 245,711 NOK 1,464,000 12/12/2013 4,500
USD 704,844 NOK 4,185,000 12/12/2013 14,668
USD 918,971 NOK 5,521,000 12/12/2013 11,347
USD 1,464,092 NOK 8,902,000 12/12/2013 5,319
USD 237,054 NOK 1,410,000 12/12/2013 4,633
USD 174,424 NOK 1,067,000 12/12/2013 (144)
USD 1,054,863 NOK 6,416,000 12/12/2013 3,567
USD 1,234,425 NOK 7,326,000 12/12/2013 26,094
USD 968,962 NOK 5,773,000 12/12/2013 17,781
USD 248,544 NZD 301,000 12/12/2013 2,222
USD 317,326 NZD 380,000 12/12/2013 5,415
USD 261,892 NZD 314,000 12/12/2013 4,239
USD 285,486 NZD 345,000 12/12/2013 2,995
USD 477,829 NZD 585,000 12/12/2013 478
USD 45,442 NZD 57,000 12/12/2013 (774)
USD 243,734 NZD 294,000 12/12/2013 2,883
USD 349,111 NZD 427,000 12/12/2013 596
USD 1,001,389 NZD 1,205,000 12/12/2013 13,589
USD 1,316,588 NZD 1,592,000 12/12/2013 13,241
USD 185,075 SEK 1,210,000 12/12/2013 189
USD 308,745 SEK 2,036,000 12/12/2013 (1,646)
USD 1,194,480 SEK 7,710,000 12/12/2013 12,381
USD 1,614,319 SEK 10,492,000 12/12/2013 8,638
USD 650,528 SEK 4,259,000 12/12/2013 (1)
USD 1,280,199 SEK 8,189,000 12/12/2013 21,613
USD 365,241 SEK 2,310,000 12/12/2013 9,122
USD 519,459 SEK 3,401,000 12/12/2013 (13)
USD 1,916,447 SEK 12,334,000 12/12/2013 23,916
CAD 30,000 NOK 178,005 13/12/2013 (575)
CAD 80,000 NOK 462,920 13/12/2013 (118)
EUR 178,350 SEK 1,593,159 13/12/2013 (583)
GBP 20,811 EUR 25,000 13/12/2013 (13)
NOK 175,181 CAD 30,000 13/12/2013 235
NOK 469,544 CAD 80,000 13/12/2013 916
SEK 72,682,357 EUR 8,144,695 13/12/2013 18,475
USD 5,001 EUR 3,735 13/12/2013 (58)
MYR 868,107 USD 265,354 17/12/2013 2,798
PHP 69,319 USD 1,605 17/12/2013 (14)
PHP 26,741,373 USD 617,370 17/12/2013 (4,028)

Unaudited Interim Report and Accounts 143
The notes on pages 150 to 158 form an integral part of these financial statements.
BlackRock Global Absolute Return Bond Fund continued
Open Forward Foreign Exchange Transactionsas at 30 November 2013
Purchases Sales Value Date
Unrealised appreciation/
(depreciation)EUR
THB 20,116,373 USD 646,579 17/12/2013 (15,072)
USD 272,948 MYR 867,974 17/12/2013 2,816
USD 42 MYR 133 17/12/2013 0
USD 620,977 PHP 26,810,692 17/12/2013 5,514
USD 16,681 THB 522,442 17/12/2013 309
USD 610,308 THB 19,593,931 17/12/2013 357
EUR 25,913 USD 34,860 18/12/2013 279
EUR 640,884 USD 858,530 18/12/2013 9,583
USD 843,382 BRL 1,991,935 18/12/2013 (6,372)
EUR 105,000 USD 141,673 20/12/2013 823
JPY 64,400,000 USD 635,108 20/12/2013 (4,063)
USD 143,511 CHF 131,000 20/12/2013 (1,019)
EUR 100,000 CHF 123,235 6/1/2014 (248)
NZD 89,879 AUD 80,000 6/1/2014 328
NZD 56,198 AUD 50,000 6/1/2014 219
JPY 1,246,835 USD 12,500 7/1/2014 (227)
NOK 250,000 SEK 272,083 7/1/2014 (486)
NOK 250,000 SEK 268,818 7/1/2014 (120)
NZD 60,000 CAD 51,598 7/1/2014 93
NZD 116,299 EUR 70,000 7/1/2014 (369)
USD 12,500 JPY 1,248,768 7/1/2014 213
CHF 11,356 USD 12,500 8/1/2014 46
USD 12,500 CHF 11,391 8/1/2014 (75)
EUR 371,536 JPY 51,212,120 9/1/2014 3,327
EUR 2,290,080 USD 3,102,548 9/1/2014 8,690
SGD 360,465 USD 290,768 9/1/2014 (2,602)
USD 259,368 JPY 26,286,917 9/1/2014 1,721
USD 1,423,220 SGD 1,780,628 9/1/2014 3,209
USD 288,528 SGD 360,532 9/1/2014 916
EUR 60,000 CHF 73,971 10/1/2014 (175)
IDR 3,113,031,238 USD 270,934 10/1/2014 (7,382)
KRW 564,649,524 USD 532,990 10/1/2014 (452)
MYR 1,145,668 USD 362,095 10/1/2014 (5,365)
MYR 133 USD 42 10/1/2014 0
THB 522,442 USD 16,663 10/1/2014 (310)
USD 269,503 IDR 3,002,268,705 10/1/2014 13,155
USD 362,717 MYR 1,141,109 10/1/2014 6,861
USD 516,908 MYR 1,668,319 10/1/2014 184
USD 1,608 PHP 69,319 10/1/2014 13
USD 901,599 THB 29,013,468 10/1/2014 (275)
EUR 223,907 AUD 320,000 16/1/2014 10,098
EUR 227,343 AUD 325,000 16/1/2014 10,193
EUR 227,404 AUD 325,000 16/1/2014 10,254
EUR 223,891 AUD 320,000 16/1/2014 10,082
EUR 5,203,870 GBP 4,415,000 16/1/2014 (95,505)
EUR 5,395,743 GBP 4,575,000 16/1/2014 (95,682)
EUR 14,848,685 GBP 12,555,000 16/1/2014 (221,225)
EUR 8,299,912 GBP 7,025,000 16/1/2014 (132,276)
EUR 1,898,805 GBP 1,590,000 16/1/2014 (9,691)
EUR 588,398 USD 810,000 16/1/2014 (7,209)
EUR 490,505 USD 665,000 16/1/2014 1,519
EUR 540,942 USD 740,000 16/1/2014 (3,192)
EUR 699,062 USD 945,000 16/1/2014 4,187
EUR 1,110,630 USD 1,510,000 16/1/2014 302
EUR 1,835,400 USD 2,480,000 16/1/2014 11,815
EUR 1,539,666 USD 2,090,000 16/1/2014 2,854
GBP 160,000 EUR 190,815 16/1/2014 1,235
GBP 3,810,000 EUR 4,501,934 16/1/2014 71,253
USD 110,000 EUR 81,136 16/1/2014 (251)
USD 270,000 EUR 200,389 16/1/2014 (1,854)
USD 1,225,000 EUR 909,852 16/1/2014 (9,089)
USD 285,000 EUR 211,519 16/1/2014 (1,954)
USD 2,200,000 EUR 1,614,241 16/1/2014 3,456
AUD 45,000 EUR 31,625 23/1/2014 (1,572)
EUR 470,754 AUD 674,000 23/1/2014 20,630
Open Forward Foreign Exchange Transactionsas at 30 November 2013
Purchases Sales Value Date
Unrealised appreciation/
(depreciation)EUR
EUR 422,092 GBP 357,000 23/1/2014 (6,389)
EUR 118,304 MXN 2,127,000 23/1/2014 (541)
EUR 636,190 USD 860,000 23/1/2014 3,827
USD 8,071 GBP 5,000 23/1/2014 (66)
CNY 956,534 USD 155,559 10/2/2014 281
CNY 6,216,426 USD 999,072 10/2/2014 10,572
USD 605,766 CNY 3,732,124 10/2/2014 (1,966)
USD 604,262 TWD 18,058,364 10/2/2014 (5,536)
INR 19,258,737 USD 301,814 11/2/2014 898
EUR 825,000 USD 1,111,162 25/2/2014 8,008
NOK 3,394,000 USD 554,785 25/2/2014 (665)
USD 770,844 AUD 837,000 25/2/2014 9,020
USD 1,111,919 CHF 1,016,000 25/2/2014 (9,208)
USD 537,327 SEK 3,570,000 25/2/2014 (5,255)
Net unrealised depreciation
(EUR underlying exposure – EUR 360,673,847) (167,933)
Note: The net unrealised depreciation attributed to these transactions is included
in the Statements of Net Assets (see note 2(d)).
Bank of America N.A., Barclays Bank Plc, BNP Paribas SA, Citibank N.A., Credit Suisse
International, Deutsche Bank AG London, Goldman Sachs International, HSBC Bank Plc,
JPMorgan Chase Bank N.A., Morgan Stanley and Co International Plc, Royal Bank of
Canada (UK), Royal Bank of Scotland Plc, Standard Chartered Bank, Standard Chartered
Bank London, State Street Bank and Trust Company, State Street Bank London and UBS
AG London, Westpac Banking Corp are the counterparties to these Open Forward Foreign
Exchange Transactions.
Sector Breakdownas at 30 November 2013
% of netassets *
Government 30.16
Asset Backed Securities 18.10
Mortgage Securities 18.04
Financial 12.03
Funds 6.96
Consumer, Non-cyclical 3.42
Consumer, Cyclical 2.39
Energy 1.87
Utilities 1.84
Communications 1.74
Industrial 1.41
Diversified 0.82
Technology 0.67
Basic Materials 0.60
Other Net Liabilities (0.05)
100.00
* Based on the market value of the Portfolio of Investments
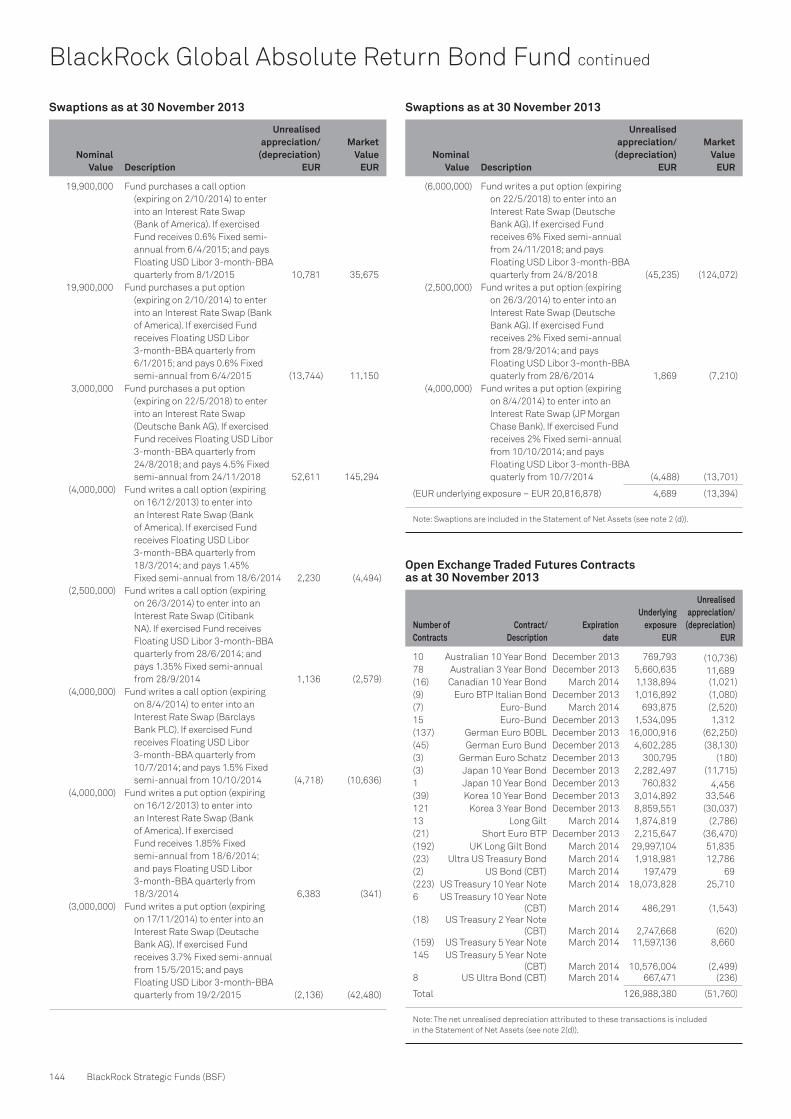
144 BlackRock Strategic Funds (BSF)
BlackRock Global Absolute Return Bond Fund continued
Swaptions as at 30 November 2013
Nominal Value Description
Unrealised appreciation/
(depreciation) EUR
Market Value
EUR
19,900,000 Fund purchases a call option
(expiring on 2/10/2014) to enter
into an Interest Rate Swap
(Bank of America). If exercised
Fund receives 0.6% Fixed semi-
annual from 6/4/2015; and pays
Floating USD Libor 3-month-BBA
quarterly from 8/1/2015 10,781 35,675
19,900,000 Fund purchases a put option
(expiring on 2/10/2014) to enter
into an Interest Rate Swap (Bank
of America). If exercised Fund
receives Floating USD Libor
3-month-BBA quarterly from
6/1/2015; and pays 0.6% Fixed
semi-annual from 6/4/2015 (13,744) 11,150
3,000,000 Fund purchases a put option
(expiring on 22/5/2018) to enter
into an Interest Rate Swap
(Deutsche Bank AG). If exercised
Fund receives Floating USD Libor
3-month-BBA quarterly from
24/8/2018; and pays 4.5% Fixed
semi-annual from 24/11/2018 52,611 145,294
(4,000,000) Fund writes a call option (expiring
on 16/12/2013) to enter into
an Interest Rate Swap (Bank
of America). If exercised Fund
receives Floating USD Libor
3-month-BBA quarterly from
18/3/2014; and pays 1.45%
Fixed semi-annual from 18/6/2014 2,230 (4,494)
(2,500,000) Fund writes a call option (expiring
on 26/3/2014) to enter into an
Interest Rate Swap (Citibank
NA). If exercised Fund receives
Floating USD Libor 3-month-BBA
quarterly from 28/6/2014; and
pays 1.35% Fixed semi-annual
from 28/9/2014 1,136 (2,579)
(4,000,000) Fund writes a call option (expiring
on 8/4/2014) to enter into an
Interest Rate Swap (Barclays
Bank PLC). If exercised Fund
receives Floating USD Libor
3-month-BBA quarterly from
10/7/2014; and pays 1.5% Fixed
semi-annual from 10/10/2014 (4,718) (10,636)
(4,000,000) Fund writes a put option (expiring
on 16/12/2013) to enter into
an Interest Rate Swap (Bank
of America). If exercised
Fund receives 1.85% Fixed
semi-annual from 18/6/2014;
and pays Floating USD Libor
3-month-BBA quarterly from
18/3/2014 6,383 (341)
(3,000,000) Fund writes a put option (expiring
on 17/11/2014) to enter into an
Interest Rate Swap (Deutsche
Bank AG). If exercised Fund
receives 3.7% Fixed semi-annual
from 15/5/2015; and pays
Floating USD Libor 3-month-BBA
quarterly from 19/2/2015 (2,136) (42,480)
Swaptions as at 30 November 2013
Nominal Value Description
Unrealised appreciation/
(depreciation) EUR
Market Value
EUR
(6,000,000) Fund writes a put option (expiring
on 22/5/2018) to enter into an
Interest Rate Swap (Deutsche
Bank AG). If exercised Fund
receives 6% Fixed semi-annual
from 24/11/2018; and pays
Floating USD Libor 3-month-BBA
quarterly from 24/8/2018 (45,235) (124,072)
(2,500,000) Fund writes a put option (expiring
on 26/3/2014) to enter into an
Interest Rate Swap (Deutsche
Bank AG). If exercised Fund
receives 2% Fixed semi-annual
from 28/9/2014; and pays
Floating USD Libor 3-month-BBA
quaterly from 28/6/2014 1,869 (7,210)
(4,000,000) Fund writes a put option (expiring
on 8/4/2014) to enter into an
Interest Rate Swap (JP Morgan
Chase Bank). If exercised Fund
receives 2% Fixed semi-annual
from 10/10/2014; and pays
Floating USD Libor 3-month-BBA
quaterly from 10/7/2014 (4,488) (13,701)
(EUR underlying exposure – EUR 20,816,878) 4,689 (13,394)
Note: Swaptions are included in the Statement of Net Assets (see note 2 (d)).
Open Exchange Traded Futures Contractsas at 30 November 2013
Number of Contracts
Contract/Description
Expirationdate
Underlying exposure
EUR
Unrealised appreciation/
(depreciation) EUR
10 Australian 10 Year Bond December 2013 769,793 (10,736)
78 Australian 3 Year Bond December 2013 5,660,635 11,689
(16) Canadian 10 Year Bond March 2014 1,138,894 (1,021)
(9) Euro BTP Italian Bond December 2013 1,016,892 (1,080)
(7) Euro-Bund March 2014 693,875 (2,520)
15 Euro-Bund December 2013 1,534,095 1,312
(137) German Euro BOBL December 2013 16,000,916 (62,250)
(45) German Euro Bund December 2013 4,602,285 (38,130)
(3) German Euro Schatz December 2013 300,795 (180)
(3) Japan 10 Year Bond December 2013 2,282,497 (11,715)
1 Japan 10 Year Bond December 2013 760,832 4,456
(39) Korea 10 Year Bond December 2013 3,014,892 33,546
121 Korea 3 Year Bond December 2013 8,859,551 (30,037)
13 Long Gilt March 2014 1,874,819 (2,786)
(21) Short Euro BTP December 2013 2,215,647 (36,470)
(192) UK Long Gilt Bond March 2014 29,997,104 51,835
(23) Ultra US Treasury Bond March 2014 1,918,981 12,786
(2) US Bond (CBT) March 2014 197,479 69
(223) US Treasury 10 Year Note March 2014 18,073,828 25,710
6 US Treasury 10 Year Note
(CBT) March 2014 486,291 (1,543)
(18) US Treasury 2 Year Note
(CBT) March 2014 2,747,668 (620)
(159) US Treasury 5 Year Note March 2014 11,597,136 8,660
145 US Treasury 5 Year Note
(CBT) March 2014 10,576,004 (2,499)
8 US Ultra Bond (CBT) March 2014 667,471 (236)
Total 126,988,380 (51,760)
Note: The net unrealised depreciation attributed to these transactions is included
in the Statement of Net Assets (see note 2(d)).
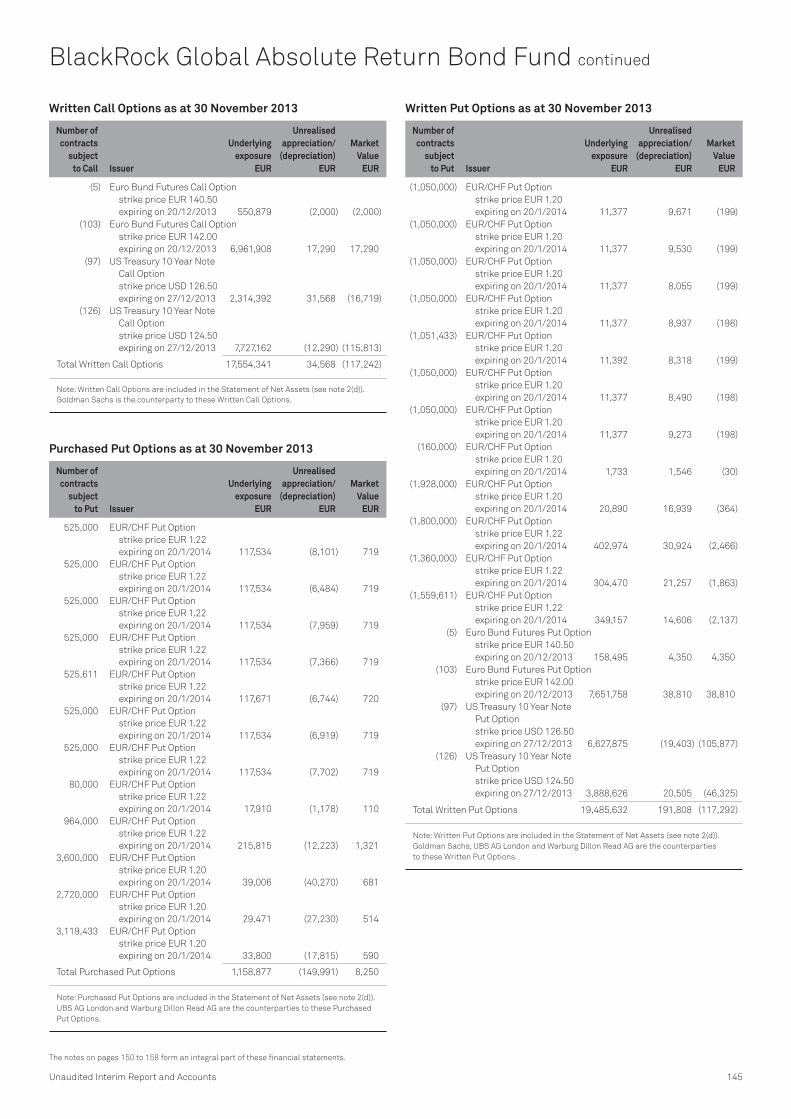
Unaudited Interim Report and Accounts 145
The notes on pages 150 to 158 form an integral part of these financial statements.
BlackRock Global Absolute Return Bond Fund continued
Written Call Options as at 30 November 2013
Number of contracts
subjectto Call Issuer
Underlying exposure
EUR
Unrealised appreciation/
(depreciation)EUR
Market Value
EUR
(5) Euro Bund Futures Call Option
strike price EUR 140.50
expiring on 20/12/2013 550,879 (2,000) (2,000)
(103) Euro Bund Futures Call Option
strike price EUR 142.00
expiring on 20/12/2013 6,961,908 17,290 17,290
(97) US Treasury 10 Year Note
Call Option
strike price USD 126.50
expiring on 27/12/2013 2,314,392 31,568 (16,719)
(126) US Treasury 10 Year Note
Call Option
strike price USD 124.50
expiring on 27/12/2013 7,727,162 (12,290) (115,813)
Total Written Call Options 17,554,341 34,568 (117,242)
Note: Written Call Options are included in the Statement of Net Assets (see note 2(d)).
Goldman Sachs is the counterparty to these Written Call Options.
Purchased Put Options as at 30 November 2013
Number of contracts
subjectto Put Issuer
Underlying exposure
EUR
Unrealised appreciation/
(depreciation)EUR
Market Value
EUR
525,000 EUR/CHF Put Option
strike price EUR 1.22
expiring on 20/1/2014 117,534 (8,101) 719
525,000 EUR/CHF Put Option
strike price EUR 1.22
expiring on 20/1/2014 117,534 (6,484) 719
525,000 EUR/CHF Put Option
strike price EUR 1.22
expiring on 20/1/2014 117,534 (7,959) 719
525,000 EUR/CHF Put Option
strike price EUR 1.22
expiring on 20/1/2014 117,534 (7,366) 719
525,611 EUR/CHF Put Option
strike price EUR 1.22
expiring on 20/1/2014 117,671 (6,744) 720
525,000 EUR/CHF Put Option
strike price EUR 1.22
expiring on 20/1/2014 117,534 (6,919) 719
525,000 EUR/CHF Put Option
strike price EUR 1.22
expiring on 20/1/2014 117,534 (7,702) 719
80,000 EUR/CHF Put Option
strike price EUR 1.22
expiring on 20/1/2014 17,910 (1,178) 110
964,000 EUR/CHF Put Option
strike price EUR 1.22
expiring on 20/1/2014 215,815 (12,223) 1,321
3,600,000 EUR/CHF Put Option
strike price EUR 1.20
expiring on 20/1/2014 39,006 (40,270) 681
2,720,000 EUR/CHF Put Option
strike price EUR 1.20
expiring on 20/1/2014 29,471 (27,230) 514
3,119,433 EUR/CHF Put Option
strike price EUR 1.20
expiring on 20/1/2014 33,800 (17,815) 590
Total Purchased Put Options 1,158,877 (149,991) 8,250
Note: Purchased Put Options are included in the Statement of Net Assets (see note 2(d)).
UBS AG London and Warburg Dillon Read AG are the counterparties to these Purchased
Put Options.
Written Put Options as at 30 November 2013
Number of contracts
subjectto Put Issuer
Underlying exposure
EUR
Unrealised appreciation/
(depreciation)EUR
Market Value
EUR
(1,050,000) EUR/CHF Put Option
strike price EUR 1.20
expiring on 20/1/2014 11,377 9,671 (199)
(1,050,000) EUR/CHF Put Option
strike price EUR 1.20
expiring on 20/1/2014 11,377 9,530 (199)
(1,050,000) EUR/CHF Put Option
strike price EUR 1.20
expiring on 20/1/2014 11,377 8,055 (199)
(1,050,000) EUR/CHF Put Option
strike price EUR 1.20
expiring on 20/1/2014 11,377 8,937 (198)
(1,051,433) EUR/CHF Put Option
strike price EUR 1.20
expiring on 20/1/2014 11,392 8,318 (199)
(1,050,000) EUR/CHF Put Option
strike price EUR 1.20
expiring on 20/1/2014 11,377 8,490 (198)
(1,050,000) EUR/CHF Put Option
strike price EUR 1.20
expiring on 20/1/2014 11,377 9,273 (198)
(160,000) EUR/CHF Put Option
strike price EUR 1.20
expiring on 20/1/2014 1,733 1,546 (30)
(1,928,000) EUR/CHF Put Option
strike price EUR 1.20
expiring on 20/1/2014 20,890 16,939 (364)
(1,800,000) EUR/CHF Put Option
strike price EUR 1.22
expiring on 20/1/2014 402,974 30,924 (2,466)
(1,360,000) EUR/CHF Put Option
strike price EUR 1.22
expiring on 20/1/2014 304,470 21,257 (1,863)
(1,559,611) EUR/CHF Put Option
strike price EUR 1.22
expiring on 20/1/2014 349,157 14,606 (2,137)
(5) Euro Bund Futures Put Option
strike price EUR 140.50
expiring on 20/12/2013 158,495 4,350 4,350
(103) Euro Bund Futures Put Option
strike price EUR 142.00
expiring on 20/12/2013 7,651,758 38,810 38,810
(97) US Treasury 10 Year Note
Put Option
strike price USD 126.50
expiring on 27/12/2013 6,627,875 (19,403) (105,877)
(126) US Treasury 10 Year Note
Put Option
strike price USD 124.50
expiring on 27/12/2013 3,888,626 20,505 (46,325)
Total Written Put Options 19,485,632 191,808 (117,292)
Note: Written Put Options are included in the Statement of Net Assets (see note 2(d)).
Goldman Sachs, UBS AG London and Warburg Dillon Read AG are the counterparties
to these Written Put Options.

Transferable Securities and Money Market Instruments Admitted to an Official Stock Exchange Listing or Dealt in on Another Regulated Market
Transferable Securities and Money Market Instruments Admitted to an Official Stock Exchange Listing or Dealt in on Another Regulated Market
Holding Description Market Value
(USD) % Holding Description Market Value
(USD) %
* Investments which are less than 0,5 USD have been rounded down to zero.
146 BlackRock Strategic Funds (BSF)
BlackRock Latin American Opportunities Fund
COMMON / PREFERRED STOCKS (SHARES)
Bermuda 202,000 Cosan Ltd 'A' 3,025,960 2.07
3,025,960 2.07
Brazil 329,000 Arezzo Industria e Comercio SA 4,084,157 2.80
378,000 Autometal SA 2,847,823 1.95
686,000 BR Properties SA 5,652,797 3.87
199,000 Cia de Saneamento de Minas
Gerais-COPASA 3,254,908 2.23
450,000 Cyrela Brazil Realty SA
Empreendimentos e
Participacoes 3,043,534 2.09
675,000 EDP - Energias do Brasil SA 3,452,870 2.37
800,000 Even Construtora e Incorporadora SA 2,814,948 1.93
450,000 Hypermarcas SA 3,669,578 2.51
589,000 Iguatemi Empresa de Shopping
Centers SA 6,005,728 4.12
422,000 Iochpe-Maxion SA 4,734,652 3.24
1,018,000 Klabin SA - Pref - 5,272,805 3.61
500,000 Kroton Educacional SA 8,464,963 5.80
236,000 Localiza Rent a Car SA 3,413,570 2.34
103,000 Lojas Renner SA 2,755,661 1.89
850,000 Magazine Luiza SA 3,056,376 2.09
375,000 Mills Estruturas e Servicos de
Engenharia SA 5,040,452 3.45
1,200,000 Minerva SA/Brazil 5,342,237 3.66
650,000 QGEP Participacoes SA 2,857,540 1.96
450,000 Ser Educacional SA 4,122,255 2.82
800,000 Suzano Papel e Celulose (Pref) 2,910,834 1.99
600,000 Usinas Siderurgicas de Minas
Gerais (Pref) 3,197,637 2.19
85,995,325 58.91
Colombia 450,000 Grupo Nutresa SA 6,056,684 4.15
6,056,684 4.15
Mexico 1,925,000 Alfa SAB de CV 'A' 5,653,384 3.87
1,588,000 Alsea SAB de CV 4,783,629 3.28
2,150,000 Bolsa Mexicana de Valores SAB de CV 5,126,469 3.51
1,750,000 Concentradora Fibra Hotelera Mexicana
SA de CV (Reit) 2,699,908 1.85
1,750,000 Corp Inmobiliaria Vesta SAB de CV 3,242,027 2.22
2,023,000 Credito Real SAB de CV 3,172,032 2.17
1,250,000 Genomma Lab Internacional SAB
de CV 'B' 3,688,196 2.53
1,595,000 Grupo Sanborns SA de CV 3,317,542 2.27
325,000 Promotora y Operadora de
Infraestructura SAB de CV 3,831,260 2.63
1,860,041 TF Administradora Industrial S
de RL de CV (Reit) 3,462,918 2.37
38,977,365 26.70
Panama 40,000 Copa Holdings SA 'A' 6,056,800 4.15
6,056,800 4.15
Peru 900,000 Grana y Montero SA 3,532,560 2.42
3,532,560 2.42
Spain 411,000 Cemex Latam Holdings SA 3,046,730 2.09
3,046,730 2.09
Total Common / Preferred Stocks (Shares) 146,691,424 100.49
BONDS
Brazil BRL 490,000 Lupatech SA 6.50% 15/4/2018 30,152 0.02
30,152 0.02
Total Bonds 30,152 0.02
Total Transferable Securities and Money
Market Instruments Admitted to an
Official Stock Exchange Listing or
Dealt in on Another Regulated Market 146,721,576 100.51
Other Transferable Securities and Money Market Instruments
WARRANTS
Brazil 802 Hypermarcas SA (Wts 31/12/2049)* – 0.00
– 0.00
Total Warrants – 0.00
BONDS
Brazil BRL 802 Hypermarcas SA FRN 15/10/2015 416,508 0.29
BRL 802 Hypermarcas SA 11.30% 15/10/2018 290,678 0.20
707,186 0.49
Total Bonds 707,186 0.49
Total Other Transferable Securities
and Money Market Instruments 707,186 0.49
Securities portfolio at market value 147,428,762 101.00
Other Net Liabilities (1,458,821) (1.00)
Total Net Assets (USD) 145,969,941 100.00
Portfolio of Investments as at 30 November 2013

Unaudited Interim Report and Accounts 147
The notes on pages 150 to 158 form an integral part of these financial statements.
BlackRock Latin American Opportunities Fund continued
Sector Breakdownas at 30 November 2013
% of netassets *
Consumer, Non-cyclical 29.82
Consumer, Cyclical 23.60
Financial 22.20
Basic Materials 7.79
Diversified 6.29
Industrial 4.72
Utilities 4.60
Energy 1.98
Other Net Liabilities (1.00)
100.00
* Based on the market value of the Portfolio of Investments

Transferable Securities and Money Market Instruments Admitted to an Official Stock Exchange Listing or Dealt in on Another Regulated Market
Transferable Securities and Money Market Instruments Admitted to an Official Stock Exchange Listing or Dealt in on Another Regulated Market
Holding Description Market Value
(USD) % Holding Description Market Value
(USD) %
1 This fund is managed by BlackRock.
148 BlackRock Strategic Funds (BSF)
BlackRock Mining Opportunities Fund
COMMON STOCKS (SHARES), WARRANTS
Australia 859,261 Alara Resources Ltd 70,470 0.78
3,000,000 Avanco Resources Ltd 174,960 1.93
245,972 Beadell Resources Ltd 170,348 1.88
322,000 Berkeley Resources Ltd 73,356 0.81
66,943 Fortescue Metals Group Ltd 346,490 3.82
414,577 Galaxy Resources Ltd
(Wts 31/12/2014) 1,889 0.02
522,770 Galaxy Resources Ltd 18,579 0.20
23,139 Iluka Resources Ltd 184,919 2.04
287,133 Indochine Mining Ltd 13,606 0.15
494,964 Metals X Ltd 81,186 0.90
112,776 Mineral Deposits Ltd 256,918 2.84
270,665 Pacific Niugini Ltd 16,032 0.18
527,064 Sierra Mining Ltd 110,466 1.22
32,799 Sirius Resources NL 63,960 0.71
535,651 Tiger Resources Ltd 165,958 1.83
77,449 Western Areas Ltd 147,503 1.63
749,375 World Titanium Resources Ltd 75,115 0.83
1,971,755 21.77
Bermuda 90,000 Petra Diamonds Ltd 158,248 1.75
158,248 1.75
Canada 11,491 Alamos Gold Inc 145,538 1.61
47,300 Augusta Resource Corp 74,261 0.82
177,119 Aureus Mining Inc 96,165 1.06
8,050 Cameco Corp 163,891 1.81
180,000 Canada Lithium Corp 69,754 0.77
15,150 Eldorado Gold Corp 92,217 1.02
31,298 First Quantum Minerals Ltd 530,409 5.85
250,000 Fission Uranium Corp 262,287 2.89
4,331 Franco-Nevada Corp 173,895 1.92
425,931 Katanga Mining Ltd 185,187 2.04
160,000 Lucara Diamond Corp 223,819 2.47
76,502 Lundin Mining Corp 315,987 3.49
45,000 MAG Silver Corp 267,958 2.96
109,000 Nevsun Resources Ltd 359,556 3.97
52,200 NGEx Resources Inc 84,862 0.94
187,105 Petaquilla Minerals Ltd 64,992 0.72
100,000 Platinum Group Metals Ltd 132,325 1.46
275,403 Romarco Minerals Inc 98,916 1.10
70,273 Santacruz Silver Mining Ltd 61,107 0.67
81,199 Sierra Metals Inc 161,938 1.79
331,000 Sirocco Mining Inc 124,360 1.37
11,357 Tahoe Resources Inc 202,129 2.23
11,357 Teck Resources Ltd 'B' 276,089 3.05
4,167,642 46.01
Ireland 397,092 Kenmare Resources Plc 129,851 1.43
129,851 1.43
Jersey 2,200 Randgold Resources Ltd ADR 155,804 1.72
155,804 1.72
Mexico 4,216 Industrias Penoles SAB de CV 106,439 1.17
106,439 1.17
Peru 7,142 Sociedad Minera Cerro Verde SAA 166,408 1.84
236,940 Volcan Cia Minera SAA 'B' 95,520 1.05
261,928 2.89
Russia 8,641 MMC Norilsk Nickel OJSC ADR 130,133 1.44
130,133 1.44
South Africa 1,914 Kumba Iron Ore Ltd 74,793 0.82
74,793 0.82
United Kingdom 10,827 Fresnillo Plc 148,410 1.64
100,693 London Mining Plc 188,263 2.08
758,000 Stratex International Plc 53,223 0.59
17,425 Vedanta Resources Plc 253,234 2.79
643,130 7.10
United States 17,531 Freeport-McMoRan Copper & Gold Inc 616,741 6.81
616,741 6.81
Total Common Stocks (Shares), Warrants 8,416,464 92.91
BONDS
Canada USD 280,000 Banro Corp 10.00% 1/3/2017 220,500 2.43
220,500 2.43
Total Bonds 220,500 2.43
FUNDS
Jersey 1,890 ETFS Physical Palladium 132,187 1.46
132,187 1.46
Total Funds 132,187 1.46
Total Transferable Securities and Money
Market Instruments Admitted to an
Official Stock Exchange Listing or
Dealt in on Another Regulated Market 8,769,151 96.80
Funds
Ireland 439,121 Institutional Cash Series Plc -
Institutional US Dollar
Liquidity Fund 1 439,121 4.85
439,121 4.85
Total Funds 439,121 4.85
Portfolio of Investments as at 30 November 2013

Other Transferable Securities and Money Market Instruments
Holding Description Market Value
(USD) %
* Investments which are less than USD 0.5 have been rounded down to zero.
Holding DescriptionMarket Value
USD
Unrealisedappreciation/
(depreciation) USD Holding Description
Market ValueUSD
Unrealisedappreciation/
(depreciation) USD
Note: The net unrealised appreciation attributed to these transactions is included in the Statement of Net Assets (see Note 2(d)).
UBS is the counterparty to these Contracts for Difference.
Unaudited Interim Report and Accounts 149
The notes on pages 150 to 158 form an integral part of these financial statements.
BlackRock Mining Opportunities Fund continued
WARRANTS
Canada 30,000 Aureus Mining Inc (Wts 16/5/2014)* - 0.00
- 0.00
Total Warrants - 0.00
Total Other Transferable Securities
and Money Market Instruments - 0.00
Securities portfolio at market value 9,208,272 101.65
Other Net Liabilities (149,558) (1.65)
Total Net Assets (USD) 9,058,714 100.00
Portfolio of Investments as at 30 November 2013
Canada (100,000) Torex Gold Resources Inc (90,737) 31,474
(90,737) 31,474
United Kingdom (8,000) Anglo American Plc (177,660) 18,778
(22,000) New World Resources Plc 'A' (27,392) 26,494
(205,052) 45,272
United States (45,000) Allied Nevada Gold Corp (146,700) 162,960
(146,700) 162,960
Total market value
(USD underlying exposure – USD 442,489) (442,489) 239,706
Contracts For Difference as at 30 November 2013
Open Forward Foreign Exchange Transactionsas at 30 November 2013
Purchases Sales Value date
Unrealised appreciation
USD
USD 3,942 ZAR 39,788 2/12/2013 35
Net unrealised appreciation
(USD underlying exposure – USD 3,907) 35
Note: The net unrealised appreciation attributed to these transactions is included
in the Statement of Net Assets (see Note 2(d)).
Deutsche Bank AG London is the counterparty to this Open Forward Foreign Exchange
Transaction.
Sector Breakdownas at 30 November 2013
% of netassets *
Basic Materials 95.34
Funds 6.31
Other Net Liabilities (1.65)
100.00
* Based on the market value of the Portfolio of Investments

150 BlackRock Strategic Funds (BSF)
Notes to the Financial Statements
1. OrganisationBlackRock Strategic Funds (“the Company”) is a public limited
company (société anonyme) established under the laws of
the Grand Duchy of Luxembourg as an open-ended variable
capital investment company (société d’investissement
à capital variable). The Company has been authorised by
the Commission de Surveillance du Secteur Financier
(“the CSSF”) as an undertaking for collective investment in
transferable securities (“UCITS”) pursuant to the provisions of
Part I of the law of 17 December 2010, as amended from time
to time and is regulated pursuant to such law. The Company
is an “umbrella” structure comprising a number of different
Funds, each having a separate portfolio of investments.
The Company has appointed BlackRock (Luxembourg) S.A. as
its Management Company.
As at 30 November 2013, the Company offered shares
in 19 Funds (“Funds”). Each Fund is a separate pool of assets
and is represented by separate shares of each Fund which are
divided into share classes as follows:
A Class
A Class distributing share EUR
A Class non-distributing share AUD
A Class non-distributing share CHF hedged
A Class non-distributing share EUR
A Class non-distributing share EUR hedged
A Class non-distributing share SEK hedged
A Class non-distributing share USD
A Class non-distributing share USD hedged
A Class UK reporting distributing fund share GBP
A Class UK reporting non-distributing fund share GBP
A Class UK reporting non-distributing fund share GBP hedged
C Class
C Class non-distributing share USD
D Class
D Class distributing share EUR
D Class non-distributing share CHF hedged
D Class non-distributing share EUR
D Class non-distributing share EUR hedged
D Class non-distributing share USD
D Class non-distributing share USD hedged
D Class UK reporting distributing fund share GBP
D Class UK reporting distributing fund share GBP hedged
D Class UK reporting non-distributing fund share EUR
D Class UK reporting non-distributing fund share EUR hedged2
D Class UK reporting non-distributing fund share GBP
D Class UK reporting non-distributing fund share GBP hedged
D Class UK reporting non-distributing fund share USD
E Class
E Class non-distributing share EUR
E Class non-distributing share USD
E Class non-distributing share EUR hedged
H Class
H Class non-distributing share CHF hedged
H Class non-distributing share EUR
H Class (continued)
H Class non-distributing share USD hedged
H Class UK reporting non-distributing fund share GBP hedged
I Class
I Class non-distributing share EUR1
I Class non-distributing share USD
I Class non-distributing share EUR hedged1
I Class non-distributing share SEK hedged1
I Class UK reporting non-distributing fund share EUR2
I Class UK reporting non-distributing fund share GBP hedged1
I Class UK reporting non-distributing fund share USD hedged1, 2
K Class
K Class non-distributing share EUR
L Class
L Class non-distributing share EUR
M Class
M Class non-distributing share EUR
T Class
T Class non-distributing share EUR*
U Class
U Class non-distributing share EUR
U Class UK reporting non-distributing fund share GBP
U Class UK reporting non-distributing fund share USD hedged2
X Class
X Class non-distributing share EUR1
X Class non-distributing share USD1
1 available to institutional investors.
2 class name changed, see Note 1, for further details.
J share Class has not yet been issued.
The classes of shares have equivalent rights in the Company
but carry different features and charging structures which are
more fully described in the Company’s Prospectus.
Fund Launch and LiquidationEffective 12 June 2013, the BlackRock Emerging Markets Flexi
Dynamic Bond Fund, denominated in USD was launched.
Effective 17 July 2013, the BlackRock European Opportunities
Absolute Return Fund, denominated in EUR was liquidated.
Effective 15 November 2013, the BlackRock Emerging Markets
Allocation Fund, denominated in USD was launched.
Significant events during the period ended 30 November 2013A new Prospectus was issued on 4 October 2013.
Effective 20 November 2013, Bruno Rovelli was appointed as
a Director of the Board.
Effective 25 November 2013, the following class name
changes occurred:
� BSF Americas Diversified Equity Absolute Return Fund D
Class non-distributing share EUR hedged changed its name

Unaudited Interim Report and Accounts 151
Notes to the Financial Statements continued
to BSF Americas Diversified Equity Absolute Return Fund D
Class UK reporting non-distributing fund share EUR hedged;
� BSF European Credit Strategies Fund I Class
non-distributing share in EUR changed its name to BSF
European Credit Strategies Fund I Class UK reporting
non-distributing fund share in EUR;
� BSF European Credit Strategies Fund I Class non-
distributing share USD hedged changed its name to BSF
European Credit Strategies Fund I Class UK reporting
non-distributing fund share USD hedged;
� BSF European Credit Strategies Fund U Class non-
distributing share USD hedged changed its name to BSF
European Credit Strategies Fund U Class UK reporting
non-distributing fund share USD hedged.
Share Classes Launched
Effective date Type Fund
12 June 2013 A Class non-distributing share USD BlackRock Emerging Markets Flexi Dynamic Bond Fund
19 June 2013 A Class non-distributing share USD BlackRock Emerging Markets Absolute Return Fund
26 June 2013 X Class non-distributing share USD BlackRock Emerging Markets Flexi Dynamic Bond Fund
3 July 2013 D Class non-distributing share USD BlackRock Emerging Markets Flexi Dynamic Bond Fund
3 July 2013 E Class non-distributing share USD BlackRock Emerging Markets Flexi Dynamic Bond Fund
17 July 2013 D Class non-distributing share EUR hedged BlackRock Emerging Markets Flexi Dynamic Bond Fund
17 July 2013 E Class non-distributing share EUR hedged BlackRock Emerging Markets Flexi Dynamic Bond Fund
11 September 2013 D Class UK reporting distributing fund share
GBP hedged BlackRock Emerging Markets Absolute Return Fund
2 October 2013 A Class non-distributing share in USD hedged BlackRock Global Absolute Return Bond Fund
13 November 2013 X Class non-distributing share USD BlackRock Asia Extension Fund
15 November 2013 A Class non-distributing share USD BlackRock Emerging Markets Allocation Fund
15 November 2013 C Class non-distributing share USD BlackRock Emerging Markets Allocation Fund
15 November 2013 D Class non-distributing share USD BlackRock Emerging Markets Allocation Fund
15 November 2013 E Class non-distributing share USD BlackRock Emerging Markets Allocation Fund
15 November 2013 I Class non-distributing share USD BlackRock Emerging Markets Allocation Fund
15 November 2013 X Class non-distributing share USD BlackRock Emerging Markets Allocation Fund
27 November 2013 A Class non-distributing share EUR hedged BlackRock Emerging Markets Absolute Return Fund
27 November 2013 D Class UK reporting distributing fund share GBP BlackRock Emerging Markets Flexi Dynamic Bond Fund
Share Classes Closed
Effective date Type Fund
8 July 2013 D Class UK reporting non-distributing fund
share GBP hedged BlackRock European Opportunities Absolute Return Fund
17 July 2013 A Class non-distributing share EUR BlackRock European Opportunities Absolute Return Fund
17 July 2013 D Class non-distributing share EUR BlackRock European Opportunities Absolute Return Fund
17 July 2013 E Class non-distributing share EUR BlackRock European Opportunities Absolute Return Fund
2. Summary of Significant Accounting Policies:The Financial Statements have been prepared in accordance
with the legal and regulatory requirements relating to the
preparation of the financial statements as prescribed by the
Luxembourg authorities for Luxembourg investment companies
and include the following significant accounting policies:
(a) Valuation of Investments and Other Assets
The Company’s investments and other assets are valued as
follows:
� the value of all securities and other assets forming any
particular Fund’s portfolio is determined by last known
prices upon close of the exchange on which those securities
or assets are traded or admitted for trading. For securities
traded on markets closing after the time of the valuation,
last known prices as of this time or such other time may
be used. If net transactions in Shares of the Fund on any
Dealing Day exceed the threshold set by the Board of
Directors of the Fund, then additional procedures apply (see
Note 2(h)). The value of any securities or assets traded on
any other regulated market is determined in the same way.
Where such securities or other assets are quoted or dealt
in on more than one stock exchange or regulated market
the Board of Directors of the Fund may in their discretion
select one of such stock exchanges or regulated markets
for such purposes;

152 BlackRock Strategic Funds (BSF)
Notes to the Financial Statements continued
� for non-quoted securities or securities not traded or dealt in
on any stock exchange or other regulated market (including
securities of closed-ended investment funds), as well as
quoted or non quoted securities on such other markets
for which no valuation price is available, or securities for
which the quoted prices are, in the opinion of the Board of
Directors of the Fund, not representative of the fair market
value, the value shall be determined prudently and in good
faith by the Board of Directors of the Fund on the basis of
their expected disposal or acquisition price;
� liquid assets such as time deposits may be valued at
nominal values plus any accrued interest or at amortised
cost basis;
� cash, bills payable on demand, other debts and prepaid
expenses are valued at their nominal amount;
� assets which include, in particular, interest and dividends
receivable, receivable for investments sold and receivable
for Fund shares subscribed are valued at nominal value;
� liabilities which include, in particular, income distribution
payable, payable for investments purchased and payable for
Fund shares redeemed are valued at nominal value.
Funds that invest in fixed income transferable securities may
purchase “To Be Announced” securities (“TBAs”). This refers
to the common trading practice in the mortgage-backed
securities market in which a security is to be bought from a
mortgage pool for a fixed price at a future date. At the time
of purchase the exact security is not known, but the main
characteristics of it are specified. Although the price has been
established at the time of purchase, the principal value has not
been finalised. As a TBA is not settled at the time of purchase,
this may lead to leveraged positions within a Fund. Purchasing
a TBA involves a risk of loss if the value of the security to be
purchased declines prior to the settlement date. Risks may
also arise upon entering into these contracts from the potential
inability of counterparties to meet the terms of their contracts.
The Funds may dispose of a commitment prior to settlement if
it is deemed appropriate to do so. Proceeds of TBA sales are not
received until the contractual settlement date. During the time
a TBA sale commitment is outstanding, equivalent deliverable
securities, or an offsetting TBA purchase commitment
(deliverable on or before the sale commitment date), are held
as cover for the transaction.
If the TBA sale commitment is closed through the acquisition of
an offsetting purchase commitment, the Fund realises a gain or
loss on the commitment without regard to any unrealised gain
or loss on the underlying security. If the Fund delivers securities
under the commitment, the Fund realises a gain or loss from
the sale of the securities upon the unit price established at the
date the commitment was entered into.
The Funds had TBAs outstanding as of 30 November 2013,
which are included within receivable for investments sold
and payable for investments purchased in the Statement
of Net Assets.
The market value of the Contracts for Difference (“CFDs”) is
determined by the traded price on the exchange on which
the underlying securities or assets are traded or admitted for
trading. For underlying securities traded on markets closing
after the time of the valuation, last known prices as of this time
or such other time may be used. The change in market value,
if any, is recorded as unrealised appreciation or depreciation
in the Statement of Operations and Changes in Net Assets.
Realised gains or losses on maturity or termination of the CFDs
are presented in the Statement of Operations and Changes
in Net Assets.
The liquidating value of futures, forward or options contracts
not traded on exchanges or on regulated markets and/or
other regulated markets shall be their net liquidating value
determined, pursuant to the policies established by the Board
of Directors of the Fund, on a basis consistently applied for
each different variety of contract. The liquidating value of
futures, forward and options contracts traded on exchanges or
on regulated markets and/or other regulated markets is based
upon the last available settlement prices of these contracts
on exchanges and regulated markets and/or other regulated
markets on which the particular futures, forward or options
contracts are traded by the Company; provided that if a futures,
forward or options contract could not be liquidated on the day
with respect to which net assets are being determined, the
basis for determining the liquidating value of such contract
shall be such value as the Board of Directors of the Fund may
deem fair and reasonable.
(b) Cost of Sales of Investments
Gains and losses on sales of investments have been
determined on the basis of the average cost method.
Gains and losses on sales of CFDs have been determined on
cost basis using the First In First Out (“FIFO”) method.
(c) Income from Investments
The Company takes credit for income from its investments on
the following basis:
� interest income is accrued daily and includes the
amortisation on a straight line basis of premiums and
accretion of discounts;
� bank interest, fixed deposit and money market deposit
income are recognised on an accrual basis;
� dividend income is accrued on the ex-dividend date.
(d) Financial Instruments
During the period, the Funds have entered into a number of
forward foreign exchange transactions and futures contracts.

Unaudited Interim Report and Accounts 153
Notes to the Financial Statements continued
Open forward foreign exchange transactions and futures
contracts are valued at the cost to close the contracts on
the valuation date. Surpluses/deficits arising from these
and closed unsettled contracts are taken to unrealised
appreciation/depreciation and are included under assets or
liabilities (as appropriate) in the Statement of Net Assets.
During the period, the Funds have entered into CFDs. CFDs
allow investors to take synthetic long or synthetic short
positions with a variable margin. Unlike shares, with CFDs
the buyer is potentially liable for far more than the amount
they paid on margin. This will result in the Funds holding
cash received from shareholders on deposit with various
institutions as described in the Prospectus. CFD positions
are entered into subject to a daily financing charge, applied
at a previously agreed rate above or below the applicable
benchmark. The related interest income or expense is
disclosed net of withholding tax in the Statement of
Operations and Changes in Net Assets.
The Funds can write covered call and put options and
purchase call and put options. When the Funds write and/or
purchase an option, an amount equal to the premium received
or paid by the Funds is reflected as a liability or an asset.
The liability for a written option and the asset for a purchased
option is subsequently marked to market to reflect the current
value of the option. When a security is sold or bought through
an exercise of an option, the premium received (or paid) is
deducted from (or added to) the basis of the security sold or
bought. When an option expires (or the Funds enter into a
closing transaction), the Funds realise a gain or loss on the
option to the extent of the premiums received or paid (or gain
or loss to the extent the cost of the closing transactions
exceeds premium paid or received).
The Funds have entered into swap agreements to exchange
the return generated by one instrument for the return
generated by another investment. In the case of credit
default swaps, a series of premiums is paid to the seller of
the protection, in return for a payment contingent on a credit
event (predefined in the agreement). Where possible, swaps
are marked to market based upon daily prices obtained from
third party pricing agents and verified against the actual
market maker. Where such quotations are not available swaps
are priced based upon daily quotations from the market
maker. In both cases changes in quotations are recorded as
unrealised appreciation or depreciation in the Statement
of Operations and Changes in Net Assets. Realised gains
or losses on maturity or termination of the swaps and the
interest earned in relation to the swaps are presented in the
Statement of Operations and Changes in Net Assets.
(e) Foreign Exchange
The cost of investments in currencies other than the currency
of denomination of the respective Fund has been translated
at the rates of exchange ruling at the time of purchase.
Investments and other assets in currencies other than the
currency of denomination of the respective Funds has been
translated at the exchange rate prevailing at the Fund’s
valuation point in Luxembourg on 30 November 2013.
Income and expenses in currencies other than the currency of
denomination of the respective Fund have been translated at
the rates of exchange prevailing on record date.
The following exchange rates were used to translate
the investments and other assets and other liabilities
denominated in currencies for all Funds other than the base
currency of the Fund at 30 November 2013:
All Funds (except the BlackRock Euro Dynamic Diversified Growth Fund and BlackRock Latin American Opportunities Fund)
BlackRock Euro Dynamic Diversified Growth Fund
BlackRock Latin American Opportunities Fund
CCY EUR USD EUR USD
ARS 0.1198 0.1630 0.1197 0.1629
AUD 0.6701 0.9112 0.6712 0.9110
BRL 0.3157 0.4293 0.3148 0.4281
CAD 0.6950 0.9452 0.6937 0.9415
CHF 0.8132 1.1059 0.8128 1.1032
CLP 0.0014 0.0019 0.0014 0.0019
CNY 0.1207 0.1641 0.1205 0.1641
COP 0.0004 0.0005 0.0004 0.0005
CZK 0.0365 0.0497 0.0365 0.0497
DKK 0.1341 0.1823 0.1341 0.1821
EUR 1.0000 1.3600 1.0000 1.3585
GBP 1.2007 1.6329 1.2031 1.6368
HKD 0.0948 0.1290 0.0947 0.1290
HUF 0.0033 0.0045 0.0033 0.0045
IDR 0.0001 0.0001 0.0001 0.0001
INR 0.0118 0.0160 0.0118 0.0160
JPY 0.0072 0.0098 0.0072 0.0098
KRW 0.0007 0.0009 0.0007 0.0009
MXN 0.0561 0.0763 0.0560 0.0763
MYR 0.2281 0.3103 0.2279 0.3103
NGN 0.0046 0.0063 0.0046 0.0063
NOK 0.1204 0.1637 0.1201 0.1631
NZD 0.6002 0.8162 0.5996 0.8135
PEN 0.2623 0.3568 0.2622 0.3568
PHP 0.0168 0.0228 0.0168 0.0228
PLN 0.2378 0.3234 0.2380 0.3231
RON 0.2253 0.3063 0.2256 0.3065
RUB 0.0222 0.0301 0.0222 0.0302
SEK 0.1123 0.1528 0.1124 0.1525
SGD 0.5859 0.7968 0.5859 0.7968
THB 0.0229 0.0311 0.0229 0.0311
TRY 0.3643 0.4955 0.3638 0.4953
TWD 0.0248 0.0338 0.0248 0.0338
USD 0.7353 1.0000 0.7345 1.0000
UYU 0.0348 0.0473 0.0347 0.0472
ZAR 0.0722 0.0982 0.0722 0.0980

154 BlackRock Strategic Funds (BSF)
Notes to the Financial Statements continued
(f) Total Combined Figures
The combined figures of the Company are expressed in
USD and include the total of the financial statements of the
different Funds. For the translation of the Statement of Net
Assets, the exchange rate prevailing at 16:00 in Luxembourg
as at 30 November 2013 for all Funds expressed in Euros
excluding BlackRock Euro Dynamic Diversified Growth Fund is:
EURUSD 0.7353
For the BlackRock Euro Dynamic Diversified Growth Fund,
the exchange rate prevailing at 17:00 in Luxembourg as at
30 November 2013 is:
EURUSD 0.7345
For the Statement of Operations and Changes in Net Assets,
the following exchange rate is the average rate calculated
over the period for all Funds expressed in Euros excluding
BlackRock Euro Dynamic Diversified Growth Fund:
EURUSD 0.7496
For the BlackRock Euro Dynamic Diversified Growth Fund,
the following exchange rate is the average rate calculated over
the period:
EURUSD 0.7495
(g) Income Equalisation
The Company operates Income Equalisation arrangements
with a view to ensure that the level of net income accrued
within a Fund is not affected by the issue, conversion or
redemption of Fund shares during an accounting period.
The Income Equalisation is netted in the Movements in share
capital in the Statement of Operation and Changes in Net
Assets.
(h) Swing Adjustment
If on any dealing day the aggregate transactions in shares
of all classes of a Fund result in a net increase or decrease
of shares which exceeds a threshold set by the Board of
Directors of the Fund, the Net Asset Value of the relevant
Fund may be adjusted by an amount which reflects the
dealing costs that may be incurred by the Fund and the
estimated bid/offer spread of the assets in which the Fund
invests. In addition, the Board of Directors of the Fund may
agree to include anticipated fiscal charges in the amount of
the adjustment. In accordance with the prospectus such a
swing was applied as at 30 November 2013 to the BlackRock
Latin American Opportunities Fund.
The Management Company may, at its discretion, decide to
subsidise the swing adjustment.
The published/dealing NAV per share is disclosed in the Three
Year Summary of Net Asset Values and may include a swing
pricing adjustment. This adjustment is not recognised in the
Statement of Net Assets or the Statement of Operations and
Changes in Net Assets.
(i) Fair valuation
If in any case a particular value is not ascertainable by the
methods outlined above, or if the Board of Directors of the
Fund considers that some other method of valuation more
accurately reflects the fair value of the relevant security
or other asset for the purpose concerned, the method of
valuation of the security or asset will be such as the Board
of Directors of the Fund in its absolute discretion decides.
Discrepancies in the value of securities may result where
the underlying markets are closed for business at the time
of calculating the net asset value of certain Funds. The
Board of Directors of the Fund may set specific thresholds,
that where exceeded, result in an adjustment to the value of
these securities to their fair value by applying a specific index
adjustment.
For BlackRock Asia Extension Fund and BlackRock Emerging
Markets Absolute Return Fund in case of price variation, the
Board of Directors of the Fund may decide to apply a fair
valuation factor on the market value of the Fund.
(j) Transaction costs
Transaction costs are incremental costs that are directly
attributable to the acquisition, issue or disposal of securities.
An incremental cost is one that would not have been incurred
if the entity had not acquired, issued or disposed of the
security. When a security is recognised initially, it is measured
at its market value, plus transaction costs that are directly
attributable to the acquisition or issue of the security.
Transaction costs excluding custodian transaction fees on
purchases or sales of securities are included within net
realised gain/(loss) or net change in unrealised appreciation/
(depreciation) within the Statement of Operations and
Changes in Net Assets of each Fund. Custodian transaction
fees are included in custodian and depositary fees in the
Statement of Operations and Changes in Net Assets of the
Fund. Refer to notes 6 for further information.
3. Management CompanyBlackRock (Luxembourg) S.A. has been appointed by
the Company to act as its Management Company. The
Management Company is authorised to act as a Fund
Management Company in accordance with Chapter 15
of 17 December 2010 Law.
The Company has signed a restated Management Company
Agreement with the Management Company effective
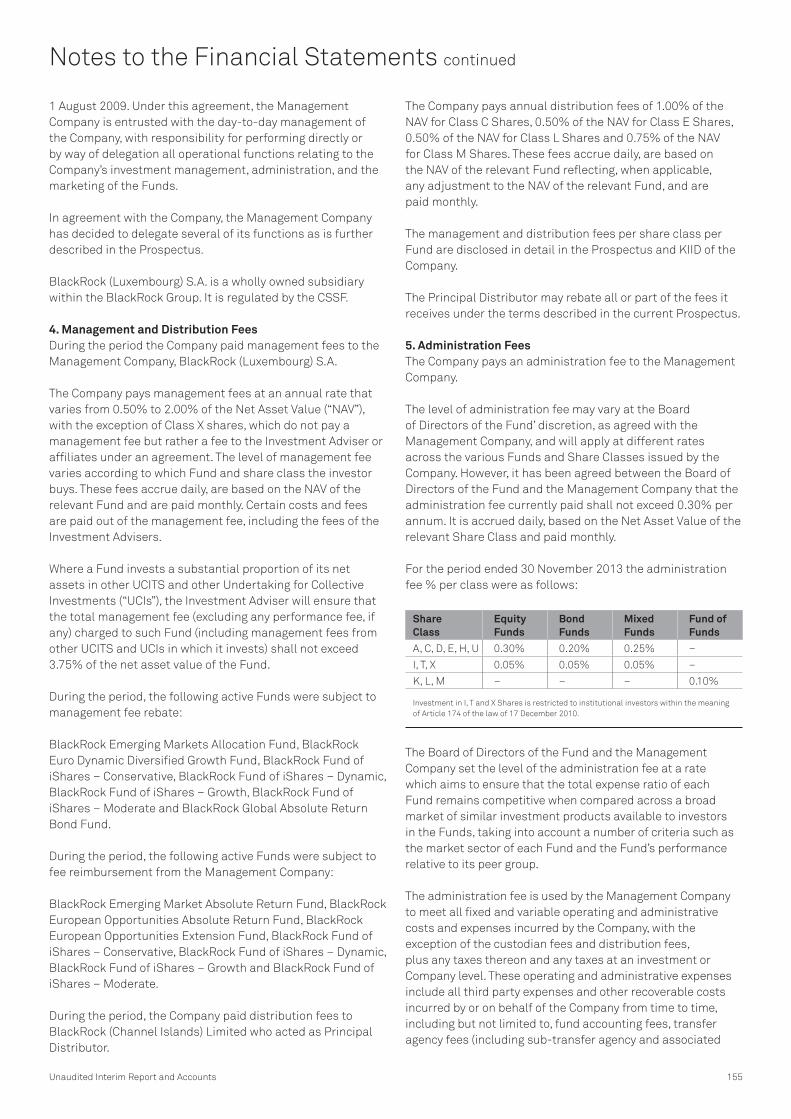
Unaudited Interim Report and Accounts 155
Notes to the Financial Statements continued
1 August 2009. Under this agreement, the Management
Company is entrusted with the day-to-day management of
the Company, with responsibility for performing directly or
by way of delegation all operational functions relating to the
Company’s investment management, administration, and the
marketing of the Funds.
In agreement with the Company, the Management Company
has decided to delegate several of its functions as is further
described in the Prospectus.
BlackRock (Luxembourg) S.A. is a wholly owned subsidiary
within the BlackRock Group. It is regulated by the CSSF.
4. Management and Distribution FeesDuring the period the Company paid management fees to the
Management Company, BlackRock (Luxembourg) S.A.
The Company pays management fees at an annual rate that
varies from 0.50% to 2.00% of the Net Asset Value (“NAV”),
with the exception of Class X shares, which do not pay a
management fee but rather a fee to the Investment Adviser or
affiliates under an agreement. The level of management fee
varies according to which Fund and share class the investor
buys. These fees accrue daily, are based on the NAV of the
relevant Fund and are paid monthly. Certain costs and fees
are paid out of the management fee, including the fees of the
Investment Advisers.
Where a Fund invests a substantial proportion of its net
assets in other UCITS and other Undertaking for Collective
Investments (“UCIs”), the Investment Adviser will ensure that
the total management fee (excluding any performance fee, if
any) charged to such Fund (including management fees from
other UCITS and UCIs in which it invests) shall not exceed
3.75% of the net asset value of the Fund.
During the period, the following active Funds were subject to
management fee rebate:
BlackRock Emerging Markets Allocation Fund, BlackRock
Euro Dynamic Diversified Growth Fund, BlackRock Fund of
iShares – Conservative, BlackRock Fund of iShares – Dynamic,
BlackRock Fund of iShares – Growth, BlackRock Fund of
iShares – Moderate and BlackRock Global Absolute Return
Bond Fund.
During the period, the following active Funds were subject to
fee reimbursement from the Management Company:
BlackRock Emerging Market Absolute Return Fund, BlackRock
European Opportunities Absolute Return Fund, BlackRock
European Opportunities Extension Fund, BlackRock Fund of
iShares – Conservative, BlackRock Fund of iShares – Dynamic,
BlackRock Fund of iShares – Growth and BlackRock Fund of
iShares – Moderate.
During the period, the Company paid distribution fees to
BlackRock (Channel Islands) Limited who acted as Principal
Distributor.
The Company pays annual distribution fees of 1.00% of the
NAV for Class C Shares, 0.50% of the NAV for Class E Shares,
0.50% of the NAV for Class L Shares and 0.75% of the NAV
for Class M Shares. These fees accrue daily, are based on
the NAV of the relevant Fund reflecting, when applicable,
any adjustment to the NAV of the relevant Fund, and are
paid monthly.
The management and distribution fees per share class per
Fund are disclosed in detail in the Prospectus and KIID of the
Company.
The Principal Distributor may rebate all or part of the fees it
receives under the terms described in the current Prospectus.
5. Administration FeesThe Company pays an administration fee to the Management
Company.
The level of administration fee may vary at the Board
of Directors of the Fund’ discretion, as agreed with the
Management Company, and will apply at different rates
across the various Funds and Share Classes issued by the
Company. However, it has been agreed between the Board of
Directors of the Fund and the Management Company that the
administration fee currently paid shall not exceed 0.30% per
annum. It is accrued daily, based on the Net Asset Value of the
relevant Share Class and paid monthly.
For the period ended 30 November 2013 the administration
fee % per class were as follows:
ShareClass
Equity Funds
Bond Funds
Mixed Funds
Fund of Funds
A, C, D, E, H, U 0.30% 0.20% 0.25% –
I, T, X 0.05% 0.05% 0.05% –
K, L, M – – – 0.10%
Investment in I, T and X Shares is restricted to institutional investors within the meaning
of Article 174 of the law of 17 December 2010.
The Board of Directors of the Fund and the Management
Company set the level of the administration fee at a rate
which aims to ensure that the total expense ratio of each
Fund remains competitive when compared across a broad
market of similar investment products available to investors
in the Funds, taking into account a number of criteria such as
the market sector of each Fund and the Fund’s performance
relative to its peer group.
The administration fee is used by the Management Company
to meet all fixed and variable operating and administrative
costs and expenses incurred by the Company, with the
exception of the custodian fees and distribution fees,
plus any taxes thereon and any taxes at an investment or
Company level. These operating and administrative expenses
include all third party expenses and other recoverable costs
incurred by or on behalf of the Company from time to time,
including but not limited to, fund accounting fees, transfer
agency fees (including sub-transfer agency and associated

156 BlackRock Strategic Funds (BSF)
Notes to the Financial Statements continued
platform dealing charges), all professional costs, such as
consultancy, legal, tax advisory and audit fees, Directors’
fees, travel expenses, reasonable out-of-pocket expenses,
printing, publication, translation and all other costs relating
to shareholder reporting, regulatory filing and licence fees,
correspondent and other banking charges, software support
and maintenance, operational costs and expenses attributed
to the Investor Servicing teams and other global administration
services provided by various BlackRock Group companies.
The Management Company bears the financial risk of ensuring
that the Fund’s total expense ratio remains competitive.
Accordingly the Management Company is entitled to retain
any amount of the administration fee paid to it which is in
excess of the actual expenses incurred by the Company
during any period whereas any costs and expenses incurred
by the Company in any period which exceed the amount of
administration fee that is paid to the Management Company,
shall be borne by the Management Company or another
BlackRock Group company.
Directors of the Fund who are not representatives of the
BlackRock Group receive a fee of EUR 25,000 per annum gross
of taxation in return for their duties performed. The Chairman
receives a fee of EUR 27,500 per annum gross of taxation.
Directors who are representatives of the BlackRock Group
have agreed to waive their Directors’ fees.
6. Custodian and Depository FeesThe Custodian receives a fee in respect of each Fund. These
fees are to remunerate the Custodian for safekeeping and
transaction costs applicable to each Fund. These fees vary in
respect of each Fund depending on the value of assets under
management and the volume of trading in that Fund.
For Funds which have low volume trading the safekeeping
fee which accrues daily, will range from 0.005% to 0.20%
per annum and the transaction fees will range from USD 7
to USD 50 per transaction.
For Funds which engage in higher trading volumes, the
Custodian does not charge separate safekeeping and
transaction fees. The Custodian receives a fee which is
charged on a sliding scale, based on the value of assets
under management and the volume of trading within each
Fund. These fees range from 1 basis point to 15 basis points
of assets under management of each Fund, depending on
whether a particular Fund is considered to be a ‘medium
volume trading Fund’ or ‘high volume trading Fund’.
Each of the Funds is also subject to a minimum annual fee
which will be set at either, USD 30,000 for a low volume
trading Fund, USD 100,000 for a medium volume trading Fund
or USD 150,000 for a high volume trading Fund.
Trading volumes for each Fund vary according to the
investment strategy of each Fund. The combined custody
cost to each Fund depends on its asset allocation and trading
activity at any time.
7. Performance FeesA performance fee may be payable out of each Share Class
of each Fund with the exception of Class X shares which
do not pay a performance fee, in addition to other fees and
expenses mentioned in the Prospectus. The performance fee
accrues on each Valuation Day and is equal to 10% or 20%
(as applicable to the relevant Fund, as stated in Appendix F
of the Prospectus) of the amount by which the net asset value
per share return exceeds the appropriate benchmark return
described in further detail in Appendix E of the Prospectus.
Two methods of calculation are used and are referred to as
Type A and Type B – the method applicable to each Fund is
indicated in Appendix E of the Prospectus.
Crystallisation of the performance fee occurs on the last day
of each Performance Period or where a shareholder redeems
or converts all or part of his shares before the end of a
Performance Period.
8. Tax
LuxembourgThe Company is registered under Luxembourg law as an
investment company. Accordingly, no Luxembourg income
or capital gains tax is at present payable by the Company.
However, it is subject to an annual “taxe d’abonnement”
calculated at an annual rate of 0.05%, and in the case of all
Class I, Class T and Class X Shares, of 0.01% of the NAV of
each Fund at the end of each quarter. For the period ended
30 November 2013, USD 831,337 was charged in relation to
Luxembourg tax.
BelgiumThe Company is registered with the Banking and Finance
Commission in Belgium in accordance with Article 154 of the
Law of 3 August 2012 relating to financial transactions and
the financial markets. Funds registered for public distribution
in Belgium are subject to an annual tax of 0.10% on the
net assets value of units distributed in Belgium via Belgian
intermediaries as at 31 December of the previous year.
For the period ended 30 November 2013, there was no charge
in relation to Belgium tax.
United KingdomReporting Funds
The UK Reporting Funds regime applies to the Company.
Under this regime, investors in UK Reporting Funds are
subject to tax on the share of the UK Reporting Funds income
attributable to their holdings in the Fund, whether or not
distributed, but any gains on disposal of their holdings are
subject to capital gains tax. A list of the Funds which currently
have UK Reporting Fund status is available at:
www.blackrock.co.uk/reportingfundstatus.
9. Brazilian Transaction TaxBrazilian transaction tax became effective from 20 October 2009.
Effective 5 October 2010 the transaction tax rate was increased
to 4% from the previous 2% rate. The rates were changed
again effective 19 October 2010 and 1 December 2011.

Unaudited Interim Report and Accounts 157
Notes to the Financial Statements continued
Currently the following rates apply to foreign currency
exchange transactions by non-residents making investments
in the Brazilian financial and capital markets.
� A 0% rate applies to transactions related to investments in
listed shares or shares issued in an Initial Public offering;
� A 6% rate applies to transactions related to fixed income
investments or investment in investment funds. Effective
4 June 2013, this rate was reduced to 0%.
For the period ended 30 November 2013, there was no charge
in relation to Brazilian tax.
10. Investment AdviceThe Management Company, BlackRock (Luxembourg) S.A.,
has delegated some management and investment advice to
the Investment Advisers: BlackRock Financial Management,
Inc., BlackRock Institutional Trust Company N.A., BlackRock
Investment Management LLC, BlackRock Investment
Management (UK) Limited (“BIM UK”) and BlackRock
(Singapore) Limited as described in the Prospectus.
The Investment Advisers provide advice and management in
the areas of stock and sector selection and strategic allocation.
BIM UK has sub-delegated some of these functions to
BlackRock Asset Management North Asia Limited, to BlackRock
Investment Management (Australia) Limited and to BlackRock
Japan Co., Ltd. Notwithstanding the appointment of the
Investment Advisers, the Management Company accepts full
responsibility to the Company for all investment transactions.
BlackRock Institutional Trust Company N.A. provides
investment advice on the following Funds:
BlackRock Americas Diversified Equity Absolute Return Fund
BlackRock Asia Extension Fund
BlackRock Emerging Markets Allocation Fund
BlackRock Global Absolute Return Bond Fund
BIM UK provides investment advice on the following Funds:
BlackRock Emerging Markets Absolute Return Fund
BlackRock Emerging Markets Allocation Fund
BlackRock Emerging Markets Flexi Dynamic Bond Fund
BlackRock Euro Dynamic Diversified Growth Fund
BlackRock European Absolute Return Fund
BlackRock European Constrained Credit Strategies Fund
BlackRock European Credit Strategies Fund
BlackRock European Diversified Equity Absolute Return Fund
BlackRock European Opportunities Absolute Return Fund
BlackRock European Opportunities Extension Fund
BlackRock Fixed Income Strategies Fund
BlackRock Fund of iShares – Conservative
BlackRock Fund of iShares – Dynamic
BlackRock Fund of iShares – Growth
BlackRock Fund of iShares – Moderate
BlackRock Global Absolute Return Bond Fund
BlackRock Mining Opportunities Fund
BlackRock Financial Management, Inc. provides investment
advice on the following Funds:
BlackRock European Constrained Credit Strategies Fund
BlackRock European Credit Strategies Fund
BlackRock Global Absolute Return Bond Fund
BlackRock (Singapore) Limited provides investment advice on
the following Fund:
BlackRock Emerging Markets Allocation Fund
BlackRock Global Absolute Return Bond Fund
BlackRock Investment Management, LLC provides investment
advice on the following Fund:
BlackRock Latin American Opportunities Fund
BIM UK has sub-delegated some of these functions to
BlackRock Asset Management North Asia Limited for the
following Funds:
BlackRock Emerging Markets Allocation Fund
BlackRock Global Absolute Return Bond Fund
BIM UK has sub-delegated some of these functions to
BlackRock Japan Co., Ltd.for the following Funds:
BlackRock Global Absolute Return Bond Fund
BIM UK has sub-delegated some of these functions to
BlackRock Investment Management (Australia) Limited for the
following Funds:
BlackRock Global Absolute Return Bond Fund
11. Transactions with Connected PersonsThe ultimate holding company of the Management Company,
the Principal Distributor and the Investment Advisers is
BlackRock, Inc., a company incorporated in Delaware,
USA. PNC Financial Services Group Inc., is a substantial
shareholder in BlackRock Inc. When arranging transactions
in securities for the Company, companies in the PNC Group
may have provided securities, brokerage, foreign exchange
banking and other services or may have acted as principal
on their usual terms and may benefit therefrom. Commission
has been paid to brokers and agents in accordance with the
relevant market practice and the benefit of any bulk or other
commission discounts or cash commission rebates provided
by brokers or agents have been passed on to the Company.
The services of PNC Group companies could have been
used by the Investment Advisers where it was considered
appropriate to do so provided that their commissions and
other terms of business are generally comparable with
those available from unassociated brokers and agents in the
markets concerned, and that this is consistent with the above
policy of obtaining best results.

158 BlackRock Strategic Funds (BSF)
Notes to the Financial Statements continued
During the period, there have been no transactions which
were outside the ordinary course of business or which were
not on normal commercial terms. There were no transactions
of the Company effected through BlackRock companies.
During the period no Director purchased shares in any
of the Funds.
12. DividendsThe Board of Directors of the Fund’s current policy is to retain
and reinvest all net income except for income attributable to
distributing share classes.
For the distributing share classes the policy is to distribute
substantially all the investment income for the period
after deduction of expenses. The Board of Directors of the
Fund may also determine if and to what extent dividends
may include distributions, from both net realised and net
unrealised capital gains.
13. Securities Pledged or Given in GuaranteeSecurities which have been given as guarantee for OTC
derivatives traded under International Swaps and Derivatives
Association (“ISDA”), are evidenced by “‡” in the Portfolio of
Investments of the Funds. As at 30 November 2013 the value
of these securities amounts to USD 15,660,170.
Securities which have been received in guarantee are detailed
in table below. As at 30 November 2013 the value of these
securities amounts to USD 1,364,786.
Fund Holdings Description Value (USD)
BlackRock European
Constrained Credit
Strategies Fund
256,000 France Government Bond
OAT 4.25% 25/10/2023
560,591
BlackRock European
Credit Strategies Fund
50,000 Bundesschatzanweisungen
0.000% 12/12/2014
(Zero Coupon) 92,507
BlackRock European
Credit Strategies Fund
325,000 France Government Bond
OAT 4.25% 25/10/2023 711,688
14. Cash collateralThe Fund trades derivatives with a range of counterparties.
The counterparties to the swap contracts, forward
transactions, futures contracts, options written (put & call),
options purchased (put & call) and swaptions are shown in
the portfolio of investments. The swap contracts, forward
transactions, futures contracts, options written (put & call),
options purchased (put & call) and swaptions are traded with
the following counterparties: Bank of America, Barclays, BNP
Paribas, Citibank, Credit Suisse, Deutsche Bank, Goldman
Sachs, HSBC, JP Morgan, Morgan Stanley and Royal Bank of
Canada (UK), Royal Bank of Scotland Plc, Standard Chartered
Bank, UBS and Westpac Banking Corp.
Margin cash is paid or received on swap contracts, CFDs,
forward transactions, futures contracts, options written
(put & call), options purchased (put & call) and swaptions to
cover any exposure by the counterparty to the Company or
by the Company to the counterparty. Due to brokers consists
primarily of cash and margin received from Portfolio’s clearing
brokers and various counterparties. It is included in “Due to
broker” on the Statement of Net Assets. Due from brokers
consists primary of cash and margin paid to the Portfolio’s
clearing brokers and various counterparties. It is included in
“Due from broker” on the Statement of Net Assets.
As at 30 November 2013, the Fund had received margin
of USD 86,346,424 from counterparties and had pledged
margin of USD 30,249,993 relating to swap contracts, forward
transactions, futures contracts, options written (put & call),
options purchased (put & call) and swaptions.
15. Efficient Portfolio Management TechniquesThe Funds may engage in derivative transactions for the
purpose of efficient portfolio management. Refer to each
Fund’s Portfolio of Investments for details.
16. Financial Derivative InstrumentsThe Funds may buy and sell financial derivative instruments.
See further details in the Fund’s Portfolio of Investments.
Underlying exposure, as disclosed in the portfolio of
investments, has been calculated according to the guidelines
issued by the European Securities and Market Authority
(“ESMA”) and represents the market value of an equivalent
position in the assets underlying each financial derivative
instrument. The underlying exposure on the bond futures is
calculated off the market value of the bonds rather than the
cheapest to deliver security.
17. Subsequent EventsThere have been no subsequent events since the period end.
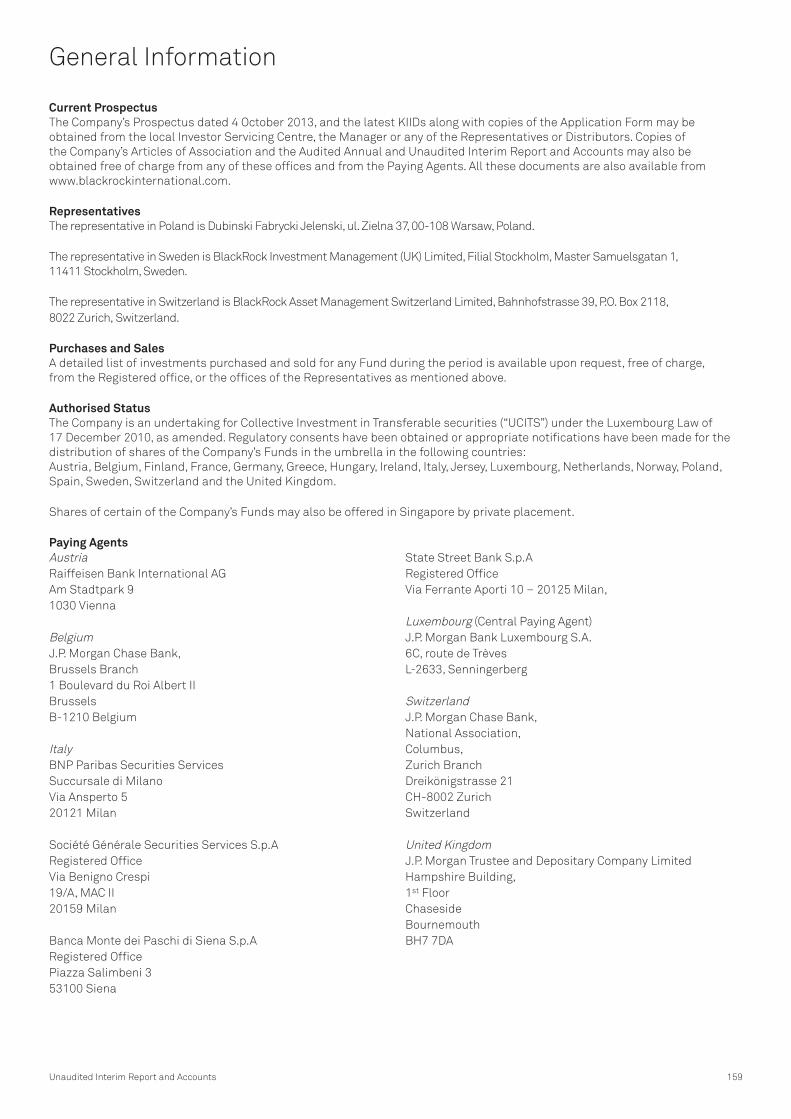
Unaudited Interim Report and Accounts 159
General Information
Current ProspectusThe Company’s Prospectus dated 4 October 2013, and the latest KIIDs along with copies of the Application Form may be
obtained from the local Investor Servicing Centre, the Manager or any of the Representatives or Distributors. Copies of
the Company’s Articles of Association and the Audited Annual and Unaudited Interim Report and Accounts may also be
obtained free of charge from any of these offices and from the Paying Agents. All these documents are also available from
www.blackrockinternational.com.
RepresentativesThe representative in Poland is Dubinski Fabrycki Jelenski, ul. Zielna 37, 00-108 Warsaw, Poland.
The representative in Sweden is BlackRock Investment Management (UK) Limited, Filial Stockholm, Master Samuelsgatan 1,
11411 Stockholm, Sweden.
The representative in Switzerland is BlackRock Asset Management Switzerland Limited, Bahnhofstrasse 39, P.O. Box 2118,
8022 Zurich, Switzerland.
Purchases and SalesA detailed list of investments purchased and sold for any Fund during the period is available upon request, free of charge,
from the Registered office, or the offices of the Representatives as mentioned above.
Authorised StatusThe Company is an undertaking for Collective Investment in Transferable securities (“UCITS”) under the Luxembourg Law of
17 December 2010, as amended. Regulatory consents have been obtained or appropriate notifications have been made for the
distribution of shares of the Company’s Funds in the umbrella in the following countries:
Austria, Belgium, Finland, France, Germany, Greece, Hungary, Ireland, Italy, Jersey, Luxembourg, Netherlands, Norway, Poland,
Spain, Sweden, Switzerland and the United Kingdom.
Shares of certain of the Company’s Funds may also be offered in Singapore by private placement.
Paying AgentsAustria
Raiffeisen Bank International AG
Am Stadtpark 9
1030 Vienna
Belgium
J.P. Morgan Chase Bank,
Brussels Branch
1 Boulevard du Roi Albert II
Brussels
B-1210 Belgium
Italy
BNP Paribas Securities Services
Succursale di Milano
Via Ansperto 5
20121 Milan
Société Générale Securities Services S.p.A
Registered Office
Via Benigno Crespi
19/A, MAC II
20159 Milan
Banca Monte dei Paschi di Siena S.p.A
Registered Office
Piazza Salimbeni 3
53100 Siena
State Street Bank S.p.A
Registered Office
Via Ferrante Aporti 10 – 20125 Milan,
Luxembourg (Central Paying Agent)
J.P. Morgan Bank Luxembourg S.A.
6C, route de Trèves
L-2633, Senningerberg
Switzerland
J.P. Morgan Chase Bank,
National Association,
Columbus,
Zurich Branch
Dreikönigstrasse 21
CH-8002 Zurich
Switzerland
United Kingdom
J.P. Morgan Trustee and Depositary Company Limited
Hampshire Building,
1st Floor
Chaseside
Bournemouth
BH7 7DA


FOR MORE INFORMATION
+44 (0)20 7743 3300
blackrockinternational.com
© 2013 BlackRock, Inc. All Rights reserved. BLACKROCK, BLACKROCK SOLUTIONS, iSHARES, SO WHAT DO I DO WITH MY MONEY, INVESTING
FOR A NEW WORLD, and BUILT FOR THESE TIMES are registered and unregistered trademarks of BlackRock, Inc. or its subsidiaries in the
United States and elsewhere. All other trademarks are those of their respective owners. PRISMA 13/1701 BSF SAR ENG 1113