infosys technologies limited auditors’ report to the members of infosys technologies limited we...
TRANSCRIPT

1
INFOSYS TECHNOLOGIES LIMITEDReport for the first quarter ended June 30, 2001
Q1_2001_PAPF_Final.p65 28/07/2001, 2:47 PM1
2
At a glance – Indian GAAP
Rs. in crores, except per share data
Quarter ended Year endedJune 30, 2001 June 30, 2000 March 31, 2001
For the period
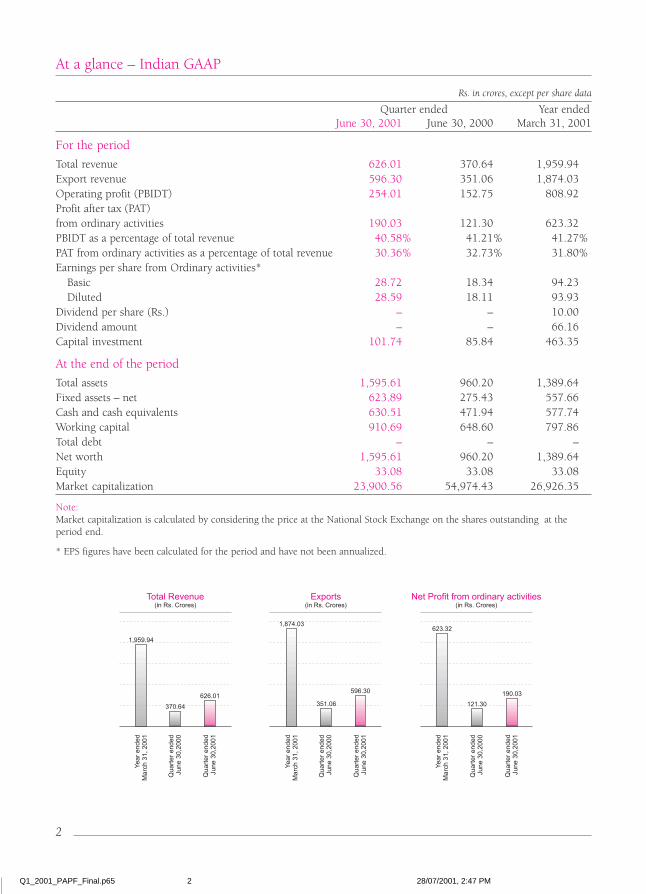
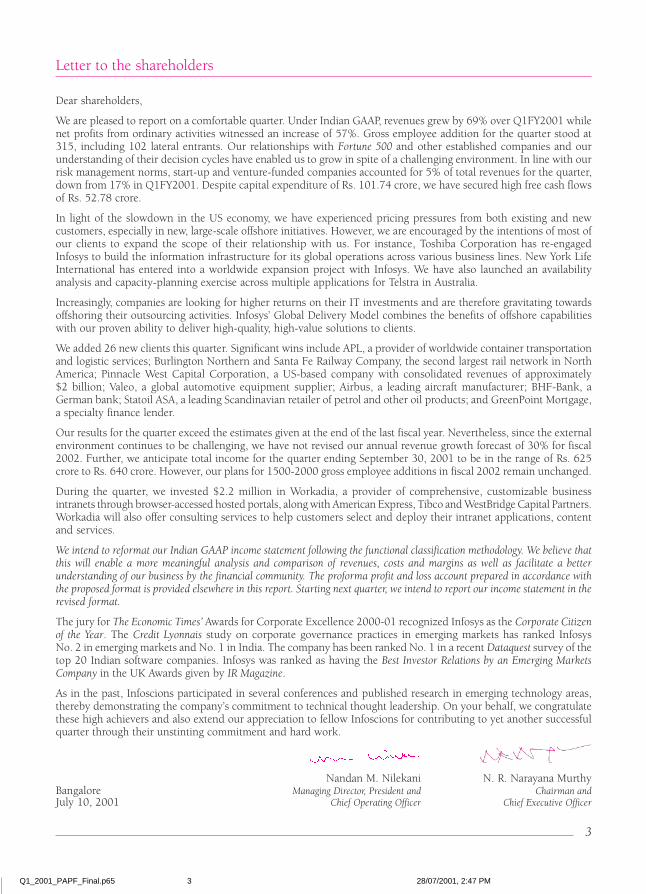
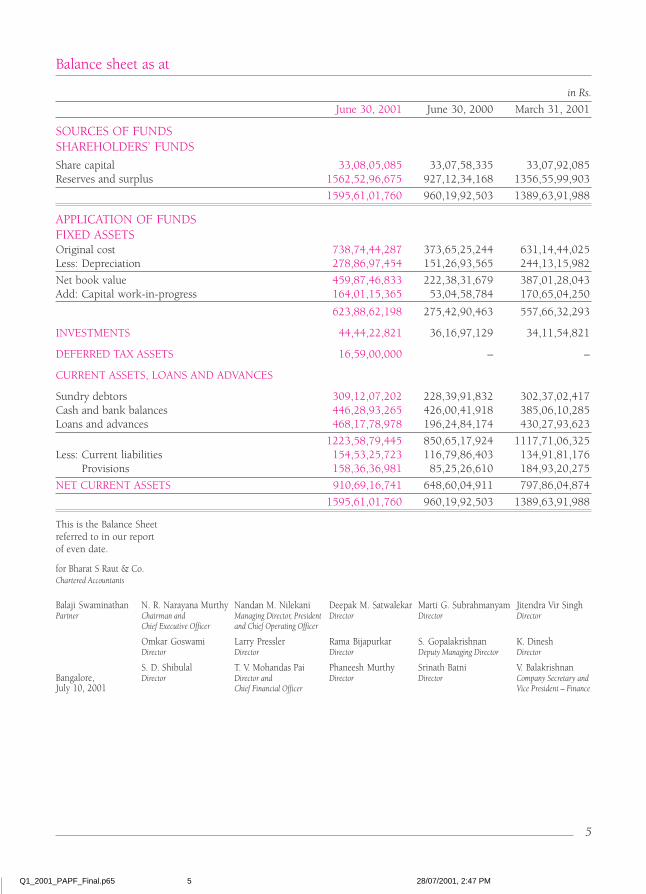
Total revenue 626.01 370.64 1,959.94Export revenue 596.30 351.06 1,874.03Operating profit (PBIDT) 254.01 152.75 808.92Profit after tax (PAT)from ordinary activities 190.03 121.30 623.32PBIDT as a percentage of total revenue 40.58% 41.21% 41.27%PAT from ordinary activities as a percentage of total revenue 30.36% 32.73% 31.80%Earnings per share from Ordinary activities*
Basic 28.72 18.34 94.23Diluted 28.59 18.11 93.93
Dividend per share (Rs.) – – 10.00Dividend amount – – 66.16Capital investment 101.74 85.84 463.35
At the end of the period
Total assets 1,595.61 960.20 1,389.64Fixed assets – net 623.89 275.43 557.66Cash and cash equivalents 630.51 471.94 577.74Working capital 910.69 648.60 797.86Total debt – – –Net worth 1,595.61 960.20 1,389.64Equity 33.08 33.08 33.08Market capitalization 23,900.56 54,974.43 26,926.35
Note:Market capitalization is calculated by considering the price at the National Stock Exchange on the shares outstanding at theperiod end.
* EPS figures have been calculated for the period and have not been annualized.
Q1_2001_PAPF_Final.p65 28/07/2001, 2:47 PM2
3
Letter to the shareholders
Dear shareholders,
We are pleased to report on a comfortable quarter. Under Indian GAAP, revenues grew by 69% over Q1FY2001 whilenet profits from ordinary activities witnessed an increase of 57%. Gross employee addition for the quarter stood at315, including 102 lateral entrants. Our relationships with Fortune 500 and other established companies and ourunderstanding of their decision cycles have enabled us to grow in spite of a challenging environment. In line with ourrisk management norms, start-up and venture-funded companies accounted for 5% of total revenues for the quarter,down from 17% in Q1FY2001. Despite capital expenditure of Rs. 101.74 crore, we have secured high free cash flowsof Rs. 52.78 crore.
In light of the slowdown in the US economy, we have experienced pricing pressures from both existing and newcustomers, especially in new, large-scale offshore initiatives. However, we are encouraged by the intentions of most ofour clients to expand the scope of their relationship with us. For instance, Toshiba Corporation has re-engagedInfosys to build the information infrastructure for its global operations across various business lines. New York LifeInternational has entered into a worldwide expansion project with Infosys. We have also launched an availabilityanalysis and capacity-planning exercise across multiple applications for Telstra in Australia.
Increasingly, companies are looking for higher returns on their IT investments and are therefore gravitating towardsoffshoring their outsourcing activities. Infosys’ Global Delivery Model combines the benefits of offshore capabilitieswith our proven ability to deliver high-quality, high-value solutions to clients.
We added 26 new clients this quarter. Significant wins include APL, a provider of worldwide container transportationand logistic services; Burlington Northern and Santa Fe Railway Company, the second largest rail network in NorthAmerica; Pinnacle West Capital Corporation, a US-based company with consolidated revenues of approximately$2 billion; Valeo, a global automotive equipment supplier; Airbus, a leading aircraft manufacturer; BHF-Bank, aGerman bank; Statoil ASA, a leading Scandinavian retailer of petrol and other oil products; and GreenPoint Mortgage,a specialty finance lender.
Our results for the quarter exceed the estimates given at the end of the last fiscal year. Nevertheless, since the externalenvironment continues to be challenging, we have not revised our annual revenue growth forecast of 30% for fiscal2002. Further, we anticipate total income for the quarter ending September 30, 2001 to be in the range of Rs. 625crore to Rs. 640 crore. However, our plans for 1500-2000 gross employee additions in fiscal 2002 remain unchanged.
During the quarter, we invested $2.2 million in Workadia, a provider of comprehensive, customizable businessintranets through browser-accessed hosted portals, along with American Express, Tibco and WestBridge Capital Partners.Workadia will also offer consulting services to help customers select and deploy their intranet applications, contentand services.
We intend to reformat our Indian GAAP income statement following the functional classification methodology. We believe thatthis will enable a more meaningful analysis and comparison of revenues, costs and margins as well as facilitate a betterunderstanding of our business by the financial community. The proforma profit and loss account prepared in accordance withthe proposed format is provided elsewhere in this report. Starting next quarter, we intend to report our income statement in therevised format.
The jury for The Economic Times’ Awards for Corporate Excellence 2000-01 recognized Infosys as the Corporate Citizenof the Year. The Credit Lyonnais study on corporate governance practices in emerging markets has ranked InfosysNo. 2 in emerging markets and No. 1 in India. The company has been ranked No. 1 in a recent Dataquest survey of thetop 20 Indian software companies. Infosys was ranked as having the Best Investor Relations by an Emerging MarketsCompany in the UK Awards given by IR Magazine.
As in the past, Infoscions participated in several conferences and published research in emerging technology areas,thereby demonstrating the company’s commitment to technical thought leadership. On your behalf, we congratulatethese high achievers and also extend our appreciation to fellow Infoscions for contributing to yet another successfulquarter through their unstinting commitment and hard work.
Nandan M. Nilekani N. R. Narayana MurthyBangalore Managing Director, President and Chairman andJuly 10, 2001 Chief Operating Officer Chief Executive Officer
Q1_2001_PAPF_Final.p65 28/07/2001, 2:47 PM3

4
Auditors’ report to the members of Infosys Technologies Limited
We have audited the attached Balance Sheet of Infosys Technologies Limited (the Company) as at June 30, 2001 andthe Profit and Loss Account of the Company for the quarter ended on that date, annexed thereto, and report that:
1 As required by the Manufacturing and Other Companies (Auditor’s Report) Order, 1988, issued by the CompanyLaw Board in terms of Section 227(4A) of the Companies Act, 1956, we enclose in the Annexure a statement onthe matters specified in paragraphs 4 and 5 of the said Order.
2 Further to our comments in the Annexure referred to in paragraph 1 above:
(a) we have obtained all the information and explanations which to the best of our knowledge and beliefwere necessary for the purpose of our audit;
(b) in our opinion, proper books of account as required by law have been kept by the Company so far asappears from our examination of these books;
(c) the Balance Sheet and Profit and Loss Account dealt with by this report are in agreement with the booksof account;
(d) in our opinion, the Balance Sheet and Profit and Loss Account dealt with by this report are prepared incompliance with the accounting standards referred to in Section 211(3C) of the Companies Act, 1956,to the extent applicable;
(e) in our opinion, and to the best of our information and according to the explanations given to us, the saidaccounts give the information required by the Companies Act, 1956, in the manner so required and givea true and fair view:
(i) in the case of the Balance Sheet, of the state of affairs of the Company as at June 30, 2001; and
(ii) in the case of the Profit and Loss Account, of the profit for the quarter ended on that date.
for Bharat S Raut & Co.Chartered Accountants
Bangalore Balaji SwaminathanJuly 10, 2001 Partner
Q1_2001_PAPF_Final.p65 28/07/2001, 2:47 PM4
5
Balaji Swaminathan N. R. Narayana Murthy Nandan M. Nilekani Deepak M. Satwalekar Marti G. Subrahmanyam Jitendra Vir SinghPartner Chairman and Managing Director, President Director Director Director
Chief Executive Officer and Chief Operating Officer
Omkar Goswami Larry Pressler Rama Bijapurkar S. Gopalakrishnan K. DineshDirector Director Director Deputy Managing Director Director
S. D. Shibulal T. V. Mohandas Pai Phaneesh Murthy Srinath Batni V. BalakrishnanBangalore, Director Director and Director Director Company Secretary andJuly 10, 2001 Chief Financial Officer Vice President – Finance
Balance sheet as at
in Rs.
June 30, 2001 June 30, 2000 March 31, 2001
SOURCES OF FUNDSSHAREHOLDERS’ FUNDS
Share capital 33,08,05,085 33,07,58,335 33,07,92,085Reserves and surplus 1562,52,96,675 927,12,34,168 1356,55,99,903
1595,61,01,760 960,19,92,503 1389,63,91,988
APPLICATION OF FUNDSFIXED ASSETSOriginal cost 738,74,44,287 373,65,25,244 631,14,44,025Less: Depreciation 278,86,97,454 151,26,93,565 244,13,15,982
Net book value 459,87,46,833 222,38,31,679 387,01,28,043Add: Capital work-in-progress 164,01,15,365 53,04,58,784 170,65,04,250
623,88,62,198 275,42,90,463 557,66,32,293
INVESTMENTS 44,44,22,821 36,16,97,129 34,11,54,821
DEFERRED TAX ASSETS 16,59,00,000 – –
CURRENT ASSETS, LOANS AND ADVANCES
Sundry debtors 309,12,07,202 228,39,91,832 302,37,02,417Cash and bank balances 446,28,93,265 426,00,41,918 385,06,10,285Loans and advances 468,17,78,978 196,24,84,174 430,27,93,623
1223,58,79,445 850,65,17,924 1117,71,06,325Less: Current liabilities 154,53,25,723 116,79,86,403 134,91,81,176
Provisions 158,36,36,981 85,25,26,610 184,93,20,275
NET CURRENT ASSETS 910,69,16,741 648,60,04,911 797,86,04,874
1595,61,01,760 960,19,92,503 1389,63,91,988
This is the Balance Sheetreferred to in our reportof even date.
for Bharat S Raut & Co.Chartered Accountants
Q1_2001_PAPF_Final.p65 28/07/2001, 2:47 PM5
6
Profit and loss account for the
in Rs.
Quarter ended Year endedJune 30, 2001 June 30, 2000 March 31, 2001
INCOME
Software development services and productsOverseas 596,30,21,488 351,05,78,423 1874,02,66,421Domestic 16,21,65,861 4,47,21,726 26,53,92,386
Other income 13,49,39,605 15,11,07,532 59,37,14,915
626,01,26,954 370,64,07,681 1959,93,73,722
EXPENDITURE
Software development expenses 318,32,88,293 189,39,05,266 958,17,66,650Administration and other expenses 53,67,64,710 28,50,11,949 177,54,70,971Provision for investments – – 15,28,98,608
372,00,53,003 217,89,17,215 1151,01,36,229
Operating profit (PBIDT) 254,00,73,951 152,74,90,466 808,92,37,493Interest – – –Depreciation 35,48,03,492 17,73,71,717 112,89,45,152Profit before tax and extraordinary item 218,52,70,459 135,01,18,749 696,02,92,341
Provision for taxation 28,50,00,000 13,71,00,000 72,71,00,000Profit after tax before extraordinary item 190,02,70,459 121,30,18,749 623,31,92,341
Extraordinary item– transfer of intellectual property rights (net of tax) – 5,49,44,000 5,49,44,000
Net profit after tax and extraordinary item 190,02,70,459 126,79,62,749 628,81,36,341
AMOUNT AVAILABLE FOR APPROPRIATION 190,02,70,459 126,79,62,749 628,81,36,341
DividendInterim – – 16,53,78,418Final – – 49,61,85,878Dividend tax – – 8,69,94,211
Amount transferred – general reserve – – 553,95,77,834Balance in Profit and Loss Account 190,02,70,459 126,79,62,749 –
190,02,70,459 126,79,62,749 628,81,36,341
EARNINGS PER SHARE (equity shares, par value Rs. 5 each)Basic 28.72 19.17 95.06Diluted 28.59 18.93 94.76
Number of shares used in computing earnings per shareBasic 6,61,59,038 6,61,51,036 6,61,52,131Diluted 6,64,65,149 6,69,81,506 6,63,58,311
This is the Profit and Loss Accountreferred to in our report of even date
for Bharat S Raut & Co.Chartered Accountants
Balaji Swaminathan N. R. Narayana Murthy Nandan M. Nilekani Deepak M. Satwalekar Marti G. Subrahmanyam Jitendra Vir SinghPartner Chairman and Managing Director, President Director Director Director
Chief Executive Officer and Chief Operating Officer
Omkar Goswami Larry Pressler Rama Bijapurkar S. Gopalakrishnan K. DineshDirector Director Director Deputy Managing Director Director
S. D. Shibulal T. V. Mohandas Pai Phaneesh Murthy Srinath Batni V. BalakrishnanBangalore, Director Director and Director Director Company Secretary andJuly 10, 2001 Chief Financial Officer Vice President – Finance
Q1_2001_PAPF_Final.p65 28/07/2001, 2:47 PM6
7
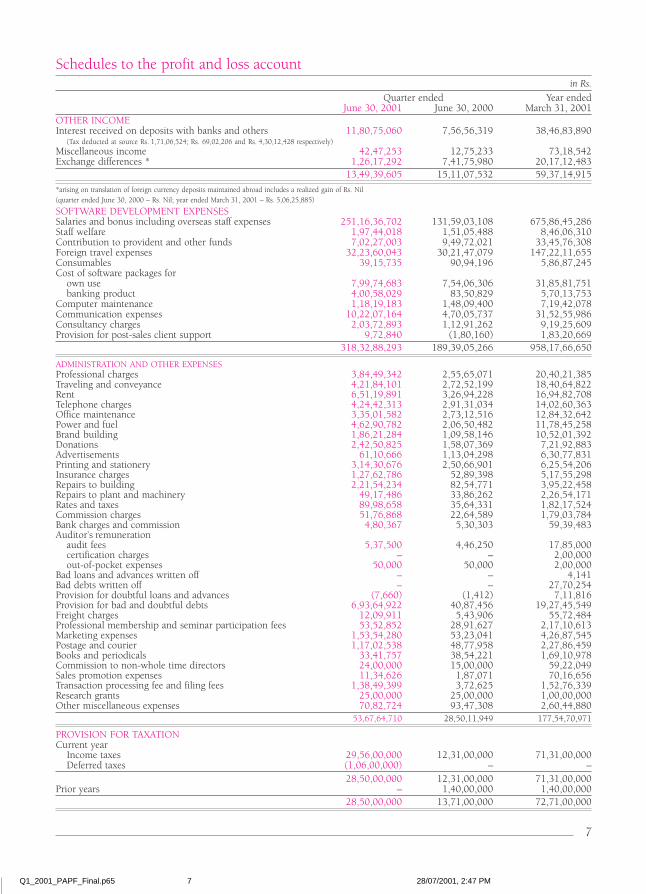
Schedules to the profit and loss accountin Rs.
Quarter ended Year endedJune 30, 2001 June 30, 2000 March 31, 2001
OTHER INCOMEInterest received on deposits with banks and others 11,80,75,060 7,56,56,319 38,46,83,890
(Tax deducted at source Rs. 1,71,06,524; Rs. 69,02,206 and Rs. 4,30,12,428 respectively)Miscellaneous income 42,47,253 12,75,233 73,18,542Exchange differences * 1,26,17,292 7,41,75,980 20,17,12,483 13,49,39,605 15,11,07,532 59,37,14,915
*arising on translation of foreign currency deposits maintained abroad includes a realized gain of Rs. Nil(quarter ended June 30, 2000 – Rs. Nil; year ended March 31, 2001 – Rs. 5,06,25,885)
SOFTWARE DEVELOPMENT EXPENSESSalaries and bonus including overseas staff expenses 251,16,36,702 131,59,03,108 675,86,45,286Staff welfare 1,97,44,018 1,51,05,488 8,46,06,310Contribution to provident and other funds 7,02,27,003 9,49,72,021 33,45,76,308Foreign travel expenses 32,23,60,043 30,21,47,079 147,22,11,655Consumables 39,15,735 90,94,196 5,86,87,245Cost of software packages for
own use 7,99,74,683 7,54,06,306 31,85,81,751banking product 4,00,58,029 83,50,829 5,70,13,753
Computer maintenance 1,18,19,183 1,48,09,400 7,19,42,078Communication expenses 10,22,07,164 4,70,05,737 31,52,55,986Consultancy charges 2,03,72,893 1,12,91,262 9,19,25,609Provision for post-sales client support 9,72,840 (1,80,160) 1,83,20,669
318,32,88,293 189,39,05,266 958,17,66,650
ADMINISTRATION AND OTHER EXPENSESProfessional charges 3,84,49,342 2,55,65,071 20,40,21,385Traveling and conveyance 4,21,84,101 2,72,52,199 18,40,64,822Rent 6,51,19,891 3,26,94,228 16,94,82,708Telephone charges 4,24,42,313 2,91,31,034 14,02,60,363Office maintenance 3,35,01,582 2,73,12,516 12,84,32,642Power and fuel 4,62,90,782 2,06,50,482 11,78,45,258Brand building 1,86,21,284 1,09,58,146 10,52,01,392Donations 2,42,50,825 1,58,07,369 7,21,92,883Advertisements 61,10,666 1,13,04,298 6,30,77,831Printing and stationery 3,14,30,676 2,50,66,901 6,25,54,206Insurance charges 1,27,62,786 52,89,398 5,17,55,298Repairs to building 2,21,54,234 82,54,771 3,95,22,458Repairs to plant and machinery 49,17,486 33,86,262 2,26,54,171Rates and taxes 89,98,658 35,64,331 1,82,17,524Commission charges 51,76,868 22,64,589 1,79,03,784Bank charges and commission 4,80,367 5,30,303 59,39,483Auditor’s remuneration
audit fees 5,37,500 4,46,250 17,85,000certification charges – – 2,00,000out-of-pocket expenses 50,000 50,000 2,00,000
Bad loans and advances written off – – 4,141Bad debts written off – – 27,70,254Provision for doubtful loans and advances (7,660) (1,412) 7,11,816Provision for bad and doubtful debts 6,93,64,922 40,87,456 19,27,45,549Freight charges 12,09,911 5,43,906 55,72,484Professional membership and seminar participation fees 53,52,852 28,91,627 2,17,10,613Marketing expenses 1,53,54,280 53,23,041 4,26,87,545Postage and courier 1,17,02,538 48,77,958 2,27,86,459Books and periodicals 33,41,757 38,54,221 1,69,10,978Commission to non-whole time directors 24,00,000 15,00,000 59,22,049Sales promotion expenses 11,34,626 1,87,071 70,16,656Transaction processing fee and filing fees 1,38,49,399 3,72,625 1,52,76,339Research grants 25,00,000 25,00,000 1,00,00,000Other miscellaneous expenses 70,82,724 93,47,308 2,60,44,880
53,67,64,710 28,50,11,949 177,54,70,971
PROVISION FOR TAXATIONCurrent year
Income taxes 29,56,00,000 12,31,00,000 71,31,00,000Deferred taxes (1,06,00,000) – –
28,50,00,000 12,31,00,000 71,31,00,000Prior years – 1,40,00,000 1,40,00,000
28,50,00,000 13,71,00,000 72,71,00,000
Q1_2001_PAPF_Final.p65 28/07/2001, 2:47 PM7
8
1. Significant accounting policies and notes on accounts
Company overview
Infosys Technologies Limited (“Infosys” or “the company”) is a publicly held company providing information technology(“IT”) solutions principally to Fortune 500 and other established corporations. Infosys’ range of services include IT consultingand architecture, application development, e-commerce and Internet consulting, and software maintenance. In addition, thecompany develops and markets certain software products.
Infosys has 16 state-of-the-art offshore software development facilities located throughout India and 7 off-site softwaredevelopment centers and a consulting office overseas. The offshore software development facilities enable the Company toprovide high quality, cost-effective services to clients in a resource-constrained environment. The company has its headquartersin Bangalore, India, and offices in the Americas, Europe and Asia that provide marketing and administrative support.
1.1 Significant accounting policies1.1.1 Basis of preparation of financial statementsThe financial statements are prepared under the historical cost convention, in accordance with Indian Generally AcceptedAccounting Principles (“GAAP”) on the accrual basis. GAAP comprises mandatory accounting standards issued by theInstitute of Chartered Accountants of India (“ICAI”) and the provisions of the Companies Act, 1956. These accountingpolicies have been consistently applied, except for certain recently issued accounting standards made mandatory bythe ICAI effective the current fiscal year and adopted by the company, as described below.The ICAI has issued accounting standards on segment reporting, related party disclosures, earnings per share andaccounting for taxes on income that became mandatory effective accounting periods commencing on or after April 1,2001. The company adopted the accounting standards on segment reporting, related party disclosures and earningsper share from the year ended March 31, 2001. The standards on accounting for leases and income taxes have beenadopted in the preparation of these financial statements.
The accounting standard on consolidated financial statements becomes effective from April 1, 2001 should a companyconsolidate its financial statements. Although Yantra Corporation, USA, is a subsidiary of Infosys as per the CompaniesAct, 1956, the financial statements have not been consolidated since the company does not have control as envisagedby the accounting standard on consolidated financial statements issued by the ICAI. The company does not have anyinvestments in associates and accordingly the related accounting standard, mandatory effective April 1, 2002, doesnot affect these financials statements.
The preparation of the financial statements in conformity with GAAP requires that the management of the company(“Management”) make estimates and assumptions that affect the reported amounts of revenue and expenses of theperiod, reported balances of assets and liabilities and disclosures relating to contingent assets and liabilities as of thedate of the financial statements. Examples of such estimates include expected development costs to complete softwarecontracts, provision for doubtful debts, future obligations under employee retirement benefit plans and the useful livesof fixed assets. Actual results could differ from those estimates.
1.1.2 Revenue recognitionRevenue from software development on fixed-price contracts is recognized according to the milestones achieved asspecified in the contracts on the proportionate-completion method based on the work completed. On time-and-materials contracts, revenue is recognized based on software developed and invoiced as per the terms of specificcontracts. Annual Technical Services revenue is recognized proportionately over the period in which services arerendered. Revenue from the sale of user licenses for software applications is recognized on transfer of the title in theuser license. Interest is recognized using the time-proportion method, based on rates implicit in the transaction.Dividend income is recognized when the company’s right to receive dividend is established. Revenue from the sale ofspecial import licenses is recognized when the licenses are transferred.
1.1.3 ExpenditureThe cost of software user licenses purchased for software development and the rendering of IT services is charged torevenue in the year the software is acquired. Project costs in the nature of salaries, travel and other expenses incurredon fixed price contracts, where milestones are yet to be reached are classified as “Costs in excess of billings” in thebalance sheet. Charges relating to non-cancelable long-term operating leases are computed on the basis of the leaserentals payable as per the relevant lease agreements. Provisions are made for all known losses and liabilities, futureunforeseeable factors that may affect the profit on fixed-price software development contracts and also towards likelyexpenses for providing post-sales client support. The leave encashment liability of the company is provided on thebasis of an actuarial valuation.
Q1_2001_PAPF_Final.p65 28/07/2001, 2:47 PM8
9
1.1.4 Fixed assets and capital work-in-progressFixed assets are stated at cost, after reducing accumulated depreciation until the date of the balance sheet. Direct costsare capitalized until the assets are ready for use and include financing costs relating to any borrowing attributable toacquisition. Capital work-in-progress includes the cost of fixed assets that are not yet ready for their intended use,advances paid to acquire fixed assets and the cost of assets not put to use before the balance sheet date.
1.1.5 DepreciationDepreciation on fixed assets is determined using the straight-line method based on useful lives of assets as estimated bythe company. Depreciation for assets purchased/sold during the year is proportionately charged. Individual assetsacquired for less than Rs. 5,000/- are entirely depreciated in the year of acquisition. Management estimates the usefullives for the various fixed assets as follows:
Buildings 15 years Furniture and fixtures 5 yearsPlant and machinery 5 years Vehicles 5 yearsComputer equipment 2-5 years
1.1.6 Retirement benefits to employees
1.1.6a GratuityIn accordance with the Payment of Gratuity Act, 1972, Infosys provides for gratuity, a defined benefit retirement plan(the “Gratuity Plan”) covering eligible employees. The Gratuity Plan provides a lump sum payment to vested employeesat retirement, death, incapacitation or termination of employment, of an amount based on the respective employee’ssalary and the tenure of employment.
Liabilities with regard to the Gratuity Plan are determined by actuarial valuation, based upon which, the companycontributes to the Infosys Technologies Limited Employees’ Gratuity Fund Trust (the “Trust”). Trustees administercontributions made to the Trust and invest in specific designated securities as mandated by law, which generallycomprise central and state government bonds and debt instruments of government-owned corporations.
1.1.6b SuperannuationApart from being covered under the Gratuity Plan described above, certain employees of Infosys are also participantsof a defined contribution plan. The company makes monthly contributions under the superannuation plan (the “Plan”)to the Infosys Technologies Limited Employees Superannuation Fund Trust based on a specified percentage of eachcovered employee’s salary. The company has no further obligations to the Plan beyond its monthly contributions.
1.1.6c Provident fundEligible employees also receive benefits from a provident fund, which is a defined contribution plan. Both the employeeand the company make monthly contributions to this provident fund plan equal to a specified percentage of thecovered employee’s salary.
Infosys contributes a part of the contributions to the Infosys Technologies Limited Employees Provident Fund Trust.The remainders of the contributions are made to the Government administered provident fund. The company has nofurther obligations under the provident fund plan beyond its monthly contributions.
1.1.7 Research and developmentRevenue expenditure incurred on research and development is charged off as incurred. Capital expenditure incurredon research and development is depreciated over the estimated useful lives of the related assets.
1.1.8 Foreign currency transactionsRevenue from overseas clients and collections deposited in foreign currency bank accounts are recorded at the exchangerate as of the date of the respective transactions. Expenditure in foreign currency is accounted at the exchange rateprevalent when such expenditure is incurred. Disbursements made out of foreign currency bank accounts are reportedat a rate that approximates the actual monthly rate. Exchange differences are recorded when the amount actuallyreceived on sales or actually paid when expenditure is incurred is converted into Indian Rupees. The exchange differencesarising on foreign currency transactions are recognized as income or expense in the period in which they arise.
Fixed assets purchased at overseas offices are recorded at cost, based on the exchange rate as of the date of purchase.The charge for depreciation is determined as per the company’s accounting policy.
Current assets and current liabilities denominated in foreign currency are translated at the exchange rate prevalent atthe date of the balance sheet. The resulting difference is also recorded in the profit and loss account. In the case offorward contracts, the difference between the forward rate and the exchange rate on the date of the transaction isrecognized as income or expense over the life of the contract.
Q1_2001_PAPF_Final.p65 28/07/2001, 2:47 PM9
10
1.1.9 Income taxIncome taxes are computed using the tax effect accounting method, where taxes are accrued in the same period therelated revenue and expenses arise. A provision is made for income tax annually based on the tax liability computedafter considering tax allowances and exemptions. Provisions are recorded as considered appropriate for matters underappeal due to disallowances or for other reasons.
The differences that result between the profit offered for income taxes and the profit as per the financial statements areidentified and thereafter a deferred tax asset or deferred tax liability is recorded for timing differences, namely thedifferences that originate in one accounting period and reverse in another, based on the tax effect of the aggregateamount being considered. The tax effect is calculated on the accumulated timing differences at the end of an accountingperiod based on prevailing enacted regulations. Deferred tax assets are recognized only if there is reasonable certaintythat they will be realized and are reviewed for the appropriateness of their respective carrying values at each balancesheet date.
1.1.10 Earnings per shareIn determining earnings per share, the company considers the net profit after tax and includes the post-tax effect ofany extra-ordinary items. The number of shares used in computing basic earnings per share is the weighted averagenumber of shares outstanding during the period. The number of shares used in computing diluted earnings per sharecomprises the weighted average shares considered for deriving basic earnings per share, and also the weighted averagenumber of equity shares which could have been issued on the conversion of all dilutive potential equity shares.Dilutive potential equity shares are deemed converted as of the beginning of the period, unless they have been issuedat a later date. The diluted potential equity shares have been adjusted for the proceeds receivable had the shares beenactually issued at fair value (i.e. the average market value of the outstanding shares). The number of shares andpotentially dilutive equity shares are adjusted for stock splits and bonus shares, as appropriate.
1.1.11 InvestmentsTrade investments refer to the investments made with the aim of enhancing the company’s business interests in softwaredevelopment and services. Investments are either classified as current or long-term. Current investments are carried atthe lower of cost and fair value. Cost for overseas investments comprises the Indian Rupee value of the considerationpaid for the investment.
Long-term investments are carried at cost and provisions recorded to recognize any decline, other than temporary, inthe carrying value of such investment.
The investment in the subsidiary (as per the Companies Act, 1956) is accounted on the cost method, whereby, theinvestment is carried at cost and the company recognizes only dividends received from the subsidiary as income in theprofit and loss account. Provisions are recorded to recognize any decline, other than temporary, in the carrying valueof the investment.
1.2 Notes on accountsThe previous period’s/year’s figures have been recast/restated, wherever necessary, to conform to the current period’sclassification.
1.2.1 Deferred income taxesConsequent to the standard on accounting for taxes on income becoming mandatory effective April 1, 2001, thecompany recorded the cumulative net deferred tax credit of Rs. 15,53,00,000 until April 1, 2001, as an addition tothe general reserves. The deferred tax credit of Rs. 1,06,00,000 for the quarter ended June 30, 2001 is included in theprovision for taxation.
1.2.2 Capital commitments and contingent liabilitiesa. The estimated amount of contracts remaining to be executed on capital account, and not provided for
(net of advances) is Rs. 143,18,57,443 as at June 30, 2001. The amount of such contracts as at June 30,2000 was Rs. 118,86,56,390 and as at March 31, 2001 was Rs. 158,25,35,171.
b. The company has outstanding guarantees and counter guarantees of Rs.11,97,30,000 as at June 30, 2001,to various banks, in respect of the guarantees given by the banks in favor of various government authorities.The guarantees outstanding as at June 30, 2000 were Rs. 5,71,30,000 and as at March 31, 2001 wereRs. 6,83,05,000.
c. Claims against the company, not acknowledged as debts, amounted to Rs. 4,52,10,368 as at June 30, 2001.Such claims as at June 30, 2000 were Rs. 73,78,977 and as at March 31, 2001 Rs. 8,75,532.
d. Outstanding forward contracts amounted to US$ 35,000,000 (approximately Rs. 166,13,75,000 at quarterend exchange rates) at June 30, 2001. Such contracts as at June 30, 2000 were Rs. Nil and as at March 31,2000 were US$ 20,000,000 (approximately Rs. 93,12,00,000 at year end exchange rates).
Q1_2001_PAPF_Final.p65 28/07/2001, 2:47 PM10
11
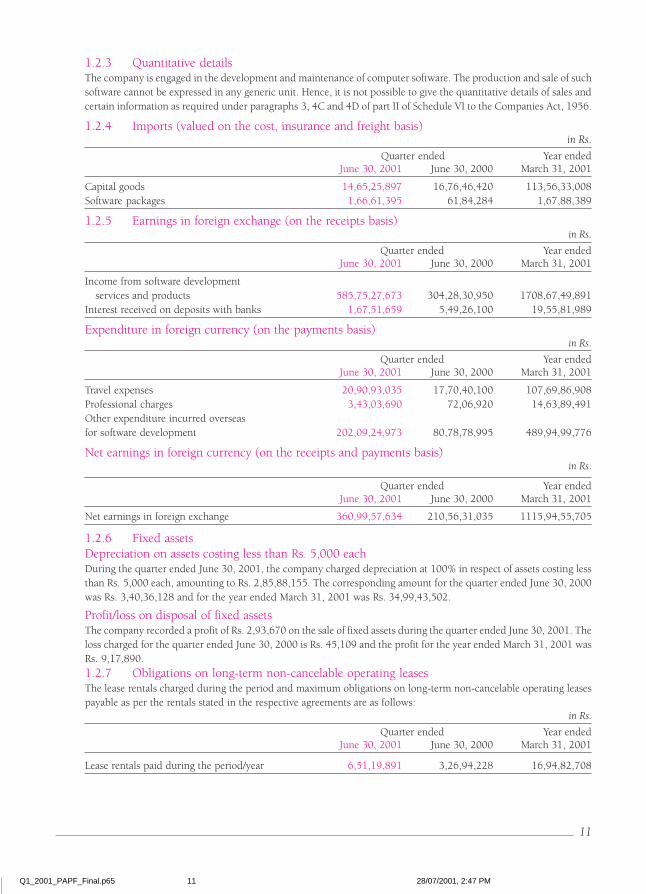
1.2.3 Quantitative detailsThe company is engaged in the development and maintenance of computer software. The production and sale of suchsoftware cannot be expressed in any generic unit. Hence, it is not possible to give the quantitative details of sales andcertain information as required under paragraphs 3, 4C and 4D of part II of Schedule VI to the Companies Act, 1956.
1.2.4 Imports (valued on the cost, insurance and freight basis)in Rs.
Quarter ended Year endedJune 30, 2001 June 30, 2000 March 31, 2001
Capital goods 14,65,25,897 16,76,46,420 113,56,33,008Software packages 1,66,61,395 61,84,284 1,67,88,389
1.2.5 Earnings in foreign exchange (on the receipts basis)in Rs.
Quarter ended Year endedJune 30, 2001 June 30, 2000 March 31, 2001
Income from software developmentservices and products 585,75,27,673 304,28,30,950 1708,67,49,891
Interest received on deposits with banks 1,67,51,659 5,49,26,100 19,55,81,989
Expenditure in foreign currency (on the payments basis)in Rs.
Quarter ended Year endedJune 30, 2001 June 30, 2000 March 31, 2001
Travel expenses 20,90,93,035 17,70,40,100 107,69,86,908Professional charges 3,43,03,690 72,06,920 14,63,89,491Other expenditure incurred overseasfor software development 202,09,24,973 80,78,78,995 489,94,99,776
Net earnings in foreign currency (on the receipts and payments basis)in Rs.
Quarter ended Year endedJune 30, 2001 June 30, 2000 March 31, 2001
Net earnings in foreign exchange 360,99,57,634 210,56,31,035 1115,94,55,705
1.2.6 Fixed assetsDepreciation on assets costing less than Rs. 5,000 eachDuring the quarter ended June 30, 2001, the company charged depreciation at 100% in respect of assets costing lessthan Rs. 5,000 each, amounting to Rs. 2,85,88,155. The corresponding amount for the quarter ended June 30, 2000was Rs. 3,40,36,128 and for the year ended March 31, 2001 was Rs. 34,99,43,502.
Profit/loss on disposal of fixed assetsThe company recorded a profit of Rs. 2,93,670 on the sale of fixed assets during the quarter ended June 30, 2001. Theloss charged for the quarter ended June 30, 2000 is Rs. 45,109 and the profit for the year ended March 31, 2001 wasRs. 9,17,890.1.2.7 Obligations on long-term non-cancelable operating leasesThe lease rentals charged during the period and maximum obligations on long-term non-cancelable operating leasespayable as per the rentals stated in the respective agreements are as follows:
in Rs.
Quarter ended Year endedJune 30, 2001 June 30, 2000 March 31, 2001
Lease rentals paid during the period/year 6,51,19,891 3,26,94,228 16,94,82,708
Q1_2001_PAPF_Final.p65 28/07/2001, 2:47 PM11
12
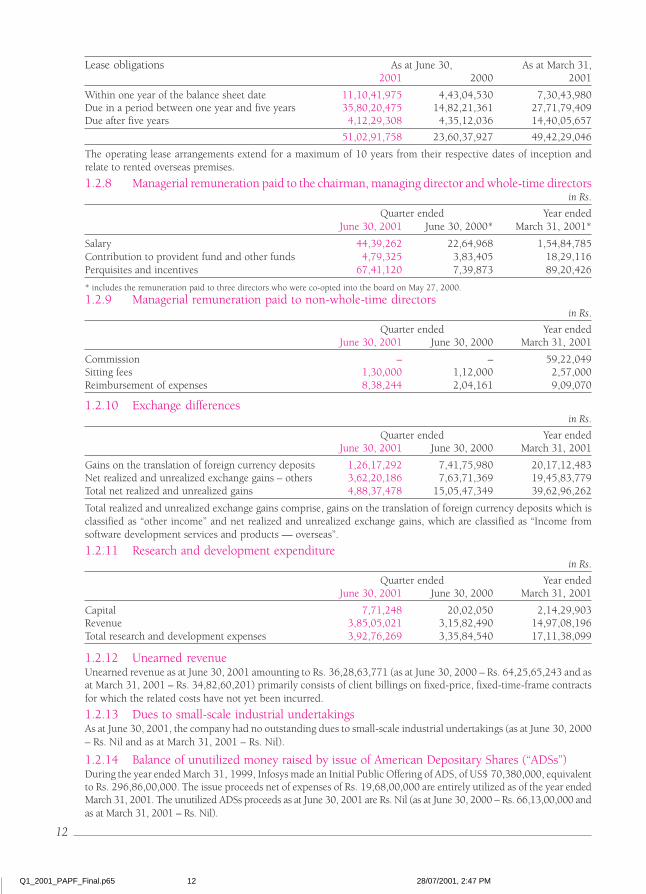
Lease obligations As at June 30, As at March 31,2001 2000 2001
Within one year of the balance sheet date 11,10,41,975 4,43,04,530 7,30,43,980Due in a period between one year and five years 35,80,20,475 14,82,21,361 27,71,79,409Due after five years 4,12,29,308 4,35,12,036 14,40,05,657
51,02,91,758 23,60,37,927 49,42,29,046
The operating lease arrangements extend for a maximum of 10 years from their respective dates of inception andrelate to rented overseas premises.
1.2.8 Managerial remuneration paid to the chairman, managing director and whole-time directorsin Rs.
Quarter ended Year endedJune 30, 2001 June 30, 2000* March 31, 2001*
Salary 44,39,262 22,64,968 1,54,84,785Contribution to provident fund and other funds 4,79,325 3,83,405 18,29,116Perquisites and incentives 67,41,120 7,39,873 89,20,426
* includes the remuneration paid to three directors who were co-opted into the board on May 27, 2000.
1.2.9 Managerial remuneration paid to non-whole-time directorsin Rs.
Quarter ended Year endedJune 30, 2001 June 30, 2000 March 31, 2001
Commission – – 59,22,049Sitting fees 1,30,000 1,12,000 2,57,000Reimbursement of expenses 8,38,244 2,04,161 9,09,070
1.2.10 Exchange differencesin Rs.
Quarter ended Year endedJune 30, 2001 June 30, 2000 March 31, 2001
Gains on the translation of foreign currency deposits 1,26,17,292 7,41,75,980 20,17,12,483Net realized and unrealized exchange gains – others 3,62,20,186 7,63,71,369 19,45,83,779Total net realized and unrealized gains 4,88,37,478 15,05,47,349 39,62,96,262
Total realized and unrealized exchange gains comprise, gains on the translation of foreign currency deposits which isclassified as “other income” and net realized and unrealized exchange gains, which are classified as “Income fromsoftware development services and products — overseas”.
1.2.11 Research and development expenditurein Rs.
Quarter ended Year endedJune 30, 2001 June 30, 2000 March 31, 2001
Capital 7,71,248 20,02,050 2,14,29,903Revenue 3,85,05,021 3,15,82,490 14,97,08,196Total research and development expenses 3,92,76,269 3,35,84,540 17,11,38,099
1.2.12 Unearned revenueUnearned revenue as at June 30, 2001 amounting to Rs. 36,28,63,771 (as at June 30, 2000 – Rs. 64,25,65,243 and asat March 31, 2001 – Rs. 34,82,60,201) primarily consists of client billings on fixed-price, fixed-time-frame contractsfor which the related costs have not yet been incurred.
1.2.13 Dues to small-scale industrial undertakingsAs at June 30, 2001, the company had no outstanding dues to small-scale industrial undertakings (as at June 30, 2000– Rs. Nil and as at March 31, 2001 – Rs. Nil).
1.2.14 Balance of unutilized money raised by issue of American Depositary Shares (“ADSs”)During the year ended March 31, 1999, Infosys made an Initial Public Offering of ADS, of US$ 70,380,000, equivalentto Rs. 296,86,00,000. The issue proceeds net of expenses of Rs. 19,68,00,000 are entirely utilized as of the year endedMarch 31, 2001. The unutilized ADSs proceeds as at June 30, 2001 are Rs. Nil (as at June 30, 2000 – Rs. 66,13,00,000 andas at March 31, 2001 – Rs. Nil).
Q1_2001_PAPF_Final.p65 28/07/2001, 2:47 PM12
13
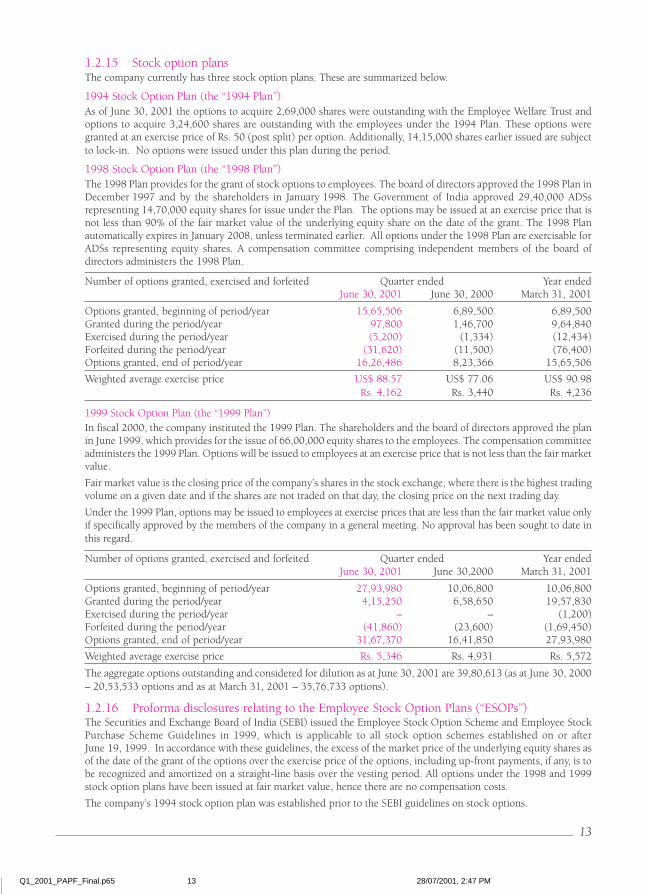
1.2.15 Stock option plansThe company currently has three stock option plans. These are summarized below.
1994 Stock Option Plan (the “1994 Plan”)As of June 30, 2001 the options to acquire 2,69,000 shares were outstanding with the Employee Welfare Trust andoptions to acquire 3,24,600 shares are outstanding with the employees under the 1994 Plan. These options weregranted at an exercise price of Rs. 50 (post split) per option. Additionally, 14,15,000 shares earlier issued are subjectto lock-in. No options were issued under this plan during the period.
1998 Stock Option Plan (the “1998 Plan”)The 1998 Plan provides for the grant of stock options to employees. The board of directors approved the 1998 Plan inDecember 1997 and by the shareholders in January 1998. The Government of India approved 29,40,000 ADSsrepresenting 14,70,000 equity shares for issue under the Plan. The options may be issued at an exercise price that isnot less than 90% of the fair market value of the underlying equity share on the date of the grant. The 1998 Planautomatically expires in January 2008, unless terminated earlier. All options under the 1998 Plan are exercisable forADSs representing equity shares. A compensation committee comprising independent members of the board ofdirectors administers the 1998 Plan.
Number of options granted, exercised and forfeited Quarter ended Year endedJune 30, 2001 June 30, 2000 March 31, 2001
Options granted, beginning of period/year 15,65,506 6,89,500 6,89,500Granted during the period/year 97,800 1,46,700 9,64,840Exercised during the period/year (5,200) (1,334) (12,434)Forfeited during the period/year (31,620) (11,500) (76,400)Options granted, end of period/year 16,26,486 8,23,366 15,65,506
Weighted average exercise price US$ 88.57 US$ 77.06 US$ 90.98Rs. 4,162 Rs. 3,440 Rs. 4,236
1999 Stock Option Plan (the “1999 Plan”)In fiscal 2000, the company instituted the 1999 Plan. The shareholders and the board of directors approved the planin June 1999, which provides for the issue of 66,00,000 equity shares to the employees. The compensation committeeadministers the 1999 Plan. Options will be issued to employees at an exercise price that is not less than the fair marketvalue.
Fair market value is the closing price of the company’s shares in the stock exchange, where there is the highest tradingvolume on a given date and if the shares are not traded on that day, the closing price on the next trading day.
Under the 1999 Plan, options may be issued to employees at exercise prices that are less than the fair market value onlyif specifically approved by the members of the company in a general meeting. No approval has been sought to date inthis regard.
Number of options granted, exercised and forfeited Quarter ended Year endedJune 30, 2001 June 30,2000 March 31, 2001
Options granted, beginning of period/year 27,93,980 10,06,800 10,06,800Granted during the period/year 4,15,250 6,58,650 19,57,830Exercised during the period/year – – (1,200)Forfeited during the period/year (41,860) (23,600) (1,69,450)Options granted, end of period/year 31,67,370 16,41,850 27,93,980
Weighted average exercise price Rs. 5,346 Rs. 4,931 Rs. 5,572
The aggregate options outstanding and considered for dilution as at June 30, 2001 are 39,80,613 (as at June 30, 2000– 20,53,533 options and as at March 31, 2001 – 35,76,733 options).
1.2.16 Proforma disclosures relating to the Employee Stock Option Plans (“ESOPs”)The Securities and Exchange Board of India (SEBI) issued the Employee Stock Option Scheme and Employee StockPurchase Scheme Guidelines in 1999, which is applicable to all stock option schemes established on or afterJune 19, 1999. In accordance with these guidelines, the excess of the market price of the underlying equity shares asof the date of the grant of the options over the exercise price of the options, including up-front payments, if any, is tobe recognized and amortized on a straight-line basis over the vesting period. All options under the 1998 and 1999stock option plans have been issued at fair market value, hence there are no compensation costs.
The company’s 1994 stock option plan was established prior to the SEBI guidelines on stock options.
Q1_2001_PAPF_Final.p65 28/07/2001, 2:47 PM13
14
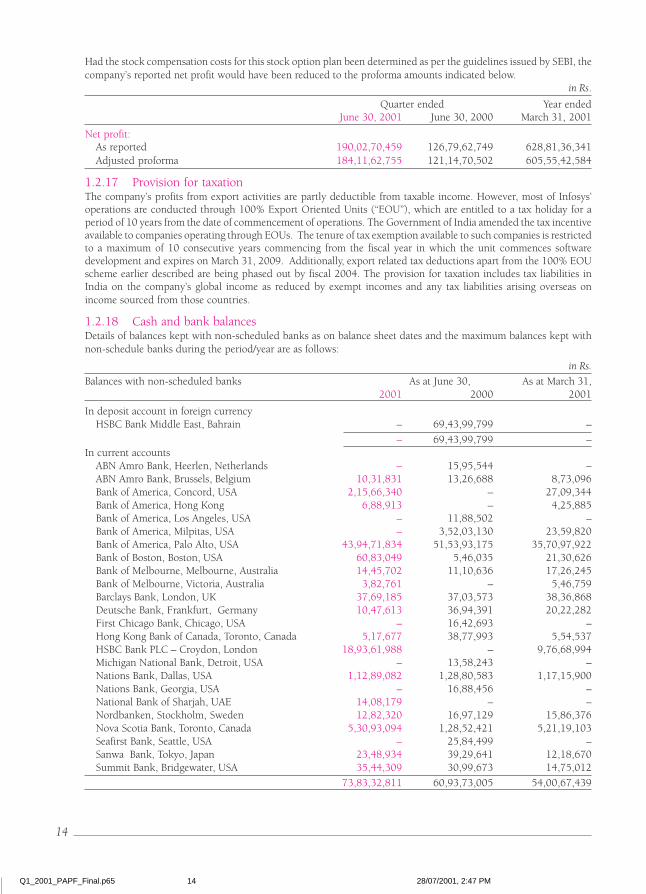
Had the stock compensation costs for this stock option plan been determined as per the guidelines issued by SEBI, thecompany’s reported net profit would have been reduced to the proforma amounts indicated below.
in Rs.
Quarter ended Year endedJune 30, 2001 June 30, 2000 March 31, 2001
Net profit:As reported 190,02,70,459 126,79,62,749 628,81,36,341Adjusted proforma 184,11,62,755 121,14,70,502 605,55,42,584
1.2.17 Provision for taxationThe company’s profits from export activities are partly deductible from taxable income. However, most of Infosys’operations are conducted through 100% Export Oriented Units (“EOU”), which are entitled to a tax holiday for aperiod of 10 years from the date of commencement of operations. The Government of India amended the tax incentiveavailable to companies operating through EOUs. The tenure of tax exemption available to such companies is restrictedto a maximum of 10 consecutive years commencing from the fiscal year in which the unit commences softwaredevelopment and expires on March 31, 2009. Additionally, export related tax deductions apart from the 100% EOUscheme earlier described are being phased out by fiscal 2004. The provision for taxation includes tax liabilities inIndia on the company’s global income as reduced by exempt incomes and any tax liabilities arising overseas onincome sourced from those countries.
1.2.18 Cash and bank balancesDetails of balances kept with non-scheduled banks as on balance sheet dates and the maximum balances kept withnon-schedule banks during the period/year are as follows:
in Rs.
Balances with non-scheduled banks As at June 30, As at March 31,2001 2000 2001
In deposit account in foreign currencyHSBC Bank Middle East, Bahrain – 69,43,99,799 –
– 69,43,99,799 –In current accounts
ABN Amro Bank, Heerlen, Netherlands – 15,95,544 –ABN Amro Bank, Brussels, Belgium 10,31,831 13,26,688 8,73,096Bank of America, Concord, USA 2,15,66,340 – 27,09,344Bank of America, Hong Kong 6,88,913 – 4,25,885Bank of America, Los Angeles, USA – 11,88,502 –Bank of America, Milpitas, USA – 3,52,03,130 23,59,820Bank of America, Palo Alto, USA 43,94,71,834 51,53,93,175 35,70,97,922Bank of Boston, Boston, USA 60,83,049 5,46,035 21,30,626Bank of Melbourne, Melbourne, Australia 14,45,702 11,10,636 17,26,245Bank of Melbourne, Victoria, Australia 3,82,761 – 5,46,759Barclays Bank, London, UK 37,69,185 37,03,573 38,36,868Deutsche Bank, Frankfurt, Germany 10,47,613 36,94,391 20,22,282First Chicago Bank, Chicago, USA – 16,42,693 –Hong Kong Bank of Canada, Toronto, Canada 5,17,677 38,77,993 5,54,537HSBC Bank PLC – Croydon, London 18,93,61,988 – 9,76,68,994Michigan National Bank, Detroit, USA – 13,58,243 –Nations Bank, Dallas, USA 1,12,89,082 1,28,80,583 1,17,15,900Nations Bank, Georgia, USA – 16,88,456 –National Bank of Sharjah, UAE 14,08,179 – –Nordbanken, Stockholm, Sweden 12,82,320 16,97,129 15,86,376Nova Scotia Bank, Toronto, Canada 5,30,93,094 1,28,52,421 5,21,19,103Seafirst Bank, Seattle, USA – 25,84,499 –Sanwa Bank, Tokyo, Japan 23,48,934 39,29,641 12,18,670Summit Bank, Bridgewater, USA 35,44,309 30,99,673 14,75,012
73,83,32,811 60,93,73,005 54,00,67,439
Q1_2001_PAPF_Final.p65 28/07/2001, 2:47 PM14
15
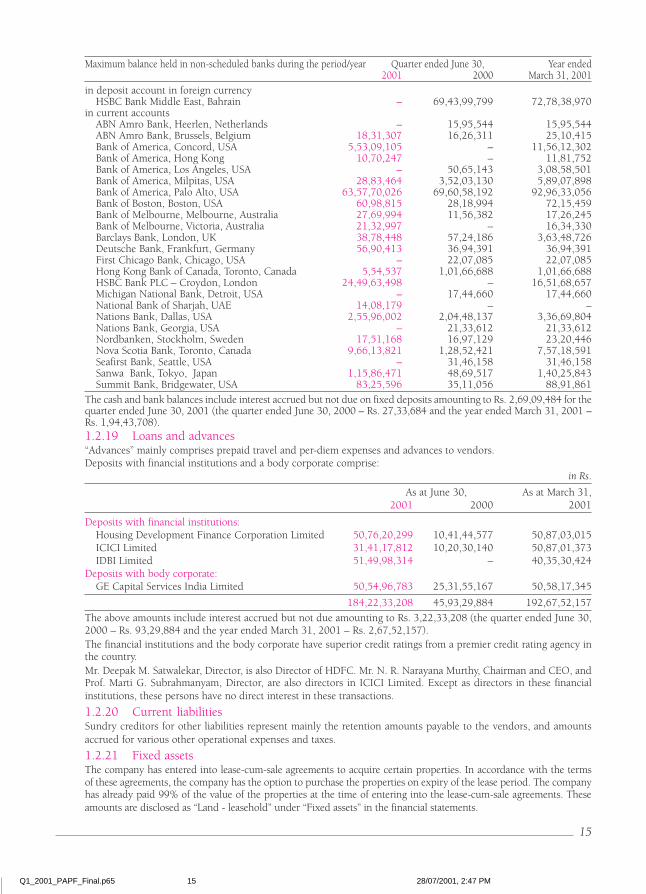
Maximum balance held in non-scheduled banks during the period/year Quarter ended June 30, Year ended2001 2000 March 31, 2001
in deposit account in foreign currencyHSBC Bank Middle East, Bahrain – 69,43,99,799 72,78,38,970
in current accountsABN Amro Bank, Heerlen, Netherlands – 15,95,544 15,95,544ABN Amro Bank, Brussels, Belgium 18,31,307 16,26,311 25,10,415Bank of America, Concord, USA 5,53,09,105 – 11,56,12,302Bank of America, Hong Kong 10,70,247 – 11,81,752Bank of America, Los Angeles, USA – 50,65,143 3,08,58,501Bank of America, Milpitas, USA 28,83,464 3,52,03,130 5,89,07,898Bank of America, Palo Alto, USA 63,57,70,026 69,60,58,192 92,96,33,056Bank of Boston, Boston, USA 60,98,815 28,18,994 72,15,459Bank of Melbourne, Melbourne, Australia 27,69,994 11,56,382 17,26,245Bank of Melbourne, Victoria, Australia 21,32,997 – 16,34,330Barclays Bank, London, UK 38,78,448 57,24,186 3,63,48,726Deutsche Bank, Frankfurt, Germany 56,90,413 36,94,391 36,94,391First Chicago Bank, Chicago, USA – 22,07,085 22,07,085Hong Kong Bank of Canada, Toronto, Canada 5,54,537 1,01,66,688 1,01,66,688HSBC Bank PLC – Croydon, London 24,49,63,498 – 16,51,68,657Michigan National Bank, Detroit, USA – 17,44,660 17,44,660National Bank of Sharjah, UAE 14,08,179 – –Nations Bank, Dallas, USA 2,55,96,002 2,04,48,137 3,36,69,804Nations Bank, Georgia, USA – 21,33,612 21,33,612Nordbanken, Stockholm, Sweden 17,51,168 16,97,129 23,20,446Nova Scotia Bank, Toronto, Canada 9,66,13,821 1,28,52,421 7,57,18,591Seafirst Bank, Seattle, USA – 31,46,158 31,46,158Sanwa Bank, Tokyo, Japan 1,15,86,471 48,69,517 1,40,25,843Summit Bank, Bridgewater, USA 83,25,596 35,11,056 88,91,861
The cash and bank balances include interest accrued but not due on fixed deposits amounting to Rs. 2,69,09,484 for thequarter ended June 30, 2001 (the quarter ended June 30, 2000 – Rs. 27,33,684 and the year ended March 31, 2001 –Rs. 1,94,43,708).1.2.19 Loans and advances“Advances” mainly comprises prepaid travel and per-diem expenses and advances to vendors.Deposits with financial institutions and a body corporate comprise:
in Rs.
As at June 30, As at March 31,2001 2000 2001
Deposits with financial institutions:Housing Development Finance Corporation Limited 50,76,20,299 10,41,44,577 50,87,03,015ICICI Limited 31,41,17,812 10,20,30,140 50,87,01,373IDBI Limited 51,49,98,314 – 40,35,30,424
Deposits with body corporate:GE Capital Services India Limited 50,54,96,783 25,31,55,167 50,58,17,345
184,22,33,208 45,93,29,884 192,67,52,157
The above amounts include interest accrued but not due amounting to Rs. 3,22,33,208 (the quarter ended June 30,2000 – Rs. 93,29,884 and the year ended March 31, 2001 – Rs. 2,67,52,157).The financial institutions and the body corporate have superior credit ratings from a premier credit rating agency inthe country.Mr. Deepak M. Satwalekar, Director, is also Director of HDFC. Mr. N. R. Narayana Murthy, Chairman and CEO, andProf. Marti G. Subrahmanyam, Director, are also directors in ICICI Limited. Except as directors in these financialinstitutions, these persons have no direct interest in these transactions.
1.2.20 Current liabilitiesSundry creditors for other liabilities represent mainly the retention amounts payable to the vendors, and amountsaccrued for various other operational expenses and taxes.
1.2.21 Fixed assetsThe company has entered into lease-cum-sale agreements to acquire certain properties. In accordance with the termsof these agreements, the company has the option to purchase the properties on expiry of the lease period. The companyhas already paid 99% of the value of the properties at the time of entering into the lease-cum-sale agreements. Theseamounts are disclosed as “Land - leasehold” under “Fixed assets” in the financial statements.
Q1_2001_PAPF_Final.p65 28/07/2001, 2:47 PM15
16
1.2.22 Transfer of intellectual property rightsDuring the year ended March 31, 2001, the company transferred its intellectual property rights in OnScan – a web-focused wireless-enabled notification product, to OnMobile Systems, Inc. (formerly OnScan Inc.) USA, a companyincubated by Infosys as part of its ongoing effort to encourage and promote budding entrepreneurs among its employees.The rights were transferred for Rs. 8,93,40,000 (US$ 2 million), received as equity, preferred voting and preferrednon-voting securities in OnMobile Systems, Inc. The income of Rs. 5,49,44,000 (net of tax) arising on the transfer isdisclosed as an extraordinary item in the statement of profit and loss of that year. The transaction was completed inthe quarter ended June 30, 2000.
The item has not been considered in the statement of cash flows since it is a non-cash transaction except for thepayment of the related income tax.
1.2.23 InvestmentsWorkadia Inc., USADuring the quarter ended June 30, 2001, the company made a strategic investment of Rs. 10,32,68,000 comprising4,40,000 fully paid Series “B” convertible preferred stock, par value of US$ 0.001, at US$ 5.00 each, in Workadia, Inc.,USA (“Workadia”). Workadia will provide companies with comprehensive, customizable business intranets throughbrowser accessed hosted portals and also offer consulting services to help customers select and deploy their intranetapplications, content and services.
Other informationDuring the year ended March 31, 2001, the company made strategic investments aggregating to Rs. 26,63,94,960 inAlpha Thinx Mobile Phone Services AG, Austria (“Alpha Thinx”); Asia Net Media BVI Limited, the British VirginIslands; CiDRA Corporation, USA (“CiDRA”); M-Commerce Ventures Pte. Limited, Singapore; and Purpleyogi Inc.,USA.
Of the above investments, the company invested Rs. 13,40,08,660 in CiDRA during the quarter ended June 30, 2000.There were no provisions as of the quarter ended June 30, 2000.
An amount of Rs. 15,28,98,608 was provided for the investments in Alpha Thinx and EC Cubed, Inc., USA, duringthe year ended March 31, 2001, when the investee companies filed for liquidation.
1.2.24 Segment reportingThe company’s operations predominantly relate to providing IT services, delivered to customers globally operating invarious industry segments. Accordingly, IT service revenues represented along industry classes comprise the primarybasis of segmental information set out in these financial statements. Secondary segmental reporting is performed onthe basis of the geographical location of customers.
The accounting principles consistently used in the preparation of the financial statements are also consistently appliedto record revenue and expenditure in individual segments. These are as set out in the note on significant accountingpolicies.
Industry segments at the company are primarily – financial services comprising customers providing banking, financeand insurance services; manufacturing companies; companies in the telecommunications and the retailing industries;and others such as utilities, transportation and logistics companies.
Revenue and direct expenses in relation to segments is categorized based on items that are individually identifiable tothat segment, while the remainder of the costs are categorized in relation to the associated turnover of the segment.Certain expenses such as depreciation, which form a significant component of total expenses, are not specificallyallocable to specific segments as the underlying services are used interchangeably. The company believes that it is notpractical to provide segment disclosures relating to those costs and expenses, and accordingly these expenses areseparately disclosed as “unallocated” and directly charged against total income.
Fixed assets used in the company’s business or liabilities contracted have not been identified to any of the reportablesegments, as the fixed assets and services are used interchangeably between segments. The company believes that it iscurrently not practicable to provide segment disclosures relating to total assets and liabilities since a meaningfulsegregation of the available data is onerous.
Customer relationships are driven based on the location of the respective client. North America comprises the UnitedStates of America, Canada and Mexico; Europe includes continental Europe (both the east and the west), Ireland andthe United Kingdom; and the Rest of the World comprising all other places except, those mentioned above and India.
Geographical revenues are segregated based on the location of the customer who is invoiced or in relation to which therevenue is otherwise recognized.
Q1_2001_PAPF_Final.p65 28/07/2001, 2:47 PM16

17
Industry segmentsin Rs.
Quarter ended June 30, 2001 Financial services Manufacturing Telecom Retail Others Total
Revenues 225,58,15,275 112,39,92,830 102,27,63,867 68,04,42,241 104,21,73,136 612,51,87,349Identifiable operating expenses 78,15,77,975 44,60,90,828 25,93,53,742 18,15,68,558 36,55,70,440 203,41,61,543Allocated expenses 64,61,93,970 30,20,16,064 27,48,15,915 18,28,34,341 28,00,31,170 168,58,91,460Segmental operating income 82,80,43,330 37,58,85,938 48,85,94,210 31,60,39,342 39,65,71,526 240,51,34,346Unallocable expenses 35,48,03,492
Operating income 205,03,30,854Other income (expense), net 13,49,39,605
Net profit before taxes 218,52,70,459Income taxes 28,50,00,000
Net profit after taxes 190,02,70,459
Quarter ended June 30, 2000 Financial services Manufacturing Telecom Retail Others Total
Revenues 104,52,58,244 70,75,04,730 65,77,30,528 31,99,77,014 82,48,29,633 355,53,00,149Identifiable operating expenses 44,57,33,666 25,67,43,679 18,17,52,649 12,03,85,355 27,81,28,026 128,27,43,375Allocated expenses 26,93,70,795 17,66,76,779 16,42,47,257 7,99,04,072 20,59,74,937 89,61,73,840Segmental operating income 33,01,53,783 27,40,84,272 31,17,30,622 11,96,87,587 34,07,26,670 137,63,82,934Unallocable expenses 17,73,71,717
Operating income 119,90,11,217Other income (expense), net 15,11,07,532
Net profit before taxes 135,01,18,749Income taxes 13,71,00,000
Net profit after taxes 121,30,18,749
Year ended March 31, 2001 Financial services Manufacturing Telecom Retail Others Total
Revenues 640,77,55,042 338,84,20,263 350,11,16,331 172,86,39,345 397,97,27,826 1900,56,58,807Identifiable operating expenses 225,87,90,591 130,66,14,108 88,39,38,378 54,74,24,303 120,92,12,385 620,59,79,765Allocated expenses 177,68,81,844 90,69,15,538 93,89,68,074 46,30,82,749 106,54,09,651 515,12,57,856Segmental operating income 237,20,82,607 117,48,90,617 167,82,09,879 71,81,32,293 170,51,05,790 764,84,21,186Unallocable expenses 128,18,43,760
Operating income 636,65,77,426Other income (expense), net 59,37,14,915
Net profit before taxes 696,02,92,341Income taxes 72,71,00,000
Net profit after taxes 623,31,92,341
Geographic segmentsQuarter ended June 30, 2001 North America Europe India Rest of the World Total
Revenues 442,08,60,840 121,41,46,804 16,21,65,862 32,80,13,843 612,51,87,349Identifiable operating expenses 142,17,68,385 43,03,39,633 4,84,21,938 13,36,31,587 203,41,61,543Allocated expenses 120,12,05,791 32,98,99,589 6,14,83,134 9,33,02,946 168,58,91,460Segmental operating income 179,78,86,664 45,39,07,582 5,22,60,790 10,10,79,310 240,51,34,346Unallocable expenses 35,48,03,492
Operating income 205,03,30,854Other income (expense), net 13,49,39,605
Net profit before taxes 218,52,70,459Income taxes 28,50,00,000
Net profit after taxes 190,02,70,459
Quarter ended June 30, 2000 North America Europe India Rest of the World Total
Revenues 264,83,86,416 60,98,27,474 4,47,21,726 25,23,64,533 355,53,00,149Identifiable operating expenses 94,89,69,281 22,57,03,906 1,69,12,413 9,11,57,775 128,27,43,375Allocated expenses 66,57,79,233 15,33,04,845 1,23,54,855 6,47,34,907 89,61,73,840Segmental operating income 103,36,37,902 23,08,18,723 1,54,54,458 9,64,71,851 137,63,82,934Unallocable expenses 17,73,71,717
Operating income 119,90,11,217Other income (expense), net 15,11,07,532
Net profit before taxes 135,01,18,749Income taxes 13,71,00,000
Net profit after taxes 121,30,18,749
Q1_2001_PAPF_Final.p65 28/07/2001, 2:47 PM17
18
in Rs.
Year ended March 31, 2001 North America Europe India Rest of the World Total
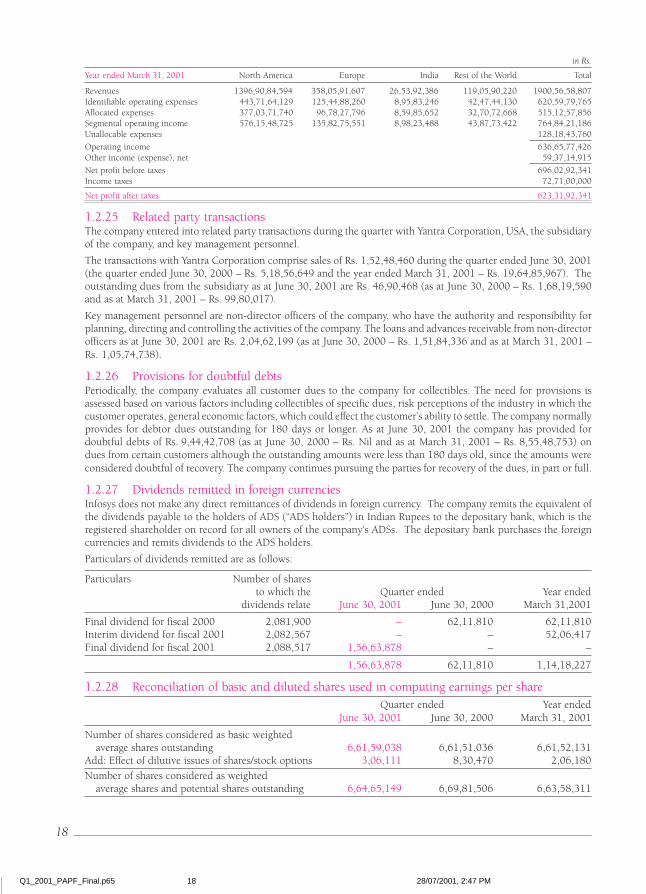
Revenues 1396,90,84,594 358,05,91,607 26,53,92,386 119,05,90,220 1900,56,58,807Identifiable operating expenses 443,71,64,129 125,44,88,260 8,95,83,246 42,47,44,130 620,59,79,765Allocated expenses 377,03,71,740 96,78,27,796 8,59,85,652 32,70,72,668 515,12,57,856Segmental operating income 576,15,48,725 135,82,75,551 8,98,23,488 43,87,73,422 764,84,21,186Unallocable expenses 128,18,43,760
Operating income 636,65,77,426Other income (expense), net 59,37,14,915
Net profit before taxes 696,02,92,341Income taxes 72,71,00,000
Net profit after taxes 623,31,92,341
1.2.25 Related party transactionsThe company entered into related party transactions during the quarter with Yantra Corporation, USA, the subsidiaryof the company, and key management personnel.
The transactions with Yantra Corporation comprise sales of Rs. 1,52,48,460 during the quarter ended June 30, 2001(the quarter ended June 30, 2000 – Rs. 5,18,56,649 and the year ended March 31, 2001 – Rs. 19,64,85,967). Theoutstanding dues from the subsidiary as at June 30, 2001 are Rs. 46,90,468 (as at June 30, 2000 – Rs. 1,68,19,590and as at March 31, 2001 – Rs. 99,80,017).
Key management personnel are non-director officers of the company, who have the authority and responsibility forplanning, directing and controlling the activities of the company. The loans and advances receivable from non-directorofficers as at June 30, 2001 are Rs. 2,04,62,199 (as at June 30, 2000 – Rs. 1,51,84,336 and as at March 31, 2001 –Rs. 1,05,74,738).
1.2.26 Provisions for doubtful debtsPeriodically, the company evaluates all customer dues to the company for collectibles. The need for provisions isassessed based on various factors including collectibles of specific dues, risk perceptions of the industry in which thecustomer operates, general economic factors, which could effect the customer’s ability to settle. The company normallyprovides for debtor dues outstanding for 180 days or longer. As at June 30, 2001 the company has provided fordoubtful debts of Rs. 9,44,42,708 (as at June 30, 2000 – Rs. Nil and as at March 31, 2001 – Rs. 8,55,48,753) ondues from certain customers although the outstanding amounts were less than 180 days old, since the amounts wereconsidered doubtful of recovery. The company continues pursuing the parties for recovery of the dues, in part or full.
1.2.27 Dividends remitted in foreign currenciesInfosys does not make any direct remittances of dividends in foreign currency. The company remits the equivalent ofthe dividends payable to the holders of ADS (“ADS holders”) in Indian Rupees to the depositary bank, which is theregistered shareholder on record for all owners of the company’s ADSs. The depositary bank purchases the foreigncurrencies and remits dividends to the ADS holders.
Particulars of dividends remitted are as follows:
Particulars Number of sharesto which the Quarter ended Year ended
dividends relate June 30, 2001 June 30, 2000 March 31,2001
Final dividend for fiscal 2000 2,081,900 – 62,11,810 62,11,810Interim dividend for fiscal 2001 2,082,567 – – 52,06,417Final dividend for fiscal 2001 2,088,517 1,56,63,878 – –
1,56,63,878 62,11,810 1,14,18,227
1.2.28 Reconciliation of basic and diluted shares used in computing earnings per shareQuarter ended Year ended
June 30, 2001 June 30, 2000 March 31, 2001
Number of shares considered as basic weightedaverage shares outstanding 6,61,59,038 6,61,51,036 6,61,52,131
Add: Effect of dilutive issues of shares/stock options 3,06,111 8,30,470 2,06,180
Number of shares considered as weightedaverage shares and potential shares outstanding 6,64,65,149 6,69,81,506 6,63,58,311
Q1_2001_PAPF_Final.p65 28/07/2001, 2:47 PM18
19
in Rs.
Quarter ended Year endedJune 30, 2001 June 30, 2000 March 31, 2001
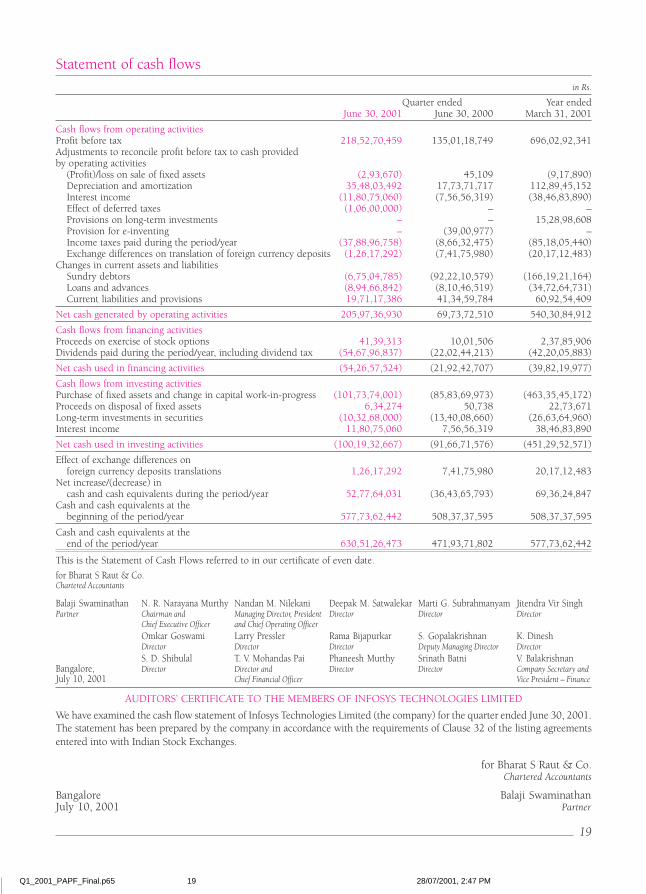
Cash flows from operating activitiesProfit before tax 218,52,70,459 135,01,18,749 696,02,92,341Adjustments to reconcile profit before tax to cash providedby operating activities
(Profit)/loss on sale of fixed assets (2,93,670) 45,109 (9,17,890)Depreciation and amortization 35,48,03,492 17,73,71,717 112,89,45,152Interest income (11,80,75,060) (7,56,56,319) (38,46,83,890)Effect of deferred taxes (1,06,00,000) – –Provisions on long-term investments – – 15,28,98,608Provision for e-inventing – (39,00,977) –Income taxes paid during the period/year (37,88,96,758) (8,66,32,475) (85,18,05,440)Exchange differences on translation of foreign currency deposits (1,26,17,292) (7,41,75,980) (20,17,12,483)
Changes in current assets and liabilitiesSundry debtors (6,75,04,785) (92,22,10,579) (166,19,21,164)Loans and advances (8,94,66,842) (8,10,46,519) (34,72,64,731)Current liabilities and provisions 19,71,17,386 41,34,59,784 60,92,54,409
Net cash generated by operating activities 205,97,36,930 69,73,72,510 540,30,84,912
Cash flows from financing activitiesProceeds on exercise of stock options 41,39,313 10,01,506 2,37,85,906Dividends paid during the period/year, including dividend tax (54,67,96,837) (22,02,44,213) (42,20,05,883)
Net cash used in financing activities (54,26,57,524) (21,92,42,707) (39,82,19,977)
Cash flows from investing activitiesPurchase of fixed assets and change in capital work-in-progress (101,73,74,001) (85,83,69,973) (463,35,45,172)Proceeds on disposal of fixed assets 6,34,274 50,738 22,73,671Long-term investments in securities (10,32,68,000) (13,40,08,660) (26,63,64,960)Interest income 11,80,75,060 7,56,56,319 38,46,83,890
Net cash used in investing activities (100,19,32,667) (91,66,71,576) (451,29,52,571)
Effect of exchange differences onforeign currency deposits translations 1,26,17,292 7,41,75,980 20,17,12,483
Net increase/(decrease) incash and cash equivalents during the period/year 52,77,64,031 (36,43,65,793) 69,36,24,847
Cash and cash equivalents at thebeginning of the period/year 577,73,62,442 508,37,37,595 508,37,37,595
Cash and cash equivalents at theend of the period/year 630,51,26,473 471,93,71,802 577,73,62,442
This is the Statement of Cash Flows referred to in our certificate of even date.
for Bharat S Raut & Co.Chartered Accountants
AUDITORS’ CERTIFICATE TO THE MEMBERS OF INFOSYS TECHNOLOGIES LIMITED
We have examined the cash flow statement of Infosys Technologies Limited (the company) for the quarter ended June 30, 2001.The statement has been prepared by the company in accordance with the requirements of Clause 32 of the listing agreementsentered into with Indian Stock Exchanges.
for Bharat S Raut & Co.Chartered Accountants
Bangalore Balaji SwaminathanJuly 10, 2001 Partner
Statement of cash flows
Balaji Swaminathan N. R. Narayana Murthy Nandan M. Nilekani Deepak M. Satwalekar Marti G. Subrahmanyam Jitendra Vir SinghPartner Chairman and Managing Director, President Director Director Director
Chief Executive Officer and Chief Operating OfficerOmkar Goswami Larry Pressler Rama Bijapurkar S. Gopalakrishnan K. DineshDirector Director Director Deputy Managing Director DirectorS. D. Shibulal T. V. Mohandas Pai Phaneesh Murthy Srinath Batni V. Balakrishnan
Bangalore, Director Director and Director Director Company Secretary andJuly 10, 2001 Chief Financial Officer Vice President – Finance
Q1_2001_PAPF_Final.p65 28/07/2001, 2:47 PM19
20
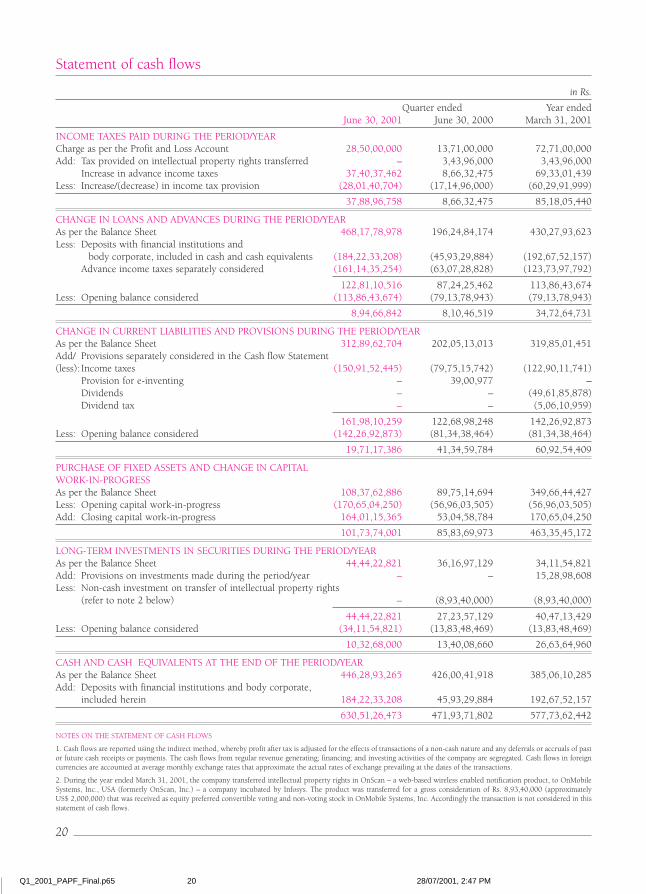
Statement of cash flows
in Rs.
Quarter ended Year endedJune 30, 2001 June 30, 2000 March 31, 2001
INCOME TAXES PAID DURING THE PERIOD/YEARCharge as per the Profit and Loss Account 28,50,00,000 13,71,00,000 72,71,00,000Add: Tax provided on intellectual property rights transferred – 3,43,96,000 3,43,96,000
Increase in advance income taxes 37,40,37,462 8,66,32,475 69,33,01,439Less: Increase/(decrease) in income tax provision (28,01,40,704) (17,14,96,000) (60,29,91,999)
37,88,96,758 8,66,32,475 85,18,05,440
CHANGE IN LOANS AND ADVANCES DURING THE PERIOD/YEARAs per the Balance Sheet 468,17,78,978 196,24,84,174 430,27,93,623Less: Deposits with financial institutions and
body corporate, included in cash and cash equivalents (184,22,33,208) (45,93,29,884) (192,67,52,157)Advance income taxes separately considered (161,14,35,254) (63,07,28,828) (123,73,97,792)
122,81,10,516 87,24,25,462 113,86,43,674Less: Opening balance considered (113,86,43,674) (79,13,78,943) (79,13,78,943)
8,94,66,842 8,10,46,519 34,72,64,731
CHANGE IN CURRENT LIABILITIES AND PROVISIONS DURING THE PERIOD/YEARAs per the Balance Sheet 312,89,62,704 202,05,13,013 319,85,01,451Add/ Provisions separately considered in the Cash flow Statement(less): Income taxes (150,91,52,445) (79,75,15,742) (122,90,11,741)
Provision for e-inventing – 39,00,977 –Dividends – – (49,61,85,878)Dividend tax – – (5,06,10,959)
161,98,10,259 122,68,98,248 142,26,92,873Less: Opening balance considered (142,26,92,873) (81,34,38,464) (81,34,38,464)
19,71,17,386 41,34,59,784 60,92,54,409
PURCHASE OF FIXED ASSETS AND CHANGE IN CAPITALWORK-IN-PROGRESSAs per the Balance Sheet 108,37,62,886 89,75,14,694 349,66,44,427Less: Opening capital work-in-progress (170,65,04,250) (56,96,03,505) (56,96,03,505)Add: Closing capital work-in-progress 164,01,15,365 53,04,58,784 170,65,04,250
101,73,74,001 85,83,69,973 463,35,45,172
LONG-TERM INVESTMENTS IN SECURITIES DURING THE PERIOD/YEARAs per the Balance Sheet 44,44,22,821 36,16,97,129 34,11,54,821Add: Provisions on investments made during the period/year – – 15,28,98,608Less: Non-cash investment on transfer of intellectual property rights
(refer to note 2 below) – (8,93,40,000) (8,93,40,000)
44,44,22,821 27,23,57,129 40,47,13,429Less: Opening balance considered (34,11,54,821) (13,83,48,469) (13,83,48,469)
10,32,68,000 13,40,08,660 26,63,64,960
CASH AND CASH EQUIVALENTS AT THE END OF THE PERIOD/YEARAs per the Balance Sheet 446,28,93,265 426,00,41,918 385,06,10,285Add: Deposits with financial institutions and body corporate,
included herein 184,22,33,208 45,93,29,884 192,67,52,157
630,51,26,473 471,93,71,802 577,73,62,442
NOTES ON THE STATEMENT OF CASH FLOWS
1. Cash flows are reported using the indirect method, whereby profit after tax is adjusted for the effects of transactions of a non-cash nature and any deferrals or accruals of pastor future cash receipts or payments. The cash flows from regular revenue generating; financing; and investing activities of the company are segregated. Cash flows in foreigncurrencies are accounted at average monthly exchange rates that approximate the actual rates of exchange prevailing at the dates of the transactions.
2. During the year ended March 31, 2001, the company transferred intellectual property rights in OnScan – a web-based wireless enabled notification product, to OnMobileSystems, Inc., USA (formerly OnScan, Inc.) – a company incubated by Infosys. The product was transferred for a gross consideration of Rs. 8,93,40,000 (approximatelyUS$ 2,000,000) that was received as equity preferred convertible voting and non-voting stock in OnMobile Systems, Inc. Accordingly the transaction is not considered in thisstatement of cash flows.
Q1_2001_PAPF_Final.p65 28/07/2001, 2:47 PM20
21
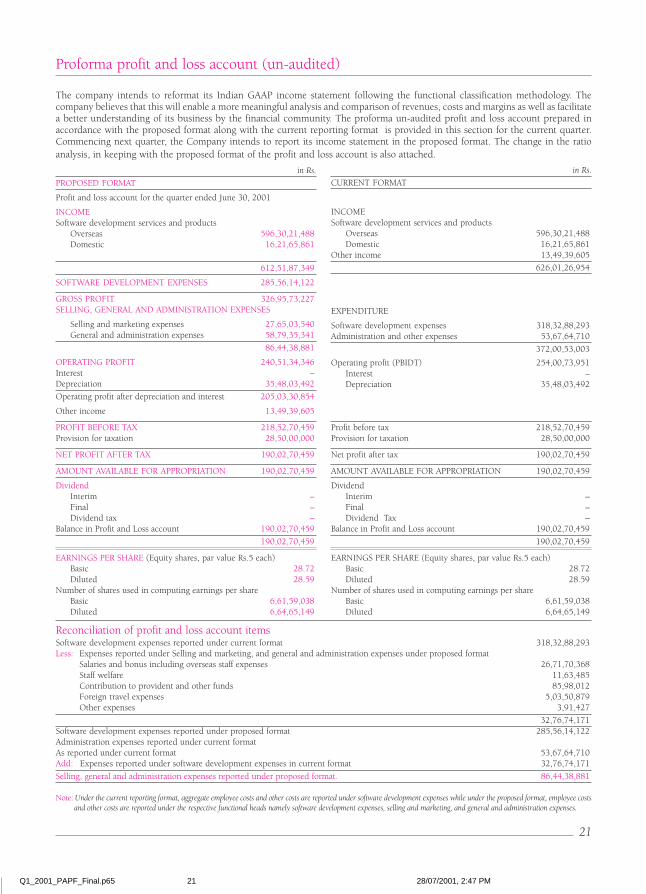
Proforma profit and loss account (un-audited)
The company intends to reformat its Indian GAAP income statement following the functional classification methodology. Thecompany believes that this will enable a more meaningful analysis and comparison of revenues, costs and margins as well as facilitatea better understanding of its business by the financial community. The proforma un-audited profit and loss account prepared inaccordance with the proposed format along with the current reporting format is provided in this section for the current quarter.Commencing next quarter, the Company intends to report its income statement in the proposed format. The change in the ratioanalysis, in keeping with the proposed format of the profit and loss account is also attached.
in Rs.
PROPOSED FORMAT
Profit and loss account for the quarter ended June 30, 2001
INCOMESoftware development services and products
Overseas 596,30,21,488Domestic 16,21,65,861
612,51,87,349
SOFTWARE DEVELOPMENT EXPENSES 285,56,14,122
GROSS PROFIT 326,95,73,227SELLING, GENERAL AND ADMINISTRATION EXPENSES
Selling and marketing expenses 27,65,03,540General and administration expenses 58,79,35,341
86,44,38,881
OPERATING PROFIT 240,51,34,346Interest –Depreciation 35,48,03,492
Operating profit after depreciation and interest 205,03,30,854
Other income 13,49,39,605
PROFIT BEFORE TAX 218,52,70,459Provision for taxation 28,50,00,000
NET PROFIT AFTER TAX 190,02,70,459
AMOUNT AVAILABLE FOR APPROPRIATION 190,02,70,459
DividendInterim –Final –Dividend tax –
Balance in Profit and Loss account 190,02,70,459
190,02,70,459
EARNINGS PER SHARE (Equity shares, par value Rs.5 each)Basic 28.72Diluted 28.59
Number of shares used in computing earnings per shareBasic 6,61,59,038Diluted 6,64,65,149
in Rs.
CURRENT FORMAT
INCOMESoftware development services and products
Overseas 596,30,21,488Domestic 16,21,65,861
Other income 13,49,39,605
626,01,26,954
EXPENDITURE
Software development expenses 318,32,88,293Administration and other expenses 53,67,64,710
372,00,53,003
Operating profit (PBIDT) 254,00,73,951Interest –Depreciation 35,48,03,492
Profit before tax 218,52,70,459Provision for taxation 28,50,00,000
Net profit after tax 190,02,70,459
AMOUNT AVAILABLE FOR APPROPRIATION 190,02,70,459
DividendInterim –Final –Dividend Tax –
Balance in Profit and Loss account 190,02,70,459
190,02,70,459
EARNINGS PER SHARE (Equity shares, par value Rs.5 each)Basic 28.72Diluted 28.59
Number of shares used in computing earnings per shareBasic 6,61,59,038Diluted 6,64,65,149
Reconciliation of profit and loss account itemsSoftware development expenses reported under current format 318,32,88,293Less: Expenses reported under Selling and marketing, and general and administration expenses under proposed format
Salaries and bonus including overseas staff expenses 26,71,70,368Staff welfare 11,63,485Contribution to provident and other funds 85,98,012Foreign travel expenses 5,03,50,879Other expenses 3,91,427
32,76,74,171Software development expenses reported under proposed format 285,56,14,122Administration expenses reported under current formatAs reported under current format 53,67,64,710Add: Expenses reported under software development expenses in current format 32,76,74,171
Selling, general and administration expenses reported under proposed format. 86,44,38,881
Note: Under the current reporting format, aggregate employee costs and other costs are reported under software development expenses while under the proposed format, employee costsand other costs are reported under the respective functional heads namely software development expenses, selling and marketing, and general and administration expenses.
Q1_2001_PAPF_Final.p65 28/07/2001, 2:47 PM21
22
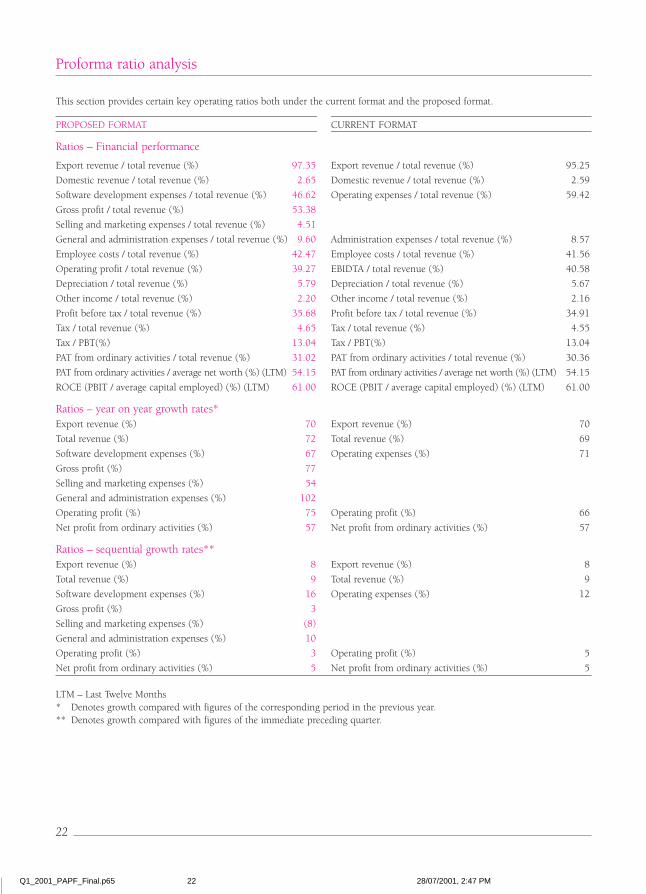
Proforma ratio analysis
This section provides certain key operating ratios both under the current format and the proposed format.
PROPOSED FORMAT CURRENT FORMAT
Ratios – Financial performance
Export revenue / total revenue (%) 97.35 Export revenue / total revenue (%) 95.25
Domestic revenue / total revenue (%) 2.65 Domestic revenue / total revenue (%) 2.59
Software development expenses / total revenue (%) 46.62 Operating expenses / total revenue (%) 59.42
Gross profit / total revenue (%) 53.38
Selling and marketing expenses / total revenue (%) 4.51
General and administration expenses / total revenue (%) 9.60 Administration expenses / total revenue (%) 8.57
Employee costs / total revenue (%) 42.47 Employee costs / total revenue (%) 41.56
Operating profit / total revenue (%) 39.27 EBIDTA / total revenue (%) 40.58
Depreciation / total revenue (%) 5.79 Depreciation / total revenue (%) 5.67
Other income / total revenue (%) 2.20 Other income / total revenue (%) 2.16
Profit before tax / total revenue (%) 35.68 Profit before tax / total revenue (%) 34.91
Tax / total revenue (%) 4.65 Tax / total revenue (%) 4.55
Tax / PBT(%) 13.04 Tax / PBT(%) 13.04
PAT from ordinary activities / total revenue (%) 31.02 PAT from ordinary activities / total revenue (%) 30.36
PAT from ordinary activities / average net worth (%) (LTM) 54.15 PAT from ordinary activities / average net worth (%) (LTM) 54.15
ROCE (PBIT / average capital employed) (%) (LTM) 61.00 ROCE (PBIT / average capital employed) (%) (LTM) 61.00
Ratios – year on year growth rates*Export revenue (%) 70 Export revenue (%) 70
Total revenue (%) 72 Total revenue (%) 69
Software development expenses (%) 67 Operating expenses (%) 71
Gross profit (%) 77
Selling and marketing expenses (%) 54
General and administration expenses (%) 102
Operating profit (%) 75 Operating profit (%) 66
Net profit from ordinary activities (%) 57 Net profit from ordinary activities (%) 57
Ratios – sequential growth rates**Export revenue (%) 8 Export revenue (%) 8
Total revenue (%) 9 Total revenue (%) 9
Software development expenses (%) 16 Operating expenses (%) 12
Gross profit (%) 3
Selling and marketing expenses (%) (8)
General and administration expenses (%) 10
Operating profit (%) 3 Operating profit (%) 5
Net profit from ordinary activities (%) 5 Net profit from ordinary activities (%) 5
LTM – Last Twelve Months* Denotes growth compared with figures of the corresponding period in the previous year.** Denotes growth compared with figures of the immediate preceding quarter.
Q1_2001_PAPF_Final.p65 28/07/2001, 2:47 PM22
23
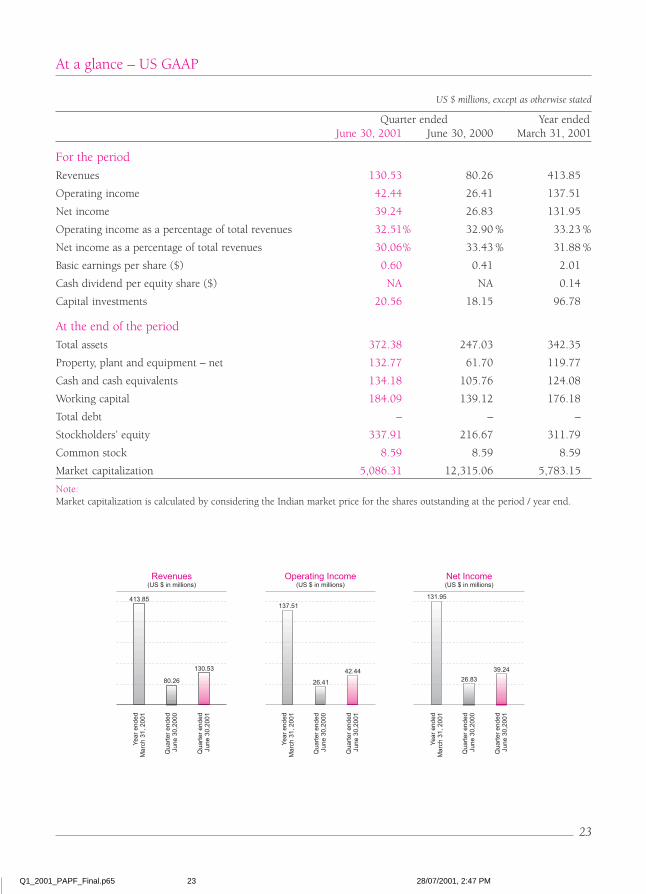
At a glance – US GAAP
US $ millions, except as otherwise stated
Quarter ended Year endedJune 30, 2001 June 30, 2000 March 31, 2001
For the period
Revenues 130.53 80.26 413.85
Operating income 42.44 26.41 137.51
Net income 39.24 26.83 131.95
Operating income as a percentage of total revenues 32.51% 32.90 % 33.23 %
Net income as a percentage of total revenues 30.06% 33.43 % 31.88 %
Basic earnings per share ($) 0.60 0.41 2.01
Cash dividend per equity share ($) NA NA 0.14
Capital investments 20.56 18.15 96.78
At the end of the period
Total assets 372.38 247.03 342.35
Property, plant and equipment – net 132.77 61.70 119.77
Cash and cash equivalents 134.18 105.76 124.08
Working capital 184.09 139.12 176.18
Total debt – – –
Stockholders’ equity 337.91 216.67 311.79
Common stock 8.59 8.59 8.59
Market capitalization 5,086.31 12,315.06 5,783.15
Note:Market capitalization is calculated by considering the Indian market price for the shares outstanding at the period / year end.
Q1_2001_PAPF_Final.p65 28/07/2001, 2:47 PM23

24
Currency of Presentation and Certain Defined TermsUnless the context otherwise requires, references herein to the “company” or to “Infosys” are to Infosys Technologies Limited,a limited liability company organized under the laws of the Republic of India. References to “U.S.” or “United States” are tothe United States of America, its territories and its possessions. References to “India” are to the Republic of India. YantraCorporation, a Delaware Corporation (“Yantra”), in which the company holds a minority interest, is considered a subsidiaryof the company for purposes of Indian GAAP. “Infosys” is a registered trademark of the company in India and the UnitedStates. All other trademarks or tradenames used in this Quarterly Report on Form 6-K (“Quarterly Report”) are the propertyof their respective owners.
In this Quarterly Report, references to “$” or “Dollars” or “U.S. Dollars” are to the legal currency of the United States,references to “EUR” or “Euro” ( ) are to the legal currency of the European Union and references to “Rs.” or “Rupees” or “IndianRupees” are to the legal currency of India. The company’s financial statements are presented in Indian Rupees and translatedinto U.S. Dollars and are prepared in accordance with United States generally accepted accounting principles (“U.S. GAAP”).References to “Indian GAAP” are to Indian generally accepted accounting principles. Except as otherwise specified, financialinformation is presented in Dollars. References to a particular “fiscal” year are to the company’s fiscal year ended March 31 ofsuch year.
Unless otherwise specified herein, financial information has been converted into Dollars at the noon buying rate in New YorkCity for cable transfers in foreign currencies as certified for customs purposes by the Federal Reserve Bank (the “Noon BuyingRate”) as of June 30, 2001, which was Rs. 47.09 per $1.00. For the convenience of the reader, this Quarterly Report containstranslations of certain Indian rupee amounts into U.S. Dollars which should not be construed as a representation that suchIndian Rupee or U.S. Dollar amounts referred to herein could have been, or could be, converted to U.S. Dollars or IndianRupees, as the case may be, at any particular rate, the rates stated below, or at all. Any discrepancies in any table between totalsand sums of the amounts listed are due to rounding.
Forward-looking statements may prove inaccurateIn addition to historical information, this quarterly report contains certain forward-looking statements within the meaning ofSection 27A of the Securities Act of 1933, as amended, and Section 21E of the Securities Exchange Act of 1934, as amended.The forward-looking statements contained herein are subject to certain risks and uncertainties that could cause actual resultsto differ materially from those reflected in the forward-looking statements. Factors that might cause such differences includebut are not limited to, those discussed in the section entitled “Management’s Discussion and Analysis of Financial Conditionand Results of Operations” and elsewhere in this report. Readers are cautioned not to place undue reliance on these forward-looking statements, which reflect management’s analysis only as of the date hereof. In addition, readers should carefullyreview the other information in this quarterly report and in the company’s periodic reports and other documents filed withthe Securities and Exchange Commission (“SEC”) from time to time.
United States Securities and Exchange CommissionWashington, DC 20549
FORM 6-KReport of Foreign Issuer
Pursuant to Rule 13a-16 or 15d-16 of the Securities Exchange Act of 1934For the quarter ended June 30, 2001
Commission File Number 333-72195
INFOSYS TECHNOLOGIES LIMITED(Exact name of Registrant as specified in its charter)
Not Applicable(Translation of Registrant’s name into English)
Bangalore, Karnataka, India(Jurisdiction of incorporation or organization)
Electronics City, Hosur Road, Bangalore, Karnataka, India 561 229. +91-80-852-0261(Address of principal executive offices)
Indicate by check mark registrant files or will file annual reports under cover Form 20-F or Form 40-F
Form 20-F ...........x........... Form 40-F .......................
Indicate by check mark whether the registrant by furnishing the information contained in this Form is also thereby furnishing theinformation to the Commission pursuant to Rule 12g 3-2(b) under the Securities Exchange Act of 1934.
Yes ................................... No ...........x.......................
If “Yes” is marked, indicate below the file number assigned to registrant in connection with Rule 12g 3-2(b).Not applicable.
Q1_2001_PAPF_Final.p65 28/07/2001, 2:47 PM24
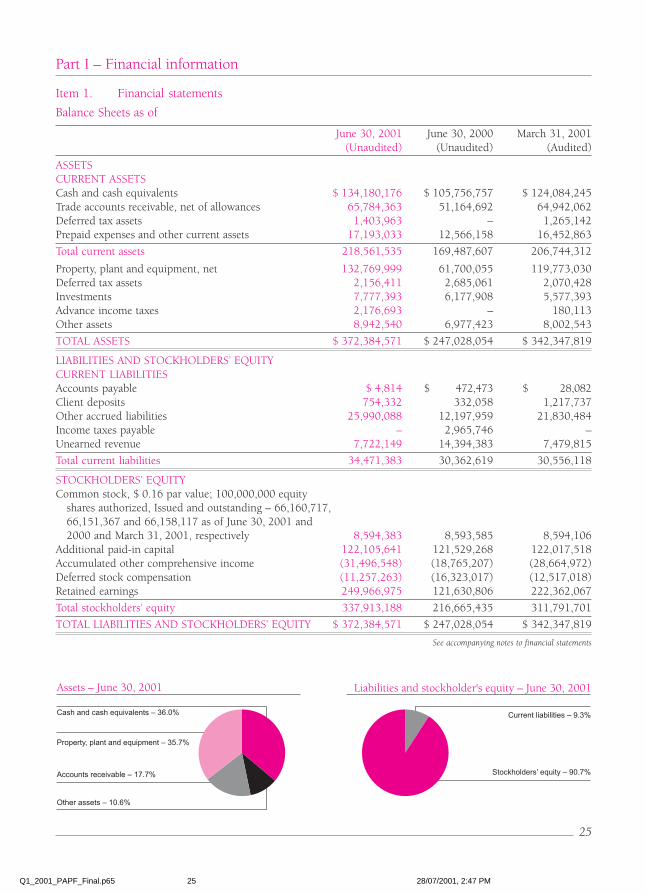
25
Part I – Financial information
Item 1. Financial statements
Balance Sheets as of
June 30, 2001 June 30, 2000 March 31, 2001(Unaudited) (Unaudited) (Audited)
ASSETSCURRENT ASSETSCash and cash equivalents $ 134,180,176 $ 105,756,757 $ 124,084,245Trade accounts receivable, net of allowances 65,784,363 51,164,692 64,942,062Deferred tax assets 1,403,963 – 1,265,142Prepaid expenses and other current assets 17,193,033 12,566,158 16,452,863
Total current assets 218,561,535 169,487,607 206,744,312
Property, plant and equipment, net 132,769,999 61,700,055 119,773,030Deferred tax assets 2,156,411 2,685,061 2,070,428Investments 7,777,393 6,177,908 5,577,393Advance income taxes 2,176,693 – 180,113Other assets 8,942,540 6,977,423 8,002,543
TOTAL ASSETS $ 372,384,571 $ 247,028,054 $ 342,347,819
LIABILITIES AND STOCKHOLDERS’ EQUITYCURRENT LIABILITIESAccounts payable $ 4,814 $ 472,473 $ 28,082Client deposits 754,332 332,058 1,217,737Other accrued liabilities 25,990,088 12,197,959 21,830,484Income taxes payable – 2,965,746 –Unearned revenue 7,722,149 14,394,383 7,479,815
Total current liabilities 34,471,383 30,362,619 30,556,118
STOCKHOLDERS’ EQUITYCommon stock, $ 0.16 par value; 100,000,000 equity
shares authorized, Issued and outstanding – 66,160,717,66,151,367 and 66,158,117 as of June 30, 2001 and2000 and March 31, 2001, respectively 8,594,383 8,593,585 8,594,106
Additional paid-in capital 122,105,641 121,529,268 122,017,518Accumulated other comprehensive income (31,496,548) (18,765,207) (28,664,972)Deferred stock compensation (11,257,263) (16,323,017) (12,517,018)Retained earnings 249,966,975 121,630,806 222,362,067
Total stockholders’ equity 337,913,188 216,665,435 311,791,701
TOTAL LIABILITIES AND STOCKHOLDERS’ EQUITY $ 372,384,571 $ 247,028,054 $ 342,347,819
See accompanying notes to financial statements
Q1_2001_PAPF_Final.p65 28/07/2001, 2:47 PM25
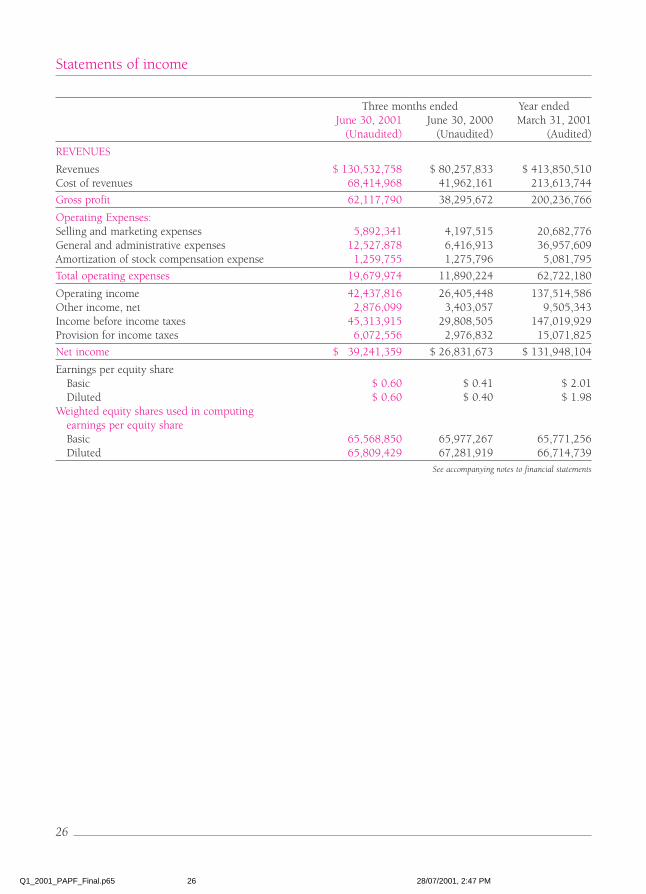
26
Three months ended Year endedJune 30, 2001 June 30, 2000 March 31, 2001
(Unaudited) (Unaudited) (Audited)
REVENUES
Revenues $ 130,532,758 $ 80,257,833 $ 413,850,510Cost of revenues 68,414,968 41,962,161 213,613,744
Gross profit 62,117,790 38,295,672 200,236,766
Operating Expenses:Selling and marketing expenses 5,892,341 4,197,515 20,682,776General and administrative expenses 12,527,878 6,416,913 36,957,609Amortization of stock compensation expense 1,259,755 1,275,796 5,081,795
Total operating expenses 19,679,974 11,890,224 62,722,180
Operating income 42,437,816 26,405,448 137,514,586Other income, net 2,876,099 3,403,057 9,505,343Income before income taxes 45,313,915 29,808,505 147,019,929Provision for income taxes 6,072,556 2,976,832 15,071,825
Net income $ 39,241,359 $ 26,831,673 $ 131,948,104
Earnings per equity shareBasic $ 0.60 $ 0.41 $ 2.01Diluted $ 0.60 $ 0.40 $ 1.98
Weighted equity shares used in computingearnings per equity shareBasic 65,568,850 65,977,267 65,771,256Diluted 65,809,429 67,281,919 66,714,739
See accompanying notes to financial statements
Statements of income
Q1_2001_PAPF_Final.p65 28/07/2001, 2:47 PM26
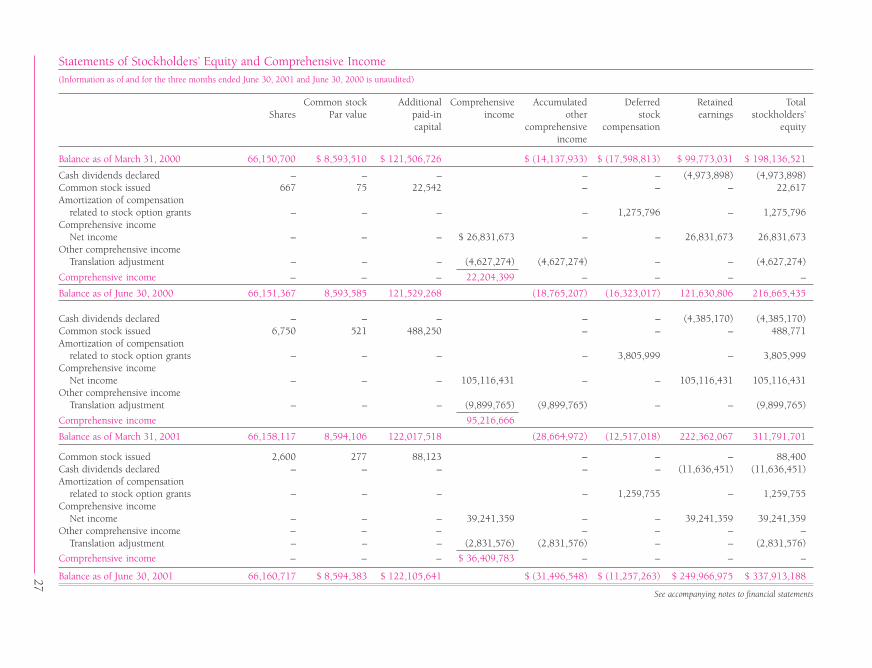
27
Statements of Stockholders’ Equity and Comprehensive Income(Information as of and for the three months ended June 30, 2001 and June 30, 2000 is unaudited)
Common stock Additional Comprehensive Accumulated Deferred Retained TotalShares Par value paid-in income other stock earnings stockholders’
capital comprehensive compensation equityincome
Balance as of March 31, 2000 66,150,700 $ 8,593,510 $ 121,506,726 $ (14,137,933) $ (17,598,813) $ 99,773,031 $ 198,136,521
Cash dividends declared – – – – – (4,973,898) (4,973,898)Common stock issued 667 75 22,542 – – – 22,617Amortization of compensation
related to stock option grants – – – – 1,275,796 – 1,275,796Comprehensive income
Net income – – – $ 26,831,673 – – 26,831,673 26,831,673Other comprehensive income
Translation adjustment – – – (4,627,274) (4,627,274) – – (4,627,274)
Comprehensive income – – – 22,204,399 – – – –
Balance as of June 30, 2000 66,151,367 8,593,585 121,529,268 (18,765,207) (16,323,017) 121,630,806 216,665,435
Cash dividends declared – – – – – (4,385,170) (4,385,170)Common stock issued 6,750 521 488,250 – – – 488,771Amortization of compensation
related to stock option grants – – – – 3,805,999 – 3,805,999Comprehensive income
Net income – – – 105,116,431 – – 105,116,431 105,116,431Other comprehensive income
Translation adjustment – – – (9,899,765) (9,899,765) – – (9,899,765)
Comprehensive income 95,216,666
Balance as of March 31, 2001 66,158,117 8,594,106 122,017,518 (28,664,972) (12,517,018) 222,362,067 311,791,701
Common stock issued 2,600 277 88,123 – – – 88,400Cash dividends declared – – – – – (11,636,451) (11,636,451)Amortization of compensation
related to stock option grants – – – – 1,259,755 – 1,259,755Comprehensive income
Net income – – – 39,241,359 – – 39,241,359 39,241,359Other comprehensive income – – – – – – –
Translation adjustment – – – (2,831,576) (2,831,576) – – (2,831,576)
Comprehensive income – – – $ 36,409,783 – – – –
Balance as of June 30, 2001 66,160,717 $ 8,594,383 $ 122,105,641 $ (31,496,548) $ (11,257,263) $ 249,966,975 $ 337,913,188
See accompanying notes to financial statements
Q1_2001_P
AP
F_F
inal.p6528/07/2001, 2:47 P
M27
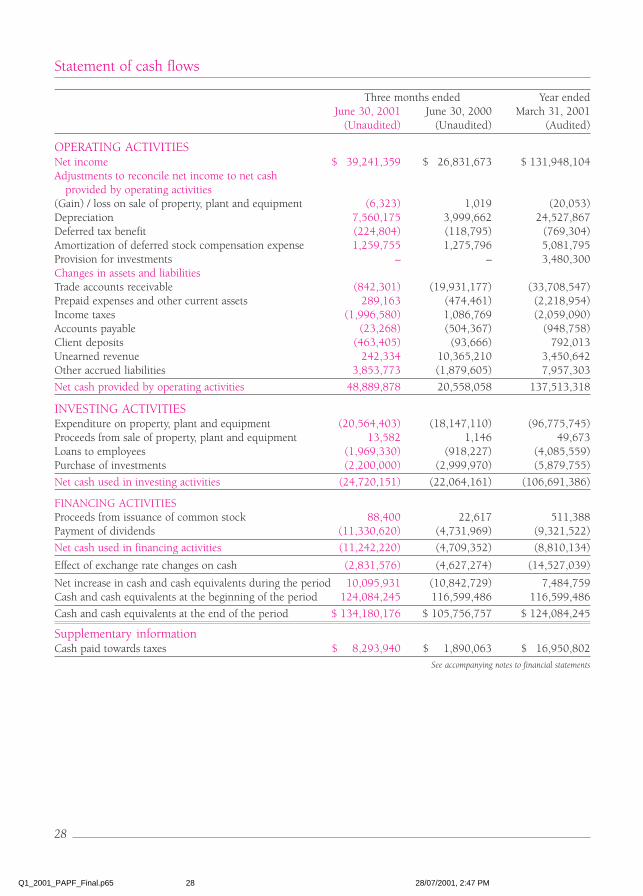
28
Statement of cash flows
Three months ended Year endedJune 30, 2001 June 30, 2000 March 31, 2001
(Unaudited) (Unaudited) (Audited)
OPERATING ACTIVITIESNet income $ 39,241,359 $ 26,831,673 $ 131,948,104Adjustments to reconcile net income to net cash
provided by operating activities(Gain) / loss on sale of property, plant and equipment (6,323) 1,019 (20,053)Depreciation 7,560,175 3,999,662 24,527,867Deferred tax benefit (224,804) (118,795) (769,304)Amortization of deferred stock compensation expense 1,259,755 1,275,796 5,081,795Provision for investments – – 3,480,300Changes in assets and liabilitiesTrade accounts receivable (842,301) (19,931,177) (33,708,547)Prepaid expenses and other current assets 289,163 (474,461) (2,218,954)Income taxes (1,996,580) 1,086,769 (2,059,090)Accounts payable (23,268) (504,367) (948,758)Client deposits (463,405) (93,666) 792,013Unearned revenue 242,334 10,365,210 3,450,642Other accrued liabilities 3,853,773 (1,879,605) 7,957,303
Net cash provided by operating activities 48,889,878 20,558,058 137,513,318
INVESTING ACTIVITIESExpenditure on property, plant and equipment (20,564,403) (18,147,110) (96,775,745)Proceeds from sale of property, plant and equipment 13,582 1,146 49,673Loans to employees (1,969,330) (918,227) (4,085,559)Purchase of investments (2,200,000) (2,999,970) (5,879,755)
Net cash used in investing activities (24,720,151) (22,064,161) (106,691,386)
FINANCING ACTIVITIESProceeds from issuance of common stock 88,400 22,617 511,388Payment of dividends (11,330,620) (4,731,969) (9,321,522)
Net cash used in financing activities (11,242,220) (4,709,352) (8,810,134)
Effect of exchange rate changes on cash (2,831,576) (4,627,274) (14,527,039)
Net increase in cash and cash equivalents during the period 10,095,931 (10,842,729) 7,484,759Cash and cash equivalents at the beginning of the period 124,084,245 116,599,486 116,599,486
Cash and cash equivalents at the end of the period $ 134,180,176 $ 105,756,757 $ 124,084,245
Supplementary informationCash paid towards taxes $ 8,293,940 $ 1,890,063 $ 16,950,802
See accompanying notes to financial statements
Q1_2001_PAPF_Final.p65 28/07/2001, 2:47 PM28
29
Notes to financial statements as of and for the three months ended June 30, 2001
Item 1. Company overview and significant accounting policies
1.1 Company overview
Infosys Technologies Limited (“Infosys” or the “company”), a publicly held company is an information technology(“IT”) consulting and service provider, providing end-to-end consulting for global corporations. The companyhas partnered with several Fortune 500 and other established corporations in building their next generationinformation infrastructure for competitive advantage. Infosys’ portfolio of services includes e-strategy consultingand solutions, large application development and enterprise integration services. Infosys also has product co-development initiatives with numerous communication and Internet infrastructure companies that are creatingthe building blocks for the digital economy. In addition, the company develops and markets certain softwareproducts. Headquartered in Bangalore, India, the company has 16 state-of-the-art offshore software developmentfacilities located throughout India, six proximity development centers in the UK and the US and one globaldevelopment center in Canada, that enable it to provide high quality, cost-effective services to clients in aresource-constrained environment. The company also maintains offices in North America, Europe and Asia.
1.2 Basis of preparation of financial statements
The accompanying financial statements are prepared in accordance with US Generally Accepted AccountingPrinciples (“GAAP”). All amounts are stated in US dollars, except as otherwise specified.
1.3 Use of estimates
The preparation of financial statements in conformity with GAAP requires management to make estimates andassumptions that affect the reported amounts of assets and liabilities, the disclosure of contingent assets andliabilities on the date of the financial statements and the reported amounts of revenues and expenses during theyear. Examples of estimates include accounting for contract costs expected to be incurred to complete softwaredevelopment, allowance for uncollectible accounts receivable, future obligations under employee benefit plansand the useful lives of property, plant and equipment. Actual results could differ from those estimates.
1.4 Revenue recognition
The company derives its revenues primarily from software services and also from the licensing of softwareproducts. Revenue on time-and-material contracts is recognized as the related costs are incurred. Revenue fromfixed-price, fixed-time frame contracts are recognized upon the achievement of specified milestones identifiedin the related contracts, as per the percentage-of-completion method. Provisions for estimated losses onuncompleted contracts are recorded in the period in which such losses become probable based on the currentcontract estimates. The company provides its clients with a fixed-period warranty for corrections of errors andtelephone support on all its fixed-price, fixed-time frame contracts. Costs associated with the support servicesare accrued at the time related revenues are recorded.
Revenue from licensing of software products is recognized upon shipment of products and fulfillment ofacceptance terms, if any, provided that no significant vendor obligations remain and the collection of the relatedreceivable is probable. When the company receives advances for software development services and products,such amounts are reported as client deposits until all conditions for revenue recognition are met. Maintenancerevenue is deferred and recognized ratably over the term of the underlying maintenance agreement, generally12 months. Revenue from client training, support and other services arising due to the sale of software productsis recognized as the services are performed.
1.5 Cash and cash equivalents
The company considers all highly liquid investments with a remaining maturity at the date of purchase/ investmentof three months or less to be cash equivalents. Cash and cash equivalents comprise cash, cash on deposit withbanks, marketable securities and deposits with corporations.
Q1_2001_PAPF_Final.p65 28/07/2001, 2:47 PM29
30
1.6 Property, plant and equipment
Property, plant and equipment are stated at cost less accumulated depreciation. The company depreciates property,plant and equipment over their estimated useful lives using the straight-line method. The estimated useful livesof assets are as follows:
Buildings 15 years
Furniture and fixtures 5 years
Computer equipment 2-5 years
Plant and equipment 5 years
Vehicles 5 years
The cost of software purchased for use in software development and services is charged to the cost of revenuesat the time of acquisition. The amount of third party software expensed in the three months ended June 30, 2001and June 30, 2000 and in fiscal 2001 was $ 1,704,551, $ 1,703,779 and $ 6,979,492, respectively.
Deposits paid towards the acquisition of property, plant and equipment outstanding at each balance sheet dateand the cost of property, plant and equipment not put to use before such date are disclosed under “Capital work-in-progress”.
1.7 Impairment of long-lived assets
The company evaluates the recoverability of its long-lived assets and certain identifiable intangibles, if any,whenever events or changes in circumstances indicate that their carrying amounts may not be recoverable.Recoverability of assets to be held and used is measured by a comparison of the carrying amount of an asset tofuture undiscounted net cash flows expected to be generated by the asset. If such assets are considered to beimpaired, the impairment to be recognized is measured by the amount by which the carrying value of the assetsexceeds the fair value of the assets. Assets to be disposed are reported at the lower of the carrying value or thefair value less the cost to sell.
1.8 Research and development
Research and development costs are expensed as incurred. Software product development costs are expensedas incurred until technological feasibility is achieved. Software product development costs incurred subsequentto achieving technological feasibility are not significant and are expensed as incurred.
1.9 Foreign currency translation
The accompanying financial statements are reported in US dollars. The functional currency of the company isthe Indian Rupee (“Rs.”). The translation of Rs. to US dollars is performed for balance sheet accounts using theexchange rate in effect at the balance sheet date, and for revenue and expense accounts using a monthly averageexchange rate for the respective periods. The gains or losses resulting from such translation are reported as“Other comprehensive income”, a separate component of stockholders’ equity. The method for translating expensesof overseas operations depends upon the funds used. If the payment is made from a rupee denominated bankaccount, the exchange rate prevailing on the date of the payment would apply. If the payment is made from aforeign currency, i.e., non-rupee denominated account, the translation into rupees is performed at the averagemonthly exchange rate.
1.10 Earnings per share
In accordance with Statement of Financial Accounting Standards (“SFAS”) No. 128, Earnings Per Share, basicearnings per share are computed using the weighted average number of common shares outstanding during theperiod. Diluted earnings per share is computed using the weighted average number of common and dilutivecommon equivalent shares outstanding during the period, using the treasury stock method for options andwarrants, except where the result would be anti-dilutive.
1.11 Income taxes
Income taxes are accounted for using the asset and liability method. Deferred tax assets and liabilities arerecognized for the future tax consequences attributable to differences between the financial statement carryingamounts of existing assets and liabilities, and their respective tax bases and operating loss carry-forwards.Deferred tax assets and liabilities are measured using enacted tax rates expected to apply to taxable income in
Q1_2001_PAPF_Final.p65 28/07/2001, 2:47 PM30
31
the years in which those temporary differences are expected to be recovered or settled. The effect of changes intax rates on deferred tax assets and liabilities is recognized as income in the period that includes the enactmentdate. The measurement of deferred tax assets is reduced, if necessary, by a valuation allowance for any taxbenefits of which future realization is uncertain.
1.12 Fair value of financial instruments
The carrying amounts reflected in the balance sheets for cash, cash equivalents, accounts receivable and accountspayable approximate their respective fair values due to the short maturities of these instruments.
1.13 Concentration of risk
Financial instruments that potentially subject the company to concentrations of credit risk consist principallyof cash equivalents, trade accounts receivable, investment securities and hedging instruments. By their nature,all such financial instruments involve risk including the credit risk of non-performance by counterparties. Inmanagement’s opinion, as of June 30, 2001, June 30, 2000 and March 31, 2001, there was no significant risk ofloss in the event of non-performance of the counterparties to these financial instruments, other than the amountsalready provided for in the financial statements. Exposure to credit risk is managed through credit approvals,establishing credit limits and monitoring procedures. The company’s cash resources are invested with corporations,financial institutions and banks with high investment grade credit ratings. Limitations are established by thecompany as to the maximum amount of cash that may be invested with any such single entity.
1.14 Retirement benefits to employees
1.14.1 GratuityIn accordance with the Payment of Gratuity Act, 1972, Infosys provides for gratuity, a defined benefit retirementplan (the “Gratuity Plan”) covering eligible employees. The Gratuity Plan provides a lump sum payment tovested employees at retirement, death, incapacitation or termination of employment, of an amount based on therespective employee’s salary and the tenure of employment. Liabilities with regard to the Gratuity Plan aredetermined by actuarial valuation, based upon which, the company contributes to the Infosys TechnologiesLimited Employees’ Gratuity Fund Trust (the “Trust”). Trustees administer contributions made to the Trust andinvest in specific designated securities as mandated by law, which generally comprise central and state governmentbonds and debt instruments of government-owned corporations.
1.14.2 SuperannuationApart from being covered under the Gratuity Plan described above, certain employees of Infosys are alsoparticipants of a defined contribution plan. The company makes monthly contributions under the superannuationplan (the “Plan”) to the Infosys Technologies Limited Employees Superannuation Fund Trust based on a specifiedpercentage of each covered employee’s salary. The company has no further obligations to the Plan beyond itsmonthly contributions.
1.14.3 Provident fundEligible employees also receive benefits from a provident fund, which is a defined contribution plan. Both theemployee and the company make monthly contributions to this provident fund plan equal to a specifiedpercentage of the covered employee’s salary. Infosys contributes a part of the contributions to the InfosysTechnologies Limited Employee’s Provident Fund Trust. The remainders of the contributions are made to theGovernment administered provident fund. The company has no further obligations under the provident fundplan beyond its monthly contributions.
1.15 InvestmentsInvestments where the company controls between 20% and 50% of the voting interest are accounted for usingthe equity method. Investment securities in which the company controls less than 20% voting interest arecurrently classified as “Available-for-sale securities”.
Investment securities designated as “available-for-sale” are carried at their fair value. Fair value is based onquoted market prices. Unquoted securities are carried at cost, adjusted for declines in value judged to be otherthan temporary. Temporary unrealized gains and losses, net of the related tax effect are reported as a separatecomponent of stockholders’ equity until realized. Realized gains and losses and declines in value judged to beother than temporary on available-for-sale securities are included in the statements of income. The cost ofsecurities sold is based on the specific identification method. Interest and dividend income is recognized whenearned.
Q1_2001_PAPF_Final.p65 28/07/2001, 2:47 PM31
32
1.16 Stock-based compensationThe company uses the intrinsic value-based method of Accounting Principles Board (“APB”) Opinion No. 25,Accounting for Stock Issued to Employees, to account for its employee stock-based compensation plan. The companyhas therefore adopted the proforma disclosure provisions of SFAS No. 123, Accounting for Stock-BasedCompensation.
1.17 DividendsDividend on common stock and the related dividend tax are recorded as a liability on declaration.
1.18 Derivative financial instrumentsEffective April 1, 2001, Infosys adopted SFAS 133, Accounting for Derivative Instruments and Hedging Activities asamended, when the pronouncement became effective for companies with fiscal year ending March 31, 2001.SFAS 133 changes the accounting treatment of derivative contracts (including foreign exchange contracts) thatare employed to manage risks. It establishes accounting and reporting standards for derivative instruments,including certain derivative instruments embedded in other contracts and for hedging activities. All derivatives,whether designated in hedging relationships or not, are required to be recorded on the balance sheet at fairvalue. The accounting treatment of changes in fair value is dependent upon whether or not a derivative instrumentis designated as a hedge and if so, the type of hedge. If the derivative is designated as a fair value hedge, thechanges in the fair value of the derivative and of the hedged item attributable to the hedged risk are recognizedin earnings. If the derivative is designated as a cash flow hedge, the effective portions of changes in the fair valueof the derivative are recorded in other comprehensive income and are recognized in the income statement whenthe hedged item affects earnings. Ineffective portions of changes in the fair value of cash flow hedges are recognizedin earnings.
1.19 Notes to the Financial Statements
1.19.1 Cash and cash equivalentsThe cost and fair values for cash and cash equivalents as of June 30, 2001 and 2000 and March 31, 2001,respectively are as follows:
As of June 30, Year ended2001 2000 March 31, 2001
Cost and fair valuesCash and bank deposits $ 94,975,383 $ 95,467,109 $ 82,702,111Deposits with corporations 39,204,793 10,289,648 41,382,134
$ 134,180,176 $ 105,756,757 $ 124,084,245
1.19.2 Trade accounts receivableTrade accounts receivable, as of June 30, 2001 and 2000 and March 31, 2001, net of allowance for doubtfulaccounts of $ 4,913,007, $ 587,229 and $ 3,902,996, respectively amounted to $ 65,784,363, $ 51,164,692and $ 64,942,062, respectively. The age profile of trade accounts receivable is given below.
in %
As of June 30, As of March 31,Period (in days) 2001 2000 2001
0 – 30 81.0 76.2 69.231 – 60 12.2 10.1 26.661 – 90 5.5 7.9 1.7More than 90 1.3 5.8 2.5
100.0 100.0 100.0
Trade accounts receivable include accounts receivable from Yantra amounting to $ 99,818, $ 376,783 and$ 214,347 as of June 30, 2001 and 2000 and March 31, 2001, respectively.
Q1_2001_PAPF_Final.p65 28/07/2001, 2:47 PM32
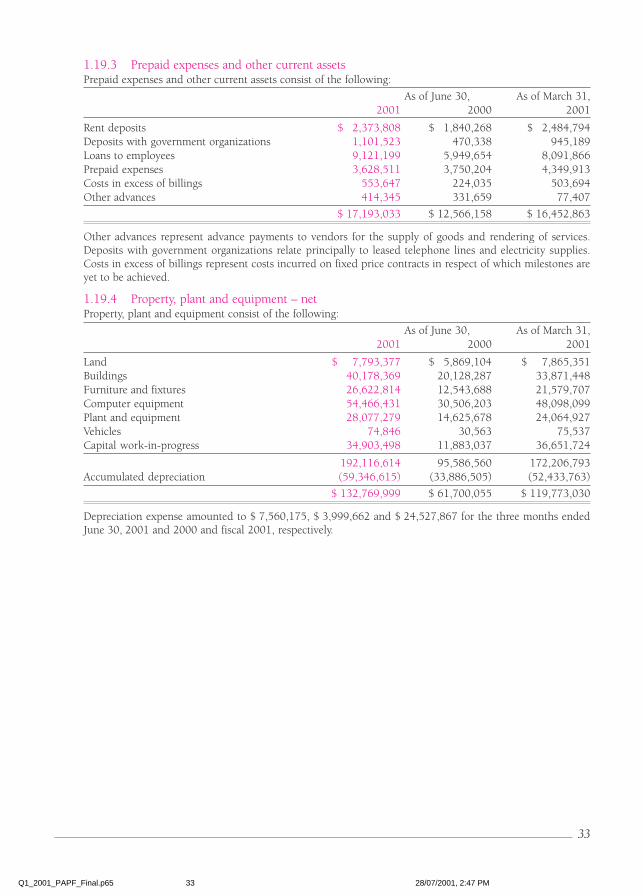
33
1.19.3 Prepaid expenses and other current assetsPrepaid expenses and other current assets consist of the following:
As of June 30, As of March 31,2001 2000 2001
Rent deposits $ 2,373,808 $ 1,840,268 $ 2,484,794Deposits with government organizations 1,101,523 470,338 945,189Loans to employees 9,121,199 5,949,654 8,091,866Prepaid expenses 3,628,511 3,750,204 4,349,913Costs in excess of billings 553,647 224,035 503,694Other advances 414,345 331,659 77,407
$ 17,193,033 $ 12,566,158 $ 16,452,863
Other advances represent advance payments to vendors for the supply of goods and rendering of services.Deposits with government organizations relate principally to leased telephone lines and electricity supplies.Costs in excess of billings represent costs incurred on fixed price contracts in respect of which milestones areyet to be achieved.
1.19.4 Property, plant and equipment – netProperty, plant and equipment consist of the following:
As of June 30, As of March 31,2001 2000 2001
Land $ 7,793,377 $ 5,869,104 $ 7,865,351Buildings 40,178,369 20,128,287 33,871,448Furniture and fixtures 26,622,814 12,543,688 21,579,707Computer equipment 54,466,431 30,506,203 48,098,099Plant and equipment 28,077,279 14,625,678 24,064,927Vehicles 74,846 30,563 75,537Capital work-in-progress 34,903,498 11,883,037 36,651,724
192,116,614 95,586,560 172,206,793Accumulated depreciation (59,346,615) (33,886,505) (52,433,763)
$ 132,769,999 $ 61,700,055 $ 119,773,030
Depreciation expense amounted to $ 7,560,175, $ 3,999,662 and $ 24,527,867 for the three months endedJune 30, 2001 and 2000 and fiscal 2001, respectively.
Q1_2001_PAPF_Final.p65 28/07/2001, 2:47 PM33
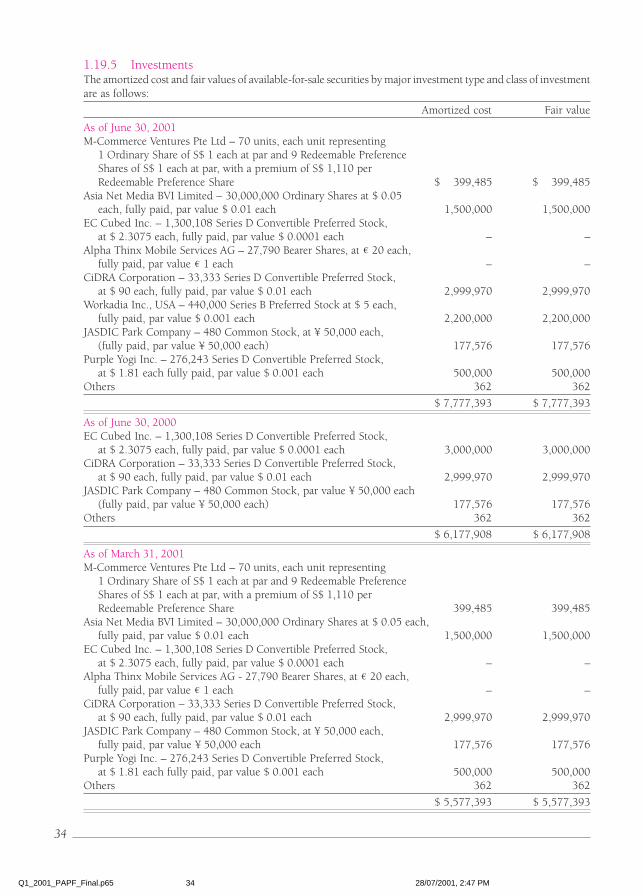
34
1.19.5 InvestmentsThe amortized cost and fair values of available-for-sale securities by major investment type and class of investmentare as follows:
Amortized cost Fair value
As of June 30, 2001M-Commerce Ventures Pte Ltd – 70 units, each unit representing
1 Ordinary Share of S$ 1 each at par and 9 Redeemable PreferenceShares of S$ 1 each at par, with a premium of S$ 1,110 perRedeemable Preference Share $ 399,485 $ 399,485
Asia Net Media BVI Limited – 30,000,000 Ordinary Shares at $ 0.05each, fully paid, par value $ 0.01 each 1,500,000 1,500,000
EC Cubed Inc. – 1,300,108 Series D Convertible Preferred Stock,at $ 2.3075 each, fully paid, par value $ 0.0001 each – –
Alpha Thinx Mobile Services AG – 27,790 Bearer Shares, at 20 each,fully paid, par value 1 each – –
CiDRA Corporation – 33,333 Series D Convertible Preferred Stock,at $ 90 each, fully paid, par value $ 0.01 each 2,999,970 2,999,970
Workadia Inc., USA – 440,000 Series B Preferred Stock at $ 5 each,fully paid, par value $ 0.001 each 2,200,000 2,200,000
JASDIC Park Company – 480 Common Stock, at ¥ 50,000 each,(fully paid, par value ¥ 50,000 each) 177,576 177,576
Purple Yogi Inc. – 276,243 Series D Convertible Preferred Stock,at $ 1.81 each fully paid, par value $ 0.001 each 500,000 500,000
Others 362 362
$ 7,777,393 $ 7,777,393
As of June 30, 2000EC Cubed Inc. – 1,300,108 Series D Convertible Preferred Stock,
at $ 2.3075 each, fully paid, par value $ 0.0001 each 3,000,000 3,000,000CiDRA Corporation – 33,333 Series D Convertible Preferred Stock,
at $ 90 each, fully paid, par value $ 0.01 each 2,999,970 2,999,970JASDIC Park Company – 480 Common Stock, par value ¥ 50,000 each
(fully paid, par value ¥ 50,000 each) 177,576 177,576Others 362 362
$ 6,177,908 $ 6,177,908
As of March 31, 2001M-Commerce Ventures Pte Ltd – 70 units, each unit representing
1 Ordinary Share of S$ 1 each at par and 9 Redeemable PreferenceShares of S$ 1 each at par, with a premium of S$ 1,110 perRedeemable Preference Share 399,485 399,485
Asia Net Media BVI Limited – 30,000,000 Ordinary Shares at $ 0.05 each,fully paid, par value $ 0.01 each 1,500,000 1,500,000
EC Cubed Inc. – 1,300,108 Series D Convertible Preferred Stock,at $ 2.3075 each, fully paid, par value $ 0.0001 each – –
Alpha Thinx Mobile Services AG - 27,790 Bearer Shares, at 20 each,fully paid, par value 1 each – –
CiDRA Corporation – 33,333 Series D Convertible Preferred Stock,at $ 90 each, fully paid, par value $ 0.01 each 2,999,970 2,999,970
JASDIC Park Company – 480 Common Stock, at ¥ 50,000 each,fully paid, par value ¥ 50,000 each 177,576 177,576
Purple Yogi Inc. – 276,243 Series D Convertible Preferred Stock,at $ 1.81 each fully paid, par value $ 0.001 each 500,000 500,000
Others 362 362
$ 5,577,393 $ 5,577,393
Q1_2001_PAPF_Final.p65 28/07/2001, 2:47 PM34
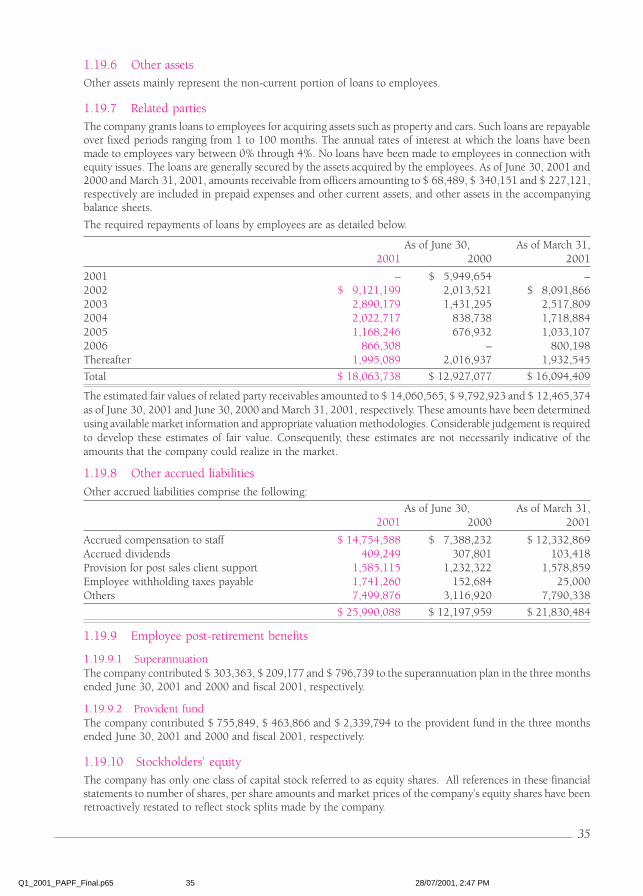
35
1.19.6 Other assets
Other assets mainly represent the non-current portion of loans to employees.
1.19.7 Related parties
The company grants loans to employees for acquiring assets such as property and cars. Such loans are repayableover fixed periods ranging from 1 to 100 months. The annual rates of interest at which the loans have beenmade to employees vary between 0% through 4%. No loans have been made to employees in connection withequity issues. The loans are generally secured by the assets acquired by the employees. As of June 30, 2001 and2000 and March 31, 2001, amounts receivable from officers amounting to $ 68,489, $ 340,151 and $ 227,121,respectively are included in prepaid expenses and other current assets, and other assets in the accompanyingbalance sheets.
The required repayments of loans by employees are as detailed below.
As of June 30, As of March 31,2001 2000 2001
2001 – $ 5,949,654 –2002 $ 9,121,199 2,013,521 $ 8,091,8662003 2,890,179 1,431,295 2,517,8092004 2,022,717 838,738 1,718,8842005 1,168,246 676,932 1,033,1072006 866,308 – 800,198Thereafter 1,995,089 2,016,937 1,932,545
Total $ 18,063,738 $ 12,927,077 $ 16,094,409
The estimated fair values of related party receivables amounted to $ 14,060,565, $ 9,792,923 and $ 12,465,374as of June 30, 2001 and June 30, 2000 and March 31, 2001, respectively. These amounts have been determinedusing available market information and appropriate valuation methodologies. Considerable judgement is requiredto develop these estimates of fair value. Consequently, these estimates are not necessarily indicative of theamounts that the company could realize in the market.
1.19.8 Other accrued liabilities
Other accrued liabilities comprise the following:
As of June 30, As of March 31,2001 2000 2001
Accrued compensation to staff $ 14,754,588 $ 7,388,232 $ 12,332,869Accrued dividends 409,249 307,801 103,418Provision for post sales client support 1,585,115 1,232,322 1,578,859Employee withholding taxes payable 1,741,260 152,684 25,000Others 7,499,876 3,116,920 7,790,338
$ 25,990,088 $ 12,197,959 $ 21,830,484
1.19.9 Employee post-retirement benefits
1.19.9.1 SuperannuationThe company contributed $ 303,363, $ 209,177 and $ 796,739 to the superannuation plan in the three monthsended June 30, 2001 and 2000 and fiscal 2001, respectively.
1.19.9.2 Provident fundThe company contributed $ 755,849, $ 463,866 and $ 2,339,794 to the provident fund in the three monthsended June 30, 2001 and 2000 and fiscal 2001, respectively.
1.19.10 Stockholders’ equity
The company has only one class of capital stock referred to as equity shares. All references in these financialstatements to number of shares, per share amounts and market prices of the company’s equity shares have beenretroactively restated to reflect stock splits made by the company.
Q1_2001_PAPF_Final.p65 28/07/2001, 2:47 PM35
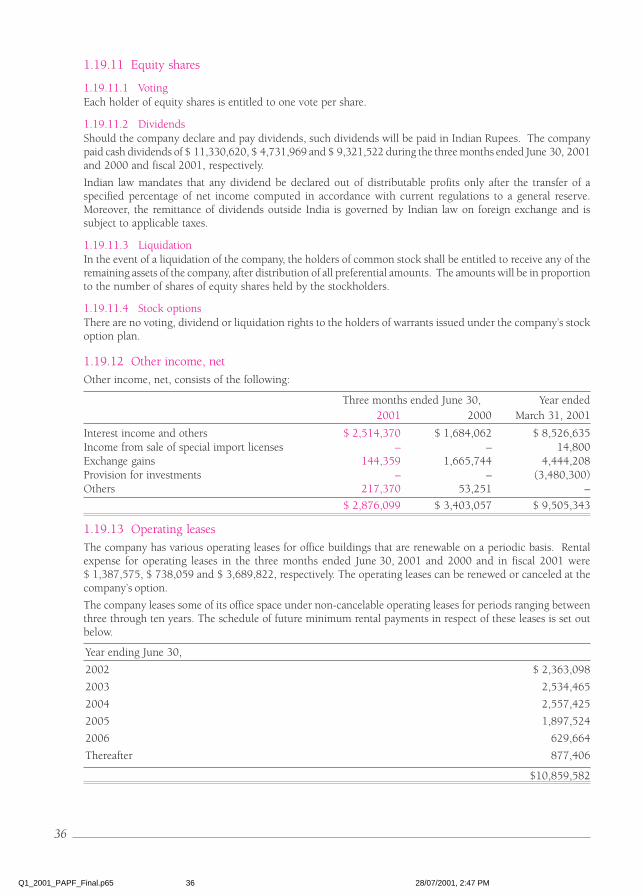
36
1.19.11 Equity shares
1.19.11.1 VotingEach holder of equity shares is entitled to one vote per share.
1.19.11.2 DividendsShould the company declare and pay dividends, such dividends will be paid in Indian Rupees. The companypaid cash dividends of $ 11,330,620, $ 4,731,969 and $ 9,321,522 during the three months ended June 30, 2001and 2000 and fiscal 2001, respectively.
Indian law mandates that any dividend be declared out of distributable profits only after the transfer of aspecified percentage of net income computed in accordance with current regulations to a general reserve.Moreover, the remittance of dividends outside India is governed by Indian law on foreign exchange and issubject to applicable taxes.
1.19.11.3 LiquidationIn the event of a liquidation of the company, the holders of common stock shall be entitled to receive any of theremaining assets of the company, after distribution of all preferential amounts. The amounts will be in proportionto the number of shares of equity shares held by the stockholders.
1.19.11.4 Stock optionsThere are no voting, dividend or liquidation rights to the holders of warrants issued under the company’s stockoption plan.
1.19.12 Other income, net
Other income, net, consists of the following:
Three months ended June 30, Year ended2001 2000 March 31, 2001
Interest income and others $ 2,514,370 $ 1,684,062 $ 8,526,635Income from sale of special import licenses – – 14,800Exchange gains 144,359 1,665,744 4,444,208Provision for investments – – (3,480,300)Others 217,370 53,251 –
$ 2,876,099 $ 3,403,057 $ 9,505,343
1.19.13 Operating leases
The company has various operating leases for office buildings that are renewable on a periodic basis. Rentalexpense for operating leases in the three months ended June 30, 2001 and 2000 and in fiscal 2001 were$ 1,387,575, $ 738,059 and $ 3,689,822, respectively. The operating leases can be renewed or canceled at thecompany’s option.
The company leases some of its office space under non-cancelable operating leases for periods ranging betweenthree through ten years. The schedule of future minimum rental payments in respect of these leases is set outbelow.
Year ending June 30,
2002 $ 2,363,098
2003 2,534,465
2004 2,557,425
2005 1,897,524
2006 629,664
Thereafter 877,406
$10,859,582
Q1_2001_PAPF_Final.p65 28/07/2001, 2:47 PM36
37
1.19.14 Research and development
General and administrative expenses in the accompanying statements of income include research and developmentexpenses of $ 801,842, $ 744,453 and $ 3,610,550 for the three months ended June 30, 2001 and 2000 andfiscal 2001, respectively.
1.19.15 Employees’ Stock Offer Plans (“ESOP”)
1994 Employees Stock Offer Plan (the “1994 Plan”): In September 1994, the company established the 1994 Plan,which provided for the issuance of 6,000,000 warrants (as adjusted for the stock split effective June 1997,December 1998 and December 1999) to eligible employees. The warrants were issued to an employee welfaretrust (the “Trust”) at Rs. 0.50 each and were purchased by the Trust using the proceeds of a loan obtained fromthe company. The Trust holds the warrants and transfers them to eligible employees at Rs. 0.50 each. Eachwarrant entitles the holder to purchase one of the company’s equity shares at a price of Rs. 50 per share. Thewarrants and the equity shares received upon the exercise of warrants are subject to a five-year aggregate vestingperiod from the date of issue of warrants to employees. The warrants expire upon the earlier of five years fromthe date of issue or September 1999. The fair market value of each warrant is the market price of the underlyingequity shares on the date of the grant.
In 1997, in anticipation of a share dividend to be declared by the company, the Trust exercised all warrants heldby it and converted them into equity shares with the proceeds of a loan obtained from the company. In connectionwith the warrant exercise and the share dividend, on an adjusted basis, 3,011,200 equity shares were issued toemployees of the company who exercised stock purchase rights and 2,988,800 equity shares were issued to theTrust for future issuance to employees pursuant to the 1994 Plan. Following such exercise, there were no longerany rights to purchase equity shares from the company in connection with the 1994 Plan. Only equity sharesheld by the Trust remained for future issues to employees, subject to vesting provisions. The equity sharesacquired upon the exercise of the warrants vest entirely on completion of five years of service. The warrantholders were entitled to exercise early, but the shares received are subject to the five-year vesting period. As ofJune 30, 2001, the company’s outstanding equity shares included 593,600 equity shares held by the Trust ofwhich 324,600 equity shares were allotted to employees, subject to vesting provisions and are included in theearnings per share calculation. The remaining 269,000 equity shares were not considered outstanding for purposesof calculating earnings per share. The warrants allotted and the underlying equity shares are not subject to anyrepurchase obligations by the company.
The 1994 plan came to an end in fiscal 2000 and no further options will be issued under this plan.
1998 Employees Stock Offer Plan (the “1998 Plan”).The company’s 1998 Plan provides for the grant of non-statutory stock options and incentive stock options toemployees of the company. The establishment of the 1998 Plan was approved by the board of directors inDecember 1997 and by the stockholders in January 1998. The Government of India has approved the 1998 Plan,subject to a limit of 1,470,000 equity shares representing 2,940,000 American Depositary Shares (“ADS”) to beissued under the 1998 Plan. Unless terminated sooner, the 1998 Plan will terminate automatically in January2008. All options under the 1998 Plan will be exercisable for equity shares represented by American DepositaryShares (ADSs). The 1999 Plan is administered by a Compensation Committee comprising five members, all ofwho are independent directors on the Board of Directors. All options under the 1998 Plan are exercisable forequity shares represented by ADSs.
1999 Stock Offer Plan (the “1999 Plan”).In fiscal 2000, the company instituted the 1999 Plan. The stockholders and the Board of Directors approvedthe 1999 Plan in June 1999. The 1999 Plan provides for the issue of 6,600,000 equity shares to employees. The1999 Plan is administered by a Compensation Committee comprising five members, all of who are independentdirectors on the Board of Directors. Under the 1999 Plan, options will be issued to employees at an exerciseprice, which shall not be less than the Fair Market Value (“FMV”). Under the 1999 Plan, options may also beissued to employees at exercise prices that are less than FMV only if specifically approved by the members of thecompany in a general meeting.
Q1_2001_PAPF_Final.p65 28/07/2001, 2:47 PM37
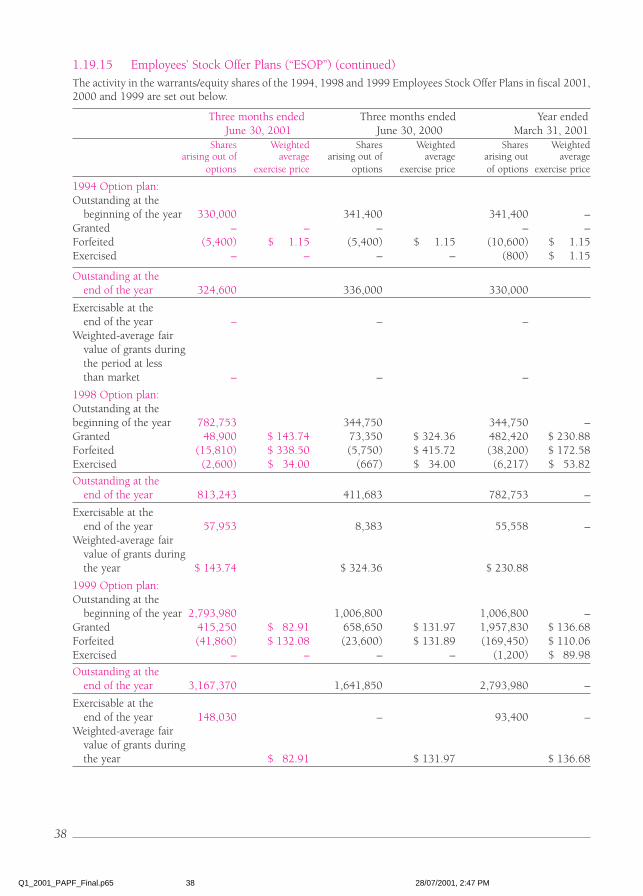
38
1.19.15 Employees’ Stock Offer Plans (“ESOP”) (continued)
The activity in the warrants/equity shares of the 1994, 1998 and 1999 Employees Stock Offer Plans in fiscal 2001,2000 and 1999 are set out below.
Three months ended Three months ended Year ended June 30, 2001 June 30, 2000 March 31, 2001
Shares Weighted Shares Weighted Shares Weightedarising out of average arising out of average arising out average
options exercise price options exercise price of options exercise price
1994 Option plan:Outstanding at the
beginning of the year 330,000 341,400 341,400 –Granted – – – – –Forfeited (5,400) $ 1.15 (5,400) $ 1.15 (10,600) $ 1.15Exercised – – – – (800) $ 1.15
Outstanding at theend of the year 324,600 336,000 330,000
Exercisable at theend of the year – – –
Weighted-average fairvalue of grants duringthe period at lessthan market – – –
1998 Option plan:Outstanding at thebeginning of the year 782,753 344,750 344,750 –Granted 48,900 $ 143.74 73,350 $ 324.36 482,420 $ 230.88Forfeited (15,810) $ 338.50 (5,750) $ 415.72 (38,200) $ 172.58Exercised (2,600) $ 34.00 (667) $ 34.00 (6,217) $ 53.82
Outstanding at theend of the year 813,243 411,683 782,753 –
Exercisable at theend of the year 57,953 8,383 55,558 –
Weighted-average fairvalue of grants duringthe year $ 143.74 $ 324.36 $ 230.88
1999 Option plan:Outstanding at the
beginning of the year 2,793,980 1,006,800 1,006,800 –Granted 415,250 $ 82.91 658,650 $ 131.97 1,957,830 $ 136.68Forfeited (41,860) $ 132.08 (23,600) $ 131.89 (169,450) $ 110.06Exercised – – – – (1,200) $ 89.98
Outstanding at theend of the year 3,167,370 1,641,850 2,793,980 –
Exercisable at theend of the year 148,030 – 93,400 –
Weighted-average fairvalue of grants duringthe year $ 82.91 $ 131.97 $ 136.68
Q1_2001_PAPF_Final.p65 28/07/2001, 2:47 PM38
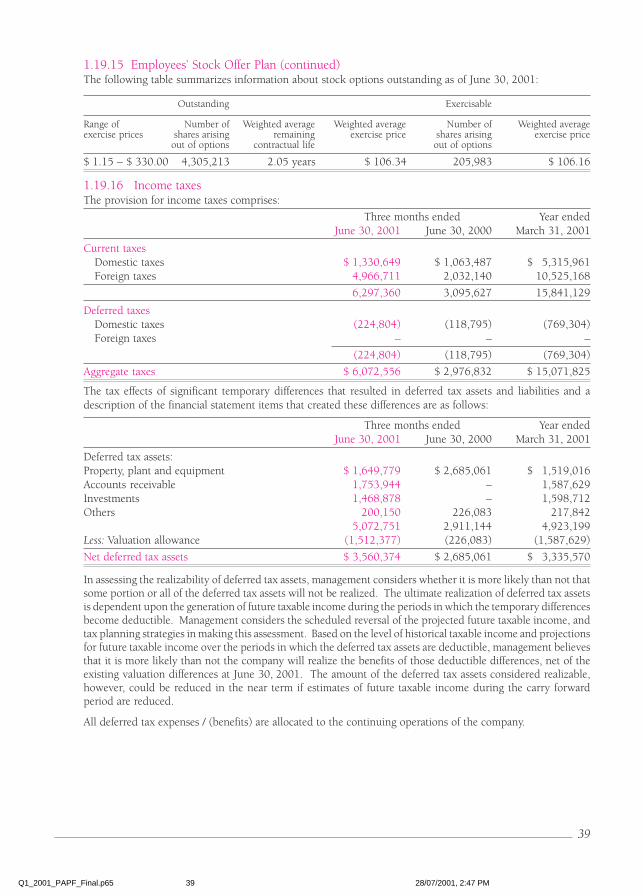
39
1.19.15 Employees’ Stock Offer Plan (continued)The following table summarizes information about stock options outstanding as of June 30, 2001:
Outstanding Exercisable
Range of Number of Weighted average Weighted average Number of Weighted averageexercise prices shares arising remaining exercise price shares arising exercise price
out of options contractual life out of options
$ 1.15 – $ 330.00 4,305,213 2.05 years $ 106.34 205,983 $ 106.16
1.19.16 Income taxesThe provision for income taxes comprises:
Three months ended Year endedJune 30, 2001 June 30, 2000 March 31, 2001
Current taxesDomestic taxes $ 1,330,649 $ 1,063,487 $ 5,315,961Foreign taxes 4,966,711 2,032,140 10,525,168
6,297,360 3,095,627 15,841,129
Deferred taxesDomestic taxes (224,804) (118,795) (769,304)Foreign taxes – – –
(224,804) (118,795) (769,304)
Aggregate taxes $ 6,072,556 $ 2,976,832 $ 15,071,825
The tax effects of significant temporary differences that resulted in deferred tax assets and liabilities and adescription of the financial statement items that created these differences are as follows:
Three months ended Year endedJune 30, 2001 June 30, 2000 March 31, 2001
Deferred tax assets:Property, plant and equipment $ 1,649,779 $ 2,685,061 $ 1,519,016Accounts receivable 1,753,944 – 1,587,629Investments 1,468,878 – 1,598,712Others 200,150 226,083 217,842
5,072,751 2,911,144 4,923,199Less: Valuation allowance (1,512,377) (226,083) (1,587,629)
Net deferred tax assets $ 3,560,374 $ 2,685,061 $ 3,335,570
In assessing the realizability of deferred tax assets, management considers whether it is more likely than not thatsome portion or all of the deferred tax assets will not be realized. The ultimate realization of deferred tax assetsis dependent upon the generation of future taxable income during the periods in which the temporary differencesbecome deductible. Management considers the scheduled reversal of the projected future taxable income, andtax planning strategies in making this assessment. Based on the level of historical taxable income and projectionsfor future taxable income over the periods in which the deferred tax assets are deductible, management believesthat it is more likely than not the company will realize the benefits of those deductible differences, net of theexisting valuation differences at June 30, 2001. The amount of the deferred tax assets considered realizable,however, could be reduced in the near term if estimates of future taxable income during the carry forwardperiod are reduced.
All deferred tax expenses / (benefits) are allocated to the continuing operations of the company.
Q1_2001_PAPF_Final.p65 28/07/2001, 2:47 PM39
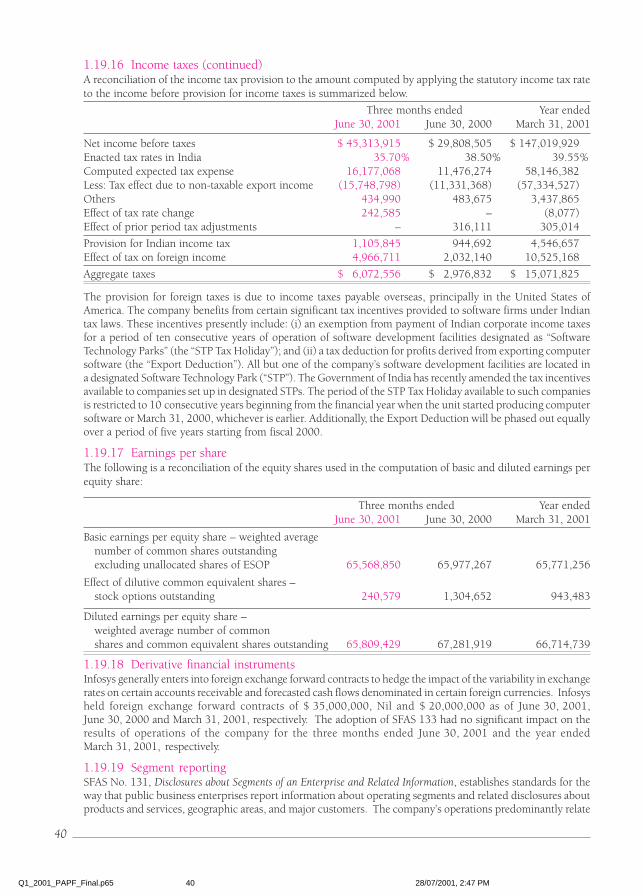
40
1.19.16 Income taxes (continued)A reconciliation of the income tax provision to the amount computed by applying the statutory income tax rateto the income before provision for income taxes is summarized below.
Three months ended Year endedJune 30, 2001 June 30, 2000 March 31, 2001
Net income before taxes $ 45,313,915 $ 29,808,505 $ 147,019,929Enacted tax rates in India 35.70% 38.50% 39.55%Computed expected tax expense 16,177,068 11,476,274 58,146,382Less: Tax effect due to non-taxable export income (15,748,798) (11,331,368) (57,334,527)Others 434,990 483,675 3,437,865Effect of tax rate change 242,585 – (8,077)Effect of prior period tax adjustments – 316,111 305,014
Provision for Indian income tax 1,105,845 944,692 4,546,657Effect of tax on foreign income 4,966,711 2,032,140 10,525,168
Aggregate taxes $ 6,072,556 $ 2,976,832 $ 15,071,825
The provision for foreign taxes is due to income taxes payable overseas, principally in the United States ofAmerica. The company benefits from certain significant tax incentives provided to software firms under Indiantax laws. These incentives presently include: (i) an exemption from payment of Indian corporate income taxesfor a period of ten consecutive years of operation of software development facilities designated as “SoftwareTechnology Parks” (the “STP Tax Holiday”); and (ii) a tax deduction for profits derived from exporting computersoftware (the “Export Deduction”). All but one of the company’s software development facilities are located ina designated Software Technology Park (“STP”). The Government of India has recently amended the tax incentivesavailable to companies set up in designated STPs. The period of the STP Tax Holiday available to such companiesis restricted to 10 consecutive years beginning from the financial year when the unit started producing computersoftware or March 31, 2000, whichever is earlier. Additionally, the Export Deduction will be phased out equallyover a period of five years starting from fiscal 2000.
1.19.17 Earnings per shareThe following is a reconciliation of the equity shares used in the computation of basic and diluted earnings perequity share:
Three months ended Year endedJune 30, 2001 June 30, 2000 March 31, 2001
Basic earnings per equity share – weighted averagenumber of common shares outstandingexcluding unallocated shares of ESOP 65,568,850 65,977,267 65,771,256
Effect of dilutive common equivalent shares –stock options outstanding 240,579 1,304,652 943,483
Diluted earnings per equity share –weighted average number of commonshares and common equivalent shares outstanding 65,809,429 67,281,919 66,714,739
1.19.18 Derivative financial instrumentsInfosys generally enters into foreign exchange forward contracts to hedge the impact of the variability in exchangerates on certain accounts receivable and forecasted cash flows denominated in certain foreign currencies. Infosysheld foreign exchange forward contracts of $ 35,000,000, Nil and $ 20,000,000 as of June 30, 2001,June 30, 2000 and March 31, 2001, respectively. The adoption of SFAS 133 had no significant impact on theresults of operations of the company for the three months ended June 30, 2001 and the year endedMarch 31, 2001, respectively.
1.19.19 Segment reportingSFAS No. 131, Disclosures about Segments of an Enterprise and Related Information, establishes standards for theway that public business enterprises report information about operating segments and related disclosures aboutproducts and services, geographic areas, and major customers. The company’s operations predominantly relate
Q1_2001_PAPF_Final.p65 28/07/2001, 2:47 PM40
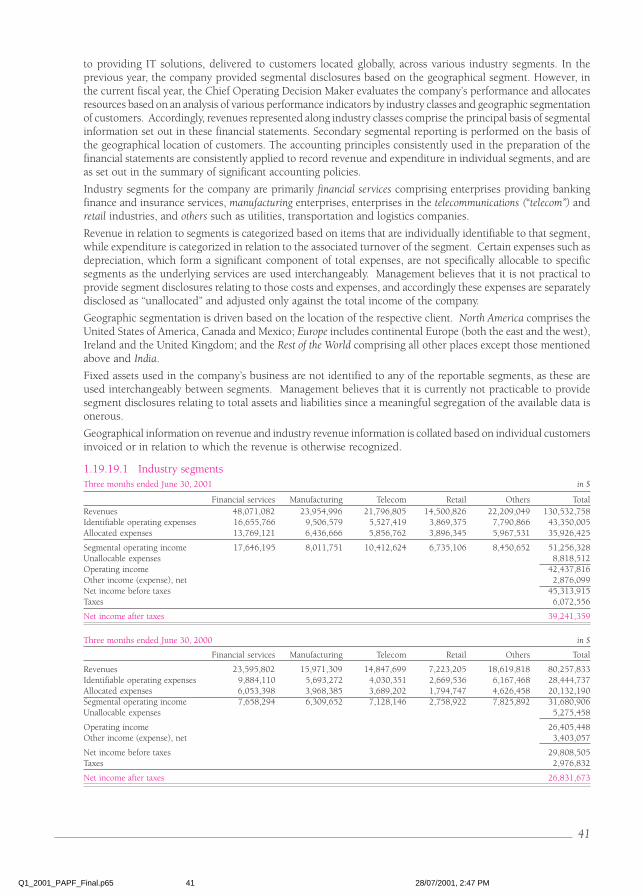
41
to providing IT solutions, delivered to customers located globally, across various industry segments. In theprevious year, the company provided segmental disclosures based on the geographical segment. However, inthe current fiscal year, the Chief Operating Decision Maker evaluates the company’s performance and allocatesresources based on an analysis of various performance indicators by industry classes and geographic segmentationof customers. Accordingly, revenues represented along industry classes comprise the principal basis of segmentalinformation set out in these financial statements. Secondary segmental reporting is performed on the basis ofthe geographical location of customers. The accounting principles consistently used in the preparation of thefinancial statements are consistently applied to record revenue and expenditure in individual segments, and areas set out in the summary of significant accounting policies.
Industry segments for the company are primarily financial services comprising enterprises providing bankingfinance and insurance services, manufacturing enterprises, enterprises in the telecommunications (“telecom”) andretail industries, and others such as utilities, transportation and logistics companies.
Revenue in relation to segments is categorized based on items that are individually identifiable to that segment,while expenditure is categorized in relation to the associated turnover of the segment. Certain expenses such asdepreciation, which form a significant component of total expenses, are not specifically allocable to specificsegments as the underlying services are used interchangeably. Management believes that it is not practical toprovide segment disclosures relating to those costs and expenses, and accordingly these expenses are separatelydisclosed as “unallocated” and adjusted only against the total income of the company.
Geographic segmentation is driven based on the location of the respective client. North America comprises theUnited States of America, Canada and Mexico; Europe includes continental Europe (both the east and the west),Ireland and the United Kingdom; and the Rest of the World comprising all other places except those mentionedabove and India.
Fixed assets used in the company’s business are not identified to any of the reportable segments, as these areused interchangeably between segments. Management believes that it is currently not practicable to providesegment disclosures relating to total assets and liabilities since a meaningful segregation of the available data isonerous.
Geographical information on revenue and industry revenue information is collated based on individual customersinvoiced or in relation to which the revenue is otherwise recognized.
1.19.19.1 Industry segmentsThree months ended June 30, 2001 in $
Financial services Manufacturing Telecom Retail Others TotalRevenues 48,071,082 23,954,996 21,796,805 14,500,826 22,209,049 130,532,758Identifiable operating expenses 16,655,766 9,506,579 5,527,419 3,869,375 7,790,866 43,350,005Allocated expenses 13,769,121 6,436,666 5,856,762 3,896,345 5,967,531 35,926,425
Segmental operating income 17,646,195 8,011,751 10,412,624 6,735,106 8,450,652 51,256,328Unallocable expenses 8,818,512Operating income 42,437,816Other income (expense), net 2,876,099Net income before taxes 45,313,915Taxes 6,072,556
Net income after taxes 39,241,359
Three months ended June 30, 2000 in $
Financial services Manufacturing Telecom Retail Others Total
Revenues 23,595,802 15,971,309 14,847,699 7,223,205 18,619,818 80,257,833Identifiable operating expenses 9,884,110 5,693,272 4,030,351 2,669,536 6,167,468 28,444,737Allocated expenses 6,053,398 3,968,385 3,689,202 1,794,747 4,626,458 20,132,190Segmental operating income 7,658,294 6,309,652 7,128,146 2,758,922 7,825,892 31,680,906Unallocable expenses 5,275,458
Operating income 26,405,448Other income (expense), net 3,403,057
Net income before taxes 29,808,505Taxes 2,976,832
Net income after taxes 26,831,673
Q1_2001_PAPF_Final.p65 28/07/2001, 2:47 PM41
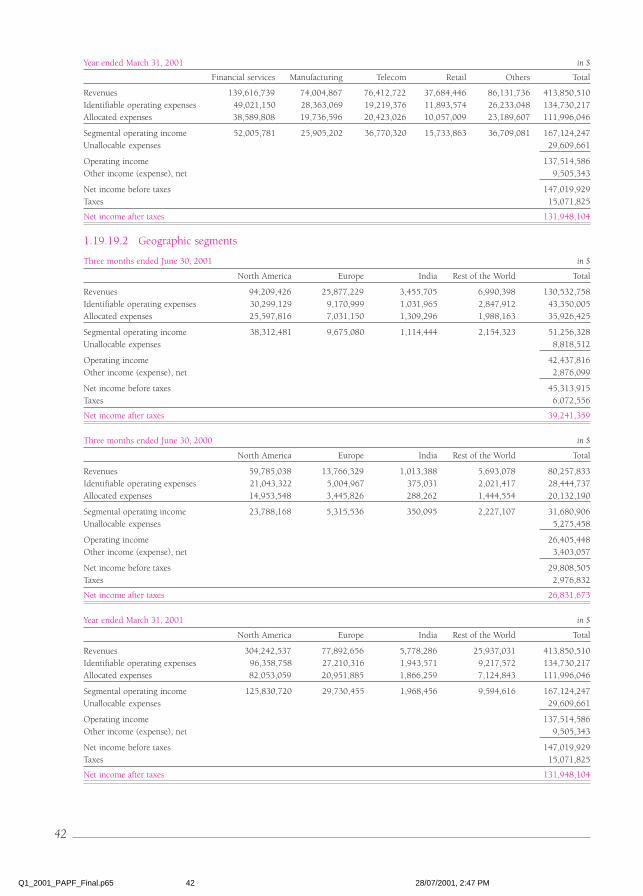
42
Year ended March 31, 2001 in $
Financial services Manufacturing Telecom Retail Others Total
Revenues 139,616,739 74,004,867 76,412,722 37,684,446 86,131,736 413,850,510Identifiable operating expenses 49,021,150 28,363,069 19,219,376 11,893,574 26,233,048 134,730,217Allocated expenses 38,589,808 19,736,596 20,423,026 10,057,009 23,189,607 111,996,046
Segmental operating income 52,005,781 25,905,202 36,770,320 15,733,863 36,709,081 167,124,247Unallocable expenses 29,609,661
Operating income 137,514,586Other income (expense), net 9,505,343
Net income before taxes 147,019,929Taxes 15,071,825
Net income after taxes 131,948,104
1.19.19.2 Geographic segments
Three months ended June 30, 2001 in $
North America Europe India Rest of the World Total
Revenues 94,209,426 25,877,229 3,455,705 6,990,398 130,532,758Identifiable operating expenses 30,299,129 9,170,999 1,031,965 2,847,912 43,350,005Allocated expenses 25,597,816 7,031,150 1,309,296 1,988,163 35,926,425
Segmental operating income 38,312,481 9,675,080 1,114,444 2,154,323 51,256,328Unallocable expenses 8,818,512
Operating income 42,437,816Other income (expense), net 2,876,099
Net income before taxes 45,313,915Taxes 6,072,556
Net income after taxes 39,241,359
Three months ended June 30, 2000 in $
North America Europe India Rest of the World Total
Revenues 59,785,038 13,766,329 1,013,388 5,693,078 80,257,833Identifiable operating expenses 21,043,322 5,004,967 375,031 2,021,417 28,444,737Allocated expenses 14,953,548 3,445,826 288,262 1,444,554 20,132,190
Segmental operating income 23,788,168 5,315,536 350,095 2,227,107 31,680,906Unallocable expenses 5,275,458
Operating income 26,405,448Other income (expense), net 3,403,057
Net income before taxes 29,808,505Taxes 2,976,832
Net income after taxes 26,831,673
Year ended March 31, 2001 in $
North America Europe India Rest of the World Total
Revenues 304,242,537 77,892,656 5,778,286 25,937,031 413,850,510Identifiable operating expenses 96,358,758 27,210,316 1,943,571 9,217,572 134,730,217Allocated expenses 82,053,059 20,951,885 1,866,259 7,124,843 111,996,046
Segmental operating income 125,830,720 29,730,455 1,968,456 9,594,616 167,124,247Unallocable expenses 29,609,661
Operating income 137,514,586Other income (expense), net 9,505,343
Net income before taxes 147,019,929Taxes 15,071,825
Net income after taxes 131,948,104
Q1_2001_PAPF_Final.p65 28/07/2001, 2:47 PM42
43
1.19.19.3 Significant clientsNo clients individually accounted for more than 10% of the revenues in fiscal 2001, 2000 and 1999, respectively.
1.19.20 Commitments and contingenciesThe company has outstanding performance guarantees for various statutory purposes totaling $ 2,547,989,$ 1,279,794 and $ 1,126,611, as of June 30, 2001 and 2000 and March 31, 2001, respectively. These guaranteesare generally provided to governmental agencies.
1.19.21 LitigationThe company is subject to legal proceedings and claims, which have arisen, in the ordinary course of itsbusiness. These actions, when ultimately concluded and determined, will not, in the opinion of management,have a material effect on the results of operations or the financial position of the company.
1.19.22 Non-monetary transactionDuring the year ended March 31, 2001, the company transferred certain Intellectual Property Rights (“IPR”)that it had developed and owned in a product called OnScan to OnMobile Systems Inc. (formerly OnScan, Inc).OnScan is a comprehensive web-enabled wireless notification product. In exchange for the transfer, the companyreceived consideration in the form of securities including 100,000 Common Stock, par value $ 0.001 each,100,000 Series A Voting Convertible Preferred Stock, par value $ 0.001 each and 4,400,000 Series A NonvotingConvertible Preferred Stock, par value $ 0.001 each. Convertible Preferred Stock is convertible into CommonStock automatically upon the closing of an Initial Public Offering by OnMobile Systems Inc. As of June 30, 2001,the company’s controlling interest in Onmobile Systems, Inc. was approximately 12%. The transfer was recordedat historic cost and, accordingly, no gain was recognized on this transaction as of the date of transfer of the IPR.
Item 2. Management Discussion and Analysis of Financial Conditions and Resultsof Operations
Investors are cautioned that this discussion contains forward-looking statements that involve risks anduncertainties. When used in this discussion, the words “anticipate”, “believe”, “estimate”, “intend”, “will” and“expect” and other similar expressions as they relate to the company or its business are intended to identifysuch forward-looking statements. The company undertakes no obligation to publicly update or revise anyforward-looking statements, whether as a result of new information, future events, or otherwise. Actual results,performances or achievements could differ materially from those expressed or implied in such forward-lookingstatements. Factors that could cause or contribute to such differences include those described under the heading“Risk Factors” in the Prospectus filed with the SEC, the factors discussed in the Form 20-F filed with the SEC,and those factors discussed elsewhere in this report. Readers are cautioned not to place undue reliance on theseforward-looking statements that speak only as of their dates. The following discussion and analysis should beread in conjunction with the company’s financial statements included herein and the notes thereto.
2.1 OverviewInfosys, an India-based IT consulting and services company formed in 1981, provides end-to-end consulting forglobal corporations. The company has partnered with several Fortune 500 and emerging companies in buildingtheir next generation information infrastructure for competitive advantage. Infosys’ portfolio of services includese-strategy consulting and solutions, maintenance and re-engineering services, large application development andenterprise integration services. Infosys also has product co-development initiatives with numerous communicationand Internet infrastructure companies that are creating the building blocks of the digital economy. In addition, thecompany develops and markets certain software products. The company utilizes an extensive offshore infrastructureincluding dedicated offshore software development centers (“OSDCs”) to provide managed software solutions toclients worldwide. From fiscal 1997 through fiscal 2001, total revenue increased from $ 39.6 million to$ 413.8 million, the number of the company’s software professionals worldwide increased from approximately1,410 to approximately 8,660, and the number of its India-based software development centers increased from sixto sixteen. The company also operationalized proximity development centers in Croydon in the UK and in Chicago,New Jersey and Phoenix in the U.S. in fiscal 2001, and one global development center in Toronto, Canada and twoproximity development centers in Fremont and Boston in the U.S. in fiscal 2000.
The company’s revenues are generated principally from software services provided either on a fixed-price,fixed-time frame or a time-and-materials basis. Revenues from services provided on a time-and-materials basisare recognized in the month that services are provided and related costs are incurred. Revenues from services
Q1_2001_PAPF_Final.p65 28/07/2001, 2:47 PM43
44
provided on a fixed-price, fixed-time frame basis are recognized upon the achievement of specified milestonesidentified in the related contracts, in accordance with the percentage of completion method. Cost of completionestimates are subject to periodic revisions. Although the company has revised its project completion estimatesfrom time to time, such revisions have not, to date, had a material adverse effect on the company’s operatingresults or financial condition. Since the company bears the risk of cost overruns and inflation with respect to itsfixed-price, fixed-time frame projects, the company’s operating results could be adversely affected by inaccurateestimates of contract completion costs and dates, including wage inflation rates and currency exchange ratesthat may affect cost projections. The company also develops and markets certain software products, includingbanking software that is licensed primarily to clients in Asia and Africa. Such software products represented3.3% of total revenue during the three months ended June 30, 2001. The company derived 72.2% of its totalrevenue from North America, 19.8% from Europe, 2.6% from India and 5.4% from the rest of the world duringthe three months ended June 30, 2001.
During the three months ended June 30, 2001 and June 30, 2000, the company derived 23.0% and 28.7% ofits total revenue, respectively, from internet and e-commerce projects. Due to shorter time-to-marketconsiderations, e-business projects necessitate higher interaction with clients. This results in a higher proportionof services being performed at client sites. Services performed at a client site typically generate higher percapita revenues, but lower gross margins, than the same quantum of services performed at the company’s ownfacilities. Consequently, any increase in work at client sites can decrease gross margins of the company.
Cost of revenue consists, primarily, of salary and other compensation expenses, depreciation, data communicationexpenses, computer maintenance, cost of software purchased for internal use, certain pre-opening expenses fornew software development centers, and foreign travel expenses. The company depreciates personal computersand servers over two years and mainframe computers over three years. Third party software is expensed in theperiod in which it is acquired.
The company assumes full project management responsibility for each project that it undertakes. Approximately69% of the work on a project during the quarter ended June 30, 2001 was performed at the company’s facilitiesin India, and the balance of the work was performed at the client site. The proportion of work performed atcompany facilities and at client sites varies from quarter to quarter. The company charges higher rates andincurs higher compensation expenses for work performed at a client site. Services performed at a client sitetypically generate higher revenues per capita, but lower gross margins, than the same quantum of servicesperformed at the company’s facilities in India. As a result, total revenues, cost of revenues and gross profit inabsolute terms, and as a percentage of revenues, fluctuate from quarter to quarter based on the proportion ofwork performed offshore at company facilities and at client sites.
Revenue and gross profits are also affected by employee utilization rates. Utilization rates depend, among otherfactors, on the number of employees enrolled for in-house training programs, particularly the 14-week classroomtraining course provided to new employees. Generally a large percentage of new hires begin their training in thesecond quarter, utilization rates have historically been lower in the second and third quarters of a fiscal year.
Selling and marketing expenses primarily consist of expenses relating to advertisements, brand building, rentalsof sales and marketing offices, salaries of marketing personnel, and travel and conveyance. General andadministrative expenses consist of expenses relating to communications, finance and administration, legal andprofessional charges, management, rent, salary and other compensation, travel and miscellaneous administrativecosts.
Other income primarily includes interest income and foreign currency exchange gains.
The company also intends to substantially expand its software development infrastructure in India. The companyhad committed $ 30.5 million towards various capital acquisitions as of June 30, 2001. The company has notyet made contractual commitments for the majority of its budgeted capital expenditure. The company intendsto spend an aggregate amount of approximately $ 60 million on various capital acquisitions for the rest of fiscal2002 and intends to use its internal accruals to fund this expansion.
2.2 Results of operations
2.2.1 Three months ended June 30, 2001 compared to three months ended June 30, 2000Revenues. Total revenues were $ 130.5 million for the three months ended June 30, 2001, representing anincrease of 62.6% over total revenues of $ 80.3 million during the same period in the fiscal 2001. This increaseis attributable to an increase in volumes of business transacted of $ 40.4 million or 50.3%, and an increase inprices at which contracts were executed in the amount of $ 9.9 million or 12.3%. Custom software development,
Q1_2001_PAPF_Final.p65 28/07/2001, 2:47 PM44
45
re-engineering, maintenance and software development through Offshore Software Development Centers(“OSDC”) formed a majority of the company’s revenues. The increase in revenues was attributable, in part, to anincrease in business from certain existing clients and from certain new clients, particularly in the insurance,banking and financial services, and retailing industries. Revenues from insurance, banking and financial servicesclients comprised 36.8% and 29.4% of revenues in the three months ended June 30, 2001 and 2000, respectively.Revenues from retailing clients comprised 11.1% and 9.0% of revenues in the three months ended June 30, 2001and 2000, respectively. Net sales of Finacle™ and other products represented 3.3% of total revenues for thethree months ended June 30, 2001 as compared to 2.4% in the corresponding period in fiscal 2001. Revenuefrom services represented 96.7% of total revenues for the three months ended June 30, 2001 as compared to97.6% in the corresponding period in fiscal 2001. Revenue from fixed-price, fixed-time frame and time-and-materials contracts represented 27.0% and 73.0%, respectively, of total revenues in the three months endedJune 30, 2001 as compared to 26.6% and 73.4%, respectively, in the three months ended June 30, 2000.Revenue from North America and Europe represented 72.2% and 19.8%, respectively, of total revenue for thethree months ended June 30, 2001 as compared to 74.5% and 17.2%, respectively, during the same period infiscal 2001.Cost of Revenues. Cost of revenues was $ 68.4 million for the three months ended June 30, 2001, representingan increase of 63.0% over the cost of revenues of $ 42.0 million for the same period in fiscal 2001. Cost ofrevenues represented 52.4% and 52.3% of total revenues for the three months ended June 30, 2001 and June30, 2000, respectively. This marginal increase in costs as a percentage of revenues was attributable to an increasein personnel costs from annual salary increments effective April 1, 2001 and increased personnel costs for newhires. This increase in personnel costs was partially offset by a decrease in foreign travel and computer maintenanceexpenses, which represented 2.8% and 4.9% of revenues for the three months ended June 30, 2001 and 2000,respectively as well as a decrease in overseas short-term allowances, which represented 1.9% and 4.2% ofrevenues for the three months ended June 30, 2001 and 2000, respectively.
Gross Profit. As a result of the foregoing, the gross profit was $ 62.1 million for the three months ended June30, 2001 representing an increase of 62.2% over gross profit of $ 38.3 million for the three months ended June30, 2000. As a percentage of total revenues, gross profit marginally decreased to 47.6% for the three monthsended June 30, 2001 from 47.7% for the corresponding period in fiscal 2001. This marginal decrease in grossmargins was attributable to an increase in personnel costs from annual salary increments effective April 1, 2001and increased personnel costs for new hires. This increase in personnel costs was partially offset by a decreasein foreign travel and computer maintenance expenses, as well as a decrease in overseas short-term allowances.
Selling and Marketing Expenses. Sales and marketing expenses were $ 5.9 million in the three months endedJune 30, 2001, an increase of 40.4% over sales and marketing expenses of $ 4.2 million in the three monthsended June 30, 2000. As a percentage of total revenues, sales and marketing expenses decreased to 4.5% in thethree months ended June 30, 2001 from 5.2% in the three months ended June 30, 2000. This decrease isprimarily due to the benefit of scale of operations, and a reduction in advertisement and brand building expensesamounting to 0.4% of revenues for the three months ended June 30, 2001 as compared to 0.7% of revenues forthe three months ended June 30, 2000. This decrease was partially offset by an increase in the number ofmarketing offices and sales personnel. The number of sales offices increased to 26 as of June 30, 2001, up from22 as of June 30, 2000 and the number of sales and marketing personnel increased to122, up from 80 as ofJune 30, 2000.General and Administrative Expenses. General and administrative expenses were $ 12.5 million for the threemonths ended June 30, 2001, representing an increase of 95.2% over general and administrative expenses of$ 6.4 million for the three months ended June 30, 2000. General and administrative expenses were 9.6% and8.0% of total revenues for the three months ended June 30, 2001 and 2000, respectively. This increase ingeneral and administrative expenses as a percentage of revenues was primarily attributable to an increase in theprovision for doubtful debts, which comprised 1.1% of revenues during the three-month period ended June30, 2001 as compared to 0.1% in the corresponding previous period as well as increases in management,finance, administrative and occupancy costs due to an increase in scale of operations.
Amortization of Stock Compensation Expense. Amortization of deferred stock compensation expense was$ 1.3 million in each of the three months ended June 30, 2001 and 2000, respectively. Deferred stockcompensation expense reflects the continued amortization of compensation expense from stock purchase rightsgranted in prior periods.
Operating Income. Operating income was $ 42.4 million for the three months ended June 30, 2001, an increaseof 60.6% over the operating income of $ 26.4 million for the corresponding period in fiscal 2001. As a percentage
Q1_2001_PAPF_Final.p65 28/07/2001, 2:47 PM45
46
of revenues, operating income decreased to 32.5% for the three months ended June 30, 2001 from 32.9% forthe corresponding period in fiscal 2001. Excluding the amortization of deferred stock compensation expense,the operating margin was 33.5% for the three months ended June 30, 2001 as compared to 34.5% for the threemonths ended June 30, 2000.
Other Income. Other income was $ 2.9 million for the three months ended June 30, 2001 as compared to$ 3.4 million for the corresponding period in fiscal 2001. Other income during the three months ended June30, 2001 includes $ 0.1 million arising from exchange differences on translation of foreign currency depositsand interest income of $ 2.5 million earned on deposits of surplus funds. Other income for the three monthsended June 30, 2000 includes $ 1.7 million arising from exchange differences on translation of foreign currencydeposits and interest income of $ 1.7 million earned on deposits of surplus funds.
Provision for Income Taxes. Provision for income taxes was $ 6.1 million for the three months ended June 30,2001 as compared to $ 3.0 million for the corresponding period in fiscal 2001. The company’s effective tax rateincreased to 13.5% for the three months ended June 30, 2001 as compared to 10.1% for the correspondingperiod in fiscal 2001. This increase in effective tax rate is primarily attributable to an increase in foreign taxespaid in respect of the overseas operations of the company in the three months ended June 30, 2001 as comparedto the three months ended June 30, 2000 as well as an increase in taxable income earned on deposit of surplusfunds. Overseas operations of the Company contribute 50.5% of revenues in the three months ended June 30,2001 as compared to 48.3% of revenues in the three months ended June 30, 2000. Income earned from thedeposit of surplus funds was $ 2.5 million and $ 1.7 million in the three months ended June 30, 2001, 2000respectively.
Net Income. Net income was $ 39.2 million for the three months ended June 30, 2001, an increase of 46.3%over net income of $ 26.8 million for the corresponding period in fiscal 2001. As a percentage of total revenues,net income decreased to 30.1% for the three months ended June 30, 2001 from 33.4% for the correspondingperiod in fiscal 2001.
2.3 Liquidity and capital resources
The growth of the company has been financed largely from cash generated from operations and, to a lesserextent, from the proceeds of equity issues and borrowings. In 1993, the company raised approximately$ 4.4 million in gross aggregate proceeds from its initial public offering of equity shares on Indian stock exchanges.In 1994, the company raised an additional $ 7.7 million through private placements of its equity shares withforeign institutional investors, mutual funds, Indian domestic financial institutions and corporations. In 1999,the company raised $ 66.3 million through the issue of American Depositary Shares (“ADS”). As of June 30,2001, the company had $ 134.2 million in cash and cash equivalents, $ 184.1 million in working capital andno outstanding bank borrowings. The company’s treasury policy calls for investing only in highly rated banks,financial institutions and companies for short maturities with a limit for individual entities. The companyretains the money both in rupee and foreign currency accounts. The bank balances in overseas accounts aremaintained to meet the expenditure of the overseas branches in the U.S. and other countries, and to meetproject-related expenditure overseas.Net cash provided by operating activities was $ 48.9 million and $ 20.6 million in the three months endedJune 30, 2001 and 2000, respectively. Net cash provided by operations consisted primarily of net income offset,in part, by an increase in accounts receivable. Accounts receivable as a percentage of total revenues, represented12.6% and 15.9% as of June 30, 2001 and 2000, respectively. Further, the average days outstanding of accountsreceivable has increased in the 0-30 and 31-60 aging periods and decreased in the 61-90 and greater than90-day aging periods. The company’s policy on accounts receivable includes a periodic review of all such outstanding.The company reviews the age, amount, and quality of each account receivable; the relationship with, size of,and history of the client; and the quality of service delivered by the company for the client, to determine theclassification of an account receivable. Should the review so demand, the company classifies accounts receivableinto secured and unsecured accounts, further sub-classified between good and doubtful accounts. The companymakes provisions for all accounts receivable classified as doubtful and for all accounts receivable that areoutstanding for more than 180 days. Management continues pursuing the parties for recovery of dues, in partor full.
Prepaid expenses and other current assets decreased by $ 0.3 million during the three months endedJune 30, 2001 as compared to an increase of $ 0.5 million during the three months ended June 30, 2000,respectively. The decrease in the three months ended June 30, 2001 was primarily due to a decrease in rentdeposits and prepaid expenses, offset partially by an increase in costs in excess of billings and other advances.
Q1_2001_PAPF_Final.p65 28/07/2001, 2:47 PM46
47
The increase in the three months ended June 30, 2000 was primarily attributable to an increase in prepaidexpenses and costs in excess of billings. Costs in excess of billings represent costs incurred on fixed-pricecontracts in respect of which milestones are yet to be achieved.
Income taxes payable decreased by $ 2.0 million during the three months ended June 30, 2001, primarily dueto higher advance tax payments made during the period, as compared to an increase of $ 1.1 million during thethree months ended June 30, 2000. Other accrued liabilities increased by $ 3.8 million during the three monthsended June 30, 2001 as compared to a decrease of $ 1.9 million during the three months ended June 30, 2000.The increase of $ 3.8 million in other accrued liabilities during the three months ended June 30, 2001 is primarilyattributable to an increase in accrued staff compensation and employee withholding taxes payable amountingto $ 2.4 million and $ 1.6 million, respectively. The decrease of $ 1.9 million in other accrued liabilities duringthe three months ended June 30, 2000 is primarily attributable to a decrease in accrued staff compensation andemployee withholding taxes payable amounting to $ 0.3 million and $ 1.4 million, respectively.
Unearned revenue as of June 30, 2001 was $ 7.7 million compared to $ 14.4 million as of June 30, 2000 andconsists primarily of advance client billings on fixed-price, fixed-time frame contracts for which related costswere not yet incurred. The proportion of fixed-price contracts was 27.0% and 26.6% of revenues for the threemonths ended June 30, 2001 and 2000 respectively.
Net cash used in investing activities was $ 24.7 million and $ 22.1 million in the three months ended June 30,2001 and 2000, respectively. Net cash used in investing activities in the three months ended June 30, 2001 and2000 consisted primarily of $ 20.6 million and $ 18.1 million, respectively, for property, plant and equipment.
Additionally, the company invested an aggregate amount of $ 2.2 million to purchase the capital stock ofWorkadia Inc., during the three months ended June 30, 2001. The company invested an aggregate amount of$ 3 million to purchase the capital stock of CiDRA Corporation during the three months ended June 30, 2000.
Publicly-traded Indian companies customarily pay dividends. The company paid cash dividends of $ 11.3 millionand $ 4.7 million in the three months ended June 30, 2001 and 2000 respectively.
As of June 30, 2001, the company had contractual commitments for capital expenditure of $ 30.5 million. Thecompany has not yet made contractual commitments for the majority of its budgeted capital expenditure. Thecompany intends to spend an aggregate amount of approximately $ 60 million on various capital expenditureduring fiscal 2002 and the same would be met out of the internal accruals of the company. In the opinion of thecompany, the working capital is sufficient for the company’s present requirements.
2.4 Reconciliation between U.S. and Indian GAAP
There are material differences between financial statements prepared as per Indian and U.S. GAAP. Thesedifferences arise due to accounting for stock-based compensation and non-recognition of unrealized gains ontransfers of intellectual property rights, as required by U.S. GAAP. Indian GAAP does not require amortizationof deferred stock compensation and permits the recognition of unrealized gains on transfers of intellectualproperty rights in the financial statements. Prior to April 1, 2001, Indian GAAP did not also require provisionfor deferred taxes.
Reconciliation of net income Three months ended June 30,2001 2000
Net profit as per Indian GAAP $ 40,501,114 $ 28,565,885Amortization of deferred stock compensation
expense under APB opinion number 25 (1,259,755) (1,275,796)Provision for retirement benefits to employees – 741,000Deferred income taxes – 118,795Provision for contingency / e-inventing the company – (87,387)Transfer of intellectual property rights (net of tax) – (1,230,824)
Net income as per US GAAP $ 39,241,359 $ 26,831,673
2.5 Investments
2.5.1 Yantra CorporationPrior to October 20, 1998, the company owned a majority of the voting stock of Yantra. As a result, all ofYantra’s operating losses through October 20, 1998 were recognized in the company’s consolidated financialstatements. For fiscal 1998 and fiscal 1999, Yantra’s losses recognized in the company’s financial statementswere $ 1.6 million and $ 2.0 million, respectively. On October 20, 1998, the company sold a portion of Yantra’s
Q1_2001_PAPF_Final.p65 28/07/2001, 2:47 PM47
48
shares held by it, thereby reducing its interest to less than one-half of the voting stock of Yantra. As of October 20,1998, the company owned all of the outstanding common stock of Yantra, but had no financial obligations orcommitments to Yantra and did not intend to extend Yantra with any financial support. Accordingly, Yantra’sresults after October 20, 1998 were not recognized in the company’s financial statements under U.S. GAAP.Yantra’s revenues were $ 1.3 million and $ 2.0 million for fiscal 1998 and for the period ended October 20,1998, respectively, while gross profits were $ 574,000 and $ 546,000, respectively, for these same periods.Yantra’s revenues were 1.9% and 2.3% of the company’s revenues for fiscal 1998 and for the period endedOctober 20, 1998, respectively. Its gross profits were 2.0% and 1.4% of the company’s gross profits for thesesame periods. Yantra currently provides e-commerce operations solutions through PureEcommerce™, a scalableweb-based solution that facilitates real-time transaction management across the extraprise. In June 1999, Yantrasold Series C Convertible Preferred Stock in the amount of $ 15 million to unrelated existing and new investors,reducing the company’s voting control to approximately 25%. In July 2000, Yantra sold Series D ConvertiblePreferred Stock amounting to $ 49 million, to unrelated existing and new investors, further reducing thecompany’s voting control to approximately 16% on a fully diluted basis.
2.5.2 Other investmentsDuring the three months ended June 30, 2001 the company also invested in Workadia Inc. a Delaware corporationby purchasing 440,000 shares of Series B Convertible Preferred Stock, par value US$ 0.001 per share, for anaggregate investment of US $2.2 million.
2.6 Principles of currency translation
In the three months ended June 30, 2001, over 94% of the company’s revenues were generated in U.S. dollarsand European currencies. A majority of the company’s expenses were incurred in Rupees, and the balance wasincurred in U.S. dollars and European currencies. The functional currency of the company is the Indian Rupee.Revenues generated in foreign currencies are translated into Indian rupees using the exchange rate prevailingon the dates revenues are recognized. Expenses of overseas operations incurred in foreign currencies are translatedinto Indian rupees at either the monthly average exchange rate or the exchange rate on the date the expense isincurred, depending on the source of payment. Assets and liabilities of foreign branches held in foreign currencyare translated into Indian rupees at the end of the applicable reporting period. For U.S. GAAP reporting, thefinancial statements are translated into U.S. dollars using the average monthly exchange rate for revenues andexpenses and the period end rate for assets and liabilities. The gains or losses from such translation are reportedas “Other comprehensive income”, a separate component of stockholders’ equity. The company expects that amajority of its revenues will continue to be generated in U.S. dollars for the foreseeable future and that asignificant portion of the company’s expenses, including personnel costs as well as capital and operatingexpenditures, will continue to be denominated in rupees. Consequently, the company’s results of operationswill be adversely affected to the extent that the rupee appreciates against the U.S. dollar.
2.7 Income Tax Matters
The company benefits from certain significant tax incentives provided to software firms under Indian tax laws.These incentives presently include: (i) an exemption from payment of Indian corporate income taxes for aperiod of ten consecutive years of operation of software development facilities designated as “Software TechnologyParks” (the “STP Tax Holiday”) beginning from the financial year when the unit started producing computersoftware, or March 31, 2000, whichever is earlier; and (ii) a tax deduction for profits derived from exportingcomputer software (the “Export Deduction”). All but one of the company’s software development facilities arelocated in a designated Software Technology Park (“STP”). Such Export Deduction will be phased out equallyover a period of five years starting from fiscal 2000. The benefits of these tax incentive programs have historicallyresulted in an effective tax rate for the company well below statutory rates. There is no assurance that theGovernment of India will continue to provide these incentives. The company pays corporate income tax inforeign countries on income derived from operations in those countries.
2.8 Effects of Inflation
The company’s most significant costs are salaries and related benefits for its employees. Competition in Indiaand the United States for IT professionals with the advanced technological skills necessary to perform theservices offered by the company have caused wages to increase at a rate greater than the general rate of inflation.As with other IT service providers, the company must adequately anticipate wage increases and other costincreases, particularly on its long-term contracts. Historically, the company’s wage costs in India have beensignificantly lower than prevailing wage costs in the United States for comparably-skilled employees, although
Q1_2001_PAPF_Final.p65 28/07/2001, 2:47 PM48
49
wage costs in India are presently increasing at a faster rate than in the United States. There can be no assurancethat the company will be able to recover cost increases through increases in the prices that it charges for itsservices in the United States.
2.9 Accounting Pronouncements
Effective April 1, 2001, the company adopted SFAS 133, Accounting for Derivative Instruments and HedgingActivities as amended, when the pronouncement became effective for companies with fiscal year ending March31, 2001. SFAS 133 changes the accounting treatment of derivative contracts (including foreign exchangecontracts) that are employed to manage risks. It establishes accounting and reporting standards for derivativeinstruments, including certain derivative instruments embedded in other contracts and for hedging activities.All derivatives, whether designated in hedging relationships or not, are required to be recorded on the balancesheet at fair value. The accounting treatment of changes in fair value is dependent upon whether or not aderivative instrument is designated as a hedge and if so, the type of hedge. If the derivative is designated as a fairvalue hedge, the changes in the fair value of the derivative and of the hedged item attributable to the hedgedrisk are recognized in earnings. If the derivative is designated as a cash flow hedge, the effective portions ofchanges in the fair value of the derivative are recorded in other comprehensive income and are recognized inthe income statement when the hedged item affects earnings. Ineffective portions of changes in the fair value ofcash flow hedges are recognized in earnings.
2.10 Risk factors
2.10.1 Management of growth
The company has experienced significant growth in recent periods. The company’s revenues in the three monthsended June 30, 2001 grew by 62.6% over the three months ended June 30, 2000. As of June 30, 2001, thecompany employed approximately 8,720 software professionals worldwide with 16 software developmentfacilities in India, six proximity development centers in the United Kingdom and the U.S., and one globaldevelopment center in Canada, as compared to approximately 5,590 with 18 facilities in India and abroad as ofJune 30, 2000. In fiscal 2001 and 2000, the company approved major expansions to its existing facilities andthe building of new facilities. The company’s growth is expected to place significant demands on its managementand other resources and will require it to continue to develop and improve its operational, financial and otherinternal controls, both in India and elsewhere. In particular, continued growth increases the challenges involvedin: recruiting and retaining sufficient skilled technical, marketing and management personnel; providing adequatetraining and supervision to maintain the company’s high quality standards; and preserving the company’sculture and values and its entrepreneurial environment. The company’s inability to manage its growth effectivelycould have a material adverse effect on the quality of the company’s services and projects, its ability to attractclients as well as skilled personnel, its business prospects, and its results of operations and financial condition.
2.10.2 Potential fluctuations in future operating results
Historically, the company’s operating results have fluctuated, and may continue to fluctuate in future, dependingon a number of factors, including: the size, timing and profitability of significant projects; the proportion ofservices that are performed at client sites rather than at the company’s offshore facilities; the accuracy of estimatesof resources and time required to complete ongoing projects, particularly projects performed under fixed-price,fixed-time frame contracts; a change in the mix of services provided to its clients or in the relative proportion ofservices and product revenues; the timing of tax holidays and other Government of India incentives; the effectof seasonal hiring patterns and the time required to train and productively utilize new employees; the size andtiming of facilities expansion; unanticipated increases in wage rates; the company’s success in expanding itssales and marketing programs; currency exchange rate fluctuations and other general economic factors. A highpercentage of the company’s operating expenses, particularly personnel and facilities, are fixed in advance ofany particular quarter. As a result, unanticipated variations in the number and timing of the company’s projectsor in employee utilization rates may cause significant variations in operating results in any particular quarter.The company believes that period-to-period comparisons of its results of operations are not necessarily meaningfuland should not be relied upon as indications of future performance. Due to all of the foregoing factors, it ispossible that in some future quarter the company’s operating results may be below the expectations of publicmarket analysts and investors. In such event, the market price of the company’s equity shares and ADSs arelikely to be materially adversely affected.
Q1_2001_PAPF_Final.p65 28/07/2001, 2:47 PM49
50
2.10.3 Impact of a slowdown in IT spending in the U.S.Historically, a significant portion of the company’s revenues was derived from the U.S. For example, in fiscal 2001and 2000, approximately 70.0% and 73.8% of the company’s revenues were derived from the U.S. Currentlythere are indications of an economic slowdown in the U.S. Accordingly, the IT services sector in the U.S. mayexperience some adjustment as a result of the economy. The continued growth of companies in this sector willdepend upon their ability to adapt to the changes in the market and justify their customer’s investments in newprojects that will drive customer retention up and costs down. Consequently, the company’s competitors mayreduce contract prices to retain customers and win new contracts. This may affect the company’s ability to winnew clients and retain existing clients as well as the company’s ability to sustain its current pricing strategy. Aninability to retain current pricing structures, retain clients or win new client contracts may result in lowerrevenue growth and lower profit margins for the company. Due to all of the foregoing factors, it is possible thatin some future quarter the company’s operating results may be below the expectations of public market analystsand investors. In such event, the market price of the equity shares and ADSs are likely to be materially adverselyaffected.
2.10.4 Exposure to industry segmentsThe company derives a significant proportion of its revenues from certain industry segments. For example, infiscal 2001 the company derived 33.7% and 18.4% of its revenues from the insurance, banking and financialservices, and telecom industry segments respectively, as compared to 30.1% and 15.4%, respectively infiscal 2000. There are indications that the possible economic slowdown in the U.S. may impact the growthprospects of companies that operate in various industry segments, for example, the insurance, banking andfinancial services, and telecom industry segments. Consequently, these companies may reduce or entirely eliminatetheir IT spending, or postpone decisions regarding new expenditures with respect to IT spending. The companybelieves that a sustained reduction or elimination in IT spending by these such companies and a longer clientengagement time that such companies may adopt, may affect the company’s ability to win new clients andretain existing clients as well as the company’s ability to sustain its current pricing strategy. An inability to retaincurrent pricing structures, retain clients or win new client contracts may result in lower revenue growth andlower profit margins for the company. Due to all of the foregoing factors, it is possible that in some futurequarter the company’s operating results may be below the expectations of public market analysts and investors.In such event, the market price of the equity shares and ADSs are likely to be materially adversely affected.
2.10.5 Exposure to start-ups and venture funded companiesSeveral of the company’s clients are early stage, young companies with little or limited financing. For example,the company derived 10.8% of its revenues from such companies in fiscal 2001. The ability of such early stagecompanies to raise capital for operations and expansion plans has recently become more difficult as a result ofseveral factors, including the U.S. capital market declines and a slowing U.S. economy. Consequently, thesecompanies may reduce or entirely eliminate their IT spending, or postpone decisions regarding new expenditureswith respect to IT spending. The company believes that a sustained reduction or elimination in IT spending bythese such companies and a longer client engagement time that such companies may adopt, may affect thecompany’s ability to win new clients and retain existing clients as well as the company’s ability to sustain itscurrent pricing strategy. An inability to retain current pricing structures, retain clients or win new client contractsmay result in lower revenue growth and lower profit margins for the company. Additionally, such companiesmay become greater risks and not be able to adequately pay for past services rendered. Due to all of theforegoing factors, it is possible that in some future quarter the company’s operating results may be below theexpectations of public market analysts and investors. In such event, the market price of the equity shares andADSs are likely to be materially adversely affected.
2.10.6 Risks related to investments in Indian securitiesThe company is incorporated in India and substantially all of its assets, and a substantial majority of its employeesare located in India. Consequently, the company’s performance may be affected by changes in exchange ratesand controls, interest rates, Government of India policies, including taxation policy, as well as political, socialand economic developments affecting India.
Political and economic environment. During the past decade and particularly since 1991, the Government ofIndia has pursued policies of economic liberalization, including significant relaxations of restrictions on theprivate sector. Nevertheless, the role of the Indian central and state Governments in the Indian economy asproducers, consumers and regulators has remained significant. Additionally, since 1996, the Government ofIndia has changed three times. The current Government of India, formed in October 1999, has announced
Q1_2001_PAPF_Final.p65 28/07/2001, 2:47 PM50
51
policies and taken initiatives that support the continuation of the economic liberalization policies pursued byprevious governments and has, in addition, set up a special IT task force to promote the IT industry. However,the speed of economic liberalization could change, and specific laws and policies affecting IT companies,foreign investment, currency exchange rates and other matters affecting investment in the company’s securitiescould change as well. Further, there can be no assurance that the liberalization policies will continue in thefuture. A significant change in the Government of India’s economic liberalization and deregulation policiescould adversely affect business and economic conditions in India generally and the company’s business inparticular. South Asia has from time to time experienced instances of civil unrest and hostilities among neighboringcountries. Events of this nature in the future could influence the Indian economy and could have a materialadverse effect on the market for securities of Indian companies and on the business of the company.
Government of India incentives and regulation. The company benefits from a variety of incentives given tosoftware firms in India, such as relief from import duties on hardware, a tax exemption for income derived fromsoftware exports, and tax holidays and infrastructure support for companies, such as Infosys, operating inspecially designated “Software Technology Parks”. There can be no assurance that these incentives will continuein future. Further, there is a risk that changes in tax rates or laws affecting foreign investment, currency exchangerates or other regulations will render the Government of India’s regulatory scheme less favorable to the companyand could adversely affect the market price of the company’s equity shares and its ADSs. Should the regulationsand incentives promulgated by the Government of India become less favorable to the company, the company’sresults of operations and financial condition could be adversely affected.
Restrictions on foreign investment. Foreign investment in Indian securities is generally regulated by the ForeignExchange Management Act, 1999. In certain emerging markets, including India, Global Depositary Shares andADSs may trade at a discount or premium, as the case may be, to the underlying shares, in part because ofrestrictions on foreign ownership of the underlying shares. In addition, under current Indian laws and regulations,the Depositary can accept deposits of outstanding equity shares and issue ADRs evidencing ADSs representingsuch equity shares provided the shares so accepted for conversion into ADSs shall not exceed the number ofequity shares which were released by the custodian pursuant to conversions of ADSs into equity shares underthe Depositary Agreement. Therefore, a holder of ADSs who surrenders ADSs and withdraws equity shares isnot permitted subsequently to deposit such equity shares and obtain ADSs if such ADSs obtained on conversionare in excess of the ADSs originally converted or surrendered. This limited ability to convert equity shares intoADSs increases the probability that the price of the ADSs will not trade on par with the price of the equity sharesas quoted on the Indian stock exchanges. Holders who seek to sell in India any equity shares withdrawn fromthe depositary facility and to convert the rupee proceeds from such sale into foreign currency and repatriatesuch foreign currency from India will have to obtain Reserve Bank of India (“RBI”) approval for each suchtransaction. Further, under current Indian regulations and practice, the approval of the RBI is required for thesale of equity shares underlying ADSs by a non-resident of India to a resident of India as well as for renunciationof rights to a resident of India. There can be no assurance that any such approval can be obtained.
Exchange rate fluctuations. Market risks relating to the company’s operations result primarily from changes ininterest rates and changes in foreign exchange rates. The company’s functional currency is the Indian Rupeealthough it transacts a major portion of its business in foreign currencies and accordingly has foreign currencyexposure through its sales in the United States and purchases from overseas suppliers in U.S. dollars. In its U.S.operations, the company does not actively hedge against exchange rate fluctuations, although it may elect to doso in the future. Accordingly, changes in exchange rates may have a material adverse affect on the company’ssales, cost of services sold, gross margin and net income, any of which alone or in the aggregate may in turnhave a material adverse affect on the company’s business, operating results and financial condition. The exchangerate between the rupee and the U.S. dollar has changed substantially in recent years and may fluctuate substantiallyin the future. During the four-year period from March 31, 1997 through March 31, 2001, the value of the rupeeagainst the U.S. dollar declined by approximately 29.8%. For the three months ended June 30, 2001 and forfiscal 2001 and 2000, the company’s U.S. dollar-denominated revenues represented 87.0%, 89.5% and 88.3%,respectively, of total revenues. The company expects that a majority of its revenues will continue to be generatedin U.S. dollars for the foreseeable future and that a significant portion of the company’s expenses, includingpersonnel costs as well as capital and operating expenditures, will continue to be denominated in rupees.Consequently, the company’s results of operations will be adversely affected to the extent the rupee appreciatesagainst the U.S. dollar. The company has in the past sought to reduce the effect of exchange rate fluctuations onoperating results by purchasing foreign exchange forward contracts to cover a portion of outstanding accountsreceivable on a need basis. As of June 30, 2001, the company had outstanding forward contracts in the amount
Q1_2001_PAPF_Final.p65 28/07/2001, 2:47 PM51
52
of $ 35,000,000. These contracts typically mature within three months, must be settled on the day of maturityand may be cancelled subject to the payment of any gains or losses in the difference between the contractexchange rate and the market exchange rate on the date of cancellation. The company uses these instrumentsonly as a hedging mechanism and not for speculative purposes. There can be no assurance that the companywill purchase contracts adequate to insulate itself from foreign exchange currency risks or that any such contractswill perform adequately as a hedging mechanism. Devaluation of the rupee will result in foreign currencytranslation losses. For example, for the three months ended June 30, 2001 and for fiscal 2001 and fiscal 2000,the company’s foreign currency translation losses were approximately $ 2.8 million, $ 14.5 million and$ 5.0 million, respectively.
Fluctuations in the exchange rate between the rupee and the U.S. dollar also will affect the U.S. dollar conversionby the Depositary of any cash dividends paid in rupees on the equity shares represented by the ADSs. Inaddition, fluctuations in the exchange rate between the Indian rupee and the U.S. dollar will affect the U.S.dollar equivalent of the Indian rupee price of equity shares on the Indian Stock Exchanges and, as a result, arelikely to affect the market prices of the ADSs in the United States, and vice versa. Such fluctuations will alsoaffect the dollar value of the proceeds a holder would receive upon the sale in India of any equity shareswithdrawn from the Depositary under the Depositary Agreement. There can be no assurance that holders willbe able to convert rupee proceeds into U.S. dollars or any other currency or with respect to the rate at which anysuch conversion could occur.
2.10.7 Substantial investment in new facilitiesAs of June 30, 2001, the company had contractual commitments of $ 30.5 million for capital expenditure andhas budgeted for significant expansion of infrastructure in the near future. Since such an expansion willsignificantly increase the company’s fixed costs, the company’s results of operations will be materially adverselyaffected if the company is unable to grow its business proportionately. Although the company has successfullydeveloped new facilities in the past, there can be no assurance that the company will not encounter costoverruns or project delays in connection with any or all of the new facilities. Furthermore, there can be noassurance that future financing for additional facilities, whether within India or elsewhere, would be availableon attractive terms or at all.
2.10.8 Restrictions on US immigrationThe company’s professionals who work on-site at client facilities in the United States on temporary and extendedassignments are typically required to obtain visas. As of June 30, 2001, substantially all of the company’spersonnel in the United States were working pursuant to H-1B visas (1,280 persons) or L-1 visas (294 persons).Although there is no limit to new L-1 petitions, there is a limit to the number of new H-1B petitions that theUnited States Immigration and Naturalization Service may approve in any government fiscal year. In years inwhich this limit is reached, the company may be unable to obtain the H-1B visas necessary to bring its criticalIndian IT professionals to the United States on an extended basis. The H-1B limit had recently been increasedto 195,000 for the next two years ending September 30, 2002. This limit has not yet been reached by the U.S.Government for its fiscal year ended September 30, 2001 While the company anticipates that this limit will bereached prior to the end of the US government’s fiscal year and has made efforts to plan accordingly, there canbe no assurance that the company will continue to be able to obtain a sufficient number of H-1B visas. Changesin existing U.S. immigration laws that make it more difficult for the company to obtain H-1B and L-1 visascould impair the company’s ability to compete for and provide services to clients and could have a materialadverse effect on the company’s results of operations and financial condition.
2.10.9 Risks related to international operationsWhile most of the company’s software development facilities are currently located in India, the company intendsto develop new software development facilities in other regions, including potentially South-East Asia, LatinAmerica and Europe. The company has not yet made substantial contractual commitments to develop suchnew software development facilities, and there can be no assurance that the company will not significantly alteror reduce its proposed expansion plans. The company’s lack of experience with facilities outside of India subjectthe company to further risk with regard to foreign regulation and overseas facilities management. Increasing thenumber of software development facilities and the scope of operations outside of India subjects the company toa number of risks, including, among other things, difficulties relating to administering its business globally,managing foreign operations, currency exchange rate fluctuations, restrictions against the repatriation of earnings,export requirements and restrictions, and multiple and possibly overlapping tax structures. Such developmentscould have a material adverse effect on the company’s business, results of operations and financial condition.
Q1_2001_PAPF_Final.p65 28/07/2001, 2:47 PM52
53
2.10.10 Dependence on skilled personnel; risks of wage inflationThe company’s ability to execute project engagements and to obtain new clients depends, in large part, on itsability to attract, train, motivate and retain highly skilled IT professionals, particularly project managers, softwareengineers and other senior technical personnel. An inability to hire and retain additional qualified personnelwill impair the company’s ability to bid for or obtain new projects and to continue to expand its business. Thecompany believes that there is significant competition for IT professionals with the skills necessary to performthe services offered by the company. There can be no assurance that the company will be able to assimilate andmanage new IT professionals effectively. Any increase in the attrition rates experienced by the company, particularlythe rate of attrition of experienced software engineers and project managers, would adversely affect the company’sresults of operations and financial condition. There can be no assurance that the company will be successful inrecruiting and retaining a sufficient number of replacement IT professionals with the requisite skills to replacethose IT professionals who leave. Further, there can be no assurance that the company will be able to re-deployand retrain its IT professionals to keep pace with continuing changes in IT, evolving standards and changingclient preferences. Historically, the company’s wage costs in India have been significantly lower than wage costsin the United States for comparably skilled IT professionals. However, wage costs in India are presently increasingat a faster rate than those in the United States. Changes in immigration laws of the countries where the company’spersonnel are on short-term assignments, requiring the company to pay a minimum threshold wage higher thanthe current wage of these personnel as a condition for obtaining visas or work permits may impact the profitabilityof the company. In the long-term, wage increases may have an adverse effect on the company’s profit marginsunless the company is able to continue increasing the efficiency and productivity of its professionals.
2.10.11 Client concentrationThe company has derived, and believes that it will continue to derive, a significant portion of its revenues froma limited number of large corporate clients. For the three months ended June 30, 2001 and for fiscal 2001 and2000, the company’s largest client accounted for 6.7%, 7.3% and 7.2%, respectively, of the company’s totalrevenues and its five largest clients accounted for 27.4%, 26.0% and 30.2%, respectively, of the company’s totalrevenues. The volume of work performed for specific clients is likely to vary from year to year, particularly sincethe company is usually not the exclusive outside software service provider for its clients. Thus, a major client inone year may not provide the same level of revenues in a subsequent year. The loss of any large client couldhave a material adverse effect on the company’s results of operations and financial condition. Since many of thecontracted projects are critical to the operations of its clients’ businesses, any failure to meet client expectationscould result in a cancellation or non-renewal of a contract. However, there are a number of factors other thanthe company’s performance that could cause the loss of a client and that may not be predictable. For example,in 1995, the company chose to reduce significantly the services provided to its then-largest client rather thanaccept the price reductions and increased company resources sought by the client. In other circumstances, thecompany reduced significantly the services provided to its client when the client either changed its outsourcingstrategy by moving more work in-house and reducing the number of its vendors, or replaced its existingsoftware with packaged software supported by the licensor. There can be no assurance that the same circumstancesmay not arise in future.
2.10.12 Fixed-price, fixed-time frame contractsAs a core element of its business strategy, the company continues to offer a significant portion of its services ona fixed-price, fixed-time frame basis, rather than on a time-and-materials basis. Although the company usesspecified software engineering processes and its past project experience to reduce the risks associated withestimating, planning and performing fixed-price, fixed-time frame projects, the company bears the risk of costoverruns, completion delays and wage inflation in connection with these projects. The company’s failure toestimate accurately the resources and time required for a project, future rates of wage inflation and currencyexchange rates or its failure to complete its contractual obligations within the time frame committed could havea material adverse effect on the company’s results of operations and financial condition.
2.10.13 Infrastructure and potential disruption in telecommunicationsA significant element of the company’s business strategy is to continue to leverage its various software developmentcenters in Bangalore, Bhubaneswar, Chennai, Mangalore, Pune, Hyderabad, Mohali and Mysore, India and toexpand the number of such centers in India as well as outside India. The company believes that the use of astrategically located network of software development centers will provide the company with cost advantages,the ability to attract highly skilled personnel in various regions, the ability to service clients on a regional andglobal basis, and the ability to provide 24-hour service to its clients. Pursuant to its service delivery model, thecompany must maintain active voice and data communication between its main offices in Bangalore, the offices
Q1_2001_PAPF_Final.p65 28/07/2001, 2:47 PM53
54
of its clients, and its other software development facilities. Although the company maintains redundant softwaredevelopment facilities and satellite communications links, any significant loss of the company’s ability to transmitvoice and data through satellite and telephone communications would have a material adverse effect on thecompany’s results of operations and financial condition.
2.10.14 CompetitionThe market for IT services is highly competitive. Competitors include IT services companies, large internationalaccounting firms and their consulting affiliates, systems consulting and integration firms, temporary employmentagencies, other technology companies and client in-house IS departments. Competitors include internationalfirms as well as national, regional and local firms located in the United States, Europe and India. The companyexpects that future competition will increasingly include firms with operations in other countries, potentiallyincluding countries with lower personnel costs than those prevailing in India. Historically, one of the company’skey competitive advantages has been a cost advantage relative to service providers in the United States andEurope. Since wage costs in India are presently increasing at a faster rate than those in the United States, thecompany’s ability to compete effectively will become increasingly dependent on its reputation, the quality of itsservices, and its expertise in specific markets. Many of the company’s competitors have significantly greaterfinancial, technical and marketing resources and generate greater revenue than the company, and there can beno assurance that the company will be able to compete successfully with such competitors and will not loseexisting clients to such competitors. The company believes that its ability to compete also depends in part on anumber of factors outside its control, including the ability of its competitors to attract, train, motivate andretain highly skilled IT professionals, the price at which its competitors offer comparable services, and theextent of its competitors’ responsiveness to client needs.
2.10.15 Dependence on key personnelThe company’s success depends to a significant degree upon continued contributions of members of the company’ssenior management and other key research and development and sales and marketing personnel. The companygenerally does not enter into employment agreements with its senior management and other key personnel thatprovide for substantial restrictions on such persons leaving the company. The loss of any of such persons couldhave a material adverse effect on the company’s business, financial condition and results of operations.
2.10.16 Potential liability to clients; risk of exceeding insurance coverageMany of the company’s contracts involve projects that are critical to the operations of its clients’ businesses andprovide benefits that may be difficult to quantify. Any failure in a client’s system could result in a claim forsubstantial damages against the company, regardless of the company’s responsibility for such failure. Althoughthe company attempts to limit its contractual liability for damages arising from negligent acts, errors, mistakesor omissions in rendering its services, there can be no assurance the limitations of liability set forth in its servicecontracts will be enforceable in all instances or will otherwise protect the company from liability for damages.The company maintains general liability insurance coverage, including coverage for errors or omissions; however,there can be no assurance that such coverage will continue to be available on reasonable terms or will beavailable in sufficient amounts to cover one or more large claims, or that the insurer will not disclaim coverageas to any future claim. The successful assertion of one or more large claims against the company that exceedavailable insurance coverage or changes in the company’s insurance policies, including premium increases orthe imposition of large deductible or co-insurance requirements, could adversely affect the company’s results ofoperations and financial condition.
2.10.17 Risks associated with possible acquisitionsThe company intends to evaluate potential acquisitions on an ongoing basis. As of the date of this QuarterlyReport, however, the company has no understanding, commitment or agreement with respect to any materialfuture acquisition. Since the company has not made any acquisitions in the past, there can be no assurance thatthe company will be able to identify suitable acquisition candidates available for sale at reasonable prices,consummate any acquisition, or successfully integrate any acquired business into the company’s operations.Further, acquisitions may involve a number of special risks, including diversion of management’s attention,failure to retain key acquired personnel and clients, unanticipated events or circumstances, legal liabilities andamortization of acquired intangible assets, some or all of which could have a material adverse effect on thecompany’s results of operations and financial condition. Under Indian law, except in certain limited circumstances,the company may not make any acquisition of, or investment in, a non-Indian company without RBI and, inmost cases, Government of India approval. Even if the company does encounter an attractive acquisition candidate,there can be no assurance that RBI and, if required, Government of India approval can be obtained.
Q1_2001_PAPF_Final.p65 28/07/2001, 2:47 PM54
55
2.10.18 Risks associated with strategic investmentsThe company has made and continues to make strategic investments in early stage technology companies inorder to gain experience in niche technologies. The company invested an aggregate of $5.9 million in strategicinvestments in fiscal 2001. However, there can be no assurance that the company will be successful in itsinvestments and will benefit from such investments. The loss of any of such investments could have a materialadverse effect on the company’s business, financial condition and results of operations.
2.10.19 Risks associated with incubationThe company incubates employee ideas that it expects to be commercially viable. The company may incursignificant expenditures until the successful commercialization of these ideas. The company may also holdequity in these incubation ventures in return for transfers of intellectual property rights related to incubatedideas. However, there can be no assurance that the company will be successful in incubating ideas, will besuccessful in commercializing such ideas, or will benefit from such incubation ventures. The failure of any ofsuch incubation ventures could have a material adverse effect on the company’s reputation, business, financialcondition and results of operations.
2.10.20 Risks related to software product salesThe company derived 3.3%, 2.5% and 2.6% of its total revenue from the sale of software products in the threemonths ended June 30, 2001, fiscal 2001 and fiscal 2000, respectively. The development of the company’ssoftware products requires significant investments. The markets for the company’s primary software productare competitive and currently located in developing countries, and there can be no assurance that such aproduct will continue to be commercially successful. In addition, there can be no assurance that any newproducts developed by the company will be commercially successful or that the costs of developing such newproducts will be recouped. A decrease in the company’s product revenues or margins could adversely affect thecompany’s results of operations and financial condition. Additionally, software product revenues typically occurin periods subsequent to the periods in which the costs are incurred for development of such products. Therecan be no assurance that such delayed revenues will not cause periodic fluctuations of the company’s results ofoperations and financial condition.
2.10.21 Restrictions on exercise of preemptive rights by ADS holdersUnder the Indian Companies Act, 1956 (“Indian Companies Act”), a company incorporated in India must offerits holders of equity shares preemptive rights to subscribe and pay for a proportionate number of shares tomaintain their existing ownership percentages prior to the issuance of any new equity shares, unless suchpreemptive rights have been waived by three-fourths of the company’s shareholders. U.S. holders of ADSs maybe unable to exercise preemptive rights for equity shares underlying ADSs unless a registration statement underthe Securities Act of 1933, as amended (the “Securities Act”), is effective with respect to such rights or anexemption from the registration requirements of the Securities Act is available. The company’s decision to file aregistration statement will depend on the costs and potential liabilities associated with any such registrationstatement as well as the perceived benefits of enabling the holders of ADSs to exercise their preemptive rightsand any other factors the company considers appropriate at the time. No assurance can be given that thecompany would file a registration statement under these circumstances. If the company issues any such securitiesin the future, such securities may be issued to the Depositary, which may sell such securities for the benefit ofthe holders of the ADSs. There can be no assurance as to the value, if any, the Depositary would receive uponthe sale of such securities. To the extent that holders of ADSs are unable to exercise preemptive rights grantedin respect of the equity shares represented by their ADSs, their proportional interests in the company would bereduced.
2.10.22 Intellectual property rightsThe company relies upon a combination of non-disclosure and other contractual arrangements and copyright,trade secrets and trademark laws to protect its proprietary rights. Ownership of software and associated deliverablescreated for clients is generally retained by or assigned to the client, and the company does not retain an interestin such software and deliverables. The company also develops foundation and application software products, orsoftware “tools”, which are licensed to clients and remain the property of the company. The company hasobtained registration of INFOSYS as a trademark in India and the United States, and does not have any patentsor registered copyrights in the United States. The company currently requires its IT professionals to enter intonon-disclosure and assignment of rights agreements to limit use of, access to, and distribution of its proprietaryinformation. There can be no assurance that the steps taken by the company in this regard will be adequate to
Q1_2001_PAPF_Final.p65 28/07/2001, 2:47 PM55
56
deter misappropriation of proprietary information or that the company will be able to detect unauthorized useand take appropriate steps to enforce its intellectual property rights.
Although the company believes that its services and products do not infringe upon the intellectual propertyrights of others, there can be no assurance that such a claim will not be asserted against the company in thefuture. Assertion of such claims against the company could result in litigation, and there can be no assurancethat the company would be able to prevail in such litigation or be able to obtain a license for the use of anyinfringed intellectual property from a third party on commercially reasonable terms. There can be no assurancethat the company will be able to protect such licenses from infringement or misuse, or prevent infringementclaims against the company in connection with its licensing efforts. The company expects that the risk ofinfringement claims against the company will increase if more of the company’s competitors are able to obtainpatents for software products and processes. Any such claims, regardless of their outcome, could result insubstantial cost to the company and divert management’s attention from the company’s operations. Anyinfringement claim or litigation against the company could, therefore, have a material adverse effect on thecompany’s results of operations and financial condition.
2.10.23 Control by principal shareholders, officers and directors; anti-takeover provisionsThe company’s officers and directors, together with members of their immediate families, in the aggregate,beneficially own approximately 24.9% of the company’s issued equity shares. As a result, such persons, actingtogether, will likely still have the ability to exercise significant control over most matters requiring approval bythe shareholders of the company, including the election and removal of directors and significant corporatetransactions. Such control by the company’s officers and directors could delay, defer or prevent a change incontrol of the company, impede a merger, consolidation, takeover or other business combination involving thecompany, or discourage a potential acquirer from making a tender offer or otherwise attempting to obtaincontrol of the company.
The Indian Companies Act and the company’s Articles of Association (the “Articles”) require that: (i) at leasttwo-thirds of the company’s directors shall serve for a specified term and shall be subject to re-election by thecompany’s shareholders at the expiration of such terms; and (ii) at least one-third of the company’s directorswho are subject to re-election shall be up for re-election at each annual meeting of the company’s shareholders.In addition, the company’s Articles provide that Mr. N. R. Narayana Murthy, one of the company’s principalfounders and its Chairman of the Board and Chief Executive Officer, shall serve as the company’s Chairman ofthe Board and shall not be subject to re-election as long as he and his relatives, own at least 5% of the company’soutstanding equity securities. Furthermore, any amendment to the company’s Articles would require theaffirmative vote of three-fourths of the company’s shareholders. Finally, foreign investment in Indian companiesis highly regulated. These provisions could delay, defer or prevent a change in control of the company, impedea business combination involving the company or discourage a potential acquirer from attempting to obtaincontrol of the company.
Item 3. Quantitative and Qualitative Disclosure About Market Risk
3.1 Foreign currency market risk
This information is set forth under the caption “Exchange rate fluctuations” under Item 2.10.6, Risks related toInvestments in Indian securities, above, and is incorporated herein by reference.
Part II – Other informationItem 1. Legal proceedings
The company, its directors, senior executive officers and affiliates are not currently a party to any materiallegal proceedings.
Item 2. Changes in securities and use of proceedsNone
Q1_2001_PAPF_Final.p65 28/07/2001, 2:47 PM56
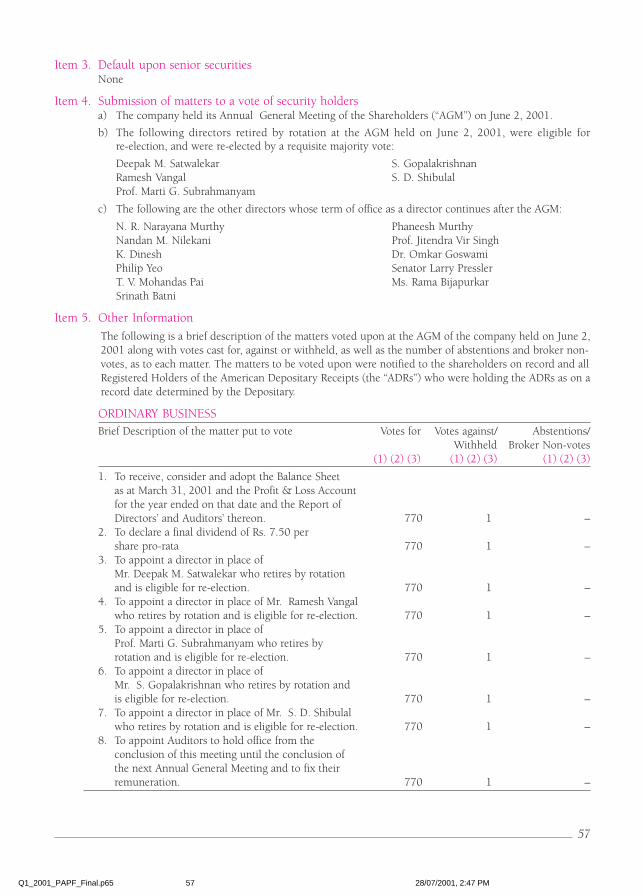
57
Item 3. Default upon senior securitiesNone
Item 4. Submission of matters to a vote of security holdersa) The company held its Annual General Meeting of the Shareholders (“AGM”) on June 2, 2001.
b) The following directors retired by rotation at the AGM held on June 2, 2001, were eligible forre-election, and were re-elected by a requisite majority vote:
Deepak M. Satwalekar S. GopalakrishnanRamesh Vangal S. D. ShibulalProf. Marti G. Subrahmanyam
c) The following are the other directors whose term of office as a director continues after the AGM:
N. R. Narayana Murthy Phaneesh MurthyNandan M. Nilekani Prof. Jitendra Vir SinghK. Dinesh Dr. Omkar GoswamiPhilip Yeo Senator Larry PresslerT. V. Mohandas Pai Ms. Rama BijapurkarSrinath Batni
Item 5. Other Information
The following is a brief description of the matters voted upon at the AGM of the company held on June 2,2001 along with votes cast for, against or withheld, as well as the number of abstentions and broker non-votes, as to each matter. The matters to be voted upon were notified to the shareholders on record and allRegistered Holders of the American Depositary Receipts (the “ADRs”) who were holding the ADRs as on arecord date determined by the Depositary.
ORDINARY BUSINESSBrief Description of the matter put to vote Votes for Votes against/ Abstentions/
Withheld Broker Non-votes(1) (2) (3) (1) (2) (3) (1) (2) (3)
1. To receive, consider and adopt the Balance Sheetas at March 31, 2001 and the Profit & Loss Accountfor the year ended on that date and the Report ofDirectors’ and Auditors’ thereon. 770 1 –
2. To declare a final dividend of Rs. 7.50 pershare pro-rata 770 1 –
3. To appoint a director in place ofMr. Deepak M. Satwalekar who retires by rotationand is eligible for re-election. 770 1 –
4. To appoint a director in place of Mr. Ramesh Vangalwho retires by rotation and is eligible for re-election. 770 1 –
5. To appoint a director in place ofProf. Marti G. Subrahmanyam who retires byrotation and is eligible for re-election. 770 1 –
6. To appoint a director in place ofMr. S. Gopalakrishnan who retires by rotation andis eligible for re-election. 770 1 –
7. To appoint a director in place of Mr. S. D. Shibulalwho retires by rotation and is eligible for re-election. 770 1 –
8. To appoint Auditors to hold office from theconclusion of this meeting until the conclusion ofthe next Annual General Meeting and to fix theirremuneration. 770 1 –
Q1_2001_PAPF_Final.p65 28/07/2001, 2:47 PM57
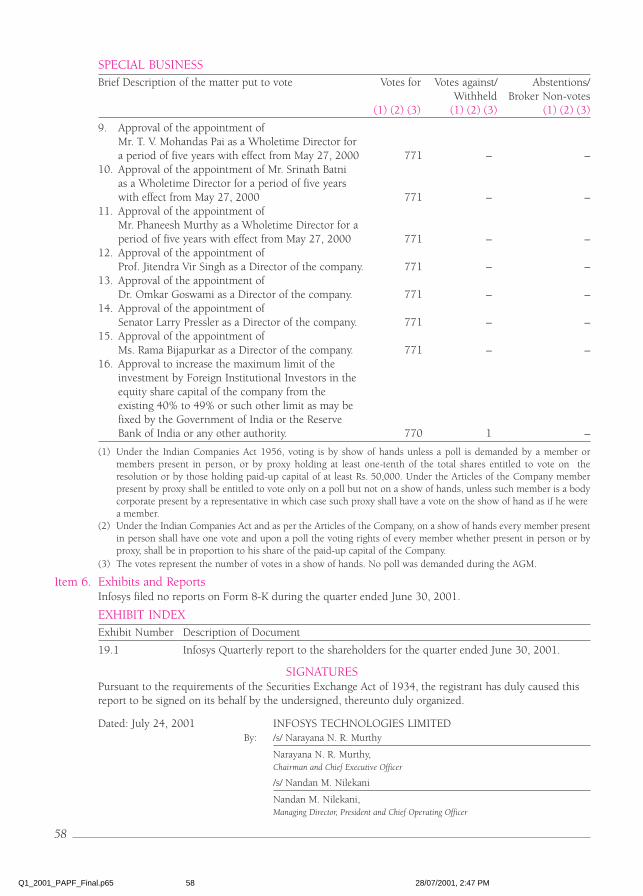
58
(1) Under the Indian Companies Act 1956, voting is by show of hands unless a poll is demanded by a member ormembers present in person, or by proxy holding at least one-tenth of the total shares entitled to vote on theresolution or by those holding paid-up capital of at least Rs. 50,000. Under the Articles of the Company memberpresent by proxy shall be entitled to vote only on a poll but not on a show of hands, unless such member is a bodycorporate present by a representative in which case such proxy shall have a vote on the show of hand as if he werea member.
(2) Under the Indian Companies Act and as per the Articles of the Company, on a show of hands every member presentin person shall have one vote and upon a poll the voting rights of every member whether present in person or byproxy, shall be in proportion to his share of the paid-up capital of the Company.
(3) The votes represent the number of votes in a show of hands. No poll was demanded during the AGM.
Item 6. Exhibits and ReportsInfosys filed no reports on Form 8-K during the quarter ended June 30, 2001.
EXHIBIT INDEXExhibit Number Description of Document
19.1 Infosys Quarterly report to the shareholders for the quarter ended June 30, 2001.
SIGNATURESPursuant to the requirements of the Securities Exchange Act of 1934, the registrant has duly caused thisreport to be signed on its behalf by the undersigned, thereunto duly organized.
Dated: July 24, 2001 INFOSYS TECHNOLOGIES LIMITEDBy: /s/ Narayana N. R. Murthy
Narayana N. R. Murthy,Chairman and Chief Executive Officer
/s/ Nandan M. Nilekani
Nandan M. Nilekani,Managing Director, President and Chief Operating Officer
SPECIAL BUSINESSBrief Description of the matter put to vote Votes for Votes against/ Abstentions/
Withheld Broker Non-votes(1) (2) (3) (1) (2) (3) (1) (2) (3)
9. Approval of the appointment ofMr. T. V. Mohandas Pai as a Wholetime Director fora period of five years with effect from May 27, 2000 771 – –
10. Approval of the appointment of Mr. Srinath Batnias a Wholetime Director for a period of five yearswith effect from May 27, 2000 771 – –
11. Approval of the appointment ofMr. Phaneesh Murthy as a Wholetime Director for aperiod of five years with effect from May 27, 2000 771 – –
12. Approval of the appointment ofProf. Jitendra Vir Singh as a Director of the company. 771 – –
13. Approval of the appointment ofDr. Omkar Goswami as a Director of the company. 771 – –
14. Approval of the appointment ofSenator Larry Pressler as a Director of the company. 771 – –
15. Approval of the appointment ofMs. Rama Bijapurkar as a Director of the company. 771 – –
16. Approval to increase the maximum limit of theinvestment by Foreign Institutional Investors in theequity share capital of the company from theexisting 40% to 49% or such other limit as may befixed by the Government of India or the ReserveBank of India or any other authority. 770 1 –
Q1_2001_PAPF_Final.p65 28/07/2001, 2:47 PM58
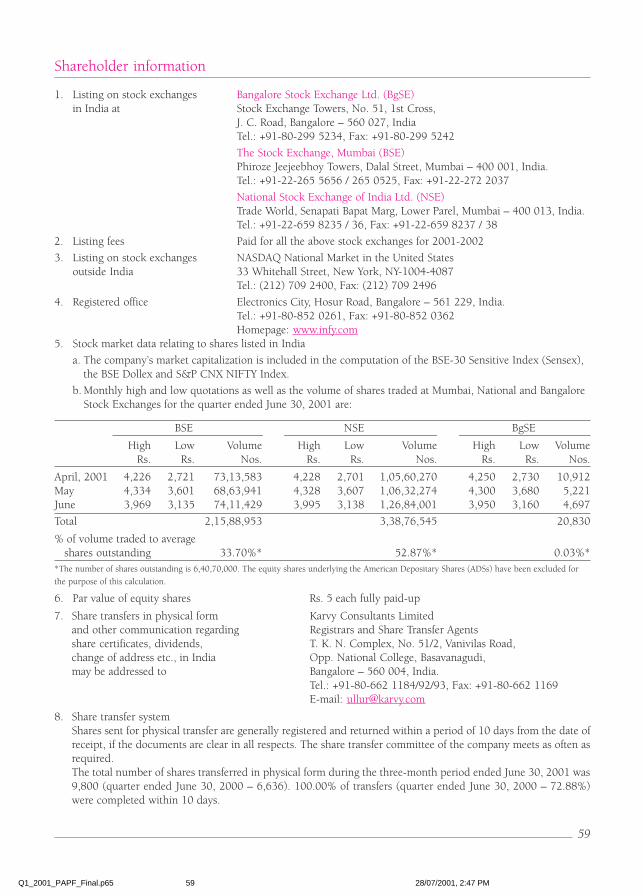
59
Shareholder information
1. Listing on stock exchanges Bangalore Stock Exchange Ltd. (BgSE)in India at Stock Exchange Towers, No. 51, 1st Cross,
J. C. Road, Bangalore – 560 027, IndiaTel.: +91-80-299 5234, Fax: +91-80-299 5242
The Stock Exchange, Mumbai (BSE)Phiroze Jeejeebhoy Towers, Dalal Street, Mumbai – 400 001, India.Tel.: +91-22-265 5656 / 265 0525, Fax: +91-22-272 2037
National Stock Exchange of India Ltd. (NSE)Trade World, Senapati Bapat Marg, Lower Parel, Mumbai – 400 013, India.Tel.: +91-22-659 8235 / 36, Fax: +91-22-659 8237 / 38
2. Listing fees Paid for all the above stock exchanges for 2001-2002
3. Listing on stock exchanges NASDAQ National Market in the United Statesoutside India 33 Whitehall Street, New York, NY-1004-4087
Tel.: (212) 709 2400, Fax: (212) 709 2496
4. Registered office Electronics City, Hosur Road, Bangalore – 561 229, India.Tel.: +91-80-852 0261, Fax: +91-80-852 0362Homepage: www.infy.com
5. Stock market data relating to shares listed in India
a. The company’s market capitalization is included in the computation of the BSE-30 Sensitive Index (Sensex),the BSE Dollex and S&P CNX NIFTY Index.
b. Monthly high and low quotations as well as the volume of shares traded at Mumbai, National and BangaloreStock Exchanges for the quarter ended June 30, 2001 are:
BSE NSE BgSE
High Low Volume High Low Volume High Low VolumeRs. Rs. Nos. Rs. Rs. Nos. Rs. Rs. Nos.
April, 2001 4,226 2,721 73,13,583 4,228 2,701 1,05,60,270 4,250 2,730 10,912May 4,334 3,601 68,63,941 4,328 3,607 1,06,32,274 4,300 3,680 5,221June 3,969 3,135 74,11,429 3,995 3,138 1,26,84,001 3,950 3,160 4,697
Total 2,15,88,953 3,38,76,545 20,830
% of volume traded to averageshares outstanding 33.70%* 52.87%* 0.03%*
*The number of shares outstanding is 6,40,70,000. The equity shares underlying the American Depositary Shares (ADSs) have been excluded for
the purpose of this calculation.
6. Par value of equity shares Rs. 5 each fully paid-up
7. Share transfers in physical form Karvy Consultants Limitedand other communication regarding Registrars and Share Transfer Agentsshare certificates, dividends, T. K. N. Complex, No. 51/2, Vanivilas Road,change of address etc., in India Opp. National College, Basavanagudi,may be addressed to Bangalore – 560 004, India.
Tel.: +91-80-662 1184/92/93, Fax: +91-80-662 1169E-mail: [email protected]
8. Share transfer systemShares sent for physical transfer are generally registered and returned within a period of 10 days from the date ofreceipt, if the documents are clear in all respects. The share transfer committee of the company meets as often asrequired.The total number of shares transferred in physical form during the three-month period ended June 30, 2001 was9,800 (quarter ended June 30, 2000 – 6,636). 100.00% of transfers (quarter ended June 30, 2000 – 72.88%)were completed within 10 days.
Q1_2001_PAPF_Final.p65 28/07/2001, 2:47 PM59
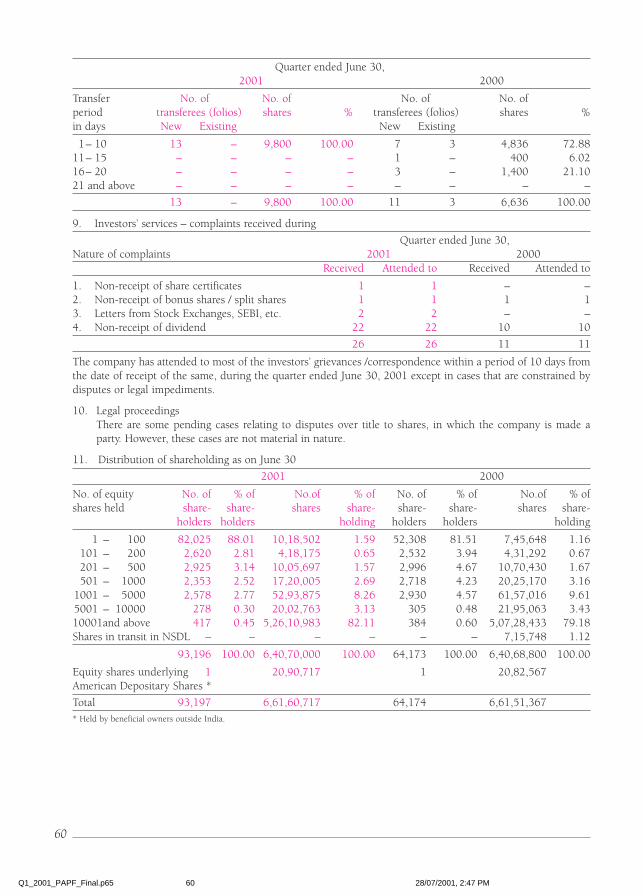
60
Quarter ended June 30,2001 2000
Transfer No. of No. of No. of No. ofperiod transferees (folios) shares % transferees (folios) shares %in days New Existing New Existing
1– 10 13 – 9,800 100.00 7 3 4,836 72.8811– 15 – – – – 1 – 400 6.0216– 20 – – – – 3 – 1,400 21.1021 and above – – – – – – – –
13 – 9,800 100.00 11 3 6,636 100.00
9. Investors’ services – complaints received during
Quarter ended June 30,Nature of complaints 2001 2000
Received Attended to Received Attended to
1. Non-receipt of share certificates 1 1 – –2. Non-receipt of bonus shares / split shares 1 1 1 13. Letters from Stock Exchanges, SEBI, etc. 2 2 – –4. Non-receipt of dividend 22 22 10 10
26 26 11 11
The company has attended to most of the investors’ grievances /correspondence within a period of 10 days fromthe date of receipt of the same, during the quarter ended June 30, 2001 except in cases that are constrained bydisputes or legal impediments.
10. Legal proceedingsThere are some pending cases relating to disputes over title to shares, in which the company is made aparty. However, these cases are not material in nature.
11. Distribution of shareholding as on June 30
2001 2000
No. of equity No. of % of No.of % of No. of % of No.of % ofshares held share- share- shares share- share- share- shares share-
holders holders holding holders holders holding
1 – 100 82,025 88.01 10,18,502 1.59 52,308 81.51 7,45,648 1.16101 – 200 2,620 2.81 4,18,175 0.65 2,532 3.94 4,31,292 0.67201 – 500 2,925 3.14 10,05,697 1.57 2,996 4.67 10,70,430 1.67501 – 1000 2,353 2.52 17,20,005 2.69 2,718 4.23 20,25,170 3.16
1001 – 5000 2,578 2.77 52,93,875 8.26 2,930 4.57 61,57,016 9.615001 – 10000 278 0.30 20,02,763 3.13 305 0.48 21,95,063 3.4310001and above 417 0.45 5,26,10,983 82.11 384 0.60 5,07,28,433 79.18Shares in transit in NSDL – – – – – – 7,15,748 1.12
93,196 100.00 6,40,70,000 100.00 64,173 100.00 6,40,68,800 100.00
Equity shares underlying 1 20,90,717 1 20,82,567American Depositary Shares *
Total 93,197 6,61,60,717 64,174 6,61,51,367* Held by beneficial owners outside India.
Q1_2001_PAPF_Final.p65 28/07/2001, 2:47 PM60
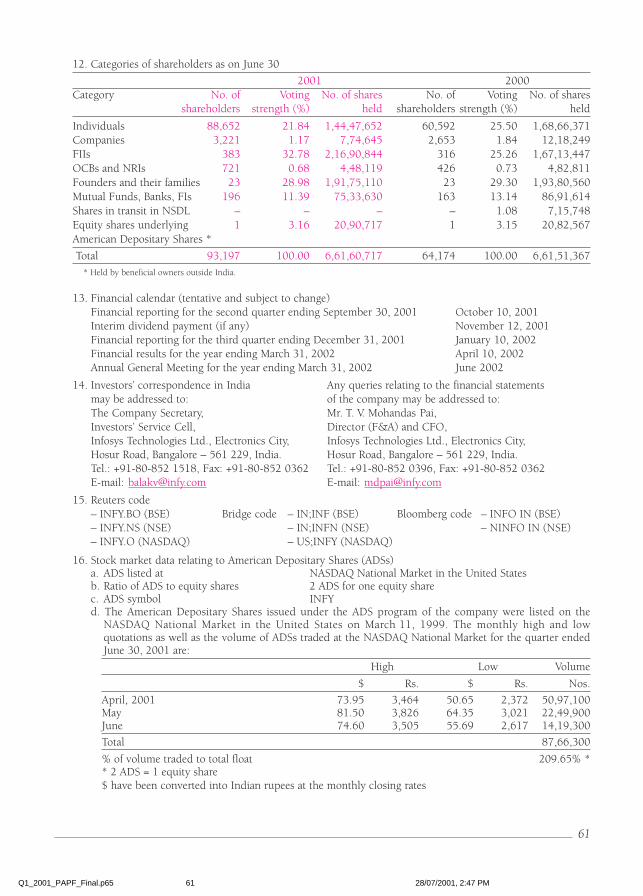
61
12. Categories of shareholders as on June 30
2001 2000Category No. of Voting No. of shares No. of Voting No. of shares
shareholders strength (%) held shareholders strength (%) held
Individuals 88,652 21.84 1,44,47,652 60,592 25.50 1,68,66,371Companies 3,221 1.17 7,74,645 2,653 1.84 12,18,249FIIs 383 32.78 2,16,90,844 316 25.26 1,67,13,447OCBs and NRIs 721 0.68 4,48,119 426 0.73 4,82,811Founders and their families 23 28.98 1,91,75,110 23 29.30 1,93,80,560Mutual Funds, Banks, FIs 196 11.39 75,33,630 163 13.14 86,91,614Shares in transit in NSDL – – – – 1.08 7,15,748Equity shares underlying 1 3.16 20,90,717 1 3.15 20,82,567American Depositary Shares *
Total 93,197 100.00 6,61,60,717 64,174 100.00 6,61,51,367
* Held by beneficial owners outside India.
13. Financial calendar (tentative and subject to change)Financial reporting for the second quarter ending September 30, 2001 October 10, 2001Interim dividend payment (if any) November 12, 2001Financial reporting for the third quarter ending December 31, 2001 January 10, 2002Financial results for the year ending March 31, 2002 April 10, 2002Annual General Meeting for the year ending March 31, 2002 June 2002
14. Investors’ correspondence in India Any queries relating to the financial statementsmay be addressed to: of the company may be addressed to:The Company Secretary, Mr. T. V. Mohandas Pai,Investors’ Service Cell, Director (F&A) and CFO,Infosys Technologies Ltd., Electronics City, Infosys Technologies Ltd., Electronics City,Hosur Road, Bangalore – 561 229, India. Hosur Road, Bangalore – 561 229, India.Tel.: +91-80-852 1518, Fax: +91-80-852 0362 Tel.: +91-80-852 0396, Fax: +91-80-852 0362E-mail: [email protected] E-mail: [email protected]
15. Reuters code– INFY.BO (BSE) Bridge code – IN;INF (BSE) Bloomberg code – INFO IN (BSE)– INFY.NS (NSE) – IN;INFN (NSE) – NINFO IN (NSE)– INFY.O (NASDAQ) – US;INFY (NASDAQ)
16. Stock market data relating to American Depositary Shares (ADSs)a. ADS listed at NASDAQ National Market in the United Statesb. Ratio of ADS to equity shares 2 ADS for one equity sharec. ADS symbol INFYd. The American Depositary Shares issued under the ADS program of the company were listed on the
NASDAQ National Market in the United States on March 11, 1999. The monthly high and lowquotations as well as the volume of ADSs traded at the NASDAQ National Market for the quarter endedJune 30, 2001 are:
High Low Volume
$ Rs. $ Rs. Nos.
April, 2001 73.95 3,464 50.65 2,372 50,97,100May 81.50 3,826 64.35 3,021 22,49,900June 74.60 3,505 55.69 2,617 14,19,300
Total 87,66,300
% of volume traded to total float 209.65% ** 2 ADS = 1 equity share$ have been converted into Indian rupees at the monthly closing rates
Q1_2001_PAPF_Final.p65 28/07/2001, 2:47 PM61
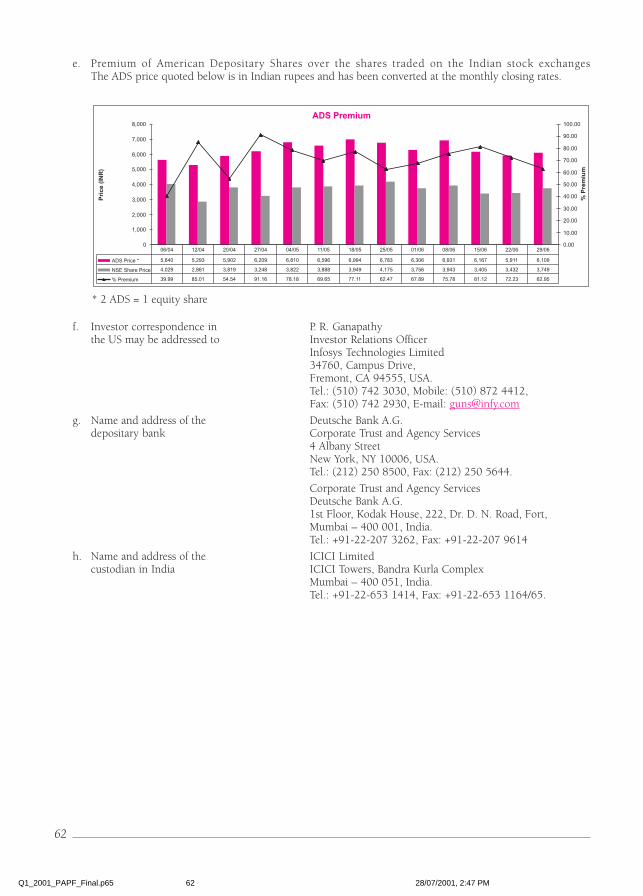
62
e. Premium of American Depositary Shares over the shares traded on the Indian stock exchangesThe ADS price quoted below is in Indian rupees and has been converted at the monthly closing rates.
f. Investor correspondence in P. R. Ganapathythe US may be addressed to Investor Relations Officer
Infosys Technologies Limited34760, Campus Drive,Fremont, CA 94555, USA.Tel.: (510) 742 3030, Mobile: (510) 872 4412,Fax: (510) 742 2930, E-mail: [email protected]
g. Name and address of the Deutsche Bank A.G.depositary bank Corporate Trust and Agency Services
4 Albany StreetNew York, NY 10006, USA.Tel.: (212) 250 8500, Fax: (212) 250 5644.
Corporate Trust and Agency ServicesDeutsche Bank A.G.1st Floor, Kodak House, 222, Dr. D. N. Road, Fort,Mumbai – 400 001, India.Tel.: +91-22-207 3262, Fax: +91-22-207 9614
h. Name and address of the ICICI Limitedcustodian in India ICICI Towers, Bandra Kurla Complex
Mumbai – 400 051, India.Tel.: +91-22-653 1414, Fax: +91-22-653 1164/65.
* 2 ADS = 1 equity share
Q1_2001_PAPF_Final.p65 28/07/2001, 2:47 PM62
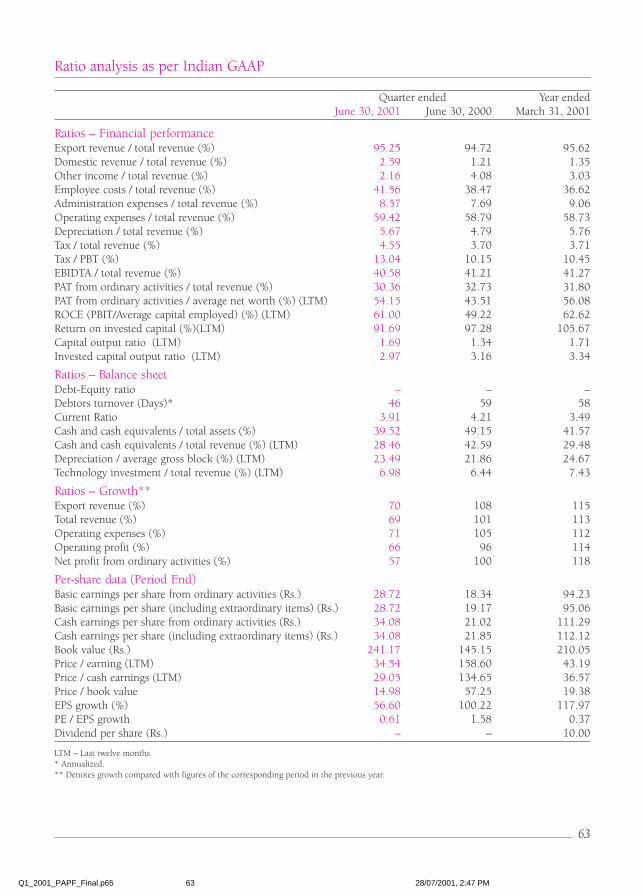
63
Ratio analysis as per Indian GAAP
Quarter ended Year endedJune 30, 2001 June 30, 2000 March 31, 2001
Ratios – Financial performanceExport revenue / total revenue (%) 95.25 94.72 95.62Domestic revenue / total revenue (%) 2.59 1.21 1.35Other income / total revenue (%) 2.16 4.08 3.03Employee costs / total revenue (%) 41.56 38.47 36.62Administration expenses / total revenue (%) 8.57 7.69 9.06Operating expenses / total revenue (%) 59.42 58.79 58.73Depreciation / total revenue (%) 5.67 4.79 5.76Tax / total revenue (%) 4.55 3.70 3.71Tax / PBT (%) 13.04 10.15 10.45EBIDTA / total revenue (%) 40.58 41.21 41.27PAT from ordinary activities / total revenue (%) 30.36 32.73 31.80PAT from ordinary activities / average net worth (%) (LTM) 54.15 43.51 56.08ROCE (PBIT/Average capital employed) (%) (LTM) 61.00 49.22 62.62Return on invested capital (%)(LTM) 91.69 97.28 105.67Capital output ratio (LTM) 1.69 1.34 1.71Invested capital output ratio (LTM) 2.97 3.16 3.34
Ratios – Balance sheetDebt-Equity ratio – – –Debtors turnover (Days)* 46 59 58Current Ratio 3.91 4.21 3.49Cash and cash equivalents / total assets (%) 39.52 49.15 41.57Cash and cash equivalents / total revenue (%) (LTM) 28.46 42.59 29.48Depreciation / average gross block (%) (LTM) 23.49 21.86 24.67Technology investment / total revenue (%) (LTM) 6.98 6.44 7.43
Ratios – Growth**Export revenue (%) 70 108 115Total revenue (%) 69 101 113Operating expenses (%) 71 105 112Operating profit (%) 66 96 114Net profit from ordinary activities (%) 57 100 118
Per-share data (Period End)Basic earnings per share from ordinary activities (Rs.) 28.72 18.34 94.23Basic earnings per share (including extraordinary items) (Rs.) 28.72 19.17 95.06Cash earnings per share from ordinary activities (Rs.) 34.08 21.02 111.29Cash earnings per share (including extraordinary items) (Rs.) 34.08 21.85 112.12Book value (Rs.) 241.17 145.15 210.05Price / earning (LTM) 34.54 158.60 43.19Price / cash earnings (LTM) 29.05 134.65 36.57Price / book value 14.98 57.25 19.38EPS growth (%) 56.60 100.22 117.97PE / EPS growth 0.61 1.58 0.37Dividend per share (Rs.) – – 10.00
LTM – Last twelve months* Annualized.** Denotes growth compared with figures of the corresponding period in the previous year.
Q1_2001_PAPF_Final.p65 28/07/2001, 2:47 PM63

64
United StatesAddison15305 Dallas ParkwaySuite 210Addison, TX 75001Tel. : (972) 770-0450Fax : (972) 770-0490
Bellevue10900 NE 4th St.#2300 BellevueWA 98004Tel. : (425) 990 1028Fax : (425) 990 1029
Fremont 34760 Campus DriveFremontCA 94555Tel. : (510) 742 3000Fax : (510) 742 3090
Marietta1950 Spectrum Circle#400 MariettaGA 30067Tel. : (770) 857 4428Fax : (770) 857 2258
Newport Beach4590 MacArthurSuite 500Newport BeachCA 92660Tel. : (949) 475 0196Fax : (949) 475 0198
Quincy Two Adams PlaceQuincy, MA 02169Tel. : (781) 356 3100Fax : (781) 356 3150
Troy100 Liberty Center#200 West Big BeaverTroy, MI 48084Tel. : (248) 524 0320Fax : (248) 524 0321
Phoenix10851, N Black CanyonHighway, #830Phoenix, AZ 85029Tel. : (602) 9444855Fax : (602) 9444879
Lisle2300 Cabot DrSuite 250Lisle, IL 60532Tel. : (630) 4825000Fax : (630) 5059144
Berkeley HeightsTwo Oak WayFourth Floor, South WingBerkeley Heights,NJ 07922Tel. : (908) 286 3101Fax : (908) 286 3125
BankersICICI Bank Ltd.Bank of America
Company SecretaryV. Balakrishnan
AuditorsBharat S Raut and Co.Chartered Accountants
Independent auditors(US GAAP)KPMG
Visit Infosys atwww.infy.com
Send e-mail [email protected]
Call us atwithin the U.S.
1-800-ITL INFOoutside the U.S.
91-80-8520261
Infosys Technologies Limited
© 2001 Infosys Technologies Limited, Bangalore, India.Infosys acknowledges the proprietary rights in the trademarks andproduct names of other companies mentioned in this document.
UKCroydonP.O. Box 122111th Floor Emerald House7/15 Lansdowne RoadCroydon, CR0 2BXTel. : 44-20-8774 3300Fax : 44-20-8686 6631
ArgentinaBuenos AiresGrupo ASSA Building2nd Floor, Elvira Rawson deDellepiane 150, Dique 1Puerto Madero, C1107BCABuenos Aires
AustraliaMelbourneLevel 7, 505, St Kilda RoadMelbourne, Victoria 3004Tel. : 61 3 9868 1607Fax : 61 3 9868 1652
SydneyLevel 4, 90, Mount StreetNorth Sydney, NSW 2060Tel. : 61 2 9954 0036Fax : 61 2 8904 1344
BelgiumBrusselsDreve Richelle 161Building N 1410 WaterlooBrusselsTel. : 322-352-8743Fax : 322-352-8889
CanadaToronto5140 Yonge StreetSuite 1400, TorontoOntario, M2N 6L7Tel. : (416) 2247400Fax : (416) 2247449
FranceParis12, AV DU CentreFaubourg de l’Arche 92419Courbevoie CedexTel. : 33 1 4691 8454Fax : 33 1 4691 8800
GermanyFrankfurt TOPAS 2, Mergenthalerallee79-81, 65760, EschbornFrankfurtTel. : 49 6196 9202115Fax : 49 6196 9202320
Hong Kong16F Cheung Kong Centre2 Queen’s Road CentralCentral, Hong KongTel. : 852 22972806Fax : 852 22970066
JapanTokyo2F, Kearny Place Akasaka,2-21-25, Akasaka,Minato-Ku, Tokyo 107-0052Tel. : 81 3-5545-3251Fax : 81 3-5545-3252
Singapore30, Raffles Place,23-00, Caltex HouseSingapore 048622Tel. : 65 233 6820Fax : 65 233 6905
SwedenStockholmStureplan 4C, 4tr114 35, StockholmTel. : 46-846 31112Fax : 46-846 31114
UAEP. O. Box 8230Sharjah Airport Intl.Free Zone SharjahTel. : 971 6557 0000Fax : 971 6557 1010
IndiaBangaloreElectronics CityHosur RoadBangalore–561 229Tel. : (080) 8520261Fax : (080) 8520362
Reddy BuildingK-310, 1st Main5th Block, KoramangalaBangalore–560 095Tel. : (080) 5530392Fax : (080) 5530391
Pavithra Complex#1, 27th Main, 2nd Cross1st Stage, BTM LayoutBangalore–560 068Tel. : (080) 6681755Fax : (080) 6680181
Infosys TowersNo. 27, Bannerghatta Road3rd Phase, J. P. NagarBangalore–560 076Tel. : (080) 6588668Fax : (080) 6588676
BhubaneswarPlot No. N-1/70, NayapalliAdjoining Planetarium onNH5, Post RRLBhubaneswar–751 013Tel. : (0674) 584068-71Fax : (0674) 583991
KonarkPlot No. E/4Infocity, ChandakaBhubaneswar–751 014Tel. : (0674) 320001Fax : (0674) 320100
ChennaiNo. 138,Old Mahabalipuram RoadSholinganallurChennai–600 119Tel. : (044) 4500345
Hyderabad1Q3 A1, 1st Floor,Cyber TowersHI-TEC City, MadhapurHyderabad–500 033Tel. : (040) 3100242/44-48Fax : (040) 3100243
KolkataC/61, Bapuji NagarRegent Estate P.O.Kolkata–92Pager No. 9628-304450
MangaloreKottara CrossKuloor Ferry RoadMangalore–575 006Tel. : (0824) 451485-88Fax : (0824) 451504
Mohali (Chandigarh)B 100, Phase VIIIIndustrial Area, SAS NagarMohali–160 059Tel. : (0172) 254191/ 92/ 94Fax : (0172) 254193
MumbaiNo. 85, Mittal Towers ‘C’8th Floor, Nariman PointMumbai–400 021Tel. : (022) 2882911-14Fax : (022) 2846489
MysoreSJCE-STEPSree JayachamarajendraCollege of Engineering,Science and TechnologyEntrepreneurs ParkMysore–570 006Tel. : (0821) 500001/06/08Fax : (0821) 511614
New Delhi K30, Green Park MainBehind Green Park MarketNew Delhi–110 066Tel. : (011) 6514829-30Fax : (011) 6853366
PunePlot No. 1Infotech Park MIDCHinjewadi, Taluka MulshiPune–411027Tel. : (02139) 32801-03Fax : (02139) 32832
Q1_2001_PAPF_Final.p65 28/07/2001, 2:47 PM64