“infrastructure demand of $3.7 trillion per annum between...
TRANSCRIPT

“Infrastructure Demand of $3.7 trillion
per annum between now and 2030”
Contents
Overview
Strategy
Infrastructure Marketplace
Mining Marketplace
Summary
Exhibit I
Exhibit II
www.infrastructurecommodities.com © 2017
www.infrastructurecommodities.com © 2017
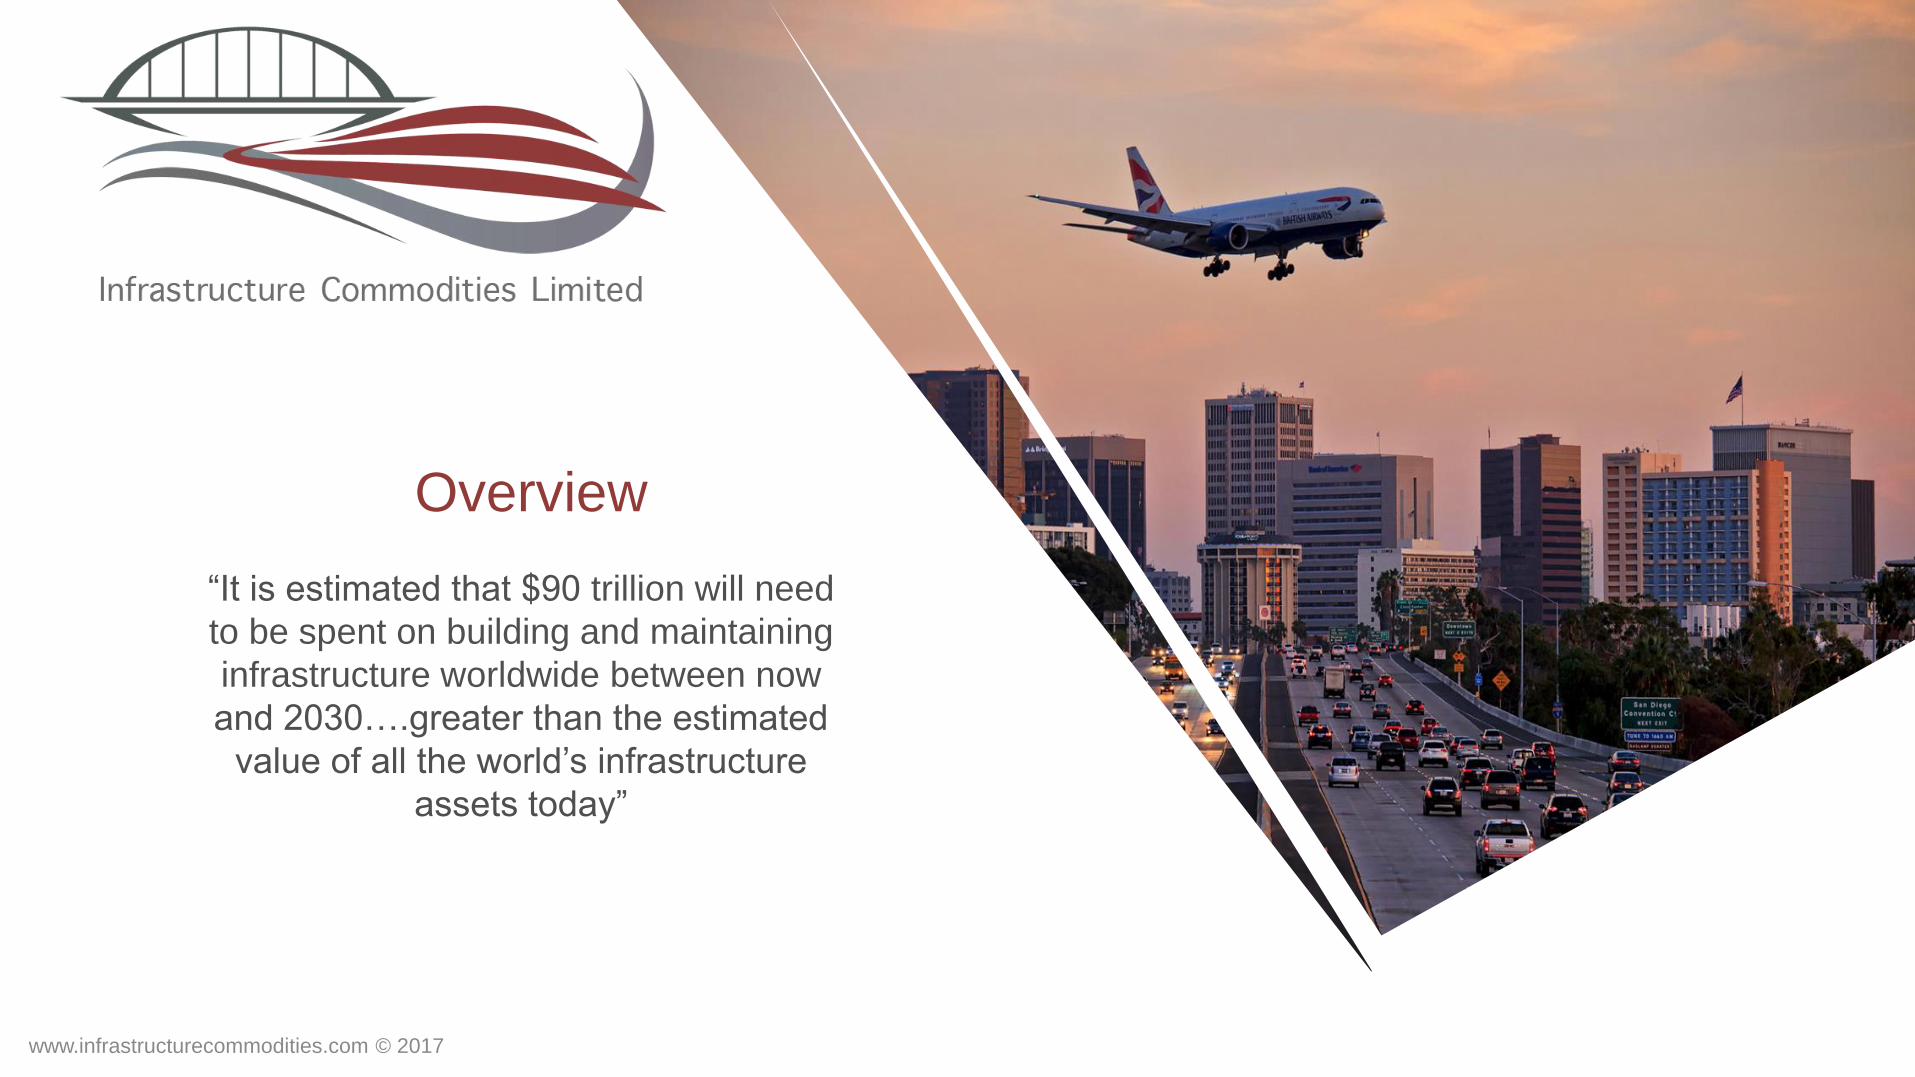
Overview
“It is estimated that $90 trillion will need
to be spent on building and maintaining
infrastructure worldwide between now
and 2030….greater than the estimated
value of all the world’s infrastructure
assets today”
Introduction
• Infrastructure Commodities is focused on developing and acquiring natural resources that will be needed for infrastructure.
• Infrastructure investment demand is estimated at $3.7 trillion per annum between now and 2030, fuelled by mass urbanisation, population growth and new government initiatives.
• Existing assets all acquired at or around the bottom of the cycle, all benefit from low cost base and no write downs.
• Long term outlook for portfolio is extremely positive, projecting significant returns in 5 year timeframe as demand for infrastructure commodities increases.
• Current Investment focus on direct private equity investments in commodities that are needed for infrastructures using the substantial resources and relationships of our manager.
www.infrastructurecommodities.com © 2017 4

Strategy
• Infrastructure Commodities build a portfolio of commodities that will benefit from unprecedented infrastructure investment.
• Funding gap exists in mining sector due to sector recent underperformance creating significant opportunity.
• Will only invest in high quality assets with realistic valuations.
• Demand will be fuelled by infrastructure deficit and obsolete existing infrastructure due to under investment.
• Recent announcements by governments to boost infrastructure spending will further fuel demand.
• Infrastructure Commodities will partner with major end users of infrastructure commodities.
• Public listing will create liquidity for existing shareholders.
www.infrastructurecommodities.com © 2017 5
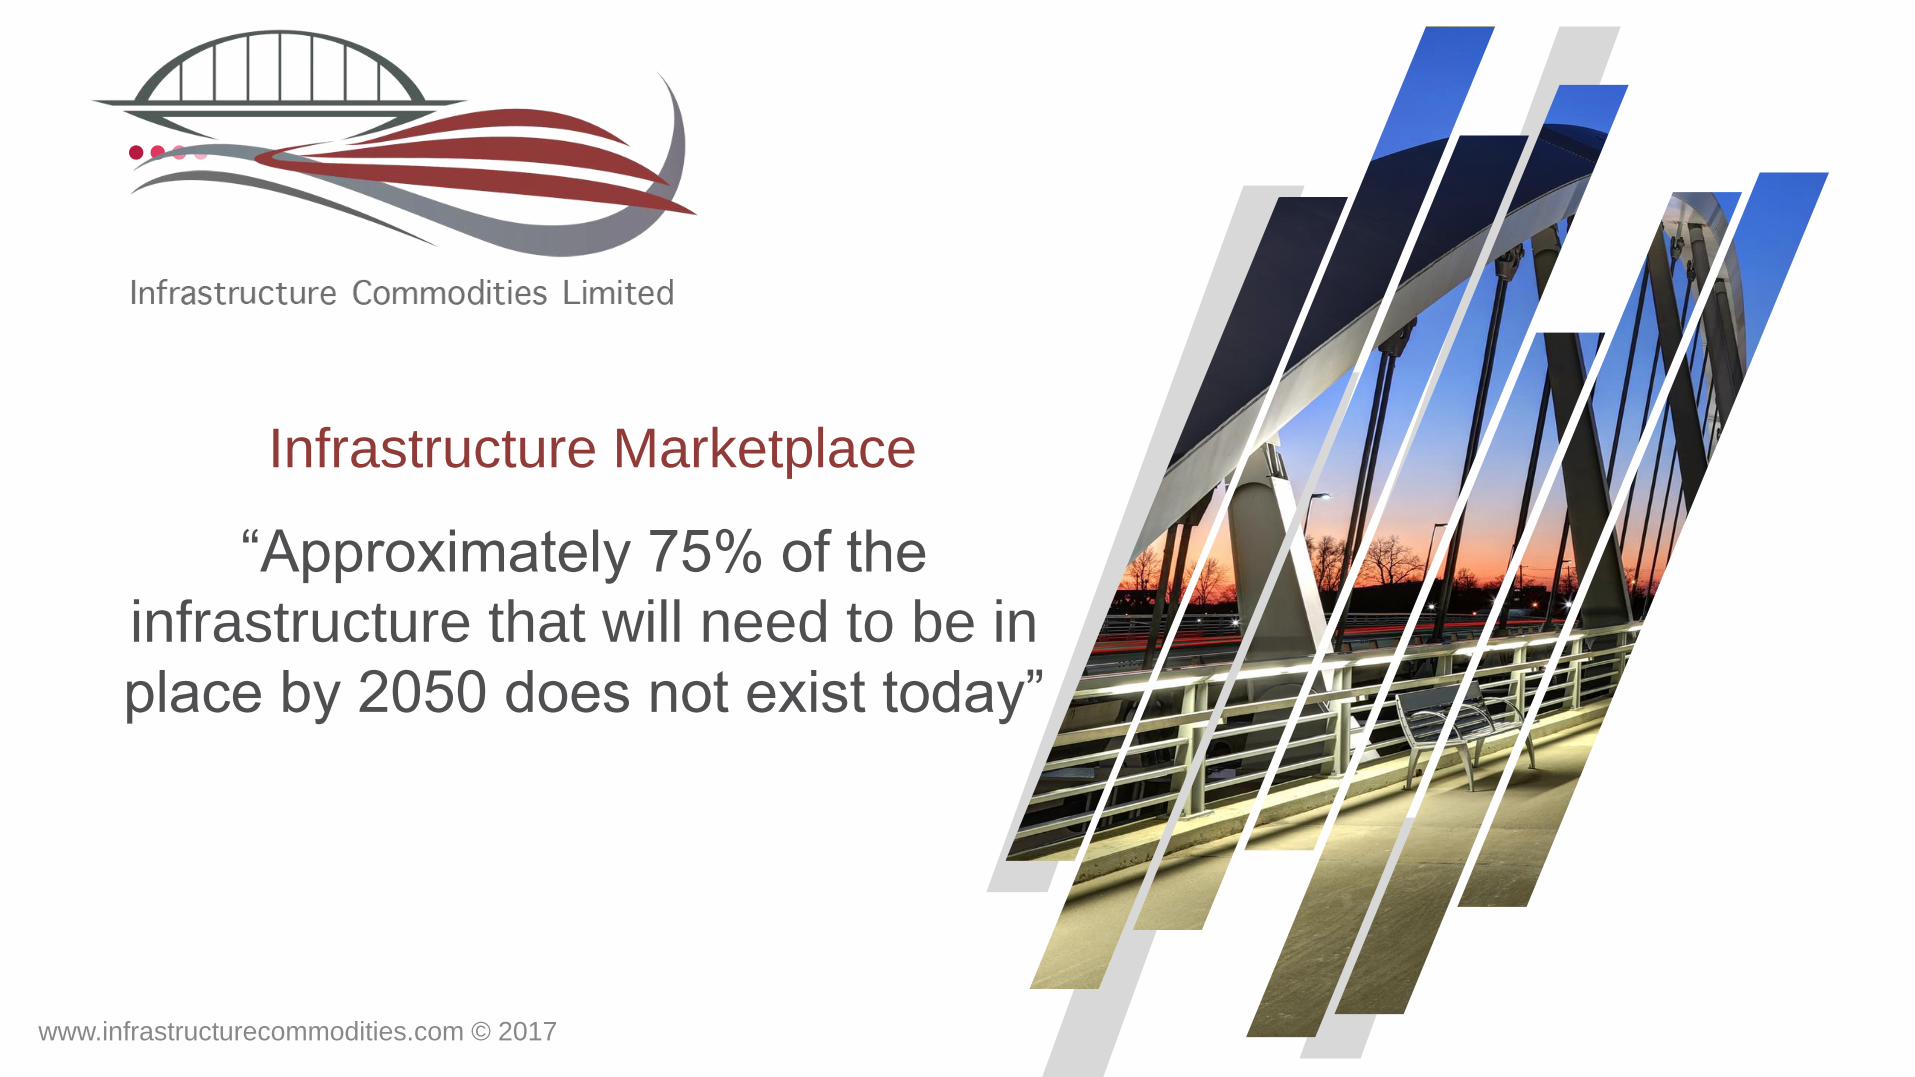
Infrastructure Marketplace
www.infrastructurecommodities.com © 2017
“Approximately 75% of the
infrastructure that will need to be in
place by 2050 does not exist today”
Market Opportunity in Infrastructure
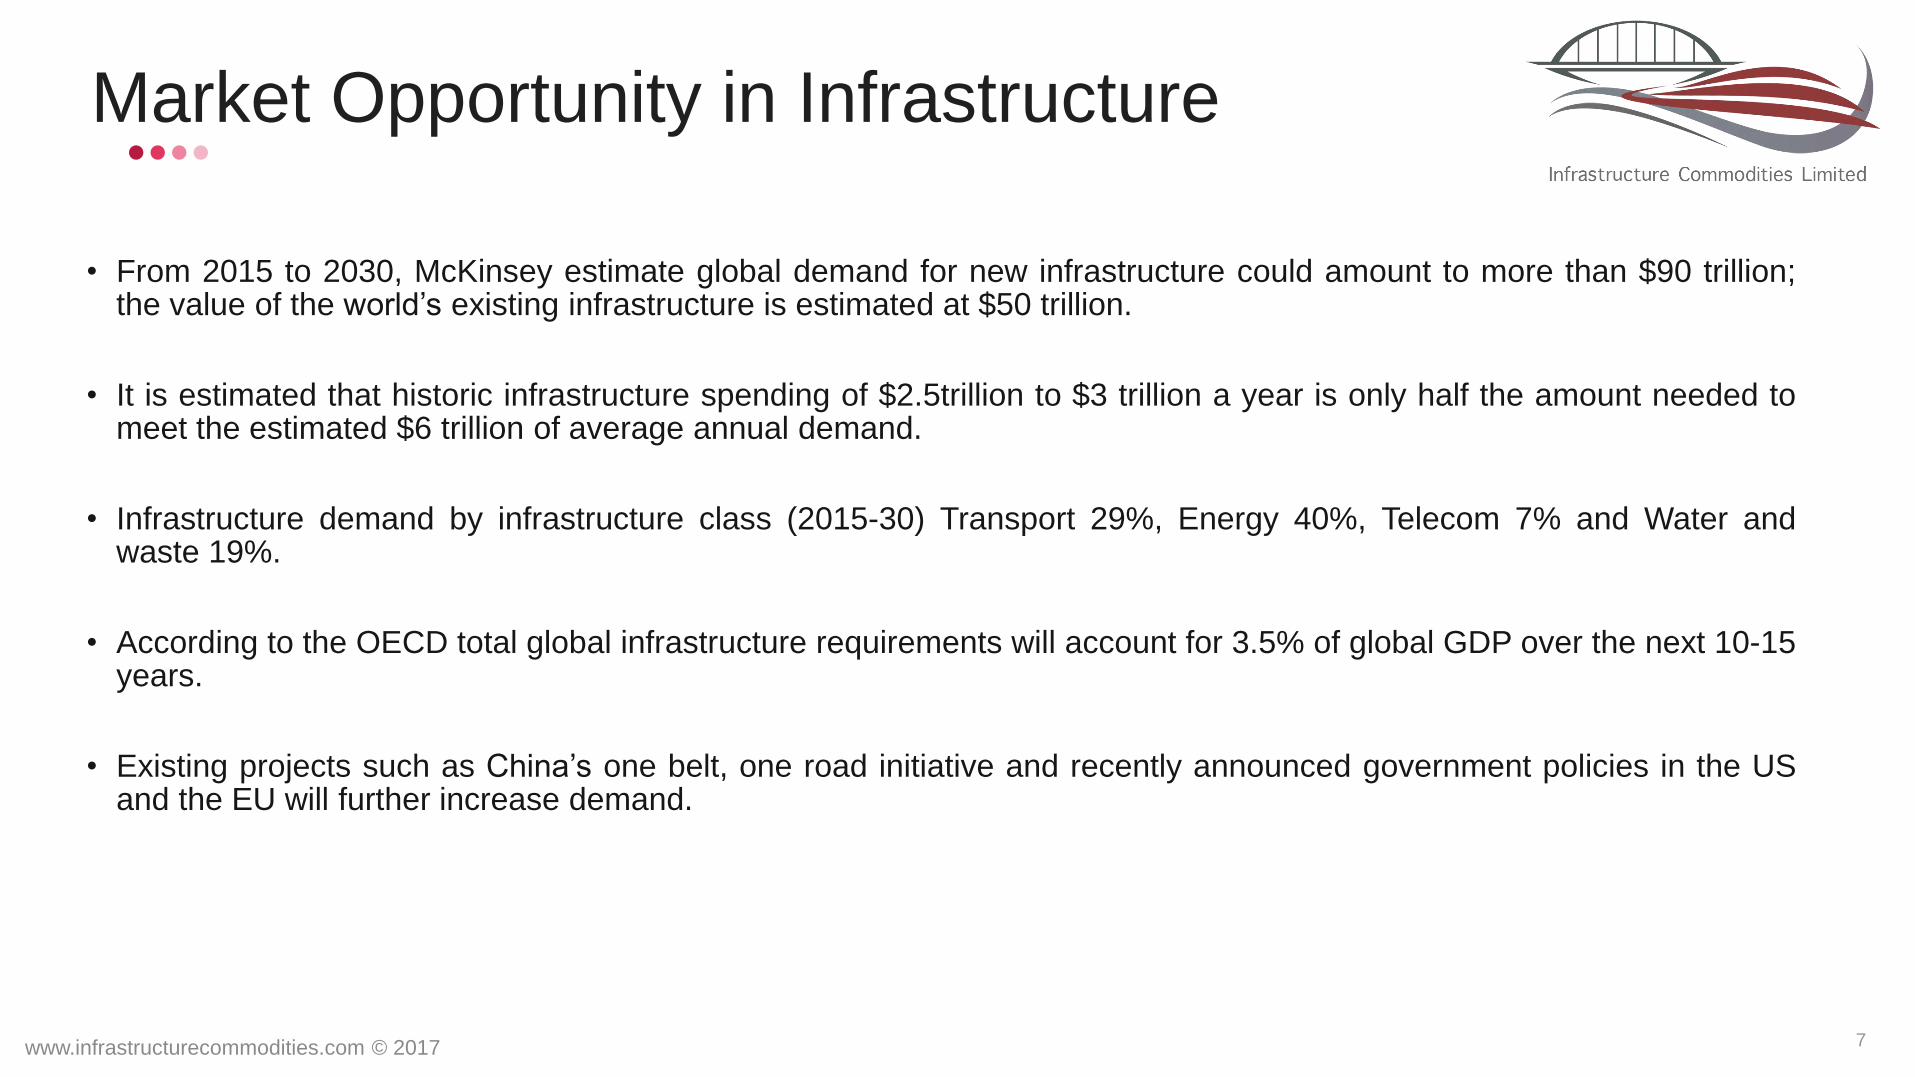
• From 2015 to 2030, McKinsey estimate global demand for new infrastructure could amount to more than $90 trillion; the value of the world’s existing infrastructure is estimated at $50 trillion.
• It is estimated that historic infrastructure spending of $2.5trillion to $3 trillion a year is only half the amount needed to meet the estimated $6 trillion of average annual demand.
• Infrastructure demand by infrastructure class (2015-30) Transport 29%, Energy 40%, Telecom 7% and Water and waste 19%.
• According to the OECD total global infrastructure requirements will account for 3.5% of global GDP over the next 10-15 years.
• Existing projects such as China’s one belt, one road initiative and recently announced government policies in the US and the EU will further increase demand.
www.infrastructurecommodities.com © 2017 7

Infrastructure Trends
• Rapid urbanisation in emerging economies and expanding urbanisation in mature economies requires governments to build new and improve existing infrastructure.
• Infrastructure typically involves high-cost long term investments that are essential to a country’s or business’ economic development and prosperity.
• Global infrastructure assets provide essential services that allow the global economy to function.
• Infrastructure investments are attractive to investors as there is significant demand, limited supply and stable long term income.
• The desire to invest in infrastructure as an asset class has never been stronger with huge amounts of capital available from pension, insurance and sovereign wealth funds.
www.infrastructurecommodities.com © 2017 8
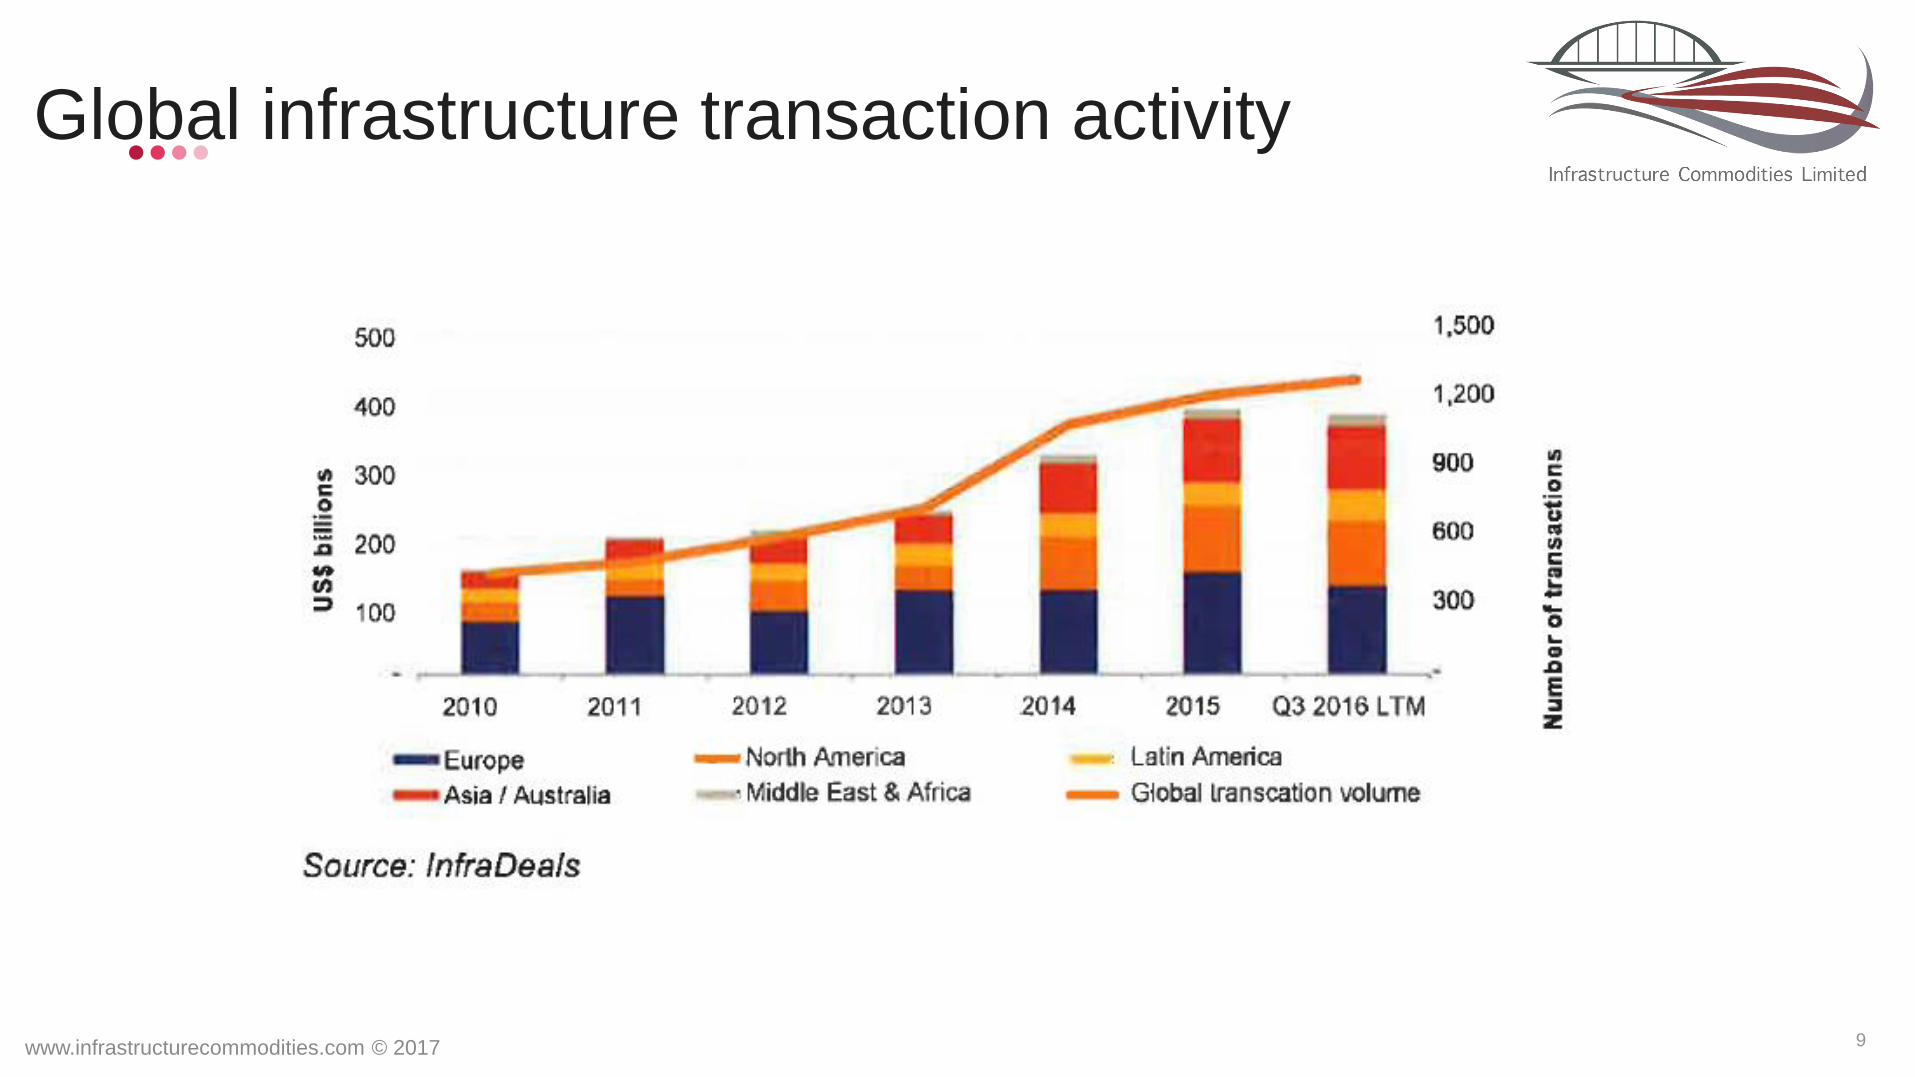
Global infrastructure transaction activity
www.infrastructurecommodities.com © 2017 9
www.infrastructurecommodities.com © 2017
Mining Marketplace
“Mined mineral production
$1.57 trillion per annum”
Production & Reserves of Mined Minerals
www.infrastructurecommodities.com © 2017 11
1.57
2.38
0
0.5
1
1.5
2
2.5
Mined MineralProduction
Oil and GasProduction
97.99
121.76
0
20
40
60
80
100
120
140
Mined MineralReserves
World Oil and GasReserves
$T
rilli
on
$T
rilli
on
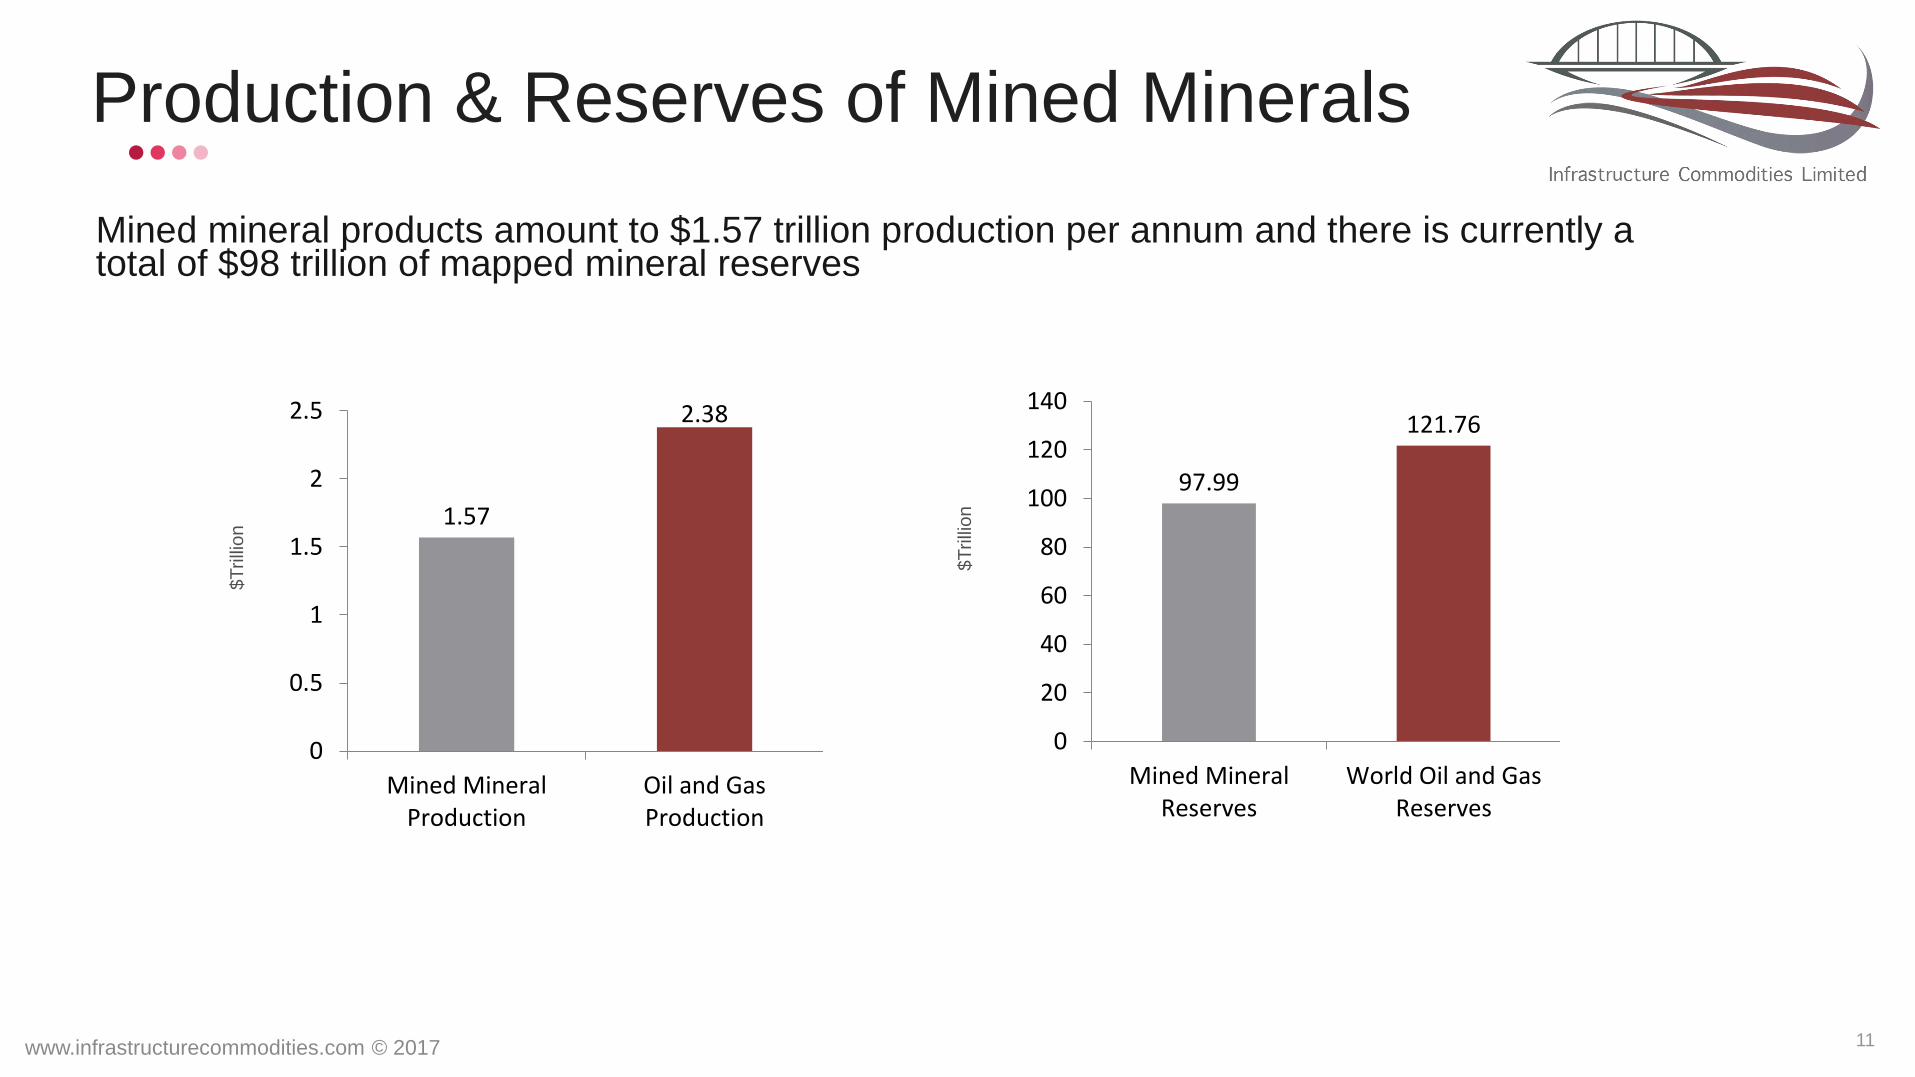
Mined mineral products amount to $1.57 trillion production per annum and there is currently a total of $98 trillion of mapped mineral reserves
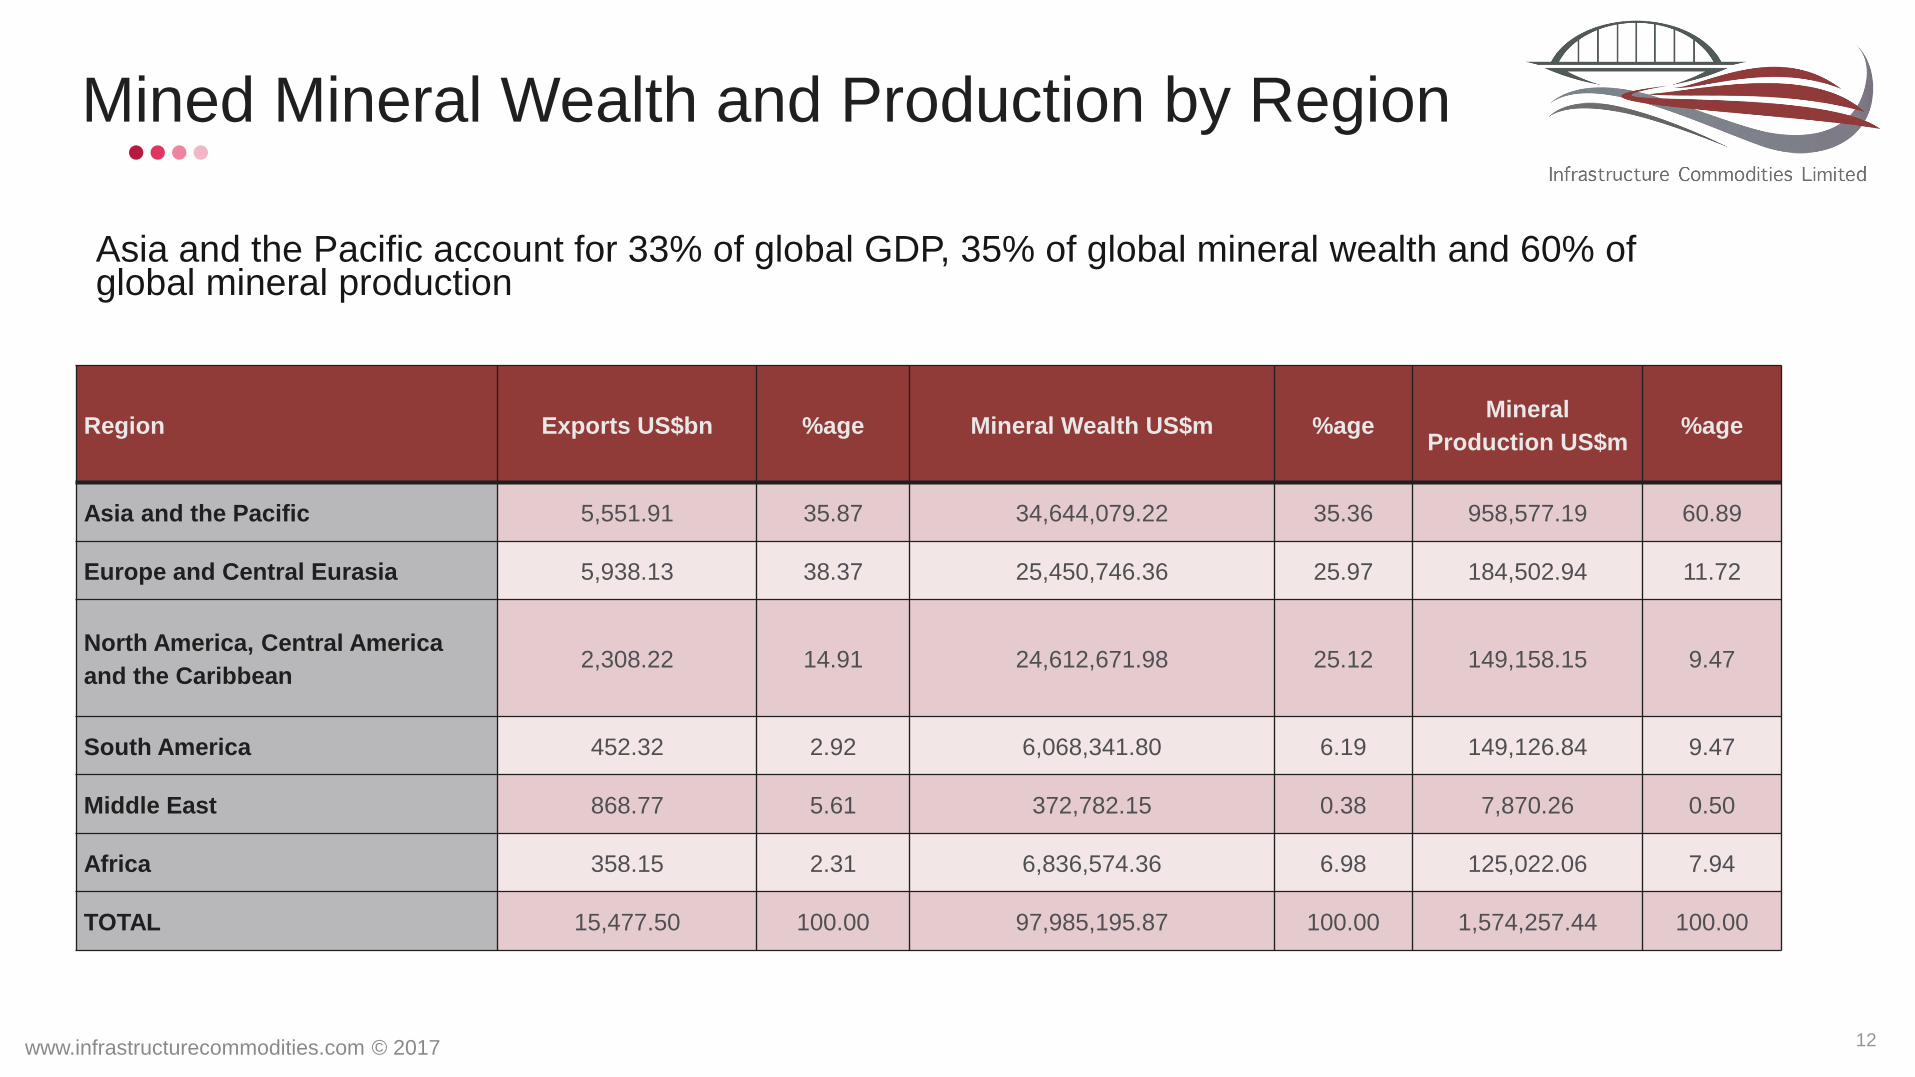
Mined Mineral Wealth and Production by Region
www.infrastructurecommodities.com © 2017 12
Region Exports US$bn %age Mineral Wealth US$m %age Mineral
Production US$m %age
Asia and the Pacific 5,551.91 35.87 34,644,079.22 35.36 958,577.19 60.89
Europe and Central Eurasia 5,938.13 38.37 25,450,746.36 25.97 184,502.94 11.72
North America, Central America
and the Caribbean 2,308.22 14.91 24,612,671.98 25.12 149,158.15 9.47
South America 452.32 2.92 6,068,341.80 6.19 149,126.84 9.47
Middle East 868.77 5.61 372,782.15 0.38 7,870.26 0.50
Africa 358.15 2.31 6,836,574.36 6.98 125,022.06 7.94
TOTAL 15,477.50 100.00 97,985,195.87 100.00 1,574,257.44 100.00
Asia and the Pacific account for 33% of global GDP, 35% of global mineral wealth and 60% of global mineral production

Value of top 20 Mining Companies by Commodity
www.infrastructurecommodities.com © 2017 13
$2
54
.06
$1
15
.08
$1
13
.54
$7
9.7
4 $1
39
.08
$7
7.5
0
$5
.20
$4
7.9
3
$6
4.4
8
$4
35
.73
$1
90
.30
$1
60
.61
$1
24
.83
$1
41
.08
$1
16
.02
$8
.08
$5
9.5
1
$9
9.6
1
0.00
50.00
100.00
150.00
200.00
250.00
300.00
350.00
400.00
450.00
500.00
Diversified Gold Metals Copper Coal Silver Diamond Potash Specialist
31st December 2015 31st December 2016
Bill
ion
s
www.infrastructurecommodities.com © 2017
Summary
“Supplying a
$3.7 trillion industry”

Projected Long Term Increase in Net Asset Value per share
www.infrastructurecommodities.com © 2017 15
$0.90
$1.42
$1.83
$2.60
$3.69
$4.57
0
0.5
1
1.5
2
2.5
3
3.5
4
4.5
5
31.03.17 31.03.18 31.03.19 31.03.20 31.03.21 31.03.22
$ per share
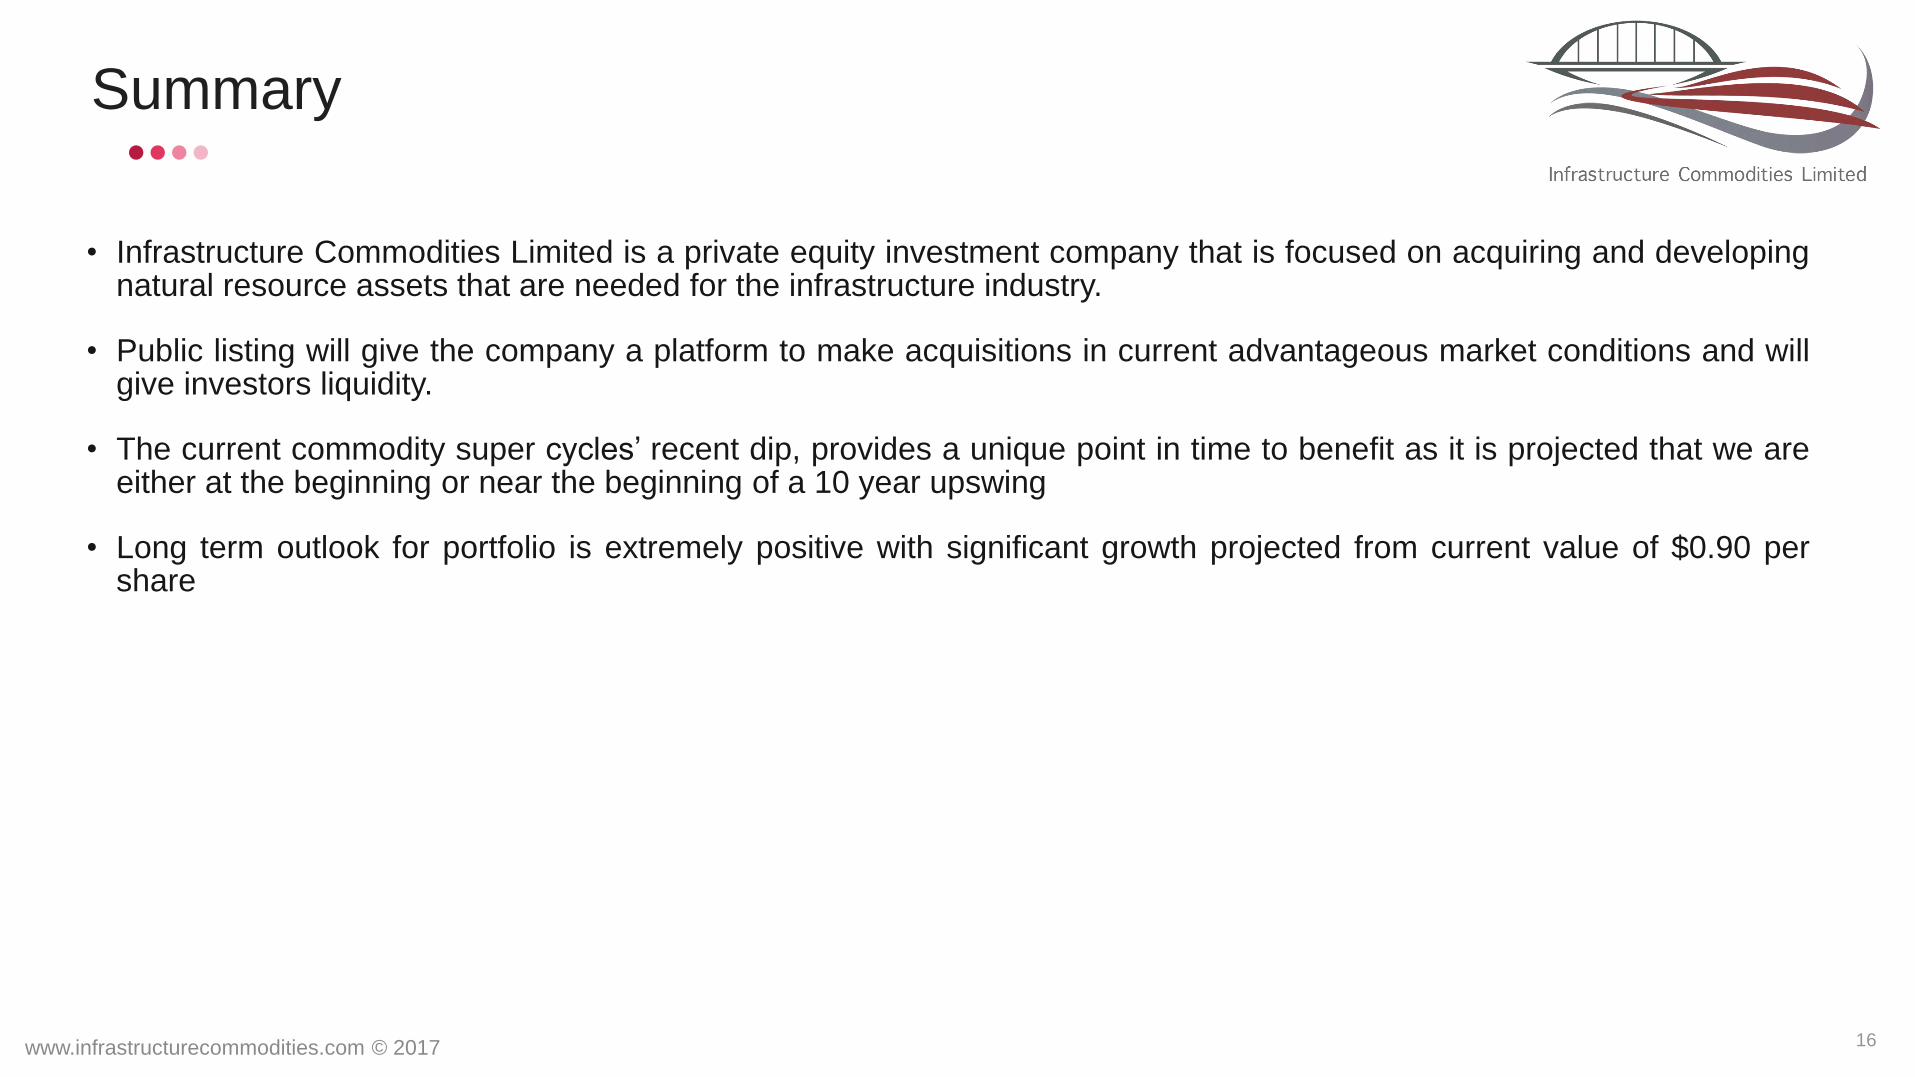
Summary
www.infrastructurecommodities.com © 2017 16
• Infrastructure Commodities Limited is a private equity investment company that is focused on acquiring and developing natural resource assets that are needed for the infrastructure industry.
• Public listing will give the company a platform to make acquisitions in current advantageous market conditions and will give investors liquidity.
• The current commodity super cycles’ recent dip, provides a unique point in time to benefit as it is projected that we are either at the beginning or near the beginning of a 10 year upswing
• Long term outlook for portfolio is extremely positive with significant growth projected from current value of $0.90 per share

Exhibit I
Key Infrastructure
Commodities
www.infrastructurecommodities.com © 2017 18
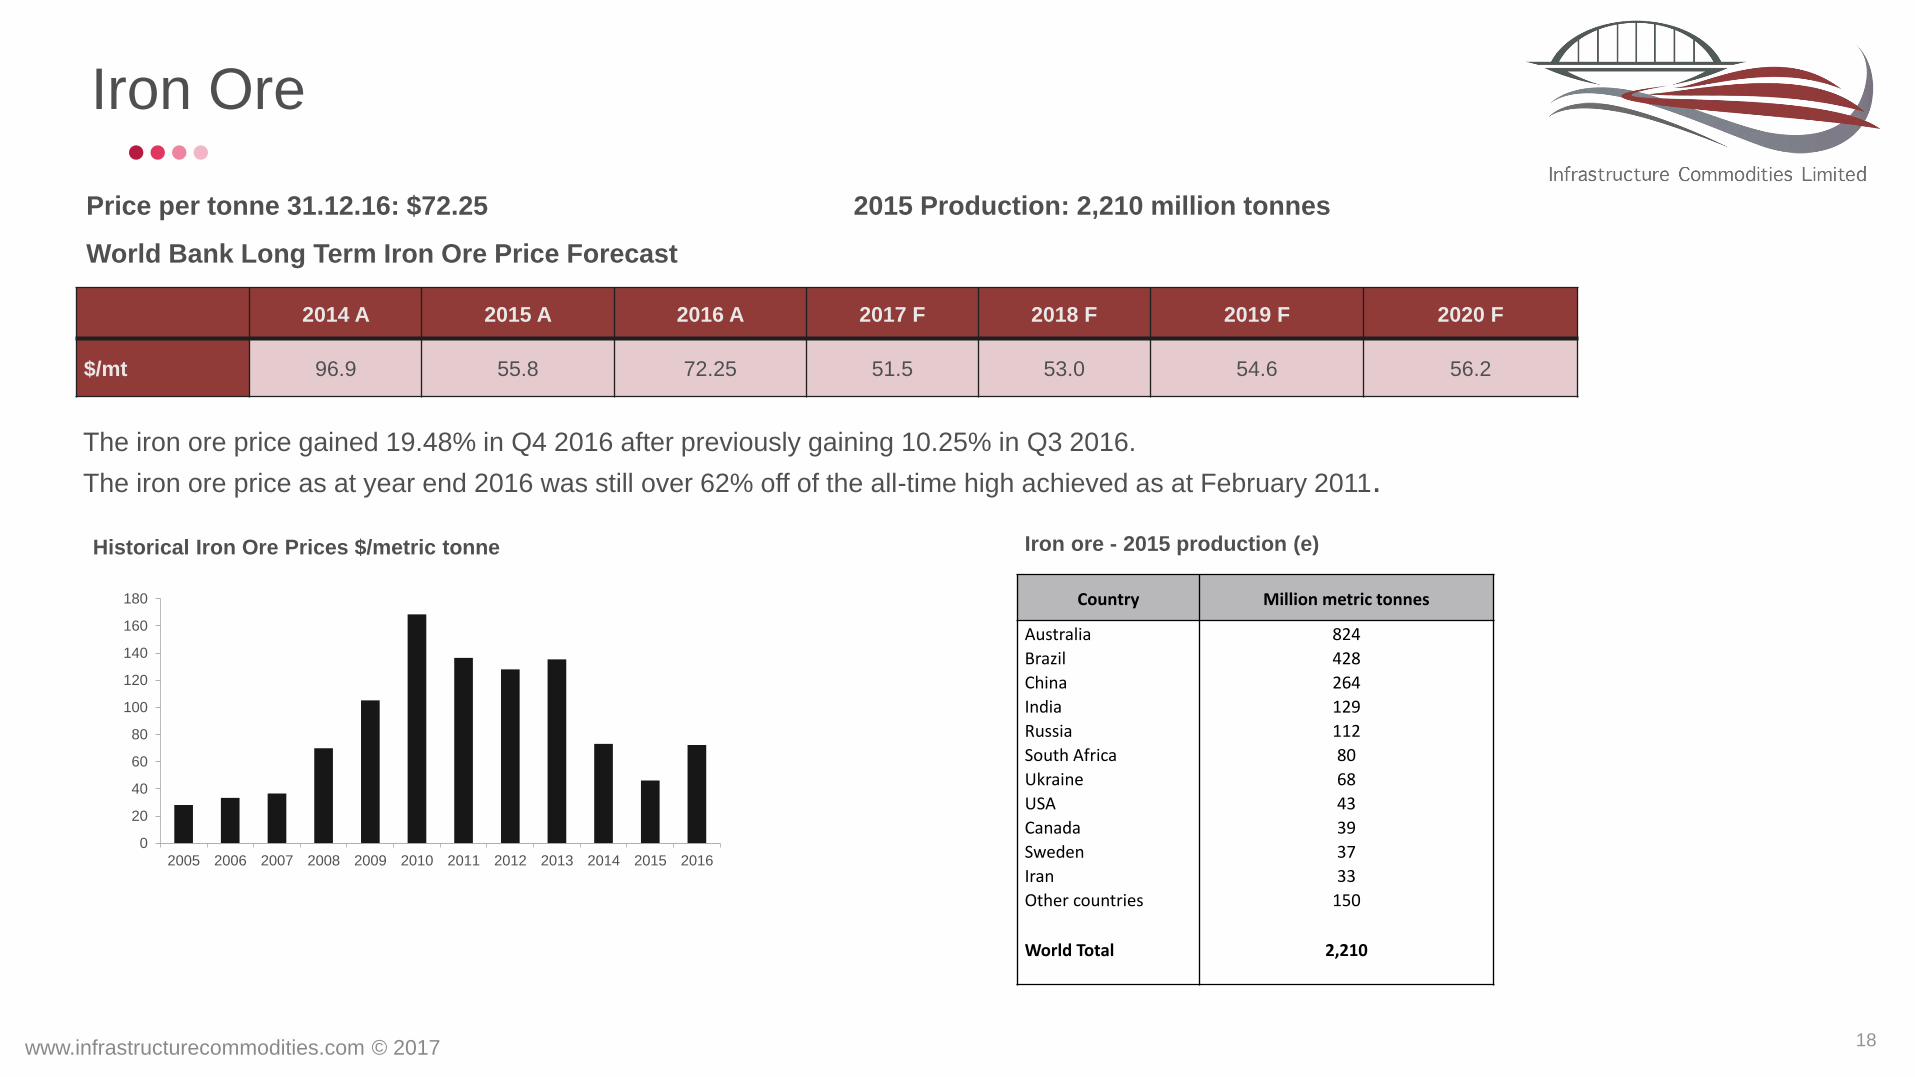
Iron Ore
Price per tonne 31.12.16: $72.25 2015 Production: 2,210 million tonnes
World Bank Long Term Iron Ore Price Forecast
2014 A 2015 A 2016 A 2017 F 2018 F 2019 F 2020 F
$/mt 96.9 55.8 72.25 51.5 53.0 54.6 56.2
The iron ore price gained 19.48% in Q4 2016 after previously gaining 10.25% in Q3 2016.
The iron ore price as at year end 2016 was still over 62% off of the all-time high achieved as at February 2011.
Historical Iron Ore Prices $/metric tonne
0
20
40
60
80
100
120
140
160
180
2005 2006 2007 2008 2009 2010 2011 2012 2013 2014 2015 2016
Iron ore - 2015 production (e)
Country Million metric tonnes
Australia 824
Brazil 428
China 264
India 129
Russia 112
South Africa 80
Ukraine 68
USA 43
Canada 39
Sweden 37
Iran 33
Other countries
150
World Total 2,210

www.infrastructurecommodities.com © 2017 19
Copper
Price per tonne 31.12.16: $5,501.00 2015 Production: 18,700,000 tonnes
World Bank Long Term Copper Price Forecast
2014 F 2015 F 2016 A 2017 F 2018 F 2019 F 2020 F
$/mt 6,863 5,510 5,501 5,190 5,388 5,593 5,807
The copper price increased by 14.43% in Q4 2016 after previously increasing slightly by 0.58% in Q3 2016.
The copper price as at 31st Dec. 2016 was just under 46% off of the all-time high achieved as at February 2011.
Historical Copper Prices $/mt
0
1,000
2,000
3,000
4,000
5,000
6,000
7,000
8,000
9,000
10,000
2005 2006 2007 2008 2009 2010 2011 2012 2013 2014 2015 2016
Country Metric tonnes
Chile 5,700,000
China 1,750,000
Peru 1,600,000
USA 1,250,000
Congo (Kinshasa) 990,000
Australia 960,000
Russia 740,000
Canada 695,000
Zambia 600,000
Mexico 550,000
Other countries 3,900,000
World Total 18,700,000
Copper – 2015 production (e)
www.infrastructurecommodities.com © 2017 20
Steam/Thermal Coal
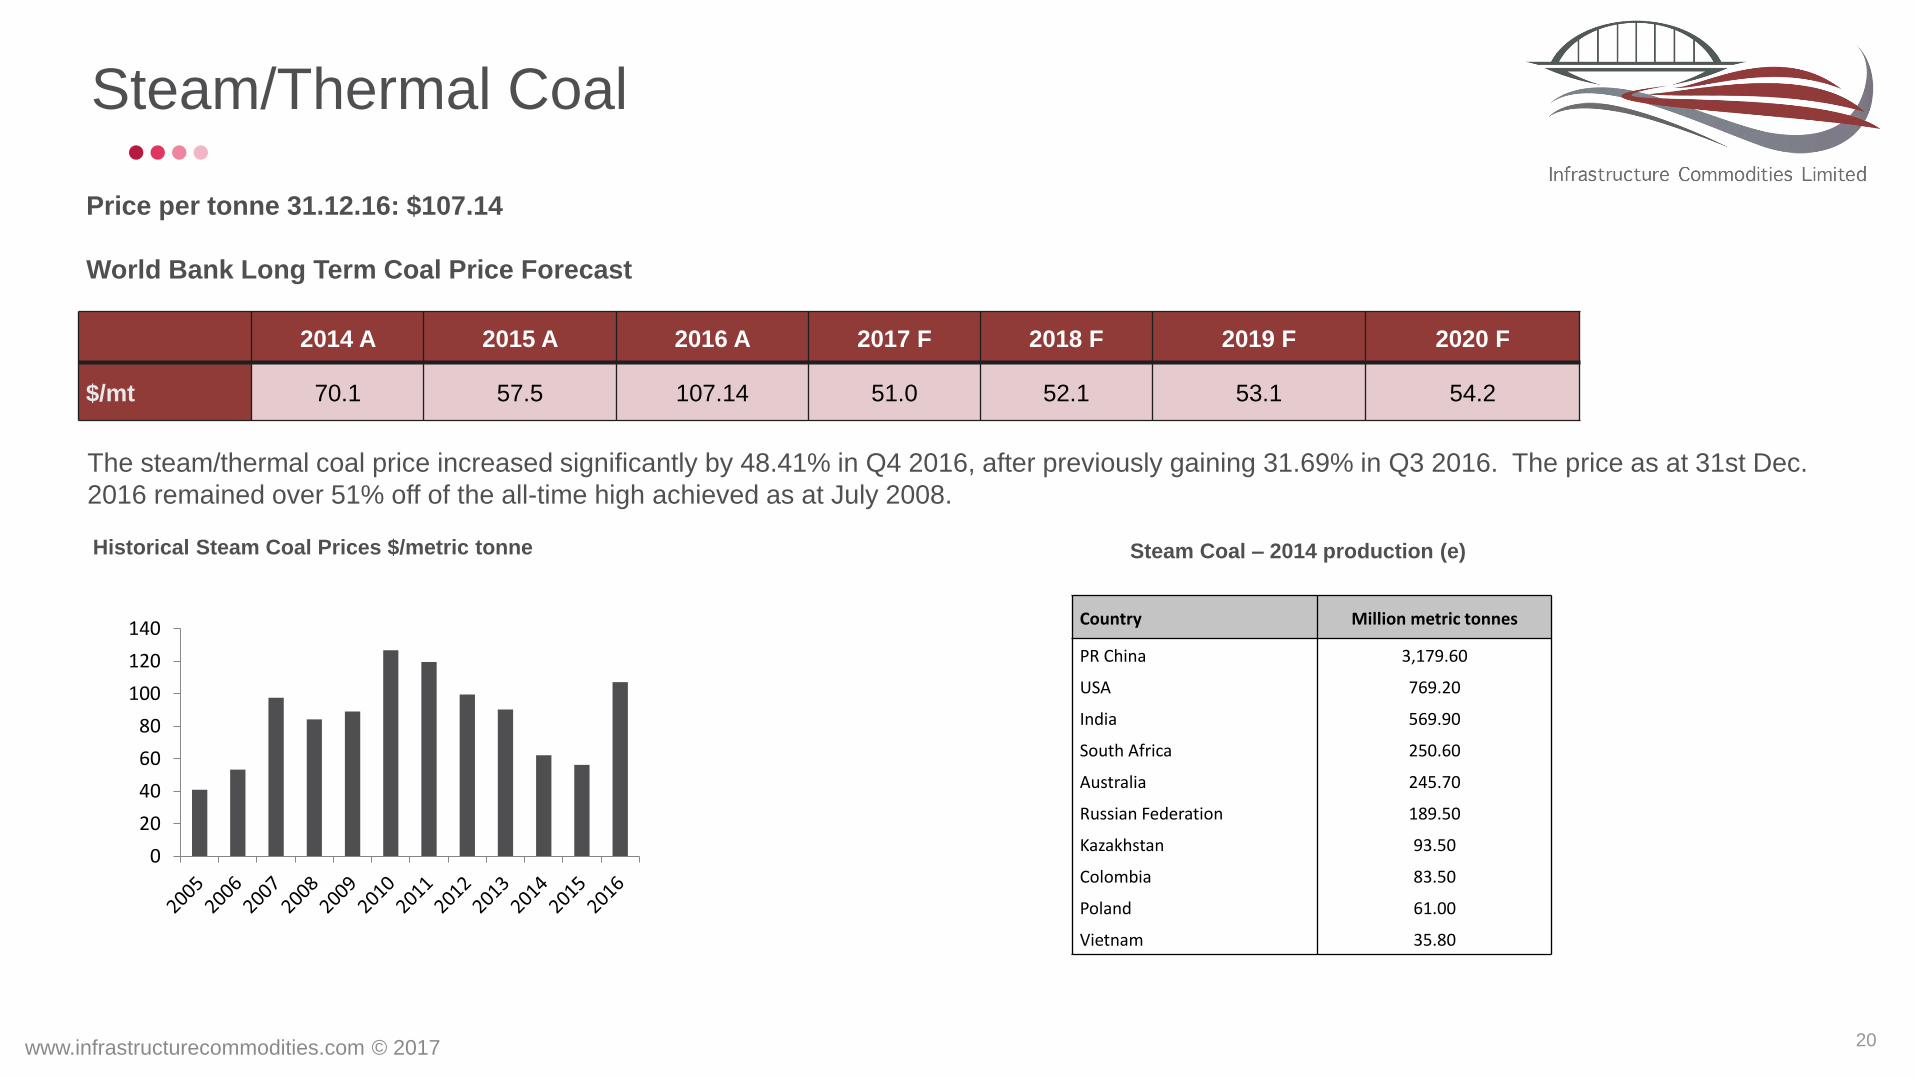
Price per tonne 31.12.16: $107.14
World Bank Long Term Coal Price Forecast
2014 A 2015 A 2016 A 2017 F 2018 F 2019 F 2020 F
$/mt 70.1 57.5 107.14 51.0 52.1 53.1 54.2
The steam/thermal coal price increased significantly by 48.41% in Q4 2016, after previously gaining 31.69% in Q3 2016. The price as at 31st Dec.
2016 remained over 51% off of the all-time high achieved as at July 2008.
Historical Steam Coal Prices $/metric tonne Steam Coal – 2014 production (e)
0
20
40
60
80
100
120
140 Country Million metric tonnes
PR China 3,179.60
USA 769.20
India 569.90
South Africa 250.60
Australia 245.70
Russian Federation 189.50
Kazakhstan 93.50
Colombia 83.50
Poland 61.00
Vietnam 35.80
www.infrastructurecommodities.com © 2017 21
Zinc
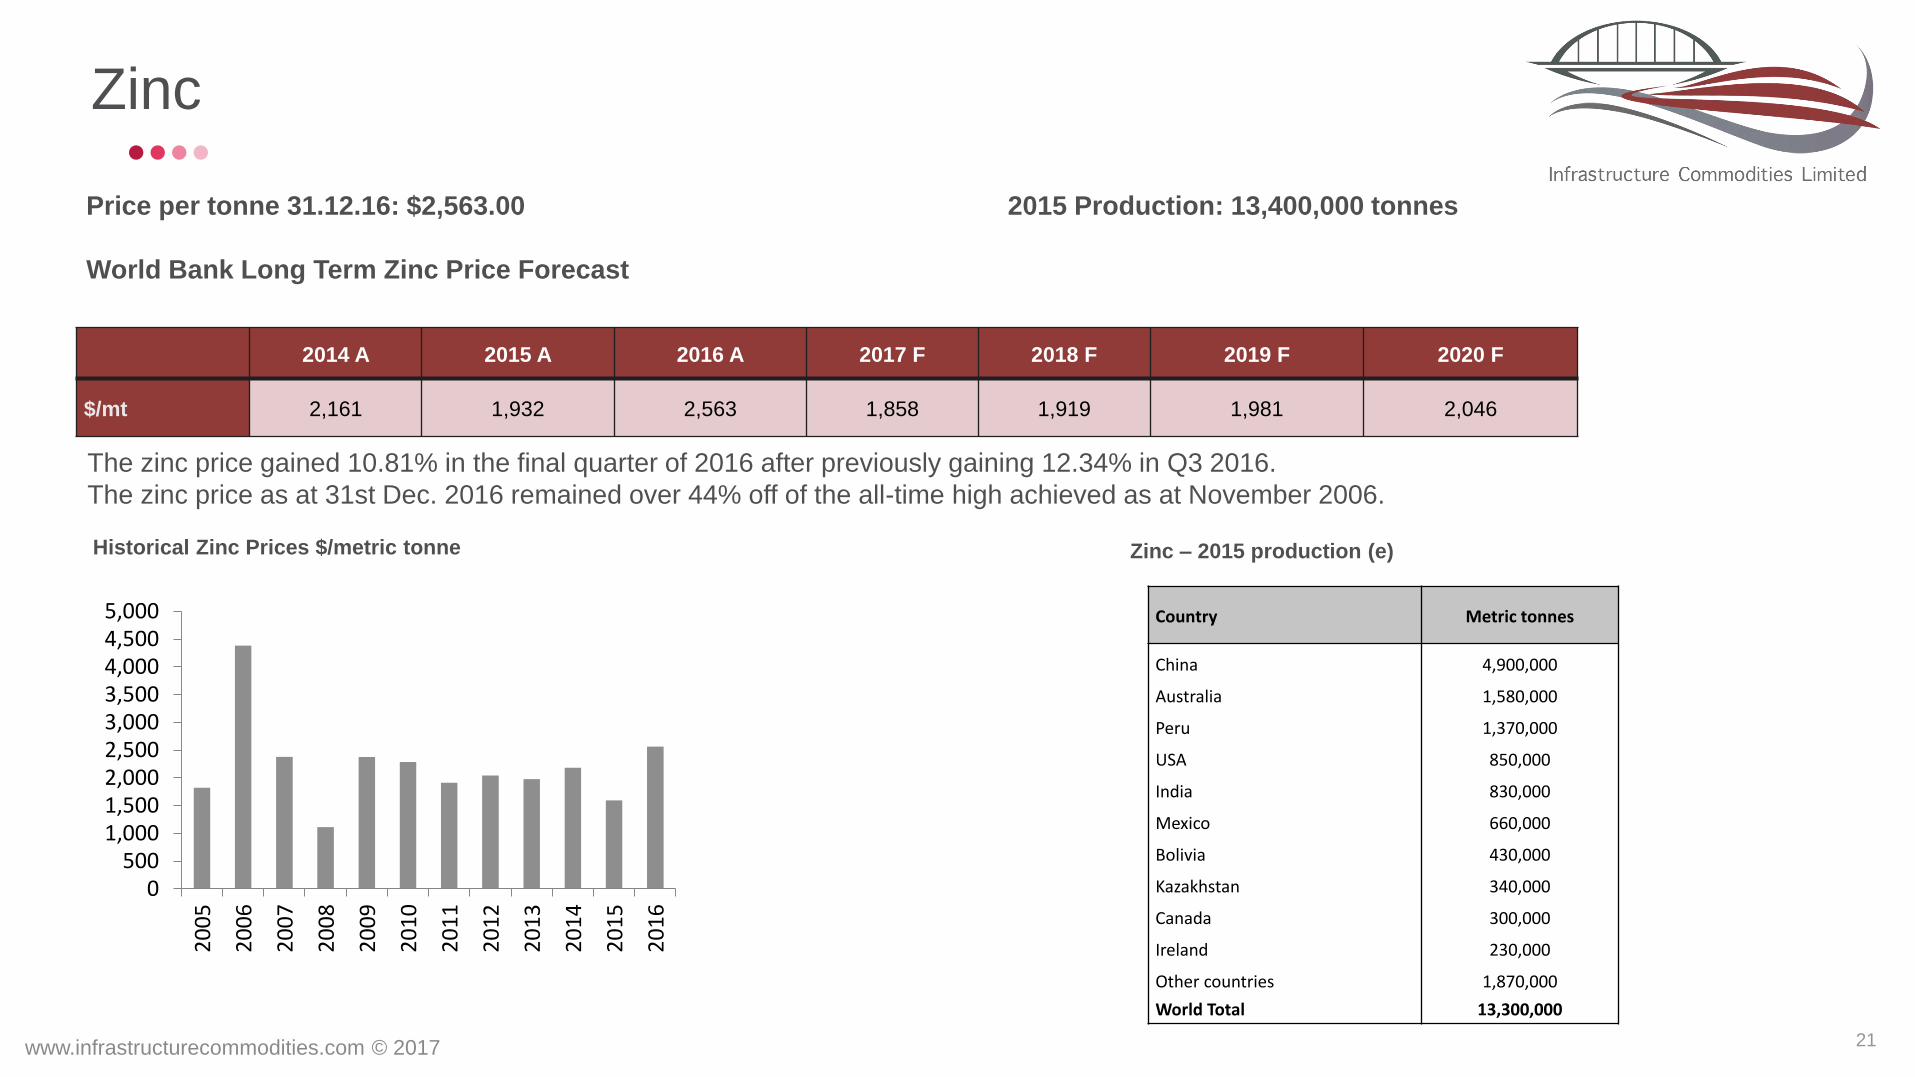
Price per tonne 31.12.16: $2,563.00 2015 Production: 13,400,000 tonnes
World Bank Long Term Zinc Price Forecast
2014 A 2015 A 2016 A 2017 F 2018 F 2019 F 2020 F
$/mt 2,161 1,932 2,563 1,858 1,919 1,981 2,046
The zinc price gained 10.81% in the final quarter of 2016 after previously gaining 12.34% in Q3 2016.
The zinc price as at 31st Dec. 2016 remained over 44% off of the all-time high achieved as at November 2006.
Historical Zinc Prices $/metric tonne Zinc – 2015 production (e)
0500
1,0001,5002,0002,5003,0003,5004,0004,5005,000
20
05
20
06
20
07
20
08
20
09
20
10
20
11
20
12
20
13
20
14
20
15
20
16
Country Metric tonnes
China 4,900,000
Australia 1,580,000
Peru 1,370,000
USA 850,000
India 830,000
Mexico 660,000
Bolivia 430,000
Kazakhstan 340,000
Canada 300,000
Ireland 230,000
Other countries 1,870,000
World Total 13,300,000

www.infrastructurecommodities.com © 2017 22
Metals and Minerals: Aluminium
Price per tonne 31.12.16: $1,713.50 2015 Production: 58,300,000 tonnes
World Bank Long Term Aluminium Price Forecast
2014 A 2015 A 2016 A 2017 F 2018 F 2019 F 2020 F
$/mt 1,867 1,665 1,713 1,649 1,700 1,752 1,806
The aluminium price gained 3.94% in the final quarter of 2016 after previously increasing by 2.14% in Q3 2016.
The aluminium price as at 31st Dec. 2016 was almost 48% off of the all-time high achieved as at July 2008.
Historical Aluminium Prices $/metric tonne Aluminium – 2015 production (e)
0
500
1,000
1,500
2,000
2,500
3,000
2005 2006 2007 2008 2009 2010 2011 2012 2013 2014 2015 2016
Country Metric tonnes
China 32,000,000
Russia 3,500,000
Canada 2,900,000
India 2,350,000
United Arab Emirates 2,340,000
Australia 1,650,000
USA 1,600,000
Norway 1,320,000
Bahrain 960,000
Iceland 820,000
Brazil 780,000
Saudi Arabia 740,000
South Africa 690,000
Qatar 640,000
Other countries 6,010,000
World Total 58,300,000
www.infrastructurecommodities.com © 2017 23
Lead
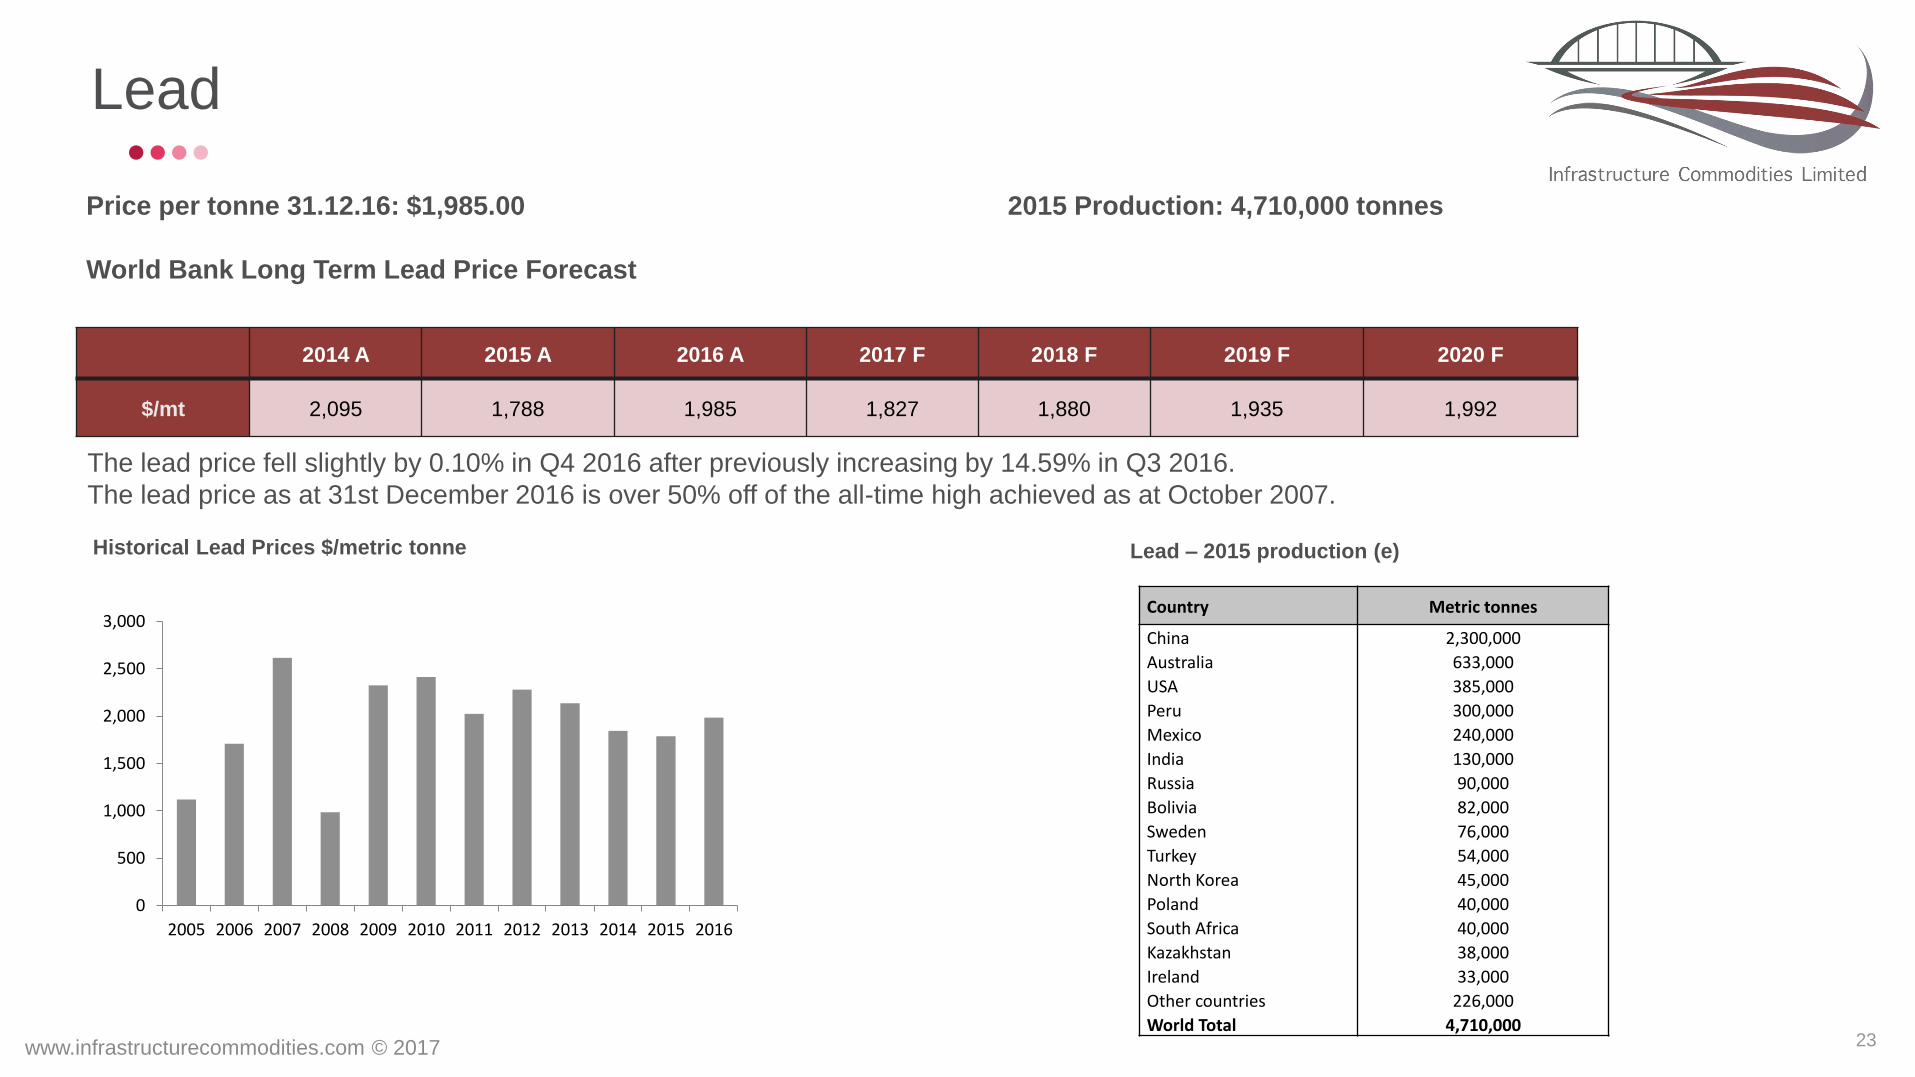
Price per tonne 31.12.16: $1,985.00 2015 Production: 4,710,000 tonnes
World Bank Long Term Lead Price Forecast
2014 A 2015 A 2016 A 2017 F 2018 F 2019 F 2020 F
$/mt 2,095 1,788 1,985 1,827 1,880 1,935 1,992
The lead price fell slightly by 0.10% in Q4 2016 after previously increasing by 14.59% in Q3 2016.
The lead price as at 31st December 2016 is over 50% off of the all-time high achieved as at October 2007.
Historical Lead Prices $/metric tonne Lead – 2015 production (e)
0
500
1,000
1,500
2,000
2,500
3,000
2005 2006 2007 2008 2009 2010 2011 2012 2013 2014 2015 2016
Country Metric tonnes
China 2,300,000
Australia 633,000
USA 385,000
Peru 300,000
Mexico 240,000
India 130,000
Russia 90,000
Bolivia 82,000
Sweden 76,000
Turkey 54,000
North Korea 45,000
Poland 40,000
South Africa 40,000
Kazakhstan 38,000
Ireland 33,000
Other countries 226,000
World Total 4,710,000
www.infrastructurecommodities.com © 2017 24
Nickel
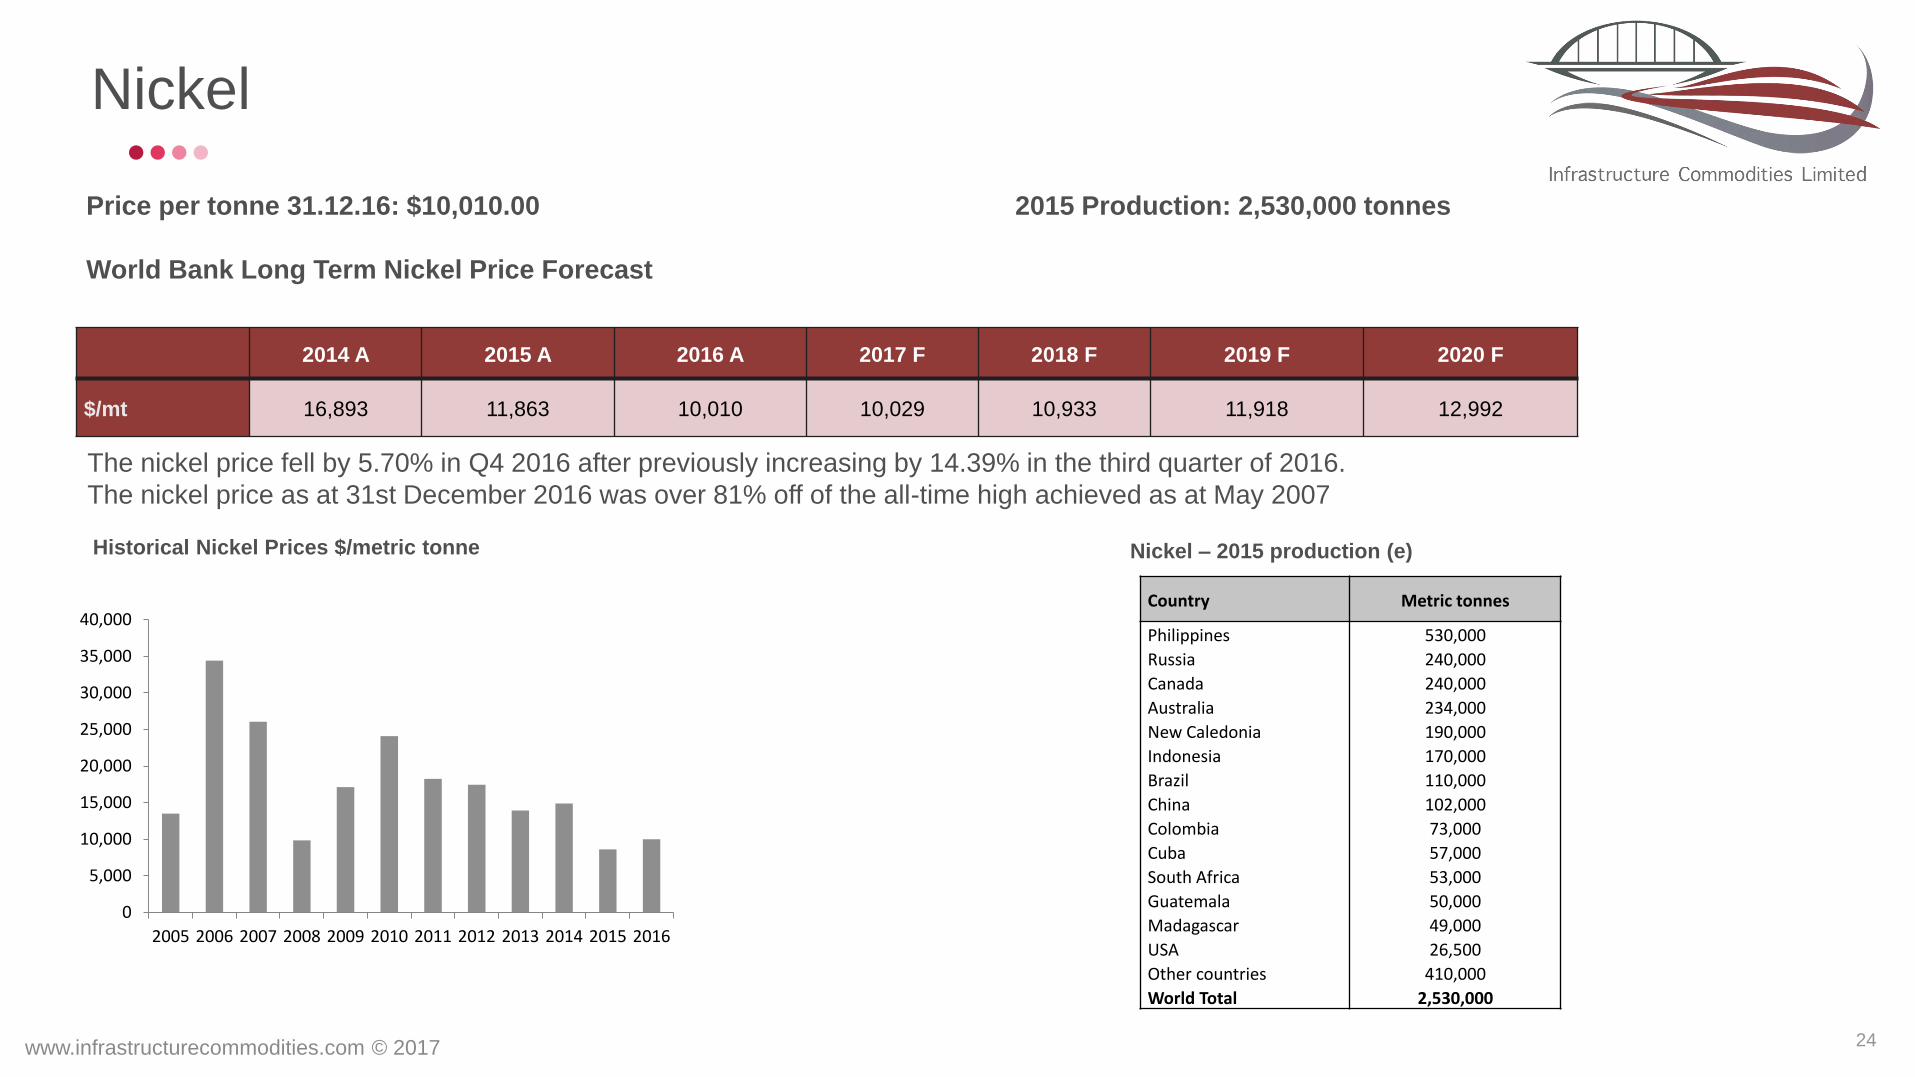
Price per tonne 31.12.16: $10,010.00 2015 Production: 2,530,000 tonnes
World Bank Long Term Nickel Price Forecast
2014 A 2015 A 2016 A 2017 F 2018 F 2019 F 2020 F
$/mt 16,893 11,863 10,010 10,029 10,933 11,918 12,992
The nickel price fell by 5.70% in Q4 2016 after previously increasing by 14.39% in the third quarter of 2016.
The nickel price as at 31st December 2016 was over 81% off of the all-time high achieved as at May 2007
Historical Nickel Prices $/metric tonne Nickel – 2015 production (e)
0
5,000
10,000
15,000
20,000
25,000
30,000
35,000
40,000
2005 2006 2007 2008 2009 2010 2011 2012 2013 2014 2015 2016
Country Metric tonnes
Philippines 530,000
Russia 240,000
Canada 240,000
Australia 234,000
New Caledonia 190,000
Indonesia 170,000
Brazil 110,000
China 102,000
Colombia 73,000
Cuba 57,000
South Africa 53,000
Guatemala 50,000
Madagascar 49,000
USA 26,500
Other countries 410,000
World Total 2,530,000

Exhibit II
Public Mining and
Infrastructure Companies
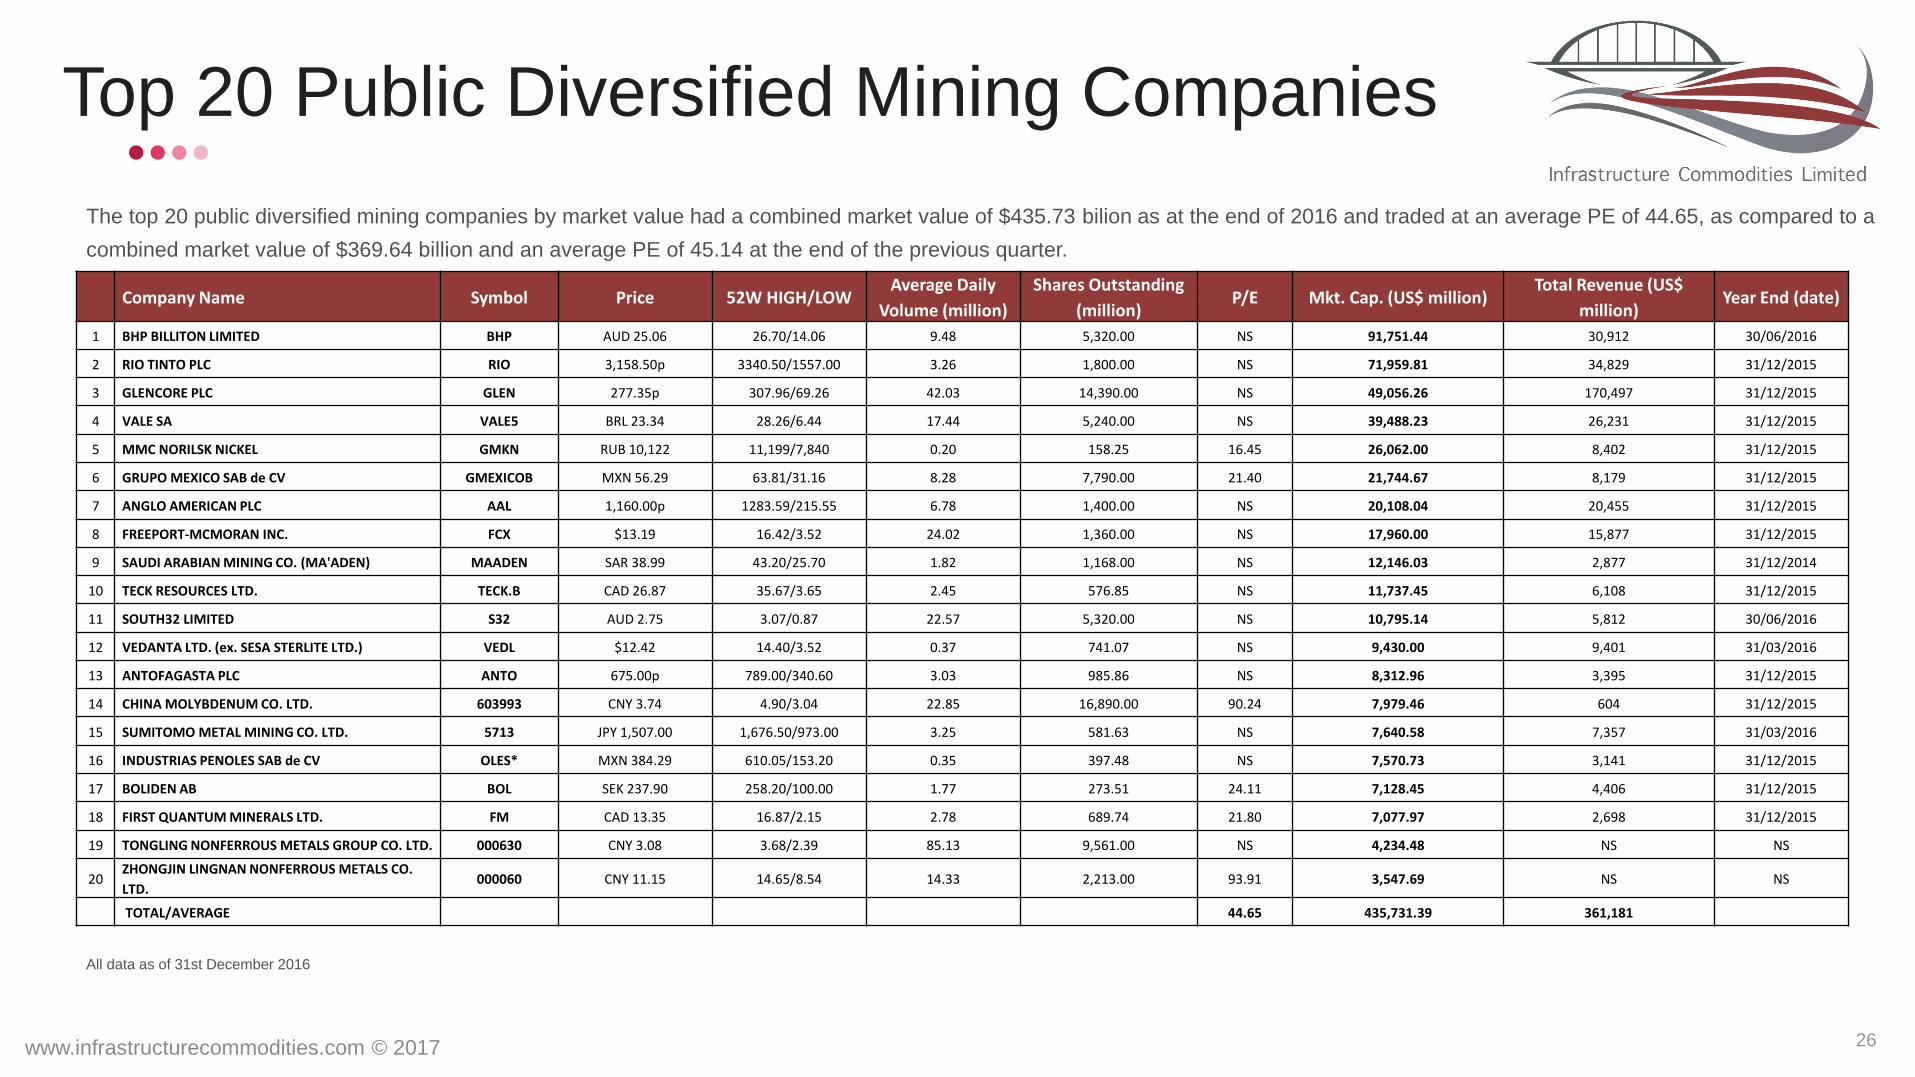
Top 20 Public Diversified Mining Companies
The top 20 public diversified mining companies by market value had a combined market value of $435.73 bilion as at the end of 2016 and traded at an average PE of 44.65, as compared to a
combined market value of $369.64 billion and an average PE of 45.14 at the end of the previous quarter.
www.infrastructurecommodities.com © 2017 26
Company Name Symbol Price 52W HIGH/LOW Average Daily
Volume (million)
Shares Outstanding
(million) P/E Mkt. Cap. (US$ million)
Total Revenue (US$
million) Year End (date)
1 BHP BILLITON LIMITED BHP AUD 25.06 26.70/14.06 9.48 5,320.00 NS 91,751.44 30,912 30/06/2016
2 RIO TINTO PLC RIO 3,158.50p 3340.50/1557.00 3.26 1,800.00 NS 71,959.81 34,829 31/12/2015
3 GLENCORE PLC GLEN 277.35p 307.96/69.26 42.03 14,390.00 NS 49,056.26 170,497 31/12/2015
4 VALE SA VALE5 BRL 23.34 28.26/6.44 17.44 5,240.00 NS 39,488.23 26,231 31/12/2015
5 MMC NORILSK NICKEL GMKN RUB 10,122 11,199/7,840 0.20 158.25 16.45 26,062.00 8,402 31/12/2015
6 GRUPO MEXICO SAB de CV GMEXICOB MXN 56.29 63.81/31.16 8.28 7,790.00 21.40 21,744.67 8,179 31/12/2015
7 ANGLO AMERICAN PLC AAL 1,160.00p 1283.59/215.55 6.78 1,400.00 NS 20,108.04 20,455 31/12/2015
8 FREEPORT-MCMORAN INC. FCX $13.19 16.42/3.52 24.02 1,360.00 NS 17,960.00 15,877 31/12/2015
9 SAUDI ARABIAN MINING CO. (MA'ADEN) MAADEN SAR 38.99 43.20/25.70 1.82 1,168.00 NS 12,146.03 2,877 31/12/2014
10 TECK RESOURCES LTD. TECK.B CAD 26.87 35.67/3.65 2.45 576.85 NS 11,737.45 6,108 31/12/2015
11 SOUTH32 LIMITED S32 AUD 2.75 3.07/0.87 22.57 5,320.00 NS 10,795.14 5,812 30/06/2016
12 VEDANTA LTD. (ex. SESA STERLITE LTD.) VEDL $12.42 14.40/3.52 0.37 741.07 NS 9,430.00 9,401 31/03/2016
13 ANTOFAGASTA PLC ANTO 675.00p 789.00/340.60 3.03 985.86 NS 8,312.96 3,395 31/12/2015
14 CHINA MOLYBDENUM CO. LTD. 603993 CNY 3.74 4.90/3.04 22.85 16,890.00 90.24 7,979.46 604 31/12/2015
15 SUMITOMO METAL MINING CO. LTD. 5713 JPY 1,507.00 1,676.50/973.00 3.25 581.63 NS 7,640.58 7,357 31/03/2016
16 INDUSTRIAS PENOLES SAB de CV OLES* MXN 384.29 610.05/153.20 0.35 397.48 NS 7,570.73 3,141 31/12/2015
17 BOLIDEN AB BOL SEK 237.90 258.20/100.00 1.77 273.51 24.11 7,128.45 4,406 31/12/2015
18 FIRST QUANTUM MINERALS LTD. FM CAD 13.35 16.87/2.15 2.78 689.74 21.80 7,077.97 2,698 31/12/2015
19 TONGLING NONFERROUS METALS GROUP CO. LTD. 000630 CNY 3.08 3.68/2.39 85.13 9,561.00 NS 4,234.48 NS NS
20 ZHONGJIN LINGNAN NONFERROUS METALS CO.
LTD. 000060 CNY 11.15 14.65/8.54 14.33 2,213.00 93.91 3,547.69 NS NS
TOTAL/AVERAGE 44.65 435,731.39 361,181
All data as of 31st December 2016
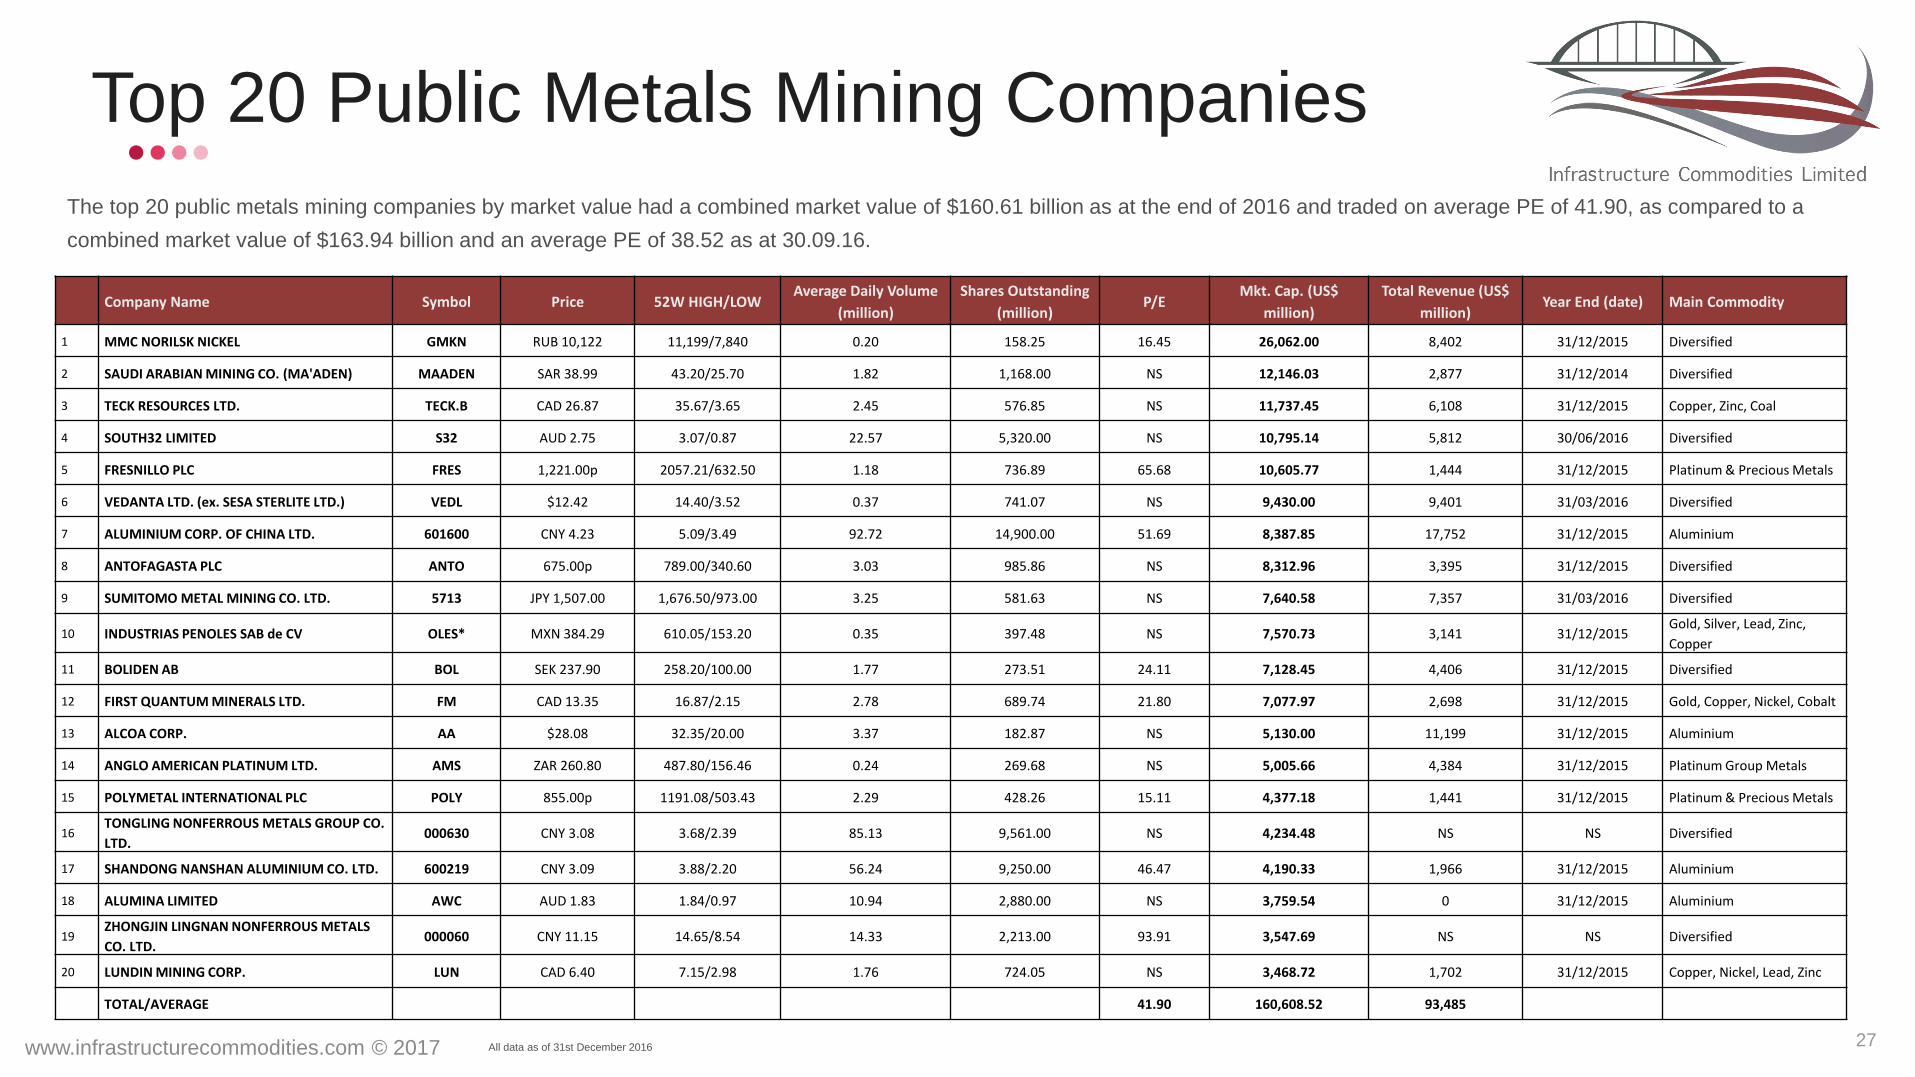
Top 20 Public Metals Mining Companies
The top 20 public metals mining companies by market value had a combined market value of $160.61 billion as at the end of 2016 and traded on average PE of 41.90, as compared to a
combined market value of $163.94 billion and an average PE of 38.52 as at 30.09.16.
www.infrastructurecommodities.com © 2017 27
Company Name Symbol Price 52W HIGH/LOW Average Daily Volume
(million)
Shares Outstanding
(million) P/E
Mkt. Cap. (US$
million)
Total Revenue (US$
million) Year End (date) Main Commodity
1 MMC NORILSK NICKEL GMKN RUB 10,122 11,199/7,840 0.20 158.25 16.45 26,062.00 8,402 31/12/2015 Diversified
2 SAUDI ARABIAN MINING CO. (MA'ADEN) MAADEN SAR 38.99 43.20/25.70 1.82 1,168.00 NS 12,146.03 2,877 31/12/2014 Diversified
3 TECK RESOURCES LTD. TECK.B CAD 26.87 35.67/3.65 2.45 576.85 NS 11,737.45 6,108 31/12/2015 Copper, Zinc, Coal
4 SOUTH32 LIMITED S32 AUD 2.75 3.07/0.87 22.57 5,320.00 NS 10,795.14 5,812 30/06/2016 Diversified
5 FRESNILLO PLC FRES 1,221.00p 2057.21/632.50 1.18 736.89 65.68 10,605.77 1,444 31/12/2015 Platinum & Precious Metals
6 VEDANTA LTD. (ex. SESA STERLITE LTD.) VEDL $12.42 14.40/3.52 0.37 741.07 NS 9,430.00 9,401 31/03/2016 Diversified
7 ALUMINIUM CORP. OF CHINA LTD. 601600 CNY 4.23 5.09/3.49 92.72 14,900.00 51.69 8,387.85 17,752 31/12/2015 Aluminium
8 ANTOFAGASTA PLC ANTO 675.00p 789.00/340.60 3.03 985.86 NS 8,312.96 3,395 31/12/2015 Diversified
9 SUMITOMO METAL MINING CO. LTD. 5713 JPY 1,507.00 1,676.50/973.00 3.25 581.63 NS 7,640.58 7,357 31/03/2016 Diversified
10 INDUSTRIAS PENOLES SAB de CV OLES* MXN 384.29 610.05/153.20 0.35 397.48 NS 7,570.73 3,141 31/12/2015 Gold, Silver, Lead, Zinc,
Copper
11 BOLIDEN AB BOL SEK 237.90 258.20/100.00 1.77 273.51 24.11 7,128.45 4,406 31/12/2015 Diversified
12 FIRST QUANTUM MINERALS LTD. FM CAD 13.35 16.87/2.15 2.78 689.74 21.80 7,077.97 2,698 31/12/2015 Gold, Copper, Nickel, Cobalt
13 ALCOA CORP. AA $28.08 32.35/20.00 3.37 182.87 NS 5,130.00 11,199 31/12/2015 Aluminium
14 ANGLO AMERICAN PLATINUM LTD. AMS ZAR 260.80 487.80/156.46 0.24 269.68 NS 5,005.66 4,384 31/12/2015 Platinum Group Metals
15 POLYMETAL INTERNATIONAL PLC POLY 855.00p 1191.08/503.43 2.29 428.26 15.11 4,377.18 1,441 31/12/2015 Platinum & Precious Metals
16 TONGLING NONFERROUS METALS GROUP CO.
LTD. 000630 CNY 3.08 3.68/2.39 85.13 9,561.00 NS 4,234.48 NS NS Diversified
17 SHANDONG NANSHAN ALUMINIUM CO. LTD. 600219 CNY 3.09 3.88/2.20 56.24 9,250.00 46.47 4,190.33 1,966 31/12/2015 Aluminium
18 ALUMINA LIMITED AWC AUD 1.83 1.84/0.97 10.94 2,880.00 NS 3,759.54 0 31/12/2015 Aluminium
19 ZHONGJIN LINGNAN NONFERROUS METALS
CO. LTD. 000060 CNY 11.15 14.65/8.54 14.33 2,213.00 93.91 3,547.69 NS NS Diversified
20 LUNDIN MINING CORP. LUN CAD 6.40 7.15/2.98 1.76 724.05 NS 3,468.72 1,702 31/12/2015 Copper, Nickel, Lead, Zinc
TOTAL/AVERAGE 41.90 160,608.52 93,485
All data as of 31st December 2016
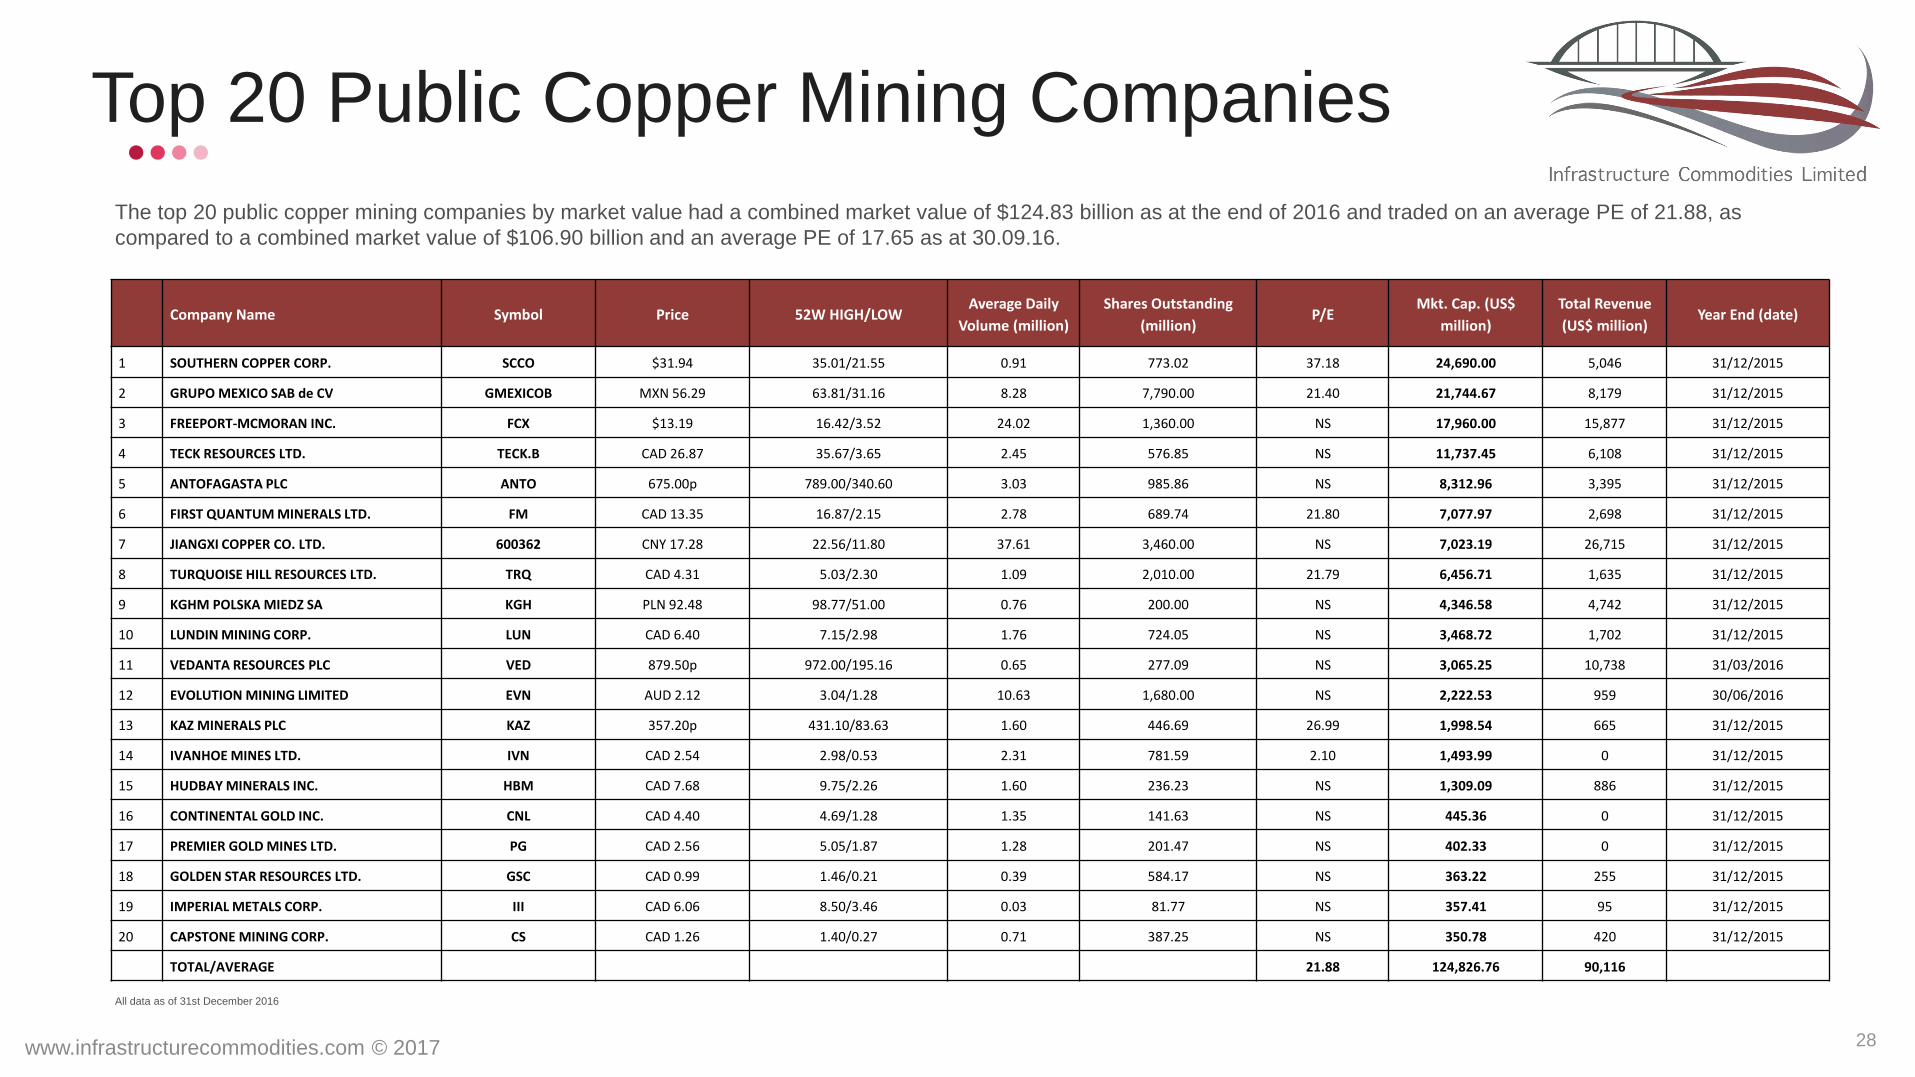
Top 20 Public Copper Mining Companies
www.infrastructurecommodities.com © 2017 28
All data as of 31st December 2016
The top 20 public copper mining companies by market value had a combined market value of $124.83 billion as at the end of 2016 and traded on an average PE of 21.88, as
compared to a combined market value of $106.90 billion and an average PE of 17.65 as at 30.09.16.
Company Name Symbol Price 52W HIGH/LOW Average Daily
Volume (million)
Shares Outstanding
(million) P/E
Mkt. Cap. (US$
million)
Total Revenue
(US$ million) Year End (date)
1 SOUTHERN COPPER CORP. SCCO $31.94 35.01/21.55 0.91 773.02 37.18 24,690.00 5,046 31/12/2015
2 GRUPO MEXICO SAB de CV GMEXICOB MXN 56.29 63.81/31.16 8.28 7,790.00 21.40 21,744.67 8,179 31/12/2015
3 FREEPORT-MCMORAN INC. FCX $13.19 16.42/3.52 24.02 1,360.00 NS 17,960.00 15,877 31/12/2015
4 TECK RESOURCES LTD. TECK.B CAD 26.87 35.67/3.65 2.45 576.85 NS 11,737.45 6,108 31/12/2015
5 ANTOFAGASTA PLC ANTO 675.00p 789.00/340.60 3.03 985.86 NS 8,312.96 3,395 31/12/2015
6 FIRST QUANTUM MINERALS LTD. FM CAD 13.35 16.87/2.15 2.78 689.74 21.80 7,077.97 2,698 31/12/2015
7 JIANGXI COPPER CO. LTD. 600362 CNY 17.28 22.56/11.80 37.61 3,460.00 NS 7,023.19 26,715 31/12/2015
8 TURQUOISE HILL RESOURCES LTD. TRQ CAD 4.31 5.03/2.30 1.09 2,010.00 21.79 6,456.71 1,635 31/12/2015
9 KGHM POLSKA MIEDZ SA KGH PLN 92.48 98.77/51.00 0.76 200.00 NS 4,346.58 4,742 31/12/2015
10 LUNDIN MINING CORP. LUN CAD 6.40 7.15/2.98 1.76 724.05 NS 3,468.72 1,702 31/12/2015
11 VEDANTA RESOURCES PLC VED 879.50p 972.00/195.16 0.65 277.09 NS 3,065.25 10,738 31/03/2016
12 EVOLUTION MINING LIMITED EVN AUD 2.12 3.04/1.28 10.63 1,680.00 NS 2,222.53 959 30/06/2016
13 KAZ MINERALS PLC KAZ 357.20p 431.10/83.63 1.60 446.69 26.99 1,998.54 665 31/12/2015
14 IVANHOE MINES LTD. IVN CAD 2.54 2.98/0.53 2.31 781.59 2.10 1,493.99 0 31/12/2015
15 HUDBAY MINERALS INC. HBM CAD 7.68 9.75/2.26 1.60 236.23 NS 1,309.09 886 31/12/2015
16 CONTINENTAL GOLD INC. CNL CAD 4.40 4.69/1.28 1.35 141.63 NS 445.36 0 31/12/2015
17 PREMIER GOLD MINES LTD. PG CAD 2.56 5.05/1.87 1.28 201.47 NS 402.33 0 31/12/2015
18 GOLDEN STAR RESOURCES LTD. GSC CAD 0.99 1.46/0.21 0.39 584.17 NS 363.22 255 31/12/2015
19 IMPERIAL METALS CORP. III CAD 6.06 8.50/3.46 0.03 81.77 NS 357.41 95 31/12/2015
20 CAPSTONE MINING CORP. CS CAD 1.26 1.40/0.27 0.71 387.25 NS 350.78 420 31/12/2015
TOTAL/AVERAGE 21.88 124,826.76 90,116

Top 20 Public Coal Mining Companies
www.infrastructurecommodities.com © 2017 29 All data as of 31st December 2016
The top 20 public coal mining companies by market value had a combined market value of $141.08 billion as at the end of 2016 and traded on an average PE of 37.36, as compared to a combined market value of
$143.99 billion and an average PE of 28.27 as at 30.09.16.
Company Name Symbol Price 52W HIGH/LOW Average Daily
Volume (million)
Shares Outstanding
(million) P/E Mkt. Cap. (US$ million)
Total Revenue (US$
million) Year End (date)
1 CHINA SHENHUA ENERGY CO. LTD. 601088 CNY 16.03 18.56/12.72 16.32 19,890.00 18.44 43,394.53 25,463 31/12/2015
2 COAL INDIA LTD. COALINDIA INR 300.00 349.95/271.65 3.15 6,210.00 16.21 27,195.00 11,467 31/03/2016
3 SASOL LTD. SOL ZAR 401.37 497.47/354.00 1.60 654.23 18.30 18,931.19 12,677 30/06/2016
4 CHINA COAL ENERGY CO. LTD. 601898 CNY 5.82 7.13/4.45 15.52 13,260.00 NS 9,466.35 8,523 31/12/2015
5 SHAANXI COAL INDUSTRY CO. LTD. 601225 CNY 4.88 7.02/3.60 26.93 10,000.00 NS 6,959.92 4,675 31/12/2015
6 YANZHOU COAL MINING CO. LTD. 600188 CNY 10.78 14.20/7.90 5.91 4,910.00 106.66 5,892.92 9,923 31/12/2015
7 CONSOL ENERGY INC. CNX $18.23 22.34/4.54 3.13 229.44 NS 4,180.00 2,501 31/12/2015
8 INNER MONGOLIA YITAI COAL CO. LTD. 900948 USD 0.93 1.06/0.71 2.58 3,250.00 NS 3,070.00 2,814 31/12/2015
9 BANPU PCL BANPU THB 19.20 21.00/10.88 42.07 4,940.00 NS 2,594.02 2,477 31/12/2015
10 YANGQUAN COAL INDUSTRY GROUP
CO. LTD. 600348 CNY 6.78 8.81/5.46 18.79 2,410.00 NS 2,331.00 2,425 31/12/2015
11 EXXARO RESOURCES LTD. EXX ZAR 87.95 114.28/40.02 1.33 358.12 39.08 2,242.98 1,344 31/12/2015
12 WHITEHAVEN COAL LIMITED WHC AUD 2.61 3.35/0.36 5.54 1,030.00 NS 1,977.18 840 30/06/2016
13 CLIFFS NATURAL RESOURCES INC. CLF $8.41 10.90/1.20 11.92 230.60 25.46 1,940.00 2,013 31/12/2015
14 HENAN DAYOU ENERGY CO. LTD. 600403 CNY 5.74 7.86/4.51 3.17 2,390.00 NS 1,932.67 665 31/12/2015
15 GUIZHOU PANJIANG REFINED COAL CO.
LTD. 600395 CNY 8.13 11.83/7.26 10.61 1,660.00 NS 1,922.61 585 31/12/2015
16 SDIC XINJI ENERGY CO. LTD. 601918 CNY 4.67 9.48/3.41 19.41 2,590.00 NS 1,754.36 687 31/12/2015
17 PINGDINGSHAN TIANAN COAL MINING
CO. LTD. 601666 CNY 4.87 5.99/3.75 13.68 2,360.00 NS 1,650.82 1,789 31/12/2015
18 DATONG COAL INDUSTRY CO. LTD. 601001 CNY 6.09 8.05/4.42 8.21 1,670.00 NS 1,463.88 1,025 31/12/2015
19 SHANXI COAL INT'L ENERGY GROUP
CO. LTD. 600546 CNY 4.04 5.54/2.87 14.10 1,980.00 NS 1,160.47 5,694 31/12/2015
20 SHOUGANG FUSHAN RESOURCES
GROUP LTD. 639 HKD 1.46 1.91/0.69 6.68 5,300.00 NS 1,019.10 258 31/12/2015
TOTAL/AVERAGE 37.36 141,079.01 97,844

Top 20 Public Specialist Mining Companies
www.infrastructurecommodities.com © 2017 30
All data as of 31st December 2016
The top 20 specialist mining companies by market value had a combined market value of $99.61 billion as at the end of 2016 and an average PE of 38.42, as compared to a combined market value of $103.99 billion
and an average PE of 33.42 as at 30.09.16.
Company Name Symbol Price 52W HIGH/LOW Average Daily Volume
(million)
Shares
Outstanding
(million)
P/E Mkt. Cap. (US$
million)
Total Revenue
(US$ million) Year End (date) Main Commodity
1 FORTESCUE METALS GROUP LIMITED FMG AUD 5.89 6.96/1.44 16.68 3,110.00 13.58 13,414.54 7,083 30/06/2016 Iron Ore
2 FRANCO-NEVADA CORP. FNV CAD 80.28 105.69/58.67 0.90 178.25 NS 10,931.29 444 31/12/2015 Royalty Company
3 SILVER WHEATON CORP. SLW CAD 25.94 40.80/14.51 2.01 441.24 NS 8,912.18 649 31/12/2015 Streaming/Royalty
Company
4 CHINA MOLYBDENUM CO. LTD. 603993 CNY 3.74 4.90/3.04 22.85 16,890.00 90.24 7,979.46 604 31/12/2015 Diversified
5 SOCIEDAD QUIMICA Y MINERA DE CHILE SA SQM $28.65 32.32/14.51 0.79 263.20 31.16 7,910.00 1,728 31/12/2015 Lithium and potassium
6 CHINA NORTHERN RARE EARTH GP. HI-TECH CO. LTD. 600111 CNY 12.29 15.73/10.82 15.96 3,630.00 NS 6,535.71 942 31/12/2015 Rare Earth Metals
7 NMDC LIMITED NMDC INR 123.40 142.50/75.15 2.59 3,160.00 7.65 5,720.65 949 31/03/2016 Iron Ore
8 SICHUAN TIANQI LITHIUM INDUSTRIES INC. 002466 CNY 32.45 52.64/25.79 6.05 994.42 23.03 4,640.28 NS NS Lithium
9 ROYAL GOLD INC. RGLD $63.35 87.74/24.68 1.02 65.32 NS 4,140.00 360 30/06/2016 Royalty Company
10 CAMECO CORP. CCO CAD 14.04 17.67/9.88 1.95 395.79 75.83 4,089.99 2,037 31/12/2015 Uranium
11 US SILICA HOLDINGS INC. SLCA $56.68 58.28/13.54 1.52 70.64 NS 4,000.00 643 31/12/2015 Industrial Minerals
12 KUMBA IRON ORE LTD. KIO ZAR 159.91 189.45/24.15 0.70 322.09 45.89 3,720.71 2,649 31/12/2015 Iron Ore
13 JINDUICHENG MOLYBDENUM CO. LTD. 601958 CNY 7.66 9.35/6.00 6.35 3,230.00 NS 3,554.74 1,374 31/12/2015 Molybdenum
14 XIAMEN TUNGSTEN CO. LTD. 600549 CNY 21.72 33.16/12.65 9.44 1,080.00 NS 3,467.02 1,115 31/12/2015 Tungsten
15 COMPASS MINERALS INTERNATIONAL INC. CMP $78.35 82.55/66.30 0.29 33.79 21.51 2,650.00 1,099 31/12/2015 Mineral Sands
16 ILUKA RESOURCES LIMITED ILU AUD 7.27 8.20/5.21 1.56 418.70 NS 2,157.58 636 31/12/2015 Mineral Sands
17 IAMGOLD CORP. IMG CAD 5.19 7.65/1.66 3.37 453.73 NS 1,804.62 917 31/12/2015 Gold, Rare Earths,
Niobium
18 AREVA SA AREVA EUR 5.06 5.43/3.52 NS 383.20 NS 1,726.73 4,399 31/12/2015 Uranium
19 TRONOX LTD. TROX $10.31 12.03/2.79 0.67 116.30 NS 1,200.00 2,112 31/12/2015 Mineral Sands
20 OSISKO GOLD ROYALTIES LTD. OR CAD 13.09 18.64/11.90 0.96 106.63 36.90 1,050.23 33 31/12/2015 Royalty Company
TOTAL/AVERAGE 38.42 99,605.73 29,773
www.infrastructurecommodities.com © 2017 31
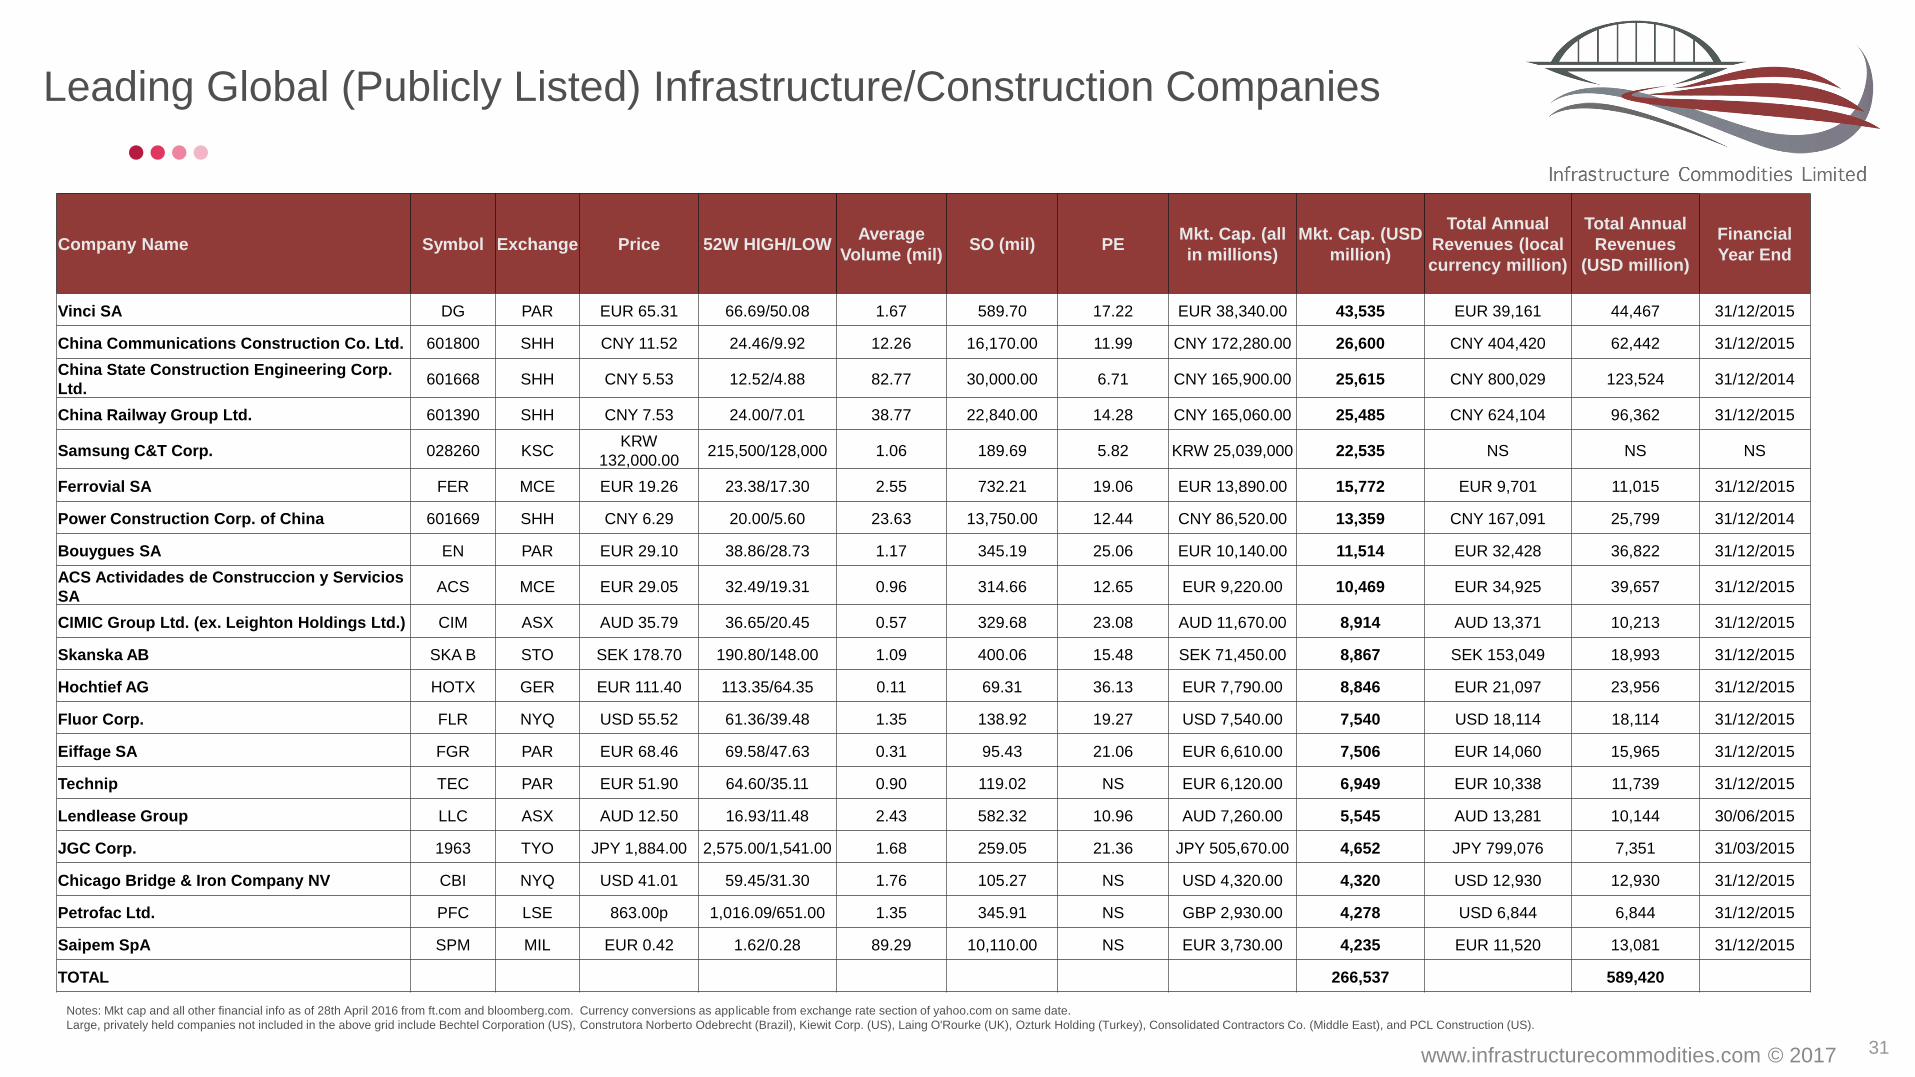
Leading Global (Publicly Listed) Infrastructure/Construction Companies
Company Name Symbol Exchange Price 52W HIGH/LOW Average
Volume (mil) SO (mil) PE
Mkt. Cap. (all
in millions)
Mkt. Cap. (USD
million)
Total Annual
Revenues (local
currency million)
Total Annual
Revenues
(USD million)
Financial
Year End
Vinci SA DG PAR EUR 65.31 66.69/50.08 1.67 589.70 17.22 EUR 38,340.00 43,535 EUR 39,161 44,467 31/12/2015
China Communications Construction Co. Ltd. 601800 SHH CNY 11.52 24.46/9.92 12.26 16,170.00 11.99 CNY 172,280.00 26,600 CNY 404,420 62,442 31/12/2015
China State Construction Engineering Corp.
Ltd. 601668 SHH CNY 5.53 12.52/4.88 82.77 30,000.00 6.71 CNY 165,900.00 25,615 CNY 800,029 123,524 31/12/2014
China Railway Group Ltd. 601390 SHH CNY 7.53 24.00/7.01 38.77 22,840.00 14.28 CNY 165,060.00 25,485 CNY 624,104 96,362 31/12/2015
Samsung C&T Corp. 028260 KSC KRW
132,000.00 215,500/128,000 1.06 189.69 5.82 KRW 25,039,000 22,535 NS NS NS
Ferrovial SA FER MCE EUR 19.26 23.38/17.30 2.55 732.21 19.06 EUR 13,890.00 15,772 EUR 9,701 11,015 31/12/2015
Power Construction Corp. of China 601669 SHH CNY 6.29 20.00/5.60 23.63 13,750.00 12.44 CNY 86,520.00 13,359 CNY 167,091 25,799 31/12/2014
Bouygues SA EN PAR EUR 29.10 38.86/28.73 1.17 345.19 25.06 EUR 10,140.00 11,514 EUR 32,428 36,822 31/12/2015
ACS Actividades de Construccion y Servicios
SA ACS MCE EUR 29.05 32.49/19.31 0.96 314.66 12.65 EUR 9,220.00 10,469 EUR 34,925 39,657 31/12/2015
CIMIC Group Ltd. (ex. Leighton Holdings Ltd.) CIM ASX AUD 35.79 36.65/20.45 0.57 329.68 23.08 AUD 11,670.00 8,914 AUD 13,371 10,213 31/12/2015
Skanska AB SKA B STO SEK 178.70 190.80/148.00 1.09 400.06 15.48 SEK 71,450.00 8,867 SEK 153,049 18,993 31/12/2015
Hochtief AG HOTX GER EUR 111.40 113.35/64.35 0.11 69.31 36.13 EUR 7,790.00 8,846 EUR 21,097 23,956 31/12/2015
Fluor Corp. FLR NYQ USD 55.52 61.36/39.48 1.35 138.92 19.27 USD 7,540.00 7,540 USD 18,114 18,114 31/12/2015
Eiffage SA FGR PAR EUR 68.46 69.58/47.63 0.31 95.43 21.06 EUR 6,610.00 7,506 EUR 14,060 15,965 31/12/2015
Technip TEC PAR EUR 51.90 64.60/35.11 0.90 119.02 NS EUR 6,120.00 6,949 EUR 10,338 11,739 31/12/2015
Lendlease Group LLC ASX AUD 12.50 16.93/11.48 2.43 582.32 10.96 AUD 7,260.00 5,545 AUD 13,281 10,144 30/06/2015
JGC Corp. 1963 TYO JPY 1,884.00 2,575.00/1,541.00 1.68 259.05 21.36 JPY 505,670.00 4,652 JPY 799,076 7,351 31/03/2015
Chicago Bridge & Iron Company NV CBI NYQ USD 41.01 59.45/31.30 1.76 105.27 NS USD 4,320.00 4,320 USD 12,930 12,930 31/12/2015
Petrofac Ltd. PFC LSE 863.00p 1,016.09/651.00 1.35 345.91 NS GBP 2,930.00 4,278 USD 6,844 6,844 31/12/2015
Saipem SpA SPM MIL EUR 0.42 1.62/0.28 89.29 10,110.00 NS EUR 3,730.00 4,235 EUR 11,520 13,081 31/12/2015
TOTAL 266,537 589,420
Notes: Mkt cap and all other financial info as of 28th April 2016 from ft.com and bloomberg.com. Currency conversions as applicable from exchange rate section of yahoo.com on same date.
Large, privately held companies not included in the above grid include Bechtel Corporation (US), Construtora Norberto Odebrecht (Brazil), Kiewit Corp. (US), Laing O'Rourke (UK), Ozturk Holding (Turkey), Consolidated Contractors Co. (Middle East), and PCL Construction (US).