infrastructure monitoring for ukraine (imu)
TRANSCRIPT

Infrastructure Monitoring for Ukraine (IMU)
No. 11/2009 Anna Chukhai,
Dmytro Naumenko, Natalia Sysenko
September 2009
Anna Chukhai: Leading Research Fellow. Research field: infrastructure development and regulation, special attention to restructuring of energy and the water and wastewater sectors. Post-graduate student at Heriot-Watt University, Edinburgh, United Kingdom.
Dmytro Naumenko: Senior Research Fellow. Research interests: power & gas sectors, corporate finance, public management. Natalia Sysenko: Senior Research Fellow. Specialization: Economics. Research fields: infrastructure sectors of transport and telecommunications; innovations and their economic efficiency. Post-graduate student at the Department of Economics, National University “Kyiv-Mohyla Academy”.


INSTITUTE FOR ECONOMIC RESEARCH AND POLICY CONSULTING
List of abbreviations
AMCU - Antimonopoly Committee of Ukraine
bcm - billion cubic meters
bn – billion
CDMA - Code Division Multiple Access
CMU – Cabinet of Ministers of Ukraine
EBRD – European Bank of Reconstruction and Development
ECMT - European Conference of Ministers of Transport
ECU - Energy Company of Ukraine
EU – European Union
GSM - Global System for Mobile Communications
IMU – Infrastructure Monitoring of Ukraine
MTCU – Ministry of Transport and Communications of Ukraine
m - million
NCRC - National Commission for Regulation of Communications
NCRT - National Commission for Regulation of Transport
NERC – National Electricity Regulatory Commission
PFTS – First Securities Trading System
PPP - Public-Private Partnership
RUE - RosUkrEnergo
SPFU – State Property Fund of Ukraine
tcm - thousand cubic meters
TM - trademark
UAH – Ukrainian hryvnia
UCTE - Union for the Co-ordination of Transmission of Electricity
UEFA - Union of European Football Associations
UGE – UkrGasEnergo
USD - United States dollars
UZ - Ukrzaliznytsia
yoy - year-on-year change
4

INSTITUTE FOR ECONOMIC RESEARCH AND POLICY CONSULTING
Infrastructure Monitoring for Ukraine (IMU) No. 11/2009
Anna Chukhai, Dmytro Naumenko, Natalia Sysenko
Foreword .............................................................................................6 1 Summary ..........................................................................................7 2 Ukrainian Infrastructure Policies between September 2008 and August 2009 ........................................................................................9 2.1 Telecommunications....................................................................10 2.2 Railways ......................................................................................17 2.3 Roads ..........................................................................................25 2.4 Power ..........................................................................................31 2.5 Gas ..............................................................................................36 2.6 Water and Wastewater ................................................................41 Appendix 1 Infrastructure indicator evaluation .................................46 Appendix 2. General description of the infrastructure indicators.......48 Appendix 3. Explanations for the infrastructure indicator evaluations given in Appendix 1 (September 2008 - August 2009) ......................52
5

INSTITUTE FOR ECONOMIC RESEARCH AND POLICY CONSULTING
Foreword This is the eleventh “Infrastructure Monitoring for Ukraine” report issued by the Institute for Economic Research and Policy Consulting in Kyiv. It presents information on the restructuring of six key infrastructure sectors of the Ukrainian economy in a standardized manner, which allows for cross-industry comparisons.1 When developing the evaluation methodology the Institute for Economic Research and Policy Consulting followed the EBRD’s approach. Monitored indicators are qualitative and fall into three broad categories: (1) commercialisation, (2) tariff reform, and (3) regulatory and institutional development. Twenty-one indicators allow for economic and policy-making analysis at different aggregation levels. The indicators are constructed in a way that represents the status of the reforms in each sector at a given moment in time. An extensive discussion of the methodology employed was presented in the first issue of IMU.2
Section 1 contains an executive summary that outlines major developments within selected sectors of the infrastructure during the period from September 2008 till August 2009. A general analysis of the Ukrainian infrastructure policies is presented in Section 2. The detailed study of reforms in each of the six sectors includes not only an ex-post analysis, but also an outline of major challenges to future development. A description of the reform progress in each infrastructure sector supplements the numerical evaluation and provides a broader view of the situation. Appendiсes summarize the evaluations in tabular form and provide methodological explanations and detailed comments for each indicator.
1 For earlier issues, see Infrastructure Monitoring for Ukraine, which can be downloaded from
the Institute’s website at [http://www.ier.kiev.ua/English/IMU_eng.html]. 2 IMU No. 1, June 2001, see also IER Working Paper No 9
[http://www.ier.kiev.ua/English/WP/2001/WP2001_eng.html].
6

INSTITUTE FOR ECONOMIC RESEARCH AND POLICY CONSULTING
1 Summary The indicator for Telecommunications has been improved from 2.46 to 2.48 mainly due to approaching to cost reflective tariff setting and renewal of the regulator’s activities.
The indicator in the Railways has just slightly decreased from 1.77 to 1.76. The positive impact of reduced cross-subsidization between freight and passenger transportation was not noticeable due to adverse trends in budget discipline of Ukrainian railways.
The indicator for Roads has been decreased from 2.44 to 2.42 due to increase in mutual non-payments between the government, Ukravtodor and other counterparts as well as due to government interference into competitive transportation market.
The overall indicator for the Power has not been changed and remained at the level of 2.57. Positive impact of the new pricing system for electricity export was compensated by political interference in the price setting for final consumers. The privatisation of energy companies has been legally restored. However, there are numerous problems with its practical realisation.
The indicator for Gas has been decreased from 2.02 to 1.99. Freezing tariffs for selected industries, transferring local gas distribution system back to state monopolist, and increase in inter-industry debts have pushed the indicator down. The separation of Russian gas supplies and transit contracts has moderately increased the indicator. The commitment of Ukraine to reform its domestic gas market is positively assessed but will not lead to the indicator’s change until the real changes. The aggregate indicator for the Water and wastewater has not been changed form the level of 1.60. Policy makers have accelerated their activities in programming, drafting legislation and raising tariffs in the sector. Continuously rising tariffs and unchanged service quality bring up an issue of the efficiency of the enterprises in the sector.
7

INSTITUTE FOR ECONOMIC RESEARCH AND POLICY CONSULTING
Figure 1 IER infrastructure indicators for Ukraine
1.3
1.6
1.9
2.2
2.5
2.8
Nov-
00
May
-01
Nov-
01
May
-02
Nov-
02
May
-03
Jun-0
4
Jul-05
Sep-0
6
Aug-0
7
Aug-0
8
Sep-0
9
Power Telecom
Roads Gas
Railways Water and wastewater
Source: Own estimations
8

INSTITUTE FOR ECONOMIC RESEARCH AND POLICY CONSULTING
2 Ukrainian Infrastructure Policies between September 2008 and August 2009
In 2008 – 2009 Ukraine’s infrastructure sectors faced new challenges – world financial crisis and following Ukraine’s economic downturn. Overall economic downturn in Ukraine has resulted in the fall of the output, revenues and profits of all infrastructure sectors that are discussed in the IMU. Fall in demand for infrastructure services has replaced peak demand that has been exhausting infrastructure assets for the last several years. Most investment programs held up this year.
The policies in the sectors had to challenge new conditions too. Most anti-crisis activities of the Cabinet had anti-market nature. On the one hand, the state strived to increase budget revenues and decrease budget spending and that’s why it increased fiscal burden on Ukrzaliznytsia, decreased expenses on investments programs and accumulated debts before Ukravtodor. On the other hand, the government decided to support selected industries – metallurgy and chemistry - in the crisis times. However, the mentioned support came into expense of the revenues of other industries - railways and power. The problem of the worsened payment discipline in the gas sector was approached by a quick strategically wrong decision that united management of gas supply and gas distribution activities.
Policy in telecommunications was an exception. As a response to crisis a regulator in the sector has chosen to pursue market based pricing policy. Some positive policy developments were also observed in other sectors. The level of cross subsidization between cargo and passenger transportations has decreased. In power privatization of the generation capacities has been legally restored and export pricing has been improved. In water and wastewater new normative base has been drafted.
In general, the assessment of the development of the infrastructure sectors of Ukraine has worsened in all the sectors except telecommunications this year. The reason is a shift in policy towards decisions based on short run considerations rather than on strategic long run ones.
9

INSTITUTE FOR ECONOMIC RESEARCH AND POLICY CONSULTING
2.1 Telecommunications
Communications continue to grow rapidly. In 2000-2007 total nominal output of communication services increased by almost 5 times to UAH 37 bn (Table 1), mainly driven by the growing demand for mobile and Internet services against the background of relatively stable prices for services.
Table 1 The role of communications sector in the economy 2003 2004 2005 2006 2007
Output UAH m 14,268 19,703 24,956 30,309 36,756 % total
output 2.1 2.2 2.2 2.2 2.0
% services output*
5.7 5.8 5.8 5.6 4.8
Value added % GDP 4 3.6 3 3 3 % output 67 63 54 53 57 Structure of value added: Compensation
to employees % sector VA 34 29 31.9 36.2 36.7
Profit, mixed income
% sector VA 56 65 57.5 54.0 55.9
Net taxes on production and imports
% sector VA 11 6 10.6 9.8 7.4
Employment thous people 252 252 254 259 262 2.2 2.3 2.3 2.3 2.2 Average wage UAH 548 548 710 967 1,191 Exports UAH m 443 665 2,407 2,940 3,533 % total
exports 0.3 0.3 1.1 1.2 1.1
% sector output
3.1 3.4 9.6 9.7 9.6
Imports UAH m 421 558 1,628 1,635 1,914 % total
imports 0.3 0.3 0.7 0.6 0.5
% sector output
3.0 2.8 6.5 5.4 5.2
Exports/imports index 1.1 1.2 1.5 1.8 1.8
Source: State Statistics Committee, own calculations Note: * including Construction
3In 2008 Internet segment was the most dynamic (151% yoy ) communications sectors. In December 2008 monthly number of Internet-users4 reached 10.4 m people (approximately 22.4% of Ukrainian population), which is 62.5% more than a year before. Broadband Internet access5 is the most promising segment in terms of technology and revenues, which develops mainly due to individual subscribers (Figure 2). In 2008 the biggest broadband
3 State Statistics Committee 4 Users, who reviewed a web-page more than once per month. 5 High-speed Internet access, typically contrasted with dial-up access over a modem.
10

INSTITUTE FOR ECONOMIC RESEARCH AND POLICY CONSULTING
operators were Ukrtelecom, Volia, Vega, Golden Telecom, TeNeT, IPNet, Datagroup, FreeNet6.
Figure 2 Number of broadband users, m
0.62
0.79
1.05
1.34
1.75
0.00
0.20
0.40
0.60
0.80
1.00
1.20
1.40
1.60
1.80
1Q/2007 3Q/2007 1Q/2008 3Q/2008 1Q/2009
Source: iKS-Consulting
Despite the crisis and saturation of the market, mobile communications continued to grow in 2008 (Figure 3). Mobile communications market demonstrates tough competition with still growing number of subscribers of GSM as well as CDMA operators (Table 2). On December 31, 2008 the amount of subscribers to these services reached 55.89 m, which exceeds Ukrainian population by 21%, though the real level of penetration is about 70%7. Both domestic and foreign companies are among key GSM players: Kyivstar, MTS-Ukraine, Astelit (TM life:)), and URS (TM Beeline). Among key CDMA operators are ITC (TM CDMA), Intertelecom, and Telesystemy Ukrainy (TM PeopleNet). Ukrtelecom (TM Utel) has recently entered 3G8 mobile communications
6 iKS-Consulting. 7 According to the NCRC. 8 3G is a generic name for third-generation networks or services under the IMT-2000 banner.
International Mobile Telecommunications-2000 (IMT-2000) is a “family of standards” for third generation (3G) wireless communications, defined by a set of interdependent ITU Recommendations, offering evolution/revolution options from the major existing 2G network standards. There are five IMT-2000 standards: IMT-MC (cdma2000); IMT-SC (EDGE); IMT-DS (W-CDMA (UMTS)); IMT-TC (TD-SCDMA/UTRA TDD); and IMT-FT (DECT). 3G technologies enable network operators to offer users a wider range of more advanced services (voice telephony, video calls, and broadband wireless data) while achieving greater network capacity through improved spectral efficiency.
11

INSTITUTE FOR ECONOMIC RESEARCH AND POLICY CONSULTING
market; however, it is currently far behind major mobile players. Besides, there are three more operators offering advanced services via 3G technologies in Ukraine: MTS, Intertelecom, Telesystemy Ukrainy.
Figure 3 Communications revenues, UAH m
0
10000
20000
30000
40000
50000
2000 2001 2002 2003 2004 2005 2006 2007 2008
Fixed local Fixed long-distance Computer, incl. Internet Mobile Other
Source: State Statistics Committee, own calculations
In contrast to mobile telecommunications fixed line market demonstrates much lower level of competition. 78.5% of the market belongs to Ukrtelecom. Datagroup, Golden Telecom and merged Farlep-Optima Telecom (TM Vega) are the next largest fixed-line operators. The amount of customers of fixed-line communications is also much lower and equals only 12.5 m, where individual subscribers account for 82.4%9.
Table 2 Mobile subscribers in Ukraine Number of subscribers,
December 31, 2008, m Growth rate over 2007, %
Total 55.89 0.56 Kyivstar 23.53 -0.31 UMC 18.12 -9.44 Astelit 11.23 27.28 URS 2.03 -23.38 ITC 0.29 155.21 Intertelecom 0.25 131.99 Telesystemy Ukrainy 0.26 197.12 Golden Telecom 0.03 -38.82 Ukrtelecom 0.16 1,817.65
Source: iKS-Consulting
9 NCRC
12

INSTITUTE FOR ECONOMIC RESEARCH AND POLICY CONSULTING
Since 2005 the telecommunications industry has been regulated by the National Commission for Regulation of Communications (NCRC) that is assumed to be independent. In addition, there are a range of other governmental bodies that define the sector and sub-sectors policies. In particular, the State Administration of Communications within the MTCU provides general state sector policy. The National Television and Broadcasting Council of Ukraine is collegial body that supervises and regulates the activities of television and radio broadcasting.
2.1.1 Reforms between September 2008 and August 2009
The monitored period is characterized by both negative and positive trends in the telecommunications sector. On the one hand, the government continued its practice of interference into the market and has not privatised Ukrtelecom. On the other hand, the NCRC’s activities renewed, so that the market regulation and tariff setting were improved.
The controversy over the right to make appointments in the NCRC has stopped. In September 2008 the President cancelled10 11 his June’s Decree that has suspended appointment of the NCRC members. At the same time, the CMU renewed its own Decree12 that re-subordinated the NCRC to the CMU and adopted Regulations13 on the NCRC. Besides, later in October the Constitutional Court of Ukraine decided that subordination of the regulator to the President set by the Law On telecommunications is not constitutional14. Thus, the Commission has renewed its activities and has started to conduct its regulatory functions. The indicator “Independence of regulator, insulation from political influence” has been increased from 2.3 to 2.7.
Between September 2008 and August 2009 tariffs for almost all services in the sector were increased by the NCRC. In October 2008 monthly fee for fixed telephones grew by 20%15, in May 2009 - by 10-20% in urban areas and by 10% in rural areas16. Ukrtelecom has also increased prices for non-universal services. In particular, during the monitored period it has raised fee for radio usage by 233% for households and by 200% for commercial organisations17. In July 200918 it 6-8 times increased price for access to telephone lines, managed by this company. All these measures were aimed at either removing cross-subsidization within Ukrtelecom's operations or increasing its revenues to prevent the company from substantial losses as it showed in 2008 (see Figure 4). The indicators “Political vs. regulated operators” and “Natural
10 Decree of the President of Ukraine, No.814/2008, September 9, 2008. 11 Decree of the President of Ukraine, No. 534/2008, June 10, 2008.. 12 Decree of the CMU, No. 865, September 24, 2008. 13 Decree of the CMU, No. 971, July 25, 2007. 14 Decision of the Constitutional Court of Ukraine, No. 21-рп/2008, October 8, 2008. 15 Resolution of the NCRC, No.1110, September 12, 2008 16 Resolution of the NCRC, No.1491, April 28, 2009 17 In October 2008 Ukrtelecom raised fee for radio usage from UAH 1.8 to 6.0 for households
and from UAH 3.0 to 9.0 for organizations. In February 2009 the AMC made the operator to decrease these fees to UAH 3.0 and 3.9, correspondingly. In June 2009 they were again raised to UAH 6.0 and 9.0.
18 Ukrtelecom// http://www.ukrtelecom.ua/services/providers/sewerage
13

INSTITUTE FOR ECONOMIC RESEARCH AND POLICY CONSULTING
monopoly pricing” have been slightly improved to 3.0 and 3.7, correspondingly.
Figure 4 Net profit of Ukrtelecom, UAH m
616759
519 468267
-1526
-2000
-1500
-1000
-500
0
500
1000
2003 2004 2005 2006 2007 2008
Source: Ukrtelecom 19From January 1, 2009 new fees for use of radio frequencies came into force .
Frequencies have become half more expensive for telecommunications operators. Also, services related to use of radio frequencies, which are provided by the state incumbent “The Ukrainian State Centre of Radio Frequencies”, became more expensive. The discounts20, introduced earlier, have been cancelled and new tariffs were introduced from August 1, 200921. All those higher tariffs should boost state incumbents’ profits and, consequently, budgetary payments.
The monitored period was characterized by a range of conflicts between telecom operators. At the beginning of spring the conflict over the rates of interconnection22, similar to the one in 2007, took place. This time the main issue was inequality of interconnection rates between fixed-line (Ukrtelecom) and mobile companies23. That’s why, starting from January 1, 2009 Ukrtelecom has initiated revision of the interconnection rates towards establishment of parity values. The initiator of another conflict was also
19 Decree of the CMU, No. 1150, December 27, 2008 20 Resolution of the NCRC, No.1083, June 10, 2008 21 Resolution of the NCRC, No.1256, December 11, 2008 22 Interconnection refers to the linking of two networks for the mutual exchange of traffic. 23 In 2008 Ukrtelecom paid to mobile companies UAH 0.5 per minute and mobile operators – only
UAH 0.25 per minute.
14

INSTITUTE FOR ECONOMIC RESEARCH AND POLICY CONSULTING
Ukrtelecom, which abused its monopolistic power while granting access to sewerage of Ukraine, 95% of which it operates as a state incumbent. In contrast to similar conflicts in 2007-2008, the NCRC took active position. In particular, it has adopted a resolution on the juridical establishment of separate markets of telecommunications services24 that had to allow the AMC to announce major telephone operators as monopolists on different segments and transfer regulatory power to the NCRC25. The latter also elaborated an order on mutual settlements between telecommunications operators for interconnection services26 and an order On access to lines of telecommunications channels27. Those documents could allow the Commission to set fair rates of interconnection between mobile and fixed-line operators, based on real costs, and secure transparent procedures of application for a channel of Ukrtelecom for telecom operator of any ownership. However, in June 2009 the AMC suspended its May decision that has determined 8 major telecom operators as monopolists within their networks28 and has created prerequisites for the regulation. It was the CMU who recommended the AMC to postpone determination of the telecom monopolists, whose share of payments to the budget is significant29. The interference of the government showed its readiness to use administrative pressure on the market. The indicator “Transparency of regulations” was decreased from 2.7 to 2.3.
During the monitored period the MTCU interfered into the sector’s activities. It has centralised management and control over two major state-owned telecom enterprises. In April 2009, the MTCU took over30 Broadcasting, Radiocommunications & Television Concern (BRT Concern31). In July 2009 Ukrtelecom has been re-subordinated from the SPFU to the Ministry32. Officially, such measures were explained by necessity to improve corporate governance and innovation policy of the enterprises. However, it seems that such changes will lead to increase in budget payments of them. The indicator “Decentralization” has not been decreased because real changes in operation and organisational structure of the enterprises were not observed.
In November 2008 the CMU adopted the State Programme on Digital Broadcasting Implementation33 within a framework of Ukrainian preparations to introduction of complete digital broadcasting within Geneva 2006 Plan34.
24 Resolution of the NCRC, No.1366, February 19, 2009. 25 The NCRC has right to regulate only monopolists and provision of universal services. 26 Resolution of the NCRC, No.1424, March 26, 2009. 27 Resolution of the NCRC, No.1607, July 23, 2009 28 Decision of the AMC, May 25, 2009. 29 Petition of the CMU for postponement of the AMC’s decision, which has determined 8 major
telecom operators as monopolists, till 2010, June 1, 2009 30 Decree of the CMU, No. 1039, November 26, 2008 31 The major operator of on-air television and radio broadcasting networks in Ukraine. 32 Order of the CMU, No. 828-p, July 17, 2009. 33 Decree of the CMU, No. 1085, November 26, 2008
34 Ukraine signed the Geneva 2006 (GE06) Agreement that establishes a Plan containing frequency allotments and assignments for the transmission of DVB-T and T-DAB services in Band III (174-230 MHz) and DVB-T services in Bands IV/V (470-862 MHz). According to this plan, Ukraine has got frequency band for digital broadcasting implementation. But, analogue and digital services are interfering, so it is necessary to reduce the number of analogue
15

INSTITUTE FOR ECONOMIC RESEARCH AND POLICY CONSULTING
Ukraine has to raise investments and conversion funds, organize replacement of analogue by digital services, inform all concerned agents, provide transparent institutional environment, etс in order to cover all territory by digital network. However, the Programme has stipulated no institutional changes, which could facilitate those processes. In addition, 99.8% of planned investments of UAH 4.3 bn is expected to be private, though they cannot be raised under existing market conditions. That’s why, such a Programme cannot be assessed positively and it will not speed up digital networks implementation in Ukraine.
Summarising, the telecommunications sector indicator has been increased from 2.46 to 2.48 mainly due to approaching to cost reflective tariff setting and renewal of the regulator’s activities.
2.1.2 Needed future reforms Despite the saturation of the market for 2G mobiles services, there is still stable demand for advanced telecommunications technologies, i.e. Internet and 3G services. It pushes the development of sector, which remains one of the most promising markets for investors, who, however, require fair-play rules, free market entry/exit, transparent and predictable regulation. Thus, the CMU must make a final decision on privatization of Ukrtelecom and resist the temptation to interfere and overrule the regulators’ resolutions. Otherwise, performance of the sector will deteriorate as operators will lose confidence to Ukrainian telecommunications market and cut their investments.
broadcast transmissions and finally to cease them. This replacement needs transition period, which is defined until June 2015 in the GE06.
16

INSTITUTE FOR ECONOMIC RESEARCH AND POLICY CONSULTING
2.2 Railways
Transport is one of the major infrastructure sectors, on which the development of the economy as a whole depends. Its output constantly rose, at least till 2007 (Table 3). The railways remain the most important mean of transportation. In 2008, according to the State Statistics Committee, it serviced 52% of total freight and 36% of total passenger turnover.
Table 3 The role of the transport sector in the economy
2003 2004 2005 2006 2007 Output UAH m 49,155 59,554 70,342 82,096 103,608 % total
output 7 7 6 6 6
% services output*
20 17 16 15 14
Value added % GDP 11 10 9 8 8 % output 59 58 54 54 53 Structure of value added:
Compensation to employees
% sector VA
47 39 51 56 51
Profit, mixed income
% sector VA
44 50 40 35 41
Net taxes on production and imports
% sector VA
10 11 9 9 8
Employment thous people
742 719 733 730 725
% total employed
6 6 6 6 6
Average wage UAH 685 843 1,057 1,328 1,734
Exports UAH m 20,008 23,189 25,526 29,855 34,536 % total
exports 13 11 11 12 11
% sector output
41 39 36 36 33
Imports UAH m 4,805 11,226 12,684 18,405 22,451 % total
imports 3 6 6 7 6
% sector output
10 19 18 22 22
Exports/imports index 4.2 2.1 2.0 1.6 1.5 Source: State Statistics Committee, own calculations Notes: * including Construction
35In 2008 net profit of Ukrzaliznytsia (UZ) constituted UAH 186.5 m (Figure 5), which is 71% less than a year before and 93% less than it was expected in
35 Ukrainian Railways constitute six regional railways that are regulated by the State Railways
Administration (Ukrzaliznytsia), which is integrated into the Ministry of Transport and
17

INSTITUTE FOR ECONOMIC RESEARCH AND POLICY CONSULTING
financial plan for 2008. Such decrease in profits is caused by increase in costs of services provision and fallen freight flows36 due to economic downturn. Nevertheless, in 2009 it is planned to get UAH 245 m of net profits.
2.2.1 Reforms between September 2008 and August 2009
During the monitored period the state did not start reforms of Ukrainian railways, which were declared many times. Also the government continued its usual practice of using the railways as a cash cow to cover its fiscal obligations (Figure 6). Tariffs for all rail services sharply increased. At the same time, fixed assets of the Ukrainian railways have been only slightly modernized.
Figure 5 Net profits of Ukrzaliznytsia, UAH m
-652
-1020
19283
349
8
1589
497651
187 245
-1500
-1000
-500
0
500
1000
1500
2000
1999 2000 2001 2002 2003 2004 2005 2006 2007 2008 2009*
* Expected in financial plan of UZ
Source: MTCU The state officials have repeatedly announced plans to reform railways sector37, but no final programme of reforms has been adopted so far. The MTCU prepared a new draft programme38, which appeared to be very similar
Communications of Ukraine (MTCU). Railways infrastructure, freight, and passenger operations are also strongly integrated. Ukrainian railways also incorporate ancillary services and quite an extensive social infrastructure.
36 According to the State Statistics Committee, freight transported for October-December 2008 fell by 25% in comparison to October-December 2007.
37 Order of the CMU, No. 1381-p, October 30, 2008. 38 Draft Programme on Reforms (Market Transformation) of Ukrainian Railways Transport (prepared by the MTCU under the head of Vinskii)// http://tbu.com.ua/news/mintranssviazi_obnarodovalo_proekt_gosprogrammy_reformirovaniia_j_d_transporta_.html
18

INSTITUTE FOR ECONOMIC RESEARCH AND POLICY CONSULTING
39to the one of June 2008 that was not supported by the CMU. The new draft programme just as the previous one is inconsistent with the Concept of the reforms adopted in 200640 41. The latter fully complies with modern approach to network industries reforms and is supported by UZ’s management, railways trade union, and parliamentary committee on transport and communications. However, the proposed draft programme stipulates different steps. In particular, the first stage of the reforms envisages creation of the national rail carrier of goods and passengers, integrating all activities on the vertical basis. There is also no plan to create an independent transport regulator, to conduct vertical unbundling, to separate freight and passenger transportations into different companies, to introduce market selection of rail services suppliers. The long drafting of the reforms programme confirms conflict of interests among different bodies over railways sector transformation, which has become an additional braking factor for reforms in the rail sector.
Figure 6 Payments of Ukrzaliznytsia to the budget, UAH bn
3.7
6.26.7
8.2
11.4
9
0
2
4
6
8
10
12
2004 2005 2006 2007 2008 2009*
* Expected in financial plan of UZ
Source: MTCU
Delays in sector reforms and poor adjustment to fast changing economic situation have lead to worse performance of the UZ. In particular, losses from passenger travels continued to grow (see Figure 7).
39 For details see the Infrastructure Monitoring for Ukraine No. 10//
http://www.ier.com.ua/docs/imu/imu_10_en.pdf. 40 Order of the CMU, No. 651-р, December 27, 2006. 41 See details of the Concept in the Infrastructure Monitoring for Ukraine No. 9//
http://www.ier.kiev.ua/English/imu_eng.cgi)
19

INSTITUTE FOR ECONOMIC RESEARCH AND POLICY CONSULTING
Figure 7 Losses of Ukrzaliznytsia from passenger transportation, UAH bn
0
1
2
3
4
5
2004 2005 2006 2007 2008
local long-distance
Source: Ministry of Transport and Communications The MTCU regularly used tariffs increases to cope with non-profitability. During the monitored period domestic passenger tariffs grew three times. In October 2008 they were increased by 5%42, so that cumulative increase of tariffs constituted 15% yoy. In March and June 2009 domestic tickets became more expensive: six-month cumulative raise of passenger tariffs has been 9.5% for couch and 15% for compartment. Railways passenger travels to international destinations have also became noticeably expensive. Fares for travels to the CIS and Baltic countries were revised upwards by 25%43 starting from mid-October 2008. Fares to non-FSU international destinations were tied to EUR/UAH exchange rate starting from mid-December 2008. Moreover, these tariffs for travels in second class were set by on average 15% higher than before44. The same tariff policy was conducted in segment of local railway transportation. In particular, in November 2008 the MTCU declared equalization of local railways transportation tariffs (for distance of up to 50 km) with the road ones for 2009 and their further increase to the level that covers maintenance costs of railways companies for 201045. Later, in January
42 Resolution of the MTCU, No.913, from July 22, 2008. 43 Resolution of the MTCU, No.1183, from September 25, 2008 44 Resolution of the MTCU, No.1037, from August 18, 2008 45 The press service of the MTCU// http://www.mintrans.gov.ua/uk/news/2008-11-10/9237.html
20

INSTITUTE FOR ECONOMIC RESEARCH AND POLICY CONSULTING
2009, the MTCU charged regional railways with introduction of monthly 3% indexation of local railways tariffs and binding agreement with local authorities on full compensation of privileged customers’ travels46. In line with these measures UZ also constantly increases the number of so-called local expresses that are not obliged to transport privileged customers.
47Tariffs increases have occurred against the background of financial crisis and gradual reorientation of passenger flows from rail to road transport (see Table 4). So, transport flows by rail are likely to further fall until sector reforms are conducted and approach to this business changes.
Table 4 National transport, shares by type of transport, %
rail road water air Freight turnover, on the basis of tonnes-km performed*
2000 83.6 9.3 7.0 0.0 2005 81.3 12.8 5.8 0.1 2006 80.2 13.5 6.1 0.1 2007 80.0 14.2 5.7 0.1 2008 82.7 12.0 5.1 0.1
Passengers turnover, on the basis of passenger-km performed** 2000 62.9 35.0 0.1 2.1 2005 47.3 47.1 0.1 5.5 2006 46.0 46.7 0.1 7.2
44.7 47.3 0.2 7.8 2007 42.4 48.9 0.1 8.6 2008
Source: State Statistics Committee, own calculations Notes: * excl. pipeline transport ** excl. electric city transport
The Ministry continued a practice of gradual tariffs indexation in freight transportation until financial crisis expanded over all sectors. Freight tariffs were increased in August 2008 by 6.5% and in October 2008 by 9.5%48. However, at the same time in September 2008 UZ introduced temporary 9-10% discounts for transportation of coke, iron ore, and limestone responding to the pressure of metal-producing enterprises49. Then in October 2008 the Cabinet of Ministers froze transport tariffs for metallurgy and chemical industry till January 1, 200950, canceling for these industries the two increases. Later the preferential tariffs were many times prolonged and currently they are active till October 1, 200951. As those two sectors are major Ukrainian exporters, introduction of reduced tariffs for them can be treated as trade-distorting subsidy and, consequently, might provoke the WTO member
46 UNIAN// http://economics5.unian.net/rus/detail/3676 47 For the first half of 2009 passenger turnover has constituted 89.9% of the value for the first half of 2008, in particular 91.0% - for rail and 93.9% - for road. 48 Resolution of the MTCU, No. 955, July 30, 2008. 49 The decision was made by tariff commission of UZ on August 29, 2008 by order of the CMU. 50 Decree of the CMU, No. 925, October 14, 2008. 51 Decrees of the CMU, No. 1158, December 27, 2008; No.336, April 8, 2009; No. 710, June 24,
2009.
21

INSTITUTE FOR ECONOMIC RESEARCH AND POLICY CONSULTING
52countries’ retaliation. Moreover, such measure was of little help . To crown it all, this decision has adversely affected increasing revenues leakage in the railway sector, caused by reduced cargo flow in the last months of the year, by the amount of provided preferences53. However, the indicator “Political vs. regulated operators” has not been changed since it was decreased earlier for this reason54. In spite of introduced privileges, flow by railways continued to fall in the first half of 200955, which, consequently has led to fall in the UZ’s profits. In attempt to raise UZ’s revenues, the MTCU adopted a long-expected Price list for freight rail transportation56, which came into force on May 1, 2009. It separated charges for operation at starting-points and terminals and for carriage as well as infrastructure and wagon components in the tariff structure. It also eliminated some additional fees reducing their number. Such changes in tariff-setting can be positively assessed since prices for owners of private wagons and UZ are now clearly defined. At the same time, owners of private cars57 appeared to find themselves in discriminatory conditions as they pay for carriage of empty wagons, which is not paid by UZ that operates the infrastructure as incumbent operator. On the other hand, total costs of freight railway transportation are envisaged to be increased since the majority of services became more expensive. Only a ban to increase prices of services provided by natural monopolies58 and threat to lose customers have made the MTCU to introduce discounting coefficients for a great part of UZ’s freight categories, namely for metals59. So, final impact of new Price list cannot be unambiguously predicted, and the problems of economic justification and transparency of tariff setting still remain unsolved in this long-expecting document. So, no relative indicator has been changed. Competition on the international railways market forced the UZ to introduce significant discounts for transit freight transportation60. It tries to attract cargo flows from alternative routes through Russian Federation and Belarus. In general the indicator “Natural monopoly pricing” has been slightly improved from 2.7 to 3.0 due to reduced cross-subsidization. In 2008 the MTCU approved Complex Programme of Ukrainian Railways Rolling Stock Replacement for 2008-202061. According to the programme, the
52 Transport costs were around 10% of overall production costs, which, in addition, substantially
fell in 2009. 53 Ukrzaliznytsia has got UAH 1.6 bn profit for the 9 months of 2008, but at the end of 2008 it has already reported about UAH 186.5 m profit for the whole year// Press service of UZ: http://www.mintrans.gov.ua/uk/statical/10091.html 54 For details see the Infrastructure Monitoring for Ukraine No. 10//
http://www.ier.com.ua/docs/imu/imu_10_en.pdf55 Rail freight turnover for the first half of 2009 has fallen by 34% in comparison with first half of
2008. 56 Resolution of the MTCU, No. 317, March 26, 2009. 57 Lemtrans (10500 wagons), Ukrenergotrans (3047), Ukrmetallurgtrans (1311), Eximtrans (493), metallurgical enterprises (5500), etc. 58 Decree of the President, No. 1046/2008, November 17, 2008. 59 Resolution of the MTCU, No. 317, March 26, 2009. 60 Changes and amendments to the Tariff policy for 2009//
http://uz.gov.ua/?m=info.normdocs.tarpolmain.tarpolUZ2007.izmUZ2007&lng=uk 61 Resolution of the MTCU, October 14, 2008.
22

INSTITUTE FOR ECONOMIC RESEARCH AND POLICY CONSULTING
UZ plans to invest about UAH 130 bn in its rolling stock, 75-80% of which is now outmoded. However, so far it has not succeeded in replacement of obsolete equipment (see Table 5). The main reason for this is lack of funds caused by rising input prices, budget obligations and maintenance costs of assets due to wear and tear. The other important investment project – introduction of high speed trains - has already failed for the same reason62. The indicator “Natural monopoly planning and investment decisions” has been decreased from 2.0 to 1.7.
Table 5 Capital investments of UZ Need 2006 2007 2008 2009
(plan) Capital investments, UAH bn
n/a 4.5 9.4 11.3 7.9
Incl. investments in rolling stock replacement, UAH bn
10 1 2.7 5.7 4
Freight wagons, pieces 6000 353 2310 1924 1860 Passenger wagons, pieces 300 62 37 180 170
Source: MTCU
Lack of own working capital has forced the UZ to attract outside money to make capital investments. International audit of the UZ, finished in November 2008 by Deloitte, revealed its capitalisation of UAH 62 bn and, thus, eased its access to capital markets. In November 2008 the European Investment Bank agreed to provide EUR 175 m, and the EBRD promised to lend USD 125 m for purchase of new freight cars. So far UZ has signed one credit agreement with the EBRD on USD 62.5 m loan (see Table 6). However, this amount was insufficient to accelerate the rolling stock replacement since even more credit resources of UAH 13 bn raised in 2006-200863 had not helped UZ to replace obsolete assets and modernize infrastructure (see Table 5) due to low efficiency of railways monopolist and non-transparent accounting procedures. As a result, in August 2009 the EBRD refused to further cooperate with the UZ, explaining such a decision by absence of reforms in the sector. Nevertheless, in 2009 the UZ plans to attract resources at the amount of UAH 4 bn to make capital investments. So, starting from August 10, 2009 it started public offering of bonds at the total amount of UAH 1 bn with 24% coupon rate64. Thus, UZ's bond issue appears in line with UZ's need to refinance its debt, because in 2009 it has to pay off around UAH 4 bn to meet its credit obligations65. Taking into account the rising payments of the UZ to the
62 In 2004 the CMU approved the Concept of the State Purpose Programme on Introduction of Fast-Speed Passenger Rail Transportation for 2005-2015 (Order of the CMU, No. 979-р, December 31, 2004), which foresaw introduction of trains with 200 km/h speed. In 2007 the MTCU elaborated draft Programme for 2008-2015 based on that Concept and foreseen UAH 37.6 bn of investments (UAH 19.6 bn – budget, UAH 18 bn – credits). But it has not been adopted. Moreover, now the MTCU and UZ admit they won’t be able to fulfill offered project. That’s why at the moment they work on draft Programme foreseeing UAH 13-14 bn of investments. But even so, it won’t be realised under crisis conditions. 63 Press service of UZ// http://uzinfo.net/ua/analysis/8110 64 Materials of the information agency Cbonds// http://www.cbonds.info 65 Financial plan of UZ, Order of the CMU, No. 489-p, April 28, 2009.
23

INSTITUTE FOR ECONOMIC RESEARCH AND POLICY CONSULTING
66budget , its investment programmes will be again postponed and quality improvements of its services cannot be expected in near future.
Table 6 Main credits of the UZ Year Credit amount Creditor Period Rate
EBRD 1999 USD 51.88 m 15 years, 2.5 grace period
Libor+1%
EBRD 2004 USD 120 m 15 years Libor+1% 2004 USD 700 m Deutsche Bank AG 8 years (till
2012)
2007 UAH 500 m. Raiffeisen Bank Aval 4 years 13.5% 2007 UAH 1.5 bn Prominvestbank n/a 12% 2007 USD 550 m Barclays Capital
Bank 3 years, 2-grace period
Libor+5%*
2009 USD 62.5 m EBRD 10 years, 3-grace period
Libor+6%
Source: CMU, mass media, Ukrzaliznytsia Notes: * in August 2009 credit conditions were revised so that interest rate was
changed from Libor+2.5% to Libor+5%.
Overall indicator for railways has just slightly decreased from 1.77 to 1.76. The positive impact of reduced cross-subsidization between freight and passenger transportation softened negative trends in budget discipline.
2.2.2 Needed future reforms
Railways sector remains one of the least reformed infrastructural sectors. The separation of the government’s regulatory function and operational function of UZ should be soon and finally finished as well as independent transport regulator is to be established. If this occurs, the next steps are corporatization of UZ and unbundling of different railways market segments, such as transportation business and ancillary businesses; infrastructure and transportation operations; passenger and freight segments. Only in this case market of rail transportation services will be created and private investments for modernization will be raised.
66 For the first half of 2009 its payments to the budget have exceeded planned indicators by
28.8%.
24
INSTITUTE FOR ECONOMIC RESEARCH AND POLICY CONSULTING
2.3 Roads
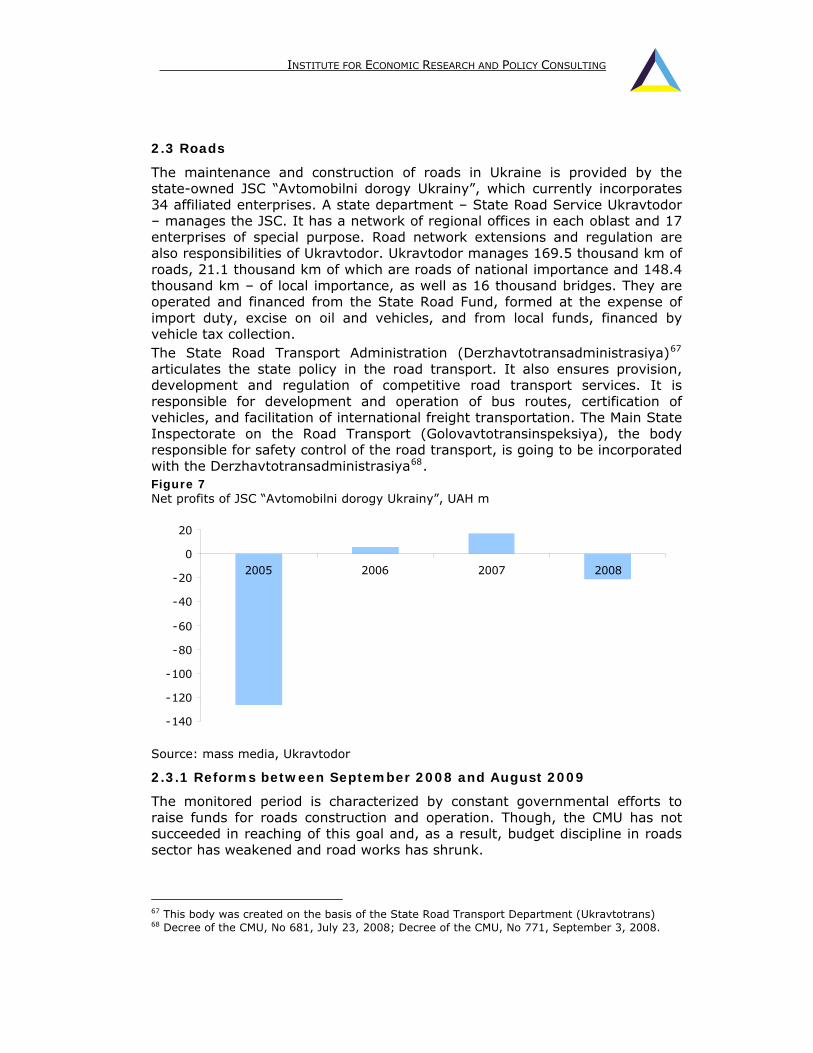
The maintenance and construction of roads in Ukraine is provided by the state-owned JSC “Avtomobilni dorogy Ukrainy”, which currently incorporates 34 affiliated enterprises. A state department – State Road Service Ukravtodor – manages the JSC. It has a network of regional offices in each oblast and 17 enterprises of special purpose. Road network extensions and regulation are also responsibilities of Ukravtodor. Ukravtodor manages 169.5 thousand km of roads, 21.1 thousand km of which are roads of national importance and 148.4 thousand km – of local importance, as well as 16 thousand bridges. They are operated and financed from the State Road Fund, formed at the expense of import duty, excise on oil and vehicles, and from local funds, financed by vehicle tax collection.
67The State Road Transport Administration (Derzhavtotransadministrasiya) articulates the state policy in the road transport. It also ensures provision, development and regulation of competitive road transport services. It is responsible for development and operation of bus routes, certification of vehicles, and facilitation of international freight transportation. The Main State Inspectorate on the Road Transport (Golovavtotransinspeksiya), the body responsible for safety control of the road transport, is going to be incorporated with the Derzhavtotransadministrasiya68. Figure 7 Net profits of JSC “Avtomobilni dorogy Ukrainy”, UAH m
-140
-120
-100
-80
-60
-40
-20
0
20
2005 2006 2007 2008
Source: mass media, Ukravtodor
2.3.1 Reforms between September 2008 and August 2009
The monitored period is characterized by constant governmental efforts to raise funds for roads construction and operation. Though, the CMU has not succeeded in reaching of this goal and, as a result, budget discipline in roads sector has weakened and road works has shrunk.
67 This body was created on the basis of the State Road Transport Department (Ukravtotrans) 68 Decree of the CMU, No 681, July 23, 2008; Decree of the CMU, No 771, September 3, 2008.
25

INSTITUTE FOR ECONOMIC RESEARCH AND POLICY CONSULTING
The central issue of the sector is proper maintenance and construction of roads. In Ukraine state budget transfers remain the main source of financing the roads (see Table 7). During the last years their size has substantially increased; however, performed roads works have shrunk69. Non-transparent and excessively bureaucratic budget procedures of funds spending and sharp increase of costs in the roads sector are the main causes of current situation. As a result, Ukravtodor needs much more capital to deal with poor state of Ukrainian roads and low traffic safety. Besides, urgent necessity to prepare to the UEFA EURO 2012 adds additional burden on the State Road Service.
Table 7 Central fiscal financing of roads sector, UAH m Guidance and
governance in the roads sector
Roads network development
Redemption of sovereign
guaranteed loans
plan 2.46 5,294.12 0.00 2004 fact 2.21 5,275.88 0.00
2005 plan 4.44 3,506.00 248.57 fact 4.41 3,303.17 248.57
2006 plan 6.78 5,822.51 649.04 fact 6.68 5,821.67 645.48
2007 plan 7.51 10,020.80 1,063.81 fact 7.49 9,878.46 993.08
2008 plan 11.03 8,205.81 1,305.46 fact 11.03 7,210.39 1,304.70
2009 plan 9.18 12,348.59 6,270.04 fact (January-June) 3.96 1,894.14 4,890.42
Source: State Budget 2009, Treasury reports on budget execution
Financial crisis has revealed new challenges for the government. Despite the fact that some excises on vehicles and petrol as well as import duty on cars were increased70, the State Road Fund is not expected to collect planned revenues this year as tax base has substantially dried out (see Table 8). This means that Ukravtodor will not get funds from the budget to fully pay for road works, which have already been conducted on credit by both public and private road-constructing enterprises. Eventually, the indicator “State indebtedness” has been decreased from 2.3 to 2.0. In attempt to ensure roads maintenance and preparation for the UEFA EURO 2012 the government allowed Ukravtodor to pay its suppliers and contractors with promissory notes at total amount of UAH 2 bn71, though arrears of Ukravtodor to its counteragents have already been significant72. The indicator “Intra-industry payment ratios” has been decreased from 3.0 to 2.7.
69 According to Ukravtodor, in 2004 171.2 km of roads was built and 9162 km – renewed. In
2008 130.1 km of roads was built and only 200.5 km – renewed. 70 E.g., from January 10, 2009 some excises on vehicles and petrol were increased by 1.5-10
times, Law on Amendments to some Laws of Ukraine on taxation, No. 797-VI, December 25, 2008.
71 Decree of the CMU, No. 841, July 29, 2009. 72 According to Ukravtodor, its arrears to private counteragents achieved UAH 1 bn till the end of
2008.
26

INSTITUTE FOR ECONOMIC RESEARCH AND POLICY CONSULTING
Table 8 Main sources of revenues of the State Road Fund, UAH m 2009
(plan) 2008 (fact)
January-June 2008
Change, yoy, %
January-June 2009
Vehicle tax 1786.45 649.52 1558.42 732.41 -11.32 Excise on: Vehicles n/a 190.76 439.29 215.41 -11.44 Oil products n/a 2650.91 3682.83 1909.78 38.81
3500.00 391.52 3922.76 2417.68 -83.81 Import duty on oil products and vehicles Payments for patent (on trade in oil products)
59.43 9.07 17.61 8.35 8.62
Total 5345.88 3891.78 9620.91 5283.64 -26.34 Source: State Budget 2009, Treasury reports on budget execution. Notes: n/a – not available.
Deficit of budget sources made Ukravtodor and government to look for alternative in the form of loans. However, world financial crisis and deterioration of Ukraine’s credit rating have complicated such task. In late 2008 Morgan Stanley, one of the Ukravtodor’s creditors, called for early repayment of its loan to the State Road Service. In November 2008 USD 465 m debt has been transferred from Morgan Stanley Bank International to Credit Suisse Investment Bank without change of the loan conditions. Later, in January 2009 the Swiss also agreed to provide a USD 465 m loan to Ukravtodor at LIBOR+8% thus refinancing the debt to Morgan Stanley. This time the risk of Ukravtodor’s default has been removed, though at the expense of more expensive credit.
In April 2009 the World Bank approved the Roads and Safety Improvement Project that foresaw provision of another USD 400 m loan to Ukravtodor. The objective of the project is to improve condition and quality of sections of M-03 road and increase traffic safety. In July 2009 the Cabinet of Ministers increased amount of state guarantees allowed for Ukravtodor to cover its credits from UAH 5 bn to UAH 8 bn. Such measure was explained by intention of the government to compensate deficiency of Road Fund revenues by credit sources. Such step can help in the short run, but it again increases debt burden not only on Ukravtodor, but also on the central coffer, which is extremely undesirable under current economic conditions. As efficiency of funds usage remains questionable, such credit amounts are insufficient to change situation in the sector that needs far more to repair roads73.
Table 9 The main credits for roads sector development Year of signing
Credit amount
Creditor Maturity Interest rate
2000 EUR 75 m EBRD 15 years, a 4.5-year grace period
6.28%
73 According to Ukravtodor, the amount of USD 127 bn is necessary for the rehabilitation of the
whole road network in Ukraine.
27

INSTITUTE FOR ECONOMIC RESEARCH AND POLICY CONSULTING
2004 USD 480 m
Deutsche Bank AG
10 years, a 2-year grace period
8% (first 6 months); Libor+6.8%
2005 USD 100 m
Deutsche Bank AG
10 years Libor+2.7%
2005 EUR 100 m
EBRD 15 years, a 3-year grace period
Libor+1%
2006 EUR 200 m
EBRD, EIB 15 years, a 3.5-year grace period
N/A
2006 EUR 300 m
Citibank N.A. 10 years, a 3-year grace period
Libor+2.38%
2007 EUR 200 m
EIB 15 years, a 3.5-year grace period
Libor+0.55%
2008 USD 465 m
Credit Suisse Investment Bank
9 years, a 2-year grace period*
Libor+2.57%*
2009 USD 465 m
Credit Suisse Investment Bank
N/A Libor+8%
2009 USD 400 m
World Bank 17 (30) years, a 5-year grace period
N/A
Source: mass media, CMU, Ukravtodor Note: * it is supposed that conditions of the credit are the same ones agreed with Morgan Stanley Bank International.
The Parliament has adopted a new law On concessions for roads construction and operation74 that came into force on January 31, 2009 in order to attract private investors to the sector. The law allowed a concessionaire not only to build, but also to rehabilitate and operate existing roads. Restrictions to use imported products and foreign labour are excluded from the new law. A concessionaire also gets additional opportunities to ensure sufficient ROI not only through road tolls, but also from state payments and profits received from byroad infrastructure. It is offered to use “operating readiness of a road” to define the quality of a road under concession as an indicator according to which the government will be able to set state compensations. Such improved concession terms may attract private capital for road construction, though the short-term effect of the law will be limited by the world crisis and extreme caution of potential investors. Nevertheless, the indicator “Private sector participation in service contracts” has been slightly improved. i.e. increased from 2.3 to 2.7. The Cabinet of Ministers has also expanded the list of roads for concession. In particular, it made Kyiv Great Bypass Road and Odessa-Reni highway available for concession75.
Besides, during the monitored period the Cabinet has adopted a plan of measures necessary to reform the sector76. According to the plan Ukravtodor has already prepared a range of legislative documents, foreseeing the reorganization of the state-owned JSC “Avtomobilni dorogy Ukrainy” through creation of 10 branch enterprises in its structure, which will operate and repair
74 Law on Amendments to the Law on Concessions for roads construction and operation, No. 891-VI, January 15, 2009 75 Decree of the CMU, No. 569, June 10, 2009. 76 Order of the CMU, No.125-p, February 4, 2009. For details of the reforms see the Infrastructure
Monitoring for Ukraine No. 10// http://www.ier.com.ua/docs/imu/imu_10_en.pdf.
28

INSTITUTE FOR ECONOMIC RESEARCH AND POLICY CONSULTING
77roads of national importance on equal terms with private companies later on (see planned structure of the sector governance in the Figure 8). In the whole, in case of successful reforms improvements in the roads sector’s governance are likely to ensure better financing and operation of both national and local roads. Meantime, no indicator has been changed since further changes are expected.
Figure 8 Structure of the state governance of the roads sector after reforms
Regional agencies of the roads
MTCU
State Administration of the Roads
Cabinet of Ministers
Regional (oblast) state administrations
Departments of the roads (operate the local roads and order their
construction and repair)
The state-owned enterprise – the Agency of the roads of national importance (operates the roads of national
importance and orders construction and repair
works)
The state-owned enterprises and
private companies that can conduct any works on roads construction
and operation
Source: Ukravtodor In December 2008 the CMU adopted new procedures of tender for servicing passenger routes78, which are now the same all over Ukraine. The new procedures foresee formation of a tender committee from both governmental bodies and the NGOs, toughening of the selection criteria for transport companies, and selection of so-called “working body” that will prepare tender documentation and assess eligibility of transport companies. The regulation should make tender procedures more transparent and strengthen competition in the passenger road transport services. Nevertheless, the indicator “Access regulation” has not been changed. The CMU has decided to support domestic transport companies in crisis times. In particular, it has set minimum tariffs for freight auto transportation - the service provided mostly by private companies79. This decision was explained by the need to prevent some automobile freight transporting companies from undercutting others. As this form of intervention violates the principles of 77 Resolution of Ukravtodor, No. 176-185, April 28, 2009 78 Decree of the CMU, No. 1081, December 3, 2008. 79 According to the MTCU, there are 100.1 thousand of enterprises providing road transportation
services in Ukraine.
29

INSTITUTE FOR ECONOMIC RESEARCH AND POLICY CONSULTING
market competition and prices regulation we have decreased the indicator “Political vs. regulated operators” from 2.3 to 2.0.
The overall indicator for roads sector has been decreased from 2.44 to 2.42 due to weakened budget discipline both of the government and Ukravtodor as well as due to government interference into competitive transportation market.
2.3.2 Needed future reforms
The existing system of roads maintenance and construction does not ensure further sector development since public funds are exhausted and private investments are insufficient. So, planned reforms separating regulatory and management functions in the road sector, transferring local road network to local authorities and creating prerequisites for private participation should last later on.
30

INSTITUTE FOR ECONOMIC RESEARCH AND POLICY CONSULTING
2.4 Power
Since 2002 the output growth in the power sector had been strongly accelerating together with rapid industrial output growth. It accelerated up to 13% between 2004 and 2005 and reached almost 30% between 2006 and 2007. In 2008 the acceleration stopped. According to preliminary data in 2008 output of the power sector declined by 2% reflecting the negative influence of economic crisis.
Table 10 The role of the power sector in the economy 2003 2004 2005 2006 2007 Output UAH m 20,561 22,703 26,189 34,473 43,913 % total output 3 3 2 3 2 % industrial output 6 5 4 4 3
Value added % GDP 4 3 3 3 3 % output 47 48 49 49 47 Structure of value added:
Compensation of employees
% sector VA 35 56 49 48 39
Gross operating surplus, mixed income
% sector VA 65 36 38 30 44
% sector VA - 8 13 22 16 Net taxes on production and imports
Employment* thous people 529 528 527 520 518 % total employed 5 5 5 5 5 Average wage* UAH 651 767 969 1,228 1,577 Exports UAH m 608 639 945 1,525 2,113 % total exports - - - 1 1
% sector output 3 3 4 5 5 Imports UAH m 14 2 0 0 - % total imports - - 0 0 - % sector output - - 0 0 - Exports/imports index 43 320 n/a n/a n/a Source: State Statistics Committee, own calculations Notes: *Data is for gas, water and power sectors together
“-“ - less that 0.5% n/a - not applicable
In 2008 the electricity generation dropped for the first time since 2001. Total electricity generation declined by 6% yoy and constituted 192 TWh. At the same time, consumption remained at the level of 2007 (see Table 11), which is explained by a drop in outside demand. During the first quarter of 2009 the Ukraine’s power plants generated 84 TWh, which is 16% lower than a year ago reflecting decline of domestic consumption of 14% yoy (see Table 11). The biggest drop of electricity consumption was at metallurgy, chemistry, machine building and construction - the industries that were hit by the crisis the most.
31

INSTITUTE FOR ECONOMIC RESEARCH AND POLICY CONSULTING
Table 11 Electricity generation and consumption breakdown in 2008 and in first half of 2009, TWh 2007,
TWh 2008, TWh
Growth, First half Growth, %, yoy of 2009, %, yoy
TWh Total generation 195 192 -2 84 -16 Power stations subordinated to the Ministry of Fuel and Energy 187 164 -12 80 -16
Nuclear Power Plants 93 90 -3 41 -13 Thermal Power Plants 84 82 -2 33 -21 Hydropower Plants 10 11 10 7 0 Combined Heat and Power Plants 8 8 0 4 -17 Renewable resources 0 4 n/a n/a
Gross consumption 186 185 -1 83 -14 Net consumption 148 148 0 66 -15 Industry 83 77 -7 30 -28
Metals 45 41 -9 15 -34 Fuel and energy 10 9 -10 5 -7 Machine building 7 7 0 2 -34 Chemicals and petrochemicals 7 6 -14 2 -36 Food processing 5 5 0 2 -5 Construction materials 3 3 0 1 -42 Other industrial consumers 6 6 0 2 -13 Agriculture 3 3 0 2 -4 Transport 10 10 0 4 -22 Construction 1 1 0 1 -30
Public utilities 17 18 6 9 -4 Other non-industrial consumers 6 6 0 3 -4 Households 29 32 10 18 11
Source: Energobusiness Notes: n/a – not available
2.4.1 Reforms between September 2008 and August 2009
During the reviewed period we observed changes in the structure of nuclear energy sub-sector, structure of electricity exports and structure of ownership of electricity generation and distribution assets. There were no major changes in tariffs for domestic consumers.
During the monitored period the CMU has created the State concern ‘Nuclear fuel of Ukraine’80 81 and adopted respective State programme . Simultaneously, the previous vertically integrated state company ‘Ukratomprom’ was abolished82. In contrast to ‘Ukratomprom’ the main aim of the new concern is
80 CMU Resolution On issues of state concern ‘Nuclear Fuel’, No 841, September 10, 2008. 81 CMU Order On approval of Conception of State economic target program ‘Nuclear Fuel of
Ukraine’, No 216, February 25, 2009. 82 “Ukratomprom” was initially planned to consolidate uranium-mining enterprises, industrial
companies and scientific institutions. Concern was established according to CMU Orders On improvement of atomic complex management, No 1854 and on issues of state concern ‘Ukratomprom’, 456. Later, these orders were initially abolished by the President (Decree No 706 as of March 14, 2007) and later by the Cabinet itself (Order No1403 as of December, 2007) at the background of accusation for shadow privatisation of some large state
32

INSTITUTE FOR ECONOMIC RESEARCH AND POLICY CONSULTING
to create Ukraine’s own closed nuclear cycle in order to supply domestic fuel to national nuclear plants. The concern is going to unite the enterprises that extract uranium ore, process it and produce different parts of nuclear reactors equipment. The centralization in the power sector is not critically necessary step for creation of closed nuclear cycle. The bundling carries the risk of lowering the efficiency of management and decreasing of transparency of operations. However, we have not reduced any indicator of operation efficiency of natural monopoly since the result of the decision is still remains to be seen.
The Government has frozen the tariffs for households at the level of 2006 (UAH 0.24 per KWh), even though the National Electricity Regulatory Commission (NERC) calculated the costs of supplying power to households at UAH 0.73 per KWh.83 At the same time, the CMU has provided privileges in electricity price for metallurgical and chemical companies in order to support the enterprises in coping with economic downturn.84 Such tariff policy has increased the level of cross subsidization and has resulted in direct financial losses for the power sector. We have decreased the indicator that correspond the level of political interference to tariff setting from 3.0 to 2.7.
During the period under review has changed rules in electricity export. On particular, in March 2009 the Parliament adopted a law85 that debarred the state company “Ukrinterenergo” from exclusive rights to export electricity. The law instead empowers all electricity suppliers, which are members of wholesale electricity market (WEM) and have appropriate license, to buy electricity for exports at the WEM at a price that does not exceed a wholesale price. At the same time, the suppliers have then to compete for one-year access to the distribution network of the National Energy Company ‘Ukrenergo’. The access will be granted to a supplier that offers the highest possible price subject to availability of free electricity grid. It will improve the framework of electricity exports market significantly in terms of competitiveness and reasonable pricing. This improvement allowed us to raise indicator for access regulation upward up to 3.3.
Reasonable pricing appeared to be very important as in 2009 Ukraine’s electricity was uncompetitive on the international market due to its high price86. Current price of electricity for export in Ukraine is higher than electricity prices in countries-importers. Currently rapid decrease of electricity consumption inside our largest consumers - Hungary, Slovakia and Poland - has led to sharp decrease of prices at those markets. This resulted in contraction of Ukraine’s electricity export of almost 60% yoy in the first half of 2009 (see Figure 9). Only Slovakia increased electricity imports from Ukraine
enterprises like ‘Energoatom’ and ‘Turboatom’. So, the first attempt to consolidate capacities on nuclear fuel production failed in practice.
83 http://www.rbc.ua/ukr/newsline/2009/05/19/545018.shtml. 84 The CMU has recommended the NERC to freeze electricity prices for the enterprises from
November 2008 till October 2009 in the CMU Order On immediate measures on stabilization of situation in chemical and metallurgical complexes, No 925, October 14, 2008.
85 Law of Ukraine On changes in Law On power industry in terms of electricity exports regulation issues’, No 1164, March 19, 2009.
86 Export price is bounded by the wholesale price formed on the wholesale electricity market.
33

INSTITUTE FOR ECONOMIC RESEARCH AND POLICY CONSULTING
thanks to large market share of Ukrainian companies-exporters in Slovakia market.
In May privatization of state power generating companies was restored when the President abolished his previous decree87 that prohibited privatization of strategic state companies including power generators and distributors. The privatization of the largest state power generators and distributors has not been started yet due to numerous difficulties. In particular, selling of controlling stakes (60%+1) in four energy-generating companies - Donbasenergo, Zahidenergo, Dniproenergo and Centerenergo - is currently blocked by the conflict between stockholders of Dniproenergo, which limits possibility to sell the stakes in one package as the CMU plans. The attempts to sell the controlling stakes of the biggest state power distributors failed as initial auction prices were too high to attract the investors.
Figure 9 Electricity exports in 2008-2009, m kWh.
0
200
400
600
800
1000
1200
1400
1600
Hungary Moldova Romania Slovakia Poland Belarus
m KWh
January - June 2008 January - June 2009
Source: Energobusiness
Summing up, the overall indicator for power industry has not changed and remained at 2.57. The improved access to the distribution networks could not compensate political interference into the tariff setting in the industry.
2.4.2 Needed future reforms
It is necessary to continue tariff reform in the power sector, stimulate competition in electricity generation, and introduce incentive regulation in electricity transmission. The state should make a commitment as for further
87 Presidential Decree On cancellation of President decree No 1178, December 19, 2008, No
359, May 26, 2009.
34

INSTITUTE FOR ECONOMIC RESEARCH AND POLICY CONSULTING
privatization in the sector. Liberalization steps declared in the plan of liberalization of the electricity market have to be done.
35

INSTITUTE FOR ECONOMIC RESEARCH AND POLICY CONSULTING
2.5 Gas
The output in gas sector is always strongly influenced by natural gas price changes. Between 2001 and 2004 the gas sector output did not change significantly due to stable prices. For the next three years output has been growing at 25% annually mainly due to rise of the gas prices.
Table 12 Role of the gas supply sector in the economy 2003 2004 2005 2006 2007 Output UAH m 2,112 2,129 2,356 3,807 4,158 % total
output - - - - -
% industrial output
1 - 1 - -
Value added % GDP - - 1 - - % output 54 52 67 59 56 Structure of value added: Compensation of
employees % sector VA 68 75 47 61 77
Gross operating surplus, mixed income
% sector VA 2 1 47 20 17
% sector VA Net taxes on production and imports
30 24 6 20 6
Employment* thous. people
529 528 527 520 518
% total employed
5 5 5 5 5
Average wage* UAH 651 767 969 1,228 1,577
Source: State Statistics Committee, IER estimates Notes: *Data is for gas, water and power sectors together
- less than 0.5%
2.5.1 Reforms between September 2008 and August 2009
Ukraine’s gas sector was strongly hit by the economic crisis that slashed natural gas consumption of the most energy-intensive industrial consumers already in the end of 2008. Besides this, stability of natural gas supply and transit to Europe was threatened by January gas conflict with Russia that was followed by signing a new, this time, long-term agreement on gas supply.
In 2008 Ukraine and Russia started gas talks earlier than usually but this have not prevented usual January crisis. In October NJSC “Naftogaz of Ukraine” and OJSC “Gazprom” signed a memorandum on principles of long-term cooperation in gas trading. The Memorandum has fixed introduction of market-based pricing for natural gas supplied to Ukraine as well as for Ukraine’s transit services with three-year transition period. Besides, the parties agreed to change gas supply scheme to direct purchases from Gazprom avoiding an intermediary RosUkrEnergo with the following transferring of the debts of Naftogaz towards RosUkrEnergo to Gazprom.
36

INSTITUTE FOR ECONOMIC RESEARCH AND POLICY CONSULTING
However, in the end of 2008 the Memorandum was cancelled since Naftogaz failed to pay its debts of USD 2.6 bn accumulated between September and November 2008 in full. USD 1.95 bn of debts body without fees and penalties was paid on December 30 mainly at the expense of loans provided to Naftogaz from the state bank Oshchadbank. The failure to repay the entire debts became the official ground for abandoning the Memorandum. In the beginning of 2009 the companies didn’t reach another agreement and Gazprom stopped supplying gas for Ukraine on January 1, 2009 and later for transit to the EU customers. The latter decision was explained by gas thefts in Ukraine.
Gas transit to the EU was resumed on January 13 after intensive tripartite talks between Ukraine, Russia, and the EU. On January 19, Naftogaz and Gazprom (Russia) signed two separate long-terms contracts On natural gas supply to Ukraine in 2009 - 2019 and On transit of natural gas to the EU consumers. According to the contracts, in 2009 Ukraine is obligated to buy 40 bcm of gas and transit 120 bcm of gas to the EU. It was also agreed to link gas price for Ukraine to the EU petroleum products price for the period from 2009 till 2019. Instead of keeping constant gas transit fee at USD 1.7 per tcm per 100 km Ukraine will receive a 20% discount in gas price.
Generally, separation of gas supply and gas transit contracts is long awaited step, which will allow to increase transparency and efficiency of operations of gas import and gas transit units of Naftogaz. On the other hand, the mechanism of calculation of gas price is not favourable for Ukraine. In particular, the base price for calculation of final import gas price for Ukraine is high. The price of USD 450 for tcm equals to the gas price at the EU market while at minimum it should exclude the transportation costs. As a result, in 2009 average price for imported natural gas is expected be USD 228.8 per tcm, which is 27% higher than a year ago. Second, current transit tariff fee is not sufficiently high to finance all necessary investments in transit pipelines because the transit fee formula does not take into account current operational and capital expenditures. Instead it built as a simple indexation of current transit fee to the EU inflation. Third, the contracts stipulate ‘take or pay’ obligations for Ukraine at rather high volumes (40 bcm in 2009), which Ukraine will not be able to consume due to the economic crisis while the Gazprom has no symmetric obligations for gas transit through Ukraine territory and can significantly reduce transit volumes without being imposed to penalties. However, we have increased indicator ”Operation. Natural monopoly” from 2.0 to 2.3.
After the intergovernmental negotiations between Russia and Ukraine in November, 2009 NJC ‘Naftogas’ (Ukraine) and JSC ‘Gazprom’ (Russia) signed the supplement to January 2009 gas supply contracts. Companies agreed to decrease contracted figures of gas imports for 2009 and 2010. Thus, Gazprom will not penalize Ukraine even though Ukraine will probably import only 27 bcm of the natural gas from Russia instead of previously contracted 33 bcm. For 2010, contracted amount was decreased from 52 bcm to 33.75 bcm though take-or-pay clause will remain in the contract. In 2010, average price for gas imported from Russia will increase to USD 280 - 337 per tcm depending on oil price developments next year. The transit tariff is also expected to rise and reach USD 2.7-2.8 per 100 km/per tcm.
37

INSTITUTE FOR ECONOMIC RESEARCH AND POLICY CONSULTING
Seeking possibilities to invest in modernization of the gas transport system Ukraine, the EU, the EBRD, the European Investment Bank and the World Bank signed a declaration on March 23, 2009. The declaration fixes intentions of the sides to support Ukraine in attracting loans of international organisations to rehabilitate and modernize Ukraine’s gas transport system. Initially the parties intend to invest USD 3.0 bn in the gas main; additional USD 5-6 bn are expected to be attracted to expand the capacity of Ukraine’s gas transport system by 60 bcm. In response, Ukraine has committed to reform domestic gas market according to the respective EU directive88, which envisages legal separation of different activities of the Naftogaz, creation of independent gas transit operator, appropriate financial reporting and market-based pricing etc.
Table 13 Consumption of gas in Ukraine during 2003-2007, bcm 2004 2005 2006 2007 2008 2009E* All Consumers 68.1 68.9 65.9 63.9 59.2 48.7 Industry (excluding power) 28.2 29.0 24.3 25.8 23.2 18.2
Metals industry 9.9 9.6 9.3 9.8 8.1 n/a Chemical industry 8.3 8.8 n/a n/a 6.6 n/a Other industrial users 10.0 10.7 n/a n/a 8.5 n/a
Power industry 6.7 5.7 8.6 8.4 7.5 2.8 including Ministry of Fuel and Energy 6.6 5.7 n/a n/a n/a n/a
Local government 33.1 34.1 34.2 29.7 28.5 27.7 Households 18.9 19.2 19.3 19.2 18.5 18.9Including district heating companies 13.5 13.7 12.8 10.5 10.0 8.8
Technical use 7.6 7.4 8.1 7.0 7.0 7.1 Total consumption 75.8 76.4 73.9 69.9 66.3 55.8 Households, tcm per capita 0.40 0.41 0.41 0.41 0.4 0.4 Total consumption, tcm per capita 1.60 1.63 1.58 1.51 1.4 1.2
Source: Energobusiness , Ministry of Fuel and Energy Notes: n/a – not available.
NJSC “Naftogaz of Ukraine” has published consolidated financial statements for 2008 that reported unsuccessful financial performance of the company. Naftogaz has ended the year with net losses of UAH 1.9 bn while current liabilities have exceeded its current assets by UAH 14.0 bn. Losses accumulated by the Naftogaz was mainly a result of hryvnia devaluation in the forth quarter of 2008 that led to foreign exchange losses of UAH 8.7 bn. The sharply increased debts service amounts and pumping gas into gas storage were covered by an increase the short-term borrowings to UAH 19.6 bn (UAH 3.5 bn in 2007). In 2009 the problem of high import gas price was coupled by the economic crisis that pushed down gas consumption 66.3 in 2008 to expected 59 bcm in 2009 (Table 13), which implies direct financial losses to the Naftogaz.
88 EU Directive 2003/55/EC (see http://eur-lex.europa.eu/LexUriServ/LexUriServ.do?uri=OJ:L:2003:176:0057:0078:EN:PDF for further details)
38

INSTITUTE FOR ECONOMIC RESEARCH AND POLICY CONSULTING
89In June the CMU changed the structure of gas distribution market having transferred gas distribution networks of 42 regional gas supplying companies (oblgases) to a subsidiary of Naftogaz – “Naftogasmerezhi”. The main purpose of such restructuring is to provide control over local gas supply to Naftogaz. On the one hand, Naftogas can now directly manage gas supplies and payments of final consumers and solve the problem of non-payments by local gas distributors. On the one hand, such centralization will hurt transparency of operations on the domestic gas market, increase monopoly power of the Naftogas; and finally, it directly contradicts EC directives mentioned earlier, according to which Ukraine has promised to reform its gas market. We have decrease the indicator 1.3.1 “Separation of natural monopoly and potentially competitive businesses” from 2.0 to 1.7.
During the period under the review the NERC has increased gas tariffs for households by 14%.90. Against the background of the increase import gas price and hryvnia devaluation current price is far from a cost covering one. In 2009 the CMU decided to support metallurgy and chemical industry at the expense of Naftogaz by freezing the gas tariffs for those industries91. Chemical enterprises92 have even lobbied additional discounts for gas used as a feedstock for nitrogen fertilizers.93 94 As a result, separate companies pay USD 197 per tcm starting from August 14, 2009. Thus the tariff policy of the NERC continues to be very populist; it does not only result in direct loss of Naftogaz but also increase cross-subsidization in gas sector. The indicator 2.1.1 “Political vs regulated operators” from 2.0 to 1.7.
Summing up the changes we have decreased the indicator for gas sector from 2.02 to 1.98.
2.5.2 Needed future reforms
The tariff system reform is the first urgent reform that should be done while the current pricing that foresees cross-subsidization is not working in economic crisis conditions and natural gas price hike at the beginning of 2009. For this the current pricing mechanism both with Gazprom and in domestic market should be immediately changed. The other important thing of further reforming of the sector is fulfilling the conditions of investment Memorandum signed in Brussels that envisages the establishment the competitive gas market in Ukraine according the EU standards in mid-term. The core element of this reform is legal unbundling and real independence of producers,
89 CMU Order On management efficiency improvement concerning the state property of gas
distributive networks, No 775, June 10, 2009. 90 Resolution of the National Electricity Regulation Commission of Ukraine "On approval of the
retail price of natural gas used for the needs of the population, the International Children Center Artek and Ukrainian Children's Centre "Young Guard”, № 1239 of October 25, 2008.
91 NERC Resolution On setting the ceiling prices for natural gas for industrial consumers and other entities in 2009, No 769, July 1, 2009
92 Excluding RivneAzot chemical plant. The company did not obtain the discount price by politically motivated reasons.
93 NERC Resolution On setting the ceiling price for nitrogen fertilizers producers in 2009, No 1251/1, October 30, 2009.
94 Namely DniproAzot, Concern Stirol, Odessa Port Plant, OJSC Azot, CJSC Severodonetsky Azot.
39

INSTITUTE FOR ECONOMIC RESEARCH AND POLICY CONSULTING
suppliers and distributors of natural gas (including Russian gas transit service) that are supposed to operate at market at cost covering prices.
40

INSTITUTE FOR ECONOMIC RESEARCH AND POLICY CONSULTING
2.6 Water and wastewater
In nominal terms the output of the water supply and water treatment had been increasing from 2003. The share of the sector output in the total output and industrial output has been steadily decreasing during the last few years. Table 14 The role of the water and wastewater sector in the economy 2001 2002 2003 2004 2005 2006 Output UAH m 2,240 2,178 2,320 2,451 3,734 4,180 % total
output - - - - - - %
industrial output 1 1 1 1 1 1
Value added % GDP - - - - - - % of
output 37 37 38 38 39 52 Structure of value added:
Compensation to employees
% sector VA 58 60 76 76 56 53
Profit, mixed income % sector VA 25 14 5 7 28 32
Net taxes on production and imports
% sector VA
17 26 19 17 15 15 Employment* thous.
people 529 528 529 528 527 520 % total
employed 4 4 % 5 5 5 Average wage* UAH 476 562 651 767 969 1,228 Exports UAH m 0 0 0 0 9 10 % total
exports 0 0 0 0 - - % sector
output 0 0 0 0 - - Source: State Statistics Committee, own calculations. Note: * Data for electricity, gas, and water supply. - less than 0.5%
In Ukraine local communities are responsible for performance of water supply and wastewater treatment sector. Most of them are communal enterprises managed by local authorities. On the national level the sector is governed by the Ministry of Housing and Public Utilities. The enterprises inherited soviet type infrastructure and management approach that has led to continuously exhausting assets, and, respectively, low services quality, high leakages. Traditionally the enterprises did not charge households full price and used cross subsidization to cover their needs. Meantime, during the last years the household tariffs for the services were continuously increasing. However, they still do not cover costs, according to the official statistics. Now substantially higher tariffs and unchanged service quality bring up an issue of the efficiency of the enterprises in the sector.
41

INSTITUTE FOR ECONOMIC RESEARCH AND POLICY CONSULTING
2.6.1 Reforms between September 2008 and August 2009
The period under review was characterized by accelerated activity of the policy makers of the sector in programming, drafting legislation and raising tariffs.
Last year in July the CMU approved a Concept of Development of the State Regulatory System of Natural Monopolies on Utilities Market95. The concept correctly acknowledges that natural monopolies in the utilities sector require special regulation different from the regulation of other utilities sub-sectors96. The concept foresees two major developments in the sector. First, it is envisaged to create a separate regulator for district heating, water supply and wastewater treatment companies – National Utility Market Regulatory Commission, the main function of which would be balancing the interests of the state, consumers and suppliers of the services. Second, the concept states the principles of tariff policy in the sectors:
- the tariffs are set by local authorities,
- the tariffs cover fully economically justified costs,
- the tariffs can include costs of investments and energy saving projects.
In more details, identifying the need in special regulation of natural monopolies and stating - one more time - the cost covering principle are correct but not enough for a concept of development of the state regulatory system. It is not clear how the commission is going to balance interests of all stakeholders since the only mechanism to do this is to set tariffs and this function remains to be of the local authorities. Thus, the concept does not identify the single regulatory authority in the sector. The regulatory functions are divided between the commission and local authorities. Besides, the main functions and aims of the envisaged commission repeat the functions and aims of the existing Ministry of Housing and Public Utilities; only the commission will be responsible for the narrower sector.
In general, the concept is far from a coordinating program document that clearly defines which principles and methods the Ukrainian state has chosen to regulate utilities. The aims and principles of the regulation set in the concept are mixed up; the responsibilities are often not supported by authorities. The concept defines neither chosen approach to regulation nor its instruments.
Summing up, the adopted concept will hardly lead to increase in efficiency neither of regulatory system nor of the sector itself. Executing the articles of the concept the CMU created a State Housing and Utilities Inspection97 in the Ministry in September 2008. The inspection is a controlling authority in the sector with rights and responsibilities to control obeying legislation, standards, normatives, norms, orders and rules in the sphere of utilities and housing. As controlling performance of the socially
95 The CMU Order On approval of a concept of development of the state regulation of
activities of natural monopolies enterprises on public utilities market, No 932, July 09, 2008.
96 That do not have features of natural monopolies. 97 CMU Order On approval of a provision on State housing and utilities inspection, No
798, September 10, 2008.
42

INSTITUTE FOR ECONOMIC RESEARCH AND POLICY CONSULTING
important services and housing and public utilities are very important we assess positively the creating of the inspection.
Following the commitments fixed in the Concept the Ministry of Housing and Public Utilities has drafted couple of laws. In particular, a draft law On water supply and water treatment services98 and a draft law on national regulatory commission on the utilities market99.
Several important developments occurred in tariff setting. In March 2009 the Parliament has amended the law on Natural Monopolies in the articles that concern tariff regulation100. In particular, the amendments have forbidden inclusion of sums of bad debts, fines and penalties, written off assets, losses and costs of keeping social and cultural infrastructure to the tariffs. Thus, the natural monopolies are limited in using tariffs to cover their own inefficiencies. On the other hand, it is in principle unreasonable to put the burden of keeping social and cultural infrastructure on natural monopolies and not allowing to include their costs into tariffs. The mechanism of sell-offs social and cultural businesses should be introduced simultaneously with such changes. However, with appropriate stimulus the mentioned limitations can lead to a raise in efficiency of natural monopolies including enterprises of water supply and wastewater treatment.
101In all main cities except Kharkiv and Sebastopol the tariffs for water supply and water treatment changed since June 2008. However as figure 10 shows current tariffs for households cover costs only in two cities – in Zaporizhzhia and Lviv; in Kyiv the tariff almost cover costs. At the same time, the current tariffs demonstrate huge cross-subsidization. Even in the cities where households pay 100% of costs commercial consumers pay 20 and 47% more. In 7 cities commercial consumers pay more than doubled unit costs. First, such level of cross subsidization is inadmissible. Second, it rises important questions:
- with such tariffs structure it is highly doubtful that the enterprises are as loss-making as commonly reported;
- if the enterprises are still unprofitable, what do they spend money on?
- if the enterprises are profitable who is benefiting? Do they make necessary investments from profits?
Another important issues that Figure 10 reveals is significant differentiation in tariffs across cities of Ukraine. While there is common single methodology on tariff setting102 the authorities that set the tariffs – local bodies – use the methodology surprisingly differently, which again points at fallacy of current tariff setting system.
98 http://www.minjkg.gov.ua/index.php?id=1507 99 http://www.minjkg.gov.ua/index.php?id=1985 100 Law of Ukraine On amending the article 9 of the law of Ukraine On natural
monopolies, No 1072-VI, March 5, 2009. 101 In Kharkiv the current tariffs have not changed since October 2006, in Sebastopol –
since October 2007. 102 CMU Order On approval of the methodology calculation of tariffs for water supply
and wastewater treatment, No 959, July 12, 2006.
43

INSTITUTE FOR ECONOMIC RESEARCH AND POLICY CONSULTING
Figure 10 Cost covering level of the water supply tariffs for households and commercial consumers
0%
50%
100%
150%
200%
250%
300%
350%
Sim
fero
pol
Vin
nyt
sia
Luts
kD
nip
ropet
rovs
kD
onet
skZhyt
omir
Uzh
gor
odZap
oriz
hzh
iaIv
ano-
Fran
kivs
kBila
Tse
rkva
Kirov
ogra
dLu
gan
skLv
ivM
ykol
ayiv
Odes
aPo
ltav
aRiv
ne
Sum
yTe
rnop
ilKhar
kiv
Kher
son
Khm
elnitsk
yiCher
kasy
Cher
niv
tsi
Чернігів
Kyi
vSeb
asto
pol
cost coverage
households commercial consumers 100%
Source: Ministry for housing and public utilities
During the period under consideration the state has managed to attract investments into the sector from international organizations. In September 2008 Ukraine and the International Bank for Reconstruction and Development (IBRD) has signed an agreement on the USD 140 m loan, which was ratified by the Parliament103. The money will be spent on investment projects in water supply, wastewater treatment, and wastes utilization in Odesa, Chernihiv and Ivano-Frankivsk. The projects will last for 5 years and first tranches are expected in 2009. Such initiative is insufficient to resolve all financing issues, but it can bring necessary expertise to the sector, facilitate know-how and advanced technologies transfer, thus improving utilities’ performance. In general, Ukraine has received comparatively few loans from international organizations to invest in the sector (Table 15).
103 Law of Ukraine, No.592-VI, September 24, 2008
44

INSTITUTE FOR ECONOMIC RESEARCH AND POLICY CONSULTING
Table 15 Major loans to utilities sector
Year Creditor Borrower Credit amount 1999 EBRD Zaporizhzhia water utility EUR 21.4 m
Dnipropetrovsk municipal water and wastewater company
EUR 20.0 m 2005 EBRD
2008 IBRR Government of Ukraine USD 140.0 m
Sources: EBRD, World Bank
Summing up, the developments in the sector have not allowed us to change the overall indicator. The sector is still the least reformed one with an indicator of 1.60
2.6.2 Needed future reforms No structural changes in the sector means that the reforms that we talk about in all issues of the IMU still have to be done. Water and wastewater tariffs have to cover the services costs at 100%. At the same time, current tariffs structure and financial state of the enterprises require audit. The enterprises have to make commitments as for increase of the services quality. Regulation system in the sector has to be changed. First of all, an institute of independent regulator has to be established.
45

INSTITUTE FOR ECONOMIC RESEARCH AND POLICY CONSULTING
Indi
cato
r
00-N
01-M
01-N
02-M
02-N
03-M
04-J
05-J
06-J
07-A
08-A
09-S
00-N
01-M
01-N
02-M
02-N
03-M
04-J
05-J
06-J
07-A
08-A
09-S
00-N
01-M
01-N
02-M
02-N
03-M
04-J
05-J
06-J
07-A
08-A
09-S
EBRD
indi
cato
r2,3
2,32,3
2,32,3
2,32,7
2,72,7
2,72,0
2,02,0
2,02,0
2,02,0
2,02,0
2,02,0
2,02,0
2,02,0
2,02,0
2,02,0
2,0IE
RPC
indi
cato
r2,3
12,3
62,2
42,2
22,2
62,2
92,4
12,4
02,5
02,5
32,4
62,4
81,2
91,3
91,4
91,5
41,5
61,7
91,7
31,7
81,8
01,7
91,7
71,7
62,1
22,1
52,1
52,1
42,1
72,3
02,2
82,3
02,3
92,3
92,4
42,4
21
Com
mer
cial
izat
ion
and
priv
atiz
atio
n2,0
2,01,9
1,92,0
2,12,1
2,12,1
2,12,1
2,11,3
1,41,5
1,51,6
1,81,8
1,81,8
1,81,7
1,71,9
2,02,0
2,02,1
2,12,2
2,22,2
2,22,2
2,31.
1O
wne
rshi
p2,0
2,02,0
2,02,1
2,22,1
2,12,2
2,32,3
2,31,2
1,31,3
1,31,5
1,71,6
1,61,6
1,61,6
1,62,0
2,02,0
2,02,0
2,02,1
2,12,1
2,12,1
2,11.
1.1
Natu
ral m
onop
oly
1,31,3
1,71,7
1,71,7
1,71,7
1,71,7
1,71,7
1,01,0
1,01,0
1,01,0
1,01,0
1,01,0
1,01,0
1,01,0
1,01,0
1,01,0
1,01,0
1,01,0
1,01,0
1.1.
2Po
tent
ially
com
petit
ive
busin
esse
s2,7
2,72,3
2,32,7
3,02,7
2,73,0
3,33,3
3,31,3
1,31,3
1,31,7
2,02,0
2,02,0
2,02,0
2,02,7
2,72,7
2,72,7
2,73,0
3,03,0
3,03,0
3,01.
1.3
Ancil
lary
bus
ines
ses
2,02,0
2,02,0
2,02,0
2,02,0
2,02,0
2,02,0
1,31,7
1,71,7
1,72,0
1,71,7
1,71,7
1,71,7
2,32,3
2,32,3
2,32,3
2,32,3
2,32,3
2,32,3
1.2
Ope
rati
on1,8
1,91,7
1,71,7
1,82,0
2,02,0
2,02,0
2,01,2
1,41,6
1,71,7
1,81,9
1,91,9
1,91,8
1,71,6
1,81,8
1,91,9
2,02,2
2,22,2
2,22,2
2,31.
2.1
Natu
ral m
onop
oly
1,72,0
1,71,7
1,71,7
2,02,0
2,02,0
2,02,0
1,31,3
1,71,7
1,71,7
1,71,7
1,71,7
1,71,7
1,31,7
1,72,0
2,02,0
2,02,0
2,02,0
2,02,0
1.2.
2Na
tura
l mon
opol
y pl
anni
ng a
nd in
vest
men
t 2,0
2,01,7
1,71,7
1,71,7
1,71,7
1,71,7
1,71,0
1,31,3
1,71,7
2,02,3
2,32,3
2,32,0
1,71,7
1,71,7
1,71,7
2,02,3
2,32,3
2,32,3
2,31.
2.3
Priv
ate
sect
or p
artic
ipat
ion
in s
ervi
ce
1,71,7
1,71,7
1,72,0
2,32,3
2,32,3
2,32,3
1,31,7
1,71,7
1,71,7
1,71,7
1,71,7
1,71,7
1,72,0
2,02,0
2,02,0
2,32,3
2,32,3
2,32,7
1.3
Org
aniz
atio
nal s
truc
ture
2,22,2
2,12,1
2,12,2
2,22,1
2,12,1
2,12,1
1,41,6
1,61,6
1,71,8
1,81,8
1,81,8
1,71,7
2,22,2
2,22,2
2,32,4
2,42,4
2,42,4
2,42,4
1.3.
1Se
para
tion
of n
atur
al m
onop
oly
and
pote
ntia
lly c
ompe
titiv
e bu
sines
ses
2,32,3
2,02,0
2,02,3
2,32,0
2,02,0
2,02,0
1,01,0
1,01,0
1,31,7
1,71,7
1,71,7
1,71,7
3,33,3
3,33,3
3,33,3
3,33,3
3,33,3
3,33,3
1.3.
2Se
para
tion
of a
ncilla
ry b
usin
esse
s2,0
2,02,0
2,02,0
2,02,0
2,02,0
2,02,0
2,01,3
1,71,7
1,71,7
1,71,7
1,71,7
1,71,7
1,72,0
2,02,0
2,02,0
2,02,0
2,02,0
2,02,0
2,01.
3.3
Dece
ntra
lizat
ion
2,32,3
2,32,3
2,32,3
2,32,3
2,32,3
2,32,3
2,02,0
2,02,0
2,02,0
2,02,0
2,02,0
1,71,7
1,31,3
1,31,3
1,72,0
2,02,0
2,02,0
2,02,0
2,0
Tari
ff r
efor
m2,6
2,62,6
2,62,7
2,72,9
2,92,9
2,82,9
2,91,4
1,51,7
1,81,8
2,12,0
2,02,1
2,12,1
2,12,1
2,12,1
2,02,0
2,22,1
2,22,3
2,32,3
2,22.
1St
ruct
ure
of t
ariff
s2,3
2,42,4
2,42,6
2,62,9
2,93,0
2,93,0
3,21,0
1,01,0
1,01,0
1,81,7
1,71,9
2,02,0
2,12,0
2,02,0
2,02,0
2,11,9
2,12,2
2,22,4
2,32.
1.1
Polit
ical v
s. re
gula
ted
oper
ator
s2,0
2,02,0
2,02,0
2,02,3
2,32,3
2,32,7
3,01,0
1,01,0
1,01,0
1,71,3
1,31,7
1,71,3
1,31,7
1,71,7
1,71,7
1,71,7
2,02,0
2,02,3
2,02.
1.2
Natu
ral m
onop
oly
prici
ng2,3
2,32,3
2,32,7
2,73,0
3,03,3
3,33,3
3,71,0
1,01,0
1,01,0
2,02,0
2,02,3
2,32,7
3,01,7
1,71,7
1,71,7
2,01,7
1,72,0
2,02,0
2,02.
1.3
Pote
ntia
lly c
ompe
titiv
e bu
sines
ses
prici
ng2,7
3,03,0
3,03,0
3,03,3
3,33,3
3,03,0
3,01,0
1,01,0
1,01,0
1,71,7
1,71,7
2,02,0
2,02,7
2,72,7
2,72,7
2,72,3
2,72,7
2,73,0
3,02.
2Pa
ymen
ts
3,03,1
3,13,1
3,23,2
3,33,3
3,33,2
3,23,2
1,71,9
2,32,6
2,62,6
2,62,6
2,62,4
2,42,2
2,42,2
2,22,1
2,22,5
2,52,5
2,72,7
2,72,5
2.2.
1In
trai
ndus
try
paym
ents
ratio
s3,0
3,03,0
3,03,3
3,33,3
3,33,3
3,33,3
3,31,3
1,72,3
2,72,7
2,72,7
2,72,7
2,72,7
2,32,7
2,72,7
2,72,7
3,03,0
3,03,0
3,03,0
2,72.
2.2
Fina
l con
sum
ers
colle
ctio
n ra
tes
3,03,3
3,33,3
3,33,3
3,73,7
3,73,7
3,73,7
2,02,3
2,73,0
3,03,0
3,03,0
3,02,7
2,72,7
2,72,7
2,72,3
2,32,7
2,72,7
2,72,7
2,72,7
2.2.
3St
ate
inde
bted
ness
3,03,0
3,03,0
3,03,0
3,03,0
3,02,7
2,72,7
1,71,7
2,02,0
2,02,0
2,02,0
2,01,7
1,71,7
1,71,3
1,31,3
1,71,7
1,71,7
2,32,3
2,32,0
2.3
Stat
e fu
ndin
g 2,4
2,42,4
2,42,4
2,42,4
2,42,4
2,42,4
2,41,7
1,71,9
1,91,9
1,91,9
1,91,9
1,91,9
1,92,0
2,02,0
1,91,9
1,91,9
1,91,9
1,91,7
1,72.
3.1
Subs
idie
s le
vel
2,72,7
2,72,7
2,72,7
2,72,7
2,72,7
2,72,7
1,31,3
1,71,7
1,71,7
1,71,7
1,71,7
1,71,7
2,02,0
2,01,7
1,71,7
1,71,7
1,71,7
1,31,3
2.3.
2Su
bsid
ies
proc
edur
e2,0
2,02,0
2,02,0
2,02,0
2,02,0
2,02,0
2,02,0
2,02,0
2,02,0
2,02,0
2,02,0
2,02,0
2,02,0
2,02,0
2,02,0
2,02,0
2,02,0
2,02,0
2,03,
0Re
gula
tory
and
inst
itut
iona
l dev
elop
men
t2,4
2,42,2
2,12,1
2,12,3
2,32,5
2,62,4
2,41,2
1,21,3
1,31,3
1,61,4
1,61,6
1,61,6
1,62,3
2,42,4
2,42,4
2,62,5
2,52,7
2,72,8
2,83.
1Ef
fect
ive
regu
lato
ry in
stitu
tion
2,42,6
2,32,2
2,22,2
2,62,6
2,72,6
2,42,4
1,31,4
1,51,5
1,51,8
1,81,8
1,81,8
1,81,8
1,92,0
2,02,1
2,12,2
2,32,3
2,32,3
2,32,3
3.1.
1M
anag
emen
t sel
ectio
n fo
r com
petit
ive
busin
esse
s2,7
2,72,3
2,32,3
2,32,7
2,72,7
2,32,3
2,31,3
1,31,3
1,31,3
1,71,7
1,71,7
1,71,7
1,72,0
2,02,0
2,02,0
2,32,3
2,32,3
2,32,3
2,3
3.1.
2In
depe
nden
ce o
f reg
ulat
or, i
nsul
atio
n fro
m
polit
ical i
nflu
ence
2,32,7
2,32,3
2,32,3
2,72,7
2,72,7
2,32,7
1,01,0
1,31,3
1,31,7
1,71,7
1,71,7
1,71,7
2,02,0
2,02,0
2,02,0
2,02,0
2,02,0
2,02,0
3.1.
3Tr
ansp
aren
cy o
f reg
ulat
ion
2,32,3
2,32,0
2,02,0
2,32,3
2,72,7
2,72,3
1,72,0
2,02,0
2,02,0
2,02,0
2,02,0
2,02,0
1,72,0
2,02,3
2,32,3
2,72,7
2,72,7
2,72,7
3.2
Acce
ss r
egul
atio
n2,3
2,32,0
2,02,0
2,02,0
2,02,3
2,72,3
2,31,0
1,01,0
1,01,0
1,31,0
1,31,3
1,31,3
1,32,7
2,72,7
2,72,7
3,02,7
2,73,0
3,03,3
3,3
Tele
com
mun
icat
ions
Railw
ays
Road
s
A
pp
en
dic
es
46
A
pp
en
dix
1 I
nfr
ast
ruct
ure
In
dic
ato
r evalu
ati
on

INSTITUTE FOR ECONOMIC RESEARCH AND POLICY CONSULTING
47
A
pp
en
dix
1
In
frast
ruct
ure
I
nd
icato
r evalu
ati
on
(co
nti
nu
ati
on
) In
dica
tor
00-N
01-M
01-N
02-M
02-N
03-M
04-J
05-J
06-J
07-A
08-A
09-S
00-N
01-M
01-N
02-M
02-N
03-M
04-J
05-J
06-J
07-A
08-A
09-S
00-N
01-M
01-N
02-M
02-N
03-M
04-J
05-J
06-J
07-A
08-A
09-S
EBRD
indi
cato
r3,0
3,03,0
3,03,0
3,03,0
3,03,0
3,01,7
1,71,7
1,71,7
1,71,7
2,02,0
2,0IE
RPC
indi
cato
r2,3
72,4
92,5
12,5
12,4
92,6
02,5
62,5
62,5
72,5
82,5
72,5
71,8
92,0
42,0
92,0
62,0
52,0
42,0
62,0
62,0
42,0
32,0
21,9
91,3
81,4
21,4
21,4
71,5
11,5
71,6
11,6
11,6
11,6
01,6
01,6
01,
0Co
mm
erci
aliz
atio
n an
d pr
ivat
izat
ion
2,42,5
2,52,5
2,52,7
2,62,6
2,62,6
2,62,6
1,61,7
1,81,8
1,71,7
1,71,7
1,71,7
1,71,6
1,31,3
1,31,5
1,51,5
1,61,6
1,61,6
1,61,6
1.1
Ow
ners
hip
2,22,3
2,42,4
2,42,6
2,62,6
2,62,6
2,62,6
1,81,8
1,91,9
1,71,6
1,61,6
1,61,6
1,61,6
1,11,1
1,11,1
1,31,3
1,31,3
1,31,3
1,31,3
1.1.
1Na
tura
l mon
opol
y 3,0
3,33,3
3,33,3
3,33,3
3,33,3
3,33,3
3,31,3
1,31,3
1,31,3
1,31,3
1,31,3
1,31,3
1,31,0
1,01,0
1,01,3
1,31,3
1,31,3
1,31,3
1,31.
1.2
Pote
ntia
lly c
ompe
titive
bus
ines
ses
2,32,3
2,72,7
2,72,7
2,72,7
2,72,7
2,72,7
2,72,7
2,72,7
2,01,7
1,71,7
1,71,7
1,71,7
1,01,0
1,01,0
1,31,3
1,31,3
1,31,3
1,31,3
1.1.
3An
cilla
ry b
usin
esse
s1,3
1,31,3
1,31,3
1,71,7
1,71,7
1,71,7
1,71,3
1,31,7
1,71,7
1,71,7
1,71,7
1,71,7
1,71,3
1,31,3
1,31,3
1,31,3
1,31,3
1,31,3
1,31.
2O
pera
tion
2,52,6
2,62,6
2,62,8
2,82,8
2,82,8
2,82,8
1,41,8
1,81,8
1,81,8
1,81,8
1,81,8
1,81,9
1,31,3
1,31,7
1,71,7
1,81,8
1,81,8
1,81,8
1.2.
1Na
tura
l mon
opol
y 3,0
3,33,3
3,33,3
3,33,3
3,33,3
3,33,3
3,32,0
2,02,0
2,02,0
2,02,0
2,02,0
2,02,0
2,31,7
1,71,7
2,02,0
2,02,3
2,32,3
2,32,3
2,31.
2.2
Natu
ral m
onop
oly
plan
ning
and
inve
stm
ent
decis
ions
2,72,7
2,72,7
2,72,7
2,72,7
2,72,7
2,72,7
1,02,0
2,02,0
2,02,0
2,02,0
2,02,0
2,02,0
1,01,0
1,01,3
1,31,3
1,31,3
1,31,3
1,31,3
1.2.
3Pr
ivat
e se
ctor
par
ticip
atio
n in
ser
vice
1,7
1,71,7
1,71,7
2,32,3
2,32,3
2,32,3
2,31,3
1,31,3
1,31,3
1,31,3
1,31,3
1,31,3
1,31,3
1,31,3
1,71,7
1,71,7
1,71,7
1,71,7
1,71.
3O
rgan
izat
iona
l str
uctu
re2,5
2,52,5
2,52,5
2,72,4
2,42,4
2,42,4
2,41,7
1,71,7
1,71,7
1,71,7
1,71,7
1,71,7
1,51,6
1,61,6
1,71,7
1,71,8
1,81,8
1,81,8
1,81.
3.1
Sepa
ratio
n of
nat
ural
mon
opol
y an
d po
tent
ially
com
petit
ive
busin
esse
s3,7
3,73,7
3,73,7
3,73,0
3,03,0
3,03,0
3,02,0
2,02,0
2,02,0
2,02,0
2,02,0
2,02,0
1,71,0
1,01,0
1,31,3
1,31,3
1,31,3
1,31,3
1,3
1.3.
2Se
para
tion
of a
ncilla
ry b
usin
esse
s1,3
1,31,3
1,31,3
1,71,7
1,71,7
1,71,7
1,71,3
1,31,3
1,31,3
1,31,3
1,31,3
1,31,3
1,31,0
1,01,0
1,01,0
1,01,0
1,01,0
1,01,0
1,01.
3.3
Dece
ntra
lizat
ion
2,72,7
2,72,7
2,72,7
3,03,0
3,03,0
3,03,0
2,0
Tari
ff re
form
2,22,5
2,62,6
2,62,7
2,72,7
2,72,8
2,72,7
2,02,2
2,32,3
2,32,3
2,42,4
2,32,3
2,32,2
1,71,8
1,81,8
1,82,0
2,02,0
2,02,0
2,02,0
2.1
Stru
ctur
e of
tarif
fs2,7
2,72,7
2,72,7
2,92,9
2,93,0
3,13,0
3,02,2
2,22,2
2,22,1
2,12,1
2,12,1
2,01,9
1,81,3
1,31,3
1,31,3
1,31,4
1,41,4
1,41,4
1,42.
1.1
Polit
ical v
s. re
gula
ted
oper
ator
s3,0
3,03,0
3,03,0
3,03,0
3,03,0
3,03,0
2,72,0
2,02,0
2,02,0
2,02,0
2,02,0
2,02,0
1,71,0
1,01,0
1,01,0
1,01,3
1,31,3
1,31,3
1,32.
1.2
Natu
ral m
onop
oly
prici
ng2,7
2,72,7
2,72,7
2,72,7
2,73,0
3,33,0
3,02,3
2,32,3
2,32,3
2,32,3
2,32,3
2,01,7
1,71,7
1,71,7
1,71,7
1,71,7
1,71,7
1,71,7
1,72.
1.3
Pote
ntia
lly c
ompe
titive
bus
ines
ses
prici
ng2,3
2,32,3
2,32,3
3,03,0
3,03,0
3,03,0
3,32,3
2,32,3
2,32,0
2,02,0
2,02,0
2,02,0
2,01,3
1,31,3
1,31,3
1,31,3
1,31,3
1,31,3
1,32.
2Pa
ymen
ts
1,92,8
2,92,9
3,03,0
3,03,0
3,03,0
3,03,0
1,92,7
3,02,8
3,03,0
3,23,2
3,03,0
3,02,9
1,92,3
2,32,3
2,32,7
2,82,8
2,82,7
2,72,7
2.2.
1In
train
dust
ry p
aym
ents
ratio
s2,0
3,03,0
3,03,0
3,03,0
3,03,0
3,03,0
3,02,0
3,03,3
3,33,3
3,33,3
3,33,0
3,03,0
2,72,0
2,32,3
2,32,3
2,32,3
2,32,3
2,32,3
2,32.
2.2
Final
con
sum
ers
colle
ctio
n ra
tes
2,03,0
3,33,3
3,73,7
3,73,7
3,73,7
3,73,7
2,02,7
3,32,7
3,32,7
3,33,3
3,03,0
3,03,0
2,02,3
2,32,3
2,33,0
3,33,3
3,33,0
3,03,0
2.2.
3St
ate
inde
bted
ness
1,72,3
2,32,3
2,32,3
2,32,3
2,32,3
2,32,3
1,72,3
2,32,3
2,33,0
3,03,0
3,03,0
3,03,0
1,72,3
2,32,3
2,32,7
2,72,7
2,72,7
2,72,7
2.3
Stat
e fu
ndin
g 2,2
2,22,2
2,22,2
2,22,2
2,22,2
2,22,2
2,21,9
1,91,9
1,91,9
1,91,9
1,91,9
1,91,9
1,91,9
1,91,9
1,91,9
1,91,9
1,91,9
1,91,9
1,92.
3.1
Subs
idie
s le
vel
2,32,3
2,32,3
2,32,3
2,32,3
2,32,3
2,32,3
2,02,0
2,02,0
2,02,0
2,02,0
2,02,0
2,02,0
1,71,7
1,71,7
1,71,7
1,71,7
1,71,7
1,71,7
2.3.
2Su
bsid
ies
proc
edur
e2,0
2,02,0
2,02,0
2,02,0
2,02,0
2,02,0
2,01,7
1,71,7
1,71,7
1,71,7
1,71,7
1,71,7
1,72,0
2,02,0
2,02,0
2,02,0
2,02,0
2,02,0
2,03,
0Re
gula
tory
and
inst
itutio
nal d
evel
opm
ent
2,52,5
2,52,5
2,42,4
2,42,4
2,42,4
2,42,4
2,12,2
2,22,2
2,22,2
2,22,2
2,22,2
2,22,2
1,11,1
1,11,1
1,21,2
1,21,2
1,21,2
1,21,2
3.1
Effe
ctiv
e re
gula
tory
inst
itutio
n2,7
2,72,7
2,72,4
2,62,6
2,62,6
2,62,6
2,61,9
2,02,0
2,02,0
2,02,0
2,02,0
2,02,0
2,01,2
1,21,2
1,21,3
1,41,4
1,41,4
1,41,4
1,43.
1.1
Man
agem
ent s
elec
tion
for c
ompe
titiv
e bu
sines
ses
2,02,0
2,02,0
2,02,0
2,02,0
2,02,0
2,02,0
2,02,0
2,02,0
2,02,0
2,02,0
2,02,0
2,02,0
1,31,3
1,31,3
1,71,7
1,71,7
1,71,7
1,71,7
3.1.
2In
depe
nden
ce o
f reg
ulat
or, i
nsul
atio
n fro
m
polit
ical i
nflu
ence
3,03,0
3,03,0
3,03,0
3,03,0
3,03,0
3,03,0
2,32,3
2,32,3
2,32,3
2,32,3
2,32,3
2,32,3
1,31,3
1,31,3
1,31,3
1,31,3
1,31,3
1,31,3
3.1.
3Tr
ansp
aren
cy o
f re g
ulat
ion
3,03,0
3,03,0
2,32,7
2,72,7
2,72,7
2,72,7
1,31,7
1,71,7
1,71,7
1,71,7
1,71,7
1,71,7
1,01,0
1,01,0
1,01,3
1,31,3
1,31,3
1,31,3
3.2
Acce
ss re
gula
tion
2,32,3
2,32,3
2,32,3
2,32,3
2,32,3
2,32,3
2,32,3
2,32,3
2,32,3
2,32,3
2,32,3
2,32,3
1,01,0
1,01,0
1,01,0
1,01,0
1,01,0
1,01,0
ower
Gas
Wat
er a
nd W
aste
wat
erP

INSTITUTE FOR ECONOMIC RESEARCH AND POLICY CONSULTING
Appendix 2. General description of the infrastructure indicators
This appendix presents a brief description of the criteria for scoring each indicator.
1.0 Commercialisation and privatisation
1.1 Ownership
1.1.1 Natural monopoly. A natural monopoly is a network operator. A score of one means that the whole network is state owned; the score increases with an increasing share of corporatised, privatised and newly constructed private fixed networks in the total length of networks. The maximum score is reached with private ownership of all networks.
1.1.2 Potentially competitive businesses. A potentially competitive business is an operator using networks to provide its services; it is a market related to a natural monopoly. A score of one implies that the businesses are part of the state owned natural monopoly. The score increases with separation, corporatisation and privatisation of existing operators, or with increased market penetration by newly established private agents. The maximum is reached when all the businesses are in private ownership.
1.1.3 Ancillary businesses. Ancillary businesses are concerned with network construction, its maintenance, inputs supplies, and social infrastructure. A score of one means that these businesses are state owned. The score increases with the degree of separation, corporatisation and privatisation, or the increase in new private establishments.
1.2 Operation
1.2.1 Natural monopoly. A score of one is given when the natural monopoly is operated as a government department. The score increases with reorganisation into an independent state agency or a company, and the establishment of an independent regulator. The maximum score is assigned if a private company manages the natural monopoly, and only an independent regulator, established by law, can intervene.
1.2.2 Natural monopoly planning and investment decisions. A score of one implies political interference in making business and investment decisions. The score increases as commercial objectives such as profitability and operational efficiency grow in importance. The highest score applies if network extensions and new investment projects are realised solely based on profitability considerations and reflect marginal social costs.
1.2.3 Private sector participation in service contracts. A score of one means that the private sector does not participate in construction,
48

INSTITUTE FOR ECONOMIC RESEARCH AND POLICY CONSULTING
maintenance or rehabilitation, etc. The score increases with increasing participation in these activities by the private sector.
1.3 Organisational structure
1.3.1 Separation of natural monopoly and potentially competitive businesses. A score of one means no separation between the infrastructure and the service providers’ managements, as well as separation between the managements of different service providers. The score increases with unbundling of the industry. The highest score applies when different services are provided by separate private companies.
1.3.2 Separation of ancillary businesses. A score of one means no separation of ancillary businesses from the natural monopoly or potentially competitive businesses. The score increases with increasing degrees of separation. The maximum score is assigned when ancillary services for the natural monopoly and for potentially competitive businesses are supplied by the market.
1.3.3 Decentralisation. A score of one implies no or minimal decentralisation and increases with increasing decentralisation. Decentralization is both regional and functional and implies autonomy of decision making at the regional level concerning tariffs and investments. The highest score is assigned when the industry is divided into competing regional operators.
2.0 Tariff reform
2.1 Structure of tariffs
2.1.1 Political vs. regulated operators. A score of one implies strong political interference in tariff setting. The score increases with declining political interference and its transfer from the central government to the corresponding government agency and finally to the regulatory body. The maximum score is reached for full cost reflective tariff setting by an infrastructure operator regulated by an independent regulator.
2.1.2 Natural monopoly pricing. A score of one corresponds to pricing below cost accompanied by a substantial amount of cross-subsidisation. The score increases as the tariff approaches the long-run marginal cost reflecting cost covering levels, with cross-subsidisation declining.
2.1.3 Potentially competitive businesses pricing. A score of one means a lack of cost reflective pricing. The score increases with markets becoming increasingly competitive and prices approaching market equilibrium levels.
2.2 Payments
2.2.1 Intra-industry payment ratios. A score of one implies that arrears are constantly accumulating and transactions between companies within an industry are basically non-monetary. The score increases as
49

INSTITUTE FOR ECONOMIC RESEARCH AND POLICY CONSULTING
monetary settlements are carried out and arrears are approaching zero.
2.2.2 Final consumer collection rates. A score of one means low revenue collection from final consumers (households, companies, budgetary organizations) and constantly accumulating arrears. The score increases as progress with revenue collection is made and services are fully paid for. Apart from a non-linear pattern of evaluation grades with respect to payment percentage improvements in each sector, there is non-homogeneity of the patterns across sectors. The six sectors were divided into two groups in accordance with the potential efforts needed to reach higher payment levels. Telecommunications and roads represent the first group, where high levels of payments are relatively easy to achieve. The railroad, power, gas, and water supply sectors were put into the second group, where comparatively small improvements can be defined as considerable successes.
2.2.3 State indebtedness. A score of one corresponds to growing arrears for state compensations to privileged consumers. The score improves as this indebtedness is reduced zero.
2.3 State funding
2.3.1 Subsidies level. A score of one means that some groups of consumers are heavily subsidised by the state in an explicit or implicit form. Both the depth of the subsidisation and the distribution of subsidies are important. The government may pursue a constant practice of debt forgiving and restructuring. Abstention from implicit and explicit subsidies leads to improved scores.
2.3.2 Subsidies procedure. A score of one is assigned when the subsidies are directed to service suppliers and are provided in non-transparent ways. The score improves as the process becomes more transparent and income compensations replace price compensations.
3 Regulatory and institutional development
3.1 Effective regulatory institutions
3.1.1 Management selection for competitive businesses. A score of one means that state officials appoint the management. The score increases when the management is elected by the shareholders and reaches its maximum when the shareholders are private companies or individuals.
3.1.2 Independence of regulator, insulation from political influence. A score of one is assigned when a government department provides the service. The score increases as a state commission is introduced and an independent regulator is established. The highest score applies when an independent regulator acts according to law.
3.1.3 Transparency of regulations. A score of one implies an absence of legislation defining clear rules of the game for businesses, and obligations of government bodies. The score increases with the
50

INSTITUTE FOR ECONOMIC RESEARCH AND POLICY CONSULTING
development of legislation and its enforcement, including when the decision-making becomes public. The maximum score is reached when an independent regulator alone regulates the performance of the natural monopolies in an industry in accordance with law, and all decisions are disclosed.
3.2 Access regulation. A score of one means that the access right is arbitrarily determined by the state or the state-owned operator. The score increases as access is regulated by an independent regulator, later negotiated, finally determined by market mechanisms.
51

INSTITUTE FOR ECONOMIC RESEARCH AND POLICY CONSULTING
Appendix 3. Explanations for the infrastructure indicator evaluations given in Appendix 1 (September 2008 - August 2009) TELECOMMUNICATIONS
1.0 Commercialisation and privatisation
1.1 Ownership
1.1.1 The state-owned telecommunications incumbent Ukrtelecom still controls the fixed-line telephone market and owns the largest primary network. The indicator remains unchanged at 1.7.
1.1.2 Expected privatization of Ukrtelecom was again postponed. The indicator is unchanged – 3.3.
1.1.3 The ownership structure in the ancillary businesses has not changed significantly. The indicator remains at 2.0.
1.2 Operation
1.2.1 Fixed-line network is under control of state-owned JSC “Ukrtelecom”. Established market regulator – the NCRC – is responsible for licensing, tariff-setting for universal communications services, managing of frequencies, rules making and their enforcement. The indicator remains unchanged at 2.0.
1.2.2 The financial plan of Ukrtelecom for 2009 has not been adopted yet. At the same time, crisis pushes Ukrtelecom to make investment and operational decisions on the basis of their efficiency. However, the government preserves its control over this operator. The indicator remains at 2.0.
1.2.3 The private sector continues to increase its participation in many competitive segments and service contracts. The indicator remains at 2.3 level.
1.3 Organizational structure
1.3.1 There are no significant changes. The indicator remains at 2.0.
1.3.2 The organizational structure of the ancillary businesses remained unchanged, and so did the indicator – 2.0.
1.3.3 The indicator remains unchanged at 2.3.
2.0 Tariff reform
2.1 Structure of tariffs
2.1.1 The NCRC and Ukrtelecom increased tariffs for main telecommunication services several times. So, new tariffs are to cover costs to a greater extent. The indicator is slightly increased from 2.7 to 3.0.
2.1.2 Ukrtelecom has significantly increased prices for its services, in particular state-regulated universal services. The level of cross-subsidization is expected to decrease. That’s why the indicator has been increased from 3.3 to 3.7.
52

INSTITUTE FOR ECONOMIC RESEARCH AND POLICY CONSULTING
2.1.3 The regulation on interconnections and inter-payments allows avoiding deviations from equilibrium pricing in many cases. The indicator remains 3.0.
2.2 Payments
2.2.1 There were no major developments in intra-industry payments. The indicator has remained 3.3.
2.2.2 The indicator remains unchanged at 3.7.
2.2.3 The state’s indebtedness indicator is unchanged - 2.7.
2.3 State funding
2.3.1 The level of state subsidization is planned to decrease through the increase in tariffs. The indicator remains at 2.7.
2.3.2 The subsidies procedure has not experienced significant changes during monitored period, and the indicator remains unchanged – 2.0.
3.0 Regulatory and institutional development
3.1 Effective regulatory institutions
3.1.1 The management selection procedure for competitive businesses has not changed. So, the indicator remains the same - 2.3.
3.1.2 The confrontation between the President of Ukraine and the Cabinet of Ministers regards control over the regulator has finished for benefit of the government. The NCRC renewed its activities and started to conduct its regulatory functions. The indicator has been increased from 2.3 to 2.7.
3.1.3 The NCRC actively strives for its power to regulate telecommunications market. However some legislative drawbacks and weak position of the AMC allow the government to block and interfere into decisions of the regulators. In particular, so far dominating telecom operators have not been defined as monopolists, so they cannot be prevented from abuse of their monopolistic power. So, the indicator has been decreased from 2.7 to 2.3.
3.2 Access regulation. Expected privatization of Ukrtelecom and increased number of competitors on the telecommunications market have sharpened the issue of access to telephone channels, controlled by the state-owned telecommunication incumbent. Private operators often experienced difficulties while trying to get it. At the moment, necessary regulative procedures, aimed at improving access of all operators to the network, are elaborating by the NCRC. However, the indicator has not been changed – 2.3.
RAILWAYS
1.0 Commercialisation and privatisation
1.1 Ownership
53

INSTITUTE FOR ECONOMIC RESEARCH AND POLICY CONSULTING
1.1.1 The basic rail network is 100% state owned. Sales/transfers of branch lines take place occasionally. The indicator has not been changed – 1.0.
1.1.2 Passenger and freight transportation are 100% state-owned. Forwarding enterprises are mostly private. Freight railway cars are partially in private ownership. The indicator has not been changed - 2.0.
1.1.3 The construction, maintenance and service enterprises are corporatized, but remained state-owned. The indicator has not been changed – 1.7.
1.2 Operation
1.2.1 The railways are regulated by the State Railways Administration, which is integrated into the MTCU. The indicator has not been changed – 1.7.
1.2.2 During monitored period the State Railways Administration “UZ” has been forced to bear significant fiscal burden. As a result most investment projects failed since UZ did not have enough working capital. So, UZ rather strived not for operational efficiency and profitability, but for raising funds at any expense. The indicator has been decreased from 2.0 to 1.7.
1.2.3 Rail line construction and rolling stock maintenance is provided by state enterprises and joint stock ventures. At the same time UZ tries to involve private sector in catering and maintenance services. The indicator remained the same - 1.7.
1.3 Organisational structure
1.3.1 The railway infrastructure, passenger and freight transportation services are integrated within UZ. The indicator has not been changed – 1.7.
1.3.2 UZ is charged with the management of many ancillary businesses. The indicator remained the same - 1.7.
1.3.3 The railways are split into 6 regional companies and some ancillary enterprises. They set tariffs for a range of services, except for transportation (e.g. prices for use of bed linen, tariffs for carriage feed). The indicator has remained the same - 1.7.
2.0 Tariff reform
2.1 Structure of tariffs
2.1.1 Freight rail tariffs are at the cost-covering level, and passenger rail tariffs are constantly growing. However, the tariff-setting procedure remains non-transparent and political interference has even grown under crisis conditions. Moreover, the MTCU opposed the proposal of independent transport regulator’s establishment. The indicator has not been changed - 1.3.
2.1.2 The tariffs are steadily moving to the infrastructure and rolling stock operating costs; however overall, the costs are covered. Cross-
54

INSTITUTE FOR ECONOMIC RESEARCH AND POLICY CONSULTING
subsidisation of passenger transportation by freight transportation is further reduced since revenues from freight transportation have substantially fallen due to crisis and tariffs for passengers have risen. The indicator has been slightly increased from 2.7 to 3.0.
2.1.3 Tariffs for both freight and passenger transportation are having been adjusted to the cost-covering level. The indicator remained the same - 2.0.
2.2 Payments
2.2.1 During monitored period the practice of accumulating arrears of UZ to its suppliers and contractors as well as barter schemes renewed. The indicator has been decreased from 2.7 to 2.3.
2.2.2 Monetary payments are almost 100%, except for payments for commuter rail services. However, UZ introduced some measures aimed at increasing of collection payments for commuter rail services. The indicator has not been changed – 2.7.
2.2.3 State subsidies are provided in greater extent at levels set in the central state budget and almost not - by local authorities. For 2008 only 41.3% (UAH 154.5 m) of the costs of railroad transportation of privileged passengers have been compensated from the state budget, and for 7 months of 2009 – 23.3% (UAH 68.4 m). The indicator has not been changed - 1.7.
2.3 State funding
2.3.1 The government still relies on (privileged) passenger transportation funding at the expense of UZ. The indicator has not been changed – 1.7.
2.3.2 Subsidies are paid to the railways (service provider). The indicator has not been changed – 2.0.
3.0 Regulatory and institutional development
3.1 Effective regulatory institutions
3.1.1 The Cabinet of Ministers appoints the top management, although the government body operating the railways is formally independent. The indicator has not been changed – 1.7.
3.1.2 There is no independent regulatory body in the sphere of railways. The body, responsible for railways regulation, is part of the MTCU. The indicator has not been changed – 1.7.
3.1.3 Tariffs for both freight and passenger transportations are fixed by legislation. A transport tariff policy is being developed to increase cost-covering level. The indicator has not been changed – 2.0.
3.2 Access pricing regulation method. Access is regulated by government permission. The index remained at 1.3. ROADS
1.0 Commercialisation and privatisation
55

INSTITUTE FOR ECONOMIC RESEARCH AND POLICY CONSULTING
1.1 Ownership
1.1.1 Roads of the public use are 100% in state and communal ownership. The indicator has not been changed – 1.0.
1.1.2 Freight transportation is mostly provided by private companies. The share of private sector in passenger transportation is constantly increasing. The indicator has not been changed – 3.0.
1.1.3 The social infrastructure, services, and automobile maintenance enterprises are mostly private. Publicly owned companies provide most of the road maintenance and construction (at least as main contractors). At the same time, there are plans to set transparent tender procedure both for state-owned and private construction companies. The indicator has not been changed – 2.3.
1.2 Operation
1.2.1 Regulation and management of the road network are separated from each other. The regulatory body (State Road Service) is the principal managing body of the State Joint Stock Company “Avtomobilny dorogy Ukrainy”. The indicator has not been changed – 2.0.
1.2.2 There were no significant changes in the procedures of natural monopoly planning and investment decisions making. The indicator has not been changed – 2.3.
1.2.3 So far road maintenance has been provided mostly by local subsidiaries of the State JSC “Avtomobilny dorogy Ukrainy” and from time to time by private contractors. However, new law on concessions for roads construction and operation, which improves conditions for private operators, came into force in 2009. The indicator has been changed from 2.3 to 2.7.
1.3 Organisational structure
1.3.1 Roads management is separated from freight and passenger transportation services. The indicator has not been changed – 3.3.
1.3.2 Road construction and maintenance are separated from transportation; some services are contracted out. The indicator has not been changed – 2.0.
1.3.3 Roads are financed and operated at both central and regional levels. Municipal authorities can make investment decisions on local road construction using the vehicle tax funds they collect. But in practice they usually get less from Road fund than they collect. In 2008-2009 Ukravtodor initiated reforms that imply transfer of local roads operation and maintenance to local authorities and enterprises. However, the indicator has not been changed since reforms had not taken place yet – 2.0.
2.0 Tariff reform
2.1 Structure of tariffs
56

INSTITUTE FOR ECONOMIC RESEARCH AND POLICY CONSULTING
2.1.1 Local authorities approve tariffs for local passenger transportation, except for interregional passenger travels. However, private companies had chance to negotiate with local authorities an optimal price. However, at the end of 2008 the government roughly interfered into the market for freight auto transportation, having set minimum tariffs. The indicator has been decreased from 2.3 to 2.0.
2.1.2 Officially road funding derives from an excise tax and import duty on mineral oils and vehicles. And they are directed towards road construction and maintenance. The indicator has not been changed – 2.0.
2.1.3 The level of tariffs can be considered as cost-effective since passenger companies have chance to negotiate the price level. The indicator has not been changed - 3.0.
2.2 Payments
2.2.1 Due to financial crisis and drying budget transfers in 2008-2009 financial state of Ukravtodor has significantly deteriorated, having caused not only rising credit obligations, but also growing arrears to private counteragents, including issues of promissory notes. The indicator has been decreased from 3.0 to 2.7.
2.2.2 Payments are mostly monetary but the enterprises that conduct roads maintenance and construction also receive capital transfers from the budget. Compensation for privileged passenger transportation remains significant issue. The indicator has not been changed – 2.7.
2.2.3 Taking into consideration the poor state of economy, planned budget transfers to Ukravtodor for already done road works are not expected to be fully conducted. The indicator has been decreased from 2.3 to 2.0.
2.3 State funding
2.3.1 The number of privileged passengers remains high, and compensation levels from the budget are inadequate. Moreover, the government pursues a constant practice of softening budget constraints for Ukravtodor. It again allowed attracting huge volumes of sovereign guaranteed loans for roads construction in the middle of budget year and despite their previous inadequate use. The indicator has not been changed - 1.3.
2.3.2 Subsidization of privileged passengers is frequently put onto the shoulders of service providers. However, the MTCU developed draft law On amendments to some legislative acts regards privileges in the road transport. But it has not been adopted so far. The indicator is the same – 2.0.
3.0 Regulatory and institutional development
3.1 Effective regulatory institutions
57

INSTITUTE FOR ECONOMIC RESEARCH AND POLICY CONSULTING
3.1.1 The management of the State Road Service is appointed by the government. The indicator has not been changed – 2.3.
3.1.2 The State Road Service of Ukraine, the regulatory body in the sector and department of the MTCU, also includes the State JSC “Avtomobilni dorogy Ukrainy”, infrastructure operator. The indicator has not been changed – 2.0.
3.1.3 The MTCU does not support the idea of independent transport regulator creation. That’s why this process is slowed. The indicator has not been changed – 2.7.
3.2 Access pricing regulation method. Access is regulated by licensing. New more transparent procedures of tender for servicing passenger routes were introduced. But the MTCU failed to structure freight transportation market and to cope with illegal carriers. The indicator has not been changed - 3.3. POWER 1.0 Commercialisation and privatisation
1.1 Ownership
1.1.1 The privatization energy-generating companies: Donbasenergo, Zahidenergo, Dniproenergo and Centerenergo and energy distributive companies has been legally restored. The privatisation faced a number of corporate conflicts. The indicator has not been changed - 3.3.
1.1.2 The nuclear and hydro generating plants remain 100% state property. The state remained the major owner of the three fossil fuel generating companies. The indicator has not been changed - 2.7.
1.1.3 Social infrastructure, construction and maintenance are still treated as part of the natural monopoly. The indicator has not been changed - 1.7.
1.2 Operation
1.2.1 The regional distribution companies are corporatized, some of them are in private hands, all of them are regulated by the NERC. The grid is operated as a part of Ukrenergo. The indicator has not been changed - 3.3.
1.2.2 Decision-making is still politically determined. The NERC has provided the privileges to industry at the expense of potential revenues of state electricity generating companies. The indicator has not been changed – 2.7.
1.2.3 Construction and maintenance are managed by the oblenergos. There are no rules of access of operators with unregulated tariffs. The indicator has not been changed - 2.3.
1.3 Organisational structure 1.3.1 Generation, transmission and distribution are separated into
independent companies. State stakes in the power sector, with the exception of nuclear stations united in the Energy Company of Ukraine. The indicator has not been changed – 3.0.
58

INSTITUTE FOR ECONOMIC RESEARCH AND POLICY CONSULTING
1.3.2 There is a minimal degree of separation. The private sector is marginally involved. The indicator has not been changed - 1.7.
1.3.3 Decentralisation is not a high priority in this industry.
2.0 Tariff reform 2.1 Structure of tariffs
2.1.1 Cost-effectiveness of households tariffs did not changed. The NERC has frozen the tariffs for selected industries. The indicator has been decreased from 3.0 to 2.7.
2.1.2 Cross-subsidisation of households by industrial consumers without changes. The indicator remains at 3.0.
2.1.3 Wholesale electricity market is preparing for transformation to operate on bilateral contractual basis. The prices for electricity export volumes are subject to competition between suppliers. The indicator has been increased from 3.0 to 3.3.
2.2 Payments 2.2.1 The indicator has not been changed – 3.0.
2.2.2 The average level of cash payments by the oblenergos to the wholesale electricity market is stable. The indicator has not been changed - 3.7.
2.2.3 The law On state budget foresees 100% payment for consumed power but the actual payments are below this level - 2.3.
2.3 State funding
2.3.1 The poorest people are subsidised, the number of privileged categories remains substantial. The indicator has not been changed - 2.3.
2.3.2 Subsidies are paid to the oblenergos. The indicator has not been changed - 2.0.
3.0 Regulatory and institutional development
3.1 Effective regulatory institutions
3.1.1 The management is appointed by the state. The indicator has not been changed - 2.0.
3.1.2 The NERC is governed by decrees issued by the President and the Cabinet of Ministers. The indicator has not been changed – 3.0.
3.1.3 More transparency has been introduced into the distribution of money for power supplied to the wholesale market. The indicator has not been changed - 2.7.
3.2 Access pricing regulation method. Access is regulated by the NERC, but without a strong legislative base. The indicator has not been changed - 2.3.
GAS 1.0 Commercialisation and privatisation
1.1 Ownership 1.1.1 The trunk pipeline and the distribution system are 100%owned by the
state. NJSC “Naftogaz of Ukraine” is corporatized, minor shares of
59

INSTITUTE FOR ECONOMIC RESEARCH AND POLICY CONSULTING
some regional gas distribution companies are privately owned. The indicator has not been changed - 1.3.
1.1.2 The gas imports scheme has been changed to direct purchases of Naftogaz from Gazprom, the intermediary has been eliminated The indicator has not been changed - 1.7.
1.1.3 The construction, maintenance and service efforts are carried out mainly by Naftogaz. The indicator has not been changed - 1.7.
1.2 Operation
1.2.1 NJSC “Naftogaz of Ukraine” is supervised by the government and the President; it can however operate as a market company. The separation of Russian gas supplies and transit contracts has moderately increased the indicator from 2.0 to 2.3.
1.2.2 The indicator remained unchanged – 2.0.
1.2.3 Some private companies are involved to repair and maintenance of the pipelines. The indicator has not been changed - 1.3.
1.3 Organisational structure
1.3.1 The networks of the local gas distribution companies (oblgases) have been transferred to the subsidiary of Naftogaz. The indicator has been decreased from 2.0 to 1.7.
1.3.2 There is a minimal degree of separation. The indicator has not been changed - 1.3.
1.3.3 Decentralisation is not foreseen for this industry.
2.0 Tariff reform
2.1 Structure of tariffs
2.1.1 In 2009 the CMU has frozen gas tariffs for metallurgy and chemical industry at the expense of Naftogaz revenues. The indicator has been decreased from 2.0 to 1.7.
2.1.2 Gas tariffs for households were increased, but the problem of cross-subsidization still persists. The indicator has not been changed – 1.7.
2.1.3 The indicator has not been changed – 2.0
2.2 Payments 2.2.1 Debts of district heating companies increases and has reached UAH
3.46 bn by June 15, 2009. Government is planning to cover accumulated losses at the expense of quasi-fiscal funding through providing the credits to heating companies from the state bank Oschadbank. The indicator has been decreased from 3.0 to 2.7.
2.2.2 There was no progress with revenue collection made by other groups of consumers. The indicator has not been changed.
2.2.3 The state remains among the debtors of Naftogaz. Naftogaz bears the costs of supplying gas to households. The indicator has not been changed – 3.0.
2.3 State funding 2.3.1 The poorest households are subsidised. The indicator has not been
changed – 2.0.
60

INSTITUTE FOR ECONOMIC RESEARCH AND POLICY CONSULTING
2.3.2 There was no change in subsidy procedures. The indicator has not been changed - 1.7.
3.0 Regulatory and institutional development
3.1 Effective regulatory institutions 3.1.1 The government appoints the management of the NJSC “Naftogaz
Ukrayiny” although it is formally independent. The indicator has not been changed – 2.0.
3.1.2 NJSC “Naftogaz Ukrayiny” is still subject to government control. The indicator has not been changed - 2.3.
3.1.3 NERC is the regulator of the sector which regulates the performance of the natural monopolies in an industry is not in fact independent, and all decisions are politically determined. The indicator has not been changed - 1.7.
3.2 Access pricing regulation method. Access is regulated by the NERC, but without a strong legislative base. The indicator has not been changed - 2.3.
WATER AND WASTEWATER
1.0 Commercialization and privatization 1.1 Ownership
1.1.1 The natural monopolies (water distribution and drainage systems) are mostly in communal ownership. There was no change in privatisation of networks. Thus the indicator has not been changed - 1.3.
1.1.2 Most potentially competitive businesses (water supply and wastewater treatment) are still integrated with the natural monopolies and are mostly in communal ownership. The indicator has not been changed and remained at level 1.3.
1.1.3 Construction and maintenance are integrated with the natural monopolies and are also mostly in communal ownership. The index remains at the same level - 1.3
1.2 Operation
1.2.1 Water and wastewater services are provided by local monopolists administered by local governments, which are also the owners of the companies in most cases. There is no independent regulator in the sector still in spite on the legislative initiatives. So, the indicator has not been changed - 2.3
1.2.2 The political influence on decision-making is very strong, local governments pursue goals of social support. The indicator has not been changed - 1.3.
1.2.3 Private sector participation in service contracts is low; where it exists it is mostly due to the participation of international financial institutions. The indicator has not been changed - 1.7.
1.3 Organisational structure 1.3.1 Infrastructure and the service providers’ management are still not
separated. The indicator has not been changed - 1.3.
61

INSTITUTE FOR ECONOMIC RESEARCH AND POLICY CONSULTING
1.3.2 There is no separation of ancillary businesses from the natural monopoly and for potentially competitive businesses. The indicator has not been changed - 1.0.
1.3.3 Companies operate under the supervision of the local authorities. Local governments became less dependent on the central executive powers due to a legal change concerning tariffs and investments. The indicator has not been changed - 3.0.
2.0 Tariff reform
2.1 Structure of tariffs 2.1.1 Tariffs in majority of settlements were increased by municipal officials.
They still however do not cover costs according to available official data. The indicator has not been changed - 1.7.
2.1.2 Tariffs for residential consumers were increased caused mainly by the inflation. The indicator has not been changed - 1.7.
2.1.3 Potentially competitive businesses are integrated parts of the natural monopolies, pricing of the services is not separated. The indicator has not been changed - 1.3.
2.2 Payments 2.2.1 Major creditors of the industry are the power distribution companies.
The indicator has not been changed - 2.3.
2.2.2 The collection rate from households remained at the same level. The indicator has not been changed - 3.0.
2.2.3 The indicator has not been changed - 2.7.
2.3 State funding 2.3.1 The poorest households are subsidised. The amount of subsidisation
varies substantially between regions. The indicator has not been changed - 1.7.
2.3.2 Subsidies are paid to the water supply and sewage companies. The indicator has not been changed - 2.0.
3.0 Regulatory and institutional development 3.1 Effective regulatory institutions
3.1.1 Local officials continue to appoint the management of the water supply and wastewater monopolies. The indicator has not been changed and remained at level 1.7.
3.1.2 There is no independent regulator in the sector. The indicator has not been changed - 1.3.
3.1.3 Although clear tariff regulation guidelines are available they are not obligatory for local administrations: tariffs continue to be set arbitrarily. The indicator has not been changed - 1.3.
3.2 Access pricing regulation method. There are no rules for access. The indicator has not been changed and remained at level 1.0.
62